Article

Explainable Clustered Federated Learning for Solar Energy Forecasting

School of Computer Science and Engineering, Soongsil University, Seoul 06978, Republic of Korea
*
Author to whom correspondence should be addressed.
Energies 2025, 18(9), 2380; https://doi.org/10.3390/en18092380
Submission received: 26 March 2025 / Revised: 29 April 2025 / Accepted: 1 May 2025 / Published: 7 May 2025
(This article belongs to the Section A2: Solar Energy and Photovoltaic Systems)

Abstract

:
Explainable Artificial Intelligence (XAI) is a well-established and dynamic field defined by an active research community that has developed numerous effective methods for explaining and interpreting the predictions of advanced machine learning models, including deep neural networks. Clustered Federated Learning (CFL) mitigates the difficulties posed by heterogeneous clients in traditional federated learning by categorizing related clients according to data characteristics, facilitating more tailored model updates, and improving overall learning efficiency. This paper introduces Explainable Clustered Federated Learning (XCFL), which adds explainability to clustered federated learning. Our method improves performance and explainability by selecting features, clustering clients, training local clients, and analyzing contributions using SHAP values. By incorporating feature-level contributions into cluster and global aggregation, XCFL ensures a more transparent and data-driven model update process. Weighted aggregation by feature contributions improves consumer diversity and decision transparency. Our results show that XCFL outperforms FedAvg and other clustering methods. Our feature-based explainability strategy improves model performance and explains how features affect clustering and model adjustments. XCFL’s improved accuracy and explainability make it a promising solution for heterogeneous and distributed learning environments.

1. Introduction

Since renewable energy resources are environment-friendly and economical, global energy resources are totally transforming towards renewable energy resources. Most of the energy resources will be shifted towards renewables by 2050, according to a report from the International Energy Agency (IRENA) [1]. This will reduce the overall CO2 production by 27 percent, reducing global warming. Solar power is one of the most used and easy-to-install renewable resources. However, like most other renewable energy sources, solar power is also intermittent, making it challenging to supply reliable and uninterruptible power [2]. Therefore, one of the best and most economical strategies to overcome these intermittencies is to predict the power output before. Accurate forecasting can provide multiple benefits [3]. For instance, an efficient power trading strategy can be planned with accurate day-ahead forecasting; penalties can be avoided with correct forecasting. In addition, accurate forecasting also helps in balancing generation and demand, improving system stability, and providing ancillary services [4]. Solar power forecasting can be categorized into physical, statistical, and machine learning (ML) models [5]. Physical methods are accurate but computationally expensive. Statistical methods are based on traditional predefined mathematical modeling, which either map linearly or cannot capture the underlying non-linear relationship between input features and target output [6]. ML models can overcome these challenges by capturing non-linear relations between input features and target output power. These models are trained to build a mapping using a dataset of input features and corresponding output values, resulting in a black-box model. Different machine learning models have been used for solar power forecasting. For instance, the Support Vector machine model (SVM) based on various weather information, such as cloud, sun duration, etc., has been used to forecast solar power in [7]. Ensemble models are proposed as state-of-the-art machine learning models in [8]. Ensemble models include random forest regression (RFR) and extreme gradient boosting (XGBoost), which are other types of ensemble models. Other machine learning models are Recurrent Neural Networks (RNN) [9] based suitable for time series problems.
As mentioned before, ML models are trained in a supervised learning manner to generate black-box models. These are called black box models because of the lack of understanding of the inner working mechanism. Utility engineers are hesitant to deploy AI-based models due to a lack of insight and explanation, which can help in understanding the dynamic decision-making mechanism. Explainable AI (XAI) can address these challenges by explaining, interpreting, and increasing the transparency of AI-based so-called black box models. A detailed review of XAI has been done in [10], which reviews concepts, taxonomies, opportunities, challenges, and adopting XAI tools. An XAI project is introduced in [11] to deliver AI techniques with more explainable models to understand, trust, and adequately deal with rising AI applications.
The following are the main motivations for applying XAI in solar power forecasting. Adaptation of solar photovoltaic (PV) has remarkably increased since the last decade; for instance, in the US, more than 1 million installations totaling 71.4 GW capacity [12]. This increase in installations has led to different AI-based forecasting approaches, which require explanation and interpretation. In the literature, not many studies have been carried out on the detailed application of XAI techniques in solar power forecasting. Furthermore, in the energy market, with the inclusion of distributed resources and electric vehicles, explainable and trustable models are essential.
In the literature, some XAI-based models are proposed for smart grid applications as in [13]; a short-term load is forecasted with generalized additive models to integrate a regressive part with explanatory variables such as weather, time, and trends. An agent-based deep reinforcement learning algorithm using XAI is proposed in [14] to manage an energy storage system. These models built an efficient dispatch algorithm for the energy storage device under variable tariff structures. XAI is applied to explain demand forecasting out of the gradient boosting algorithm in [15]. The analysis was done using Shapley Additive exPlanations) SHAP. This paper only used SHAPE and ELI5 XAI tools. However, other more sophisticated XAI tools are available and applied in different fields. Further, these works do not clearly demonstrate the impact of varying input features on the output, such as solar radiation, pressure, temperature, snow depth, and humidity.
Federated Learning (FL) is a distributed ML methodology that trains models across multiple nodes, allowing each node to preserve its data while handling the issues of privacy, security, and data locality [16]. FL methodologies are particularly applicable in the healthcare, finance, and smart grid industries, where data privacy is of utmost importance. Vanilla FL addresses a practical distributed learning situation wherein (1) the centralized server is restricted from accessing any user data and (2) the data distribution among different users is non-IID, a realistic premise in actual applications [17]. The central server monitors the learning process by averaging local model updates instead of utilizing their raw data, hence considerably mitigating data exposure hazards. Consequently, this methodology depends on a singular global model as the central entity for aggregating user input parameters. To overcome these limitations, we propose an explainable clustered federated learning (XCFL) framework that incorporates a cluster-wise training approach, where clients are grouped based on data similarity using Mean Shift clustering. Within each cluster, local models are trained independently, and their predictions are aggregated using a weighted averaging mechanism. The stochastic gradient descent (SGD) [16] for single-center aggregation is typically formulated for IID data, encountering obstacles such as data heterogeneity, data imbalance, time-variant preferences, and variations in data quality among nodes.
Clustering is a data analysis method that systematically groups clients or organizations with similar attributes and features into coherent clusters. This method utilizes sophisticated algorithms to identify underlying patterns within complex datasets, facilitating the generation of clusters that optimize  intra-group similarities and highlight inter-group disparities. Clustering groups clients by shared features, enabling a detailed comprehension of data structures and offering significant insights for targeted strategies and decision-making across various industries. It can assist in classifying unlabeled data into several categories with little to no supervision [18]. The grouping is structured such that items within the same category display similar characteristics and are differentiated from those in other categories [19]. Acquiring knowledge from the dataset without accounting for pertinent characteristics results in a biased prediction, particularly when imbalanced features and known labels are integrated [20].
The proposed XCFL explicitly addresses data heterogeneity by allowing each cluster to train localized models that adapt to unique climatic, geographic, or sensor conditions, thus outperforming uniform global models in heterogeneous settings. In other words, the XCFL is designed in a way that considers scalability, particularly through its use of mean shift clustering, which groups similar data distributions before model training. This reduces the number of communication rounds required compared to traditional FedAvg. The modular architecture of XCFL also makes it suitable for deployment across large-scale solar power networks, where each cluster can represent a plant, region, or sensor group. The main contributions of this paper are summarized as follows:
  • Introduces a systematic methodology that integrates explainability into federated clustering, hence enhancing transparency in decision-making through the incorporation of weighted aggregation at both the cluster-specific and global model aggregation.
  • Suggests the application of XCFL to encompass dynamic and real-time clustering contexts, seeking wider applicability in heterogeneous and distributed learning contexts.
  • Our proposed XCFL outperforms the conventional FedAvg algorithm, achieving better model performance by leveraging feature-based explainability. Provides insights into the impact of specific attributes on clustering and model refinement.
In XCFL, the aggregation weights are derived either from the size of the local training data or model performance metrics such as the R2 score. This ensures that more reliable or data-rich clusters contribute proportionally more to the final prediction, thereby improving robustness and generalization in heterogeneous settings. This strategy ensures that the aggregation process is sensitive to both data volume and prediction quality rather than relying on equal contributions from all nodes. Regarding long-term performance, the XCFL framework can incorporate temporal clustering or retrain clusters periodically to adapt to seasonal variability or evolving energy patterns. The list of symbols used in this paper is summarized in Table 1.
The rest of the paper is structured as follows: Section 2 discusses the literature review of both domains, FL and XAI. Section 3 provides the system model and elaborates on the algorithms used in this work. Section 4 presents XAI tools and the proposed explainable clustered federated learning. Section 5 elaborates on the experiment setup and the results, and finally, Section 6 concludes the work and discusses the prospects of future XAI applications in other real-world domains.

2. Background

Federated Learning and Explainable AI are transforming energy with secure, decentralized, and interpretable data-driven solutions [21,22]. FL enables collaborative model training across multiple sites while maintaining privacy by keeping raw data locally, which is crucial in smart grid and distributed photovoltaic systems. In contrast, XAI presents transparency in AI decision-making, enabling stakeholders to understand the contributions of characteristics in processes such as solar energy forecasts [23]. Over the past decade, machine learning has successfully enabled building energy management in several common applications, such as load/power forecasting, failure detection and diagnosis (FDD), and occupancy-related applications [24]. Load prediction is the estimation of projected cooling, heating, and energy demand in the next hours or days. Power prediction, on the other hand, is the estimation of power generation from equipment like photovoltaic (PV) panels and wind turbines. Ensuring precise load/power forecasting is crucial for enhancing building energy efficiency and adaptability [25]. Model predictive control and demand-side management are the two primary applications of load/power prediction models [26]. The objective of model predictive control is to minimize cost or energy consumption by optimizing building energy systems while considering restrictions such as thermal comfort and setpoint boundaries [27]. In contrast to physics-based load/power prediction, machine learning methods rely on historical data rather than intricate physical knowledge and thermal balance calculations, therefore simplifying their development and deployment. Many machine learning algorithms, including autoregressive approaches, tree-based methods, artificial neural networks (ANN), and deep neural networks (DNN), have been extensively studied and shown to have excellent performance in load/power prediction over the last few decades [26].
The growing implementation of artificial intelligence across diverse domains requires precise and interpretable models. Explainable AI fulfills this requirement by rendering AI judgments transparent, thereby cultivating user confidence and ensuring adherence to ethical standards. Simultaneously, Federated Learning has emerged as a method for training models using decentralized data sources, maintaining data privacy by localizing data [22]. Nevertheless, the amalgamation of FL’s decentralized characteristics and intricate model structures presents considerable obstacles to attaining explainability. The concept of FED-XAI, introduced by [21], proposes the federated learning of XAI models for AI-pervasive 6G networks, together with an a posteriori XAI architecture. The objective is to optimize the efficiency, intelligence, and reliability of automated vehicle networking, therefore enhancing user experience and ensuring the safety of end-users in network AI operations. The opaque characteristics of numerous AI models, particularly deep learning frameworks, sometimes engender distrust and hesitance in their implementation, especially in vital sectors such as healthcare and finance. XAI aims to elucidate these models by providing insights into their decision-making processes, thereby enhancing user confidence and facilitating regulatory compliance [28]. In medical diagnostics, understanding the rationale behind a model’s prediction is crucial for doctors to trust and effectively utilize AI solutions. In finance, explainable models are crucial for maintaining transparency and equity in decision-making processes.
Federated Learning facilitates collaborative model training while maintaining privacy by eliminating the necessity to exchange raw data. This decentralized method, however, presents issues in attaining model explainability [16]. The variability of data among many nodes and the intricacy of consolidating models trained on disparate datasets hinder the understanding of the global model’s performance. Confronting these obstacles is crucial for implementing federated learning in sensitive applications where comprehending model decisions is imperative. Recent studies have explored various approaches to enhance the interpretability of FL models [29]. The proposal of explainable fuzzy regression models aims to reconcile performance and interpretability within a federated framework. The notion of Federated Explainable AI models (Fed-XAI) has been presented to safeguard data privacy and maintain a degree of explainability concurrently [30]. Recent advancements show the increasing potential of Large Language Models (LLMs) to enhance interpretability and prediction accuracy in power systems, more specifically, time series forecasting. This has been demonstrated by the integration of market sentiment and bidding behaviors into electricity price forecasting models [31] and the utilization of event analysis through reflective reasoning mechanisms to enhance forecasting outcomes [32], highlighting promising opportunities for employing similar methods in solar energy forecasting.
Despite the progress in XAI and FL, numerous difficulties still persist. The challenge of balancing model accuracy with interpretability persists, as more complex models generally provide enhanced performance but are harder to understand. Intelligent approaches such as Fed-BN [33] enhance personalization through local batch normalization layers, whereas Hierarchical FL [18] performs multi-level aggregation. However, none of these approaches incorporates feature attribution directly into their aggregation process like XCFL does. The integration of interpretability metrics across federated learning nodes can produce generalized global insights. However, it may obscure node-specific features. Addressing these issues is crucial for establishing confidence in federated AI systems and for their widespread implementation in critical areas [34]. Recent developments highlight hybrid methodologies that integrate physics-based modeling with symbolic regression to improve interpretability and generalization with limited data. This is exemplified in [35], where a gray box model that employs symbolic regression to create precise and interpretable models for air conditioning systems effectively resolves the complexities of white box models and the obscurities of black box models. Furthermore, ref. [36] emphasizes the significance of systematic feature selection in augmenting model interpretability and predictive accuracy. They employed Elastic Net and Artificial Neural Networks for the essential selection of input features in air conditioning equipment modeling, illustrating that meticulous selection of impactful input features markedly enhances the performance and elucidation of predictive models in energy-related contexts.

Motivation

Most FL setups apply explainability to centralized models, focusing on global interpretability without considering local model subtleties. Explainability methods like SHAP and LIME are generally constrained to centralized or local models without federated learning [10]. Currently, in centralized or federated models with explainability, privacy issues may arise as client data can still be indirectly revealed through aggregated models or shared updates. Conventional federated learning frameworks do not emphasize explainability, particularly with local models, due to privacy limitations [37]. Authors in [38] employ model aggregation methodologies that consider data heterogeneity among clusters, like weight-based aggregation or personalized federated learning (FedProx). Implementing explainability approaches within a privacy-preserving federated learning framework guarantees the generation of insights without disclosing raw client data. This is vital in domains such as energy forecasting, where sensitive data such as energy usage and local meteorological conditions are used. Integrating CFL with explainability mitigates various deficiencies of conventional approaches, especially regarding data heterogeneity, privacy assurance, and the provision of explainable insights at both local and global scales.
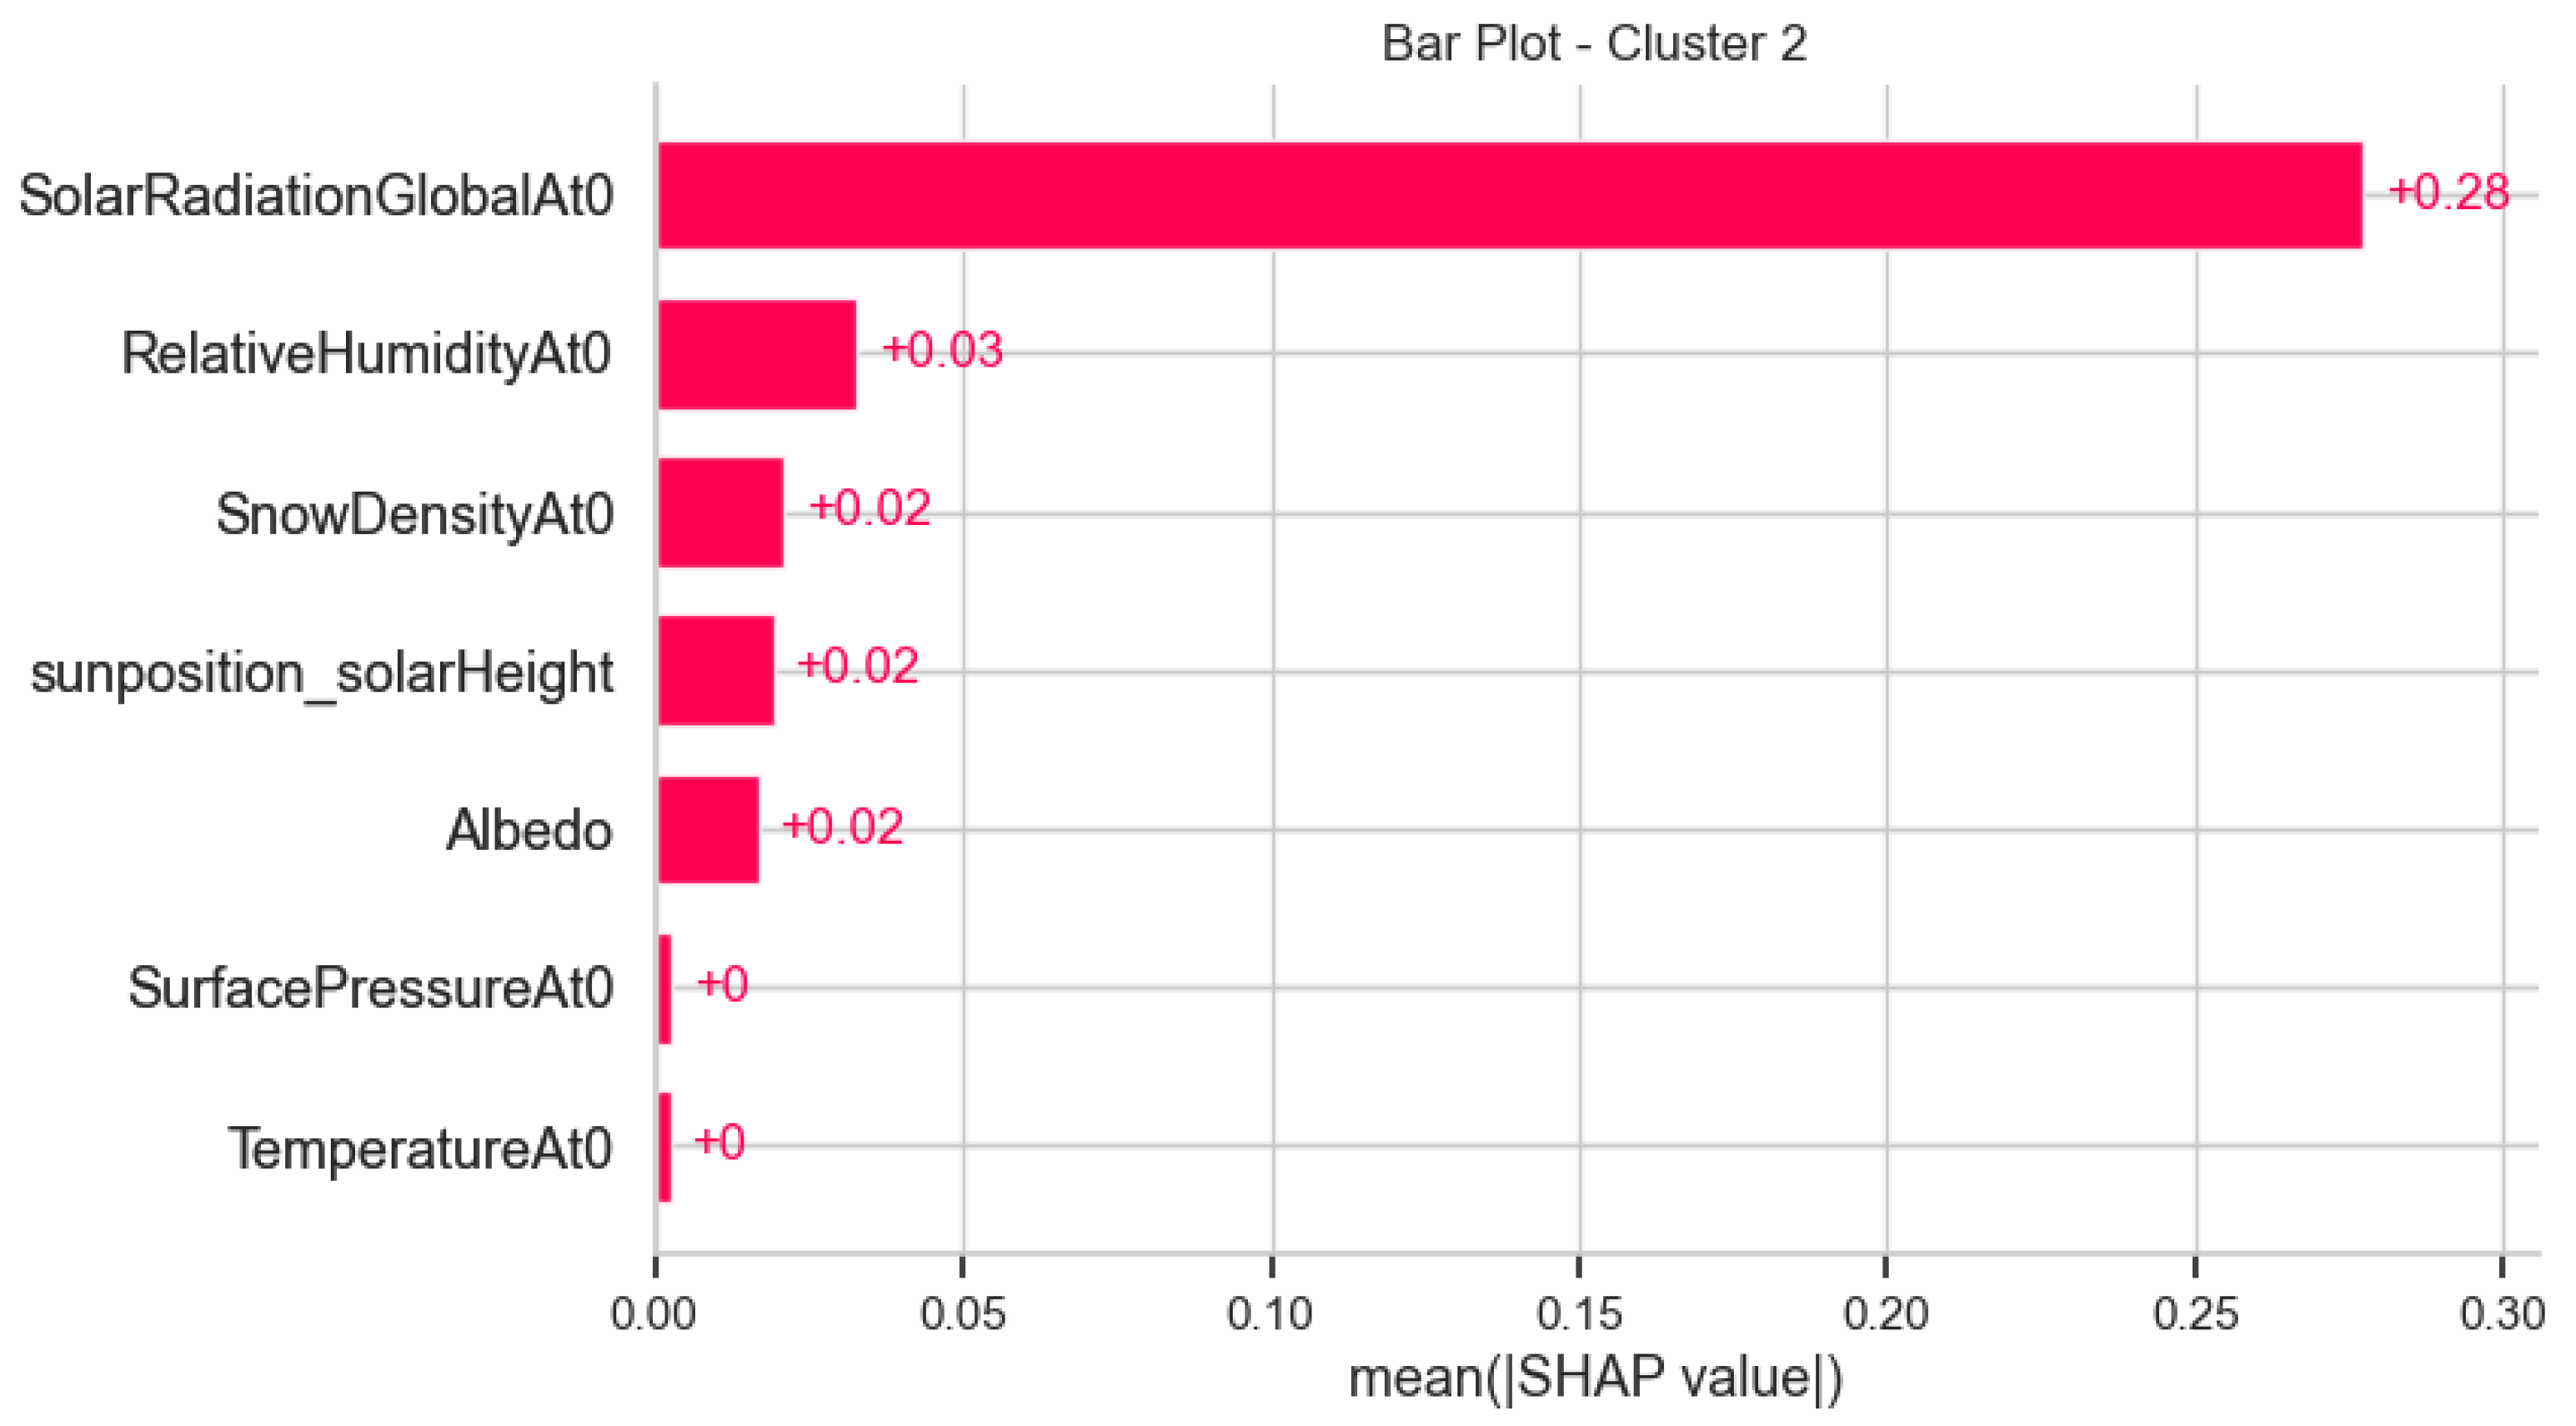
In contrast, the proposed XCFL enhances federated learning by ensuring that model enhancements and decisions are informed by domain-specific insights. In smart grid and solar forecasting applications, as well as in time-series forecasting across distributed clients, this results in practical benefits: energy operators receive more precise predictions customized for various grid segments, and they learn insights into the explanations for variations in the predictions as in our proposed XCFL approach, the forecast is most contributed by the “SolarRadiationGlobalAT0” feature in the cluster. It reduces the challenges of data heterogeneity by clustering, offers some level of personalization, preserves privacy via federated training, and ensures model interpretability through integrated XAI, achieving a balance that existing approaches addressed as separate issues [11,16,17]. This ensures that the collaborative models are robust, customized to their data niches, and understandable at local, cluster, and global levels. It demonstrates a significant improvement over the current state-of-the-art FedAvg [39], clustered FL [40], or XAI tools [30] in FL by providing a comprehensive framework that allows stakeholders to evaluate and validate each model’s behavior. It is especially critical in areas like renewable energy forecasts, where model-aware tasks such as grid management or energy trading require both accuracy and trustworthiness.

3. System Model

In recent years, solar PV generation has emerged as one of the most significant energy sources. The intermittent nature of solar energy poses considerable challenges to power system operations. To address this issue, numerous solar power forecasting techniques have been established, with varying methodologies required by different forecast horizons. Short-term predictions typically necessitate numerical weather prediction models (NWP) that yield critical estimations of meteorological variables, including sun irradiation, temperature, wind speed, precipitation, and air pressure. This research proposes a machine learning model, like XGBoost and RFR, for solar power forecasting at designated geographical locations across various locations in Germany. Moreover, the clustering has been done based on similar features, demonstrating sites utilizing the federated learning approach. The XAI technique has been employed to examine the factors that significantly influence the prediction model and to categorize similar PV sites. This optimized approach effectively integrates CFL with explainability methodologies, providing precise, customized, and comprehensible energy forecasting.

4. Explainable Clustered Federated Learning

Currently, AI has been applied to numerous industries, but its full adoption is constrained by the opaque internal processes of AI systems [41]. Both academics and industries have developed numerous strategies and XAI technologies to make AI systems transparent. LIME (Local Interpretable Model-Agnostic Explanations) [42], SHAP (Shapley Additive exPlanations) [43], ELI5, MLxtend (machine learning extensions) [44], Interpret ML [45], TreeInterpreter [15], Alibi [46], yellowbrick, CEM (Contrastive Explanation Method), and others are a few of these methods and tools. In this paper, we focus on the SHAP, which is widely used in the PV power prediction model by developers and researchers these days. The interpretation of the Random Forest and XGboost models involves an analysis by calculating the average change in model predictions resulting from variations in input features. It’s important to note that all the methods mentioned above only provide insights into the global behavior of the ML model. In contrast, the SHAP method explores both local and global behavior, utilizing game theory-based SHapley values to overcome these limitations [47]. Additionally, SHAP’s feature attribution values are additive, meaning their sum equals the model’s prediction, rendering SHAP more intuitive [43].

4.1. SHAP

SHAP (SHapley Additive exPlanations) operates on the principle of cooperative game theory, aiming to explain the contribution of each input feature to individual predictions [43]. It calculates the average change in predictions when a particular feature is included across all possible feature combinations [48]. These calculations yield SHAP values, which ensure that the sum of feature contributions equals the model’s prediction. By creating a baseline, perturbing input features, and constructing a weighted linear model, SHAP provides a transparent approximation of complex models’ behavior. The incorporation of SHAP-based feature importance enhances interpretability and enables more informed aggregation within XCFL, it does introduce a degree of computational overhead at the client or cluster level. To maintain overall efficiency, XCFL is designed with a clustering mechanism applied prior to federated training. This clustering significantly reduces both the number of communication rounds and the volume of model updates transmitted between clients and the central server. By performing aggregation at the cluster level instead of the individual client level, XCFL effectively mitigates the additional cost introduced by SHAP computations. While this work does not explicitly quantify the SHAP-related overhead, the overall architecture of XCFL achieves a favorable trade-off, balancing predictive performance with scalability and communication efficiency. This approach enables both global and local interpretations, making it a robust tool for understanding feature importance and interactions within a model’s decision-making process [49]. The SHAP values are calculated as
e ( z ) = δ 0 + f = 1 M δ f z f
z is the combination matrix, e ( z ) is explaining the model by using δ which is the contribution feature in particular δ 0 the baseline prediction value, δ f the SHAP characteristic values and z f is the coalition vector indicating whether a feature is included (11) or not (0). In the proposed XCFL framework, SHAP values serve not only as global feature importance metrics but also as local and cluster-level feature-dependent attributions that drive the weighting of model updates. This feature-level weighting mitigates variability by allowing cluster-specific prioritization of predictive features. To reduce such unfairness, our approach standardizes SHAP contributions among clients within each cluster, ensuring that no individual client’s feature predominates due to localized false correlations. In addition, by aggregating normalized SHAP values at the cluster level and not relying exclusively on client-specific distributions, we enhance the fair representation of diverse configurations. Regarding overfitting, using SHAP for weighting mitigates the impact of irrelevant or weakly correlated features, thus effectively normalizing the model updates.

4.2. Interpretation of CFL Using XAI Tools

The growing adoption of artificial intelligence has highlighted its complexity, including issues related to ethics, privacy, security, and intellectual property rights, commonly referred to as copyright. These concerns are being addressed through innovative methodologies, such as explainable AI, trusted AI, and distributed learning frameworks like federated learning (FL). Analyzing CFL with Explainable AI can help build trust and provide transparency in decentralized machine learning models, particularly in critical infrastructures such as energy demand forecasting. We propose Explainable Clustered Federated Learning, which aims to provide enhanced interpretability and performance by organizing clients with heterogeneous data distributions into clusters, facilitating personalized models for each clustering group. FL models, similar to conventional machine learning models, often function as “black boxes”, which complicates the client’s comprehension of the bias behind predictions. Integrating XAI techniques, such as SHAP, LIME, and permutation, is important as it renders CFL models interpretable at both local (client or cluster) and global levels. This facilitates a comprehensive understanding of how various input factors, such as meteorological conditions or solar radiation, impact forecasts across different geographies, providing actionable insights while preserving data privacy. Federated learning inherently incurs communication overhead, which can become a significant challenge in real-world scenarios characterized by limited bandwidth or high-latency networks. The XCFL mitigates this issue by performing aggregation at the cluster level, rather than the individual client level, thereby reducing the frequency of communication rounds. However, its performance may still be influenced by unstable network conditions or resource limitations.
The integration of CFL and XAI improves model efficacy and reliability, rendering it more appropriate for real-world applications where transparency in decision-making is essential. Clustering in the federated approach for solar farms is essential because of the varying weather patterns and environmental circumstances across different geographical regions, which can influence solar power generation in diverse ways [50]. The imperative for output forecaster interpretability through XAI stems from the requirement to comprehend the impact of local variables, such as solar radiation, temperature, and cloud cover, on power predictions, thereby facilitating more reliable and transparent decision-making in energy management across various regions.
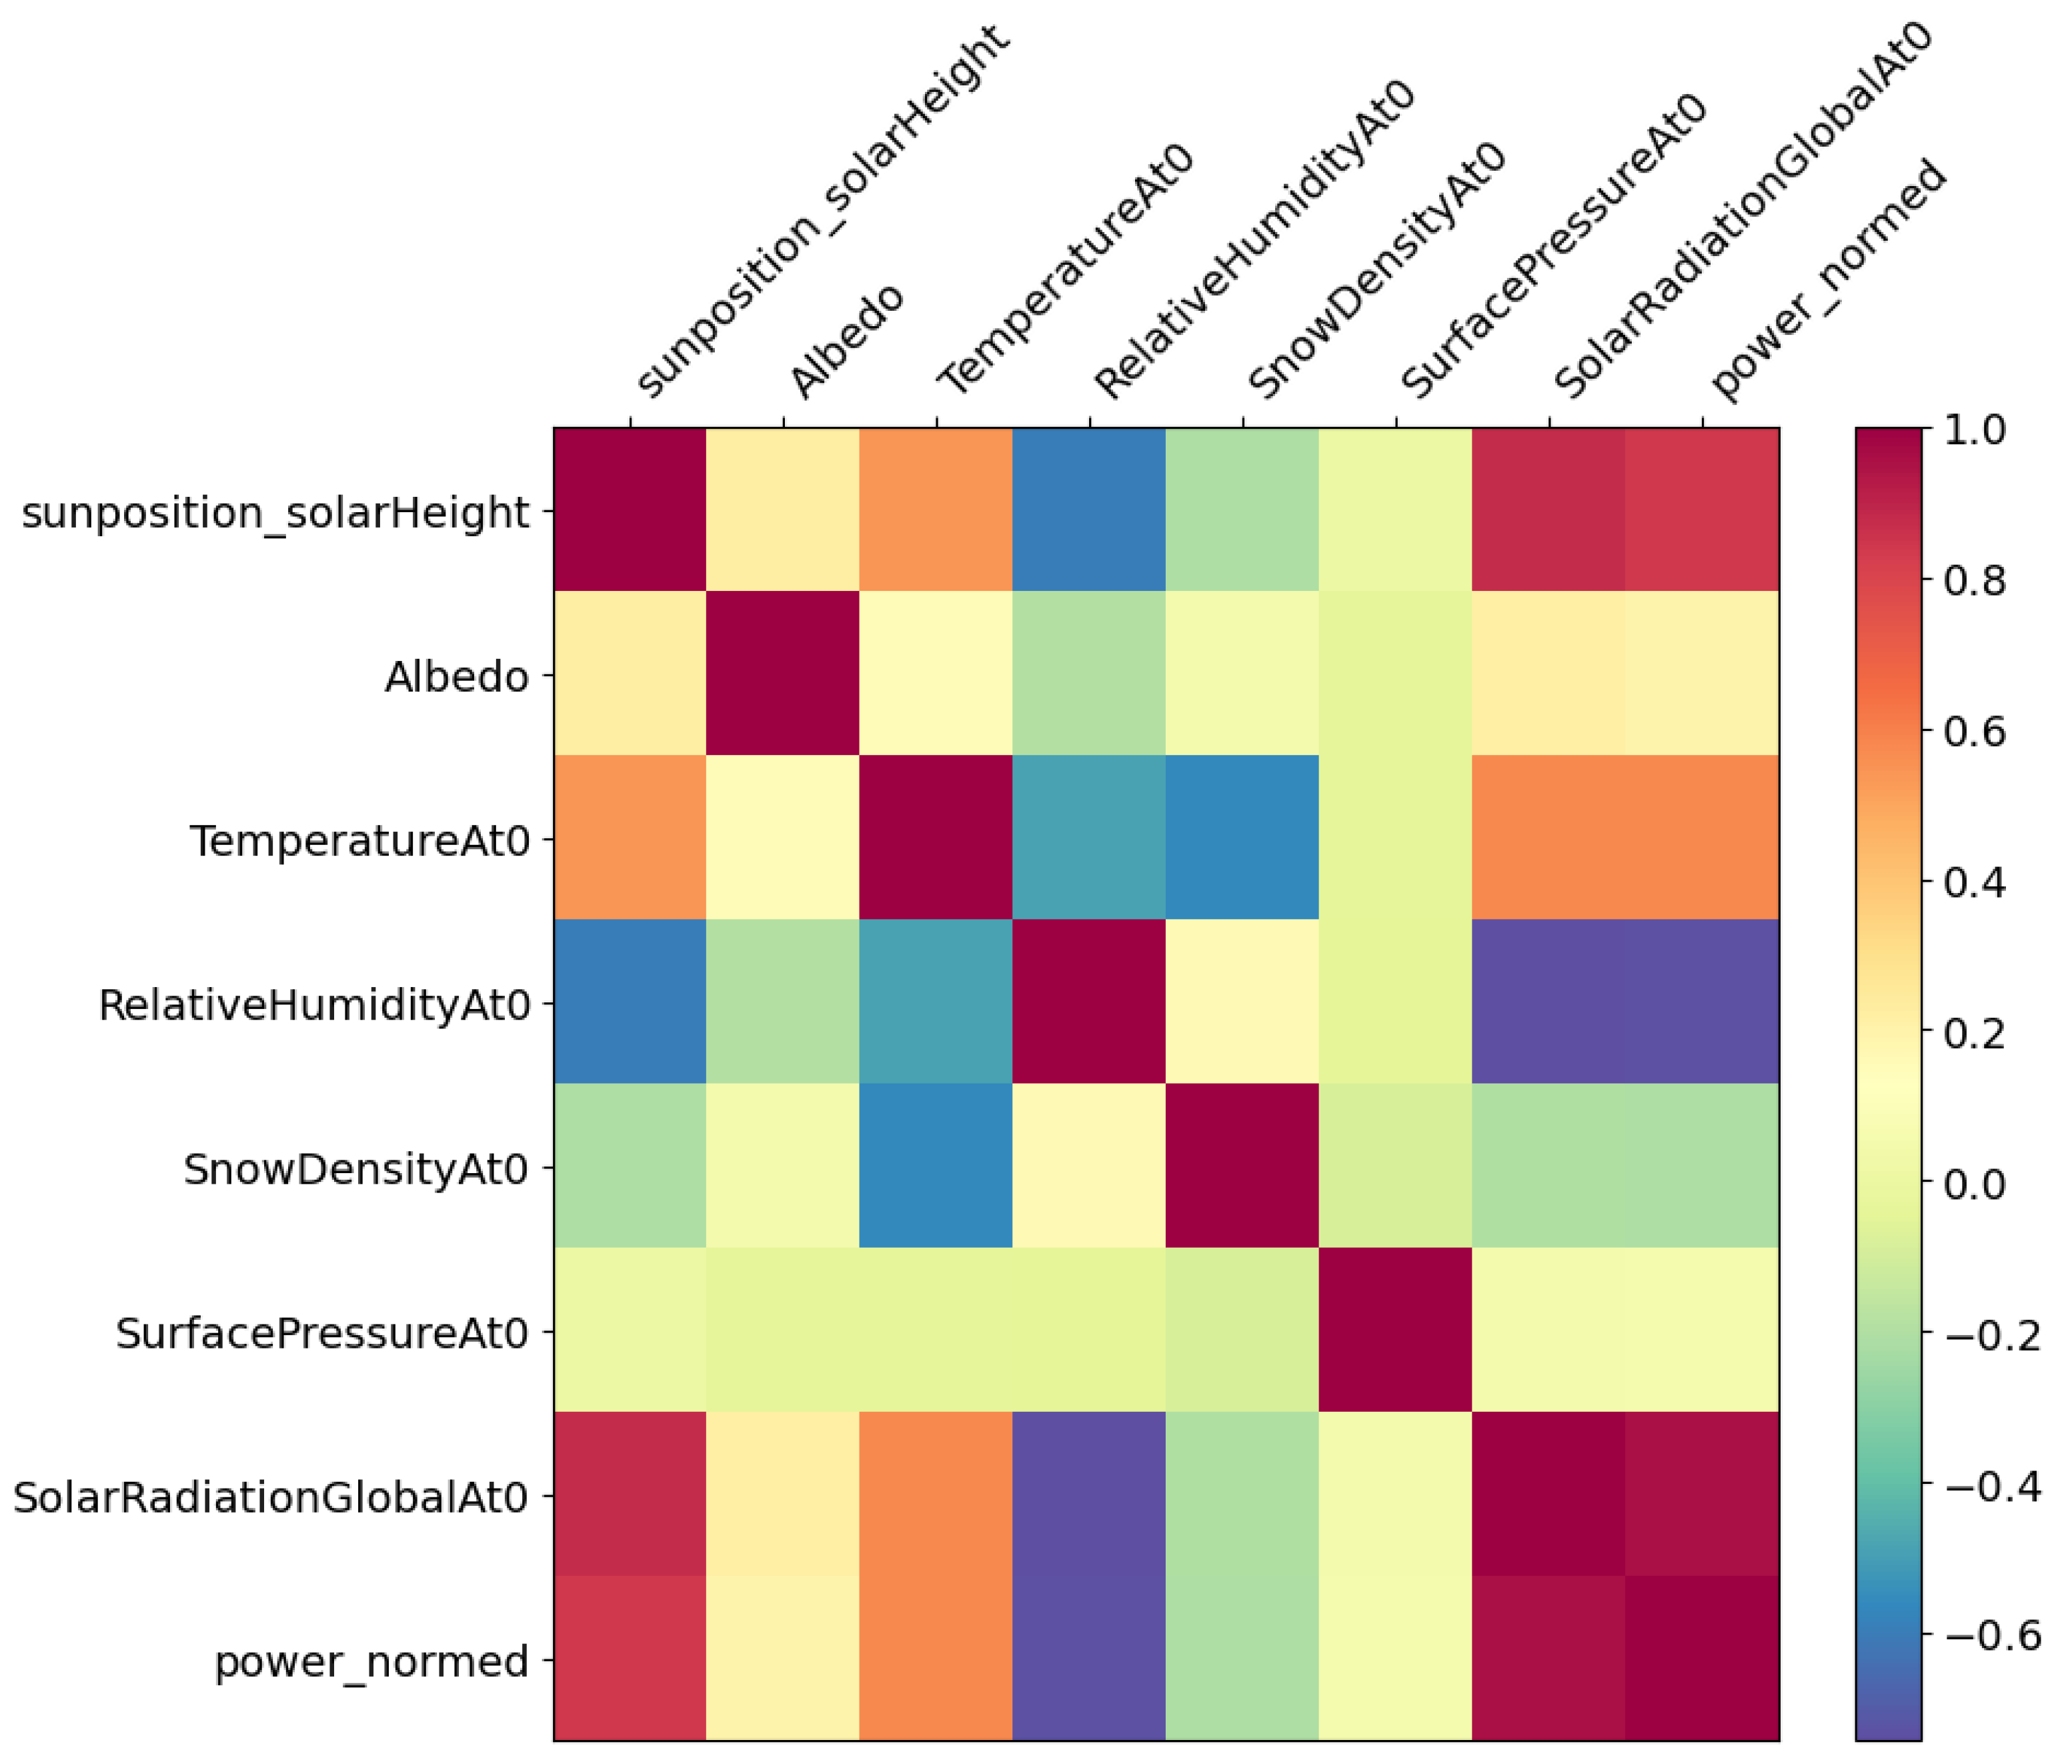
The distributed photovoltaic (PV) panels in various geographical regions demonstrate considerable variations in weather and meteorological conditions. To tackle this heterogeneity, we first find out the most significant features by Pearson correlation analysis, as shown in Figure 1. The Pearson correlation has been selected for its increased efficiency in identifying important linear relationships within the dataset relative to other approaches. Its computational efficiency and efficacy make it a suitable choice for feature selection in solar PV analysis. Figure 1 illustrates the linear relationships between input features and the target variable power_normed. It helps identify inter-feature correlations, which can be leveraged to avoid feature redundancy and improve model generalization. These insights not only validate the input selection but also inform strategies for data collection and model simplification in practical deployments. Data heterogeneity is a core challenge in distributed solar forecasting systems. Although XCFL addresses this by applying Mean Shift clustering to group clients with similar data patterns, the effectiveness of this strategy depends on the ability to form well-defined clusters. In practical scenarios involving high noise levels, sparse measurements, or significant variability, the clustering process may become less reliable. As a result, the global model may struggle to accurately represent localized behaviors. Using Mean-Shift clustering ensures that photovoltaic panels are clustered according to the underlying data distribution, thereby enhancing the effectiveness of federated learning by assuring that localized models are developed on more homogeneous datasets. Clients execute localized training within their cluster, utilizing the feature set particular to that cluster. Utilizing XAI tools, the most contributing features for the localized models in each cluster are analyzed, and the models, together with their corresponding feature importance weights, are shared with the server as
ω m ( t + 1 ) = k C m f = 1 F δ f ( k ) k C m δ f ( k ) 1 j = 1 j f F a j ω k ( t )
where m is the cluster index, k is the clients in cluster C m , δ f is the important features score contributing the model in the training and a j are the weights assigned to each feature based on their contribution scores, using the XAI tools to be shared with the server for cluster-specific aggregation purposes. Furthermore, XCFL explicitly addresses data heterogeneity by allowing each cluster to train localized models that adapt to unique climatic, geographic, or sensor conditions, thus outperforming uniform global models in heterogeneous settings. The server then executes weighted aggregation based on feature significance values to provide cluster-specific models and subsequently performs global aggregation. This technique is repetitively executed for each round. The XAI approaches enable the elucidation of feature contributions, which are crucial for effective cluster-specific model aggregation and improving the overall training process as in Equation (3).
ω t + 1 = k C m f = 1 F δ f ( k ) m C m δ f m 1 j = 1 j i F a j ω m t
where m is the index of cluster, k (1, 2, 3, …, K) is the clients in cluster C m , δ f ( k ) is contribution of the features by k client. Equations (2) and (3) present the hierarchical weighted aggregation process used in XCFL. In contrast to conventional FedAvg, where all client contributions are treated equally, XCFL leverages feature importance scores (extracted using XAI tools) and inter-feature redundancy penalties to compute client-specific and cluster-specific weights. This enables the aggregation to be performance-aware and semantically informed, ensuring that models trained on more informative or diverse features contribute more significantly to the global model. The normalization terms ensure fair comparison across clients and clusters, while the redundancy term ( 1 j = 1 j i F a j ) reduces the influence of overlapping or less distinctive features. This mechanism enhances the robustness and generalization capability of the global model, particularly under non-IID and heterogeneous data distributions. The working flow of the XCFL algorithm is explained in Algorithm 1. In line 3, the server is initializing the initial model, computing the person coefficient, and assigning the initial clustering. The local model training is done in lines 7 and 8, whereas in line 9, the SHAP values are computed for each feature from the dataset, and then the process of weight assignment for weighted aggregation is calculated in line 10. In line 13, the server aggregates models from all clusters using cluster-level SHAP contributions and finally returns the cluster-specific model in line 15.
Algorithm 1 Explainable Clustered Federated Learning (XCFL).
1:
Input:  D = { D 1 , D 2 , , D N } , C, T, epochs e, η , F, ω 0
2:
Output: Cluster-specific explainable models ω C m t
3:
Server Initialization: Compute P.C for F assign clients into clusters { C 1 , C 2 , , C M }
4:
for  t = 1 , 2 , , T   do
5:
    for  m = 1 , 2 , , C  do
6:
        for  k C m (parallel) do
7:
           Set local model: ω k ( t ) ω m ( t )
ω k ( t ) ω k ( t ) η F ( ω k ( t ) , D k )
8:
           
δ f ( k ) = SHAP ( ω k ( t ) , D k ) , f F
9:
        Compute normalized weights for clients using SHAP values:
a k ( m ) = f F δ f ( k ) k C m f F δ f ( k )
10:
        Weighted aggregation to update cluster-specific model:
ω C m ( t + 1 ) = k C m α k ( m ) · ω k ( t )
11:
        Aggregate SHAP values at cluster-level:
δ f ( m ) = k C m δ f ( k ) , f F
12:
        Share ω m ( t + 1 ) and δ f ( m ) to server
13:
    Global Aggregation:
a m = f F δ f ( m ) m = 1 C f F δ f ( m )
14:
    Compute global model:
ω ( t + 1 ) = m = 1 C a m · ω m ( t )
15:
return  ω C m t

5. Experiments and Results Discussions

5.1. Dataset

The German Solar Farm dataset comprises 21 solar installations in different locations across Germany. Their installed nominal power varies from 100 kW to 8500 kW [51]. The PV installations encompass residential solar panels to comprehensive solar farms. They are dispersed over Germany, as illustrated in Figure 2. Historical NWP data and power output for each facility are provided at three-hour intervals over a span of 990 days. All time series in the dataset, with the exception of the measured power output, are normalized to a range of 0 to 1 with min-max normalization. The goal variable, the measured power output, is normalized by the nominal output capacity of each PV facility. Consequently, permit the evaluation of forecasting performance irrespective of the dimensions of the PV facilities.
Each dataset consists of 41 features. Regarding feature selection, we performed Pearson correlation analysis on the actual dataset of 41 meteorological and environmental parameters in order to find the most important features that have a significant linear correlation with the target variable (power_normed). Pearson correlation finds the correlation coefficient for each feature in relation to the output variable. Features showing poor or redundant correlations were eliminated, and the eight most correlated features were chosen for model training to enhance efficiency, avoid overfitting, and improve interpretability, as shown in Figure 1. All the datasets are checked against any missing data, and all the datasets are normalized. 80% of the data was used for training, while the remaining 20% was used for testing. Three state-of-the-art machine learning models, SVR, RFR, and XGBoost, were compared to check the accuracies of predicting solar power forecasting. All the models are compared using statistical metrics, which include Root Mean Square Error, Mean Absolute Error, and R2 score.The outputs of two models (XGBoost and RFR) are interpreted and analyzed using different XAI tools. Figure 3 shows the graphical illustration of the comparison of predicted values and the actual values for XGBoost and RFR models. The lists of parameters and their values used in the experiments ar highlighted in Table 2.

5.2. Results

We use three different types of error metrics, root mean squared error (RMSE), mean absolute error (MAE), and R2 error, to illustrate prediction accuracy, especially prediction error, when we are dealing with prediction of energy demand, classified as a regression prediction model, where the mapping function produces continuous prediction outputs.
In Table 3, the performance comparisons of different clusters in terms of different error metrics are compared, and the clustering with 5 clusters performs better in terms of the performance of the cluster-specific model. The Table 3 shows that clustering clients based on the significance of feature contributions markedly influences model performance. Insufficient clusters (e.g., 2) may inadequately represent heterogeneity, whereas excessive clusters (e.g., 4) may result in inadequate generalization. The optimal compromise is observed with 3 or 5 clusters, where RMSE, MAE, and R2 scores exhibit greater equilibrium. In our experimental setting, the clustering configuration with four clusters led to a significant decline in model performance, shown by the negative R2 score, suggesting an imbalance in data distribution or insufficient representation within that clustering arrangement. In contrast, 3 clusters achieve a compromise between model complexity and generalization, but 5 clusters configuration, despite being numerically bigger than 4, showed better clustering assignment with the underlying data distribution and higher accuracy.
Table 4 explains the difference between the performance of the global clustered model and the performance of the FedAvg model in term of different error metrics. It can be seen that the global model using the XCFL has shown a significantly better performance than the conventional FedAvg. FedAvg does uniform averaging, presuming that all clients contribute equally. This may result in over-fitting if certain clients dominate updates and introduce bias in learning, as irrelevant features are also taken into account. The negative R2 value for cluster 4 in Table 3 is because the predictive model built for this cluster underperformed compared to a baseline model that predicts only the mean of the observed outputs. An R2 value (coefficient of determination) is negative when the selected model inadequately represents the underlying data patterns, resulting in greater prediction error than conventional mean-based metrics. In our experiment, this indicates that the data allocated to cluster 4 is comparatively more heterogeneous, resulting in insufficient model fitting and generalization. The proposed XCFL performs weighted aggregation based on SHAP feature contributions, thereby prioritizing more relevant features and balancing model updates across clusters. Although the incorporation of SHAP-based feature importance enhances interpretability and enables more informed aggregation within XCFL, it does introduce a degree of computational overhead at the client or cluster level. To maintain overall efficiency, XCFL is designed with a clustering mechanism applied prior to federated training. This clustering significantly reduces both the number of communication rounds and the volume of model updates transmitted between clients and the central server. By performing aggregation at the cluster level instead of the individual client level, XCFL effectively mitigates the additional cost introduced by SHAP computations. While this work does not explicitly quantify the SHAP-related overhead, the overall architecture of XCFL achieves a favorable trade-off, balancing predictive performance with scalability and communication efficiency.
Furthermore, we have compared our proposed method using a convolutional neural network (CNN). Table 5 presents a comparative evaluation of the proposed XCFL approach against conventional Federated Learning (FedAvg) and a centralized learning setup, all using CNN for forecasting solar power output.
The results clearly show that XCFL achieves the lowest RMSE (0.38), lowest MAE (0.27), and highest R2 Score (0.92), indicating more accurate and consistent predictions. Additionally, XCFL maintains fast inference performance, similar to FedAvg, making it viable for real-time deployment. Most importantly, we introduced a regression-based accuracy metric (i.e., predictions within 10% of the actual values), where XCFL achieved 0.98, significantly outperforming both FedAvg (0.95) and centralized CNN (0.89). Additionally, we have analyzed our proposed approach using a recurrent neural network (RNN). The results demonstrate that XCFL achieves the best performance across all metrics: lowest RMSE (0.41), lowest MAE (0.29), and highest R2 score (0.90) (Table 6). This indicates that XCFL not only generalizes better across distributed data, but also captures temporal dependencies effectively through localized models aggregated via a weighted strategy.
In terms of accuracy, XCFL again outperforms with 96%, compared to 92% for FedAvg and 88% for centralized network. Although the training time for XCFL and FedAvg is relatively high due to the sequential nature of the model, the inference speed remains acceptable for real-time forecasting scenarios.
The mean absolute SHAP values represent the average contribution of each feature on the predictive model in Figure 4. The X Axis values (E[f(X)]) correspond to the expected values of the model. The baseline value, represented as E[f(X)] = 0.085, is the mean model output included in the dataset (basically the anticipated output before to considering any particular feature values). Y-axis (values of features): Each row displays a characteristic and its corresponding value for this particular occurrence. SolarRadiationGlobalAt0 = 0.656 denotes that the feature “SolarRadiationGlobalAt0” has a value of 0.656 for this particular instance.
For this specific case, the predicted value (f(x) = 0.396) is obtained by combining the base value (E[f(X)] = 0.085) with the contributions from the individual characteristics. The estimated numerical value is 0.396. In other words, the SHAP waterfall in Figure 4 demonstrates the relative contribution of each input feature to a single prediction made by the model. SolarRadiationGlobalAt0 emerges as the most influential factor, substantially increasing the predicted solar power output, which aligns with its known physical role in photovoltaic generation. On the other hand, features such as RelativeHumidityAt950 exhibit a slight negative impact, suggesting that high atmospheric moisture at this level may attenuate irradiance. Other features contribute minimally in this instance, highlighting how SHAP enables targeted feature-level understanding. These insights can inform operational decisions, such as prioritizing the maintenance or calibration of key environmental sensors like irradiance and humidity detectors in solar farms. The result indicates that SolarRadiationGlobalAt0 is the most significant feature, with the highest SHAP value (+0.28), implying that fluctuations in global sun radiation substantially affect power generation predictions in this cluster. Solar radiation directly affects the output power of photovoltaic (PV) systems, which is anticipated. Other significant features, including RelativeHumidityAt0, SnowDensityAt0, and s u n p o s i t i o n _ s o l a r H e i g h , exhibit lower SHAP values, suggesting a comparatively diminished impact on the model’s predictions relative to solar radiation.
These SHAP values are utilized to find the contribution of the most contributing features towards the model and are utilized in the weighted model aggregation. Along with the model, these shape values are also shared with the server, which is further used to update the cluster-specific models.
Figure 5 substantiates the proposed XCFL algorithm’s ability to identify more significant features for solar forecasting for cluster no. 2 and illustrates how SHAP values facilitate interpretability at both local and cluster-level aggregations. Incorporating these SHAP-derived insights into the XCFL weighted aggregation technique guarantees that the cluster-specific aggregated model successfully highlights the predictive significance of solar radiation while suitably integrating secondary contributions from other environmental parameters. This weighted, feature-driven aggregation improves forecast accuracy and dramatically improves model transparency, allowing users and energy system operators to better understand and trust projections.

6. Conclusions

This study presents the Explainable Clustered Federated Learning (XCFL) method that incorporates explainability into the clustering mechanism of federated learning. Our methodology presents a systematic framework to improve performance and interpretability, commencing with feature selection, subsequently clustering clients based on the chosen features, doing local client training, and analysing contributions through SHAP values. XCFL guarantees a more equitable and data-driven model updating process by integrating feature-level contributions into the aggregation process at both the cluster and global levels. The incorporation of weighted aggregation according to feature contributions enhances adaptation to customer diversity and increases decision-making transparency. The results of the proposed XCFL method show that XCFL significantly outperforms conventional clustering techniques and the FedAvg algorithm. Utilizing feature-based explainability, our methodology not only achieved enhanced model performance but also explained the significance of particular features in influencing clustering and model modifications. The combined benefits of improved accuracy and explainability establish XCFL as a potential option to address the complexities of heterogeneous and distributed learning environments. Future research may investigate additional enhancements to the feature contribution method and expand XCFL to encompass dynamic and real-time clustering contexts, ensuring greater applicability and influence.

Author Contributions

Conceptualization, S.S.A. and B.J.C.; investigation, S.S.A.; resources, S.S.A. and B.J.C.; writing—original draft preparation, S.S.A.; writing—review and editing, M.A., D.M.S.B. and B.J.C.; visualization, M.A. and S.S.A.; supervision, B.J.C.; project administration, B.J.C.; funding acquisition, B.J.C. All authors have read and agreed to the published version of the manuscript.

Funding

This research was supported by the MSIT Korea under the NRF Korea (RS-2025-00557379, 90%) and the Information Technology Research Center (ITRC) support program (IITP-2025-RS-2020-II201602, 10%) supervised by the IITP.

Data Availability Statement

The dataset is available on request at https://www.uni-kassel.de/eecs/ies/downloads.

Conflicts of Interest

The authors declare no conflicts of interest.

Abbreviations

The following abbreviations are used in this manuscript:
AIArtificial Intelligence
ANNArtificial Neural Network
CFLClustered Federated Learning
DLDeep Learning
DNNDeep Neural Network
FLFederated Learning
MAEMean Absolute Error
MLMachine Learning
NNNeural Network
PCPearson Correlation
PVPhotovoltaic
RESRenewable Energy Sources
RFRRandom Forest Regressor
RMSERoot Mean Square error
SHAPSHapley Additive exPlanations
XAIExplainable Artificial Intelligence
XCFLExplainable Clustered Federated Learning
XGBoostExtreme Gradient Boosting

References

  1. Gielen, D.; Gorini, R.; Wagner, N.; Leme, R.; Gutierrez, L.; Prakash, G.; Asmelash, E.; Janeiro, L.; Gallina, G.; Vale, G.; et al. Global Energy Transformation: A Roadmap to 2050; International Renewable Energy Agency: Masdar City, United Arab Emirates, 2019. [Google Scholar]
  2. Yang, C.; Hu, W.; Liu, J.; Han, C.; Gao, Q.; Mei, A.; Zhou, Y.; Guo, F.; Han, H. Achievements, challenges, and future prospects for industrialization of perovskite solar cells. Light. Sci. Appl. 2024, 13, 227. [Google Scholar] [CrossRef] [PubMed]
  3. Ali, S.S.; Ali, M.; Bhatti, D.M.S.; Choi, B.J. dy-TACFL: Dynamic Temporal Adaptive Clustered Federated Learning for Heterogeneous Clients. Electronics 2025, 14, 152. [Google Scholar] [CrossRef]
  4. Flammer, J.; Mozaffarieh, M. Autoregulation, a balancing act between supply and demand. Can. J. Ophthalmol. 2008, 43, 317–321. [Google Scholar] [CrossRef]
  5. Voyant, C.; Notton, G.; Kalogirou, S.; Nivet, M.L.; Paoli, C.; Motte, F.; Fouilloy, A. Machine learning methods for solar radiation forecasting: A review. Renew. Energy 2017, 105, 569–582. [Google Scholar] [CrossRef]
  6. Ahmed, R.; Sreeram, V.; Mishra, Y.; Arif, M. A review and evaluation of the state-of-the-art in PV solar power forecasting: Techniques and optimization. Renew. Sustain. Energy Rev. 2020, 124, 109792. [Google Scholar] [CrossRef]
  7. Zeng, J.; Qiao, W. Short-term solar power prediction using a support vector machine. Renew. Energy 2013, 52, 118–127. [Google Scholar] [CrossRef]
  8. Ren, Y.; Suganthan, P.; Srikanth, N. Ensemble methods for wind and solar power forecasting—A state-of-the-art review. Renew. Sustain. Energy Rev. 2015, 50, 82–91. [Google Scholar] [CrossRef]
  9. Hewamalage, H.; Bergmeir, C.; Bandara, K. Recurrent neural networks for time series forecasting: Current status and future directions. Int. J. Forecast. 2021, 37, 388–427. [Google Scholar] [CrossRef]
  10. Minh, D.; Wang, H.X.; Li, Y.F.; Nguyen, T.N. Explainable artificial intelligence: A comprehensive review. Artif. Intell. Rev. 2022, 55, 3503–3568. [Google Scholar] [CrossRef]
  11. Dwivedi, R.; Dave, D.; Naik, H.; Singhal, S.; Omer, R.; Patel, P.; Qian, B.; Wen, Z.; Shah, T.; Morgan, G.; et al. Explainable AI (XAI): Core ideas, techniques, and solutions. ACM Comput. Surv. 2023, 55, 1–33. [Google Scholar] [CrossRef]
  12. Thurbon, E.; Kim, S.Y.; Tan, H.; Mathews, J.A. Developmental Environmentalism: State Ambition and Creative Destruction in East Asia’s Green Energy Transition; Oxford University Press: Oxford, UK, 2023. [Google Scholar]
  13. Pinheiro, M.G.; Madeira, S.C.; Francisco, A.P. Short-term electricity load forecasting—A systematic approach from system level to secondary substations. Appl. Energy 2023, 332, 120493. [Google Scholar] [CrossRef]
  14. Butt, H.S.; Huang, Q.; Schäfer, B. Explainable Reinforcement Learning for Optimizing Electricity Costs in Building Energy Management. In Proceedings of the 2024 3rd International Conference on Energy Transition in the Mediterranean Area (SyNERGY MED), Limassol, Cyprus, 21–23 October 2024; pp. 1–6. [Google Scholar]
  15. Revert, F. Interpreting Random Forest and Other Black Box Models like XGBoost Towards Data Science 2018. Available online: https://medium.com/data-science/interpreting-random-forest-and-other-black-box-models-like-xgboost-80f9cc4a3c38 (accessed on 25 March 2025).
  16. McMahan, B.; Moore, E.; Ramage, D.; Hampson, S.; y Arcas, B.A. Communication-efficient learning of deep networks from decentralized data. In Proceedings of the Artificial intelligence and statistics, Fort Lauderdale, FL, USA, 20–22 April 2017; pp. 1273–1282. [Google Scholar]
  17. Long, G.; Xie, M.; Shen, T.; Zhou, T.; Wang, X.; Jiang, J. Multi-center federated learning: Clients clustering for better personalization. World Wide Web 2023, 26, 481–500. [Google Scholar] [CrossRef]
  18. Xie, W.B.; Lee, Y.L.; Wang, C.; Chen, D.B.; Zhou, T. Hierarchical clustering supported by reciprocal nearest neighbors. Inf. Sci. 2020, 527, 279–292. [Google Scholar] [CrossRef]
  19. MacQueen, J. Some methods for classification and analysis of multivariate observations. In Proceedings of the Fifth Berkeley Symposium on Mathematical Statistics and Probability, Volume 1: Statistics; University of California Press: Berkeley, CA, USA, 1967; Volume 5, pp. 281–298. [Google Scholar]
  20. Saputra, Y.M.; Hoang, D.T.; Nguyen, D.N.; Dutkiewicz, E.; Mueck, M.D.; Srikanteswara, S. Energy demand prediction with federated learning for electric vehicle networks. In Proceedings of the 2019 IEEE global communications conference (GLOBECOM), Waikoloa, HI, USA, 9–13 December 2019; pp. 1–6. [Google Scholar]
  21. Renda, A.; Ducange, P.; Marcelloni, F.; Sabella, D.; Filippou, M.C.; Nardini, G.; Stea, G.; Virdis, A.; Micheli, D.; Rapone, D.; et al. Federated learning of explainable AI models in 6G systems: Towards secure and automated vehicle networking. Information 2022, 13, 395. [Google Scholar] [CrossRef]
  22. Zhang, Y.; Yu, H. LR-XFL: Logical Reasoning-based Explainable Federated Learning. In Proceedings of the AAAI Conference on Artificial Intelligence, Vancouver, BC, Canada, 26–27 February 2024; Volume 38, pp. 21788–21796. [Google Scholar]
  23. Kuzlu, M.; Cali, U.; Sharma, V.; Güler, Ö. Gaining insight into solar photovoltaic power generation forecasting utilizing explainable artificial intelligence tools. IEEE Access 2020, 8, 187814–187823. [Google Scholar] [CrossRef]
  24. Ali, M.; Singh, A.K.; Kumar, A.; Ali, S.S.; Choi, B.J. Comparative analysis of data-driven algorithms for building energy planning via federated learning. Energies 2023, 16, 6517. [Google Scholar] [CrossRef]
  25. Zhang, L.; Wen, J.; Li, Y.; Chen, J.; Ye, Y.; Fu, Y.; Livingood, W. A review of machine learning in building load prediction. Appl. Energy 2021, 285, 116452. [Google Scholar] [CrossRef]
  26. Chen, Y.; Guo, M.; Chen, Z.; Chen, Z.; Ji, Y. Physical energy and data-driven models in building energy prediction: A review. Energy Rep. 2022, 8, 2656–2671. [Google Scholar] [CrossRef]
  27. Chen, Z.; Chen, Y.; He, R.; Liu, J.; Gao, M.; Zhang, L. Multi-objective residential load scheduling approach for demand response in smart grid. Sustain. Cities Soc. 2022, 76, 103530. [Google Scholar] [CrossRef]
  28. López-Blanco, R.; Alonso, R.S.; González-Arrieta, A.; Chamoso, P.; Prieto, J. Federated learning of explainable artificial intelligence (FED-XAI): A review. In Proceedings of the International Symposium on Distributed Computing and Artificial Intelligence, L’Aquila, Italy, 9–13 October 2023; Springer: Berlin/Heidelberg, Germany, 2023; pp. 318–326. [Google Scholar]
  29. Qi, P.; Chiaro, D.; Guzzo, A.; Ianni, M.; Fortino, G.; Piccialli, F. Model aggregation techniques in federated learning: A comprehensive survey. Future Gener. Comput. Syst. 2024, 150, 272–293. [Google Scholar] [CrossRef]
  30. Bechini, A.; Daole, M.; Ducange, P.; Marcelloni, F.; Renda, A. An application for federated learning of XAI models in edge computing environments. In Proceedings of the 2023 IEEE International Conference on Fuzzy Systems (FUZZ), Yokohama, Japan, 13–17 August 2023; pp. 1–7. [Google Scholar]
  31. Lu, X.; Qiu, J.; Yang, Y.; Zhang, C.; Lin, J.; An, S. Large Language Model-based Bidding Behavior Agent and Market Sentiment Agent-Assisted Electricity Price Prediction. IEEE Trans. Energy Mark. Policy Regul. 2024. [Google Scholar] [CrossRef]
  32. Wang, X.; Feng, M.; Qiu, J.; Gu, J.; Zhao, J. From news to forecast: Integrating event analysis in llm-based time series forecasting with reflection. Adv. Neural Inf. Process. Syst. 2024, 37, 58118–58153. [Google Scholar]
  33. Li, X.; Jiang, M.; Zhang, X.; Kamp, M.; Dou, Q. Fedbn: Federated learning on non-iid features via local batch normalization. arXiv 2021, arXiv:2102.07623. [Google Scholar]
  34. Lopez-Ramos, L.M.; Leiser, F.; Rastogi, A.; Hicks, S.; Strümke, I.; Madai, V.I.; Budig, T.; Sunyaev, A.; Hilbert, A. Interplay between Federated Learning and Explainable Artificial Intelligence: A Scoping Review. arXiv 2024, arXiv:2411.05874. [Google Scholar]
  35. Yousaf, S.; Bradshaw, C.R.; Kamalapurkar, R.; San, O. A gray-box model for unitary air conditioners developed with symbolic regression. Int. J. Refrig. 2024, 168, 696–707. [Google Scholar] [CrossRef]
  36. Yousaf, S.; Bradshaw, C.R.; Kamalapurkar, R.; San, O. Investigating critical model input features for unitary air conditioning equipment. Energy Build. 2023, 284, 112823. [Google Scholar] [CrossRef]
  37. Chen, P.; Du, X.; Lu, Z.; Wu, J.; Hung, P.C. Evfl: An explainable vertical federated learning for data-oriented artificial intelligence systems. J. Syst. Archit. 2022, 126, 102474. [Google Scholar] [CrossRef]
  38. Li, T.; Sahu, A.K.; Talwalkar, A.; Smith, V. Federated learning: Challenges, methods, and future directions. IEEE Signal Process. Mag. 2020, 37, 50–60. [Google Scholar] [CrossRef]
  39. Sannara, E.; Portet, F.; Lalanda, P.; German, V. A federated learning aggregation algorithm for pervasive computing: Evaluation and comparison. In Proceedings of the 2021 IEEE International Conference on Pervasive Computing and Communications (PerCom), Fort Worth, TX, USA, 23–26 March 2021; pp. 1–10. [Google Scholar]
  40. Sattler, F.; Müller, K.R.; Samek, W. Clustered federated learning: Model-agnostic distributed multitask optimization under privacy constraints. IEEE Trans. Neural Netw. Learn. Syst. 2020, 32, 3710–3722. [Google Scholar] [CrossRef]
  41. Arrieta, A.B.; Díaz-Rodríguez, N.; Del Ser, J.; Bennetot, A.; Tabik, S.; Barbado, A.; García, S.; Gil-López, S.; Molina, D.; Benjamins, R.; et al. Explainable Artificial Intelligence (XAI): Concepts, taxonomies, opportunities and challenges toward responsible AI. Inf. Fusion 2020, 58, 82–115. [Google Scholar] [CrossRef]
  42. Ribeiro, M.T.; Singh, S.; Guestrin, C. “Why should i trust you?” Explaining the predictions of any classifier. In Proceedings of the 22nd ACM SIGKDD International Conference on Knowledge Discovery and Data Mining, San Francisco, CA, USA, 13–17 August 2016; pp. 1135–1144. [Google Scholar]
  43. Lundberg, S.M.; Lee, S.I. A unified approach to interpreting model predictions. Adv. Neural Inf. Process. Syst. 2017, 30. [Google Scholar] [CrossRef]
  44. Raschka, S. MLxtend: Providing machine learning and data science utilities and extensions to Python’s scientific computing stack. J. Open Source Softw. 2018, 3, 638. [Google Scholar] [CrossRef]
  45. Kuo, C. Explain Your Model with Microsoft’s InterpretML. arXiv 2023, arXiv:1909.09223. [Google Scholar]
  46. Klaise, J.; Van Looveren, A.; Vacanti, G.; Coca, A. Alibi explain: Algorithms for explaining machine learning models. J. Mach. Learn. Res. 2021, 22, 1–7. [Google Scholar]
  47. Molnar, C.; Casalicchio, G.; Bischl, B. Interpretable machine learning—A brief history, state-of-the-art and challenges. In Proceedings of the Joint European Conference on Machine Learning and Knowledge Discovery in Databases, Ghent, Belgium, 14–18 September 2020; Springer: Berlin/Heidelberg, Germany, 2020; pp. 417–431. [Google Scholar]
  48. Molnar, C. A Guide for Making Black Box Models Explainable. 2018, Volume 2. Available online: https://christophm.github.io/interpretable-ml-book (accessed on 25 March 2025).
  49. Ali, S.; Abuhmed, T.; El-Sappagh, S.; Muhammad, K.; Alonso-Moral, J.M.; Confalonieri, R.; Guidotti, R.; Del Ser, J.; Díaz-Rodríguez, N.; Herrera, F. Explainable Artificial Intelligence (XAI): What we know and what is left to attain Trustworthy Artificial Intelligence. Inf. Fusion 2023, 99, 101805. [Google Scholar] [CrossRef]
  50. Grataloup, A.; Jonas, S.; Meyer, A. A review of federated learning in renewable energy applications: Potential, challenges, and future directions. Energy AI 2024, 17, 100375. [Google Scholar] [CrossRef]
  51. Gensler, A.; Henze, J.; Raabe, N.; Pankraz, V. GermanSolarFarm Data Set. 2016. Available online: https://www.uni-kassel.de/eecs/ies/downloads (accessed on 5 March 2025).
Figure 1. Pearson Correlation Heatmap for the feature selection.
Energies 18 02380 g001
Figure 2. Solar farms locations across Germany.
Energies 18 02380 g002
Figure 3. Comparison of Actual output vs. predicted data.
Energies 18 02380 g003
Figure 4. SHAP Values for the proposed XAI-based clustering.
Energies 18 02380 g004
Figure 5. SHAP Values for the feature contribution for Cluster 2.
Energies 18 02380 g005
Table 1. List of symbols used.
SymbolsDescription
δ f ( k ) Feature contribution score for client k
δ f m Feature contribution score for cluster m
δ f ( k ) SHAP values for client k and cluster m
mIndex of cluster
kIndex of client
ω m Trained model of cluster m
ω k Trained model of client k
tTraining round
aWeight assign to each feature
CClusters
z Combination matrix of features
δ 0 Baseline prediction value
eEpoches
η Learning rate
FFeature set
Table 2. Parameters and their values used in the experiments.
ParametersValues
Networks UsedSVR, RFR and XGBoost
Number of clients50
Number of clusters2, 3, 4, and 5
Learning rate0.03
Number of epochs100
Total number of features41
Used number of features8
Train data ratio80%
Test data ratio20%
n estimators (RFR and XGBoost)200
XGBoost boostergbtree
Table 3. Performance of XCFL for different clustering configurations.
ClusterRMSEMAER2 Score
20.06580.02640.1979
30.07990.03240.3990
40.27200.2721−0.7230
50.07090.02710.4159
Table 4. Comparison of proposed global model with the FedAvg.
ErrorRMSEMAER2 Score
Global0.12120.06060.5859
FedAvg0.7710.03580.8140
Table 5. Performance Comparison of XCFL with centralized FL and FedAvg using CNN.
ModelRMSE ↓MAE ↓R2 Score ↑Training TimeInference SpeedAccuracy
XCFL0.380.270.92ModerateFast0.98
FedAvg0.440.320.87ModerateFast0.95
Centralized0.480.350.85LowFast0.89
Table 6. Performance Comparison of XCFL with centralized FL and FedAvg using RNN.
ModelRMSE ↓MAE ↓R2Train TimeInfer SpeedAccuracy
XCFL0.410.290.90HighModerate0.96
FedAvg0.480.340.86HighModerate0.92
Centralized FL0.520.370.82ModerateModerate0.88
Disclaimer/Publisher’s Note: The statements, opinions and data contained in all publications are solely those of the individual author(s) and contributor(s) and not of MDPI and/or the editor(s). MDPI and/or the editor(s) disclaim responsibility for any injury to people or property resulting from any ideas, methods, instructions or products referred to in the content.

