
Integrating the Assessment of Environmental Costs and the Non-Energy Benefits of Energy Efficiency into an Energy Demand Analysis of the Tertiary Sector


Abstract
1. Introduction
1.1. Background
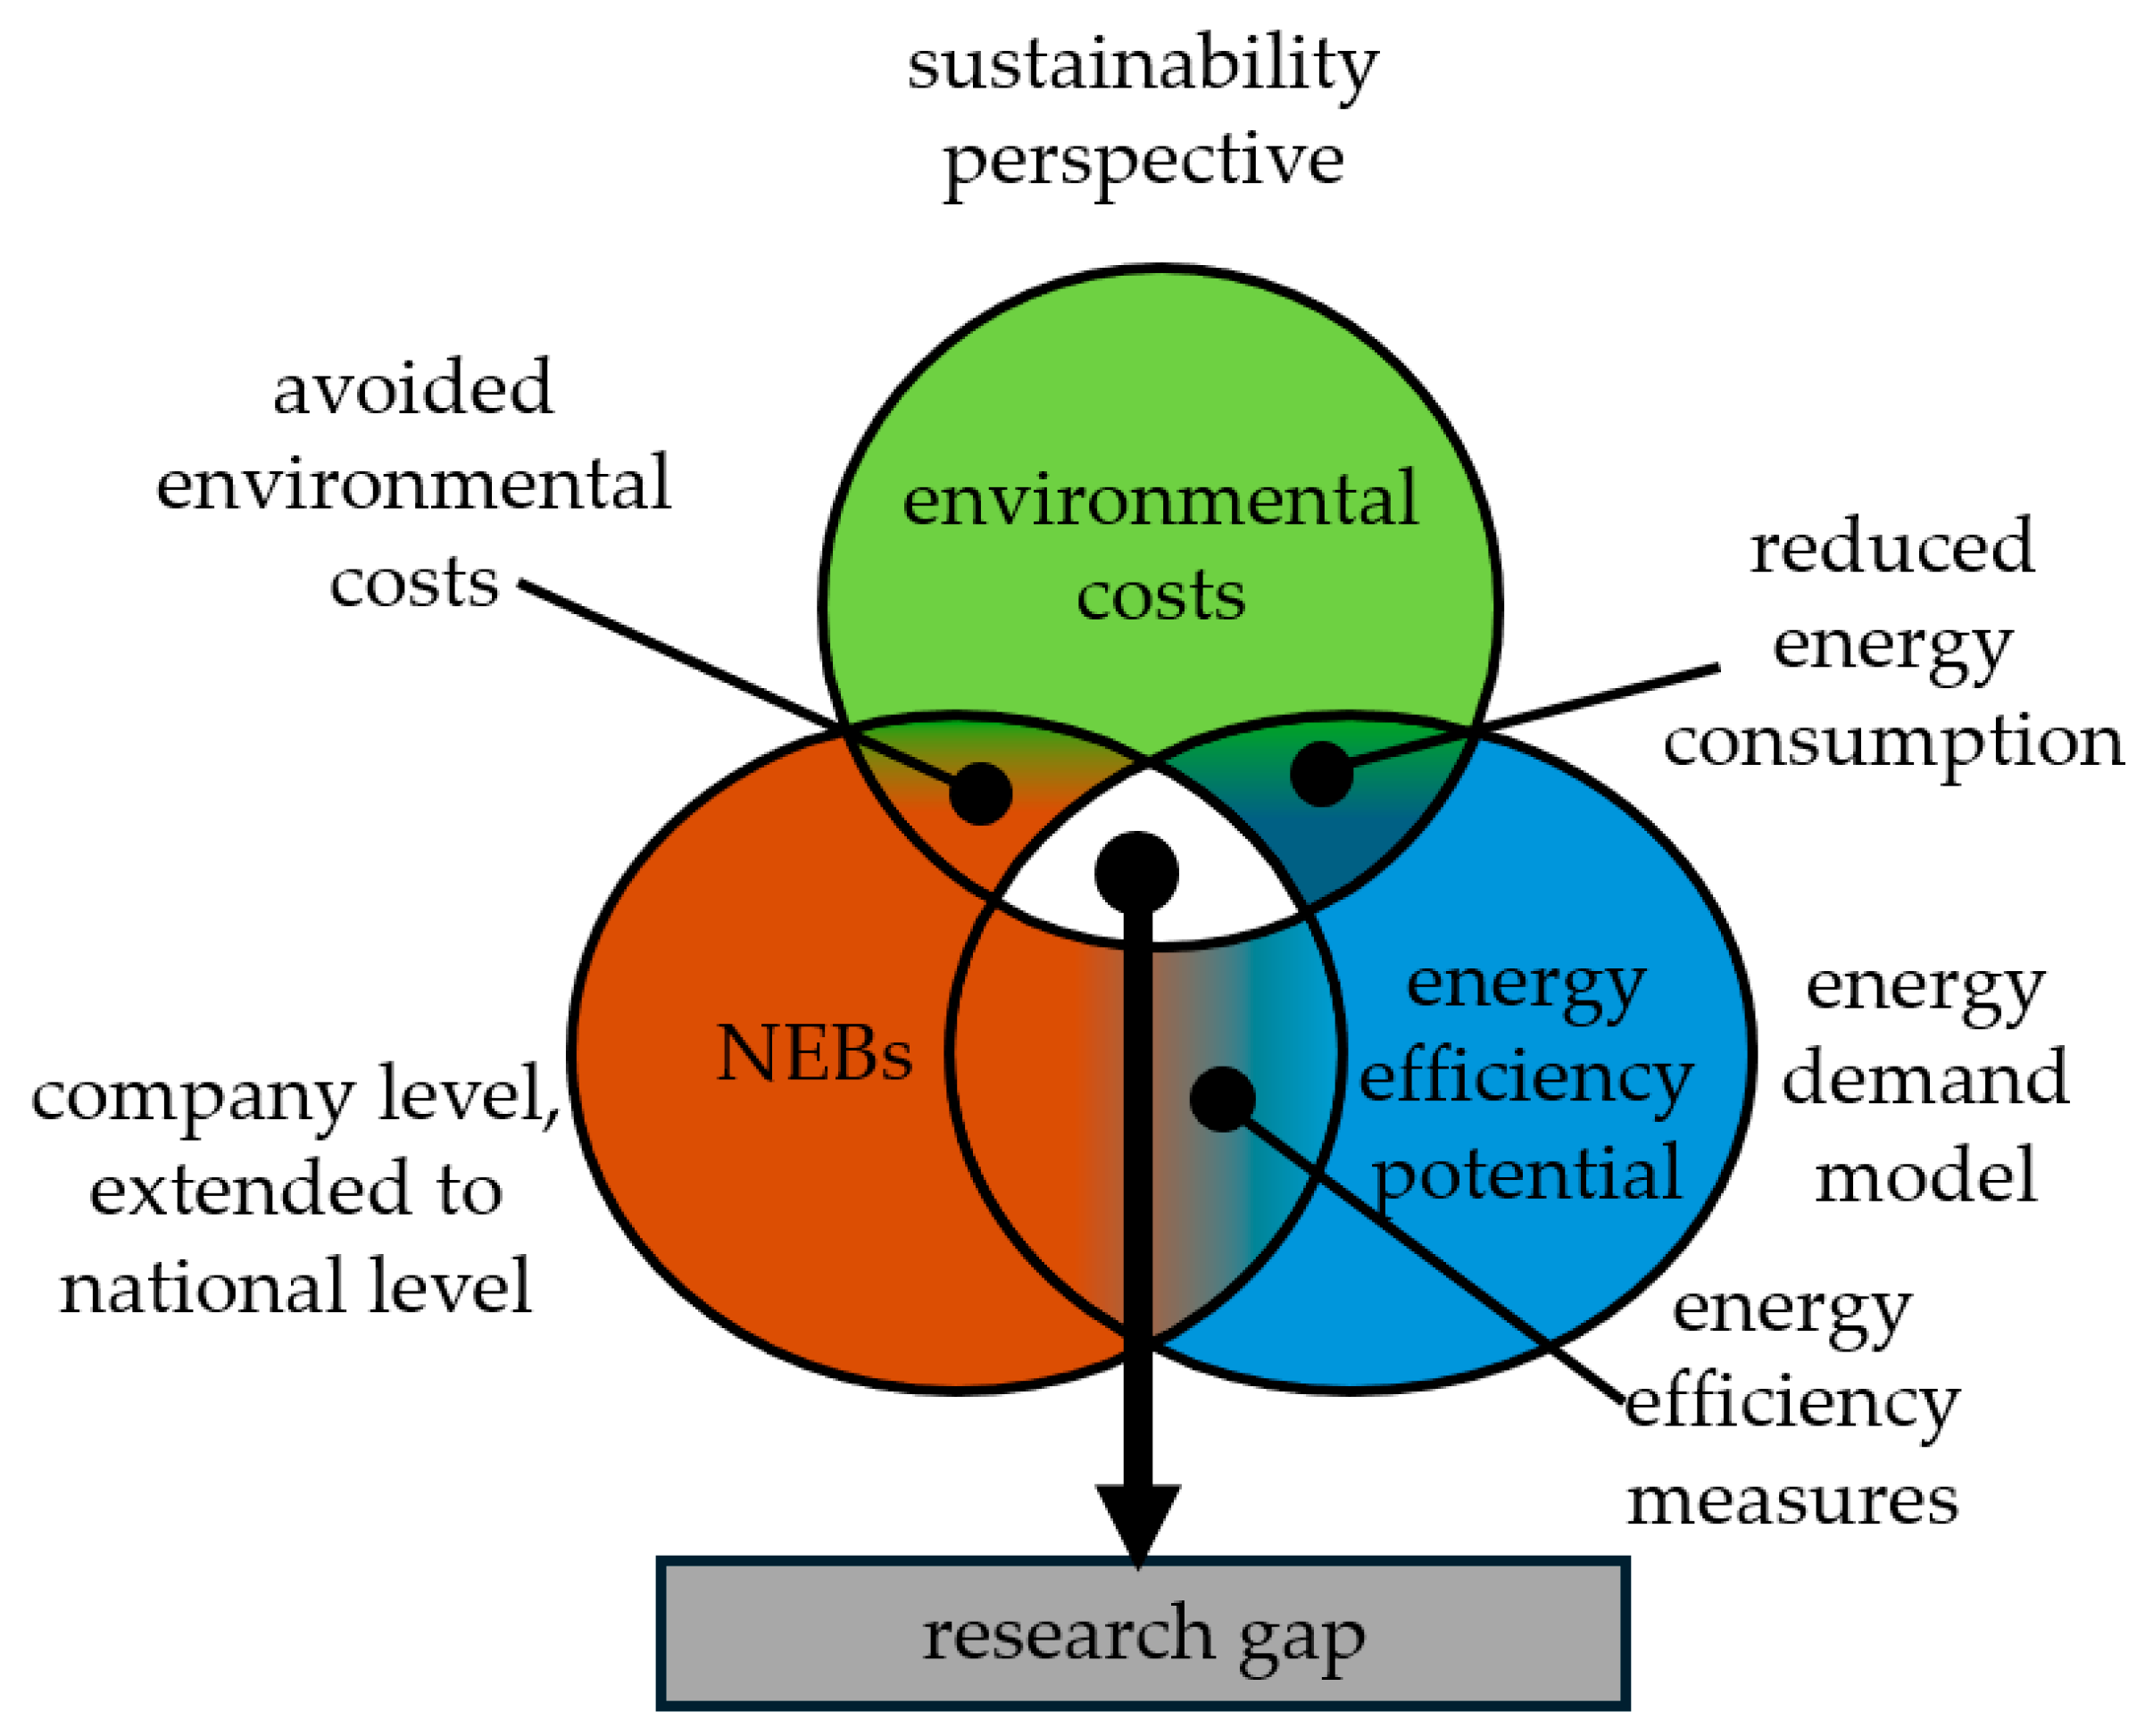
1.2. Research Gap
2. Literature Review
2.1. Techno-Economic Assessments of Energy Efficiency Measures
2.2. Quantification of Environmental Costs

| Costs of Climate Change [9,35] | Discount Rate | Costs of Climate Change [EUR-ct2020/kWh] | EU Emissions Trading System (ETS) Auction Price in 2020 (24.37 EUR2020/tCO2 [38]) [EUR-ct2020/kWh] | Damage Costs of Air Pollutants [EUR-ct2020/kWh] [9,36] | Environmental Damage Costs [EUR-ct2020/kWh] |
|---|---|---|---|---|---|
| EUR2020/CO2,eq: 680 | 0.0% | 29.17 1,3 | −1.045 3 | 0.911 4 | 29.04 1 |
| USD2020/CO2,eq: 308 | 1.5% | 11.59 1,2,3 | −1.045 3 | 0.911 4 | 11.46 1,2 |
| USD2020/CO2,eq: 185 | 2.0% | 6.96 1,2,3 | −1.045 3 | 0.911 4 | 6.83 1,2 |
| USD2020/CO2,eq: 118 | 2.5% | 4.44 2,3 | −1.045 3 | 0.911 4 | 4.31 1,2 |
2.3. Quantification of Non-Energy Benefits
2.4. The Need to Integrate Environmental Costs and NEBs When Calculating the Energy Efficiency Potential
2.5. Tertiary Sector
3. Methodology
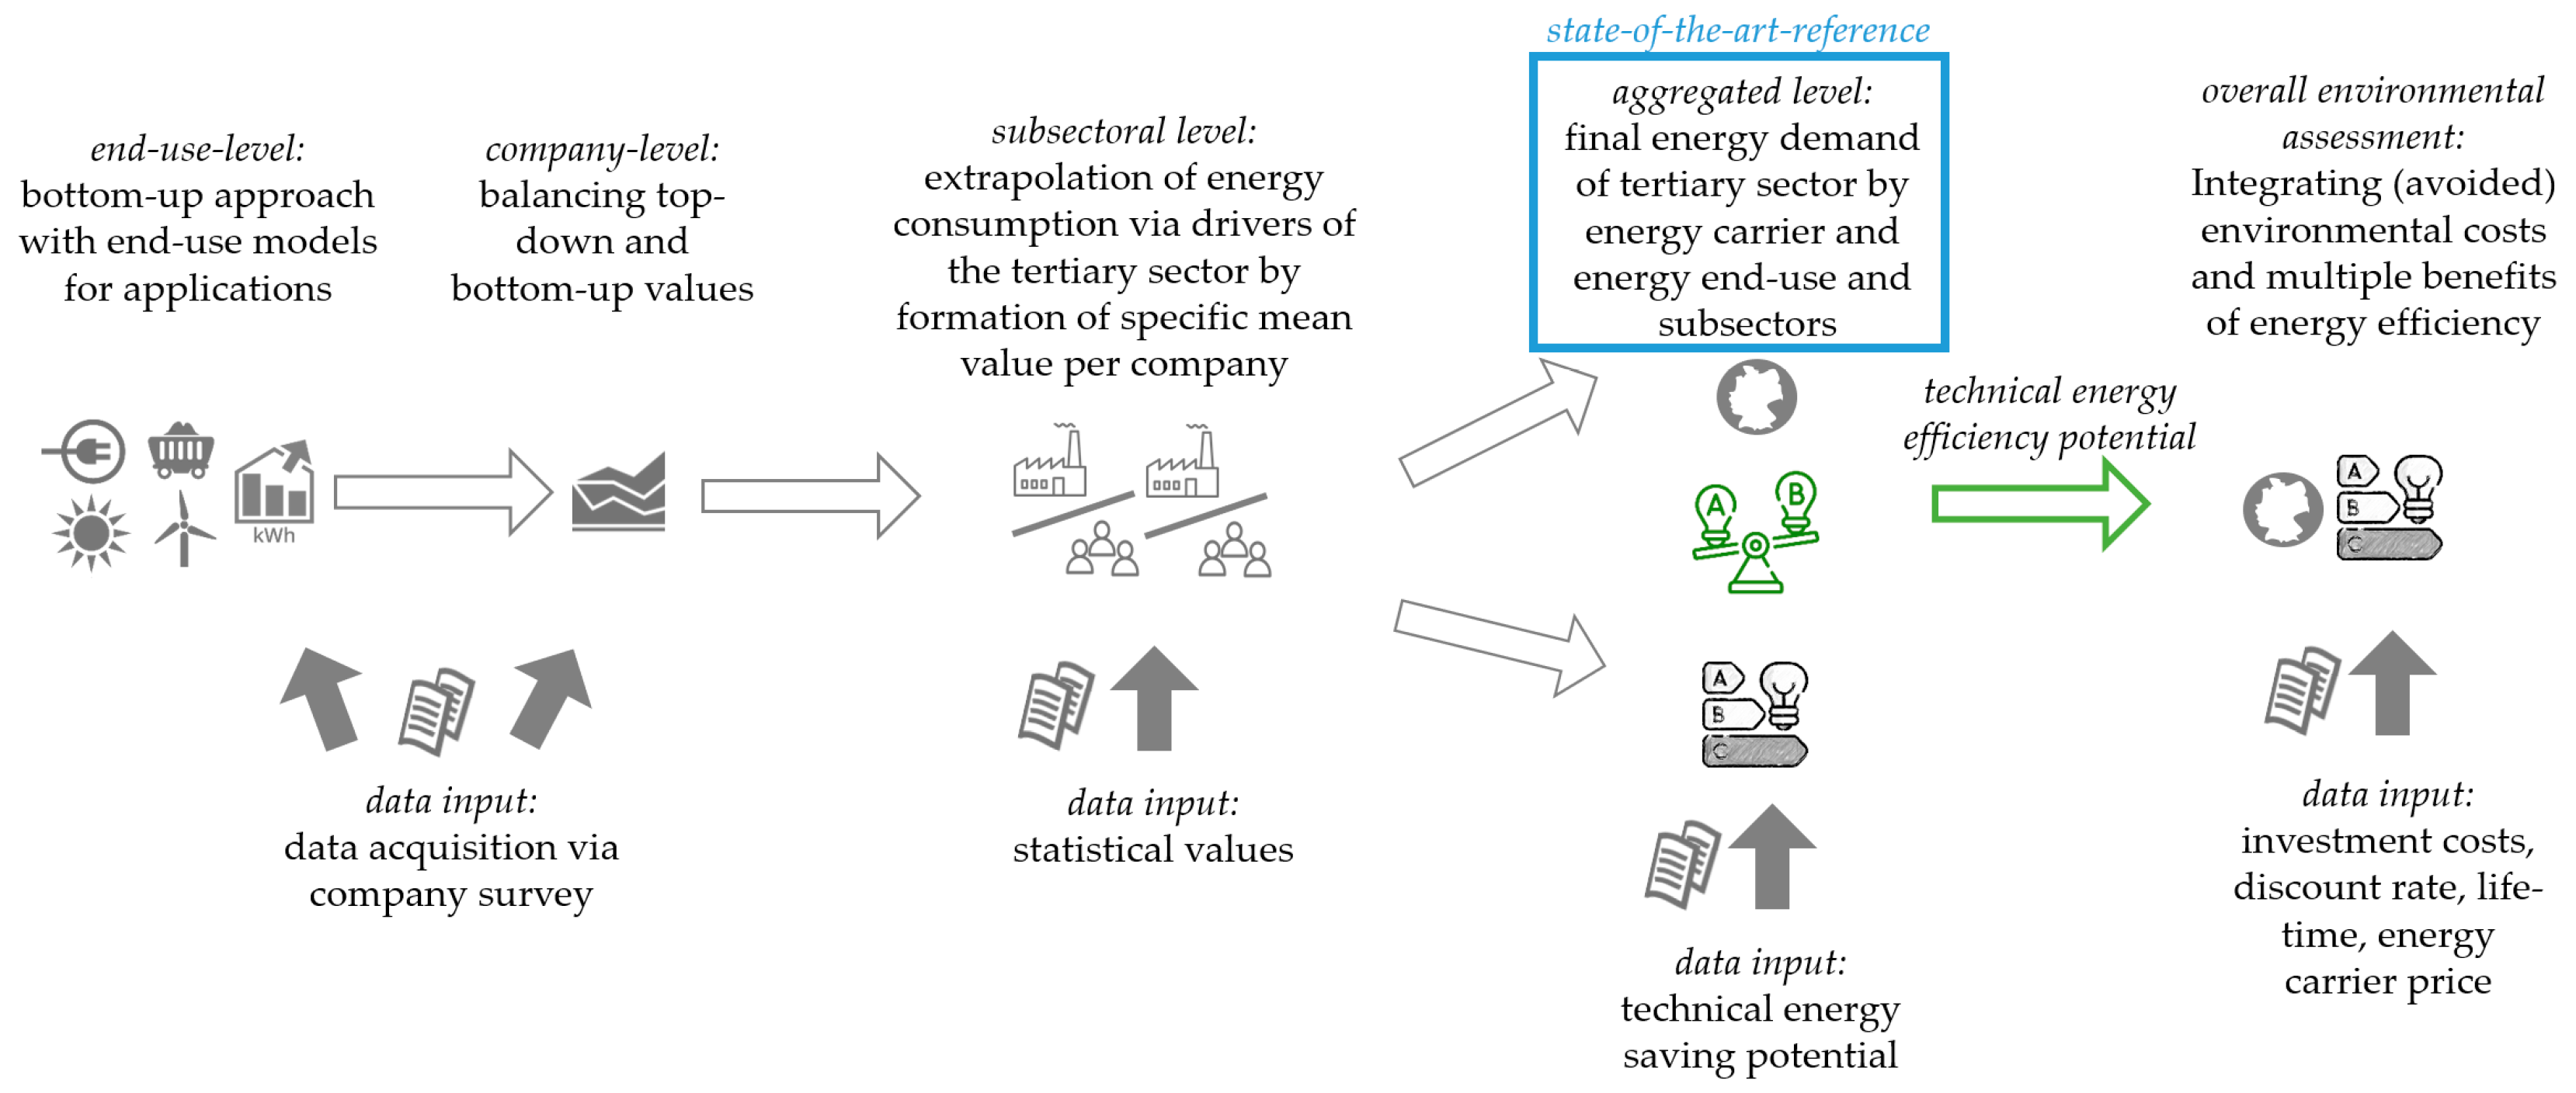
3.1. An Integrated Methodology to Quantify Environmental Costs and Non-Energy Benefits
3.2. Data Sources and Sensitivity
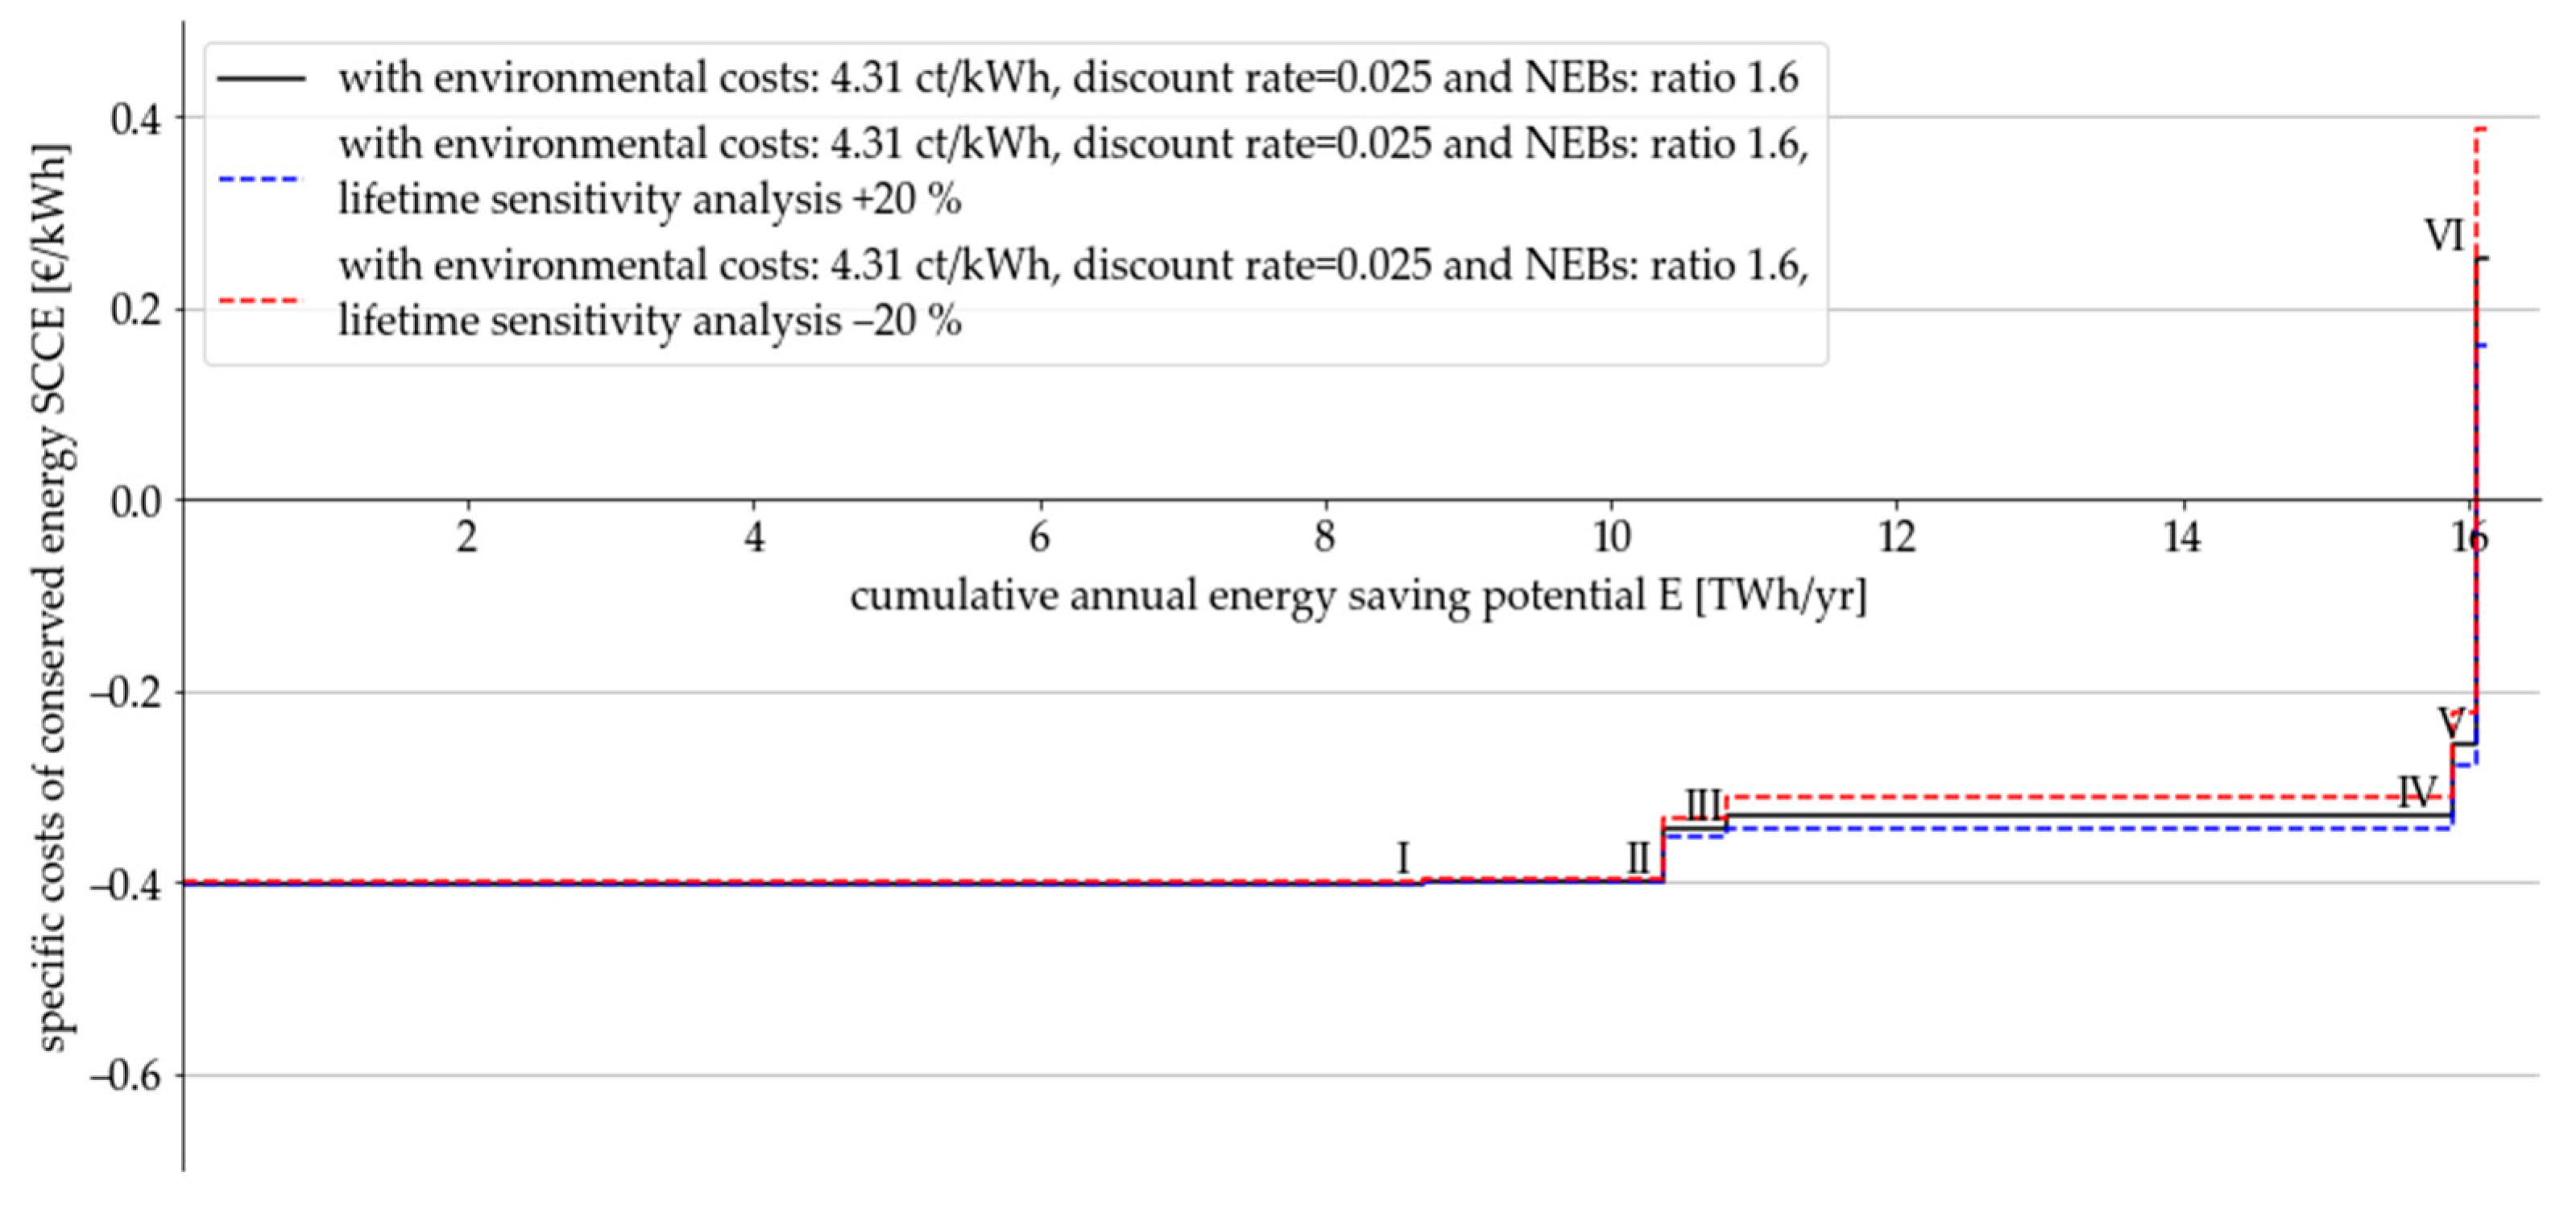
3.3. Sensitivity Analysis
4. Results
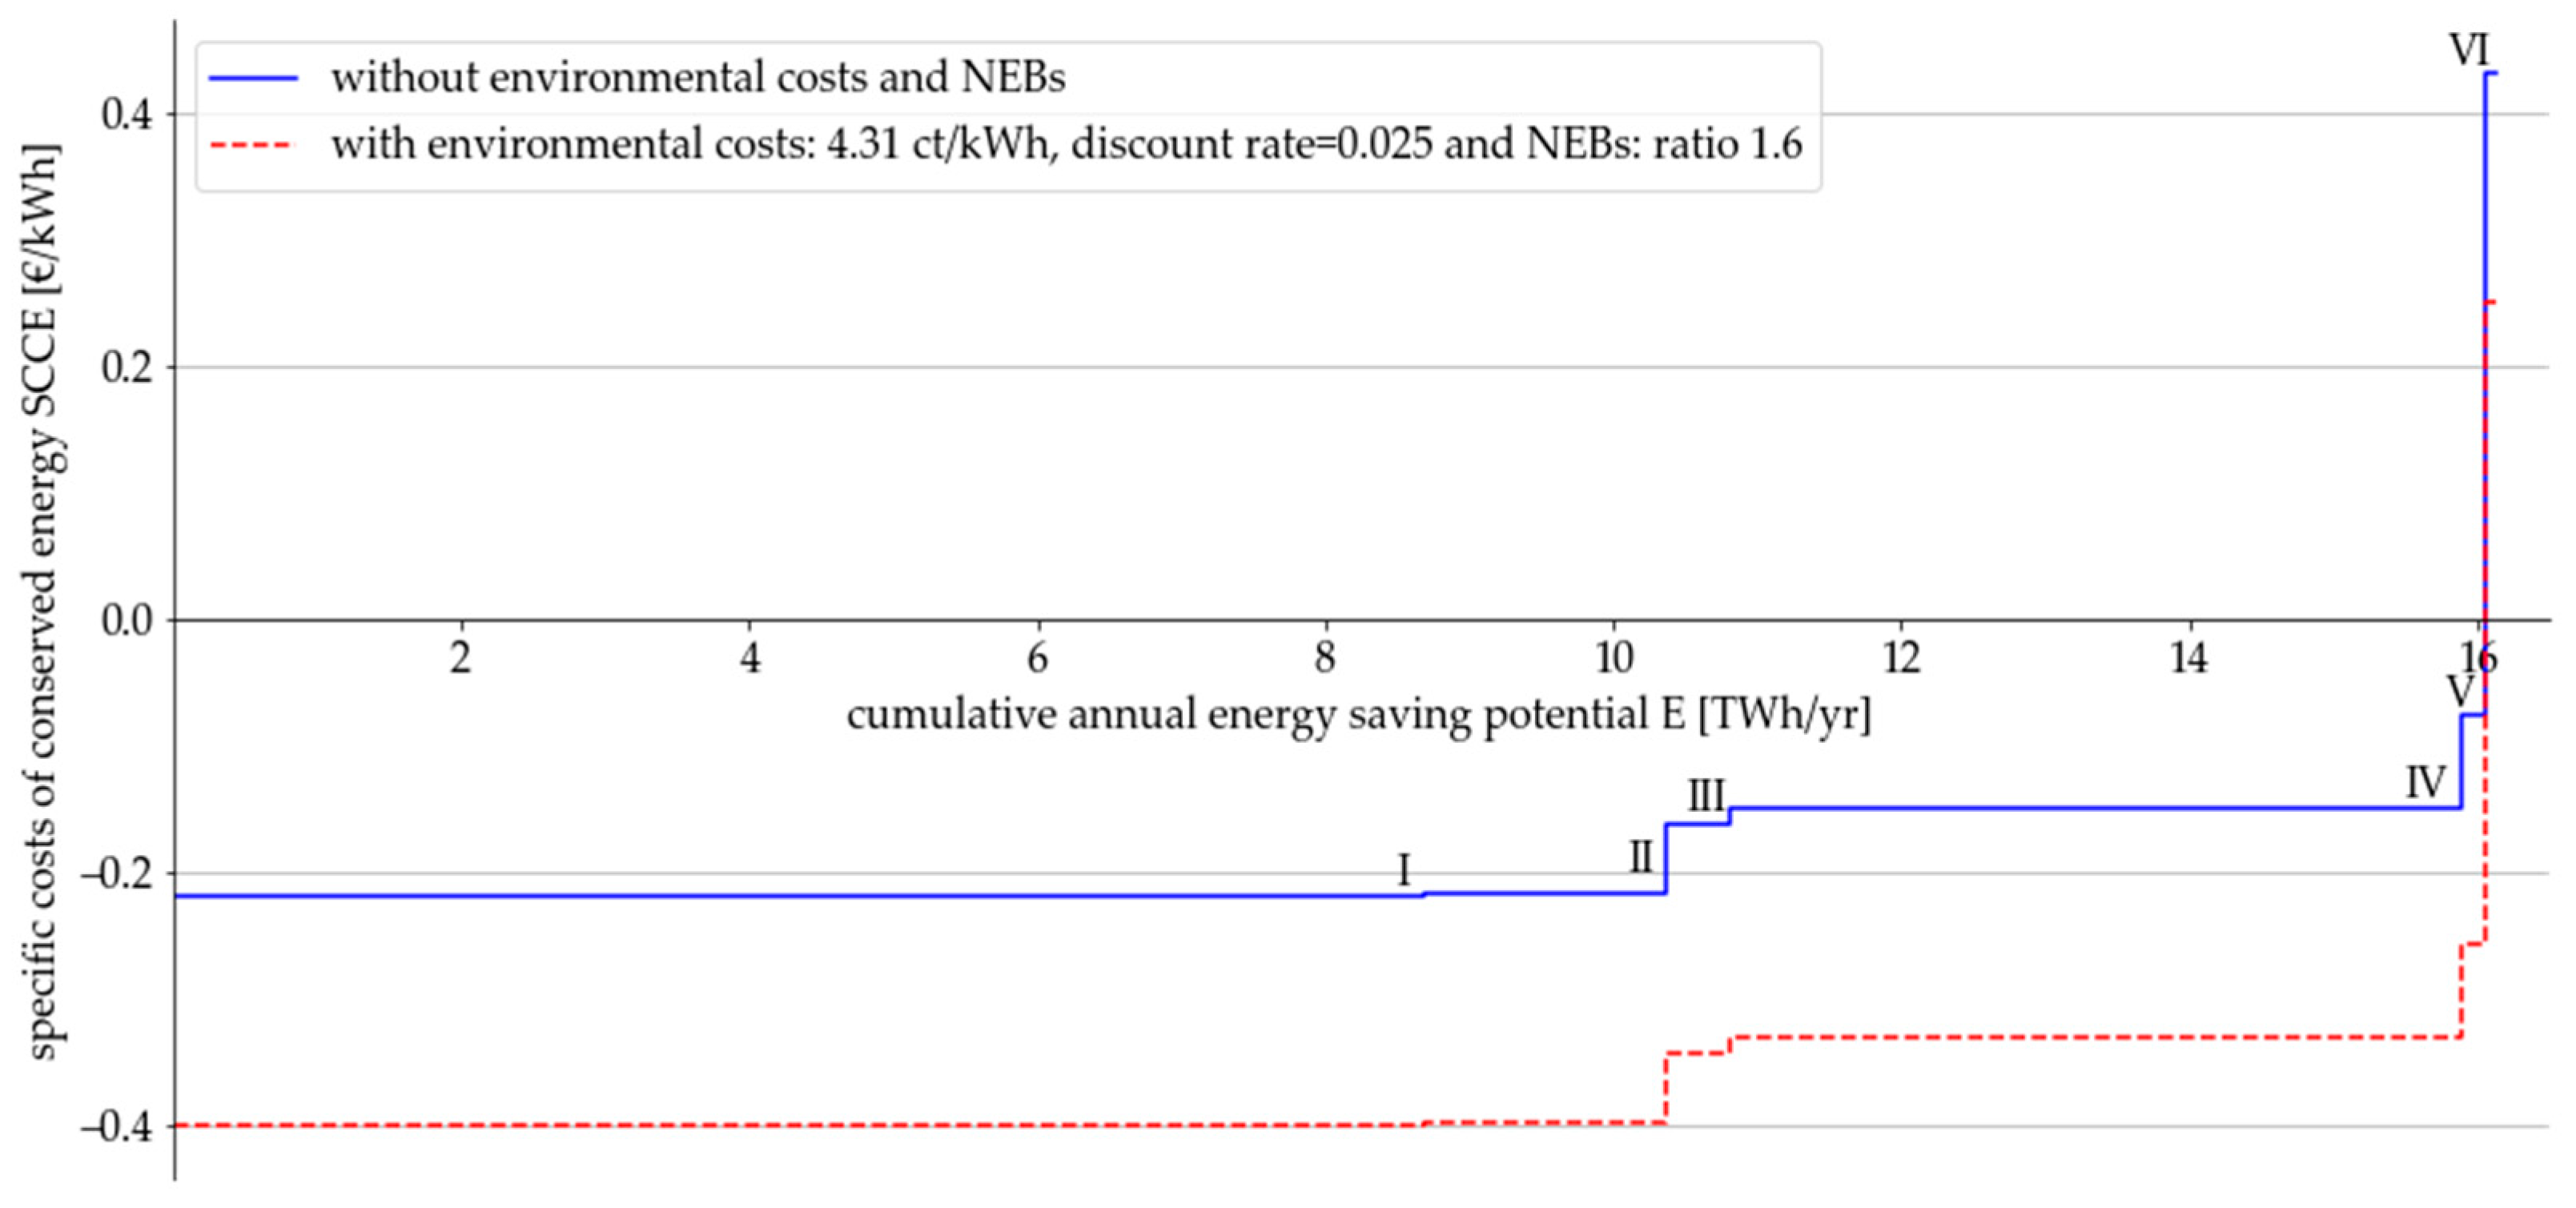
4.1. Application of the Methodology to Quantify Environmental Costs and Non-Energy Benefits
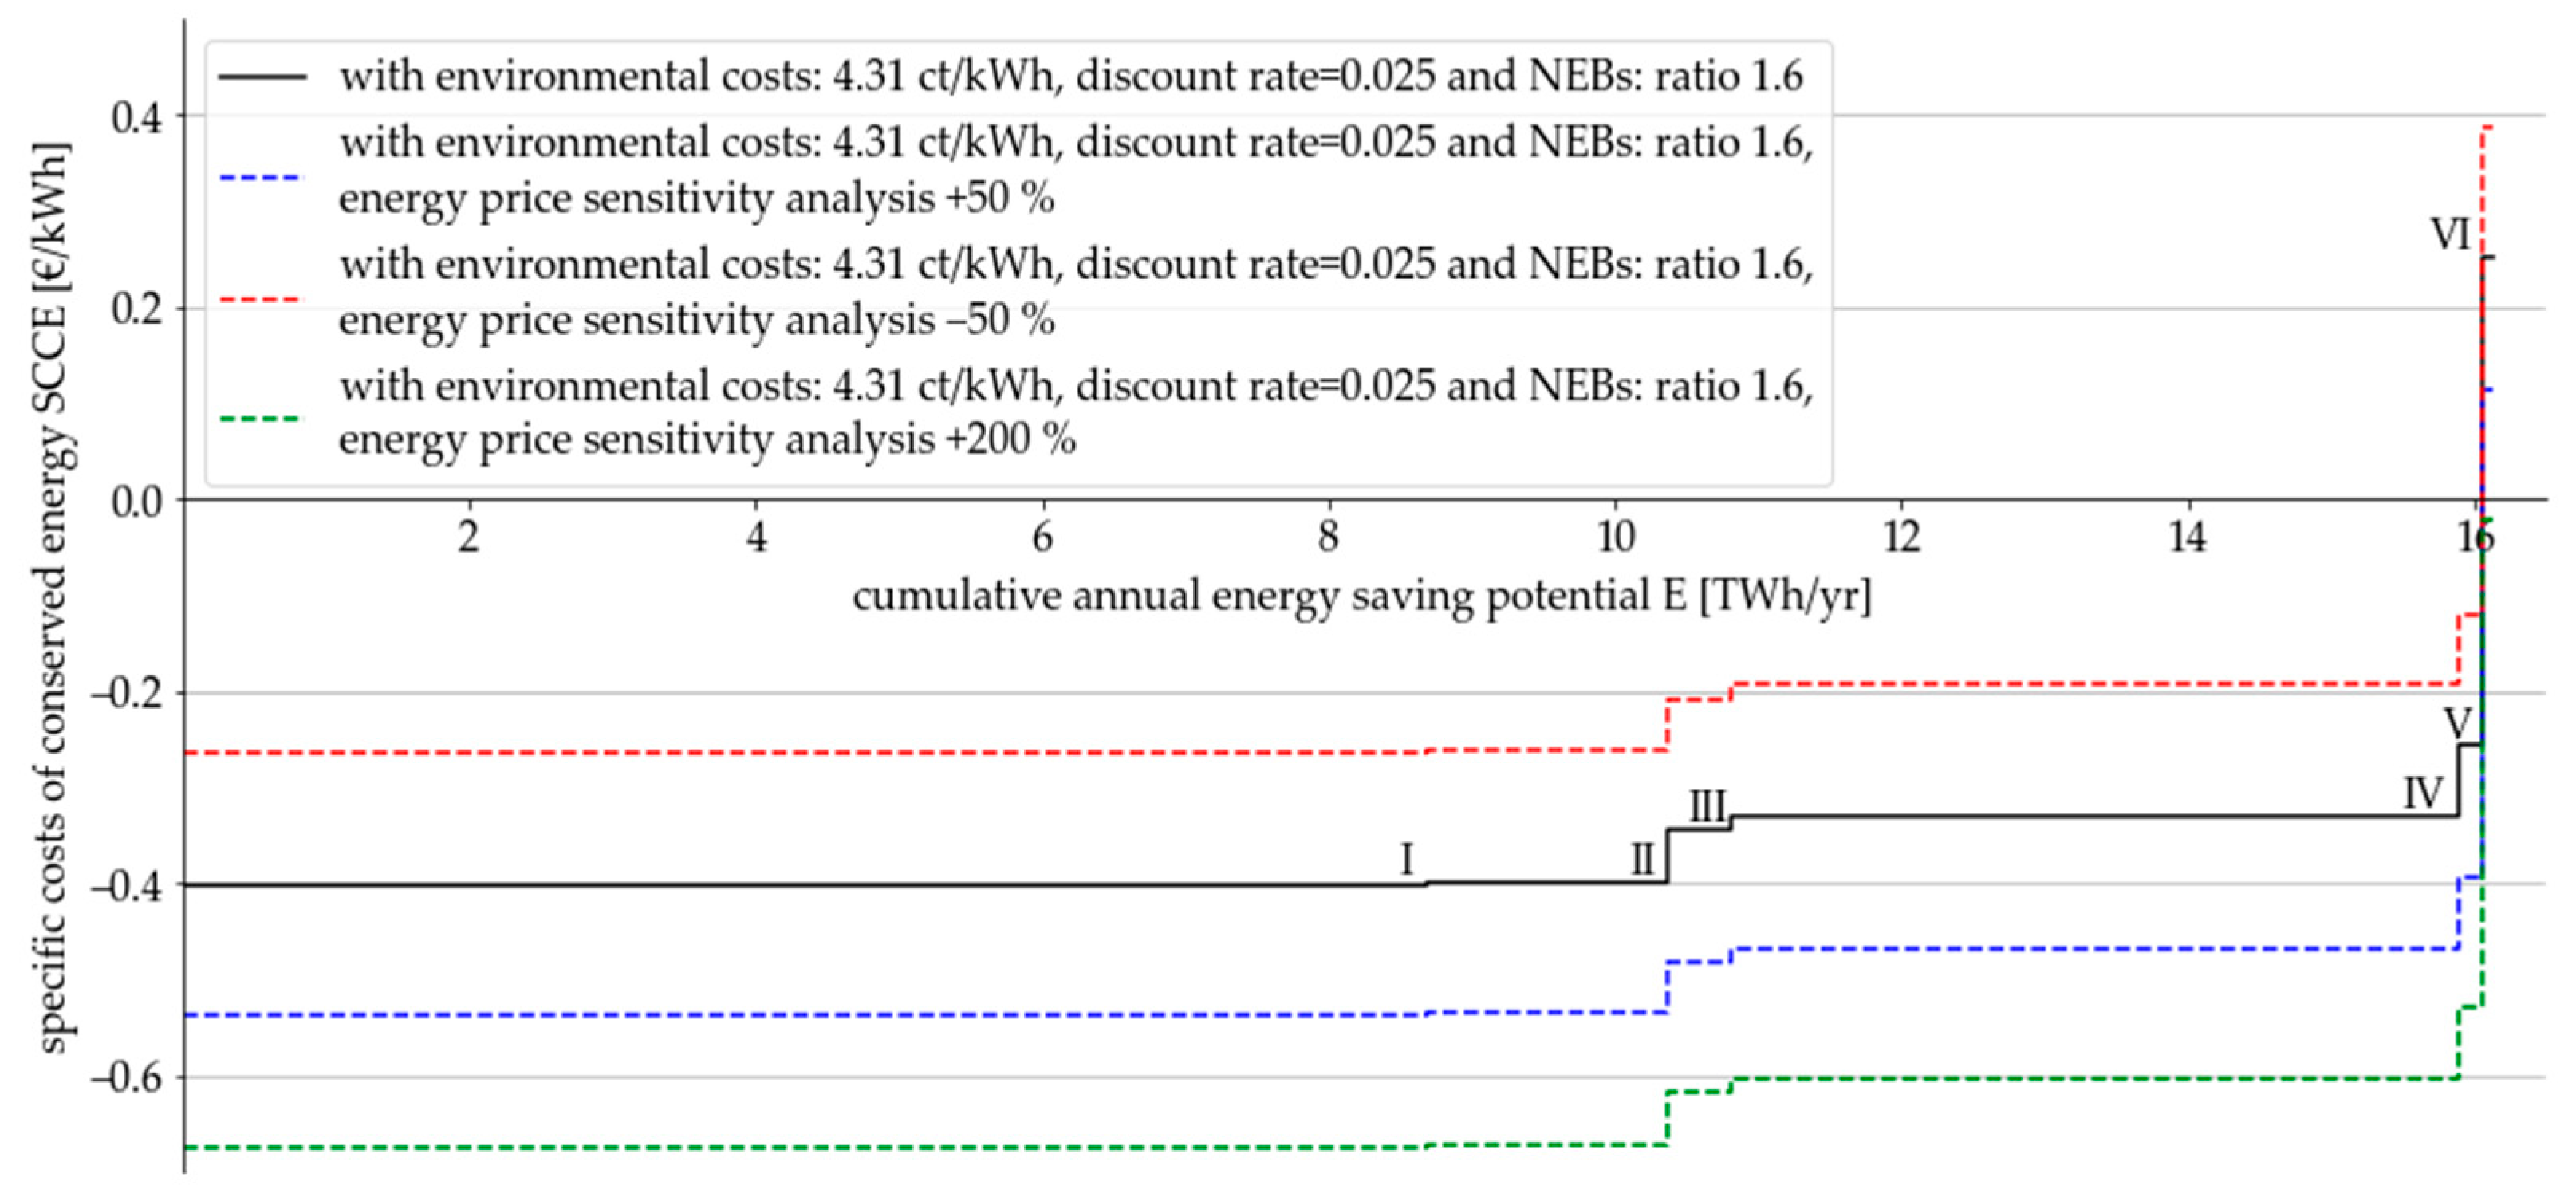
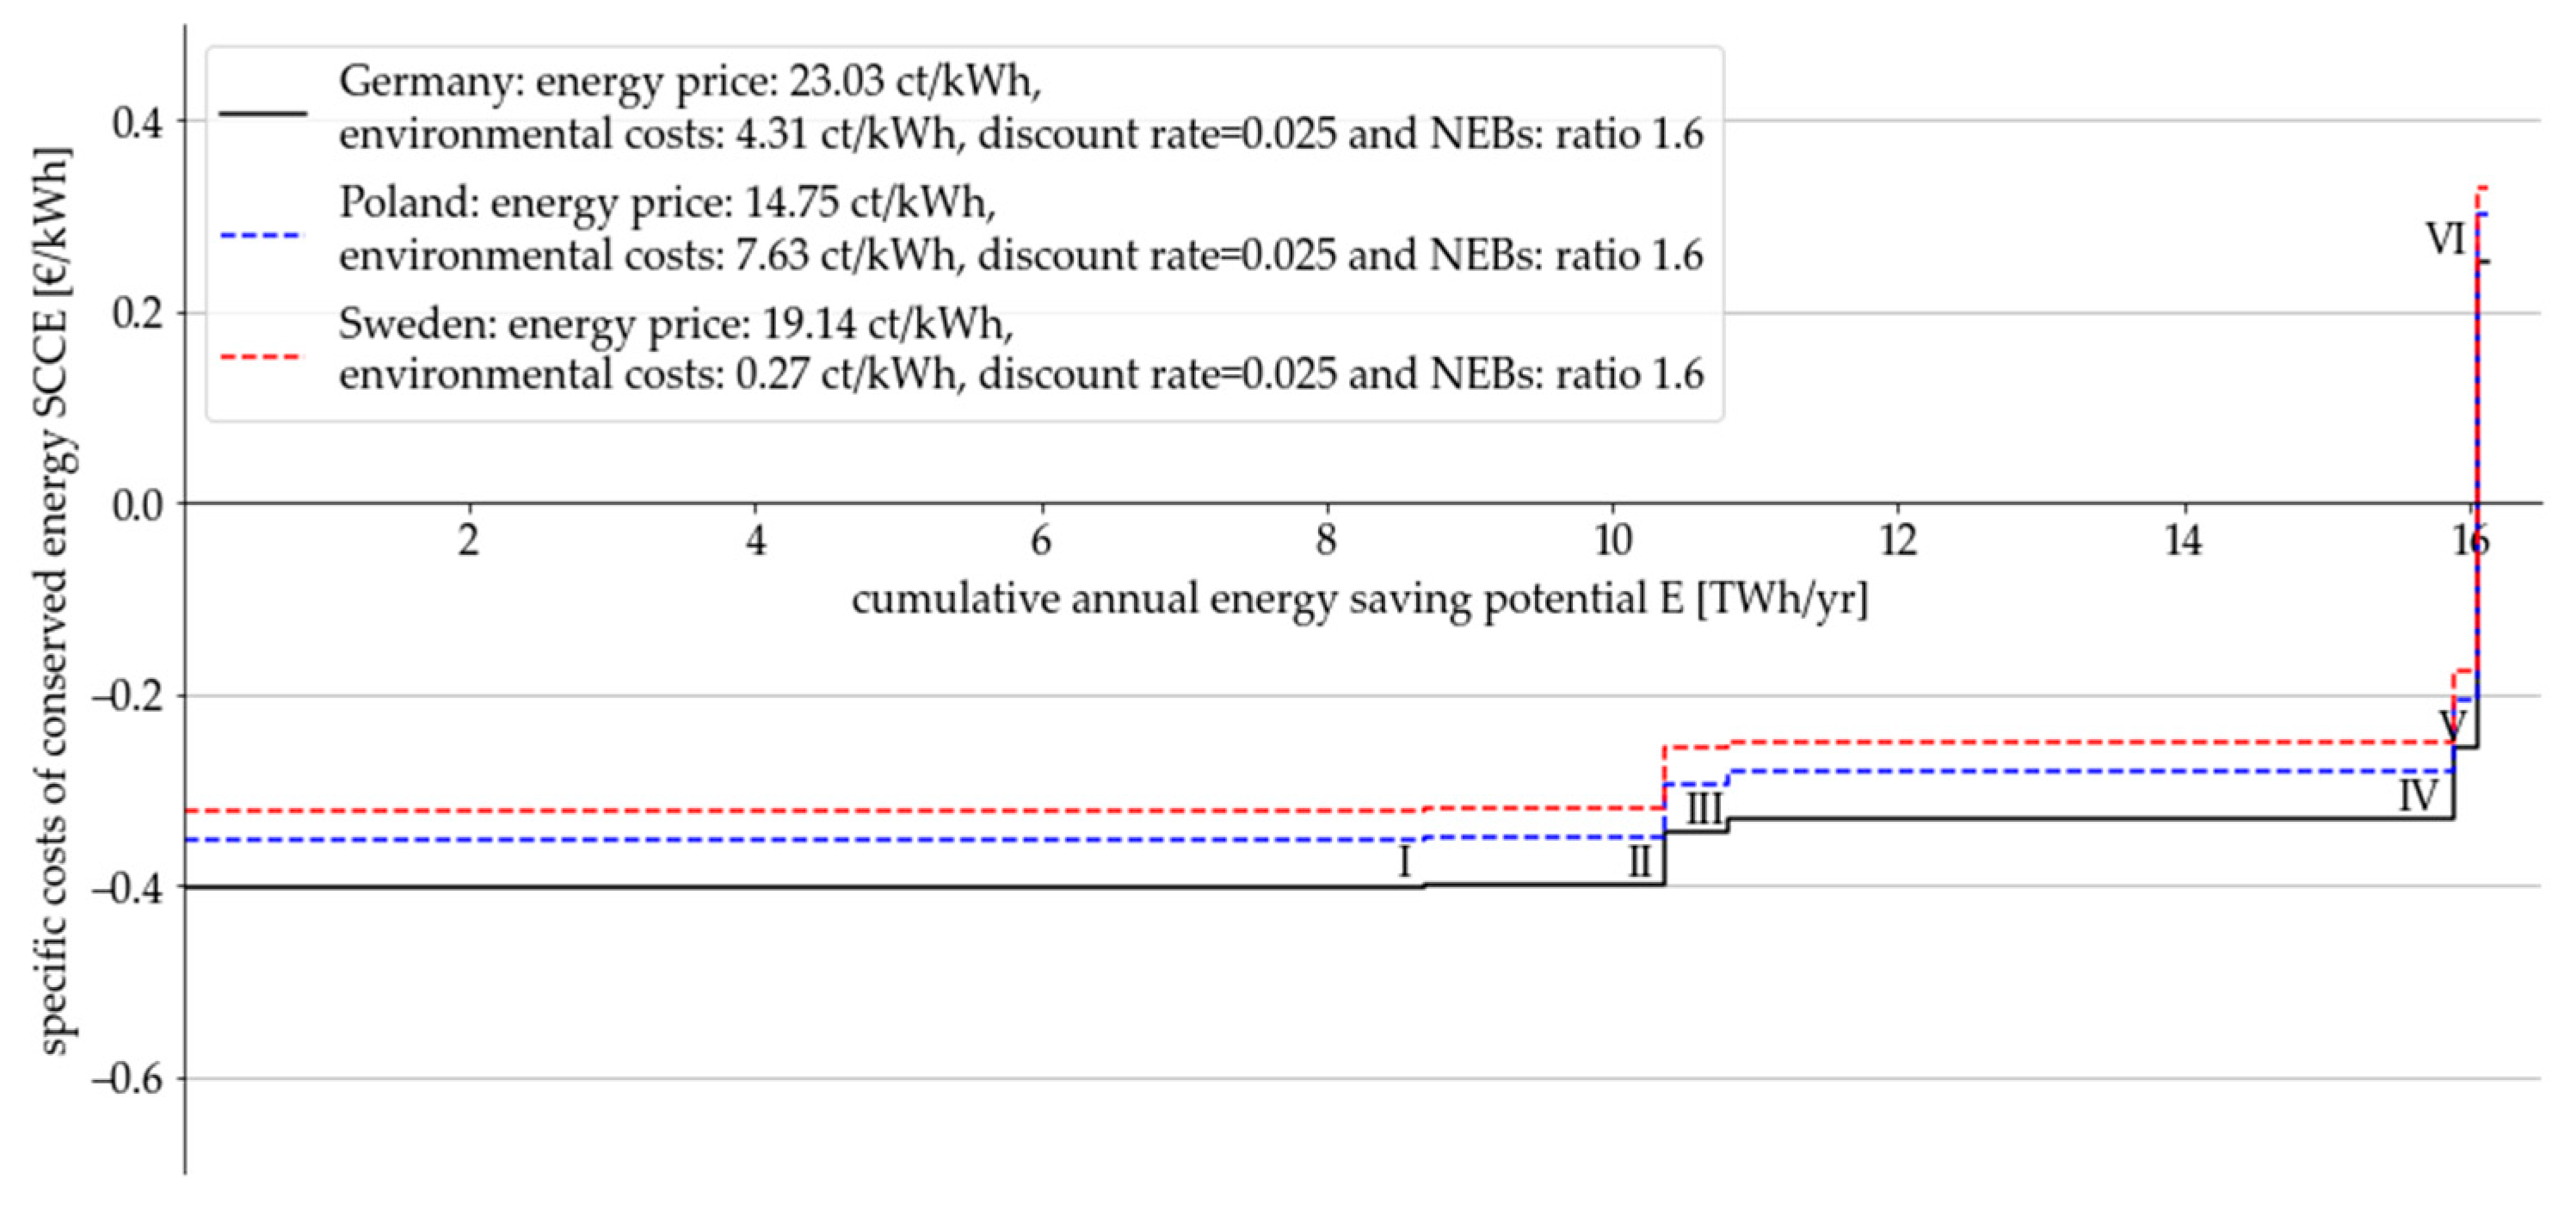
4.2. Results of the Sensitivity Analysis
5. Discussion
6. Conclusions and Implications for Policies and Modelling Practice
Author Contributions
Funding
Data Availability Statement
Conflicts of Interest
Abbreviations
| BAT | Best-available technology |
| BAU | Business-as-usual |
| COP | Coefficient of performance |
| CSC | Conservation supply curve |
| ETS | Emissions Trading System |
| GDP | Gross domestic product |
| GHG | Greenhouse gas emissions |
| IEA | International Energy Agency |
| ICT | Information and communication technology |
| LLCC | Least life cycle costs |
| NEB | Non-energy benefit |
| NPV | Net present value |
| SCCE | Specific cost of conserved energy |
| WTA | Willingness-to-accept |
| WTP | Willingness-to-pay |
References
- Copernicus Climate Change Service. 2024 on Track to Be the First Year to Exceed 1.5 °C Above the Pre-Industrial Average. Available online: https://climate.copernicus.eu/2024-track-be-first-year-exceed-15oc-above-pre-industrial-average (accessed on 16 December 2024).
- Rudolf, M.; Schmidt, M. Efficiency, sufficiency and consistency in sustainable development: Reassessing strategies for reaching overarching goals. Ecol. Econ. 2025, 227, 108426. [Google Scholar] [CrossRef]
- Federal Ministry for the Environment, Nature Conservation and Nuclear Safety. Environmental Policy for a Sustainable Society: Sustainable Development Report by the Federal Environment Ministry on the implementation of the United Nations 2030 Agenda; Federal Ministry for the Environment, Nature Conservation and Nuclear Safety: Berlin, Germany, 2020. [Google Scholar]
- Swiss Re Institute. The Economics of Climate Change: No Action Not an Option. 2021. Available online: https://www.swissre.com/dam/jcr:e73ee7c3-7f83-4c17-a2b8-8ef23a8d3312/swiss-re-institute-expertise-publication-economics-of-climate-change.pdf (accessed on 2 May 2024).
- Swiss Re Institute. Changing Climates: The Heat Is (Still) On. 2024. Available online: https://www.swissre.com/institute/research/topics-and-risk-dialogues/climate-and-natural-catastrophe-risk/changing-climates-heat-is-still-on.html (accessed on 16 December 2024).
- Eyre, N. External costs: What do they mean for energy policy? Energy Policy 1997, 25, 85–95. [Google Scholar] [CrossRef]
- Smith, M.; Moerenhout, J.; Thuring, M.; de Regel, S.; Altmann, M. External Costs: Energy Costs, Taxes and the Impact of Government Interventions on Investments; Final Report; Publications Office of the EU: Rotterdam, The Netherlands, 2020. [Google Scholar]
- Fleiter, T.; Hagemann, M.; Hirzel, S.; Eichhammer, W.; Wietschel, M. Costs and potentials of energy savings in European industry—A critical assessment of the concept of conservation supply curves. In Proceedings of the ECEEE Summer Study Proceedings 2009, La Colle-sur-Loup, France, 1–6 June 2009; pp. 1261–1272. [Google Scholar]
- Bünger, B.; Matthey, A. Methodological Convention 3.1 for the Assessment of Environmental Costs: Value Factors. Dessau/Roßlau. 2020. Available online: https://www.umweltbundesamt.de/publikationen/methodenkonvention-umweltkosten (accessed on 31 March 2025).
- Umweltbundesamt. Gesellschaftliche Kosten von Umweltbelastungen. Available online: https://www.umweltbundesamt.de/daten/umwelt-wirtschaft/gesellschaftliche-kosten-von-umweltbelastungen#gesamtwirtschaftliche-bedeutung-der-umweltkosten (accessed on 14 December 2022).
- Vatn, A.; Bromley, D.W. Externalities—A Market Model Failure. Environ. Resour. Econ. 1997, 9, 135–151. [Google Scholar] [CrossRef]
- Nehler, T.; Rasmussen, J. How do firms consider non-energy benefits? Empirical findings on energy-efficiency investments in Swedish industry. J. Clean. Prod. 2016, 113, 472–482. [Google Scholar] [CrossRef]
- van Beeck, N. Classification of Energy Models. 1999. Available online: https://pure.uvt.nl/ws/portalfiles/portal/532108/777.pdf (accessed on 2 May 2023).
- Hall, L.M.; Buckley, A.R. A review of energy systems models in the UK: Prevalent usage and categorisation. Appl. Energy 2016, 169, 607–628. [Google Scholar] [CrossRef]
- Fleiter, T.; Fehrenbach, D.; Worrell, E.; Eichhammer, W. Energy efficiency in the German pulp and paper industry—A model-based assessment of saving potentials. Energy 2012, 40, 84–99. [Google Scholar] [CrossRef]
- Meier, A.K. Supply Curves of Conserved Energy. Ph.D. Thesis, University of California, Berkeley, CA, USA, 1982. [Google Scholar]
- Arnold-Keifer, S.; Hirzel, S.; Rohde, C. Understanding Energy Demand of the Tertiary Sector by Energy Carriers and End-Uses: An Integrated Bottom-Up and Top-Down Model Taking Germany as the Example. Energies 2024, 17, 4486. [Google Scholar] [CrossRef]
- Arnold-Keifer, S.; Hirzel, S.; Rohde, C. Taking a closer look at technical energy efficiency potentials using an integrated bottomup and top-down model for the German tertiary sector: Results and calibration issues. In Proceedings of the ECEEE Summer Study Proceedings 2024, Chamouille, France, 10–15 June 2024; pp. 1015–1023. [Google Scholar]
- DIN EN ISO 14007; Environmental Management—Guidelines for Determining Environmental Costs and Benefits. Beuth Verlag GmbH, DIN Deutsches Institut für Normung e. V.: Berlin, Germany, 2021.
- Buchanan, J.M.; Stubblebine, W.C. Externality. Economica 1962, 29, 371. [Google Scholar] [CrossRef]
- Schröder, D.; Kirn, L.; Kinigadner, J.; Loder, A.; Blum, P.; Xu, Y.; Lienkamp, M. Ending the myth of mobility at zero costs: An external cost analysis. Res. Transp. Econ. 2023, 97, 101246. [Google Scholar] [CrossRef]
- de Bruyn, S.; Bijleveld, M.; de Graaff, L.; Schep, E.; Schroten, A.; Vergeer, R.; Ahdour, S. Environmental Prices Handbook: EU28 Version; CE Delft: Delft, The Netherlands, 2018. [Google Scholar]
- Silva, C.; Barbosa-Póvoa, A.P.; Carvalho, A. Towards sustainable development: Green supply chain design and planning using monetization methods. Bus. Strategy Environ. 2022, 31, 1369–1394. [Google Scholar] [CrossRef]
- Castellani, V.; Benini, L.; Sala, S.; Pant, R. A distance-to-target weighting method for Europe 2020. Int. J. Life Cycle Assess. 2016, 21, 1159–1169. [Google Scholar] [CrossRef]
- Sala, S.; Cerutti, A.K. Development of a Weighting Approach for the Environmental Footprint. Luxembourg. 2018. Available online: https://publications.jrc.ec.europa.eu/repository/handle/JRC106545 (accessed on 31 March 2025).
- Bünger, B.; Matthey, A. Methodische Grundlagen: Methodenkonvention 3.0 zur Ermittlung von Umweltkosten. Dessau/Roßlau. 2018. Available online: https://www.umweltbundesamt.de/publikationen/methodenkonvention-30-zur-ermittlung-von-0 (accessed on 31 March 2025).
- Arendt, R.; Bachmann, T.M.; Motoshita, M.; Bach, V.; Finkbeiner, M. Comparison of Different Monetization Methods in LCA: A Review. Sustainability 2020, 12, 10493. [Google Scholar] [CrossRef]
- van Essen, H.; van Wijngaarden, L.; Schroten, A.; Sutter, D.; Bieler, C.; Maffii, S.; Brambilla, M.; Fiorello, D.; Fermi, F.; Parolin, R.; et al. Handbook on the External Costs of Transport, Version 2019; Publications Office of the European Union: Luxembourg, 2019; ISBN 978-92-79-96917-1. [Google Scholar]
- Amadei, A.M.; de Laurentiis, V.; Sala, S. A review of monetary valuation in life cycle assessment: State of the art and future needs. J. Clean. Prod. 2021, 329, 129668. [Google Scholar] [CrossRef]
- Bickel, P.; Friedrich, R. ExternE: Externalities of Energy; Publications Office of the EU: Rotterdam, The Netherlands, 2005. [Google Scholar]
- Krieg, H.; Albrecht, S.; Jäger, M. Systematic monetisation of environmental impacts. In Proceedings of the Sustainable Development and Planning VI. Sustainable Developing and Planning 2013, Kos, Greece, 27–29 May 2013; Brebbia, C.A., Beriatos, E., Eds.; WIT Press: Southampton, UK, 2013; pp. 513–524. [Google Scholar]
- Interagency Working Group on Social Cost of Greenhouse Gases. Technical Support Document: Social Cost of Carbon, Methane, and Nitrous Oxide: Interim Estimates under Executive Order 13990. 2021. Available online: https://www.whitehouse.gov/wp-content/uploads/2021/02/TechnicalSupportDocument_SocialCostofCarbonMethaneNitrousOxide.pdf (accessed on 27 November 2023).
- EPA. Report on the Social Cost of Greenhouse Gases: Estimates Incorporating Recent Scientific Advances; EPA: Washington, DC, USA, 2022. [Google Scholar]
- Intergovernmental Panel on Climate Change. Climate Change 2014: Impacts, Adaptation, and Vulnerability—Part A: Global and Sectoral Aspects; Working Group II Contribution to the Fifth Assessment Report of the Intergovernmental Panel on Climate Change; Intergovernmental Panel on Climate Change: Geneva, Switzerland, 2014. [Google Scholar]
- Rennert, K.; Errickson, F.; Prest, B.C.; Rennels, L.; Newell, R.G.; Pizer, W.; Kingdon, C.; Wingenroth, J.; Cooke, R.; Parthum, B.; et al. Comprehensive evidence implies a higher social cost of CO2. Nature 2022, 610, 687–692. [Google Scholar] [CrossRef]
- Arnold-Keifer, S.; Müller, J.; Mandel, T. Integrating environmental costs when calculating the environmental efficiency potential. paper in preparation. Clean. Environ. Syst. 2025. [Google Scholar]
- Umweltbundesamt. Umweltbundesamt. Spezifische Emissionsfaktoren für den Deutschen Strommix. Available online: https://www.umweltbundesamt.de/themen/luft/emissionen-von-luftschadstoffen/spezifische-emissionsfaktoren-fuer-den-deutschen (accessed on 22 October 2024).
- European Energy Exchange AG. EUA Emission Spot Primary Market Auction. Available online: https://www.eex.com/en/market-data/market-data-hub/environmentals/eex-eua-primary-auction-spot-download (accessed on 28 March 2025).
- Statista. Statista. Strompreise für Gewerbe- und Industriekunden in Deutschland in den Jahren 2014 bis 2024 (in Euro-Cent pro Kilowattstunde). Available online: https://de.statista.com/statistik/daten/studie/154902/umfrage/strompreise-fuer-industrie-und-gewerbe-seit-2006/ (accessed on 28 March 2025).
- Statista. Jährliche Entwicklung des Wechselkurses des Euro Gegenüber dem US-Dollar von 1999 bis 2023. Available online: https://de.statista.com/statistik/daten/studie/200194/umfrage/wechselkurs-des-euro-gegenueber-dem-us-dollar-seit-2001/ (accessed on 22 October 2024).
- Icha, P.; Lauf, T. Entwicklung der Spezifischen Treibhausgas-Emissionen des Deutschen Strommix in den Jahren 1990–2023. Available online: https://www.umweltbundesamt.de/sites/default/files/medien/11850/publikationen/23_2024_cc_strommix_11_2024.pdf (accessed on 28 March 2025).
- Statista. Verbraucherpreisindex in Deutschland von 1991 bis 2024. Available online: https://de.statista.com/statistik/daten/studie/2550/umfrage/entwicklung-des-verbraucherpreisindex/ (accessed on 4 April 2025).
- Mills, E.; Rosenfeld, A. Consumer non-energy benefits as a motivation for making energy-efficiency improvements. Energy 1996, 21, 707–720. [Google Scholar] [CrossRef]
- OECD/IEA. Capturing the Multiple Benefits of Energy Efficiency: A Guide to Quantifying the Value Added. Paris, 2014. Available online: https://www.iea.org/reports/multiple-benefits-of-energy-efficiency-2015 (accessed on 31 March 2025).
- Reuter, M.; Patel, M.K.; Eichhammer, W.; Lapillonne, B.; Pollier, K. A comprehensive indicator set for measuring multiple benefits of energy efficiency. Energy Policy 2020, 139, 111284. [Google Scholar] [CrossRef]
- Yue, H.; Worrell, E.; Crijns-Graus, W.; Liu, W.; Zhang, S. Saving energy in China’s industry with a focus on electricity: A review of opportunities, potentials and environmental benefits. Energy Effic. 2021, 14, 1–28. [Google Scholar] [CrossRef]
- Ryan, L.; Campbell, N. Spreading the Net: The Multiple Benefits of Energy Efficiency Improvements. Paris. 2012. Available online: https://www.oecd.org/en/publications/spreading-the-net-the-multiple-benefits-of-energy-efficiency-improvements_5k9crzjbpkkc-en.html (accessed on 31 March 2025).
- Fleiter, T.; Hirzel, S.; Worrell, E. The characteristics of energy-efficiency measures—A neglected dimension. Energy Policy 2012, 51, 502–513. [Google Scholar] [CrossRef]
- Worrell, E.; Laitner, J.A.; Ruth, M.; Finman, H. Productivity Benefits of Industrial Energy Efficiency Measures. Energy 2003, 11, 1081–1098. [Google Scholar] [CrossRef]
- Neusel, L.; Hirzel, S. Energy efficiency in cold supply chains of the food Sector: An exploration of conditions and perceptions. Clean. Logist. Supply Chain 2022, 5, 100082. [Google Scholar] [CrossRef]
- Pye, M.; McKane, A. Making a stronger case for industrial energy efficiency by quantifying non-energy benefits. Resour. Conserv. Recycl. 2000, 28, 171–183. [Google Scholar] [CrossRef]
- Zhang, S.; Worrell, E.; Crijns-Graus, W. Evaluating co-benefits of energy efficiency and air pollution abatement in China’s cement industry. Appl. Energy 2015, 147, 192–213. [Google Scholar] [CrossRef]
- Jakob, M. Marginal costs and co-benefits of energy efficiency investments. Energy Policy 2006, 34, 172–187. [Google Scholar] [CrossRef]
- Thema, J.; Suerkemper, F.; Couder, J.; Mzavanadze, N.; Chatterjee, S.; Teubler, J.; Thomas, S.; Ürge-Vorsatz, D.; Hansen, M.B.; Bouzarovski, S.; et al. The Multiple Benefits of the 2030 EU Energy Efficiency Potential. Energies 2019, 12, 2798. [Google Scholar] [CrossRef]
- Wagner, C.; Obermeyer, M.; Lüchinger, R. A methodology for the assessment of multiple benefits of industrial energy efficiency measures. SN Appl. Sci. 2020, 2, 270. [Google Scholar] [CrossRef]
- Arnold-Keifer, S.; Kohl, V.; Hirzel, S.; Rohde, C. Investigating the Relevance of Non-Energy Benefits in Energy Efficiency Potentials for Information and Communication Technology. In Proceedings of the 2024 Electronics Goes Green 2024+ (EGG), Berlin, Germany, 18–20 June 2024; pp. 1–8. [Google Scholar]
- Berger, F.; Rohde, C.; Schlomann, B. Multiple Benefits of Energy Efficiency: Final Publishable Report. 2021. Available online: https://www.mbenefits.eu/static/media/uploads/site-6/library/Deliverables/d1.3-finalreport-multbenefits-2021.pdf (accessed on 2 April 2024).
- Multiple Benefits. Multiple Benefits of Energy Efficiency: Library of Multiple Benefits. Internal Project Database. Available online: https://mbenefits.eceee.org/news-resources/library/ (accessed on 4 April 2024).
- Mzavanadze, N. WP3 Air Pollution: Literature Review on Avoided Air Pollution Impacts of Energy Efficiency Measures: D3.1 Report; Calculating and Operationalising the Multiple Benefits of Energy Efficiency in Europe (COMBI). 2015. Available online: https://combi-project.eu/wp-content/uploads/D3.1_final_20180515.pdf (accessed on 4 April 2024).
- Sovacool, B.K.; Kim, J.; Yang, M. The hidden costs of energy and mobility: A global meta-analysis and research synthesis of electricity and transport externalities. Energy Res. Soc. Sci. 2021, 72, 101885. [Google Scholar] [CrossRef]
- Rosenow, J.; Cowart, R.; Thomas, S. Market-based instruments for energy efficiency: A global review. Energy Effic. 2019, 12, 1379–1398. [Google Scholar] [CrossRef]
- Furceri, D.; Ganslmeier, M.; Ostry, J. Are climate change policies politically costly? Energy Policy 2023, 178, 113575. [Google Scholar] [CrossRef]
- Di Foggia, G.; Beccarello, M.; Borgarello, M.; Bazzocchi, F.; Moscarelli, S. Market-Based Instruments to Promote Energy Efficiency: Insights from the Italian Case. Energies 2022, 15, 7574. [Google Scholar] [CrossRef]
- Umweltbundesamt. Der Europäische Emissionshandel. Available online: https://www.umweltbundesamt.de/daten/klima/der-europaeische-emissionshandel (accessed on 28 February 2025).
- European Commission. ETS2: Buildings, Road Transport and Additional Sectors. Available online: https://climate.ec.europa.eu/eu-action/eu-emissions-trading-system-eu-ets/ets2-buildings-road-transport-and-additional-sectors_en (accessed on 28 February 2025).
- Du, M.; Wu, F.; Luo, L.; Wang, Q.; Liao, L. Spatial effects of the market-based energy allocation on energy efficiency: A quasi-natural experiment of energy quota trading. Energy 2025, 318, 134902. [Google Scholar] [CrossRef]
- Yang, M.; Hou, Y.; Fang, C.; Duan, H. Constructing energy-consuming right trading system for China’s manufacturing industry in 2025. Energy Policy 2020, 144, 111602. [Google Scholar] [CrossRef]
- AG Energiebilanzen e.V. Energiebilanz Deutschland 2019. Available online: https://ag-energiebilanzen.de/daten-und-fakten/bilanzen-1990-bis-2020/?wpv-jahresbereich-bilanz=2011-2020 (accessed on 10 April 2022).
- Tsemekidi Tzeiranaki, S.; Bertoldi, P.; Economidou, M.; Clementi, E.L.; Gonzalez-Torres, M. Determinants of energy consumption in the tertiary sector: Evidence at European level. Energy Rep. 2023, 9, 5125–5143. [Google Scholar] [CrossRef]
- European Commission. Commission Recommendation (EU) 2024/1716: Of 19 June 2024 Setting Out Guidelines for the Interpretation of Articles 5, 6 and 7 of Directive (EU) 2023/1791 of the European Parliament and of the Council as Regards Energy Consumption in the Public Sector, Renovation of Public Buildings and Public Procurement; European Commission: Brussels, Belgium, 2024. [Google Scholar]
- Bertoldi, P. Policies for energy conservation and sufficiency: Review of existing policies and recommendations for new and effective policies in OECD countries. Energy Build. 2022, 264, 112075. [Google Scholar] [CrossRef]
- Chatterjee, S.; Ürge-Vorsatz, D. Measuring the productivity impacts of energy-efficiency: The case of high-efficiency buildings. J. Clean. Prod. 2021, 318, 128535. [Google Scholar] [CrossRef]
- Neusel, L.; Hirzel, S.; Berger, C.; Heinrich, S.; Weinert, K.; Grodeke, A.-M.; Kulkarni, P.; Radgen, P.; Löwenstein, A.; Schumacher, K.; et al. Evaluation Bundesförderung für Energie- und Ressourceneffizienz in der Wirtschaft. Available online: https://www.bmwk.de/Redaktion/DE/Evaluationen/Foerdermassnahmen/241217-evaluation-eew-jahresbericht-2023.pdf?__blob=publicationFile&v=6 (accessed on 10 February 2025).
- Fleiter, T.; Plötz, P. Diffusion of Energy-Efficient Technologies. Encyclopedia of Energy, Natural Resource, and Environmental Economics; Elsevier: Amsterdam, The Netherlands, 2013; pp. 63–73. ISBN 9780080964522. [Google Scholar]
- European Commission. Review of Regulation 206/2012 and 626/2011 Air Conditioners and Comfort Fans: Task 7 Report; Scenarios; European Commission: Brussels, Belgium, 2012. [Google Scholar]
- De Luca, F.; Simson, R.; Voll, H.; Kurnitski, J. (Eds.) Electric Lighting Predictions in the Energy Calculation Methods. In Proceedings of the 10th International Conference Improving Energy Efficiency in Commercial Buildings and Smart Communities (IEECB&SC’18), Frankfurt, Germany, 21–22 March 2018; Springer Proceedings in Energy. Springer: Berlin/Heidelberg, Germany, 2018. [Google Scholar]
- European Commission. Commission Delegated Regulation (EU) No. 626/2011 of 4 May 2011 Supplementing Directive 2010/30/EU of the European Parliament and of the Council with Regard to Energy Labelling of Air Conditioners. Available online: https://eur-lex.europa.eu/eli/reg_del/2011/626/oj/eng (accessed on 16 April 2025).
- European Commission. Ecodesign Preparatory Study for Lifts Implementing the Ecodesign Working Plan 2016–2019: Final Report. Available online: https://www.isi.fraunhofer.de/content/dam/isi/dokumente/cce/2021/Eco-design_Preparatory_Study_Final_Report_20191031.pdf (accessed on 27 March 2025).
- European Commission. Ventilation Units Ecodesign and Energy Labelling. Available online: https://www.ecoventilation-review.eu/downloads/Ventilation%20Units%20TASK%202%20Final%20Report%202020-09-10.pdf (accessed on 27 March 2025).
- Stobbe, L.; Proske, M.; Zedel, H.; Hintemann, R.; Clausen, J.; Beucker, S. Entwicklung des IKT-Bedingten Strombedarfs in Deutschland: Abschlussbericht; Fraunhofer Institute for Reliability and Microintegration: Berlin, Germany, 2015. [Google Scholar]
- U.S. Department of Energy. Purchasing Energy-Efficient Computers. Available online: https://www.energy.gov/femp/purchasing-energy-efficient-computers?nrg_redirect=458778 (accessed on 2 April 2025).
- U.S. Department of Energy. Purchasing Energy-Efficient Displays and Monitors. Available online: https://www.energy.gov/femp/purchasing-energy-efficient-displays-and-monitors?nrg_redirect=458737 (accessed on 2 April 2025).
- U.S. Department of Energy. Purchasing Energy-Efficient Imaging Equipment. Available online: https://www.energy.gov/femp/purchasing-energy-efficient-imaging-equipment?nrg_redirect=458777 (accessed on 2 April 2025).
- European Commission. VERORDNUNG (EU) 2019/2022 DER KOMMISSION vom 1. Oktober 2019 zur Festlegung von Ökodesign-Anforderungen an Haushaltsgeschirrspüler gemäß der Richtlinie 2009/125/EG des Europäischen Parlaments und des Rates, zur Änderung der Verordnung (EG) Nr. 1275/2008 der Kommission und zur Aufhebung der Verordnung (EU) Nr. 1016/2010 der Kommission, 2019. Available online: https://eur-lex.europa.eu/eli/reg/2019/2022/oj (accessed on 31 March 2025).
- Rüdenauer, I.; Blepp, M.; Brommer, E.; Gensch, C.-O.; Graulich, K.; Mudgal, S.; Cervantes, R.; Faninger, T.; Lyons, L.; Seifried, D. Preparatory Studies for Eco-Design Requirements of Energy-Using Products: Lot 24: Professional Washing Machines, Dryers and Dishwashers. Final Report, Part: Dishwashers; Öko-Institut e.V.: Freiburg, Germany, 2011. [Google Scholar]
- European Commission. Verordnung (EU) 2019/2019 der Kommission vom 1. Oktober 2019 zur Festlegung von Ökodesign-Anforderungen an Kühlgeräte gemäß der Richtlinie 2009/125/EG des Europäischen Parlaments und des Rates und zur Aufhebung der Verordnung (EG) Nr. 643/2009 der Kommission. 2019. Available online: https://eur-lex.europa.eu/eli/reg/2019/2019/oj (accessed on 31 March 2025).
- European Commission. Preparatory/Review Study: Commission Regulation (EC) No. 643/2009 with Regard to Ecodesign Requirements for Household Refrigeration Appliances and Commission Delegated Regulation (EU) No. 1060/2010 with Regard to Energy Labelling of Household Refrigeration Appliances. Final Report; European Commission: Brussels, Belgium, 2010. [Google Scholar]
- Statista. Carbon Intensity of the Power Sector in Sweden from 2000 to 2023. Available online: https://www.statista.com/statistics/1290491/carbon-intensity-power-sector-sweden/ (accessed on 30 April 2025).
- Eurostat. Electricity Prices by Type of User. Available online: https://ec.europa.eu/eurostat/databrowser/view/ten00117/default/table (accessed on 30 April 2025).
- Statista. Carbon Intensity Outlook of the Power Sector in Poland from 2020 to 2040. Available online: https://www.statista.com/statistics/1190077/carbon-intensity-outlook-of-poland/ (accessed on 30 April 2025).
- Statista. Carbon Intensity of the Power Sector in the European Union in 2023, by Country. Available online: https://www.statista.com/statistics/1291750/carbon-intensity-power-sector-eu-country/ (accessed on 30 April 2025).
- Moore, F.C.; Drupp, M.A.; Rising, J.; Dietz, S.; Rudik, I.; Wagner, G. Synthesis of evidence yields high social cost of carbon due to structural model variation and uncertainties. Proc. Natl. Acad. Sci. USA 2024, 121, e2410733121. [Google Scholar] [CrossRef]
- Hasanbeigi, A.; Lobscheid, A.; Lu, H.; Price, L.; Dai, Y. Quantifying the co-benefits of energy-efficiency policies: A case study of the cement industry in Shandong Province, China. Sci. Total Environ. 2013, 458, 624–636. [Google Scholar] [CrossRef]
- Taylor, S. The ranking of negative-cost emissions reduction measures. Energy Policy 2012, 48, 430–438. [Google Scholar] [CrossRef]
- Deutschlandfunk. Warum der Klimawandel im Wahlkampf untergeht. Available online: https://www.deutschlandfunk.de/bundestagswahl-2025-wahlkampf-klimaschutz-100.html (accessed on 19 April 2025).


| Monetization Method for Environmental Costs | Methodology | Challenge | Reference | |
|---|---|---|---|---|
| Damage costs (costs for environmental and health damage and damage reduction and prevention) | Market price approach | Damage costs valued at market prices and economic value | No market for environment | [9,26,27,29] |
| Stated or revealed preference | Connection of a non-market good to a replacement good | Based on choice experiments and information level of participants | [22,29] | |
| Societies willingness-to-accept (WTA) | Compensation cost society is willing to accept for compensating the damage | Based on survey (different financial and local situation of respondent) | [30,31] | |
| Societies willingness-to-pay (WTP) | The amount of money society is willing to spend to prevent environmental damage | Based on survey (different financial and local situation of respondent) | [22,31] | |
| Abatement/Avoidance costs | Standard price approach | Costs of measures to achieve certain political reduction targets | Political definition | [26] |
| Replacement costs | Compensation costs for negative impacts | Multiple impacts on characterization | [22] | |
| Literature | Discount Rate | Costs in EUR2020/ t CO2-eq |
|---|---|---|
| Interagency Working Group on Social Cost of Greenhouse Gases [32] | 2.5% | 67 |
| 3.0% | 45 | |
| 5.0% | 12 | |
| EPA [33] | 1.5% | 298 |
| 2.0% | 167 | |
| 2.5% | 105 | |
| Intergovernmental Panel on Climate Change [34] | 0.0% | 237 |
| 1.0% | 160 | |
| 3.0% | 29 | |
| Bünger and Matthey [9] | 0.0% | 680 |
| 1.0% | 195 | |
| Rennert et al. [35] | 1.5% | 270 |
| 2.0% | 162 | |
| 2.5% | 103 | |
| 3.0% | 70 |
| Air Pollutant | Specific Emissions in g/kWh | Total Costs in EUR2020/t |
|---|---|---|
| Dust | 0.01 | 23,300 |
| PM10 | 0.009 | 23,300 |
| NO2 | 0.374 | 15,340 |
| SO2 | 0.196 | 14,930 |
| NMVOC | 0.015 | 2300 |
| Total costs in EUR-ct2020/kWh | - | 0.911 |
| Category | Impact | Company-Level | Society |
|---|---|---|---|
| Environmental | Air pollution | X | X * |
| Greenhouse gas emissions (GHG) | X | X * | |
| Reduction of waste, hazardous waste, and water losses | X | X | |
| Resource management | X | X | |
| Social | Health | X | X |
| Well-being | X | ||
| Improved air quality and temperature control | X | ||
| Poverty reduction | X | ||
| Economic | Increased production | X | |
| Product quality | X | ||
| Reduced maintenance costs/extended service life | X | ||
| Reduced costs for compliance with environmental regulations | X | ||
| Innovation and competitiveness | X | ||
| GDP | X | ||
| Employment | X | ||
| Energy prices | X | ||
| Energy supply and security | X | ||
| Energy savings | X | X |
| Traditional Energy-Demand Modeling and Energy Efficiency Potential | Non-Energy Benefits | Environmental Costs | |
|---|---|---|---|
| Perspective | Individual/microeconomic/macroeconomic | Company level, extended to national level by IEA [44] | Societal/environmental/sustainability perspective |
| Focus | Energy demand and possible efficiency potential | Benefits of energy efficiency measures beyond the energy perspective [49] | Any costs related to the damage of the environment [19] |
| Quantification | Resulting energy demand: Frozen efficiency, economic potential, technical potential [48] | Quantifying and non-quantifying approaches | Few studies, ‘virtual’ costs for companies |
| Challenge | Not a complete picture of environmental and sociological influences | Poor data quality and availability, especially for the tertiary sector | Few studies on quantification; not implemented by politicians |
| Energy Efficiency Measures In Energy End-Use | Application [References] | Life-Time2 [yr] | Annual Energy Saving Potential [TWh] | Investment (BAU–LLCC) [EUR] Per Total Energy Cost Savings [EUR] | SCCE [EUR-ct2020/kWh] | SCCE Including Environmental Costs [EUR-ct2020/kWh] | SCCE Including Environmental Costs and NEBs [EUR-ct2020/kWh] |
|---|---|---|---|---|---|---|---|
| Lighting (I) | LED [76] | 15 | 8.69 | 0.05 | −0.220 | −0.263 | −0.401 |
| Air conditioning (II) | Central air conditioning [77] | 15 | 1.68 | 0.06 | −0.217 | −0.260 | −0.398 |
| Mobile air conditioning [77] | 15 | ||||||
| Decentralized split system [77] | 15 | ||||||
| Mechanical energy (III) | Lift [29,78] | 25 | 0.43 | 0.29 | −0.163 | −0.206 | −0.344 |
| Ventilation 1 [73,79] | 25 | ||||||
| Compressor 1 [73] | 25 | ||||||
| ICT (IV) | Desktop Computer [80,81] | 5 | 5.08 | 0.35 | −0.149 | −0.192 | −0.330 |
| Laptop [80,81] | 5 | ||||||
| Monitor [80,82] | 5 | ||||||
| Printer [80,83] | 5 | ||||||
| Copy machine [80] | 5 | ||||||
| Projector [80] | 5 | ||||||
| Cash register 2 | 5 | ||||||
| Process heat (V) | Dishwasher [84,85] | 15 | 0.17 | 0.67 | −0.075 | −0.118 | −0.257 |
| Process cooling (VI) | Refrigerator [86,87] | 15 | 0.07 | 2.88 | 0.432 | 0.389 | 0.251 |
| Freezer [86,87] | 15 |
| Environmental Costs [ct/kWh] | NEBs [Ratio] | Discount Rate | |
|---|---|---|---|
| Basis | - | - | 0.025 |
| Variation (1) | 4.31 | 1.6 | 0.025 |
| Variation (2) | 4.31 | 2.3 | 0.025 |
| Variation (3) | 6.83 | 1.6 | 0.020 |
| Variation (4) | 6.83 | 2.3 | 0.020 |
| Variation (5) | 29.04 | 2.3 | 0.000 |
| Country | Specific Emission Factor of Electricity Mix [gCO2-eq/kWh in 2020] | Costs of Climate Change [EUR-ct2020/kWh] | EU Emissions Trading System (ETS) Auction Price in 2020 (24.37 EUR2020/tCO2 [38]) [EUR-ct2020/kWh] | Damage Costs of Air Pollutants [EUR-ct2020/kWh] [9,36] | Environmental Damage Costs [EUR-ct2020/kWh] |
|---|---|---|---|---|---|
| Germany | 429 | 4.44 | −1.045 | 0.911 | 4.31 |
| Poland | 750 | 7.76 | −1.045 | 0.911 | 7.63 |
| Sweden | 39 | 0.40 | −1.045 | 0.911 | 0.27 |
Disclaimer/Publisher’s Note: The statements, opinions and data contained in all publications are solely those of the individual author(s) and contributor(s) and not of MDPI and/or the editor(s). MDPI and/or the editor(s) disclaim responsibility for any injury to people or property resulting from any ideas, methods, instructions or products referred to in the content. |
© 2025 by the authors. Licensee MDPI, Basel, Switzerland. This article is an open access article distributed under the terms and conditions of the Creative Commons Attribution (CC BY) license (https://creativecommons.org/licenses/by/4.0/).
Share and Cite
Arnold-Keifer, S.; Hirzel, S.; Rohde, C. Integrating the Assessment of Environmental Costs and the Non-Energy Benefits of Energy Efficiency into an Energy Demand Analysis of the Tertiary Sector. Energies 2025, 18, 2354. https://doi.org/10.3390/en18092354
Arnold-Keifer S, Hirzel S, Rohde C. Integrating the Assessment of Environmental Costs and the Non-Energy Benefits of Energy Efficiency into an Energy Demand Analysis of the Tertiary Sector. Energies. 2025; 18(9):2354. https://doi.org/10.3390/en18092354
Chicago/Turabian StyleArnold-Keifer, Sonja, Simon Hirzel, and Clemens Rohde. 2025. "Integrating the Assessment of Environmental Costs and the Non-Energy Benefits of Energy Efficiency into an Energy Demand Analysis of the Tertiary Sector" Energies 18, no. 9: 2354. https://doi.org/10.3390/en18092354
APA StyleArnold-Keifer, S., Hirzel, S., & Rohde, C. (2025). Integrating the Assessment of Environmental Costs and the Non-Energy Benefits of Energy Efficiency into an Energy Demand Analysis of the Tertiary Sector. Energies, 18(9), 2354. https://doi.org/10.3390/en18092354