1. Introduction
The cement industry stands as a major contributor to global carbon emissions, accounting for approximately 7% of global anthropogenic CO
2 emissions [
1,
2]. This substantial environmental impact stems primarily from the industry’s intensive energy requirements, with clinker production in rotary kilns being heavily dependent on fossil fuels such as coal and natural gas. Within the cement manufacturing process, approximately 60% of CO
2 emissions originate from limestone calcination, while energy consumption and combustion contribute the remaining 40% [
3]. As industry progresses toward reducing its environmental footprint and achieving net-zero carbon emissions, the utilization of alternative fuels derived from waste materials has emerged as a promising strategy deserving significant attention.
Alternative fuels, which are waste materials specifically processed for industrial applications, offer a sustainable solution for managing materials that cannot be reduced, reused, or recycled through conventional methods [
4]. The integration of waste as an alternative fuel serves a dual purpose: decreasing dependence on traditional fossil fuels while simultaneously providing an environmentally responsible waste disposal pathway, ultimately contributing to reduced CO
2 emissions in cement production [
2]. The implementation of alternative fuels has already demonstrated meaningful environmental benefits, leading to an approximately 12% reduction in CO
2 emissions within the cement sector [
3]. Currently, the cement industry primarily utilizes residual oils and solvents, biomass, used tires and rubber waste, and plastic waste as alternative fuels [
5]. However, the combustion of these diverse waste materials in cement kilns presents a critical challenge to understand and characterize the gaseous emissions generated during the process, as their composition and potential ecological impact are essential considerations for ensuring that alternative fuels can be deployed without compromising air quality or environmental health.
Several studies have investigated the thermal behavior and emission profiles of various biomass and industrial waste materials [
6,
7,
8,
9,
10]. These analyses typically employ TGA-MS and TGA-FTIR techniques under inert atmospheres. For instance, Radojević et al. [
9] studied the pyrolysis behavior of three biomass waste materials—spent coffee grounds, beech sawdust, and wheat straw—using TGA-MS, ranging from room temperature to 900 °C with an argon flow of 50 mL/min. The research identified emissions of gases, including H
2O, CH
4, CO
2, and H
2, during the pyrolysis process. Similarly, Singh et al. [
11] investigated the pyrolysis of various waste materials, including biomass wood waste, waste tires, refuse-derived fuel, and waste plastics, using TGA-MS and TGA-FTIR from room temperature to 900 °C with an argon flow rate of 50 mL/min. Their findings revealed a spectrum of moisture and organic species (carbonyl aromatic and alcohols) containing the hydroxyl functional group. Cho et al. [
12] investigated the thermal degradation process of microplastics, including polypropylene, polyethylene terephthalate, and polyvinyl chloride. Utilizing TG-FTIR and TED-GC-MS methodologies, the researchers conducted an analysis from room temperature to 700 °C with a nitrogen flow rate of 100 mL/min. Their research revealed thermal transformation processes, including the volatilization of terephthalic acid bound to chlorine molecules, the reduction in vinyl-ester functional groups, and the formation of aromatic hydrocarbon intermediates associated with olefin branching. In a complementary study, Fedelich [
13] evaluated the decomposition products of natural rubber using TG-GC/MS, extending the thermal analysis from 25 °C to 600 °C with a nitrogen flow rate of 30 mL/min. The research documented the devolatilization of organic compounds, identifying a range of complex molecular species including toluene, m-xylene, styrene, ethylbenzene, and limonene.
In addition to these investigations, there are several others that have evaluated these wastes using TGA-DSC. For instance, Simón et al. [
14] conducted thermal analysis of pine sawdust using TGA-DTA from room temperature up to 1000 °C, with a heating rate of 10 °C/min under an air atmosphere. The results showed a moisture loss peak at 52 °C, the decomposition of hemicellulose and cellulose at 327 °C, and lignin degradation at 488 °C. Kaiser et al. [
15] evaluated the thermal degradation of tire rubber using TGA-DSC, performed from room temperature up to 600 °C at a heating rate of 10 °C/min under a nitrogen atmosphere. The results indicated that the weight loss observed in the temperature range between 50 °C and 100 °C corresponds to the desorption of absorbed water. Between 100 °C and 350 °C, the decomposition of carboxyl, lactone, and lactol functional groups was observed. At higher temperatures, from 350 °C to 600 °C, the degradation of carbonyl, ether, quinone, and phenol groups on the carbon surface occurred. Cafiero et al. [
16] evaluated seven types of waste plastics (polypropylene, polyethylene film, polyethylene terephthalate, polystyrene, acrylonitrile–butadiene–styrene, high-impact polystyrene, and polybutadiene terephthalate) using TGA/DSC-FTIR under a nitrogen flow rate of 60 mL/min. The results revealed a single peak between 330 °C and 490 °C, indicating the degradation of the oligomers and polymers. Additionally, peaks corresponding to styrene were observed at 3000–3082 cm
−1 and 698–759 cm
−1. A CO
2 peak was also detected between 2200 and 2300 cm
−1.
While certain waste materials are not conventionally employed as alternative fuels, their large-scale production, such as wind blade waste and automotive shredder residue (ASR), has raised significant environmental concerns. Projections indicate that wind blade waste alone could reach 2.9 million tons by 2050 [
17]. Studies on the volatile products of wind blade waste conducted from room temperature to 600 °C, under a nitrogen flow at 50 mL/min, identified key gases, including H
2, CH
3+, CO
2, and C
6H
6, during the pyrolysis process [
18]. Chen et al. [
19] investigated the pyrolysis mechanism of wind blade waste using TGA-DSC from room temperature up to 1100 °C, with a heating rate of 10 °C/min in an air atmosphere. The results indicated that the pyrolysis of the resin occurred primarily between 250–350 °C and 400–500 °C, during which the resin degraded into carbon within the flue gas. Subsequently, the formed carbon gradually reacted with the limited oxygen present, producing CO
2. Additionally, ASR—a complex waste containing plastics and metals from the automotive industry—generates approximately 50 million tons annually [
20]. Investigations of ASR volatile products through pyrolysis using TG-FTIR-GC/MS analysis from room temperature to 800 °C with a nitrogen flow at 20 mL/min revealed that the primary volatile products are alkanes, olefins, alcohols, and benzene series compounds [
21].
Although several studies have examined the thermal degradation and emissions of various waste materials, most of these investigations focus on thermogravimetric analysis under pyrolysis conditions. To comprehensively understand the emissions from waste used as alternative fuels in the cement industry and to accurately replicate the conditions in a cement kiln or precalciner, studies must be conducted through thermal analysis under an air atmosphere. This approach ensures that the research findings reflect the actual combustion conditions experienced in these industrial processes.
The objective of this study is to evaluate the thermal behavior and gas emissions of biomass and industrial wastes as alternative fuels. The wastes analyzed include sawdust (SD), pecan nutshell (PNS), wind blade waste (WBW), industrial hose waste (IHW), tire-derived fuel (TDF), plastic waste (PW), and automotive shredder residue (ASR). For comparison, bituminous coal was also analyzed as a reference, given its widespread use as a fossil fuel in cement manufacturing. These waste materials are available in areas near the cement industry, which supports their potential for local sourcing and reduced transportation costs. Some wastes—such as TDF and PW—are already commonly used in cement production, while others, such as WBW and ASR, are not widely utilized. Regardless of how commonly they are used, there is a lack of information regarding the emissions generated by these materials when used as alternative fuels in cement kilns, highlighting the need for further evaluation.
This research aims to investigate the gaseous emissions produced from the combustion of these diverse waste materials as alternative fuels in cement production, focusing on the identification of key pollutants such as CO2, NOx, SO2, and volatile organic compounds, while simultaneously assessing their potential environmental impact. The outcomes of this research will provide valuable insights into the emissions profiles of these waste materials and offer critical understanding of their thermal interactions, contributing to a more comprehensive evaluation of their suitability as alternative fuels in the cement industry.
3. Results
The thermogravimetric analyses (TGA-DSC) and mass spectrometry (TGA-MS) results of all wastes are presented in
Figure 1,
Figure 2,
Figure 3,
Figure 4,
Figure 5,
Figure 6,
Figure 7 and
Figure 8. For each waste, both the thermogravimetric data and corresponding emission profiles are presented, followed by an analysis of their implications for cement production applications. The detailed description of each sample’s thermal behavior and gas emissions is discussed below.
3.1. Sawdust (SD)
The TGA thermogram of SD (
Figure 1a) reveals a distinct three-stage thermal decomposition process. These stages correspond to (1) initial drying with moisture loss occurring below 100 °C; (2) primary decomposition of cellulose and hemicellulose components between 200 and 450 °C, represented by the steepest mass loss region; and (3) complete decomposition of the more thermally stable lignin structures extending to higher temperatures. Following complete thermal degradation, the residual ash content is minimal (less than 2%), confirming the high organic content of the sawdust sample.
The DSC curve provides complementary thermal analysis, exhibiting characteristic thermal events that align precisely with the decomposition stages observed in the TGA analysis. The curve features an initial endothermic peak at approximately 90 °C, corresponding to moisture evaporation during the drying phase. A second, more pronounced exothermic peak emerges at 337 °C, representing the primary decomposition of cellulose and hemicellulose along with volatile lignin components. The third exothermic peak indicates the final decomposition stage of the more stable lignin structures [
14]. A prominent exothermic peak at 429 °C reaches a maximum heat flow of 29.3 W/g. The integration of the DSC curve across the entire temperature range yielded a total energy release of 9333 J/g, demonstrating the substantial calorific value of sawdust as an alternative fuel for cement production processes.
The mass spectrometry data (
Figure 1b) provides valuable insights into the gaseous emissions during thermal decomposition. The primary detected mass-to-charge (
m/
z) peaks at 18, 39, 42, 43, 44, and 45 correspond to H
2O, C
3H
3, C
3H
6, C
3H
7, CO
2, and COOH, respectively [
14]. The evolution of H
2O occurs during two distinct phases: initially during the drying stage (associated with the first TGA peak) and subsequently during the combustion of organic components (corresponding to the second TGA peak). This two-phase water release pattern indicates the presence of both surface moisture and chemically bound water within the sawdust structure.
The CO
2 emissions emerge prominently during the thermal decomposition between the second and third TGA stages, directly correlating with the oxidative degradation of cellulose, hemicellulose, and lignin components. The synchronization between the prominent DSC peaks and the MS data highlights the relationship between energy release and carbon emission patterns during thermal decomposition. The MS data also reveals the formation of various organic volatile compounds, including C
3H
3, C
3H
6, C
3H
7, and COOH, though at significantly lower intensities compared to H
2O and CO
2 emissions [
9,
23].
The FTIR spectroscopy analysis of the SD sample, as reported in previous work [
22], confirms the presence of the aforementioned components, validating the interpretation of the TGA-DSC and TGA-MS results. These findings align with comparable studies on biomass thermal degradation under an air atmosphere by Simón et al. [
14] and under inert conditions by Guida et al. [
7], demonstrating the consistency of thermal decomposition mechanisms in lignocellulosic biomass materials regardless of the surrounding atmosphere.
Figure 1.
(a) TGA-DSC thermograms and (b) TGA-MS spectra of SD.
Figure 1.
(a) TGA-DSC thermograms and (b) TGA-MS spectra of SD.
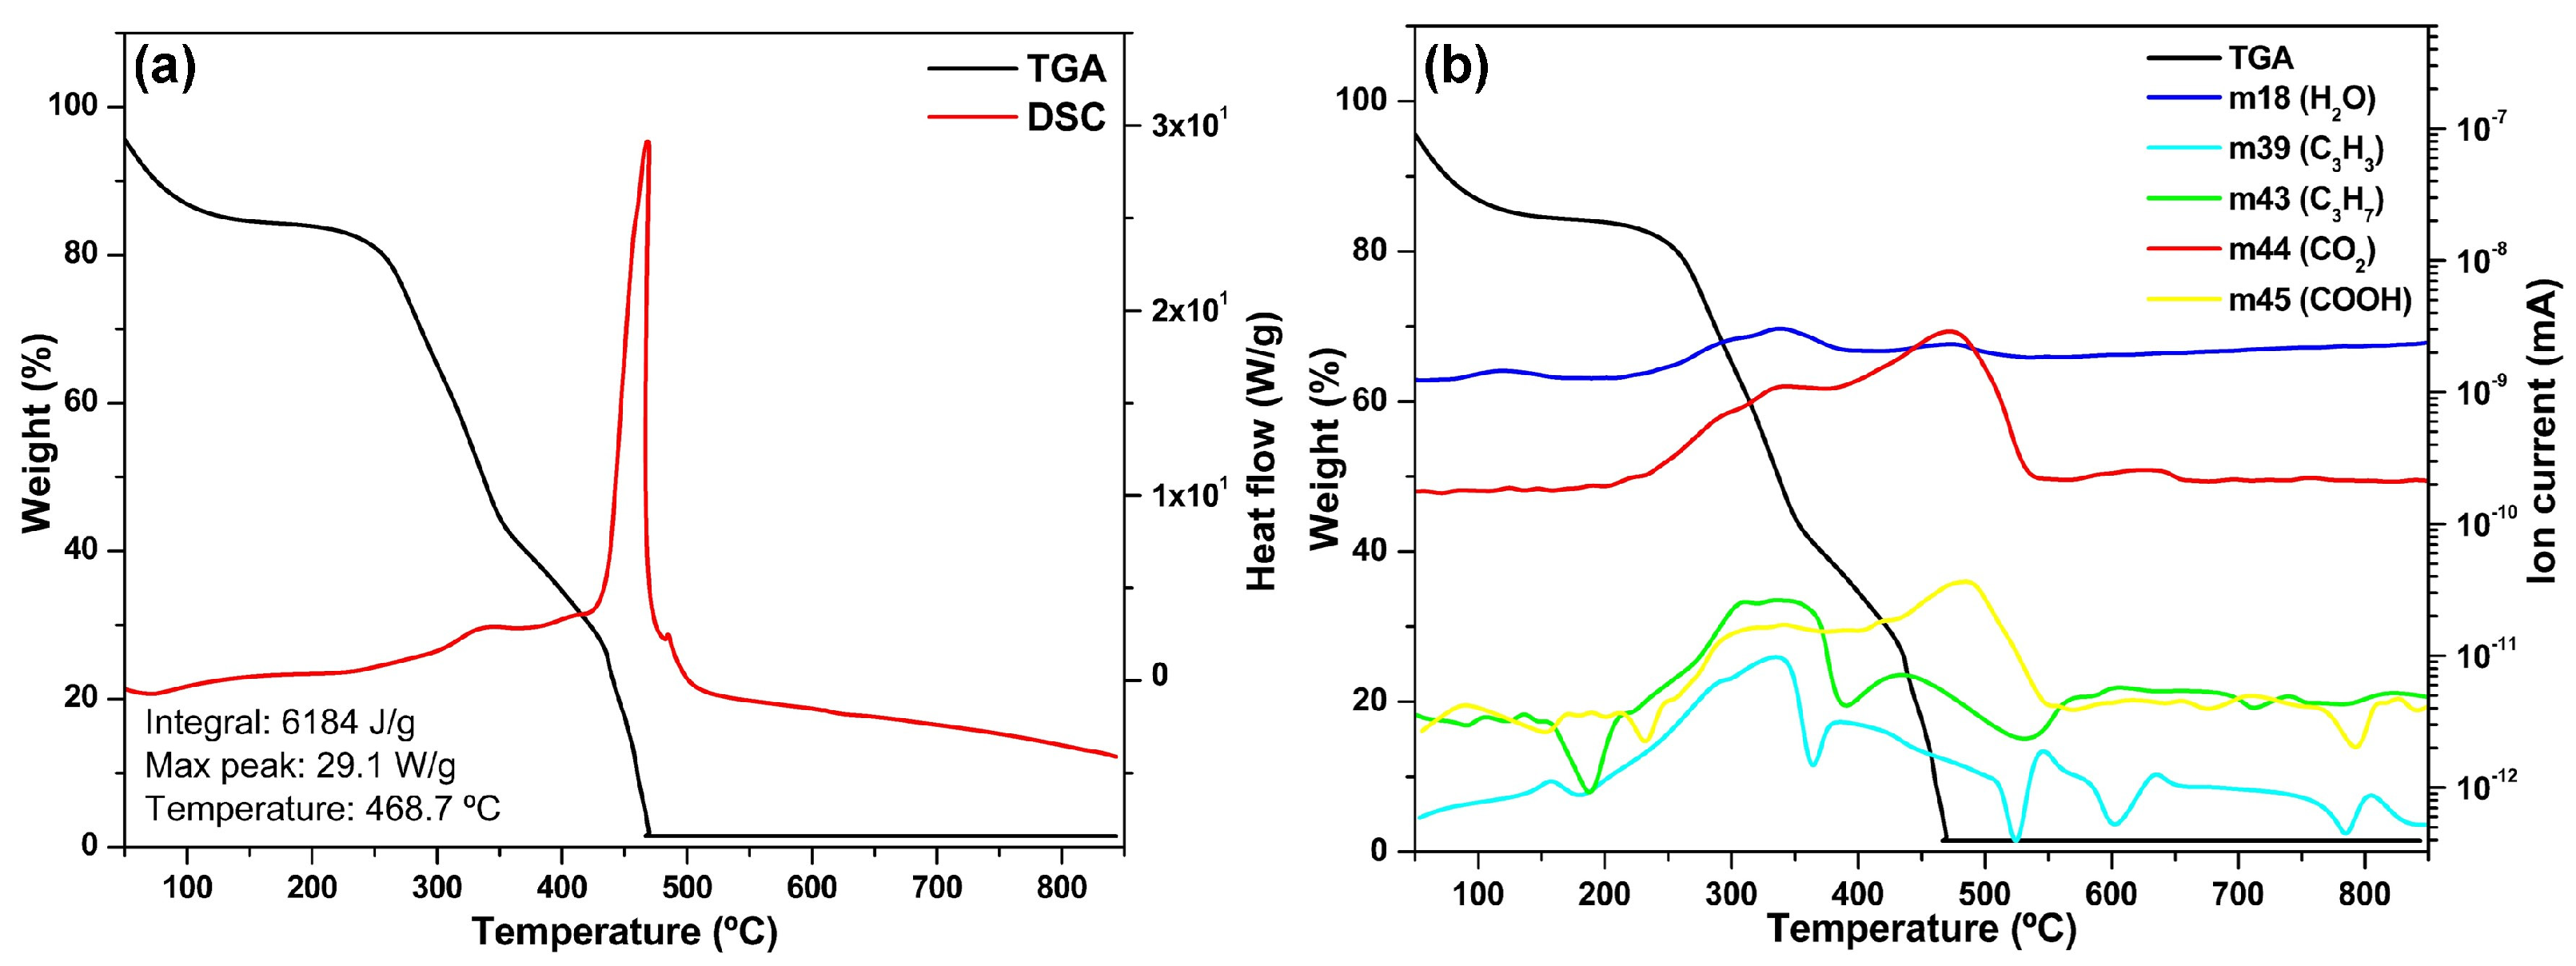
3.2. Pecan Nutshell (PNS)
The TGA thermogram of PNS (
Figure 2a) demonstrates two well-defined stages of thermal decomposition. The first stage occurs below 100 °C and corresponds to water evaporation, manifested as a subtle weight loss of approximately 5%. The second stage, occurring between 200 and 500 °C, involves the comprehensive breakdown of the lignocellulosic components (cellulose, hemicellulose, and lignin), characterized by a steep mass reduction of nearly 80%. The degradation pattern suggests a more homogeneous composition compared to other biomass materials, with less distinct separation between the decomposition of individual lignocellulosic components. Post-thermal degradation, the residual ash content is minimal (<2%), indicating the predominantly organic composition of the PNS material.
The DSC curve exhibits a characteristic thermal profile that correlates with the mass loss events, featuring an initial endothermic valley followed by a dramatic exothermic peak at 468.7 °C with a maximum heat flow of 29.1 W/g. This sharp, well-defined peak indicates a highly energetic combustion process of the lignocellulosic components concentrated within a narrow temperature window. The integration of the DSC curve revealed a total energy release of 6184 J/g, demonstrating PNS’s considerable potential as an alternative fuel source for cement manufacturing processes.
The complementary FTIR analysis of PNS, as reported in previous work [
11], confirms the presence of C-O-C bands in the 900–1250 cm
−1 range, validating the lignocellulosic composition identified in the thermal analysis. Similar to the sawdust sample, the TGA-MS analysis (
Figure 2b) reveals characteristic
m/
z peaks at 18, 39, 43, 44, and 45, which correspond to H
2O, C
3H
3, C
3H
7, CO
2, and COOH, respectively [
14]. The MS data reveals distinctive H
2O emission patterns at approximately 100 °C and 350 °C, attributable to both the evaporation of surface moisture and the release of chemically bound water during combustion.
The CO2 emission profile exhibits two significant peaks at 340 °C and 470 °C, which directly correlate with the sequential decomposition of the primary lignocellulosic components. The temporal alignment between the prominent DSC peaks and the major gas emissions underscores the relationship between energy release and carbon emission dynamics during the thermal degradation process. Additionally, the MS data indicate minor but detectable emissions of organic compounds, including C3H3, C3H7, and COOH, following patterns like those observed in the SD sample.
The FTIR analysis further substantiates the presence of cellulose, hemicellulose, and lignin structures that are responsible for the observed emission patterns [
22]. These findings demonstrate strong concordance with previous TGA-MS studies on biomass waste materials under inert atmospheric conditions, as reported by Radojević et al. [
9], indicating that the fundamental decomposition mechanisms of lignocellulosic materials remain consistent across different biomass sources.
Figure 2.
(a) TGA-DSC thermograms and (b) TGA-MS spectra of PNS.
Figure 2.
(a) TGA-DSC thermograms and (b) TGA-MS spectra of PNS.
3.3. Wind Blade Waste (WBW)
The TGA thermogram of WBW (
Figure 3a) reveals the thermal behavior of a composite material comprising epoxy resin, cellulose, and fiberglass components, which is consistent with the FTIR characterization data [
22]. The thermal degradation profile exhibits a significant weight loss between 250 and 600 °C, corresponding to the decomposition of the organic matrix materials, primarily epoxy resin and cellulosic components. Notably, the curve plateaus after 600 °C with a substantial residual mass of approximately 50%, primarily composed of fiberglass, indicating the significant inorganic content of this waste stream. This high residual content distinguishes WBW from purely organic waste materials and has implications for its use in cement manufacturing, where inorganic components could potentially contribute to the clinker composition.
The DSC curve exhibits a broad exothermic profile spanning from 200 °C to 600 °C, featuring a pronounced peak at 510 °C with a maximum heat flow of 8.9 W/g. This extended thermal event reflects the complex, multi-stage decomposition of the diverse organic components within the composite material. The integration of the DSC curve yielded a total energy release of 3319 J/g, which, while lower than purely organic waste streams, still demonstrates appreciable energy content that could be effectively utilized in cement production processes.
The TGA-MS analysis (
Figure 3b) reveals peaks at
m/
z values of 18, 28, 43, 44, 45, and 51, which can be attributed to H
2O, NO, C
3H
7, CO
2, COOH, and C
4H
3, respectively [
18]. The MS data show H
2O emissions predominantly occurring between 200 °C and 500 °C, corresponding to both the liberation of adsorbed surface moisture and chemically bound water within the material structure. Significant CO
2 emissions are observed within the 200 °C to 600 °C temperature range, coinciding with the decomposition of the polymeric structures in the epoxy resin and cellulose components.
The synchronization between the prominent DSC exotherm and the MS emission profiles underscores the correlation between energy liberation and carbon emissions during the thermal degradation process. Additionally, the MS data reveals minor but detectable emissions of NO, C
3H
7, COOH, and C
4H
3, which can be attributed to the devolatilization of complex organic structures present in the epoxy resin and cellulose components. The detection of NO emissions is particularly significant, resulting from the oxidation of nitrogen-containing compounds present in the material, with a nitrogen content of approximately 1.26% as previously reported [
22].
The thermal behavior observed in this analysis demonstrates strong concordance with previous studies on waste wind turbine blades under inert atmospheric conditions, as reported by Cheng et al. [
19]. Similarly, the emission profiles identified through the TGA-MS analysis show remarkable similarities to those reported by Hu et al. [
18] for studies conducted under inert conditions, further validating the consistency of the thermal degradation mechanisms of epoxy resin components across different atmospheric environments.
Figure 3.
(a) TGA-DSC thermograms and (b) TGA-MS spectra of WBW.
Figure 3.
(a) TGA-DSC thermograms and (b) TGA-MS spectra of WBW.
3.4. Industrial Hose Waste (IHW)
The TGA thermogram of IHW (
Figure 4a) reveals a comprehensive thermal decomposition profile characteristic of rubber-based materials. The weight loss curve shows a significant mass reduction between 200 °C and 600 °C, exhibiting multiple degradation stages that correspond to the sequential breakdown of various components within the complex rubber matrix. The first significant weight loss occurs around 300–400 °C, followed by accelerated decomposition between 400 and 550 °C, ultimately resulting in approximately 90% total mass reduction. Following complete thermal decomposition, approximately 10% residual ash remains, primarily composed of metal oxides and inorganic fillers originally present in the industrial hose formulation.
The DSC curve exhibits exothermic peaks between 200 °C and 600 °C, indicating substantial energy release during the thermal degradation process. These multiple, well-defined exothermic events align precisely with the observed mass loss stages, with the most prominent peak occurring at 521.2 °C with a remarkable maximum heat flow of 15.6 W/g. The integration of the DSC curve across the entire temperature range yielded a total energy release of 14,062 J/g, significantly higher than many other waste materials analyzed. These exothermic reactions can be attributed to the oxidative decomposition of the rubber polymer chains and the combustion of volatile organic compounds generated during this process. The intensity, multiplicity, and breadth of these peaks suggest that IHW could serve as an exceptionally effective energy source in cement manufacturing applications.
The complementary TGA-MS analysis (
Figure 4b) reveals characteristic mass-to-charge (
m/
z) peaks at 18, 28, 39, 41, 42, 43, 44, and 55, corresponding to H
2O, NO, C
3H
3, C
3H
5, C
3H
6, C
3H
7, CO
2, and C
4H
7, respectively. The emission profile demonstrates that H
2O and CO
2 constitute the primary gaseous products, with their maximum evolution occurring between 200 °C and 450 °C. This temperature range aligns with the major mass loss observed in the TGA curve, confirming that these emissions result from the combustion of volatile organic compounds released during the thermal decomposition of the rubber matrix.
The detection of NO emissions, which peak between 250 °C and 400 °C, can be attributed to the oxidation of nitrogen-containing compounds within the rubber formulation. This observation correlates with the elemental analysis data previously reported [
22], which indicated a nitrogen content of approximately 2.70% in the IHW sample. The simultaneous detection of various hydrocarbon fragments (C
3H
3, C
3H
5, C
3H
6, C
3H
7, and C
4H
7) during this temperature range suggests that, despite the oxidative atmosphere, some partial pyrolysis occurs as oxygen is preferentially consumed, leading to the formation of these intermediate volatile organic compounds.
The thermal behavior patterns observed in this analysis demonstrate strong concordance with previous studies on nitrile butadiene rubber [
24], highlighting the similarities in decomposition mechanisms across different rubber formulations. Moreover, the emission characteristics emerging from the TGA-MS analysis align closely with those reported by Singh et al. [
11] for waste tire rubber under inert conditions, further validating the consistency of the thermal degradation mechanisms of rubber materials across different atmospheric environments.
Figure 4.
(a) TGA-DSC thermograms and (b) TGA-MS spectra of IHW.
Figure 4.
(a) TGA-DSC thermograms and (b) TGA-MS spectra of IHW.
3.5. Tire-Derived Fuel (TDF)
The TGA thermogram of TDF (
Figure 5a) provides a comprehensive characterization of the thermal decomposition behavior of this recycled rubber-based material. The weight loss profile demonstrates a significant mass reduction of approximately 90% between 250 °C and 600 °C, with the steepest degradation occurring between 350 and 500 °C. This multi-stage decomposition reflects the complex composition of tire materials, including various elastomers (natural rubber, styrene-butadiene rubber, and butadiene rubber), processing oils, and other organic additives. Post-thermal degradation, the approximately 10% residual ash primarily consists of inorganic fillers, carbon black, zinc oxide, and silica originally incorporated into the tire formulation.
The DSC curve reveals significant exothermic activity with a pronounced peak at 565.2 °C, reaching a maximum heat flow of 26.6 W/g, indicating the main combustion phase of the volatilized hydrocarbons. The calculated energy release of 24,663 J/g represents a substantial calorific value comparable to some conventional fossil fuels, highlighting TDF’s potential as an effective energy source. The shape and intensity of the DSC curve, with its pronounced exothermic region between 400 °C and 600 °C, confirm TDF’s suitability for cement kiln applications, where both its energy content and the incorporation of its inorganic components into the clinker material provide dual benefits to the manufacturing process.
The TGA-MS analysis (
Figure 5b) reveals a complex emission profile with characteristic mass-to-charge (
m/
z) peaks at 18, 28, 39, 41, 42, 43, 44, 45, 53, 55, 64, and 67, which correspond to H
2O, NO, C
3H
3, C
3H
5, C
3H
6, C
3H
7, CO
2, COOH, C
4H
5, C
4H
7, SO
2, and C
5H
7, respectively. This rich emission spectrum reflects the complex composition of tire materials, which typically contain natural and synthetic rubbers, processing oils, antioxidants, accelerators, and various other additives.
The MS data reveals distinct H2O emissions between 250 °C and 550 °C, coinciding with the major mass loss observed in the TGA curve. This correlation confirms that these emissions result from both the release of physically bound moisture and the combustion reactions occurring during rubber decomposition. The substantial CO2 emissions observed between 200 °C and 600 °C correspond directly to the oxidation of carbon-containing compounds released during the thermal degradation of the polymer chains.
Particularly noteworthy in the emission profile is the detection of both NO and SO
2, which appear in the temperature ranges of 250–500 °C and 300–600 °C, respectively. These emissions can be attributed to the oxidation of nitrogen- and sulfur-containing compounds present in the tire formulation, such as accelerators and vulcanization agents. The elemental analysis previously reported [
11] indicated nitrogen and sulfur contents of approximately 0.34% and 0.14%, respectively, which align with the observed emission intensities. The presence of these heteroatom-containing gases is significant from an environmental perspective, as they are potential precursors to NO
x and SO
2 pollutants.
The simultaneous detection of various hydrocarbon fragments (C3H3, C3H5, C3H6, C3H7, COOH, C4H5, C4H7, and C5H7) primarily between 250 °C and 600 °C provides insight into the complex depolymerization mechanisms occurring during tire rubber degradation. These emissions reflect the breakdown of different polymeric chains present in the tire material, including polyisoprene, polybutadiene, and styrene-butadiene rubber, and their subsequent partial oxidation under experimental conditions.
The thermal behavior and emission profiles observed in this analysis demonstrate strong concordance with previous studies on tire rubber decomposition, such as the TGA-DSC data on tire rubber [
15] and TGA-MS analysis of waste tires [
11]. These correlations validate the consistency of the thermal degradation mechanisms of tire rubber across different experimental conditions and analytical techniques.
Figure 5.
(a) TGA-DSC thermograms and (b) TGA-MS spectra of TDF.
Figure 5.
(a) TGA-DSC thermograms and (b) TGA-MS spectra of TDF.
3.6. Plastic Waste (PW)
The TGA thermogram of PW (
Figure 6a) provides comprehensive insights into the thermal decomposition behavior of a heterogeneous mixture of polymers, including polypropylene, polyethylene, polyester, polycarbonate, and polyurethane. The weight loss profile demonstrates a sharp, nearly complete mass reduction (approximately 99%) occurring primarily between 400 °C and 600 °C, indicating the highly combustible nature of these synthetic materials. Unlike natural materials with multi-stage decomposition, the relatively narrow decomposition range suggests a somewhat coordinated breakdown of the various polymer chains present in the waste stream. The remarkably low residual ash content (approximately 1%) confirms the high organic composition of the plastic waste stream and indicates minimal inorganic additives or fillers, making this material an exceptionally clean-burning alternative fuel with potential for high energy contribution and minimal solid residue in cement production processes.
The DSC curve reveals a complex exothermic profile with two distinct and well-defined peaks within the temperature range of 350 °C to 600 °C, suggesting a two-phase thermal decomposition mechanism. The first exothermic peak, observed between 400 °C and 500 °C, can be attributed to the initial depolymerization processes where primary chemical bonds are broken within the polymer chains, leading to the release of volatile fragments with lower molecular weights. This phase represents the transformation of the solid polymeric structure into volatile intermediates as the macromolecular chains begin to fragment. The second, more pronounced peak at 572.9 °C, reaching a maximum heat flow of 44.5 W/g (significantly higher than the TDF sample), corresponds to the secondary oxidation reactions of the more thermally resistant polymer fragments and carbonaceous residues. During this stage, the more stable aromatic structures and cross-linked networks undergo complete oxidation, resulting in the formation of simple gaseous products such as CO
2 and H
2O [
25]. The calculated energy release of 22,920 J/g represents a substantial calorific value suitable for energy recovery applications in cement manufacturing.
The complementary TGA-MS analysis (
Figure 6b) reveals characteristic mass-to-charge (
m/
z) peaks at 18, 28, 39, 41, 42, 43, 44, and 45, which can be attributed to H
2O, NO, C
3H
3, C
3H
5, C
3H
6, C
3H
7, CO
2, and COOH, respectively. This emission profile reflects the complex degradation pathways of the polymeric mixture. The MS data reveals two distinct H
2O emission peaks within the temperature range of 400 °C to 650 °C, which correspond to the staged decomposition of different polymers within the mixture. The first H
2O emission peak likely originates from the decomposition of polymers containing hydroxyl groups, such as polyurethane, while the second peak can be attributed to the oxidation of hydrogen-containing fragments released during the thermal degradation of polyolefins like polyethylene and polypropylene.
The substantial CO2 emissions observed between 400 °C and 650 °C directly correlate with the oxidative decomposition of the carbon-rich polymer chains. The intensity and broad temperature range of these emissions highlight the sequential decomposition of different polymers within the waste mixture, with each polymer family exhibiting characteristic decomposition temperatures: polyethylene and polypropylene typically decompose between 400 °C and 500 °C, while more thermally stable polymers like polycarbonate and polyester degrade at higher temperatures between 500 °C and 600 °C.
Particularly noteworthy in the emission profile is the detection of NO, which appears primarily between 400 °C and 600 °C. This emission can be attributed to the oxidation of nitrogen-containing structures within polymers such as polyurethane and polyamides, which may be present in the waste mixture. The elemental analysis previously reported [
22] indicated a nitrogen content of approximately 1.17%, which aligns with the observed NO emission intensity.
The simultaneous detection of various hydrocarbon fragments (C3H3, C3H5, C3H6, C3H7) and carboxylic compounds (COOH) primarily between 400 °C and 650 °C provides critical insights into the specific depolymerization mechanisms. These emissions represent the characteristic fragmentation patterns of different polymer types: aliphatic hydrocarbons (C3H5, C3H6, C3H7) likely originating from polyolefins and unsaturated hydrocarbons (C3H3) and carboxylic fragments (COOH) potentially derived from polyester and polycarbonate degradation.
The thermal behavior and emission profiles observed in this analysis demonstrate strong concordance with previous studies on individual polymer decomposition, including the TGA-FTIR-MS analysis of polypropylene [
25], TGA-MS of low-density polyethylene, TGA-FTIR of polyurethane [
26], TGA-GC/MS of polyester resins [
27], and TGA-GC/MS of polycarbonate [
28]. These correlations validate the interpretation that the complex thermal behavior of the PW sample represents the cumulative contribution of its constituent polymers, each following its characteristic degradation pathways under oxidative conditions.
Figure 6.
(a) TGA-DSC thermograms and (b) TGA-MS spectra of PW.
Figure 6.
(a) TGA-DSC thermograms and (b) TGA-MS spectra of PW.
3.7. Automotive Shredder Residue (ASR)
The TGA thermogram of ASR (
Figure 7a) provides comprehensive insights into the thermal decomposition behavior of this complex heterogeneous waste stream. ASR, a byproduct of end-of-life vehicle processing, typically comprises a diverse mixture of polymers, elastomers, textiles, and trace metals. The weight loss profile demonstrates a substantial but incomplete mass reduction (approximately 80%) occurring in a broad temperature range between 250 °C and 550 °C, with a more gradual decomposition pattern compared to the other alternative fuels. This extended degradation range reflects the highly heterogeneous nature of ASR, with various components decomposing at different temperature thresholds. The substantial residual mass of approximately 20% confirms the significant inorganic content, including metals, glass fibers, mineral fillers, and flame retardants commonly found in automotive components. This high ash content presents both challenges and opportunities for cement production—while potentially introducing variability in clinker composition, it also provides mineral components that could be incorporated into the cement matrix, potentially enhancing certain properties while reducing the need for virgin raw materials.
The DSC curve exhibits a pronounced exothermic peak at 424.4 °C with a maximum heat flow of 27.4 W/g, followed by a sustained exothermic plateau extending to approximately 700 °C. This thermal behavior suggests a complex, multi-stage combustion process involving the sequential degradation of different material fractions, such as polypropylene, polyurethane, polyvinyl chloride, and acrylonitrile butadiene styrene commonly used in automotive applications. The calculated energy release of 10,171 J/g is notably lower than both TDF and PW samples, indicating a lower calorific value that can be attributed to the higher proportion of non-combustible materials in this waste stream. The lower energy density compared to other alternative fuels suggests ASR may be most effectively utilized in blended fuel scenarios rather than as a standalone energy source in cement manufacturing operations.
The complementary TGA-MS analysis (
Figure 7b) reveals characteristic mass-to-charge (
m/
z) peaks at 18, 28, 30, 43, and 44, which can be attributed to H
2O, NO, CH
2O, C
3H
7, and CO
2, respectively. This emission profile reflects the complex decomposition pathways of the organic components within ASR. The MS data shows a significant H
2O emission peak within the temperature range of 200 °C to 550 °C, which can be attributed to both the release of adsorbed moisture and the formation of water during oxidation reactions of hydrogen-containing organic compounds.
The substantial CO2 emissions observed between 300 °C and 600 °C directly correlate with the oxidative decomposition of carbon-rich polymeric structures in the ASR. The intensity profile of these emissions suggests a sequential decomposition of different organic components, with each polymer type exhibiting characteristic decomposition temperatures. The synchronization between the DSC exothermic peak and the CO2 emission profile underscores the direct relationship between energy liberation and carbon oxidation during the thermal degradation process.
Particularly significant in the emission profile is the detection of NO and CH2O, which appear primarily between 200 °C and 400 °C. The NO emissions can be attributed to the oxidation of nitrogen-containing structures within polymers such as polyurethane and polyamides, which are commonly found in automotive components, including seat foams and interior trims. The formaldehyde (CH2O) emissions likely originate from the decomposition of formaldehyde-based resins used in various automotive applications, including adhesives and composite materials.
The detection of C3H7 fragments between 200 °C and 400 °C provides insights into the specific depolymerization mechanisms of polyolefins, such as polypropylene and polyethylene, which constitute a significant fraction of automotive plastics. These emissions represent characteristic fragmentation patterns of the aliphatic polymer chains during their thermal decomposition. The temperature range of these emissions suggests that the polyolefin components in ASR undergo degradation at relatively lower temperatures compared to more thermally stable polymers that might be present in the mixture.
The absence of sulfur-containing compounds in the emission profile is noteworthy, suggesting minimal sulfur content in this ASR sample. This observation is favorable from an environmental perspective, as it indicates that the utilization of this material as an alternative fuel would not significantly contribute to SO2 emissions during cement production.
The thermal behavior and emission profiles observed in this analysis demonstrate strong concordance with previous studies on ASR decomposition, particularly the TGA-FTIR-GC/MS analysis [
21]. These correlations validate the interpretation that the complex thermal behavior of the ASR sample represents the cumulative contribution of its constituent materials, each following its characteristic degradation pathways under oxidative conditions. The findings highlight the potential of ASR as an alternative fuel source in cement production, offering both waste management benefits and energy recovery opportunities.
Figure 7.
(a) TGA-DSC thermograms and (b) TGA-MS spectra of ASR.
Figure 7.
(a) TGA-DSC thermograms and (b) TGA-MS spectra of ASR.
3.8. Bituminous Coal
The TGA thermogram of bituminous coal (
Figure 8a) provides comprehensive insights into the thermal decomposition behavior of this conventional fossil fuel, which serves as the reference material in this study. The weight loss profile demonstrates a characteristic multi-stage decomposition pattern with an initial moisture release below 150 °C (approximately 2–3% weight loss), followed by a moderate mass reduction between 300 and 400 °C, and then a more rapid decomposition between 400 and 550 °C. The overall mass reduction reaches approximately 89%, indicating a high organic carbon content typical of bituminous coal. This gradual, staged weight loss reflects coal’s complex macromolecular structure, composed of condensed aromatic rings with various functional groups and crosslinks. The significant residual mass of approximately 11% corresponds to the inherent mineral matter content, including aluminosilicates, pyrite, calcite, and various metal oxides that represent coal’s geological history and formation conditions.
The DSC curve reveals a distinctive thermal behavior with two distinguishable exothermic features: a moderate shoulder around 350–400 °C and a more pronounced peak at 460.2 °C with a maximum heat flow of 14.2 W/g. This bimodal heat release pattern directly correlates with coal’s heterogeneous composition, where the initial exotherm represents the combustion of more reactive components (aliphatic structures and oxygen-containing functional groups), while the main peak corresponds to the oxidation of the more stable aromatic carbon framework. The calculated energy release of 13,649 J/g is notably lower than synthetic materials like plastic waste but represents a consistent and reliable energy source due to coal’s relatively uniform composition compared to waste-derived fuels. The moderately sharp exothermic peak, combined with the extended temperature range of heat release, demonstrates bituminous coal’s established role as a predictable and controllable fuel for industrial combustion processes, providing a valuable baseline against which alternative fuels can be evaluated for cement production applications.
The complementary TGA-MS analysis (
Figure 8b) reveals characteristic mass-to-charge (
m/
z) peaks at 18, 28, 44, 45, and 64, which can be attributed to H
2O, NO, CO
2, COOH, and SO
2, respectively. This emission profile provides critical insights into the complex decomposition pathways of coal under oxidative conditions. The MS data reveals three distinct H
2O emission events: the first occurs at approximately 100 °C, corresponding to the evaporation of physically adsorbed moisture; the second and third peaks appear between 250 °C and 600 °C, which can be attributed to the release of structurally bound water and the formation of water during hydrogen oxidation reactions within the coal matrix.
The substantial CO2 emissions observed between 250 °C and 600 °C directly correlate with the oxidative decomposition of the carbon-rich coal structure. The profile of these emissions suggests a progressive oxidation of different carbonaceous components, with aliphatic structures generally oxidizing at lower temperatures, followed by the more thermally resistant aromatic and cross-linked structures. The synchronization between the DSC exothermic peak and the CO2 emission profile underscores the direct relationship between energy liberation and carbon oxidation during the combustion process.
Particularly significant in the emission profile is the detection of both NO and SO
2, which appear between 200 °C and 600 °C. These emissions result from the oxidation of organically bound nitrogen and sulfur compounds within the coal structure, including pyridines, pyrroles, thiophenes, and mercaptans. The elemental analysis previously reported [
22] indicated nitrogen and sulfur contents of approximately 2.64% and 0.83%, respectively, which align with the observed emission intensities. The presence of these heteroatom-containing gases is particularly significant from an environmental perspective, as they are direct precursors to NO
x and SO
2 pollutants that contribute to acid rain and atmospheric pollution.
The detection of COOH fragments between 300 °C and 500 °C provides insights into the decomposition of carboxylic and carbonyl functional groups present within the coal structure. These oxygenated functional groups, which are typically present in the vitrinite and liptinite macerals, undergo thermal degradation to release these characteristic fragments. The temperature range of these emissions aligns with the primary devolatilization phase of bituminous coal, where these relatively less stable functional groups decompose.
The thermal behavior and emission profiles observed in this analysis demonstrate strong concordance with previous studies on bituminous coal combustion, particularly the TGA-MS analyses [
29,
30]. These correlations validate the interpretation that the observed thermal behavior represents the characteristic decomposition pattern of bituminous coal under oxidative conditions. The emission profile, particularly the detection of NO and SO
2, establishes an important baseline for comparison with the alternative fuels investigated in this study, highlighting the potential environmental advantages of waste-derived fuels that exhibit lower sulfur and nitrogen emissions.
Figure 8.
(a) TGA-DSC thermograms and (b) TGA-MS spectra of coal.
Figure 8.
(a) TGA-DSC thermograms and (b) TGA-MS spectra of coal.
4. Discussion
The thermal degradation profiles of the analyzed biomass and industrial wastes, occurring predominantly within the 200–600 °C temperature range, demonstrate exceptional compatibility with the cement manufacturing process. This temperature range strategically aligns with both critical combustion zones in modern cement plants [
31]. The precalciner system, operating at approximately 800 °C, can effectively utilize these materials as their primary energy release occurs below this temperature threshold, ensuring complete combustion and optimal energy recovery [
32]. Similarly, the rotary kiln system, despite its significantly higher operational temperature (~1500 °C), can efficiently harness these alternative fuels through its fuel injection system, where the progressive heating gradient would facilitate complete thermal decomposition and maximize energy utilization efficiency [
32,
33].
The quantitative energy release characteristics revealed by TGA-DSC analysis provide compelling evidence for the viability of these waste streams as alternative fuels in cement production. The analyzed materials exhibited substantial energy release contributions ranging from 3319 J/g (WBW) to an impressive 24,663 J/g (TDF) within the critical 200–600 °C temperature window, highlighting their significant potential to supply the thermal energy required for clinker formation (
Table 1). Notably, four of the waste materials—specifically IHW (14,062 J/g), TDF (24,663 J/g), PW (22,920 J/g), and ASR (10,171 J/g)—demonstrated competitive or superior energy release profiles compared to the reference bituminous coal (13,649 J/g). This energetic performance, particularly from TDF and PW with their nearly 1.8 and 1.7 times higher energy density than coal, respectively, suggests these materials can effectively replace or supplement conventional fossil fuels in cement manufacturing processes [
34].
The maximum heat flow peaks in the DSC analysis of these waste materials range from 8.9 to 44.5 W/g (
Table 1), with PW exhibiting the highest value at 44.5 W/g. Significantly, all waste materials except WBW demonstrated higher maximum heat flow peaks than the reference coal (14.2 W/g), indicating their potential for more rapid energy release during combustion. While this enhanced thermal intensity is advantageous for maintaining kiln temperatures and energy efficiency, it necessitates precise control mechanisms to prevent excessive heat release that could potentially compromise clinker quality or damage refractory materials [
31].
The thermal behavior patterns observed in these materials present distinct operational considerations. SD and PNS release their energy within a relatively narrow temperature range, resulting in sharp, concentrated exothermic peaks. These materials require carefully controlled, consistent injections in smaller quantities to prevent thermal spikes in the system [
5,
35]. In contrast, TDF, PW, ASR, and other waste materials exhibited broader exothermic profiles with energy release distributed over wider temperature ranges, facilitating steadier and continuous heat contribution to the kiln system. These differences in thermal behavior profiles underscore the importance of developing material-specific injection protocols and potentially blending various waste streams to achieve optimal combustion characteristics [
33,
36].
The emission profiles characterized by TGA-MS analysis reveal that the primary gaseous products from these waste materials are predominantly H
2O and CO
2, consistent with conventional combustion processes. Minor emissions of volatile organic compounds such as COOH, C
3H
3, and various hydrocarbon fragments (C
3H
5, C
3H
6, C
3H
7) were detected, but at significantly lower concentrations compared to the major combustion products. These compounds are expected to be further oxidized into CO
2 and H
2O due to the highly oxidizing environment and elevated temperatures within the cement kiln [
37]. From an environmental perspective, it is particularly significant that harmful gases like HCl, dioxins, or furans were not detected in any of the waste samples, addressing a primary concern regarding waste fuel utilization [
38].
The presence of NO was observed in five waste materials (WBW, IHW, TDF, PW, and ASR), while SO
2 was detected only in TDF, both of which are also present in the reference coal sample (
Table 1). The NO and SO
2 emissions from the waste materials were compared with their corresponding nitrogen and sulfur contents, as determined in a previous study [
22]. As previously mentioned, the nitrogen content in the five waste materials—WBW (1.26%), IHW (2.70%), TDF (0.34%), PW (1.17%), and ASR (1.08%)—is lower than that of coal (2.64%), with the exception of IHW, which has a slightly higher nitrogen content [
22]. Furthermore, among the waste materials, only TDF contains sulfur (0.14%), which is significantly lower than that of coal (0.83%). This indicates that the substitution of coal with these alternative fuels could potentially lead to a reduction in overall NO
x and SO
2 emissions from cement manufacturing operations, contributing to improved environmental performance without requiring additional emission control technologies [
39,
40].
The combination of favorable energy characteristics, relatively benign emission profiles, and variable ash contents (ranging from <1% for PW to 50% for WBW,
Table 1) positions these waste materials as environmentally advantageous alternatives to conventional fossil fuels in cement production [
41,
42].
Beyond their direct replacement value, the utilization of these materials offers the additional benefit of diverting substantial waste streams from landfills, thus addressing waste management challenges while simultaneously reducing the carbon footprint of cement manufacturing through the displacement of fossil fuels [
43]. The mineral content in the ash fraction of these materials also presents opportunities for incorporation into the clinker matrix, potentially modifying or enhancing certain properties of the final cement product [
44].
5. Conclusions
This comprehensive thermal analysis study, analyzing the combination of TGA-DSC and TGA-MS techniques, demonstrates that the investigated waste materials—sawdust, pecan nutshell, wind blade waste, industrial hose waste, tire-derived fuel, plastic waste, and automotive shredder residue—represent promising alternative fuel sources for cement production. Several key conclusions can be drawn from this research.
The waste materials exhibit substantial energy release capacities, with most materials demonstrating higher energy outputs than conventional bituminous coal. PW, TDF, and IHW show particularly promising energy profiles, releasing between 3319 and 24,663 J/g during thermal decomposition, which significantly exceeds the energy release observed in the reference bituminous coal sample (13,649 J/g). This superior energetic performance indicates these materials can effectively substitute traditional fossil fuels in cement manufacturing, potentially at high substitution rates.
The waste materials demonstrate higher maximum peaks in energy release compared to bituminous coal, indicating their potential as valuable alternatives for clinker production. However, it is crucial to carefully manage their injection into the system to prevent excessive heat release, which could disrupt the kiln and clinker temperature. Understanding the behavior of these materials is key to optimizing their use, ensuring efficient and effective integration into the system while maintaining stable operational conditions.
The thermal decomposition characteristics of the waste materials reveal optimal combustion within the 200–600 °C temperature range, making them highly compatible with both the precalciner (operating at ~800 °C) and the rotary kiln (with fuel inlet at ~1500 °C) components of cement production systems. This temperature compatibility ensures efficient combustion and energy utilization throughout the clinker production process, facilitating seamless integration into existing cement manufacturing infrastructure.
The emission profiles from these alternative fuels predominantly consist of H2O and CO2, which are unavoidable products of any combustion process. Critically, the TGA-MS analysis confirms the absence of highly toxic emissions such as HCl, dioxins, or furans across all waste samples. While trace amounts of volatile organic compounds (COOH, C3H3, etc.) were detected, their concentrations were significantly lower than the major combustion products, suggesting minimal environmental impact.
The presence of NO and SO2 was observed in some samples (NO in WBW, IHW, TDF, PW, and ASR; SO2 in TDF), but their emission intensities were comparable to or lower than those detected in the reference bituminous coal sample. This indicates that transitioning from coal to these alternative fuels could potentially reduce harmful NOx and SO2 emissions associated with cement production, contributing to improved air quality around cement manufacturing facilities.
Beyond their direct applications in cement production, the utilization of these waste materials as alternative fuels offers significant environmental cobenefits through resource valorization. By diverting these materials from landfills and incinerators, cement manufacturers can contribute to the principles of the circular economy, addressing waste management challenges while simultaneously reducing their dependence on finite fossil fuel resources and decreasing the overall carbon footprint of cement production.
It is recommended, based on the findings, to blend alternative fuels with coal to compensate for heat release and minimize atmospheric emissions. Waste materials should partially substitute coal in this context, ensuring that the thermal requirements of the cement kiln are met without compromising process efficiency or clinker quality. Further research is essential to evaluate the long-term performance, operational stability, and potential impacts on product quality and kiln maintenance in order to determine the optimal substitution rate of fossil fuels.
This research provides a foundation for the practical implementation of alternative fuels in industrial-scale cement production. It characterizes the gases emitted from waste-derived materials and their thermal behavior. Future studies should focus on quantifying the emitted gases, optimizing fuel blends, evaluating long-term kiln performance, and assessing the net environmental benefits through comprehensive life cycle assessments of these waste-to-energy pathways in cement manufacturing.


 ,
, 


