Abstract
The global transition toward clean energy has driven the extensive deployment of overhead tower-lines in desserts, where such structures face unique challenges from wind–sand interactions. The current design standards often overlook these combined loads due to oversimplified collision models and inadequate computational frameworks. These gaps are bridged in the present study through the development of a refined impact force model grounded in Hertz contact theory, which captures transient collision mechanics and energy dissipation during sand–structure interactions. Validated against field data from northwest China, the model enables a comprehensive parametric analysis of wind speed (5–60 m/s), sand density (1000–3500 kg/m3), elastic modulus (5–100 GPa), and Poisson’s ratio (0.1–0.4). Our results show that peak impact forces increase by 66.7% (with sand density) and 148% (with elastic modulus), with higher wind speeds amplifying forces nonlinearly, reaching 8 N at 30 m/s. An increased elastic modulus shifts energy dissipation toward elastic rebound, reducing the penetration depth by 28%. The dynamic analysis of a 123.6 m transmission tower under wind–sand coupling loads demonstrated significant structural response amplifications; displacements and axial forces increased by 28% and 41%, respectively, compared to pure wind conditions. These findings reveal the importance of integrating coupling load effects into design codes, particularly for towers in sandstorm-prone regions. The proposed framework provides a robust basis for enhancing structural resilience, offering practical insights for revising safety standards and optimizing maintenance strategies in arid environments.
1. Introduction
The global transition toward clean energy over the past decade has resulted in significant infrastructural development in arid regions, particularly within the electricity sector [1,2]. Power transmission towers in these wind-rich environments face unique challenges from aeolian activities, where combined wind–sand actions amplify structural loads and accelerate material degradation [3,4]. Documented cases of wind–sand damage span critical infrastructure, including wind turbines [5], transportation networks [6], communication systems [7], and photovoltaic installations [8], underscoring the urgent need to understand these complex interactions.
Recent investigations into wind–sand effects have adopted two primary approaches: experimental testing and numerical simulation. Researchers such as Hao et al. [9] employed sediment–air injection methods to characterize erosion patterns under varying impact velocities, while Raffaele et al. [10] established critical similarity criteria for wind–sand tunnel testing of surface-mounted structures. On the numerical front, researchers have predominantly utilized momentum theorem approximations [11,12,13] and discrete phase models (DPMs) [14,15] to simulate sand–structure interactions. Notably, Zhang’s momentum-based wind–sand force model [11] revealed sand-induced motion amplification in transmission towers, which was later extended by Li et al. [12] to demonstrate height-dependent displacement amplification under coupling loads. Shen et al. [13] further identified critical failure modes in cup-type towers through static load modeling based on sandstorm ratings.
Despite these advancements, the current methodologies are constrained by fundamental limitations in representing particle–structure collision dynamics. Prevailing approaches oversimplify sand impacts as instantaneous events through momentum theorem applications [11,12,13], or involve the employment of DPM simulations with restricted restitution coefficient considerations [14]. Such idealizations neglect the transient contact mechanics governing real-world collisions, creating significant deviations from physical reality. This discrepancy stems from two critical gaps: (1) insufficient meteorological data on wind–sand characteristics in key deployment regions and (2) the absence of computational frameworks capturing finite-duration impact processes.
Theoretical developments in contact mechanics highlight opportunities for refinement. While early Kelvin–Voigt models introduced linear spring–damper approximations [16], their discontinuous contact forces violated continuum mechanics principles. Subsequent improvements through Hertzian theory derivatives [17,18,19] addressed energy dissipation aspects but introduced new limitations. Hunt and Crossley’s nonlinear damping model [16] and Lankarani–Nikravesh’s restitution-based approach [17] improved energy conservation modeling, while Flores [18] and Lee [19] introduced phase-specific energy partitioning concepts. However, none of these models fully resolve the paradox between nonlinear Hertzian stiffness and linear damping assumptions in transient collision regimes.
This study bridges these gaps through three key innovations, as follows:
- The development of a refined particle–structure interaction model integrating transient Hertzian contact dynamics;
- Comprehensive parametric analysis of aeolian parameters (wind speed, sand density, and Poisson’s ratio);
- Time-domain response characterization for lattice transmission towers.
Our approach combines field-collected meteorological data from northwest China with advanced contact mechanics modeling, addressing both empirical data scarcity and computational oversimplification in existing works. A parametric study and numerical study will be conducted based on following hypotheses:
H1.
All the sand particles are considered spherical;
H2.
All sand particles impact the structural surface vertically;
H3.
The duration of impact is very short, and the wind speed is considered as constant.
The remainder of this paper is organized as follows (as shown in Figure 1): Section 2 details our wind–sand dataset acquisition, followed by the development of the impact model in Section 3. Thereafter, parametric studies (Section 4) and comparative dynamic analyses of pure wind versus wind–sand loads (Section 5) provide practical insights for resilient tower design.
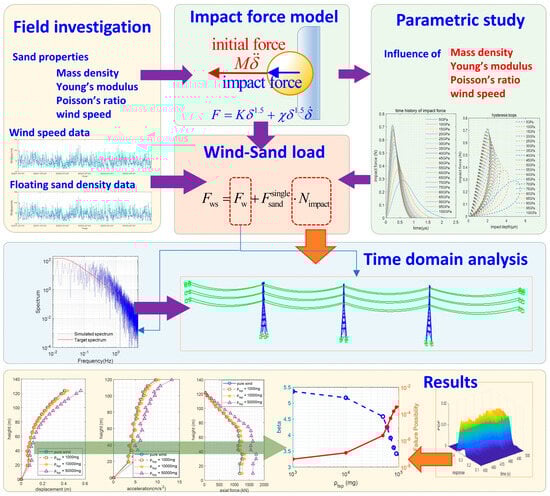
Figure 1.
Flow chart of this study.
2. Collected Climate Data
In order to develop a refined impact force model for power transmission towers under wind–sand loads, climate data and the mechanical properties of the sand were collected. This process included compiling historical wind storm events and wind speed records from northwest China, which provide critical insights into wind–sand characteristics in arid regions. In addition, we examined the correlation between wind speed and floating sand density, offering valuable information on the severity of impact conditions.
2.1. Collected Wind Speed Data and Statistical Analysis
This research systematically gathered and analyzed historical data on windstorm occurrences in northwestern China spanning several decades. Concurrently, wind speed records from multiple locations were collected and systematically organized to provide a comprehensive dataset for analysis.
Figure 2 presents the geographical distribution of meteorological stations, emphasizing the comprehensive network of monitoring sites spread across the region. Furthermore, the figure illustrates the recorded wind speed at a specific station, Guaizihu (102°22′ E, 41°22′ N), demonstrating the temporal variation in wind speed over an extended period. A distinct seasonal pattern in wind speed is evident from the figure, with wind speeds peaking during the spring season.
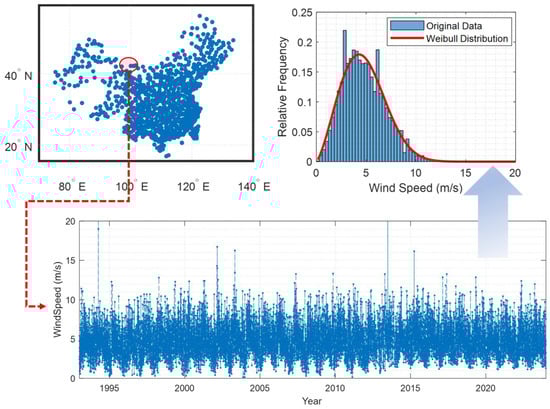
Figure 2.
Locations of the meteorological stations and typical wind speed records over the past few decades.
The histogram in Figure 2 presents the relative frequency distribution of wind speeds at the Guaizihu station (102°22′ E, 41°22′ N). The blue bars represent the original data, and the red curve denotes the fitted Weibull distribution. The Weibull distribution is commonly used in wind energy studies to model wind speed data due to its flexibility in capturing various wind regimes. The figure shows that the wind speed data exhibit a right-skewed distribution, with a peak occurring at lower wind speeds and a long tail extending toward higher wind speeds. The findings indicate that while lower wind speeds are more frequent, there are also significant occurrences of higher wind speeds, which is crucial for understanding the potential wind energy resources in the region.
2.2. Co-Relationship Between Wind Speed and Floating Mass Density
The floating mass density, , refers to the mass of sand particles per unit volume (1 m3). An increase in floating sand density corresponds to a higher concentration of sand particles, thereby indicating more severe impact conditions. According to the authors of [13], the floating sand density and wind speed exhibit an exponential positive correlation, as follows:
Here, is the floating sand density in mg/m3, and is the wind speed in m/s.
2.3. Mechanical Properties of Floating Sand Particles
In the desert regions of China, sand grains are predominantly generated through the weathering of diverse types of rocks, such as granite, limestone, basalt, quartzite, sandstone, and others. Table 1 provides an overview of the key mechanical parameters (e.g., density and elastic modulus) of the studied sand specimens. These same values were used in the parametric study detailed in Section 3.

Table 1.
Properties of sand particles.
3. Simulation of Sand–Structure Impact
Catastrophic incidents in power grid systems have repeatedly demonstrated the risks associated with windborne sand–structure interactions. Despite the plethora of evidence in this regard, international design standards continue to neglect sand-induced loads in structural calculations. A primary limitation lies in the absence of reliable computational frameworks capable of simulating granular impacts on critical components, such as steel angles and tubular members. To resolve this methodological gap, in the following section, we propose a novel particle–structure collision model grounded in Hertzian contact mechanics.
3.1. Impact Model Based on Hertz Contact Theory
Hertzian contact mechanics, originally formulated to characterize elastic body interactions during collision, provides a foundational expression for the impact force between two spherical objects,
where denotes the contact force; is the collision stiffness; and denotes the deformation of the two colliding bodies. This equation is accurate in static conditions. For colliding scenarios, the equation is modified as follows:
where is the hysteresis damping factor used to describe energy dissipation during impact; is the relative velocity of the two colliding objects; and m and n are the impact parameter and the power exponent, respectively. For collision between round particles, the values of m and n are usually set to 3/2.
In Equation (3), the impact stiffness is determined by the mechanical properties of the colliding bodies:
where and are the radii; and denote the elastic moduli; and and are the Poisson’s ratios.
In Equation (3), the hysteresis damping factor is another parameter to be calculated. The authors of previous studies have reported several models that can be used to calculate this parameter, as listed in Table 2. In this table, stands for Newton’s coefficient of restitution.
Table 2.
Hertz contact models.
3.2. Motion Equation of Impact Between Floating Sand and Structural Members
Considering and , Equation (3) can be expressed as follows:
Therefore, the motion equation regarding the impact between a floating sand particle and a structural member is as follows:
Equation (8) is a differential equation with high nonlinearity. It can be solved using the central difference method. Firstly, Equation (8) is rewritten in discrete form as
In the ith time step, the deformation velocity and deformation acceleration are as follows:
Substituting Equations (10) and (11) into Equation (9) yields
If we condense Equation (12), the iterative form of is
where
3.3. Parametric Study on Sand–Structure Impact
3.3.1. Simulation of Sand–Steel Impact Using Different Hertz Contact Models
Numerical simulations of sand–steel collisions in transmission tower components were conducted through multiple Hertz contact formulations, as outlined in Section 3.1. The steel members were assigned the following mechanical properties: elastic modulus = 210 GPa, Poisson’s ratio = 0.27, and mass density = 7800 kg/m3. For the sand particles, the parametric values included an elastic modulus of 40 GPa, a Poisson’s ratio of 0.25, a mass density of 3300 kg/m3, and a radius of 50 μm, with the ambient wind speed set to 10 m/s during the analysis.
Figure 3 illustrates the impact process between a sand particle and a steel member of the power transmission tower. Figure 3a presents the time history of the impact depth. It is evident that the duration of impact was extremely brief. Specifically, the duration calculated using the Hunt–Crossley model, the Herbert–McWhanell model, the Lee–Wang model, and the Lankarani–Nikravesh model was as short as 0.1 μs. The duration estimated using the Zhiying–Qishao model was slightly longer, with a value of only 0.13 μs. Furthermore, the duration calculated using the Zhang model or the Gonthier model extended even further, with a value reaching 0.145 μs.
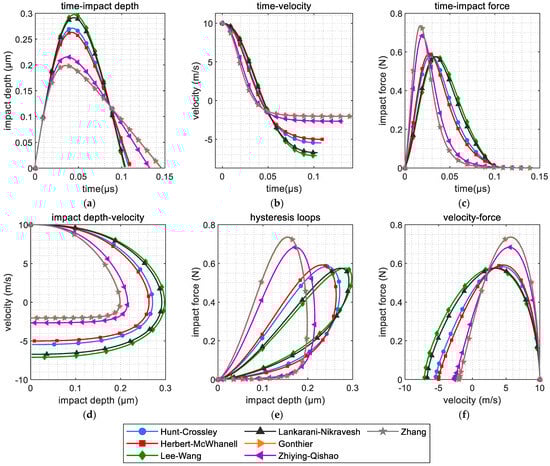
Figure 3.
Simulation of impact between one sand particle and steel using different Hertz contact models: (a) impact depth; (b) deformation velocity; (c) impact force; (d) phase diagram; (e) hysteresis loops (impact depth vs. impact force); (f) deformation velocity vs. impact force.
Figure 3a also demonstrates that there are certain differences in the calculated collision depths among the different Hertz contact models. Specifically, the Lee–Wang model yielded the deepest collision depth, reaching 0.297 μm. The results from the Zhang model and the Gonthier model are close, with a value of approximately 0.198 μm.
Figure 3b illustrates the time-varying deformation velocity of a sand particle colliding with a steel member. All of the curves depicted in the figure start with an initial velocity of 10 m/s, reflecting the model’s assumption that the sand particle’s initial velocity matches the wind speed. As the collision progresses, the sand particle’s velocity undergoes a rapid decrease. Upon reaching the maximum penetration depth, the velocity transitions to negative values, marking the beginning of the rebound phase. The final separation velocities predicted by the various Hertz contact models differ significantly. Notably, the Lee–Wang model predicted the smallest separation velocity (with the largest absolute value), at −7.119 m/s. In contrast, both the Zhang model and the Gonthier model estimated larger separation velocities (with smaller absolute values), approximately −2.02 m/s. These findings suggest that the wind–sand load model, grounded in classical dynamics theory, contains certain inaccuracies, as evidenced by the discrepancy in the absolute values of the initial and final velocities during the collision.
Figure 3c presents the time history of the collision force calculated using Equation (7). As shown in the figure, the results obtained from the Zhang model and the Gonthier model are relatively large, with a maximum collision force of approximately 0.74 N, followed closely by the Zhiying–Qishao model, with a maximum force of around 0.64 N. The remaining models exhibited smaller collision forces, ranging from approximately 0.57 N to 0.59 N. In addition, the peak collision forces calculated by the Zhiying–Qishao model, the Zhang model, and the Gonthier model occurred earlier, at an approximate collision depth of 0.2 μm. The maximum collision forces for the other models appeared when the collision depth reached 0.3 μm.
Figure 3d showcases a phase diagram depicting the collision between a sand particle and a steel member, which is commonly used to verify the accuracy of algorithms. The figure shows that the model chosen for this study demonstrated a consistent pattern—the collision deformation velocity dropped to zero at the peak of the deformation depth. This observation provides preliminary evidence that the Hertz model and the algorithm programming are accurate and reliable.
Figure 3e showcases the hysteresis curves depicting the collision between a sand particle and a steel member. The horizontal axis denotes the collision deformation depth, while the vertical axis represents the collision force. The area enclosed within the curve signifies the extent of energy dissipated throughout the collision process. As illustrated in the figure, all curves exhibit a clear positive correlation between the collision force and the deformation depth, with the Lee–Wang model and the Lankarani–Nikravesh model demonstrating the strongest results. Each curve indicates that a notable amount of energy is dissipated during the collision, highlighting potential inaccuracies in collision simulations based on classical dynamics theory. Furthermore, all curves form complete hysteresis loops, and the collision force decreases to zero at the conclusion of the collision, without dipping into negative values, contrasting with the outcomes of the Kelvin–Voight model. This finding indicates that the results obtained from the models selected for this study are reasonable and superior to those of the Kelvin–Voight model.
Figure 3f illustrates the relationship between collision speed and collision force during the impact of a sand particle with a steel member, also known as the power diagram of collision energy. The horizontal axis represents the collision deformation speed, while the vertical axis represents the collision force. Viewing the diagram from right to left, all curves pass through the point where the speed was 10 m/s, indicating that the collision process was initiated under wind speed conditions of 10 m/s. Following the curves from right to left, it can be observed that as the collision deformation increased, the collision force gradually increased while the collision speed decreased. This process continued until the collision force reached its maximum value, at which point the collision depth was at its deepest. Subsequently, the collision force gradually diminished, and the collision deformation speed decreased further until separation occurred. At the moment of separation, the collision deformation returned to zero, and the collision force also returned to zero, with the collision force remaining positive throughout the entire process.
3.3.2. Impact Between Sand and Tower-Line Components
In the following section, we additionally compare the collision processes of sand particles with different structural components, including steel members, aluminum conductor steel-reinforced (ACSR) wires, and insulators. The parameters used for the simulation are listed in Table 3.
Table 3.
Parameters of sand, steel, ACSR wires, and insulators.
Time history plots of the collision depth, collision speed and collision force, and diagrams of the displacement–velocity phase, hysteresis curves, and energy dissipation power under various conditions are presented in a single set of figures, as shown in Figure 4. In these graphs, it can be observed that the collision results for steel members, ACSR wires, and insulators are very similar, indicating that the material parameters had a relatively small influence on the collision process. In subsequent parameter analyses, emphasis is placed on examining the effects of the sand particle parameters and wind speed on the collision outcomes.
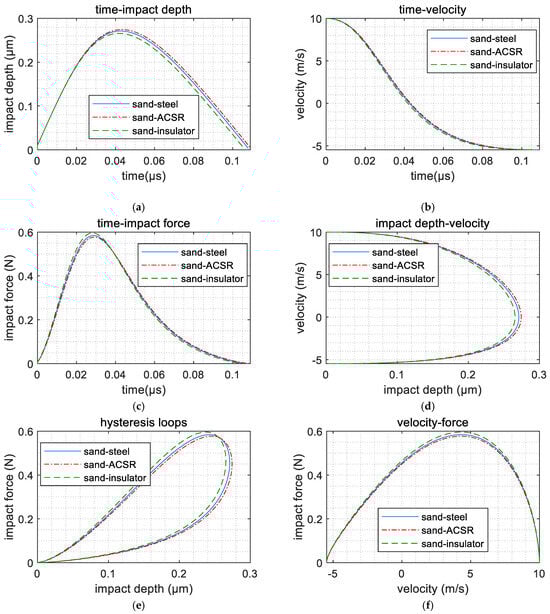
Figure 4.
Comparison of the impact of sand particles on different materials: (a) time history of impact depth; (b) time history of deformation velocity; (c) time history of impact force; (d) phase diagram of impact depth and deformation velocity; (e) hysteresis loops; (f) velocity vs. impact force.
3.3.3. Influence of Wind Speed
Figure 5 presents a summary of the influence of wind speed. Figure 5a depicts the temporal evolution of impact forces across varying initial velocities. Elevated impact velocities induced a sharp surge in force magnitude, attaining peak values within microseconds. This phenomenon underscores the material’s exposure to intensified stress states under high-velocity loading. At 5 m/s, the force profile exhibits a subdued peak (≤1.2 N) with gradual decay; in contrast, velocities of 10–15 m/s triggered steeper ascent rates and amplified peak forces (2.8–4.5 N), accompanied by accelerated post-peak attenuation. Notably, extreme velocities (>30 m/s) provoked abrupt force spikes (>8 N), followed by rapid dissipation, indicative of transient energy transfer dynamics under hypervelocity impacts.
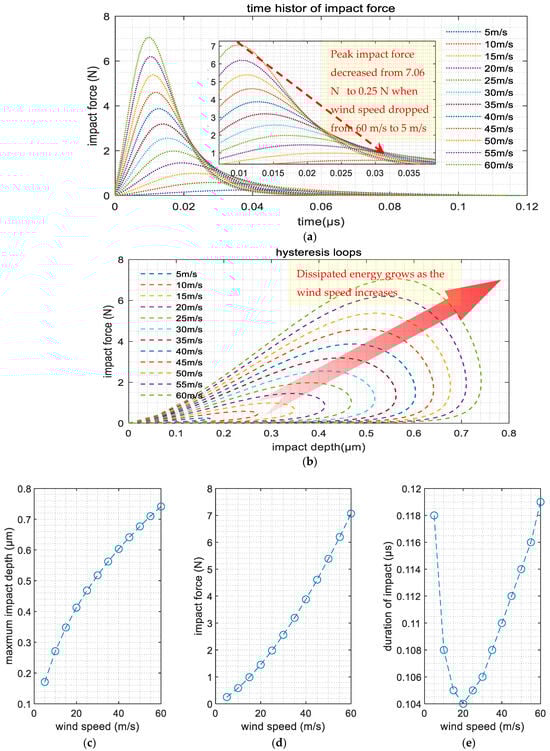
Figure 5.
Influence of wind speed: (a) time history of impact force; (b) hysteresis loops; (c) maximum impact depth; (d) maximum impact force; (e) duration of impact.
Figure 5b presents the hysteresis curves under different wind speeds (i.e., different initial collision velocities). As can be seen from the curves in the figure, as the wind speed increases, the hysteresis loops gradually grow, indicating that the energy dissipation during collision became more significant at higher wind speeds. As impact velocity rose, maximum deformation and peak force increased (shown in Figure 5c,d). This reflects greater mechanical stress on the material at higher velocities. Conversely, impact duration first decreased, hitting a minimum of 0.104 at 20 m/s Figure 5e, due to higher energy dissipation. Then, it increased again to 0.119 at 60 m/s, as greater inertia and energy prolonged interaction time.
3.3.4. Influence of Particle Density
The mass density of dessert sands varied between 1200 kg/m3 and 3500 kg/m3; therefore, in the parametric study, the values of mass density were set to 1000 kg/m3 to 3500 kg/m3, at an interval of 100 kg/m3. Figure 6 details the impact of mass density on the collision process.
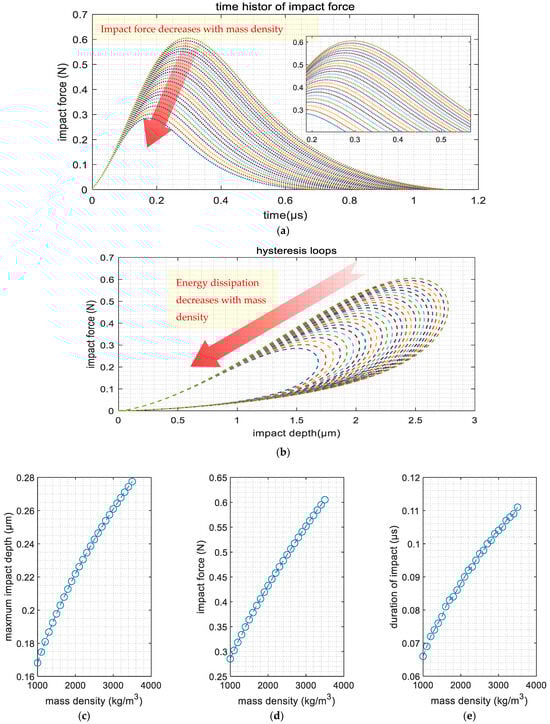
Figure 6.
Influence of mass density: (a) time history of impact force; (b) hysteresis loops; (c) maximum impact depth; (d) maximum impact force; (e) duration of impact.
As illustrated in the figures, the maximum penetration depth, peak impact force, and collision duration exhibit progressive improvements with increasing sand particle density. For instance, the results presented in Figure 6d demonstrate a significant density-dependent behavior:—when the sand particle density reached 1500 kg/m3, the recorded peak impact force measured a mere 0.36 N; in contrast, this parameter increased to 0.60 N at an elevated density of 3500 kg/m3, representing a 66.7% increase in impact intensity. This density–force correlation suggests that adopting conservative estimates of sand particle density in subsequent structural analyses would provide enhanced safety margins for engineering applications.
3.3.5. Influence of Young’s Modulus
The elastic modulus of sand particles was systematically varied from 5 GPa to 100 GPa with 5 GPa increments in this investigation. The computational results presented in Figure 7 reveal three distinct mechanical response patterns.
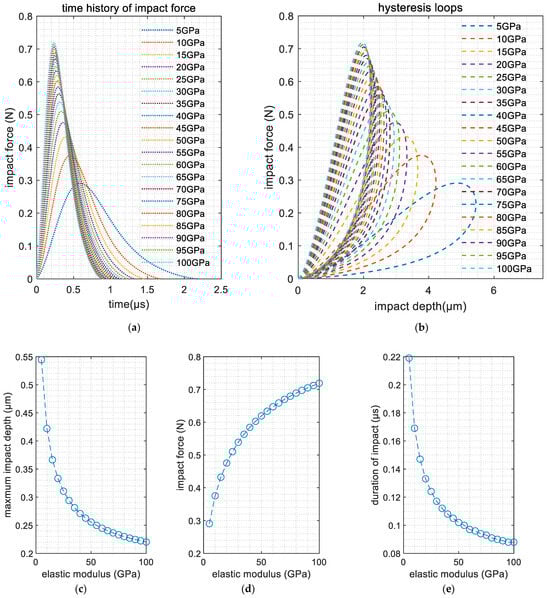
Figure 7.
Influence of elastic modulus: (a) time history of impact force; (b) hysteresis loops; (c) maximum impact depth; (d) maximum impact force; (e) duration of impact.
Figure 7a illustrates the temporal evolution of impact forces under varying elastic moduli. All force–time histories exhibit a characteristic rise–fall pattern, with steeper initial slopes observed in higher modulus cases (e.g., 100 GPa vs. 5 GPa). Notably, the peak impact force demonstrates a positive correlation with the elastic modulus, increasing from 0.29 N at 5 GPa to 0.72 N at 100 GPa (148% enhancement).
Figure 7b illustrates the hysteretic behavior through force–displacement loops. Softer particles (5 GPa) exhibited reduced peak forces (0.29 N) with deeper penetrations, producing quasi-horizontal hysteresis patterns. Conversely, stiffer configurations (100 GPa) generated vertically oriented loops with 0.72 N peak forces and shallower penetrations, reflecting energy dissipation through elastic rebound rather than plastic deformation.
The quantitative relationships in Figure 7c–e provide the following evidence:
- The maximum penetration depth decreases nonlinearly with the elastic modulus, showing a strong negative correlation (R2 = 0.98 for exponential fit);
- The contact duration shows inverse proportionality to material stiffness;
- The peak impact force demonstrates a nonlinear ascending trend with the elastic modulus, achieving a 167% increase from 5 GPa to 100 GPa.
These findings substantiate the need to employ upper-bound elastic modulus values (recommended ≥ 80 GPa) in safety-critical structural analyses to account for worst-case impact scenarios.
3.3.6. Influence of Poisson’s Ratio
In this parametric study, the Poisson’s ratio of sand particles was varied from 0.1 to 0.4, with increments of 0.05. The computational results are presented in Figure 8. Figure 8a displays the time history curves of the impact force; Figure 8b shows the hysteresis loops; and Figure 8c–e, respectively, illustrate the effects of Poisson’s ratio on impact deformation, pounding force and contact time.
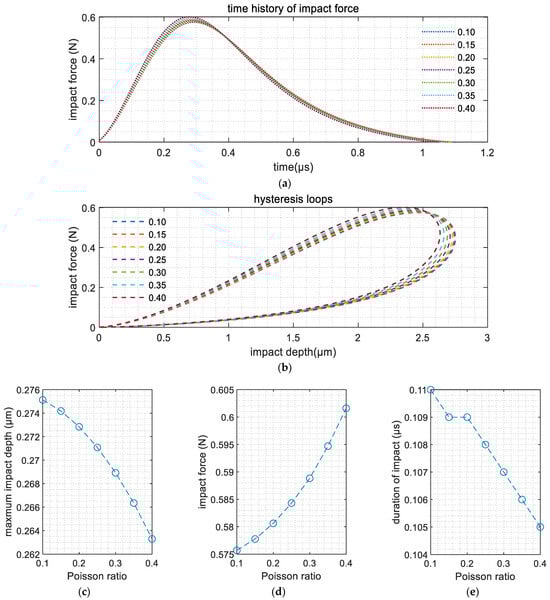
Figure 8.
Influence of Poisson’s ratio: (a) time history of impact force; (b) hysteresis loops; (c) maximum impact depth; (d) maximum impact force; (e) duration of impact.
The results presented in Figure 8c–e indicate that the penetration depth and contact duration exhibit a decreasing trend with an increasing Poisson’s ratio, whereas the impact force shows an increasing trend. However, the variations observed in Figure 8a,b demonstrate that these effects remained marginal in both dynamic force evolution and energy dissipation characteristics.
It is important to acknowledge that the Hertz contact theory, while providing a robust foundation for modeling elastic collisions, makes certain simplifications that may not fully capture the complex dynamics involved in wind–sand interactions. For instance, the Hertz theory assumes perfectly elastic and isotropic materials, which may not always hold true in practice, especially for particles with irregular shapes or heterogeneous material properties. Moreover, in extreme wind–sand conditions, such as those encountered during severe sandstorms, the high impact velocities and sand particle concentrations can lead to nonlinear and transient phenomena that are difficult to capture accurately within the Hertzian framework. These conditions may introduce potential biases in the calculated impact forces and deformation depths, as the Hertz theory is primarily designed for quasi-static or low-velocity impacts.
4. Time-Domain Analysis
4.1. Numerical Model
Based on the findings presented in Section 3 and Section 6, a time-domain analysis was conducted to investigate the response under wind and blown-sand loads. The prototype structure was an SZ27104J tangent tower with a height of 123.6 m and a width of 24.48 m. Figure 9 shows the original shape and the first three modal shapes of the transmission tower. The first three order frequencies are 0.647 Hz, 0.657 Hz and 0.684 Hz. It can be seen that the first-order modal shape is torsion; the second-order modal shape is bending in the cross-line direction and the third-order modal shape is bending in the longitudinal direction. The tower’s structural framework is primarily composed of L-shaped angle steel and circular steel tubes fabricated from Q235 and Q345 steel grades. The material parameters are displayed in Table 4.
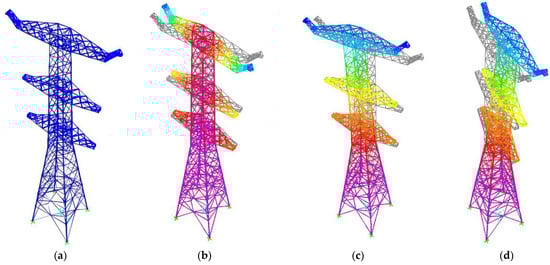
Figure 9.
Numerical model: (a) undeformed shape; (b) 1st order; (c) 2nd order; (d) 3rd order.
Table 4.
Mechanical properties of Q235 and Q345 steel.
In this study, the overhead ground wire and conductors are modeled using cable elements. Figure 10 illustrates the three-tower–four-span system. Figure 11 shows the first-order modal shape of the power transmission line system. Before time-domain analysis, an initial shape-finding of the conductors and ground wires was conducted, with geometric nonlinearity and P-delta effect taken into consideration.
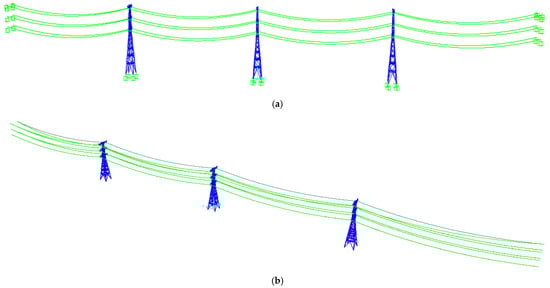
Figure 10.
Numerical model of the tower-line system: (a) original shape; (b) first-order modal shape.
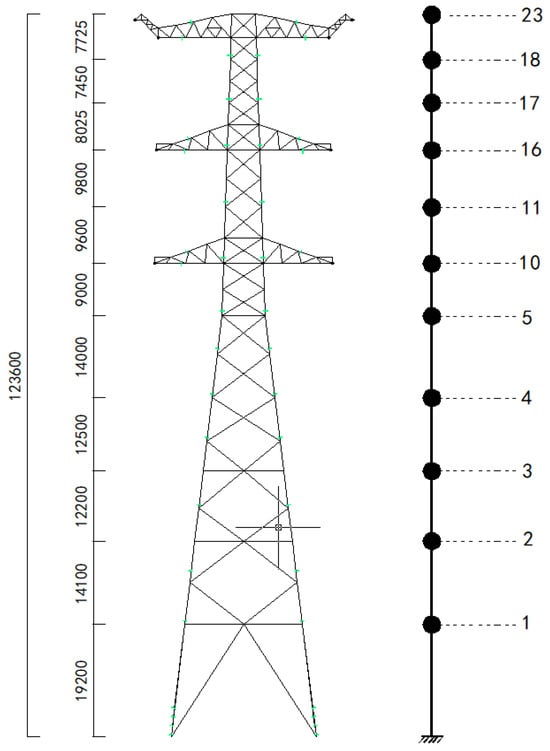
Figure 11.
Points to simulate wind loads.
4.2. Wind Load Simulation
The wind load simulation process involved two primary components: mean wind and fluctuating wind. The mean wind velocity profile was established using the power law formula, and the velocity at a specific height was calculated as
where denotes the 10 min average wind velocity at a reference height of 10 m, and represents the terrain-dependent roughness coefficient. For fluctuating wind conditions, the Kaimal spectrum was adopted to characterize the energy distribution across frequencies, incorporating spatial coherence to model turbulence correlations between different points. The harmonic superposition method was then applied to generate spatially and temporally correlated fluctuating wind velocity time histories. Details of this method can be found in the referenced study [11].
With the wind speed and projection area of a specific point, the wind load can be calculated as
where denotes the wind load; is the shape coefficient of the structural members, which is set to 1.3; the function denotes the wind speed; and is the projection area of structural members in the direction of wind.
In this study, the power transmission tower was divided into 23 points (Figure 11) to simulate the time history of the wind speed and the wind load. Table 5 provides a summary of the locations and projection areas of these points. Figure 12 illustrates the wind speed at Point 23 of the tower when .
Table 5.
Height and projection area of the points used to simulate wind loads.
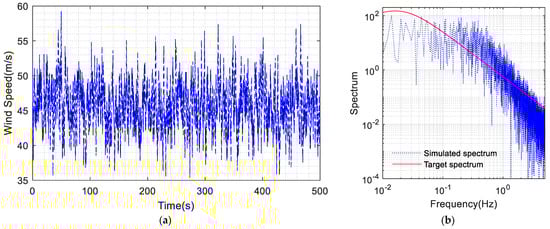
Figure 12.
Simulated wind speed: (a) time history at Point 23 of the tower and (b) comparison of the simulated spectrum and the target spectrum.
4.3. Simulation of Blown Sand Load
The wind–sand load is defined as the superposition of the wind load and the impact load between sand particles and the structural members,
where is the pure wind load. The sand load, , is calculated by multiplying the force exerted by a single sand particle by the number of sand particles per unit volume, ,
where is the projection area of the structural members in the direction of wind; is the floating sand density calculated using Equation (2); is the wind speed; is the mass ratio of the sand particles (as listed in Table 1); is the radius of the sand particle; and τ denotes the collision duration. Equations (18)–(20) provide an engineering-applicable computational method for the planning, design, and safety checking of transmission lines in wind–sand regions. Those equations can be further extended to other structural forms, such as reinforced concrete structures.
4.4. Time-Domain Response
Figure 13, Figure 14 and Figure 15 summarize the response under pure wind and blown sand loads. Figure 13 presents the time history of the displacement at the top of the tower. It is evident that as the density of floating sand increased, the displacement at the top of the tower also increased. A similar trend can be observed in Figure 14, which illustrates the acceleration at the top of the tower. The results indicate that the higher sand density led to greater acceleration, further emphasizing the impact of wind–sand conditions on the tower’s dynamic behavior.
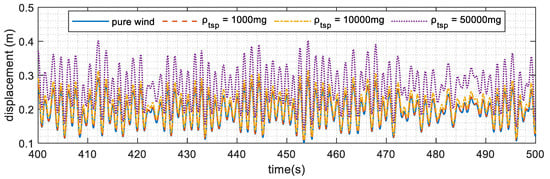
Figure 13.
Time history of displacement at Node 23.
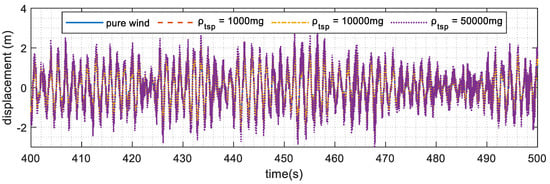
Figure 14.
Time history of acceleration at Node 23.
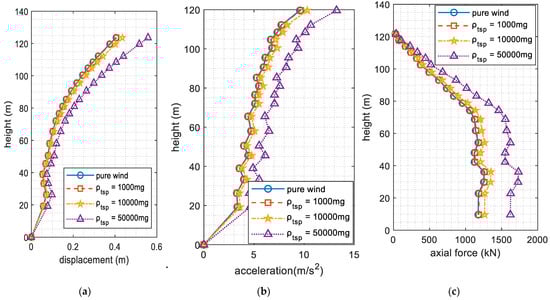
Figure 15.
Envelope of structural response along the height of the tower: (a) envelope of displacement; (b) envelope of acceleration; (c) envelope of axial force.
Figure 15 displays the maximum displacement, acceleration, and axial force in the form of an envelope. The data clearly demonstrate that the presence of floating sand particles amplified the structural response across all sections of the tower. This finding suggests that the wind–sand loads significantly influenced the tower’s performance, leading to increased displacements, accelerations, and axial forces compared to pure wind conditions.
5. Reliability Analysis
In Section 4, the time-domain responses of the overhead tower were compared. However, these results still fall within the deterministic domain. The probability density evolution theory can be utilized to consider the uncertainties and calculate the reliability of the tower.
The evolution equation of the system’s probability density can be expressed as follows:
In the above equation, denotes the probability density of the structural response when the random variable takes the value . is a function of time t. When has a deterministic initial value that is independent of the random vector , the initial condition of the probability density evolution equation is
where denotes the Dirac delta function, and is the joint probability density function of . By solving the aforementioned probability density evolution Equation (21), the probability density function of can be obtained. The probability density evolution equation can be solved using the TVD (total variation diminishing) scheme. Figure 16 illustrates the probability density function (PDF) of displacement at the top of the power transmission tower, calculated using the probability density evolution method (PDEM).
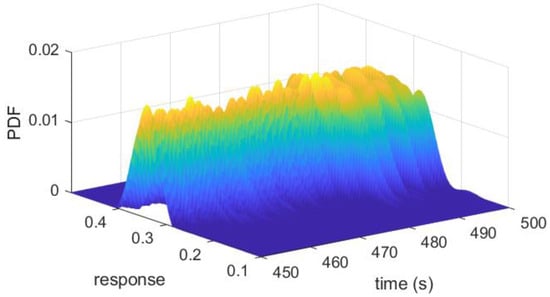
Figure 16.
Probability density function of tower tip.
Figure 17 illustrates the evolution of system reliability, quantified using the probability density evolution method (PDEM), with a particular focus on the interactive effects between the atmospheric sand concentrations and the structural performance. The reliability index , defined as the ratio of structural capacity to demand variability, exhibits a distinct nonlinear downward trend as the mass concentration of suspended sand particles increases from 0 to 100,000 mg/m3. Under pure wind loading conditions (0 mg/m3), the structure demonstrated high reliability with = 5.37, corresponding to an annual failure probability of 3.96 × 10⁻⁸. A critical threshold occurred at 10,000 mg/m3, where initiated significant degradation. At the extreme concentration of 100,000 mg/m3 (typical for severe sandstorms), decreased to 3.37, translating to a four-orders-of-magnitude increase in failure probability (3.75 × 10⁻⁴).
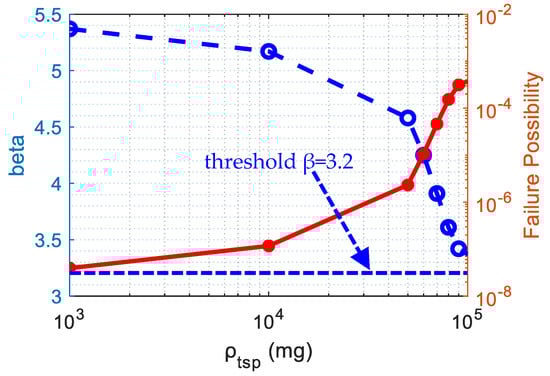
Figure 17.
Reliability and failure possibility.
6. Conclusions
In this study, we investigated the wind–sand-induced vibration of a transmission tower using a refined Hertz impact force model. We have addressed the limitations of existing models, which often assume instantaneous collisions between sand particles and structural surfaces, neglecting the duration of impact and material property variability. By incorporating Hertz contact theory, the proposed model provides a more accurate simulation of sand–structure interactions, accounting for energy dissipation and transient contact mechanics. The key findings and contributions of this study are summarized as follows:
- (1)
- The proposed Hertz contact model successfully simulated the impact behavior, capturing the duration of impact and energy dissipation during collisions. The results demonstrate that the impact force, deformation depth, and collision contact time were significantly influenced by the mechanical properties of the sand particles and the wind speed. This factor represents a significant improvement over traditional momentum-based approaches, which fail to account for the finite duration of impact processes;
- (2)
- The parametric study results reveal that the wind speed, sand particle density, and elastic modulus had substantial effects on the impact process. Higher wind speeds and sand particle densities led to increased peak impact forces and deeper penetration depths, whereas higher elastic moduli resulted in greater energy dissipation through elastic rebound rather than plastic deformation. Notably, the peak impact force increased by up to 66.7% with higher sand density and by 148% with higher elastic modulus, highlighting the importance of considering these parameters in structural design;
- (3)
- Using the developed model, we simulated the dynamic behavior of a power transmission tower subjected to combined wind and sand loads. The simulations revealed that the interaction between wind and airborne sand particles amplified structural responses compared to wind-only scenarios. Specifically, key metrics such as tower-top displacements, acceleration amplitudes, and internal axial forces in primary structural elements exhibited substantial increases. Under conditions of elevated sand density, for example, the peak displacement at the tower apex rose by 28%, highlighting the critical importance of accounting for wind–sand coupling effects in both the design phase and safety assessments of transmission towers, especially in regions prone to sandstorms;
- (4)
- The above findings emphasize the need to update design codes to account for wind–sand interactions, as the current standards often overlook these effects. This study provides a robust framework for simulating sand–steel impacts, offering valuable guidance for overhead tower-line system design in arid environments;
- (5)
- While this study advances the understanding of wind–sand interactions through a refined Hertzian contact model, certain limitations warrant further investigation. The current framework assumes uniform particle impacts and does not fully account for spatially varying sediment transport patterns or polydisperse particle size distributions, which may influence localized stress concentrations. Additionally, material nonlinearity under cyclic loading and soil–structure interaction effects were not explicitly modeled, though these factors are critical for long-term fatigue assessment and foundation stability in extreme conditions. Future work will integrate field-measured sediment data (e.g., height-dependent sand density distributions) and probabilistic fatigue analysis to address these gaps, further enhancing the model’s predictive accuracy for real-world applications.
In conclusion, this study enhances our understanding of blown sand load on overhead towers and provides a comprehensive framework for simulating sand–structure interactions using Hertz contact theory. Systematic investigations of irregular particle morphologies and polydispersed size distributions, along with their coupled effects on impact dynamics, will be prioritized in subsequent studies to enhance the model’s predictive capabilities for natural granular systems.
Author Contributions
Conceptualization, P.Z., X.M. and J.L. (Jun Lu); methodology, P.Z. and L.Z.; software, L.Z.; validation, J.L. (Jun Lu), J.L. (Jin Li) and P.Z.; formal analysis, J.L. (Jun Lu), X.M. and W.T.; investigation, L.Z. and P.Z.; resources, J.L. (Jun Lu), X.M. and W.T.; data curation, J.L. (Jun Lu), X.M. and J.L. (Jin Li); writing—original draft preparation, J.L. (Jun Lu), J.L. (Jin Li) and P.Z.; writing—review and editing, J.L. (Jun Lu), J.L. (Jin Li) and P.Z.; visualization, L.Z. and P.Z.; supervision, J.L. (Jun Lu), J.L. (Jin Li) and P.Z.; project administration, J.L. (Jun Lu) and J.L. (Jin Li); funding acquisition, J.L. (Jun Lu) and J.L. (Jin Li). All authors have read and agreed to the published version of the manuscript.
Funding
This work was supported by the State Grid science and technology project under Grant No. 5200-202356681A-3-3-JC. This support is greatly appreciated.
Data Availability Statement
The data are contained within the article.
Conflicts of Interest
J.L. (Jun Lu), J.L. (Jin Li), X.M., W.T. and L.Z. are employed by the State Grid Economic and Technological Research Institute Co., Ltd. The remaining authors declare that the research was conducted in the absence of any commercial or financial relationships that could be construed as a potential conflict of interest. The authors declare that this study received funding from the State Grid. The funder was not involved in the study design, the collection, analysis, and interpretation of the data, the writing of this article, or the decision to submit it for publication.
Abbreviations
The following abbreviations are used in this manuscript:
| ACSR | aluminum conductor steel-reinforced |
| CWE | computational wind engineering |
| DPM | discrete phase model |
| PV | photovoltaic |
| probability density function | |
| PDEM | probability density evolution method |
| SMM | sand mitigation measure |
| TSP | traveling sand particle |
| TVD | total variation diminishing |
Nomenclature
| Symbol | Description | Unit |
| Floating sand density | kg/m3 | |
| Wind speed | m/s | |
| Contact force | N | |
| Collision stiffness | N/m1.5 | |
| Deformation of the two colliding bodies | m | |
| Relative velocity of the two colliding objects | m/s | |
| Hysteresis damping factor | N·s/m | |
| m | Impact parameter | -- |
| n | Power exponent parameter | -- |
| , | Radius of colliding bodies | m |
| , | Elastic modulus | N/m2 |
| , | Poisson’s ratio | -- |
| cr | Newton’s coefficient of restitution | -- |
| Average wind velocity at a height of 10 m | m/s | |
| Terrain-dependent roughness coefficient | -- | |
| Wind load | N | |
| Shape coefficient of the structural members | -- | |
| The projection area of structural members | m2 | |
| Impact force exerted by a single sand particle | N | |
| Number of sand particles per unit volume | -- | |
| Mass density | kg/m3 | |
| Duration of impact | s | |
| Radius of the sand particle | m | |
| Probability density | -- | |
| Joint probability density function of | -- |
References
- Pambudi, N.A.; Ulfa, D.K.; Nanda, I.R.; Gandidi, I.M.; Wiyono, A.; Biddinika, M.K.; Rudiyanto, B.; Saw, L.H. The Future of Wind Power Plants in Indonesia: Potential, Challenges, and Policies. Sustainability 2025, 17, 1312. [Google Scholar] [CrossRef]
- Biswas, S.; Chen, J.S. Power Coefficient for Large Wind Turbines Considering Wind Gradient Along Height. Energies 2025, 18, 740. [Google Scholar] [CrossRef]
- Moustafa, A.M.; Shehata, A.S.; Shehata, A.I.; Hanafy, A.A. Reuse of Abandoned oil and gas wells for Power generation in Western Dessert and Gulf of Suez fields of Egypt. Energy Rep. 2022, 8, 1349–1360. [Google Scholar] [CrossRef]
- Wiesinger, F.; Sutter, F.; Fernández-García, A.; Wette, J.; Wolfertstetter, F.; Hanrieder, N.; Schmücker, M.; Pitz-Paal, R. Sandstorm erosion on solar reflectors: Highly realistic modeling of artificial aging tests based on advanced site assessment. Appl. Energy 2020, 268, 114925. [Google Scholar] [CrossRef]
- Kelly, J.; Vogel, C.; Willden, R. Impact and mitigation of blade surface roughness effects on wind turbine performance. Wind Energy 2022, 25, 660–677. [Google Scholar] [CrossRef]
- Han, F.; Wang, C.; Liu, Z.; Li, L.; Yin, W. Study on Sand-Accumulation Changes of Highway and Formation Mechanism of Sand Damage in Drifting Dunes Areas. Appl. Sci. 2022, 12, 10184. [Google Scholar] [CrossRef]
- Darvishi Boloorani, A.; Soleimani, M.; Neysani Samany, N.; Bakhtiari, M.; Qareqani, M.; Papi, R.; Mirzaei, S. Assessment of Rural Vulnerability to Sand and Dust Storms in Iran. Atmosphere 2023, 14, 281. [Google Scholar] [CrossRef]
- Desai, U.; Rathore, S.; Singh, A. Exploration of degradation pathways resulting in reduction in volume resistivity in photovoltaic backsheets under sand erosion and aging in desert conditions. Sol. Energy 2022, 236, 860–869. [Google Scholar] [CrossRef]
- Hao, Y.; Feng, Y.; Fan, J. Experimental study into erosion damage mechanism of concrete materials in a wind-blown sand environment. Constr. Build. Mater. 2016, 111, 662–670. [Google Scholar] [CrossRef]
- Raffaele, L.; van Beeck, J.; Bruno, L. Wind-sand tunnel testing of surface-mounted obstacles: Similarity requirements and a case study on a Sand Mitigation Measure. J. Wind Eng. Ind. Aerodyn. 2021, 214, 104653. [Google Scholar] [CrossRef]
- Zhang, Z.; Liu, J.; Shao, K.; Zhang, P. Analysis of Wind-Sand-Load-Induced Dynamic Response of Transmission Tower-Line Systems. Shock Vib. 2022, 2022, 1–12. [Google Scholar] [CrossRef]
- Li, F.; Yuan, B.; Dai, J. Dynamic characteristics of dry-type transmission tower under wind-sand load. J. Phys. Conf. Ser. 2024, 2808, 12011. [Google Scholar] [CrossRef]
- Shen, W.; Zhu, R.; Xue, G.; Hu, A.; Jiang, H.; Yuan, B. Static Analysis and Failure Mode Calculation of the Cup-type Tower under the Sandstorm Weather. In Proceedings of the 2023 8th Asia Conference on Power and Electrical Engineering (ACPEE), Tianjin, China, 14–16 April 2023; pp. 2774–2778. [Google Scholar]
- Paz, C.; Suárez, E.; Gil, C.; Concheiro, M. Numerical study of the impact of windblown sand particles on a high-speed train. J. Wind Eng. Ind. Aerodyn. 2015, 145, 87–93. [Google Scholar] [CrossRef]
- Gageik, M.; Rodriguez Ahlert, C.; Coste, N.; Raffaele, L. A multi-scale gap-bridging CWE approach to windblown sand action on critical infrastructures: Modelling framework and case study on a high-speed railway line. J. Wind Eng. Ind. Aerodyn. 2024, 249, 105722. [Google Scholar] [CrossRef]
- Hunt, K.H.; Crossley, F.R.E. Coefficient of restitution interpreted as damping in vibroimpact. J. Appl. Mech. 1975, 42, 440–445. [Google Scholar] [CrossRef]
- Lankarani, H.M.; Nikravesh, P.E. Continuous contact force models for impact analysis in multibody systems. Nonlinear Dyn. 1994, 5, 193–207. [Google Scholar] [CrossRef]
- Flores, P.; Machado, M.; Silva, M.T.; Martins, J.M. On the continuous contact force models for soft materials in multibody dynamics. Multibody Syst. Dyn. 2011, 25, 357–375. [Google Scholar] [CrossRef]
- Lee, T.W.; Wang, A.C. On The Dynamics of Intermittent-Motion Mechanisms. Part 1: Dynamic Model and Response. J. Mech. Des. 1983, 105, 534–540. [Google Scholar] [CrossRef]
- Herbert, R.G.; Mcwhannell, D.C. Shape and frequency composition of pulses from an impact pair. J. Eng. Ind. 1977, 99, 513–518. [Google Scholar] [CrossRef]
- Hu, G.; Hu, Z.; Jian, B.; Liu, L.; Wan, H. On the Determination of the Damping Coefficient of Non-linear Spring-dashpot System to Model Hertz Contact for Simulation by Discrete Element Method. In Proceedings of the Wase International Conference on Information Engineering, Beidai, China, 14–15 August 2010; pp. 984–988. [Google Scholar]
- Qin, Z.Y.; Lu, Q.S. Analysis of impact process model based on restitution coefficient. J. Dyn. Control 2006, 4, 294–298. [Google Scholar]
- Zhao, P.; Liu, J.; Li, Y.; Wu, C.; Li, Y. A spring-damping contact force model considering normal friction for impact analysis. Nonlinear Dyn. 2021, 105, 1437–1457. [Google Scholar] [CrossRef]
Disclaimer/Publisher’s Note: The statements, opinions and data contained in all publications are solely those of the individual author(s) and contributor(s) and not of MDPI and/or the editor(s). MDPI and/or the editor(s) disclaim responsibility for any injury to people or property resulting from any ideas, methods, instructions or products referred to in the content. |
© 2025 by the authors. Licensee MDPI, Basel, Switzerland. This article is an open access article distributed under the terms and conditions of the Creative Commons Attribution (CC BY) license (https://creativecommons.org/licenses/by/4.0/).