Abstract
In response to the stalling fault of the solar array drive assembly (SADA) in an in-orbit MEO satellite, an analysis and research on the energy balance algorithm are conducted. This is performed under the continuous changes in the light period, shadow period, and the incident angle of the solar panels. An output energy model of the solar panels is presented. It is proven that this model is a continuous function, and the optimal stalling angle for energy output is deduced. By simulating and calculating the energy output under different stalling angles and taking into account the on-orbit performance degradation of the solar cell array, the energy output curve within one orbital period is obtained, which provides support for the on-orbit operation and maintenance of the satellite. Moreover, on-orbit verification was carried out in the case of a stalling fault of the -Y-wing SADA of a certain MEO-orbiting satellite.
1. Introduction
The solar array drive assembly (SADA) is one of the important components of the satellite energy system, and the SADA generally consists of the controller circuit box (SADE), +Y-wing solar array drive mechanism (SADM_A), −Y-wing solar array drive mechanism (SADM_B), etc. [1]. Its main role is to control and manage to ensure that the solar wing is pointed to the sun, to achieve the maximum efficiency of the photovoltaic conversion, and thus provide sufficient energy for the load of the whole satellite [2,3].
According to the domestic and international statistics of faults occurring during on-orbit operation, it is found that the proportion of energy system faults in each subsystem is the second highest, of which the solar array output abnormality faults accounted for about 25%, and most of them are SADA drive mechanism faults. From 1998 to 2008, 117 satellite solar array anomalies were recorded in Airclaim’s Ascent, 12 of which directly resulted in total satellite failures [4]. Also, according to the Introductory Comment of the NASA Spacecraft Anomalies and Failures Workshop in 2023 [4], 37% of abnormalities in spacecrafts come from solar arrays [5,6]. Therefore, the normal operation of SADA is of great significance to the satellite load operation and the safety of satellite platform.
At present, there are many methods to analyze the balance of satellite energy system at home and abroad, but there is no energy balance analysis for the failure of a SADA in orbit, which leads to the failure of the solar wing to rotate, and there is no analysis of the angle for optimal energy of the SADA stalling situation. The authors of [7] analyze the energy balance of the satellite in the case of normal SADA drive, and the authors of [8] consider the energy balance analysis of SADA bias at a certain angle. The authors of [9] conducted a state analysis and energy assessment of the energy when the solar cell array was damaged. In this paper, we analyze the energy situation in the case of blockage of SADA in the -Y-wing for a satellite with double Y-wing configuration in an MEO and give the equation of the output energy of this solar wing. The energy-optimized stalling angle is derived by taking a partial derivation of the stalling angle. In case of failure of the SADA of this wing, energy optimization is achieved by controlling the SADA to stall to this optimal angle through emergency disposal double-winding power-up. In terms of fault-tolerant energy strategies, the energy management method based on adaptive control proposed in this paper effectively improves the fault-tolerant ability of the satellite system by controlling the solar array drive mechanism (SADM) to stay at an angle with optimal energy. In terms of solar tracking optimization, the optimal energy can be achieved through the energy model algorithm proposed in this paper.
2. Methodology
The electrical zero position of the SADA in the initial launch phase of an MEOing satellite coincides with the mechanical zero position in a horizontal direction (i.e., Z-direction). When the solar array is unfolded in place and an effective unfolding lock signal is given, the on-board computer sends out relevant programmed commands to execute the emergency mode to return to the electrical zero position with an angular velocity of about 0.3°/s. Taking the zero indication signal given as a benchmark, it is easy for SADA to accurately calculate the absolute rotational angle amount when executing other modes to be informed of the pointing position of the solar array surface.
According to the satellite in-orbit attitude operation state diagram, the orbital coordinate system sun vector is , and the target yaw angle is when the satellite is running in yaw maneuver mode.
are the projections of the orbital system sun vector in x/y/z direction, respectively. Then, the satellite body coordinate system sun vector is as shown in Equation (1) [10]:
The target rotation angle is defined as the angle between the projection of the sun in the XOZ plane and the SADA electrical zero position (i.e., the +Z axis), which is positive in the clockwise direction and in the range [0, 2π], and the +Y and −Y solar wing target rotation angle is as shown in Equation (2) [10]:
Sgn(x) is the sign function, and its definition is as shown in Equation (3):
Through the target rotation angle, the corresponding deviation angle was calculated, and different deviation angles set different working modes of SADA, so as to drive and control the solar wing to the sun. When the satellite switches from sun orientation to stable earth orientation, stable earth orientation to yaw maneuver, or attitude adjustment after orbit control to yaw maneuver, the large-angle rotation increment mode of SADA achieves the tracking of the solar wing to the sun with an angular velocity of about 0.3°/s. When the satellite is working in stable ground or yaw maneuver, which is the steady-state operation mode of the satellite, solar wing is synchronously tracked to the sun by SADA according to the rotation of the solar vector angle, and SADA operates in the cruise mode with angular velocity of about 0.0042°/s. The angle between the direction of the incident sunlight and normal angle of the solar array, namely, the solar incidence angle, is affected by the angle between the sunlight vector and satellite orbit plane (referred to as β), and so on [11].
The on-orbit satellite solar angle is set to β (∣β∣ < π/2), according to the on-orbit satellite design, the positive Y-wing solar wing target rotation angle varies between ∣β∣~(π − ∣β∣), and the −Y-wing SADM target rotation angle varies between (π + ∣β∣)~(2π − ∣β∣). The solar incidence angle θ of −Y solar wing varies in the following range when the −Y-wing is stuck at γ angle, as shown in Equation (4):
where θ ∈ [−π/2, π/2], beyond this interval, the −Y solar wing have no incoming light, and the current is 0 A. The stalling angle γ ∈ [π + ∣β∣~2π − ∣β∣]. θ changes with an angular velocity ω of about 0.0042°/s, and the specific value is related to the angle of the sun. The principle is to keep one orbital period; −Y solar wing rotates one full rotation. The average value of angular velocity is calculated below. The −Y solar wing output energy is positively correlated with as shown in Equations (5)–(8):
Let ; .
In the above equation, T is the orbital period of 13 h, is the start time of an orbital period, t is the end time of an orbital period, and is the output current of the solar wing in the Nth year of on-orbit operation positive to the sun.
Since the -Y solar wing SADM target rotation angle is in the range of (π + ∣β∣)~(2π − ∣β∣), the interval span is [π − 2∣β∣]. When ∣β∣ < , the interval span is more than π/2; then, θ may exceed [−π/2, π/2] for the γ angle of this interval. Therefore, for the energy case of∣β∣ < π/4, it is necessary to calculate the energy by intervals, as shown in Equation (9):
which can lead to the following, as shown in Equation (10):
The energy model is shown in Figure 1:
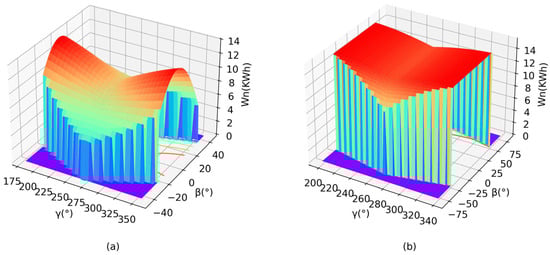
Figure 1.
Diagram of the output energy model of the Y-wing solar array: (a) |β| less than 45°, (b) |β| more than 45°.
To find the maximum value of , first determine the continuity of the function as shown in Equations (11) and (12):
Thus, it is proven that is continuous at the two breakpoints. Next, we prove that the function is derivable, as shown in Equation (13).
Due to the following,
Therefore, we obtain the following: the derivative of the function is also continuous, so it can be proved that the function is continuous and derivable [12], and, at the same time, the function is sinusoidal for the γ variable and lies in the portion of function that is greater than 0 and thus is concave. And the concave function maximum occurs at the boundary point or the stationary point.
In order to find the energy-optimal stalling angle, let , and we obtain Equation (14):
When ∣β∣ < π/4, the maximum values of the energy in each of the three γ intervals are shown in Equation (15):
When ∣β∣ < π/4, 2cosβ ≥ 1 + cos(2β). Therefore, when γ = 3π/2, the energy is maximum, and the maximum value is
When ∣β∣ > π/4, the −Y-wing SADM target rotation angle interval span is less than π/2. At this point, θ ∈ [−π/2, π/2]. We can obtain Equations (16)–(18):
Let , and we obtain: .
At this point, the maximum energy output .
To summarize, regardless of the angle of β, the solar wing output energy is maximum when the stalling angle γ is 3π/2. The maximum energy is as follows:
3. Results
3.1. Analysis of the Optimal Stalling Angle of the Y-Wing Solar Panel for Energy
When β is 0 degrees, this is when the satellite is deepest in shadow and has the greatest energy demand. The corresponding energy equation at this time is shown as Equations (19) and (20):
The graph of is shown in Figure 2:
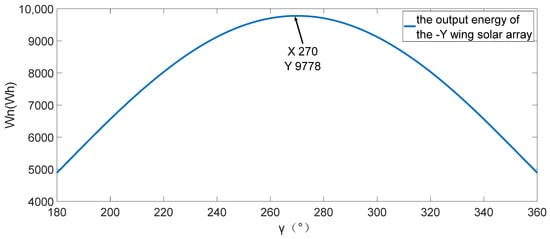
Figure 2.
Diagram of the output energy of the −Y-wing solar array when beta is equal to 0.
The obtained above does not take into account the case of no output current of the solar wing in the case of shadow period. Through the simulation of STK (12.6) software, it is known that the deepest moment of shadow entry occurs in the interval when the output current of the −Y solar wing decreases to 0. In this interval, the -Y solar wing decreases about 153 Wh on the basis of . Let = 42.2 V and = 28 A, and the load current is 35 A. According to the previous section, the situation of one orbital cycle at the deepest moment of shadow entry can be obtained:
The energy from −Y solar wing: w1 = = 9.6 kWh.
The energy from +Y solar wing: w2 = = 14 kWh.
Payload consuming energy: Load = 35 A · 42.2 · T = 19 kWh.
Battery discharge energy during 1 h of earth shadowing:
w-dc = 35 A · 42.2 · 1/η = 1.6 KWh (η is discharge efficiency, 90%).
Then, the windsurfing redundancy energy ws3r = w1+ w2-load = 4.6 KWh.
Then, all available charging energies of solar panels are as follows: w-ec-all = ws3r + w-dc = 6.2 kWh.
Due to the limitations of the battery charging module, the solar wing current cannot be used for charging after a certain peak and is shunted to ground. Therefore, w-e-c-all cannot be fully used to charge the battery. The energy available for charging after considering the current limitation of the solar wing is shown in Section 3.2 for details, which is a more accurate calculation. The results above are derived from the formula. For example, the rotational angular velocity of the solar wing is adopted as the mean value, and the earth shadow time is strictly determined as 1 h. In the actual STK orbit simulation results, is a variable, SADA runs in cruise mode with an angular velocity of about 0.0042°/s. The solar wing is synchronized to track the sun through SADA according to the sun vector angular rotation control. The shadow period is not strictly 1 h either. So there will be a slight difference. But both the data results are very close and accurate.
Based on the satellite orbits, the trend of the orbital solar angle β for the next 10 years was fitted. This is shown in Figure 3. When the absolute value of the orbital solar angle β is less than 13 degrees, the satellite enters into the shadow period. When β is 0, the satellite enters into the deepest shadow, and the longest shadow duration is about 1 h. When the stalling is at the angles of and , the simulations of the trend of the solar incidence angle of the −Y solar wing θ over the next year are shown in Figure 4 and Figure 5.
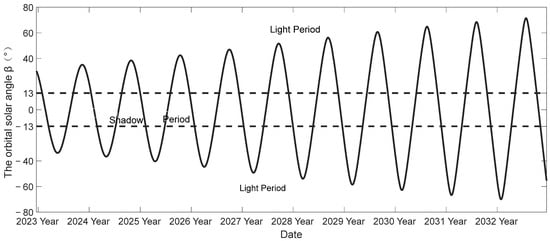
Figure 3.
The annual trend of β angle.
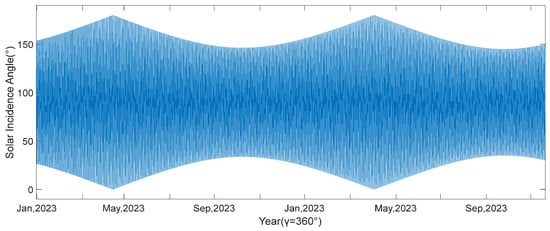
Figure 4.
−Y-wing solar incidence angle yearly variation .
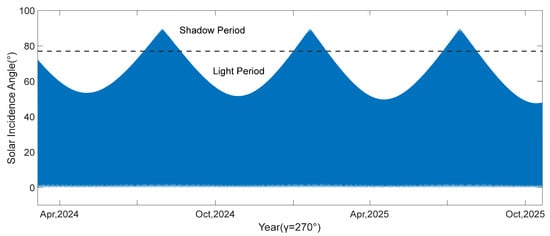
Figure 5.
−Y-wing solar incidence angle year variation .
The Discussion Section carries out the energy adaptivity algorithm calculation and analysis through the trend of solar incidence angle .
3.2. In-Orbit Control Strategy Validation and Realization
In the 5th year of an MEOing satellite in orbit, the −Y-wing SADA was stalled, which was made to stall at 270° by double-winding energization. The actual telemetry results in orbit were analyzed as follows: the satellite telemetry data are sent to the ground station through signals, and the ground station analyzes this telemetry data to obtain the following analysis data: when the satellite is within the territory, the telemetry data are directly transmitted to the ground station via the measurement and control channel. When the satellite is outside the territory, the telemetry data are routed to a node satellite within the territory through inter-satellite link transmission, and, then, the node satellite sends it down to the ground measurement and control station. The data are transmitted according to a certain format protocol, and the ground finally obtains the required original data values by decoding the data according to the protocol. Transmitting data from outside the territory via inter-satellite links can ensure that the ground station always receives the satellite telemetry data, thus ensuring the continuity of the data. In the process of telemetry data handling, we first use statistical methods to filter out outliers. Subsequently, we apply transformations to the filtered raw data using predetermined coefficient factors.
The summer solstice of 2024 is the satellite light season, and the output current of solar wing is minimized during the summer solstice due to the influence of the sun–earth distance. The orbital solar angle β on-orbit is shown in Figure 6. The tracking diagram of the SADA target rotation angle on orbit is shown in Figure 7. It can be seen that the +Y-wing solar wing SADA target angle varies between in ∣β∣~( − ∣β∣), and the −Y-wing SADM target rotation angle varies between ( + ∣β∣)~( − ∣β∣). The +Y-wing SADA drive is normal, the +Y-wing SADA potentiometer is able to track the target rotation angle in real time, and the solar wing is able to point towards the sun at all times, thus achieving optimal energy output. −Y-wing SADA is blocked, stalled at angle 270°, and cannot track the target rotation angle in real time. It is unable to point towards the sun normally, resulting in a cosine curve decrease in energy.
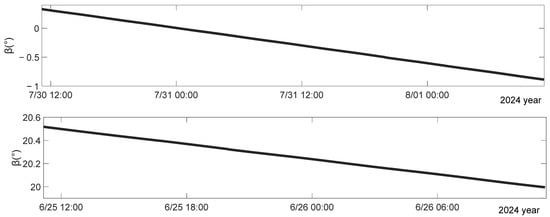
Figure 6.
The variation in the β angle in-orbit.
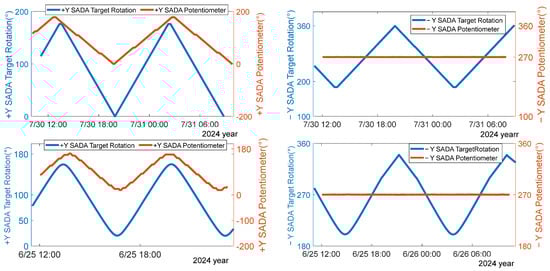
Figure 7.
Tracking diagram of SADA target rotation angles during the shadow and the summer solstice light period in 2024.
The output solar current and load of this satellite are shown in Figure 8, and the battery discharging condition is shown in Figure 9 and Figure 10. From the figures, it can be seen that, when the −Y-wing is stuck at 270°, the satellite battery does not discharge in the light period, as shown in Figure 10. The energy balance in the earth-shadow period: the battery can be fully charged within one orbital cycle, as shown in Figure 9. During one orbital period, the battery discharges twice: one is the deep discharge caused by the shadow, with a maximum discharge depth of about 28%; the other is the shallow discharge generated during the process when the output current of the −Y-wing solar panel decreases to 0 in a cosine manner, w; and one for the shallow discharge generated by the failure of the biplane current to meet the load demand when the −Y-wing solar wing deviated from the target angle at the maximum, with a discharge depth of about 3%. The satellite on-orbit performance is expected to be consistent with the results of the previous simulation analysis. Thus, it indicates that the satellite is in good condition when the −Y-wing SADA is stuck at 270°.
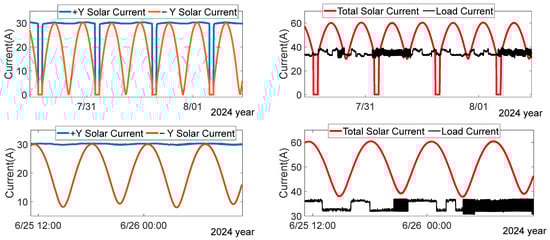
Figure 8.
Diagram of satellite solar panel output current and load.
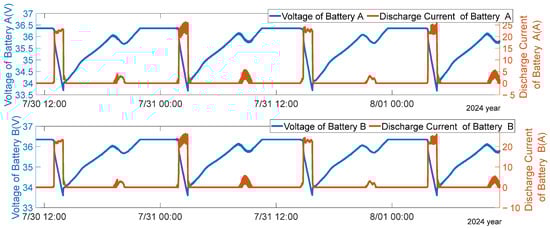
Figure 9.
Diagram of the voltage and discharge current of battery packs A and B during the shadow period in 2024.
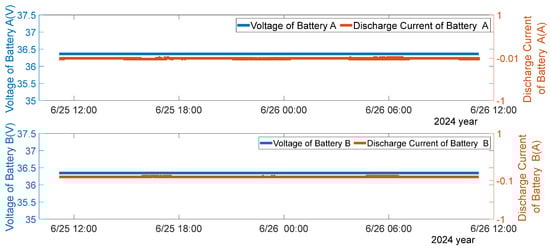
Figure 10.
Diagram of the voltage and discharge current of Battery Packs A and B during the summer solstice light period in 2024.
The comparison between the previous simulation analysis results and the actual on-orbit results is shown in Table 1.

Table 1.
Comparison between simulation and on-orbit results.
As can be seen from Table 1, the energy available for charging on orbit is greater than that in the simulation results. The reasons for this phenomenon are as follows: on the one hand, the simulation results are obtained based on the indicators of the summer solstice at the end of the satellite’s service life. At the end of the satellite life, the energy attenuation of the solar panels is greater than that in 2024. On the other hand, the simulation is set at the moment of the summer solstice, when the sun–earth distance factor is the smallest. The actual on-orbit data were collected on 30th July, and the sun–earth distance factor on that day is better than that during the summer solstice. Based on the above factors, since the actual output of the solar panels is better than the simulation expectations, the energy discharged by the battery has also been correspondingly reduced.
4. Discussion
At present, there are many methods for analyzing the balance of satellite energy systems at home and abroad. However, there is no energy balance analysis for the situation where a certain wing’s SADA fails in orbit, resulting in the inability of the solar panel on that wing to rotate. Nor is there an analysis of the optimal stalling angle for energy in the case of SADA stalling. Moreover, a portion of the abnormal output faults of the solar cell array are SADA drive mechanism faults. When the SADA motor stalls, the on-board energy decreases. At this time, if the satellite’s energy situation can be obtained in a timely manner based on the stalling angle, it is of great significance for the on-orbit disposal in ground operation and maintenance. Ref. [7] analyzed the energy balance of the satellite under the condition of normal SADA drive of the solar panel; Ref. [8] considered the energy balance analysis with a certain SADA bias angle; and Ref. [9] conducted a state analysis and energy assessment of the energy when the solar cell array was damaged [7,8,9]. According to the traditional energy balance method, the three articles consider the possible energy attenuation situation of the solar array at the end of its service life, as well as the energy balance analysis under the conditions of the battery’s discharging and charging when the satellite enters the earth’s shadow and the moon’s shadow. And they briefly introduce the energy situation when the solar panel is biased at a certain angle. However, these articles assume by default that the solar array drive mechanism (SADM) rotates normally. If a certain wing of the SADM gets stuck, the situation of its energy system and the charging and discharging conditions of the battery are not elaborated. In addition, this paper focuses on the energy adaptability issue of Medium Earth Orbit (MEO) satellites. Regarding the unique characteristics of MEOs, such as specific light conditions, orbital periods, and the degradation of the solar cell array caused by particle radiation and ultraviolet radiation in this orbital environment, these have not been comprehensively considered in the cited studies. Finally, our proposed optimal sticking angle of 270° is derived from a combination of in-orbit telemetry data and a refined theoretical model. Previous studies did not explore this specific angle to maintain power balance in the context of satellite energy adaptability. According to Equation (6) in this paper, the energy situation under this working condition can be obtained based on the orbital solar angle and the stalling angle during stalling. If the energy balance within one orbital cycle cannot be achieved, the satellite load should be reduced in advance, and the reduced load power can be calculated based on the energy situation. In the case of the satellite described in this paper, the SADA can be restored to operation by energizing the double windings. However, due to some internal problems of the SADA, the satellite will still experience stalling after the double windings are energized. By using the optimal stalling angle of 270° for the −Y-wing and the optimal energy stalling angle of 90° for the +Y-wing proposed in this paper, the optimized satellite energy can be achieved. Thus, the optimal energy under the SADA stalling condition is realized.
In Section 2, the Methodology Section proposes that the energy is optimal when the −Y-wing SADA is stalled at 270 degrees. However, the energy also shows a linear change corresponding to different orbital solar angles β. Since the target angle of the −Y-wing varies between (π + ∣β∣) and (2π − ∣β∣), when the absolute value of β approaches 90 degrees, the energy situation is the best. But, when β is 0 degrees, the satellite enters the deepest shadow, and, at this time, the energy demand is the greatest. Correspondingly, the output energy of the solar panel is at its lowest, which belongs to the most energy-strained working condition. Therefore, analyzing the energy conditions under this working condition can represent the energy situation of the satellite. This chapter, respectively, analyzes the status overview of this MEOal satellite. And, in response to the energy model proposed in Section 2, a simulation analysis is carried out on the energy situations when the −Y-wing solar panel is stalled at different angles. When conducting the simulation, the performance degradation of the on-orbit satellite solar cell array is taken into account, and the energy situation at the end of the satellite’s lifespan is analyzed. It is proven that the energy is optimal when the stalling angle is 270 degrees.
4.1. Overview of the Satellite Status
The satellite operates in a medium-high MEO with an orbital altitude of 21,528 km, an orbital period T of 13 h, and a maximum earth shadow time of 60 min. The structure of the satellite body is shown in Figure 11. The solar array of the energy system adopts a rigid structural unfolding solar wing, which consists of two solar wings in the +Y and −Y directions, with three panels in each wing (namely, the inner panel, the middle panel, and the outer panel, respectively), and its output power meets the demand of 1477 W of the constant value load. The circuits of each solar panel are brought together on the backside through wires and pass through the isolation diode to the electrical connector and cables on the board. The power and signal of each wing are input to the satellite power control unit through the inter-board cables and electrical connectors and through the SADA on both sides, and, finally, supply and distribute the satellite subsystem modules through the power control unit.
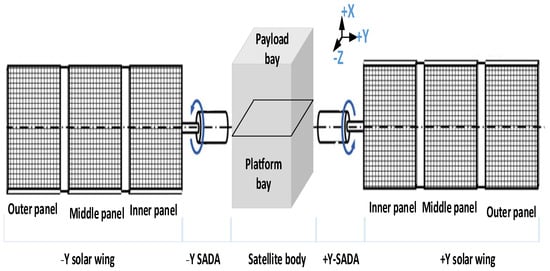
Figure 11.
Schematic diagram of the satellite body structure.
According to different mission scenarios, the satellite is set up in seven working modes, including solar capture mode, minimum safety mode, no-control mode, sun orientation mode, Earth capture mode, stable-to-Earth mode, and orbit control mode, etc. The SADA on-orbit drive control is a fully autonomous control strategy, and the satellite switches between different operating modes autonomously. SADA on orbit has various working modes such as cruise mode, emergency mode, incremental mode, hold mode, and auto-zero mode [10]. The situation of SADA auto-control is shown in Table 2. The SADM is in cruise mode during sun alignment, tracking the sun at a fixed angular velocity, and, due to the prediction of the orbit error, the actual rotation angle will exceed or lag behind the target angle; thus, the energy cannot be optimized. Therefore, it is necessary to control the SADM to switch to the incremental work or holding mode to realize the stable sun alignment of the solar wing and transmit the power generated by the solar battery array to the satellite power controller to ensure the normal supply of satellite energy. The satellite normally operates in the stable-to-ground mode. The main task of this mode is to ensure that the satellite + Z-axis points to the center of the earth, to meet the attitude control accuracy, and, at the same time, implement yaw maneuver and one-dimensional rotation of the solar wing to ensure that the solar wing is aligned with the sun, and the SADA mainly works in the cruise mode and hold mode to meet the thermal control and energy demand of the whole satellite. The satellite flight attitude schematic is shown in Figure 12.
Table 2.
SADA auto-control.
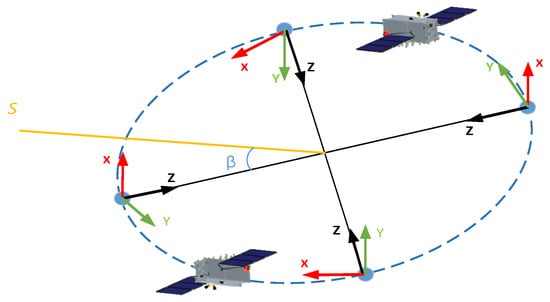
Figure 12.
Diagram of satellite’s in-orbit flight attitude.
In Figure 12, the coordinate system is the satellite body coordinate system. The origin Ob is located at the center of mass of the satellite. The xb-axis is the roll axis, pointing in the forward direction; the yb-axis is the pitch axis, pointing in the negative normal direction of the orbit (the fourth quadrant); the zb-axis is the yaw axis, pointing radially towards the center of the Earth (the first quadrant). Moreover, the xb-, yb-, and zb-axis form a right-handed orthogonal system. The orbital solar angle β is the angle between the orbital plane of the satellite around the Earth and the vector from the satellite pointing towards the Sun.
During the satellite’s steady state flight in orbit, the operating mode is stabilized to the earth. The yaw attitude and sun vector are available during both light and shadow periods, so the satellite performs yaw control according to the sun vector; that is, as described in row 4 of Table 2.
The SADA suffers from a blocked rotation fault, which often manifests itself as a single/biplane wing that cannot rotate freely and is stuck at a certain angle. It is assumed here that the −Y-wing SADA is stuck at a fixed angle γ, which cannot be normally aligned with the sun, the output current of the -Y-wing square array is abnormal, and the power output is abnormal, as shown in Figure 13. At this time, γ is 345°, and the +Y wing SADA is normally rotating, with an normal output current of 32.73 A; the satellite is still in the stable earth working mode. Since the output power of the two-wings cannot meet the satellite load demand, the battery pack goes into the discharge state, and the bus voltage is normal and stable at 42.2 ± 0.2 V, as shown in Figure 13. When the on-orbit SADA motor is blocked, the operation can be resumed by adding power to the double windings. However, the stalling still occurs from time to time. Therefore, it is necessary to analyze the energy-optimized stalled angle and subsequently set the SADA at this angle in orbit, in order to realize the energy optimization.
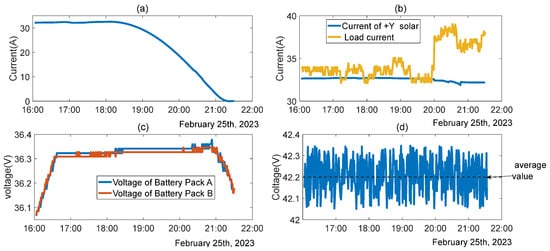
Figure 13.
Energy status under the condition of -Y SADA stall: (a) current of -Y solar, (b) current of +Y solar vs. load, (c) voltage of battery A and B, and (d) 42 V bus voltage.
4.2. Satellite Energy Adaptability Algorithm
The satellite energy system uses three-domain full regulation to regulate and control energy, with constant bus voltage regardless of light or shadow periods [13]. In the light period, the power control shunt regulator regulates the power of the solar array to stabilize the bus, and the charging regulator replenishes the battery pack; when the output power of the solar array meets the load but does not meet the charging requirements, the charging regulator regulates the charging current to stabilize the bus [14,15,16,17]. During the shadowing period, the battery outputs power through the discharge regulator to stabilize the bus [18]. The output signal of the main error amplifier (MEA) is used as the control signal for the shunt mode of the solar array and the charging/discharging mode of the battery pack [19,20], and the different control ranges of the MEA signal correspond to the different operating modes of the power supply control [21,22,23,24], including the shunt region, the charging region, and the discharging region.
The influencing factors of solar array output current are the irradiation attenuation factor, sun–earth distance factor, solar incidence angle factor, and solar array temperature, in which the sun–earth distance factor, solar incidence angle, and solar array temperature all change regularly with time. Analyze and calculate the satellite sun–earth distance, solar incidence angle, and solar array temperature with normalization [25,26,27,28,29]. We can obtain, in summer solstice, that the sun–earth distance factor is minimum (0.9843), and, in winter solstice, the sun–earth distance factor is maximum (1.0152); the variation in the sun–earth factor is shown in Figure 14 [30,31,32].

Figure 14.
Sun–earth distance factor curve.
Through a large number of ground testing experiments, the relationship between the solar array output power and the solar incidence angle θ was proven: when the solar incidence angle at 20~50°, the solar array output current is I positive illumination ; when the solar incidence angle is more than 80°, the solar array operating point is more than the point of maximum power, and the output current is reduced dramatically. At this time, there is no current output; when the solar incidence angle is between 50° and 80°, the output current of the solar cell array deviates from the cosine law and meets the requirements of Table 3:
Table 3.
Solar array output current versus angle of incidence.
The model belonging to the previous section of this paper modeled the output energy exactly according to the cosine law. If the modeling could be performed according to Table 3, the accuracy would be higher. However, the parameters listed in the second column of Table 1 are close to the cosine values for that angular interval, so the accuracy of the model described in this paper remains up to standard.
According to the relationship between the output current of the solar cell array and the incident angle, predict the energy generated by the −Y solar panel in one orbital cycle in the Nth year when a stalling occurs as shown in Equations (21)–(23):
where is the bus voltage 42.2 V; is the rate of change in the solar incidence angle of ; t0 is the start time of the orbital cycle; t is the end time of the orbital cycle; the orbital period of this satellite is 13 h; is the output current of the solar panel in the Nth year when the satellite is in orbit; is the telemetry value of the solar panel current acquired at the present time; is the sun–earth distance factor at the currently obtained telemetry time; is the predicted sun–earth distance factor in the Nth year; is the decay of the solar cells in the first year, which includes particle radiation and ultraviolet radiation and is taken as 3%; and is the decay of the solar cell after the first year, including particle radiation, which is taken as 1%. In March 2024, the satellite’s −Y-wing was stalled at 270 degrees, and, at this time, the output current of the normal -Y-wing square array is 31.73 A (the sun–earth factor is 1.0068).
In 2023, it was the 5th year in orbit, and the designed lifespan of the satellite is 10 years. It is predicted that, at the end of the 10th year, the normal current of the biplane solar wing during the summer solstice of the light period (with a sun–earth factor of 0.9843) will be about 28 A. The average value of the load and loss of the satellite during the illumination period is 35 A.
During the shadow period, the charging current of the battery pack needs to be set to the maximum value to guarantee the energy supplement and balance during the whole operation process. According to the design of the power MEA control circuit, it is necessary to turn on the two charging circuits, and the maximum charging current of each charging circuit can be up to 8 A, which means that the maximum charging current of the two groups of batteries is 16 A. In this charging mode, the sum of the whole satellite’s loading power and the charging power is close to the upper limit of the on-orbit output power of the solar array. When exceeding the upper limit, the primary bus power control adjustment will be stabilized by the main error control circuit (MEA) charging adjustment, and the stability of the whole system and the energy system will be at some risk, which may lead to bus oscillation, damage the charging module, and trigger the secondary failure of the energy source. Therefore, when charging on-orbit satellites, the maximum charging current is 16 A due to the limitation of the BCR module, and the maximum charging current is 16 A. Then, it can be estimated that the solar array should have the maximum output power, which is shown in Equation (24).
In the formula, is the maximum utilized power of the solar wing; is the load current; is the bus voltage; is the full-charge voltage of the battery, and 4.05 V is taken here; is the number of series connection of the battery group, and this satellite is a series connection of nine single cells; is the discharging efficiency of the battery, and 90% is taken here; and is the charging efficiency of the battery, and 90% is taken here. The final calculation of is 2125 W for end of life.
The on-orbit management strategy for satellite batteries is as follows: during the light period, the batteries are set to be on hold and not discharged; during the shadow period, the batteries are set to be fully charged and discharged. The most stressful energy situation is the shadow period. If the energy is in balance during the shadow period, then it will also be in balance during the light period. Therefore, only the energy balance in the case of shadow period is analyzed. For the light period, it is necessary to analyze whether the battery will be discharged additionally, so as not to affect the life of the battery. When is 0, the energy and load conditions are shown in Figure 15, corresponding to the different stall angles of the -Y-wing.
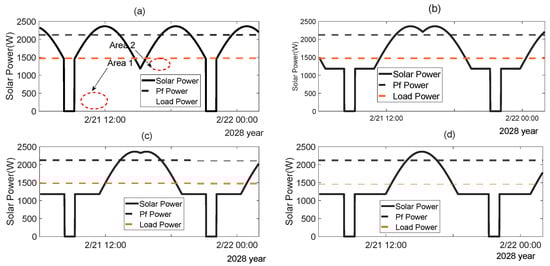
Figure 15.
Energy analysis under different locked-SADA angles (shadow period): (a) γ = 270°, (b) γ = 330°, (c) γ = 345°, (d) γ = 360°.
Calculation of the energy available for battery charging and battery discharging energy for one orbital cycle at different stall angles is shown in Table 4. It can be seen that the energy is optimal when the stall angle is 270°. It can be balanced at the end of life. When the stalling is at 270°, in addition to the battery discharging that occurs during the shadow period (see area 1 in Figure 15), it also occurs when the solar array energy is not able to satisfy the load situation during the reduction in the −Y-wing current to its minimum value, which produces a shallow battery discharge, as shown in area 2 in Figure 15. The battery discharges twice during an orbital cycle: one is a deep discharge caused by shadowing, with a depth of discharge of approximately 28%; and the other is a shallow discharge, with a depth of discharge of approximately 3%.
Table 4.
Energy supply and demand situation under different locked-SADA angles (shadow period).
In Table 4, is the energy available for battery charging in one orbital cycle; is the energy discharged by the battery in one orbital cycle. Their calculation methods are shown in Equations (25)–(27).
If > in an orbital cycle, the energy is balanced; otherwise, it is not balanced.
During the light period, the sun–earth distance factor is the smallest at the summer solstice, and the energy situation is the most stressful. The supply and load with SADA stalled at different angles are shown in Figure 16. The corresponding energy situation statistics are shown in Table 5. It can be seen that, when = 270°, the battery does not discharge. Therefore, the energy is balanced at the end-of-life light period at summer solstice regardless of the angle of the stall.
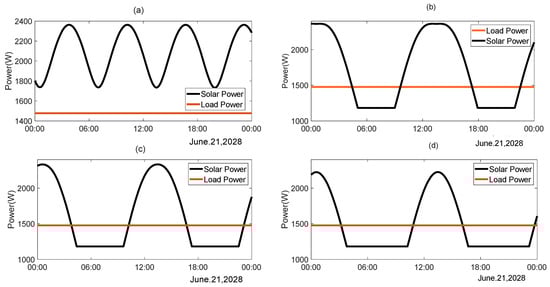
Figure 16.
Energy analysis under different locked-SADA angles (sunlight period): (a) γ = 270°, (b) γ = 330°,(c) γ = 345°, and (d) γ = 360°.
Table 5.
The supply and demand situation under different SADA-stalled angles (light period).
5. Conclusions
This study aimed at exploring the stalling fault phenomenon of a single-wing SADA that occurred on a certain MEO (Medium Earth Orbit) satellite in orbit, considering that the output current of the solar array changes with the orbital solar angle between the satellite and the sun. In order to ensure that the satellite operates in a stable Earth-oriented working mode and the main payload works normally, an algorithm for the self-adaptive analysis of the solar energy is proposed, and the following conclusions are drawn:
- The energy of −Y-wing SADA stalls at different angles of the satellite during shadow and light period is verified by simulation.
- The satellite’s energy is in the optimal state, when the SADA of the −Y wing is stalled at 270°. Similarly, it can be concluded that, when the SADA of the +Y wing is stalled at 90°, the energy is also in the optimal state.
- When the −Y-wing SADA is stalled at 270°and the +Y-wing SADA is functioning normally, the satellite energy is balanced. During the shadow period, the battery discharges one more time with a depth of approximately 3% compared to the normal situation within one orbital cycle.
This paper provides an effective strategy for on-orbit practical application and solar array energy optimization, and the satellite is now working normally with loads and stable in orbit.
Author Contributions
Conceptualization, H.L., C.K. and B.L.; methodology, H.L.; software, H.L.; validation, H.L. and C.K.; formal analysis, X.W.; investigation, Q.Z.; resources, B.L.; data curation, H.L.; writing—original draft preparation, H.L. and C.K.; writing—H.L. and C.K.; visualization, Y.W. All authors have read and agreed to the published version of the manuscript.
Funding
This research received no external funding.
Data Availability Statement
Due to the strict confidentiality agreement signed between us and our cooperation partners for the data involved in this study, the relevant information contains sensitive commercial or technical content. Constrained by legal requirements and the terms of the confidentiality agreement, we are unable to make these data publicly available.
Conflicts of Interest
The authors declare no conflict of interest.
Abbreviations
The following abbreviations are used in this manuscript:
| SADA | The solar array drive assembly |
| SADM_A | +Y-wing solar array drive mechanism |
| SADM_B | −Y-wing solar array drive mechanism |
| SADE | SADA generally consists of the controller circuit box |
| MEO | Medium Earth Orbit |
| Orbital solar angle |
References
- De Asís Delgado, F.; Hernández, P.; Toso, M. MicroSADA-18 Development of One Axis Solar Array Drive Mechanism for Small Satellites. In Proceedings of the 2023 13th European Space Power Conference (ESPC), Elche, Spain, 2–6 October 2023; pp. 1–6. [Google Scholar] [CrossRef]
- Zhu, X.; Li, L.; Mo, Y.; Dong, Y.; Shen, X.; Chen, X.; Qin, S.J. Data-driven approaches for satellite SADA system health monitoring with limited data. In Proceedings of the 2024 IEEE 20th International Conference on Automation Science and Engineering (CASE), Bari, Italy, 28 August–1 September 2024; pp. 3225–3230. [Google Scholar]
- Liang, J.; Zhu, X.; Tong, L.; Zhang, M.; Yu, G. Experimental Research on The Influence of Two-dimensional Deployment of Solar Array on SADA Drive Circuit. In Proceedings of the 2023 IEEE 18th Conference on Industrial Electronics and Applications (ICIEA), Ningbo, China, 18–22 August 2023; pp. 452–457. [Google Scholar] [CrossRef]
- Minow, J.I. Spacecraft Anomalies and Failures Workshop 2023: NASA Introductory Comments. In Spacecraft Anomalies and Failures 2023 Workshop, Langley Research Center, Hampton, Virginia, United States; National Aeronautics and Space Administration and National Reconnaissance Office: Washington, DC, USA, 2023. [Google Scholar]
- Smith, J. Cygnus Solar Array Fails to Deploy (N). SpaceNews Daily, 2022-11-09. Available online: https://www.spacenews.com/cygnus-solar-array-fails-to-deploy/ (accessed on 24 April 2025).
- Leach, R. Spacecraft system failures and anomalies attributed to the natural space environment. In Proceedings of the 1995 Space Programs and Technologies Conference, Huntsville, AL, USA, 26–28 September 1995; pp. 1–17. [Google Scholar]
- Jang, S.S.; Choi, J. Energy balance analysis of small satellite in Low Earth Orbit (LEO). In Proceedings of the 2008 IEEE 2nd International Power and Energy Conference, Johor Bahru, Malaysia, 1–3 December 2008; pp. 967–971. [Google Scholar]
- Yuan, L.; Wang, W.; Qiu, Q.; Xun, W.; Li, C.; Jiang, S. An Accurate Power Balance Analysis and Improved Design Method of the High Orbit Communication Satellites. In Proceedings of the 2023 IEEE 7th Conference on Energy Internet and Energy System Integration (EI2), Hangzhou, China, 15–18 December 2023; pp. 2355–2358. [Google Scholar]
- Gao, Y.; Su, P.; Dong, T.; Liu, X.; Chen, M. Damage Analysis and Energy Evaluation of the Solar Array of the Biaxial Drive Solar Panel. Electron. Meas. Technol. 2021, 44, 68–72. [Google Scholar] [CrossRef]
- Lin, B.J. Functional Chain-Based Engineering of Navigation Satellite Systems; Science Press: Beijing, China, 2021. [Google Scholar]
- Xiong, X.; Zhang, M.; Zhao, H.; Jin, D.; Jia, M. Solar-Array Attenuation Analysis Method for Solar Synchronous Orbit Satellites. In Proceedings of the 2023 14th International Conference on Reliability, Maintainability and Safety (ICRMS), Urumuqi, China, 26–29 August 2023; pp. 232–237. [Google Scholar]
- Fikhtengol’ts, G.M.; Xu, X.; Leng, S.; Liang, W. A Course of Mathematical Analysis; Higher Education Press: Beijing, China, 2006. [Google Scholar]
- Liu, W.; Li, X.; Luo, G. Simulation and Design of Satellite Power Conditioning Unit Based on S4R Technology. In Proceedings of the 2024 6th International Conference on Internet of Things, Automation and Artificial Intelligence (IoTAAI), Guangzhou, China, 26–28 July 2024; pp. 391–395. [Google Scholar] [CrossRef]
- Hou, X.; Zhang, X.; Wang, C.; Wang, M.; Li, Y.; Jiang, S.; Zhang, X.; Li, D.; Hou, R. A High Voltage and High Power PCDU for Space. In Proceedings of the 2023 13th European Space Power Conference (ESPC), Elche, Spain, 2–6 October 2023; pp. 1–6. [Google Scholar] [CrossRef]
- Farahani, G.; Taherbaneh, M. Extracting best reliable scheme for Electrical Power Subsystem (EPS) of satellite. In Proceedings of the 5th International Conference on Recent Advances in Space Technologies—RAST2011, Istanbul, Turkey, 9–11 June 2011; pp. 532–537. [Google Scholar] [CrossRef]
- Pequet, E.; Delporte, P.; Fayt, P.; Gak, M.; Canon, T. ESA qualified EPC for telecommunication satellites TWTA. In Proceedings of the International Vacuum Electronics Conference 2000 (Cat. No.00EX392), Monterey, CA, USA, 2–4 May 2000; p. 2. [Google Scholar] [CrossRef]
- Adnan, S.M.; Bhutto, M.S. Modular & COTS based power system for small LEO satellite. In Proceedings of the 2013 International Conference on Aerospace Science & Engineering (ICASE), Islamabad, Pakistan, 21–23 August 2013; pp. 1–3. [Google Scholar] [CrossRef]
- İnce, B.; Yıldırım, D.; Karagöz, F.E.; Çetin, E.; Şahin, Y. High Power Density Sequential Switching Shunt Regulator Module. In Proceedings of the 2023 13th European Space Power Conference (ESPC), Elche, Spain, 2–6 October 2023; pp. 1–7. [Google Scholar] [CrossRef]
- Şahin, Y.; Çetin, E.; Karagöz, F.E.; İnce, B.; Yıldırım, D. Battery Discharge Regulator Based on Weinberg Topology for High Power Communication Satellites. In Proceedings of the 2023 13th European Space Power Conference (ESPC), Elche, Spain, 2–6 October 2023; pp. 1–7. [Google Scholar] [CrossRef]
- Lin, Z.; Xie, W.; Dong, M.; Lan, J. Research of S3MPR Engineering Application on Space Power Sources. In Proceedings of the 2020 IEEE 4th Information Technology, Networking, Electronic and Automation Control Conference (ITNEC), Chongqing, China, 12–14 June 2020; pp. 817–823. [Google Scholar] [CrossRef]
- Macellari, M.; Palmerini, G.B.; Schirone, L. On the Power System of the AMALIA moon rover. In Proceedings of the 2015 IEEE Aerospace Conference, Big Sky, MT, USA, 7–14 March 2015; pp. 1–8. [Google Scholar] [CrossRef]
- Mohapatra, M.K.; Madhusudhana, C.S.; Biradar, R.C. Solar Array Bus Voltage Regulator for Small Satellite Using FS3R (Fixed Switching String Shunt Regulator) Technique. In Proceedings of the 2024 International Conference on Electronics, Computing, Communication and Control Technology (ICECCC), Bengaluru, India, 2–3 May 2024; pp. 1–6. [Google Scholar] [CrossRef]
- Chen, Q.; Yu, H.; Huang, X.; Lu, Y.; Qiu, P.; Tong, K.; Xuan, J.; Xu, F.; Xuan, X.; Huang, W.; et al. Modelling and analysis of avionics battery discharge regulator. J. Power Electron. 2016, 16, 1218–1225. [Google Scholar] [CrossRef]
- Maset, E.; Ferreres, A.; Ejea, J.; Sanchis-Kilders, E.; Jordan, J.; Esteve, V. 5 kW Weinberg converter for battery discharging in high power communications satellite. In Proceedings of the IEEE 36th Power Electronics Specialists Conference, Dresden, Germany, 16 June 2005; pp. 69–75. [Google Scholar]
- Xi, C.; Liu, Y.; Lin, B.; Wang, X.; Jiang, G.; Kong, C. Radiation-resistant design of triple-junction GaAs solar arrays for high-orbit satellites. J. Sol. Energy 2022, 43, 9–13. [Google Scholar]
- Hoang, B.; Beyene, S.; Keys, C.C.; Watkins, B.; Coughlin, C.; Rotlisberger, L. Solar array performance of a geostationary mission with full electric orbit raising. In Proceedings of the 2020 47th IEEE Photovoltaic Specialists Conference (PVSC), Calgary, ON, Canada, 15 June–21 August 2020; IEEE: Piscataway, NJ, USA, 2020; pp. 0056–0060. [Google Scholar]
- Rehman, A.; Lee, S.H.; Lee, S.H. Silicon space solar cells: Progression and radiation-resistance analysis. J. Korean Phys. Soc. 2016, 68, 593–598. [Google Scholar] [CrossRef]
- Zhang, X.; Zuo, Z. Analysis on Solar Cell Degradation Characteristic of MEO Satellite. Spacecr. Eng. 2014, 23, 75–80. [Google Scholar]
- Tu, J.; Liang, G.; Xie, D. Influence on power output of solar cells with small area of shadow. Chin. J. Power Sour. 2014, 38, 474–477. [Google Scholar]
- Hui, Y.; Yanhui, P.; Xiaoying, L.; Wenming, G. Degradation assessment of solar cell array of low orbit satellite in orbit. In Proceedings of the 2022 IEEE International Conference on Electrical Engineering, Big Data and Algorithms (EEBDA), Changchun, China, 25–27 February 2022; pp. 21–23. [Google Scholar] [CrossRef]
- Haining, M.A.; Xiang, Z.; Wenhe, L. Calculation of average power generated by solar array of CubeSat. China Sci. 2018, 13, 2669–2703. [Google Scholar]
- Piszczor, M.F.; Benson, S.W.; Scheiman, D.A.; Snyder, D.B.; Fincannon, H.J.; Oleson, S.R.; Landis, G.A. Advanced solar cell and array technology for NASA deep space missions. In Proceedings of the 2008 33rd IEEE Photovoltaic Specialists Conference, San Diego, CA, USA, 11–16 May 2008; IEEE: Piscataway, NJ, USA, 2008. [Google Scholar]
Disclaimer/Publisher’s Note: The statements, opinions and data contained in all publications are solely those of the individual author(s) and contributor(s) and not of MDPI and/or the editor(s). MDPI and/or the editor(s) disclaim responsibility for any injury to people or property resulting from any ideas, methods, instructions or products referred to in the content. |
© 2025 by the authors. Licensee MDPI, Basel, Switzerland. This article is an open access article distributed under the terms and conditions of the Creative Commons Attribution (CC BY) license (https://creativecommons.org/licenses/by/4.0/).