Article

Orderly Charging and Discharging Strategy for Electric Vehicles with Integrated Consideration of User and Distribution Grid Benefits

1
Zhaoging Power Supply Bureau of Guangdong Power Grid Co., Ltd., Zhaoging 526060, China
2
Power Dispatching Control Center of Guangdong Power Grid Corporation, Guangzhou 510600, China
3
South China Electric Power Research Institute, Guangzhou 510663, China
4
National Engineering Research Center for Electrical Energy Conversion and Control, Hunan University, Changsha 410082, China
*
Author to whom correspondence should be addressed.
Energies 2025, 18(9), 2305; https://doi.org/10.3390/en18092305
Submission received: 28 March 2025 / Revised: 21 April 2025 / Accepted: 27 April 2025 / Published: 30 April 2025

Abstract

:
With the rapid development of electric vehicles (EVs), vehicle-to-grid has become a common way to participate in grid regulation. However, in the traditional vehicle-to-grid strategy, the disorganized or coercive regulatory characteristics of EVs always affect the overall satisfaction of EV users and the safe and economic operation of the distribution network. It is challenging to balance the interests of road network subjects. For this reason, this paper proposes an orderly charging and discharging strategy for electric vehicles with integrated consideration of user and distribution grid benefits. First, a comprehensive EV user satisfaction model that considers the vehicle owner’s travel costs is established by considering the vehicle’s travel status and the road resistance characteristics of the road network. Further, the EV orderly charging and discharging model is established to optimize the operation cost of the distribution network, voltage deviation, and EV users’ comprehensive satisfaction, which takes into account the vehicle owner’s satisfaction and the stable operation of the distribution network. Finally, the proposed strategy is validated using the IEEE 33-node arithmetic example. The results show that the peak-to-valley load difference of the distribution network under the strategy of this paper is 29.52% lower than that under the EV non-participation regulation strategy. Compared with the EV non-participation strategy, it can effectively reduce the single-day operation cost of the system by 2.47%.

1. Introduction

Electric new energy vehicles have the characteristics of being green, highly efficient, and low consumption. New energy electric vehicles are expected to replace conventional fuel-powered vehicles to alleviate the huge global pressures from pollution and fossil energy shortages [1,2,3,4]. Electric vehicles (EVs) have long downtimes and wide charging demands. They have become the main development direction for new energy vehicles in China. Meanwhile, vehicle-to-grid (V2G) is a widely promoted way for electric vehicles to participate in road network regulation. It has energy storage characteristics that other loads do not possess [5,6,7]. V2G can supplement load demand during the peak load hours of the distribution network to reduce the amount of power purchased by the distribution network. At the same time, it can absorb new energy output during low-load hours to improve energy utilization [8]. However, the disorderly charging and discharging behavior of traditional V2G is random and concentrated. This can easily cause problems, such as voltage fluctuations, network loss increases, or low EV customer satisfaction, during peak load hours [9]. To avoid the above problems to the greatest possible extent, traditional V2G regulation technology needs to be optimized accordingly.
In recent years, domestic and foreign scholars have conducted a lot of research on road–grid interactions. Existing research mainly focuses on two topics: economic dispatch and voltage regulation. In terms of economic dispatching, ref. [10] analyzes EV user-side demand based on the stochastic wandering algorithm in terms of both charging and discharging economy and load volatility. This strategy allocates the specific charging power of EVs according to the traveling characteristics of EV users and achieves economic regulation. However, the distribution network lacks interactions between guidance and information for vehicle owners. This lack is likely to lead to the disorderly and random participation of EV charging and discharging in the distribution network. Thus, it increases the burden of distribution grid regulation. The authors of ref. [11] use the energy storage characteristics of EVs to smooth the load peaks of microgrids to reduce grid-side network losses. This strategy reduces the system’s operation costs. However, when electric vehicles are connected centrally, the distribution network is exposed to new peak loads. Regarding voltage regulation, ref. [12] proposes access node voltage by adjusting the charging pile power factor. However, the EVs in this strategy are not integrated with the existing voltage regulation devices in the distribution network. The authors of ref. [13] propose a day-ahead real-time coordinated optimization model for distribution networks with EV participation in reactive power compensation. This strategy uses time-of-day tariffs to guide EV charging and discharging. It reduces the burden on the distribution network while reducing the number of regulator actions and improving the distribution network’s regulation economics. However, the above literature focuses on power distribution among distribution networks, charging piles, and EVs. It is difficult for EVs to participate actively in regulation. This can easily lead to problems, such as high operating costs for distribution networks and overvoltage. Therefore, studies on the road–network interaction need to be further optimized.
In addition, EV participation in grid regulation requires comprehensive consideration of both grid-side and user-side factors. It can ensure a balance between the distribution network’s safe and economic operation and EV users’ comprehensive satisfaction. The comprehensive satisfaction of EV users is an important indicator to measure the user experience on the user side, including user cost satisfaction and user traveling satisfaction. In terms of EV user cost satisfaction, ref. [14] optimizes the charging and discharging periods based on time-of-day tariffs for distribution networks. This strategy improves the original EV charging and discharging strategy. Optimization of these charging and discharging processes ensures the reliable operation of the grid while minimizing costs for electric vehicle users. The authors of ref. [15] fully consider EV users’ satisfaction with expenses to guide EV charging in the low-load valley. However, the paper ignores EV traveling satisfaction. It may lead to the state of charge (SOC) of EV batteries at a low level. In terms of EV user travel satisfaction, ref. [16] established a travel path optimization model with dynamic charging characteristics based on a time-varying road traffic network to minimize travel distance. However, this paper only considered a single objective of EV travel satisfaction, and the distribution network is prone to the phenomenon of centralized charging. The authors of ref. [17] simulate user travel behavior based on real travel data and road network data. It proposes a clustered EV master–slave game optimization scheduling strategy that considers the road network and user satisfaction. The strategy effectively improves the revenue of each subject and increases new energy consumption. However, it does not consider the influence of road network road vehicle flow characteristics on EV traveling satisfaction and is prone to road network congestion. In addition, fewer charging strategies globally coordinate and predict road network information in advance. It is difficult for owners of electric cars to choose charging and discharging times to suit their needs. This often leads to a situation where EVs are out of power and have no power for charging, which results in very low comprehensive user satisfaction [18]. Therefore, the quantitative analysis of EV user satisfaction needs to fully consider the characteristics of the road network to guide EV charging and discharging in an orderly manner.
Based on this, this paper proposes an orderly charging and discharging strategy for EVs that comprehensively considers the benefits to users and distribution networks. Firstly, the EV charging waiting time is obtained from the EV travel behavior model using the Monte Carlo simulation method according to factors relating to the vehicle’s travel state. Second, the travel cost model for EVs was developed, taking into account the travel behavior of EV users and the characteristics of the road network. Then, to guide EVs to actively participate in distribution network regulation, the EV user travel cost is substituted into the fuzzy subset and combined with the graph theory method to establish the EV user comprehensive satisfaction model. Finally, the EV orderly charging and discharging model, considering owner satisfaction and the stable operation of the distribution network, is established with the objectives of obtaining the highest EV user satisfaction, the minimum operating cost of the distribution network, and the optimal voltage level. The results show that the model can effectively improve the comprehensive satisfaction of EV users and suppress the voltage deviation of the distribution network while enhancing the economic operation capability of the distribution network.

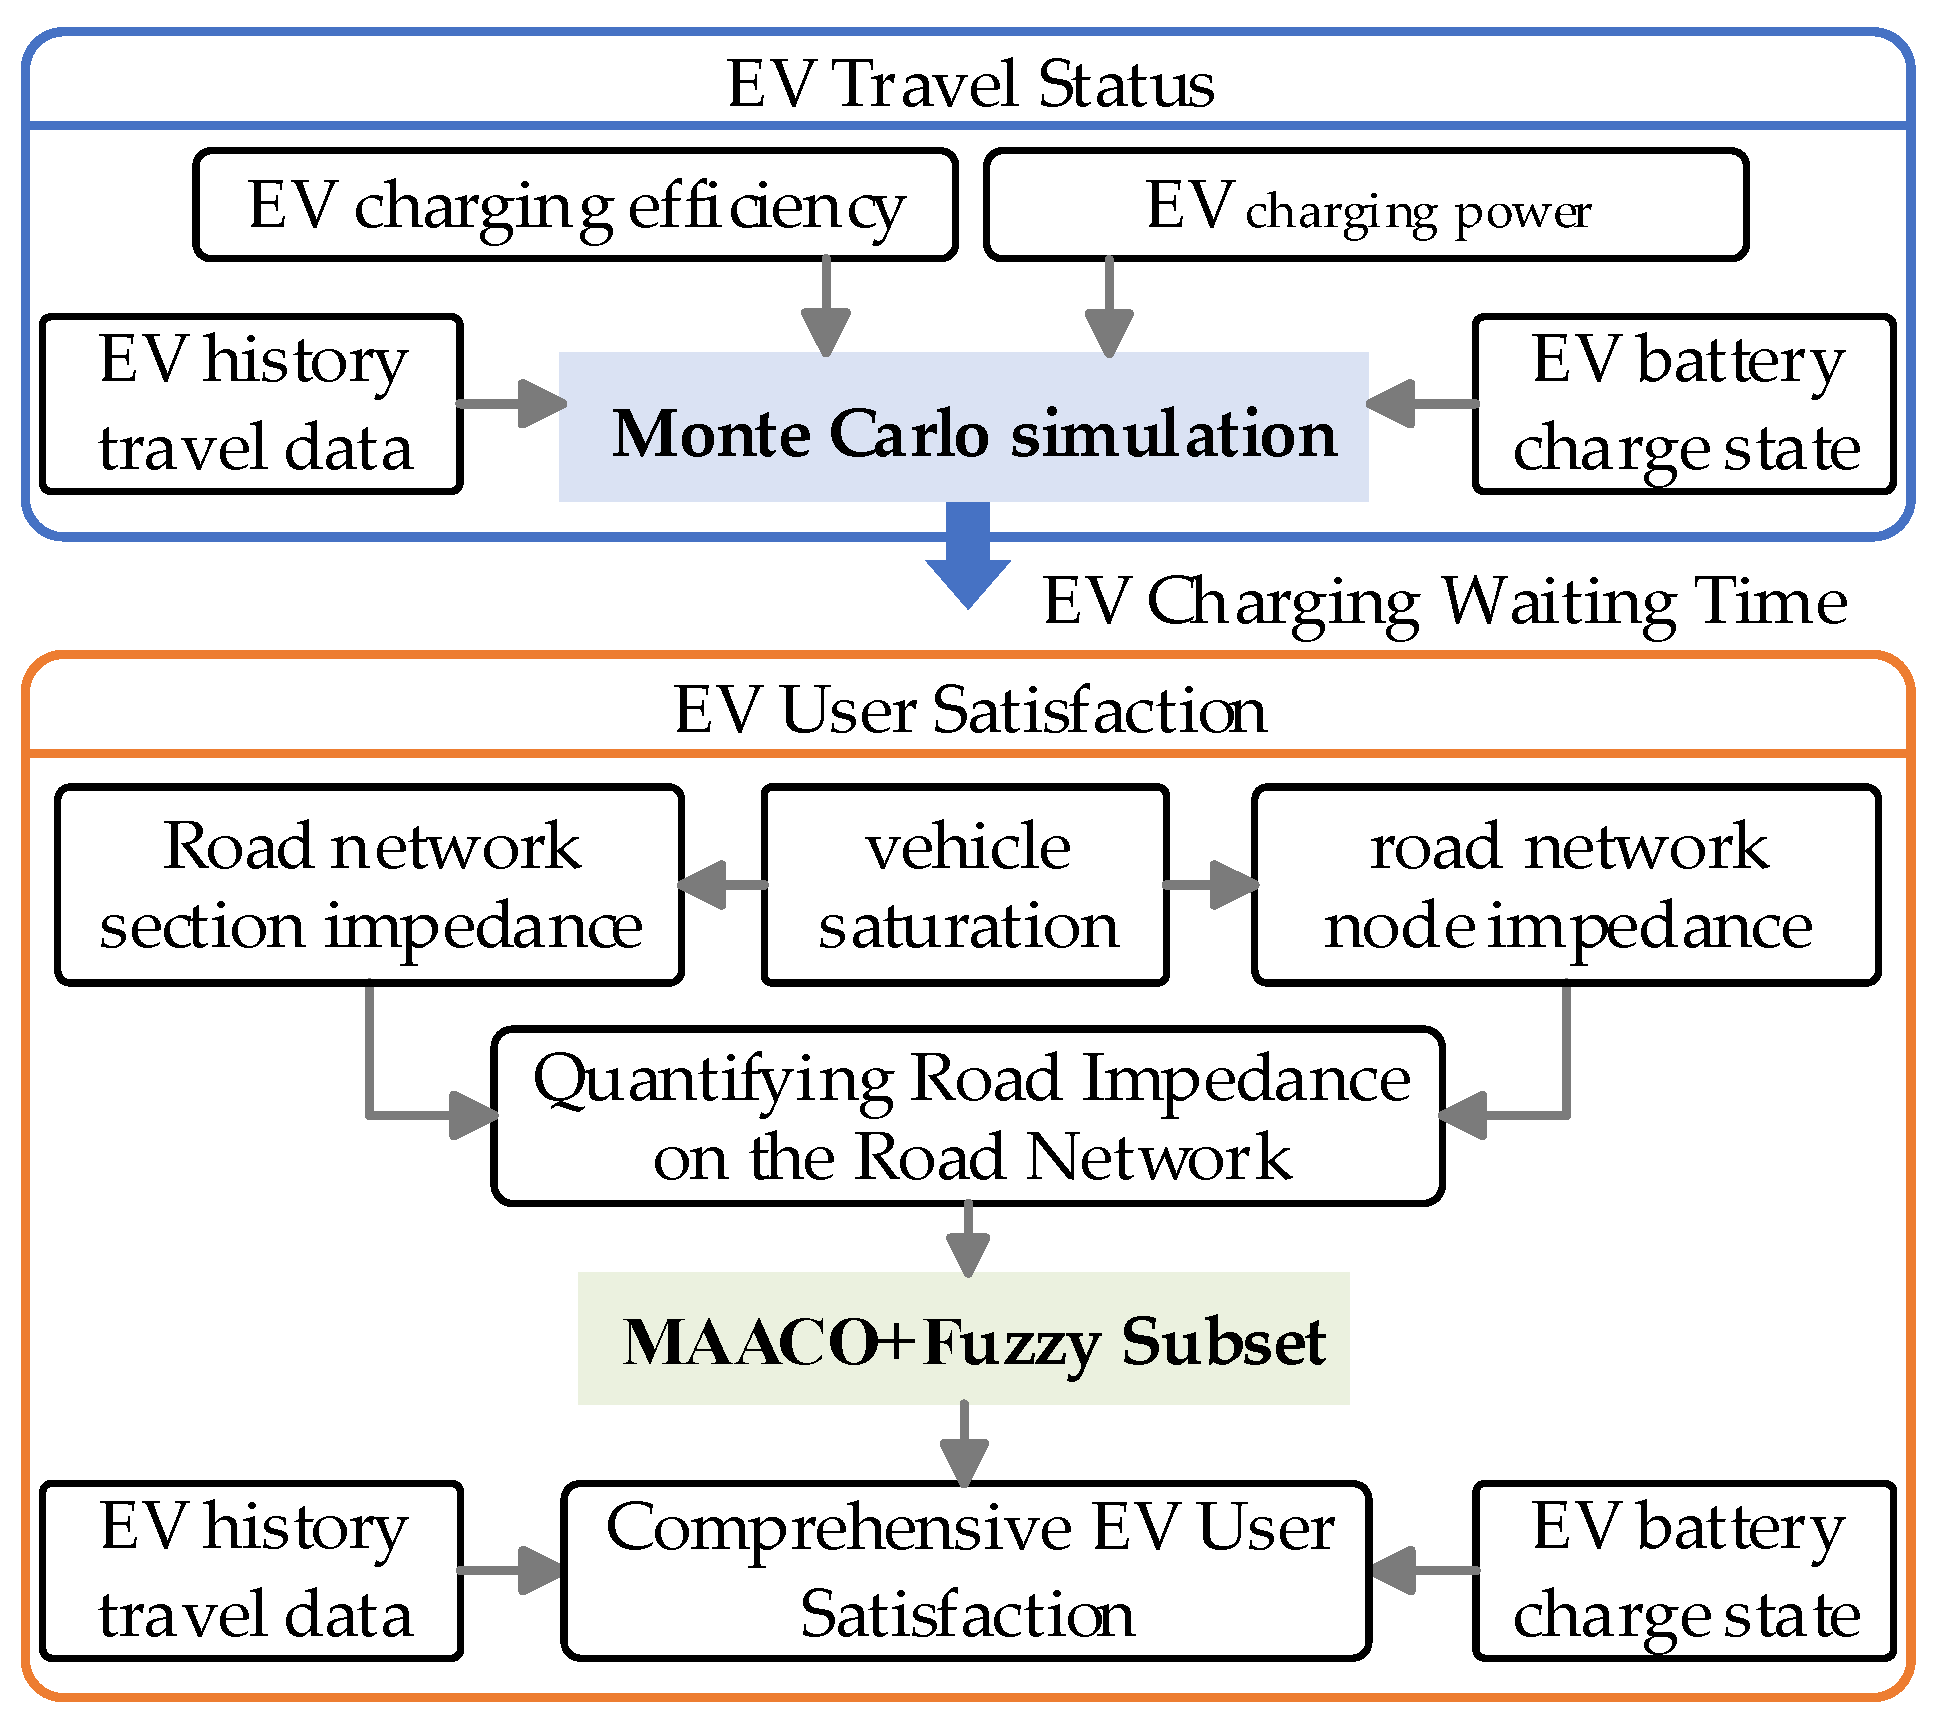
2. Comprehensive EV User Satisfaction Model That Accounts for Network Road Impedance

The charging and discharging behaviors of EVs follow the wishes of vehicle owners. To fully activate user participation, this section will develop a comprehensive EV user satisfaction model that takes into account user satisfaction with travel and costs [19]. The comprehensive EV user satisfaction is shown in Equation (1). Trip satisfaction refers to the level of satisfaction of electric vehicle users with the cost of charging and discharging trips. Cost satisfaction refers to users’ satisfaction with the cost of charging [20,21].
k = i = 1 n k k 1 max ( k 1 ) + k 2 max ( k 2 )
where k 1 and k 2 denote EV users’ travel satisfaction and EV cost satisfaction, respectively.
The EV user comprehensive satisfaction model is shown in Figure 1. First, the EV charging waiting time obtained from EV travel behavior is modeled using the Monte Carlo simulation method based on vehicle travel history statistics, EV charging efficiency, SOC and charging power, and other travel factors. Then, the saturation degree is introduced to divide the road into four states: smooth, slow, congested, and severely congested, combined with the graph theory method to quantitatively describe the road impedance of the traffic road network. Road resistance with the minimum cost of each EV trip is obtained using the modified adaptive ant colony optimization (MAACO) algorithm. Subsequently, EV user travel satisfaction is modeled according to the road network’s road resistance using the fuzzy subset affiliation function. Finally, the comprehensive EV user satisfaction model is constructed by combining EV users’ cost satisfaction with the road network’s road impedance.
(1)
EV Users’ Travel Satisfaction
To analyze the impact of EVs’ displacement behavior on the distribution network, the charging demand of EVs as a group of EVs is considered. The travel behavior of EVs is modeled with Monte Carlo simulation [22,23]. Based on the vehicle trip statistics, EV trip factors such as charging efficiency, SOC, and charging power are used to derive the EV charging waiting time, as shown in Equation (2).
T n i = S n i S S i E S i η ev , ch P ev , ch , i , t
where S n i and S S i denote the starting, expected SOC of the EV, E S i indicates the battery capacity of the EV, and η ev , ch and P ev , ch , i , t denote the EV’s charging efficiency and charging power, respectively.
The traffic road network is dynamic and variable, with many intersections. EVs are affected by intersection signals and roadway impedance in the road network. Therefore, the urban roadway resistance model includes node impedance and roadway section impedance models. By introducing the saturation degree S, the roadway is divided into four roadway conditions: smooth (0 < S ≤ 0.6), slow (0.6 < S ≤ 0.8), congested (0.8 < S ≤ 1.0), and severely congested (1.0 < S ≤ 2.0) [24]. Based on the roadway’s access conditions and the time required for charging, the node impedance and roadway impedance models corresponding to different saturation levels are obtained as Equations (3) and (4).
C i ( t ) = C i 1 ( t ) : h c ( 1 λ ) 2 2 ( 1 λ S ) + S 2 2 q ( 1 S ) , 0 < S 0.6 C i 2 ( t ) : c ( 1 λ ) 2 2 ( 1 λ S ) + 1.5 S ( S 0.6 ) 1 S , S > 0.6
where Ci(t) denotes the node impedance of intersection i at time t. S = Q/C, where Q indicates the roadway traffic flow, C denotes the navigational capability, c denotes the signal period, λ denotes the green letter ratio, q denotes the vehicle arrival rate of the road section, and h denotes the intersection EV organization degree coefficient.
R i j ( t ) = R i j 1 ( t ) : t 0 ( 1 + α ( S ) β ) + T n , 0 S 1.0 R i j 2 ( t ) : t 0 ( 1 + α ( 2 S ) β ) + T n , 1.0 S 2.0
where Rij(t) is the roadway impedance between intersection i and intersection j at time t, t0 is the zero-flow travel time, and α and β are the impedance impact factors.
In the road impedance and junction impedance models, saturation S is the only variable, with the other variables being the determinants of the road network. Therefore, combining Equations (3) and (4) yields the roadway impedance adjacency matrix, as shown in Equation (5).
w i j k ( t ) = C i 1 ( t ) + R i j 1 ( t ) , 0 < S 0.6 C i 2 ( t ) + R i j 1 ( t ) , 0.6 < S 0.8 C i 1 ( t ) + R i j 2 ( t ) , 0.8 < S 1.0 C i 2 ( t ) + R i j 2 ( t ) , 1.0 < S 2.0
The cost of EV travel to each charging station varies greatly depending on factors such as distance, electricity price, and charging station status. Multiple path options exist. To plan and recommend the optimal traveling path for EV users, MAACO is used for path guidance.
MAACO was first proposed by Italian scholar Marco Dorigo in 1996 as an algorithm. The associate editor coordinated the review of this to solve travel agents and distribute optimization problems based on the ant foraging mechanism. Ant colony optimization is a parallel self-organizing algorithm with the advantages of positive feedback and strong robustness. It was originally used to solve the traveling salesman problem; after years of development, it has gradually penetrated other fields, such as path planning problems, large-scale integrated circuit design, routing problems in communication networks, load balancing problems, and vehicle scheduling problems. The ant colony algorithm has become a common method used to solve the problem of path planning. The article [25] verified the effectiveness of MAACO and the optimal selection of fuzzy thresholds. The MAACO algorithm proposed in that paper was applied to the path planning problem and the optimal selection of ACO optimization parameters, including the selection of fuzzy thresholds, and was verified by simulation.
Next, the road resistance w of the user’s traveling cost is divided into three fuzzy subsets. They are the “Comfort”, “Normal”, and “Anxiety” affiliation models, as shown in Figure 2.
The affiliation degrees of EV users’ perceptions of travel cost as “Comfort”, “Normal”, and “Anxiety” are μcom(w), μnor(w), and μanx(w), respectively. These affiliation function relationships are shown in Table 1.
Based on the above conditions, EV user travel satisfaction is defined in Equation (6). User satisfaction with charging costs is maximized when the user is placed at the point where roadway resistance is minimized. In this case, k 1 is equal to 1.
k 1 = max μ com   w , μ nor w , μ a n x w
(2)
EV Users’ Fee Satisfaction
The user cost satisfaction function also takes into account the cost of settlement during the transmission period and the additional cost of deviation. The definition of EV cost satisfaction is given in Equation (7).
k 2 = 1 t = 1 T C + t P ev , ch , i , t Δ t c o s t k , i min c o s t k , i max c o s t k , i min
where C + t denotes charging tariff costs and c o s t k , i max denotes the highest and lowest cost of this charging for this user, obtained by scheduling the ith EV in charging station k to charge at the extremes of the highest and lowest tariff periods, respectively.
The number of time slots in the scheduling cycle is T. T = 24. The user’s satisfaction with the charging cost is maximized when the user is scheduled to charge during the k 2 low-tariff slot. At this time, a is equal to 1.

3. Orderly Charging and Discharging Model for Electric Vehicles with Integrated Consideration of User and Distribution Network Benefits

The vehicle–road network cooperative operation framework that integrates the benefits of users and the distribution network is shown in Figure 2. This paper starts with the three objectives of distribution network operation: economic benefits, the voltage deviation rate, and EV user satisfaction. In this paper, the access response, distributed generation (DG), and grid-side resource action plan for the active participation of electric vehicles in distribution grid regulation are obtained by solving the model with the CPLEX commercial solver. The grid-side unified regulation resources include on-load tap changers (OLTCs), group switching capacitor banks (CBs), and static VAR generators (SVGs).

3.1. Objective Function

The objective function is shown in Equation (8).
min F = λ 1 C total + λ 2 V syn λ 3 k
where F denotes the comprehensive operation index of the distribution network, Ctotal denotes the normalized value of the power cost for exchanging power with the distribution network, Vsyn denotes the comprehensive level of the distribution network voltage, k is the comprehensive satisfaction of EV users, and λi denotes the weighting factor.

3.1.1. Minimal Operating Costs of the Distribution Network

The economic optimization objective is to minimize the total operating cost of the distribution network. This objective function’s expression is shown in Equations (9) and (10).
C total , real = C GRI + C DG + C LIN + C REA
C total = C total , real C total , min C total , max C total , min
where Ctotal,real, Ctotal,max, and Ctotal,min denote the total operating cost of the distribution network and the maximum and minimum cost in extreme cases, CGRI denotes the cost of exchanging power with the distribution network, CDG denotes the DG power generation investment, operation, and maintenance costs, CLIN denotes the cost of distribution network losses, and CREA denotes the operation and maintenance cost of the reactive power compensation device. Its specific calculation formula is shown in Equation (11).
C GRI = t = 1 24 c GRI , t P GRI , t Δ t C LIN = i = 0 32 j = 1 33 c LIN , t I i j 2 r i j Δ t C DG = t = 1 24 c PV , t P PV , t Δ t + t = 1 24 c WD , t P WD , t Δ t C REA = t = 1 24 c CB , t Q CB , t Δ t + t = 1 24 c SVG , t Q SVG , t Δ t
where cGRI,t, cPV,t, cWD,t, cCB,t, cSVG,t, and cLIN,t denote the purchase and sale prices of electricity from the distribution grid, the unit operation and maintenance cost of photovoltaic (PV) and wind turbines, the unit operation and maintenance cost of CB and SVG, and the unit network loss price at time t. PGRI,t, PDG,t, PWD,t, QCB,t, and QSVG,t denote the exchange power, the PV and turbine outputs, and the CB and SVG outputs between node i and node j, respectively. Iij and rij denote the branch current and resistance between node i and node j, respectively.

3.1.2. Minimal Voltage Deviation in the Distribution Network

The integrated level of voltage at distribution stations is evaluated by the voltage reference deviation. The objective function’s expression is shown in Equation (12).
V s y n = 1 N bus 1 T i = 1 N bus t = 1 T V i , t V N V N
where Vi,t denotes the node voltage of node i at time t, Nbus denotes the number of nodes in the distribution network, and VN denotes the reference voltage.

3.1.3. Best Overall EV User Satisfaction

The EV comprehensive user satisfaction model has been described in detail above and is expressed as Equation (1).

3.2. Restrictive Condition

3.2.1. Distribution Network Current Constraints

The road network multi-objective optimization model needs to consider the distribution network trend constraints, as shown in Equation (13).
p j = k : j k P j k i : i j P i j I i j 2 r i j + g j V j 2 q j = k : j k Q j k i : i j Q i j I i j 2 x i j + b j V j 2 V j = V i 2 r i j P i j + x i j Q i j + r i j 2 + x i j 2 I i j 2 I i j 2 = P i j 2 + Q i j 2 V i 2
where pj and qj denote the active and reactive power injected at node j, Pij and Qij denote the active and reactive power flowing from node j to the next node k, xij denotes the reactance of the branch between node i and node j, and gj and bj denote conductivity and electricity generation to the ground of node j.
The traditional basic model of optimal tidal current is strongly nonconvex in form. It is difficult to solve because it is a mixed-integer nonlinear planning problem. Therefore, second-order cone programming is introduced to transform the traditional model into a mixed-integer model.
p j = k : j k P j k i : i j P i j I i j r i j + g j V j 2 q j = k : j k Q j k i : i j Q i j I i j x i j + b j V j 2 V j 2 = V i 2 2 r i j P i j + x i j Q i j + r i j 2 + x i j 2 I i j 2 2 P i j 2 Q i j I i j 2 V j 2 2 I i j 2 + V j 2
Distribution network security constraints also need to be considered, as shown in Equation (15).
I i j . min I i j I i j . max V j . min V j V j . max P GRI , min P GRI , t P GRI , max Q GRI , min Q GRI , t Q GRI , max
where Iij.max and Iij.min denote the upper and lower limits of the branch current between node i and node j, Vj.max and Vj.min denote the upper and lower limits of the node voltage at node j, PGRI,t and QGRI,t denote the interactive active and reactive power of the higher-level grid, PGRI,max and PGRI,min denote the maximum and minimum interactive active power that is allowed to be passed through the branch connecting the distribution grid and the higher-level grid, and QGRI,max and QGRI,min are the maximum and minimum interactive reactive power that is allowed to be passed through the branch connecting the distribution grid and the higher-level grid.

3.2.2. Proactive Management of Device Constraints

(1)
OLTC Constraints
With the addition of OLTCs, the substation bus node is converted to an adjustable variable. A replacement can be made, as in Equation (16).
V j . min 2 ( V Base , j , t ) 2 l j , t V j . max 2 l min , j l j , t l max , j l j , t = l min , j + S l j , s σ OLTC , j , s , t
where VBase,j,t denotes the voltage value on the high-voltage side of the transformer, lj,t denotes the square of the OLTC ratio, lmax,j and lmin,j denote the squares of the upper and lower limits of the adjustable OLTC ratio, and lj,s denotes the difference between the OLTC stall s and the square of the stall s-1 ratio.
(2)
CB Constraints
The CB model is shown in Equation (17).
Q CB , j , t = y CB , j , t Q CB . step , j y CB , j , t Y CB , max , j t T y CB , j , t y CB , j , t 1 N CB , max , j
where yCB,j,t denotes the number of groups in operation, YCB,max,j denotes the upper limit of the number of groups of CBs connected at node j, QCB.step,j denotes the compensating power of each group of CBs, NCB.max,j denotes the upper limit of the number of operations.
(3)
SVG Constraints
The SVG model is shown in Equation (18).
Q SVG , min , j Q SVG , j Q SVG , max , j
where QSVG,min,j and QSVG,max,j denote the lower and upper limits of the SVG compensation power.
(4)
DG Constraints
The DG model is shown in Equations (19) and (20).
0 P DG , j , t P DG . PRE , j , t
S DG , j , min S DG , j S DG , j , max
where PDG,j,t and PDG.PRE,j,t denote the actual and predicted outputs of the DG assembled at node j at time t, SDG,j,max and SDG,j,min denote the upper and lower bounds of the capacity of the DG assembled at node j.

3.2.3. EV Charging Pile Charging and Discharging Constraints

In this paper, the EV is treated as a kind of energy storage in a broad sense. When EVs are involved in distribution network regulation, continuous discharge of EVs into the distribution network during peak load hours should be avoided. The EV charging and discharging periods and power constraints are shown in Equations (21)–(23).
P ev , int , i , t = P ev , ch , i , t , P ev , dis , i , t , T a T lower T a T upper
0 P ev , ch , i , t , a P ev , ch , i , t , max
0 P ev , dis , i , t , a P ev , dis , i , t , max
where Pev,ch,i,t, Pev,dis,i,t, Pev,ch,i,t,max, and Pev,dis,i,t,max denote the EV charging and discharging power and their upper limits, and Tupper and Tlower denote the load peak and trough times.

3.2.4. Power Balance Constraints

The power balance constraints are shown in Equation (24).
p l o a d + p i = P GRI + P ev , dis , i , t P ev , ch , i , t + P DG , j , t q l o a d + q i = Q GRI + Q CB , j , t + Q SVC , j
where pload and qload denote the active and reactive loads at each node of the distribution network, and pi, and qi denote the active and reactive power injected at each node of the distribution network.

4. Example Simulation and Analysis

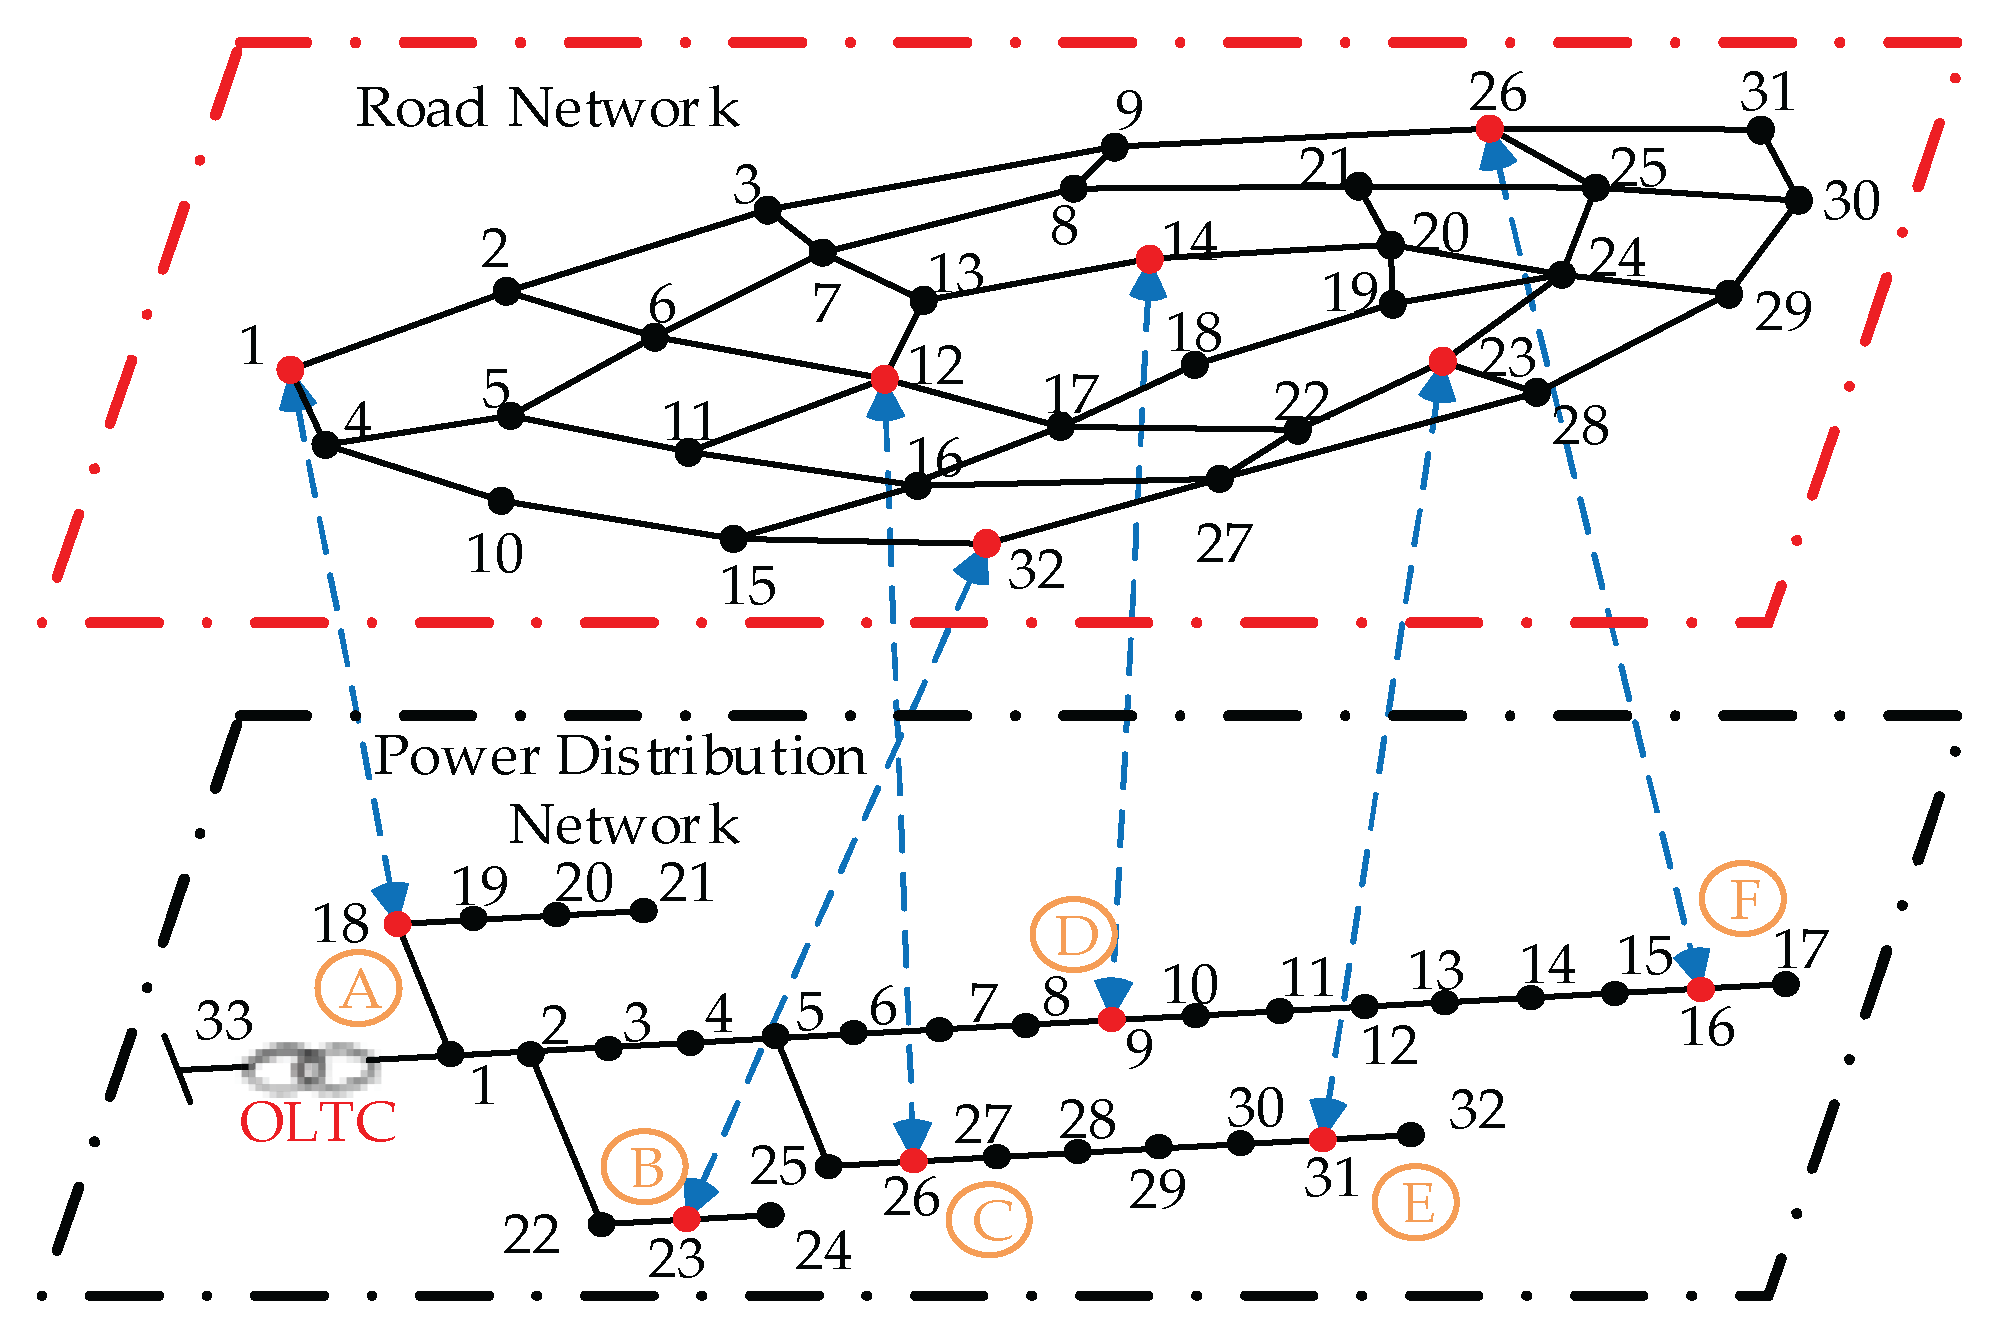
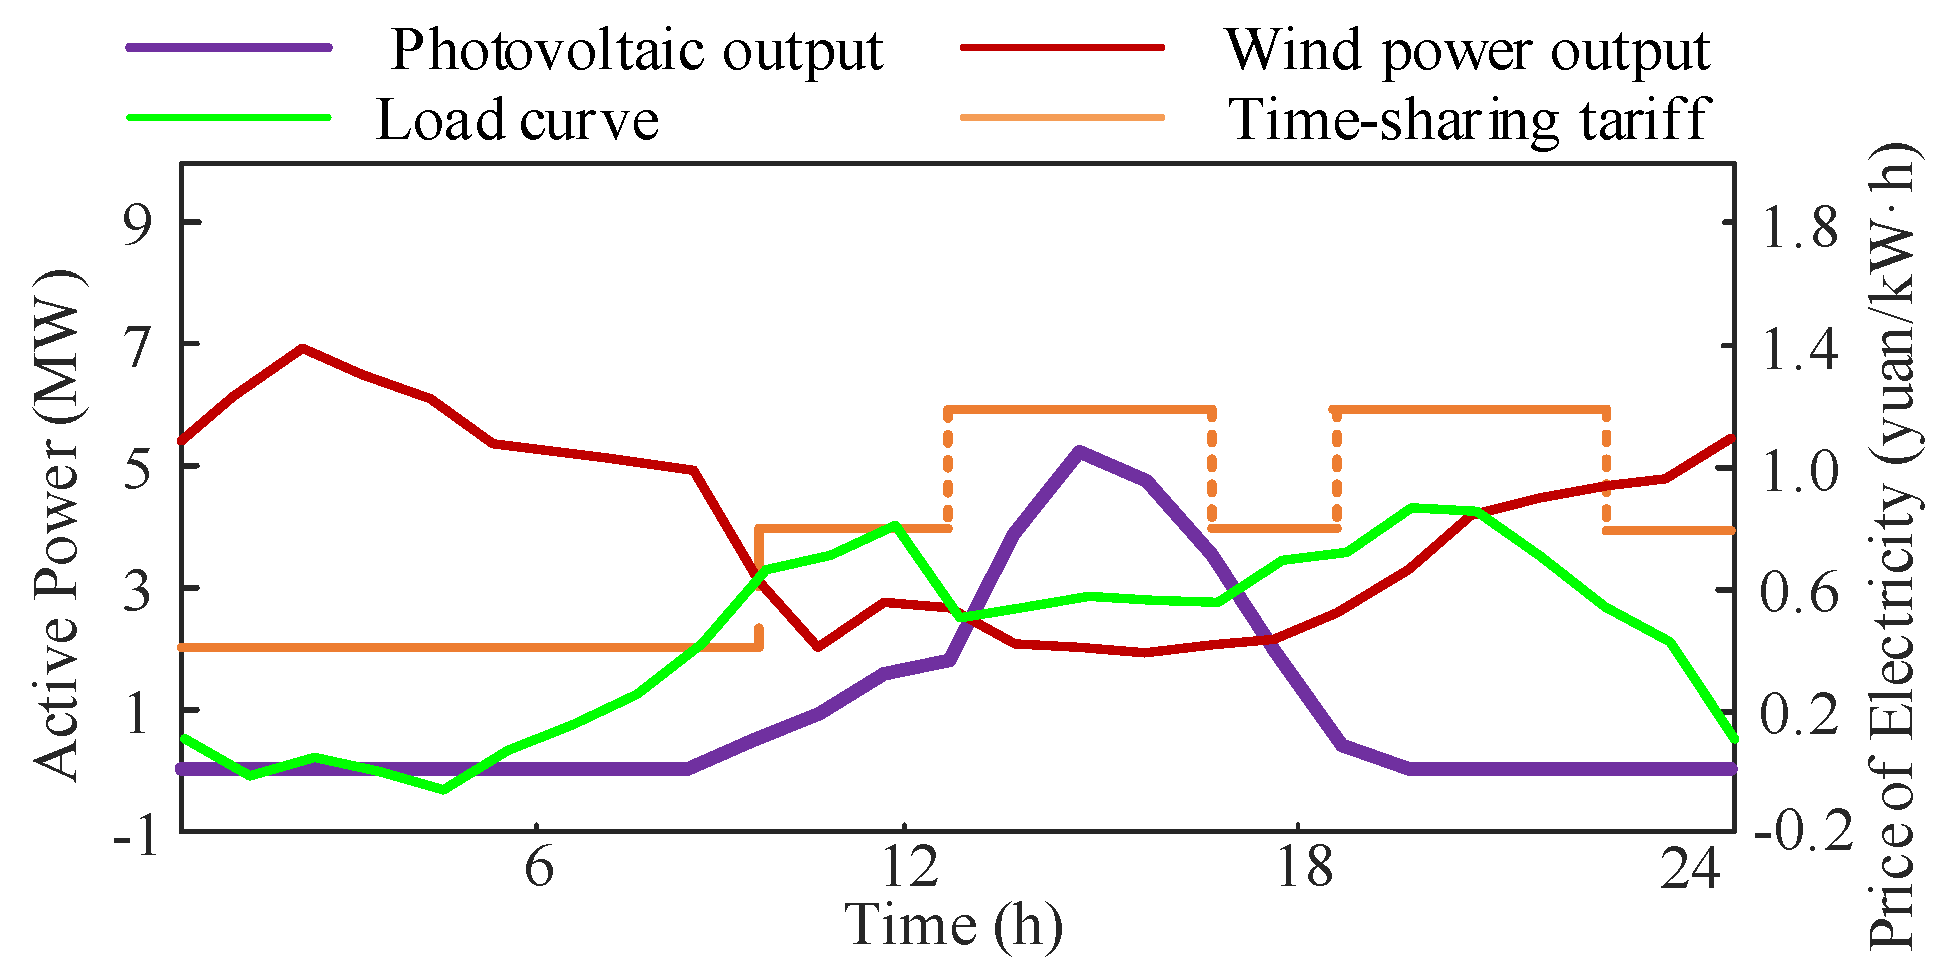
4.1. Example Overview and Parameterization

This paper analyzes the arithmetic case of an IEEE 33-node distribution network. The effectiveness of the proposed multi-objective optimization model is verified by simulation analysis. The distribution network of a bus transport network is shown in Figure 3. In this paper, the proposed mixed-integer second-order cone problem is solved using the CPLEX commercial solver.
The nominal voltage of this distribution system is 12.66 kV. The rated power of the system is 1 MVA. The system’s DG output and time-of-use tariff are shown in Figure 4. The photovoltaic power plant is provided within nodes 4, 9, 14, 20, and 28. Wind power plants are provided in nodes 17 and 32. The EV charging stations are uniformly numbered with English capital letters. The EV charging stations are located in nodes 9, 16, 18, 23, 26, and 31. Each charging station can accommodate up to 60 EVs. The parameters of each piece of equipment in the calculation example are selected from ref. [26]. The total number of EVs in the distribution network in this paper is 200 units. The user’s required power is calculated from their daily driving mileage. The charging arrival and departure times and the daily driving mileage probability density function are referred to in the literature [27].

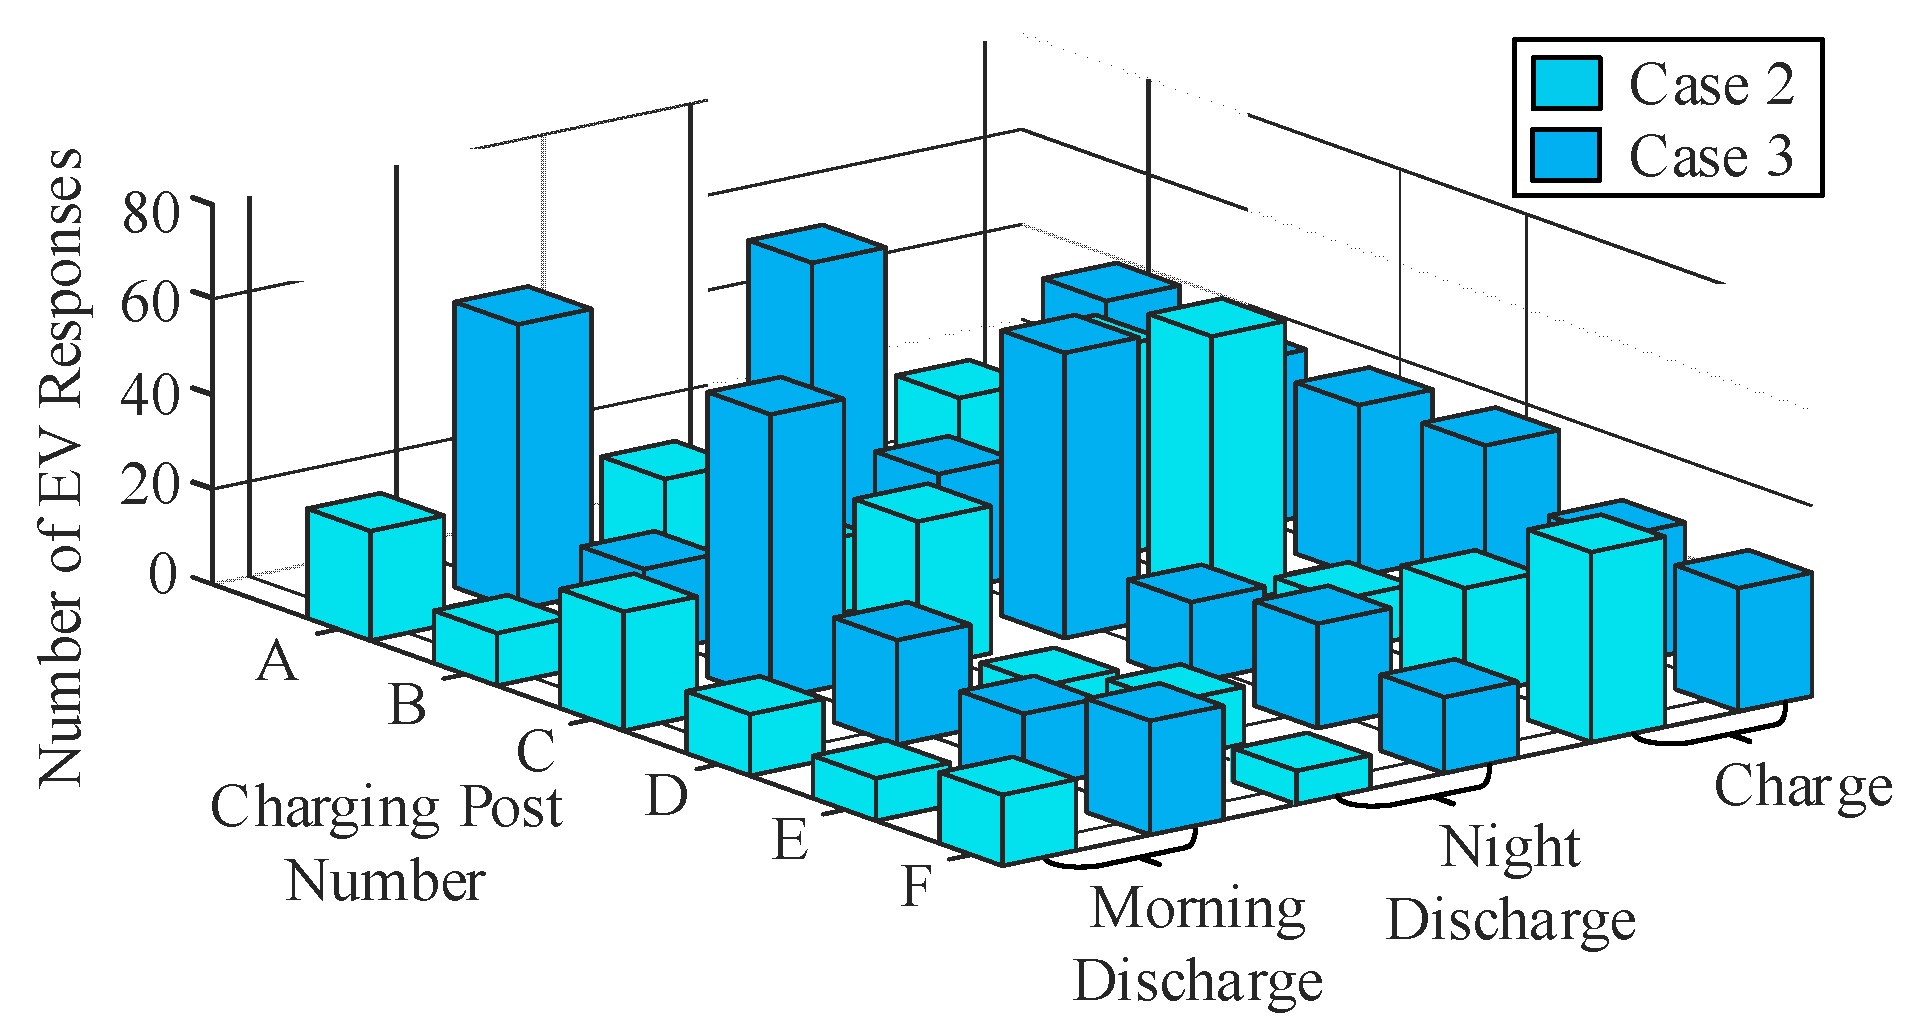
4.2. Simulation Results Analysis

This paper compares the impact of different charging and discharging methods of electric vehicles on the distribution grid. The following three strategies were used in the simulations.
Case 1: The EV does not participate in distribution network optimization and regulation (blank control group).
Case 2: The EV participates in distribution network optimization and regulation in a disordered manner (traditional strategy).
Case 3: The EV actively participates in distribution network optimization and regulation in an orderly manner (the strategy of this paper).

4.2.1. Results Analysis of the Economics of the Distribution Network

Table 2 shows the comparative results of system operation on a single day according to the three scenarios. Table 2 shows that the conventional EV participation strategy provides some reserve energy to the distribution grid. However, the disordered nature of EVs does not effectively reduce the voltage deviation of the distribution network and also increases the burden of other grid-side equipment. In this paper, the EV regulation strategy actively cooperates with the distribution network’s charging and discharging. A better voltage level can be achieved by sacrificing user satisfaction. Compared to the unregulated charging strategy, the strategy in this paper can effectively reduce the cost of overnight system operation by 2.47%. The cost of overnight charging for electric vehicles is reduced by 17.85%. Compared to the traditional charging strategy, the regulation strategy in this paper can effectively reduce the cost of overnight system operation by 6.93%. The cost of overnight charging for electric vehicles is not increased.
From 00:00 to 06:00, the distribution grid’s tariff is low. The base load is also low. The strategy in this paper prompts most of the EV chargers to charge at this time. The distribution grid purchases large amounts of power from the distribution grid to meet its own EV load demand. At 8:00~12:00 and 19:00~22:00, the utilization of EV charging piles by customers decreases. Electricity prices are also higher. The load on the distribution network is also at its peak. The distributed power output is higher. Under the premise of satisfying EV users, it takes the initiative to participate in the cooperative scheduling of the distribution grid and sends the surplus power to the distribution grid to generate revenue.
Figure 5 shows the EVs’ response to the V2G regulation strategy. By comparison, it can be seen that this paper’s scheme avoids the centralized charging phenomenon of the traditional scheme. Each charging pile reserves part of the charging position to meet the emergency load demand. In a traditional system, the participation of electric vehicles in distribution grid scheduling is influenced by factors such as the cost of user trips, etc. In this paper, the system directs EVs to take the initiative to participate in charging and discharging the distribution grid. The travel cost of EV users is fully considered. While ensuring the satisfaction of EV users, the potential of EV scheduling is deeply explored.
A comparison of the reactive power output of the reactive power compensation devices before and after the active participation of EVs in coordination is shown in Figure 6. Compared to the conventional control strategy, the reactive power output of the CB and SVG is lower when using the control strategy in this document. However, this does not lead to a deterioration in voltage levels. On the contrary, the voltage level is also improved. It can be seen that the participation of EVs in joint dispatch can ensure that the voltage level is maintained at an acceptable level at the same time. This can reduce the use of distribution network resources to extend useful life and thus reduce operating costs.

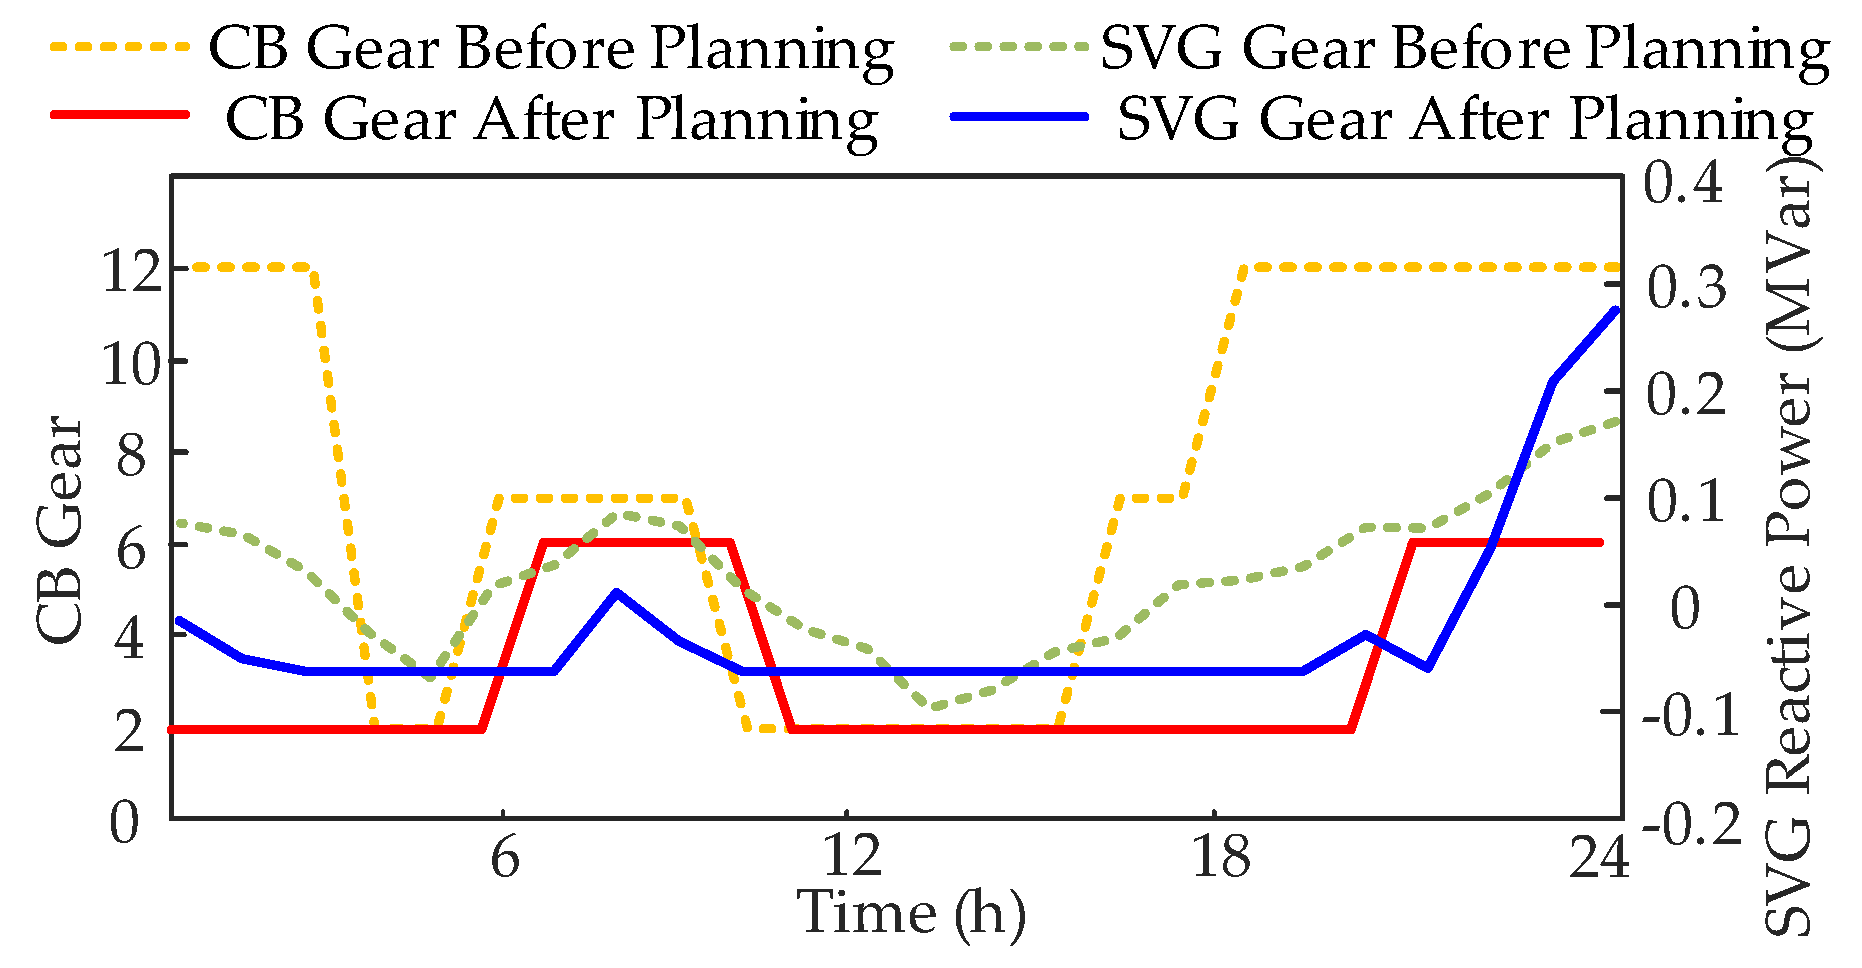
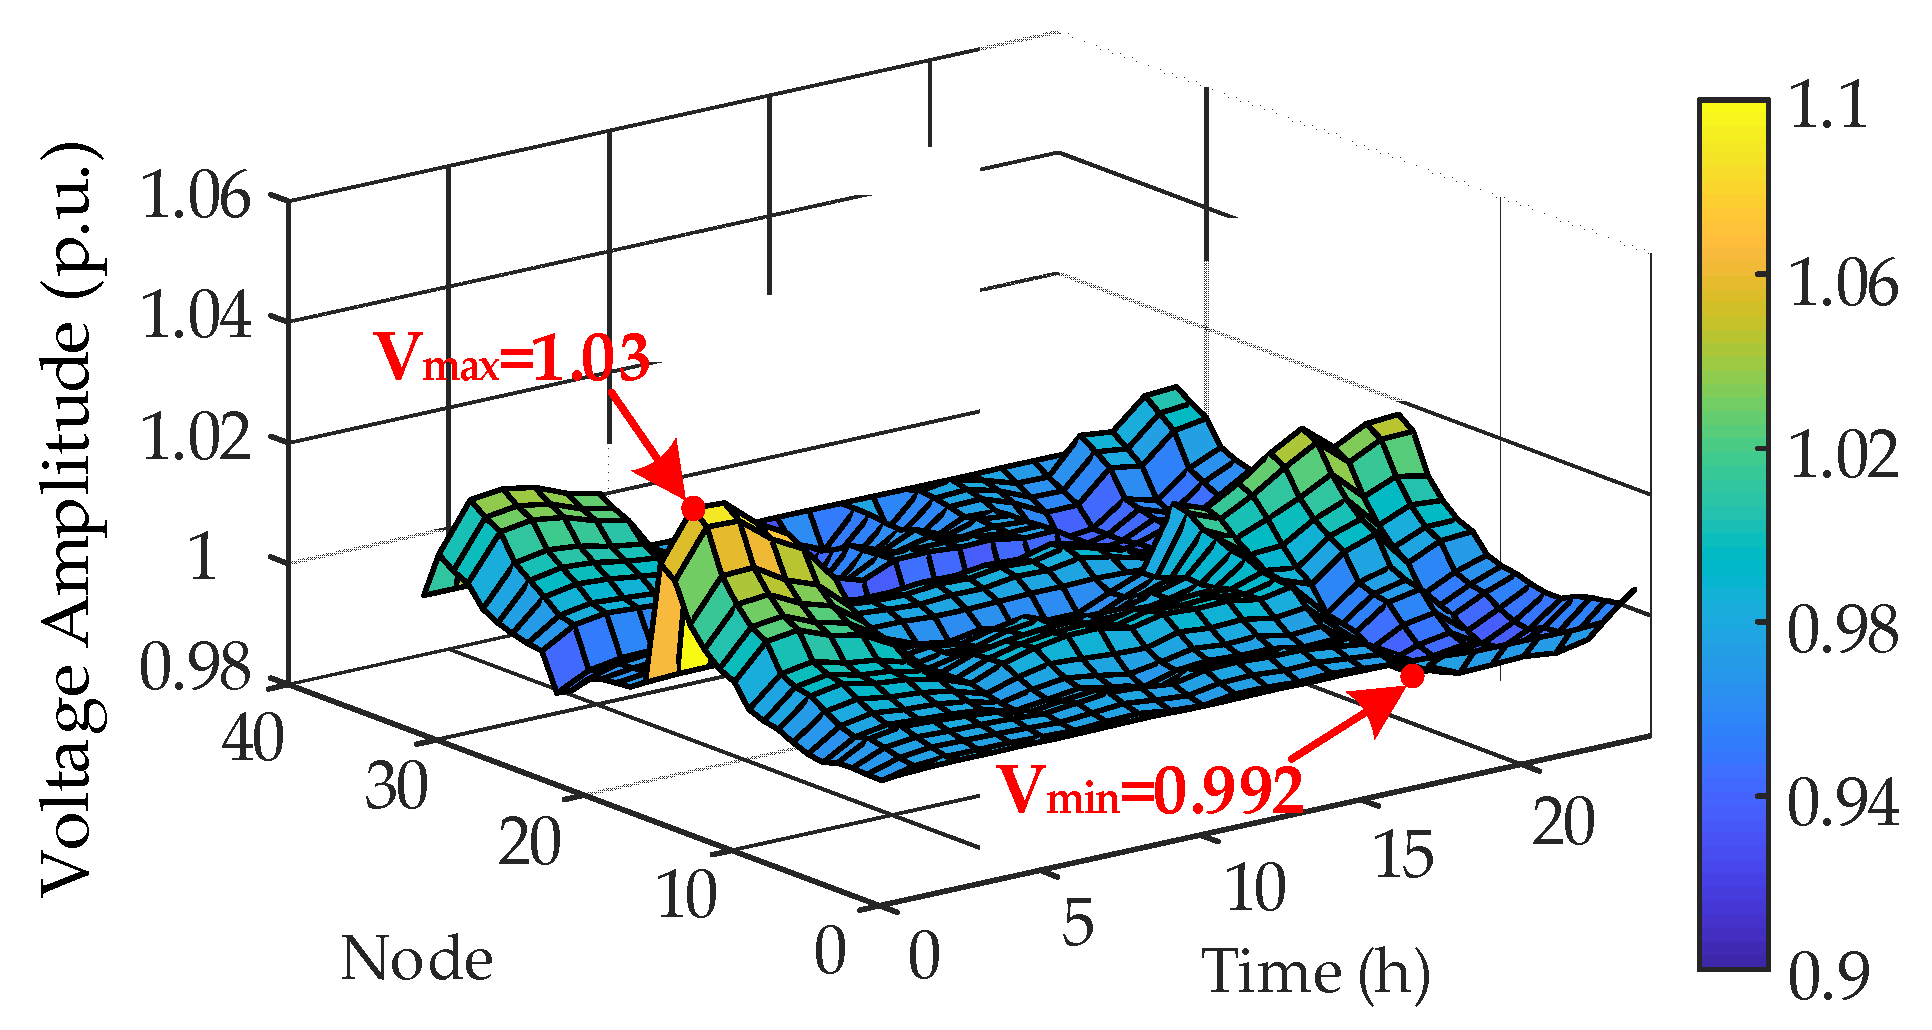
4.2.2. Analysis of Distribution Network Voltage Regulation

Using the optimization method in this paper, we can obtain the distribution network net load profile before and after charging scheduling, as shown in Figure 7.
As shown in Figure 8, the load is superimposed on the load peak in case 1. The load is lower during the valley. The difference between the peak and the valley becomes larger. The load fluctuations increase. Under both the traditional regulation strategy and the optimized regulation strategy in this paper, EV charging is rarely scheduled during the original peak load hours. The charging load can be distributed evenly and reasonably during the scheduling hours. This effectively improves the new peak load that occurs under the scenario that EVs do not participate in distribution network regulation. In addition, EVs are fully utilized to discharge during the low-load hours. This makes EVs actively participate in distribution grid regulation. The results show that the difference between peak load and off-peak for the system proposed in this paper is 29.5% lower than for the empty control group and 6.7% lower than for the traditional strategy. It effectively prevents large-scale electric vehicles from generating new peak loads when charging and discharging during off-peak hours. This prevents the overloading of distribution transformers.
The voltage distributions of cases 1–3 are shown in Figure 8, Figure 9 and Figure 10. From Figure 9, it can be seen that the node voltage has not crossed the limit due to the active management device’s access. However, the system voltage fluctuates greatly. Comparing the voltage of scenarios one and two with scenario three, it can be found that the voltage fluctuation is significantly reduced. From Table 2, it can be seen that the method of this paper can effectively reduce the voltage reference deviation by 75.59% compared to the EV non-participation regulation strategy. The method of this paper effectively reduces the voltage reference deviation by 73.48% compared to the traditional method. Therefore, the method of this paper can reduce the system load’s peak-to-valley difference rate and alleviate the voltage deviation of the distribution network.

5. Conclusions

This paper addresses the problems of low EV user satisfaction and large voltage deviations in the distribution network due to V2G disordered charging and discharging behaviors. This paper proposes an orderly charging and discharging strategy for electric vehicles with integrated consideration of user and distribution grid benefits. The following conclusions are obtained by analyzing the arithmetic examples:
(1)
The comprehensive satisfaction of EV users is carefully quantified by introducing road network road resistance. The comprehensive satisfaction of EV users can guide EVs to actively and orderly participate in grid regulation. The peak-to-valley load difference of the distribution network under the strategy of this paper is 29.52% lower than that of the strategy involving EV non-participation in regulation. It is 6.71% lower than the traditional strategy. Therefore, the strategy of this paper can ensure that the comprehensive satisfaction of EV users is within the acceptable range. In addition, it effectively reduces the peak-to-valley load difference rate of the distribution network.
(2)
The strategy set out in this document takes into account the safe and economic operation of the distribution network and the good experience of electric vehicle users. Compared to a strategy where electric vehicles do not participate, this strategy can effectively reduce the cost of operating the system by 2.47% in one day. At the same time, charging costs for electric vehicles are reduced by 17.85%. The voltage reference deviation is reduced by 75.59%. The strategy presented in this paper can effectively reduce the system operation cost for one day by 6.93% compared to the traditional strategy without distribution system regulation. The cost of charging EVs for one day increased. However, the reference voltage deviation of the system has decreased by 73.48%. The approach in this document thus improves the reliability and economic efficiency of the distribution network. The strategy has practical implications for optimizing and controlling the operation of the distribution network.
It should be noted that this paper only uses the IEEE33 distribution network as an example to analyze and illustrate, and the idea of the integrated regulation strategy proposed in this paper is still applicable to other distribution network topologies containing EVs. Meanwhile, the proposed EV orderly charging and discharging method does not consider the impact of charging pile siting on distribution network load distribution. In addition, the coordination between EVs and traditional equipment (e.g., phase shifters, reactive power compensators, etc.) has not been considered for the time being. In the future, the authors will conduct further in-depth research on the above aspects.

Author Contributions

Conceptualization, Y.C. and Y.G.; methodology, R.Z.; software, R.Z. and J.L. (Jiangang Lu); validation, M.L. and C.W.; formal analysis, M.L.; investigation, R.Z., and J.L. (Jiangang Lu); resources, M.L. and C.W.; data curation, J.L. (Junhao Li); writing—original draft preparation, J.L. (Junhao Li); writing—review and editing, J.L. (Junhao Li); visualization, Y.C. and Y.G.; supervision, M.L. and C.W.; project administration, Y.C.; funding acquisition, Y.G. All authors have read and agreed to the published version of the manuscript.

Funding

This research was funded by the Science and Technology Project of China Southern Power Grid Co., Ltd. (031200KK52222025(GDKJXM20222218)).

Data Availability Statement

The data are unavailable due to privacy.

Conflicts of Interest

The authors declare that this study received funding from Science and Technology Project of China Southern Power Grid Co., Ltd. The funder was not involved in the study design, collection, analysis, interpretation of data, the writing of this article or the decision to submit it for publication. Authors Yizhe Chen and Yifan Gao were employed by the company Zhaoging Power Supply Bureau of Guangdong Power Grid Co., Ltd. Authors Ruifeng Zhao and Jiangang Lu were employed by the company Power Dispatching Control Center of Guangdong Power Grid Corporation. The remaining authors declare that the research was conducted in the absence of any commercial or financial relationships that could be construed as a potential conflict of interest.

Abbreviations

The following abbreviations are used in this manuscript:
EVElectric vehicle
V2GVehicle-to-grid
SOCState of charge
k 1 EV user travel satisfaction
k 2 EV cost satisfaction
MAACOModified Adaptive Ant Colony Optimization
S n i Starting SOC for EV
S S i Expected SOC of EV
E S i Battery capacity of the EV
η ev , ch EV charging efficiency
P ev , ch , i , t EV charging power
Ci(t)Nodal impedance of intersection i at time t
QRoadway traffic flow
CNavigational capability
cSignal period
λGreen letter ratio
qVehicle arrival rate of the road section
hIntersection EV organization degree coefficient
Rij(t)Roadway impedance between intersection i and intersection j at time t
t0Zero flow travel time
α and βImpedance impact factors
C + t Charging tariff costs
c o s t k , i max Highest cost of charging for the user, obtained by scheduling the ith EV in charging station k to charge at the extremes of the highest and lowest tariff periods
c o s t k , i min Lowest cost of charging for the user, obtained by scheduling the ith EV in charging station k to charge at the extremes of the highest and lowest tariff periods
DGDistributed generation
OLTCOn-load tap changer
CBCapacitor banks
SVGStatic VAR generator
FComprehensive operation index of distribution network
CtotalNormalized value of power cost for exchanging power with the distribution network
VsynThe comprehensive level of distribution network voltage
k Comprehensive satisfaction of EV users
λiweighting factor
Ctotal,realTotal distribution network operating costs
Ctotal,maxMaximum costs for distribution network extremes
Ctotal,minMinimum costs for distribution network extremes
CGRICost of exchanging power with the distribution network
CDGDG power generation investment and operation and maintenance cost
CLINDistribution network network loss cost
CREAOperation and maintenance cost of the reactive power compensation device
cGRI,tPurchase and sale price of electricity from the distribution grid
cPV,tUnit operation and maintenance cost of PV
cWD,tUnit operation and maintenance cost of wind turbines
cCB,tUnit operation and maintenance cost of CB
cSVG,tUnit operation and maintenance cost of SVG
cLIN,tUnit network loss price
PVPhotovoltaic
PGRI,tPower exchanged between the distribution grid
PDG,tPV output
PWD,tWind turbine output
QCB,tCB output
QSVG,tSVG output
IijBranch current between node i and node j
rijResistance between node i and node j
Vi,tNode voltage of node i at time t
NbusNumber of nodes in the distribution network
VNReference voltage
pjActive power injected at node j
qjReactive power injected at node j
PijActive power flowing from node i to the next node j
QijReactive power flowing from node i to the next node
xijReactance of the branch between node i and node j
gjConductivity to ground of node j
bjElectricity generation to ground of node j
Iij.maxUpper limits of branch current between node i and node j
Iij.minLower limits of branch current between node i and node j
Vj.maxUpper limits of node voltage at node j
Vj.minLower limits of node voltage at node j
PGRI,tInteractive active power of the higher-level grid
QGRI,tInteractive reactive power of the higher-level grid
PGRI,maxMaximum interactive active power that is allowed to be passed through the branch of the contact between the distribution grid and the higher-level grid
PGRI,minMinimum interactive active power that is allowed to be passed through the branch of the contact between the distribution grid and the higher-level grid
QGRI,maxMaximum interactive reactive power that is allowed to be passed through the branch of the contact between the distribution grid and the higher-level grid
QGRI,minMinimum interactive reactive power that is allowed to be passed through the branch of the contact between the distribution grid and the higher-level grid
VBase,j,tVoltage value on the high-voltage side of the transformer
lj,tSquare of the OLTC ratio
lmax,jSquares of the upper limits of the adjustable OLTC ratio
lmin,jSquares of the lower limits of the adjustable OLTC ratio
lj,sDifference between the OLTC stall s and the square of the stall s-1 ratio
yCB,j,tNumber of groups in operation
YCB,max,jUpper limit of the number of groups of CBs connected at node j
QCB.step,jCompensating power of each group of CBs
NCB.max,jUpper limit of the number of operations
QSVG,min,jLower limits of SVG compensation power
QSVG,max,jUpper limits of SVG compensation power
PDG,j,tActual output of DG assembled at node j at time t
PDG.PRE,j,tPredicted output of DG assembled at node j at period t
SDG,j,maxUpper bounds of the capacity of DG assembled at node j
SDG,j,minLower bounds of the capacity of DG assembled at node j
Pev,ch,i,tEV charging power
Pev,dis,i,tEV discharging power
Pev,ch,i,t,maxMaximum EV charging capacity
Pev,dis,i,t,maxEV Maximum Discharge
TupperLoad peak times
TlowerLoad trough times
ploadActive loads at each node of the distribution network
qloadReactive loads at each node of the distribution network

References

  1. Harsh, P.; Das, D. Optimal coordination strategy of demand response and electric vehicle aggregators for the energy management of reconfigured grid-connected microgrid. Renew. Sustain. Energy Rev. 2022, 160, 112251. [Google Scholar] [CrossRef]
  2. Wang, X.; Guo, Q.; Tu, C.; Che, L.; Xu, Z.; Xiao, F.; Li, T.; Chen, L. A Comprehensive Control Strategy for F-SOP Considering Three-phase Imbalance and Economic Operation in ISLDN. IEEE Trans. Sustain. Energy 2025, 16, 149–159. [Google Scholar] [CrossRef]
  3. Yazdandoust, M.; Golkar, M.A. Participation of aggregated electric vehicles in demand response programs. In Electric Vehicles in Energy Systems: Modelling, Integration, Analysis, and Optimization; Springer: Cham, Switzerland, 2020; pp. 327–357. [Google Scholar]
  4. Şengör, İ.; Çiçek, A.; Erenoğlu, A.K.; Erdinç, O.; Catalão, J.P. User-comfort oriented optimal bidding strategy of an electric vehicle aggregator in day-ahead and reserve markets. Int. J. Electr. Power Energy Syst. 2020, 122, 106194. [Google Scholar] [CrossRef]
  5. Liu, D.; Wang, W.; Wang, L.; Jia, H.; Shi, M. Dynamic pricing strategy of electric vehicle aggregators based on DDPG reinforcement learning algorithm. IEEE Access 2021, 9, 21556–21566. [Google Scholar] [CrossRef]
  6. Wang, X.; Guo, Q.; Tu, C.; Xiao, F.; Chen, Z.; Luo, J.; Hou, Y. A Hybrid Advanced Traction Power Supply Equipment Based on Triple-Port High-Frequency Isolated Converter with its Control Strategy. IEEE Trans. Power Electron. 2025, 10038–10048. [Google Scholar] [CrossRef]
  7. Shojaabadi, S.; Talavat, V.; Galvani, S. A game theory-based price bidding strategy for electric vehicle aggregators in the presence of wind power producers. Renew. Energy 2022, 193, 407–417. [Google Scholar] [CrossRef]
  8. Hamed, A.; Torky, M.; AlJanah, S.; Alshammari, A.; Gaber, T. A blockchain-based fox optimization algorithm for optimizing and securing electrical vehicles charging. IEEE Trans. Intell. Veh. 2024, early access. [Google Scholar] [CrossRef]
  9. Long, T.; Jia, Q.S.; Wang, G.; Yang, Y. Efficient real-time EV charging scheduling via ordinal optimization. IEEE Trans. Smart Grid 2021, 12, 4029–4038. [Google Scholar] [CrossRef]
  10. Zhang, S.; Zhang, S. Efficient Federated Connected Electric Vehicle Scheduling System: A Noncooperative Online Incentive Approach. IEEE Trans. Intell. Transp. Syst. 2025, 26, 3934–3946. [Google Scholar] [CrossRef]
  11. Yao, S.; Wang, P.; Liu, X.; Zhang, H.; Zhao, T. Rolling optimization of mobile energy storage fleets for resilient service restoration. IEEE Trans. Smart Grid 2019, 11, 1030–1043. [Google Scholar] [CrossRef]
  12. Li, H.; Azzouz, M.A.; Hamad, A.A. Cooperative voltage control in MV distribution networks with electric vehicle charging stations and photovoltaic DGs. IEEE Syst. J. 2020, 15, 2989–3000. [Google Scholar] [CrossRef]
  13. Jiang, T.; Dong, X.; Zhang, R.; Li, X. Strategic active and reactive power scheduling of integrated community energy systems in day-ahead distribution electricity market. Appl. Energy 2023, 336, 120558. [Google Scholar] [CrossRef]
  14. Lin, J.; Sun, J.; Feng, Y.; Zheng, M.; Yu, Z. Aggregate demand response strategies for smart communities with battery-charging/switching electric vehicles. J. Energy Storage 2023, 58, 106413. [Google Scholar] [CrossRef]
  15. Dahiwale, P.V.; Rather, Z.H.; Mitra, I. A comprehensive review of smart charging strategies for electric vehicles and way forward. IEEE Trans. Intell. Transp. Syst. 2024, 25, 10462–10482. [Google Scholar] [CrossRef]
  16. Wang, Y.; Bi, J.; Lu, C.; Ding, C. Route guidance strategies for electric vehicles by considering stochastic charging demands in a time-varying road network. Energies 2020, 13, 2287. [Google Scholar] [CrossRef]
  17. Moradipari, A.; Alizadeh, M. Pricing and routing mechanisms for differentiated services in an electric vehicle public charging station network. IEEE Trans. Smart Grid 2019, 11, 1489–1499. [Google Scholar] [CrossRef]
  18. Salam, S.S.A.; Raj, V.; Petra, M.I.; Azad, A.K.; Mathew, S.; Sulthan, S.M. Charge scheduling optimization of electric vehicles: A comprehensive review of essentiality, perspectives, techniques and security. IEEE Access 2024, 12, 121010–121034. [Google Scholar] [CrossRef]
  19. Delice, Y.; Aydemir-Karadag, A.; ÖZen, H. A Heuristic Approach for the Nationwide Charging Station Location Problem for Intercity Trips. IEEE Access 2025, 13, 36348–36358. [Google Scholar] [CrossRef]
  20. Tao, Y.; Qiu, J.; Lai, S.; Sun, X.; Zhao, J. Adaptive integrated planning of electricity networks and fast charging stations under electric vehicle diffusion. IEEE Trans. Power Syst. 2022, 38, 499–513. [Google Scholar] [CrossRef]
  21. Cheng, S.; Wei, Z.; Shang, D.; Zhao, Z.; Chen, H. Charging load prediction and distribution network reliability evaluation considering electric vehicles’ spatial-temporal transfer randomness. IEEE Access 2020, 8, 124084–124096. [Google Scholar] [CrossRef]
  22. Wu, J.; Su, H.; Meng, J.; Lin, M. Electric vehicle charging scheduling considering infrastructure constraints. Energy 2023, 278, 127806. [Google Scholar] [CrossRef]
  23. Wang, M.; Gao, H.; Pan, D.; Sheng, X.; Xu, C.; Wang, Q. Multi-energy load collaborative optimization of the active building energy management strategy. Energies 2024, 17, 2569. [Google Scholar] [CrossRef]
  24. Vu, L.H.; Passow, B.N.; Paluszczyszyn, D.; Deka, L.; Goodyer, E. Estimation of travel times for minor roads in urban areas using sparse travel time data. IEEE Intell. Transp. Syst. Mag. 2020, 13, 220–233. [Google Scholar] [CrossRef]
  25. Zhang, D.; You, X.; Liu, S.; Pan, H. Dynamic multi-role adaptive collaborative ant colony optimization for robot path planning. IEEE Access 2020, 8, 129958–129974. [Google Scholar] [CrossRef]
  26. Sun, X.; Qiu, J. Two-stage volt/var control in active distribution networks with multi-agent deep reinforcement learning method. IEEE Trans. Smart Grid 2021, 12, 2903–2912. [Google Scholar] [CrossRef]
  27. Yan, D.; Yin, H.; Li, T.; Ma, C. A two-stage scheme for both power allocation and EV charging coordination in a grid-tied PV–battery charging station. IEEE Trans. Ind. Inform. 2021, 17, 6994–7004. [Google Scholar] [CrossRef]
Figure 1. Comprehensive EV user satisfaction model.
Energies 18 02305 g001
Figure 2. General block diagram.
Energies 18 02305 g002
Figure 3. Road network—distribution network topology.
Energies 18 02305 g003
Figure 4. Intra-cycle load profiles, DG output, and time-of-day tariffs in distribution networks.
Energies 18 02305 g004
Figure 5. EV response status.
Energies 18 02305 g005
Figure 6. CB and SVC response statuses.
Energies 18 02305 g006
Figure 7. Total load profile of the distribution network for each case.
Energies 18 02305 g007
Figure 8. Case 1’s node voltage distribution.
Energies 18 02305 g008
Figure 9. Case 2’s node voltage distribution.
Energies 18 02305 g009
Figure 10. Case 3’s node voltage distribution.
Energies 18 02305 g010
Table 1. Affiliation function relationships.
Numerical Value
of Affiliation
User Travel SatisfactionFunction Decision
μcom(w)1 w < w com , min
w com , max w w com , max w com , min w com , min w w com , max
0 w > w com , max
μnor(w) 0.6 ( w w n o r , min 1 ) w n o r , max 1 w n o r , min 1 w nor , min 1 w < w nor , max 1
0.6 w nor , max 1 w < w nor , min 2
0.6 ( w n o r , max 2 w ) w n o r , max 2 w n o r , min 2 w nor , min 2 w w nor , max 2
0 w < w nor , min 1 &   w > w nor , max 2
μanx(w)0.25 w > w anx , max  
0.25 ( w w anx , min ) w anx , max w anx , min w anx , min w w anx , max
0 w < w anx , min
Table 2. Optimization results for each cases.
Case1Case2Case3
System operating cost per day/CNY24,658.325,839.724,048.7
Total EV single-day charging cost/CNY4040.53277.53319.4
EV user satisfaction0.4290.4570.391
Voltage reference deviation0.5530.5090.135
Comprehensive indicators of distribution network operation0.9120.8810.769
Disclaimer/Publisher’s Note: The statements, opinions and data contained in all publications are solely those of the individual author(s) and contributor(s) and not of MDPI and/or the editor(s). MDPI and/or the editor(s) disclaim responsibility for any injury to people or property resulting from any ideas, methods, instructions or products referred to in the content.

