Article

Multi-Objective Optimization for the Low-Carbon Operation of Integrated Energy Systems Based on an Improved Genetic Algorithm

1
Grid Planning & Research Center, Guangdong Power Grid Co., Ltd., CSG, Guangzhou 510000, China
2
Guangzhou Institute of Energy Conversion, Chinese Academy of Sciences, Guangzhou 100045, China
3
School of Energy Science and Engineering, University of Science and Technology of China, Hefei 230052, China
*
Author to whom correspondence should be addressed.
These authors contributed equally to this work.
Energies 2025, 18(9), 2283; https://doi.org/10.3390/en18092283
Submission received: 24 March 2025 / Revised: 21 April 2025 / Accepted: 25 April 2025 / Published: 29 April 2025

Abstract

:
As global climate change and energy crises intensify, the pursuit of low-carbon integrated energy systems (IESs) has become increasingly important. This paper proposes an improved genetic algorithm (IGA) designed to optimize the multi-objective low-carbon operations of IESs, aiming to minimize both operating costs and carbon emissions. The IGA incorporates circular crossover and polynomial mutation techniques, which not only preserve advantageous traits from the parent population but also enhance genetic diversity, enabling comprehensive exploration of potential solutions. Additionally, the algorithm selects parent populations based on individual fitness and dominance, retaining successful chromosomes and eliminating those that violate constraints. This process ensures that subsequent generations inherit superior genetic traits while minimizing constraint violations, thereby enhancing the feasibility of the solutions. To evaluate the effectiveness of the proposed algorithm, we tested it on three different IES scenarios. The results demonstrate that the IGA successfully reduces equality constraint violations to below 0.3 kW, representing less than 0.2% deviation from the IES’s power demand in each time slot. We compared its performance against a multi-objective genetic algorithm, a multi-objective particle swarm algorithm, and a single-objective genetic algorithm. Compared to conventional genetic algorithms, the IGA achieved maximum 5% improvement in both operational cost reduction and carbon emission minimization objectives compared to the unimproved single-objective genetic algorithm, demonstrating its superior performance in multi-objective optimization for low-carbon IESs. These outcomes underscore the algorithm’s reliability and practical applicability.

1. Introduction

With the increasing severity of global climate change and energy security challenges, advancing low-carbon energy systems has become an urgent priority [1]. China has proposed the “dual-carbon” goal, which aims to peak carbon emissions before 2030 and achieve carbon neutrality before 2060. To achieve this goal, driving the low-carbon transformation of energy systems is crucial. Integrated energy systems (IESs), which integrate multiple energy forms such as power grids, heating networks, flexible load [2,3], and natural gas networks [4,5], can improve energy utilization efficiency, reduce energy consumption and environmental pollution, and thus become an important means to achieve the “dual-carbon” goal. Through optimization, IES can achieve coordinated utilization of different energy forms, reduce waste, and promote low-carbonization and sustainable development. Therefore, researching and developing low-carbon scheduling optimization methods for IES has significant theoretical and practical value.
With the increasing awareness of environmental protection and energy conservation, countries around the world are gradually implementing more scientific and rational energy pricing mechanisms, such as tiered electricity pricing [6], tiered carbon emission pricing [7], and tiered natural gas pricing [8]. These policies encourage users to conserve energy and reduce carbon emissions through differential pricing, promoting a low-carbon economy and the efficient utilization of energy resources. The scheduling of IES typically involves multiple objective functions, variables, and constraints, and these tiered pricing mechanisms make the optimization problem more complex. Traditional optimization methods struggle to solve this problem effectively. Therefore, the development of optimized scheduling algorithms for IES has become more important.
Ref. [9] proposed a low-carbon economic operation scheme for IESs that establishes an optimization model that considers both carbon emission and economic factors and formulates it as a mixed-integer linear programming problem. Ref. [10] presented a novel IES scheduling model, which considers two objective functions: energy efficiency and total cost, and used multi-objective optimization to solve the proposed model. Ref. [11] proposed a model to address the high operating costs and low energy efficiency of IESs, employing an interior point method based on the Hessian matrix iteration to solve the model. Ref. [12] developed a multi-objective optimization model to address the economic and environmental protection issues of rural IESs and used NSGA-II with the dynamic crowding distance to solve the model. Ref. [13] proposed a stochastic optimization model for IES, considering network dynamic characteristics and psychological preferences, to improve the flexibility of IES and promote the adoption of clean energy. Ref. [14] presented an optimization strategy for IES, considering the volatility of renewable energy, the independence of different energy sources, and profits to maximize economic benefits and improve the operational flexibility of IESs. Ref. [15] proposed an optimization planning model for IESs, considering the coupling relationship between the energy system and production system with uncertainties. A multi-objective stochastic programming model was established, and a Monte Carlo simulation-based NSGA-II algorithm was proposed to solve the model.
At present, heuristic algorithms are predominantly used in the multi-objective optimization research of IESs. Equality constraints represent the balance between thermal and electrical loads in IESs. Most heuristic algorithms handle equality constraints using penalty functions [16], treating them as soft constraints, which may lead to solutions that violate the equality constraints, affecting the normal operation of the system and causing an imbalance between the supply and demand of electrical and thermal energy. Additionally, most current studies do not account for the tiered structures of energy prices and carbon emission prices found in real-world applications.
To address the issues mentioned above, this paper proposes a day-ahead low-carbon scheduling optimization method for IESs based on an Improved Genetic Algorithm (IGA). By improving the crossover, mutation, and offspring selection mechanisms of the GA, the algorithm’s optimization capability and the reasonableness of the solution are significantly enhanced while ensuring that the equality constraints do not produce excessive deviations. This method not only guarantees the feasibility of the scheduling results but also achieves economic operation, effectively solving the optimization problem of day-ahead low-carbon scheduling for IESs.

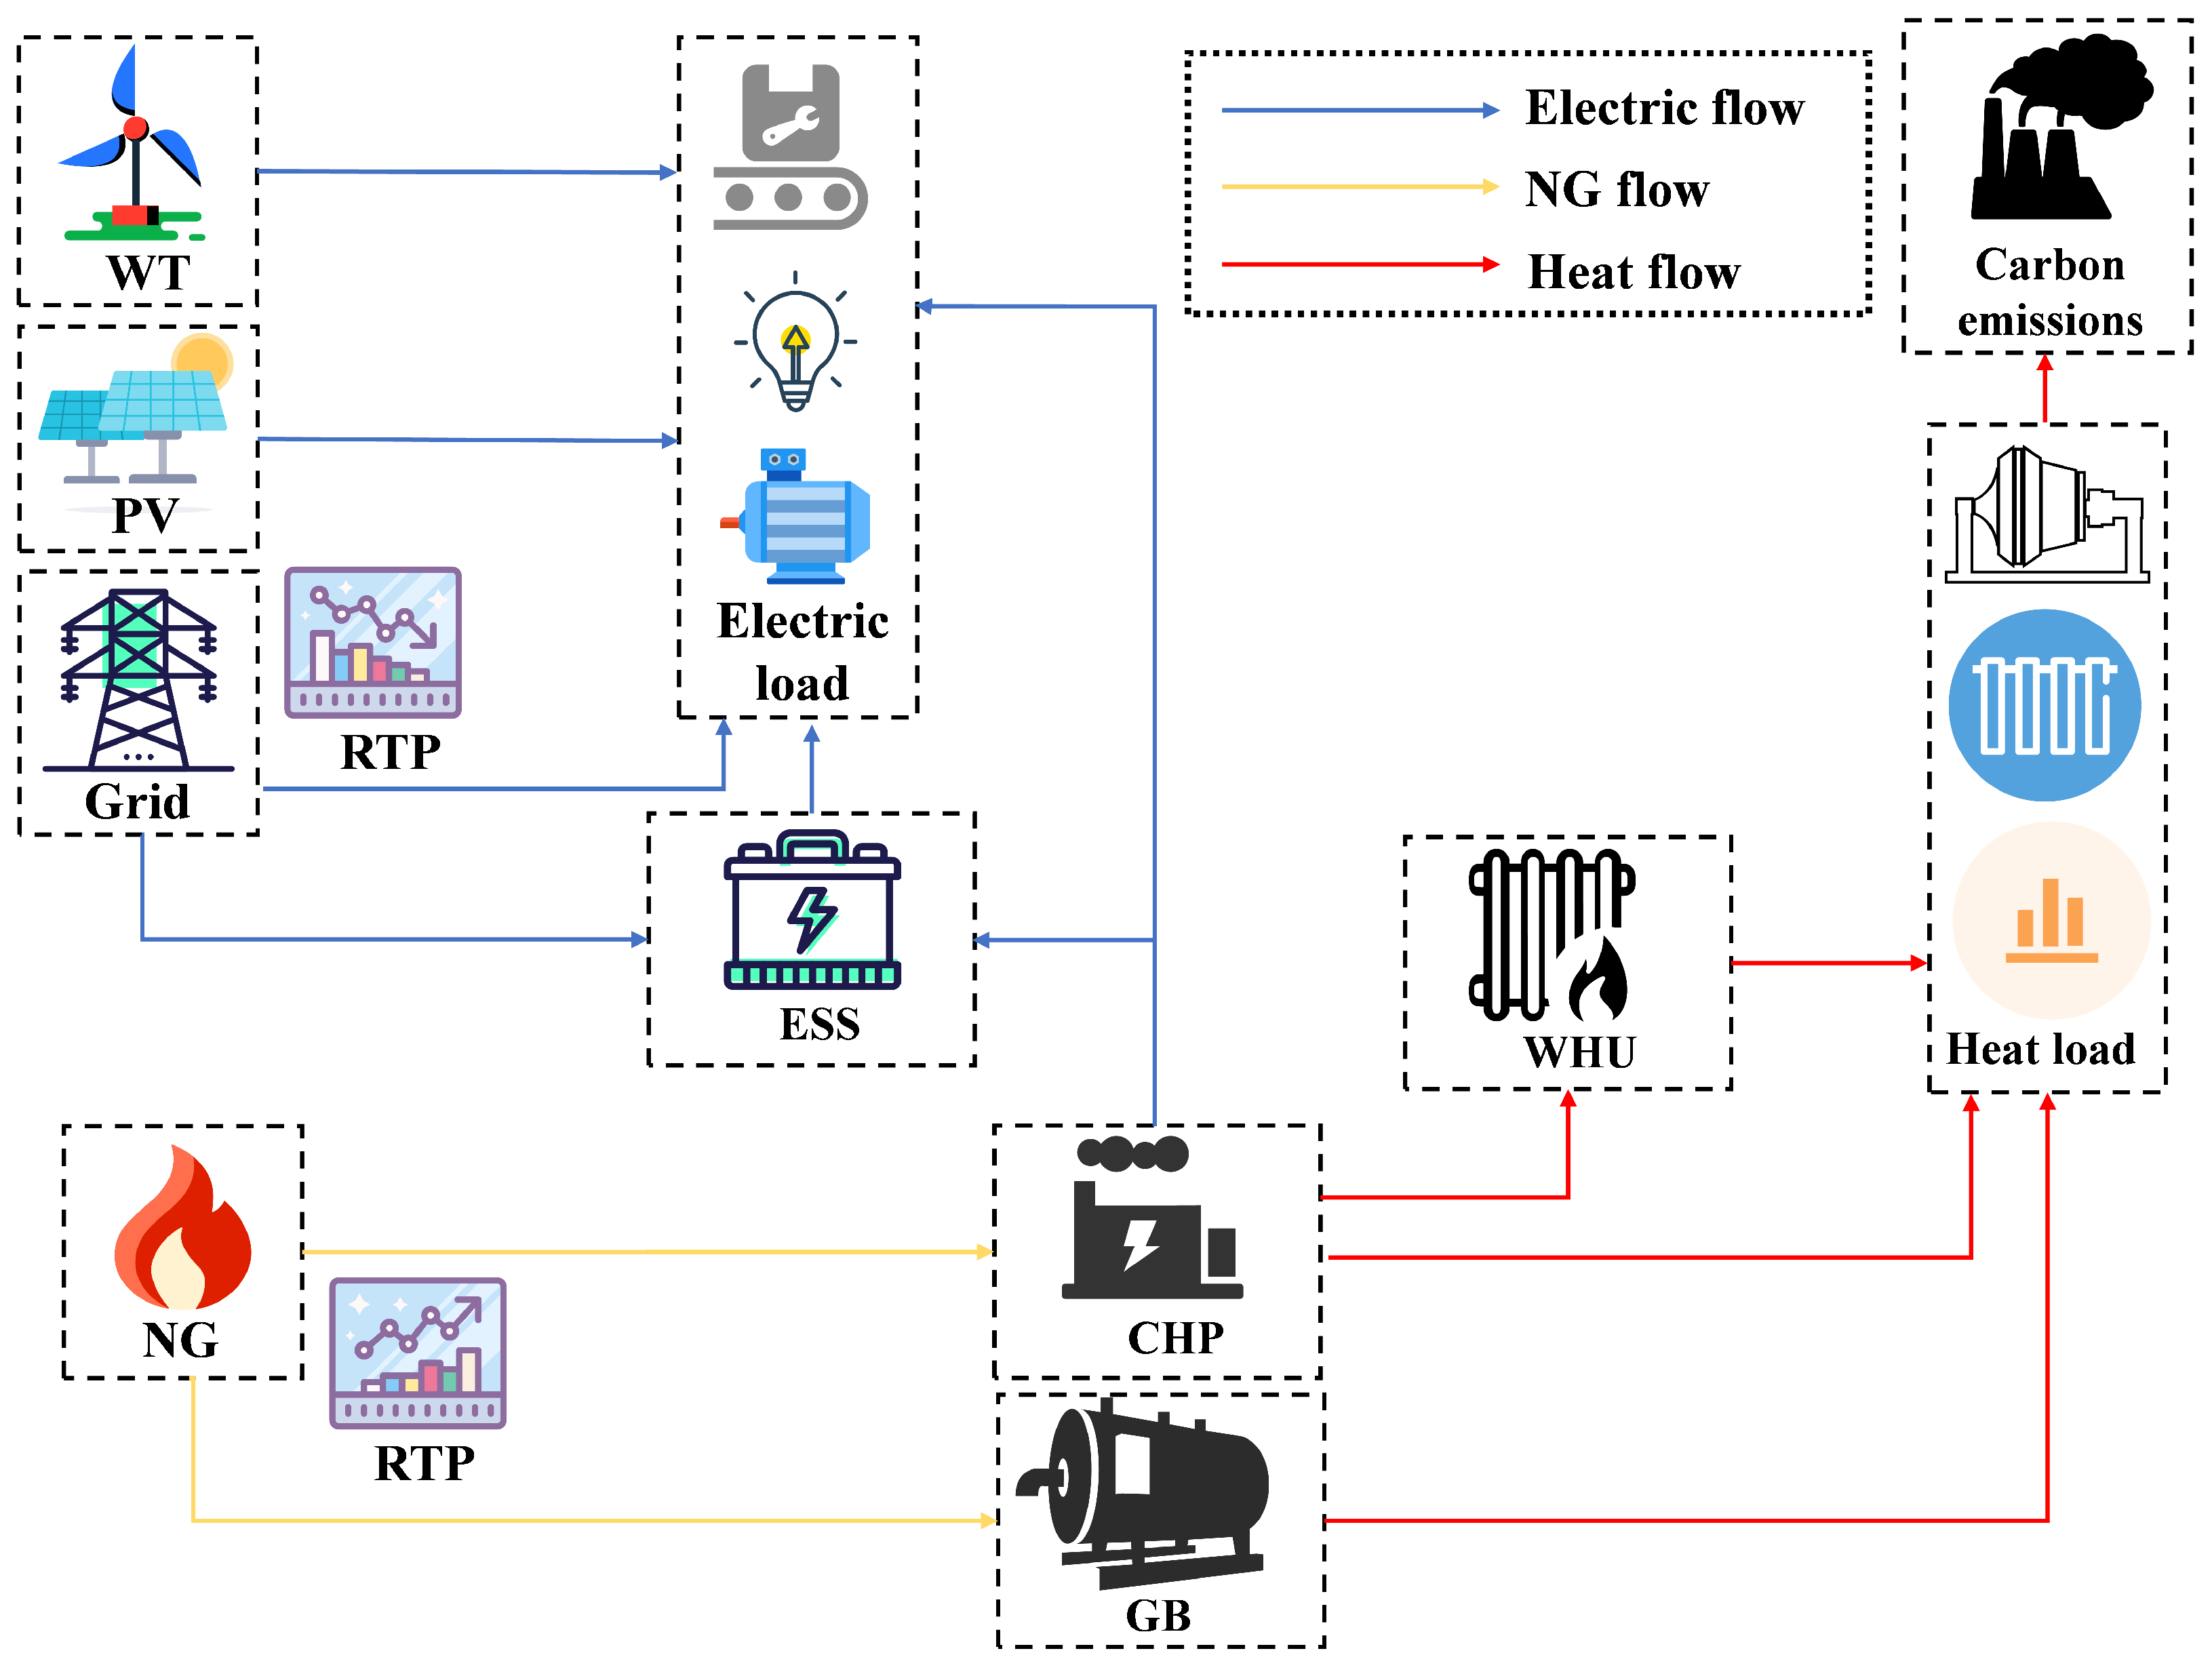
2. Modeling for IES Operation

Figure 1 illustrates the operational diagram of an IES in a certain region, including the transmission processes of electricity, natural gas, and heat. The renewable energy is generated from wind power and solar power [17] and is allocated to electrical devices [18]. Excess electricity is stored in a battery energy storage system (ESS) [19] and can also be used to generate electricity through a combined heat and power (CHP) unit. Natural gas is transmitted through pipelines and serves as fuel for the CHP unit and gas boilers (GB), producing electricity and heat. The heat is distributed to thermal load devices through pipelines and is reused through a waste heat recovery unit (WHU). The flue gas generated by the system is emitted through a chimney.

2.1. Electricity–Heat–Gas IES Modeling

2.1.1. Mathematical Modeling of CHP Units

A CHP unit is a type of power generation equipment that simultaneously produces electricity and heat. It operates by burning natural gas to drive a generator [20], producing electricity, while utilizing the waste heat to provide thermal energy to users. This allows the CHP unit to meet both the electrical and thermal energy demands of users, improving energy utilization efficiency and reducing energy waste. The expression for its electricity generation is:
P t C H P = V t C H P η C H P L N G
where P t C H P is the electricity generation power of the CHP unit at time slot t, V t C H P is the volume of natural gas consumed by the CHP unit at time slot t, η C H P is the efficiency of the CHP unit, and L N G is the lower heating value of natural gas.
The expression for the heat energy produced by the CHP unit is:
Q t C H P = P t C H P 1 η C H P η C H P
where Q t C H P represents the heat generation power of the CHP unit at time slot t.
The constraints for the operation of the CHP unit are:
P t CHP , min P t CHP P t CHP , max
0 Q t CHP Q t CHP , max
where P t CHP , min and P t CHP , max represent the upper and lower limits of the power generation of the CHP unit, respectively, while Q t CHP , max represents the upper limit of the heat production of the CHP unit.
The WHU can improve energy utilization efficiency, reduce the waste heat emissions from the CHP unit, decrease greenhouse gas emissions and air pollutant emissions, and provide a stable heat supply, thereby enhancing the reliability of heat supply. Additionally, the WHU can save fuel costs and operating costs, increasing economic benefits. The mathematical model of the WHU system can be represented as:
Q t WHU = Q t CHP η WHU
0 Q t WHU Q t WHU , max
where Q t WHU and η WHU represent the recovered thermal power and recovery efficiency of the WHU at time slot t, respectively, and Q t WHU , max is the upper limit of the recovered thermal power.

2.1.2. Mathematical Modeling of GB

A GB is a type of boiler equipment that uses natural gas as fuel to produce steam or hot water. It generates high-temperature and high-pressure steam or hot water through the combustion of natural gas, which is then used for industrial production, heating, or other purposes. The working principle of a GB is to mix the natural gas with air, then burn it to produce high-temperature and high-pressure steam, which is transported to the user’s end through pipelines to meet their thermal energy demands. The mathematical model of a GB can be represented as follows:
Q t GB = V t GB η GB L NG
0 Q t GB Q t GB , max
where Q t GB , V t GB , and η GB represent the heat generation power, natural gas consumption volume, and efficiency of the boiler at time slot t, respectively, and Q t GB , max represents the upper limit of its heat generation power.

2.1.3. Mathematical Modeling of Photovoltaic and Wind Power

Wind power generation and solar power generation are two important renewable energy generation methods in IESs. Wind power generation utilizes wind energy to drive wind turbines, producing electricity, while solar power generation uses solar energy to drive photovoltaic panels, also producing electricity. Both can provide IESs with clean electricity. The model of wind power generation and solar power generation in IESs is shown below:
0 P t W T P t W T , max
0 P t P V P t P V , max
where P t P V and P t P V , max represent the power output and upper limit of photovoltaic (PV) generation at time slot t, respectively, while P t W T and P t W T , max represent the power output and upper limit of wind power generation at time slot t, respectively.
The curtailment cost of renewable energy refers to the economic loss caused by the amount of electricity generated from renewable energy sources that is forcibly abandoned. It reflects the economic benefits of renewable energy generation. The calculation formula for curtailment cost is as follows:
C cur = t = 0 T P t PV , max P t PV + P t WT , max P t WT LMP t + M cur + N cur
where C cur represents the cost of abandoned electricity, LMP t is the locational marginal price of electricity purchased by the IES at time slot t, M cur is the maintenance cost of abandoned electricity, and N cur is the environmental cost of abandoned electricity.

2.1.4. Mathematical Model of ESSs

ESSs play a crucial role in IESs. They can provide a stable power supply to the system, helping it to cope with fluctuations in electricity demand. By storing electrical energy, battery ESSs can release energy during peak demand periods, helping the system to meet electricity demand. At the same time, ESSs can also store energy during off-peak periods, helping the system to balance power supply and demand. This improves the reliability and flexibility of the IES. The mathematical model for the operation of the ESS is shown as follows:
S O C t B E = S O C t 1 B E + η c h z t 1 c h P t 1 c h Δ t E B E z t 1 d c h P t 1 d c h Δ t E B E
0 z t c h P t c h z t c h P t c h , m a x
0 z t d c h P t d c h z t d c h P t d c h , m a x
0 z t c h + z t d c h 1
z t c h , z t d c h { 0 , 1 }
0 S O C t B E 1
S O C 1 B E = S O C 24 B E
where S O C t B E represents the state of charge of the ESS at time slot t, P t c h and P t d c h represent the charging and discharging power of the ESS at time slot t, respectively, η c h is the charging efficiency, z t c h and z t d c h are binary variables (0 or 1) that indicate whether the ESS is charging or discharging, respectively, E B E is the capacity of the ESS, and P t c h , m a x and P t d c h , m a x are the maximum charging and discharging power of the ESS, respectively. In order for the ESS to participate in the scheduling of the IES from the next day, the ESS needs to return to its initial capacity at the start of the scheduling day after the end of the scheduling day.

2.2. Operational Optimization Modeling of IES

2.2.1. Tiered Electricity Pricing Mechanism

Assuming a two-tiered electricity pricing structure, when the user’s electricity consumption is below E 0 , the electricity charge is calculated based on the locational marginal price. If the user’s electricity consumption exceeds E 0 , according to the Hong Kong Electric Company [21], the excess consumption is billed at 120% of the locational marginal price. When adopting this tiered electricity pricing structure, the expression for the total electricity purchase cost of the IES is as follows:
C grid = t = 0 T min P t grid Δ t , E 0 LMP t + max 0 , P t grid Δ t E 0 × 1.2 LMP t
where C grid represents the daily electricity purchase cost, P t grid is the amount of electricity purchased from the grid at time slot t, Δ t is the time interval, and LMP t is the locational marginal price of electricity at time slot t.

2.2.2. Tiered Carbon Emission Pricing Mechanism

Under the tiered carbon emission pricing mechanism, the IES is divided into different tiers based on its carbon emissions, with each tier corresponding to a different carbon emission standard and price. The tiered carbon emission cost expression is as follows:
C CO 2 ( e ) = c l 1 CO 2 e 0 e e 1 c l 1 CO 2 e 1 + c l 2 CO 2 ( e e 1 ) e 1 e e 2 c l 1 CO 2 e 1 + c l 2 CO 2 ( e 2 e 1 ) + c l 3 CO 2 ( e e 2 ) e 2 e
where C CO 2 is the total carbon emission cost, c l 1 CO 2 , c l 2 CO 2 , and c l 3 CO 2 are the unit prices of carbon emissions for the first, second, and third stages, respectively, e 1 and e 2 are the emission thresholds, and e is the total carbon emission of the system.

2.2.3. Tiered Natural Gas Pricing Mechanism

Similar to tiered electricity pricing, tiered natural gas pricing implements different pricing policies based on the user’s natural gas consumption and price gradient. If users can control their consumption within a lower price tier, they can enjoy a lower price; however, if their natural gas consumption exceeds a certain tier, they will have to pay a higher price. Following the same tiered pricing principle as electricity, we apply a 120% surcharge to natural gas consumption that exceeds predetermined usage tiers. The expression for the natural gas purchasing cost of the IES is as follows:
C gas = t = 0 T min V t gas , V 0 c t gas + max 0 , V t gas V 0 × 1.2 c t gas
where C g a s represents the daily natural gas purchasing cost, V t g a s represents the natural gas purchasing volume at time slot t, and c t g a s represents the natural gas price at time slot t.

2.2.4. Optimization Modeling of IES Operation

In summary, the low-carbon optimization of IES operation aims to minimize the total operating cost and total carbon emissions while ensuring the normal operation of both electrical and thermal loads. The operating cost includes the cost of purchasing electricity, the cost of purchasing natural gas, the cost of carbon emissions, and the cost of abandoning renewable energy. The costs of abandoning renewable energy, purchasing electricity, and purchasing natural gas are shown in Equations (11), (20), and (21), respectively. The carbon emissions include the emissions from the CHP unit, the emissions from the GB, and the emissions corresponding to the electricity purchased from the power grid, which are shown as follows:
e = e CHP + e GB + e grid
e CHP = t = 0 T γ h P t CHP ε e h + Q t CHP
e GB = t = 0 T γ h Q t GB
e grid = t = 0 T γ e P t grid
where e, e C H P , e G B , and e g r i d represent the total carbon emissions of the IES, the carbon emissions of the CHP unit, the carbon emissions of the GB, and the carbon emissions corresponding to the electricity purchased from the upstream grid, respectively. γ h represents the relationship between unit heat supply and carbon emissions, ϵ e h is the conversion coefficient for converting electrical power to thermal power in the CHP unit, and γ e represents the relationship between unit electricity purchase and carbon emissions.
The objective function for the low-carbon operation of the IES is:
Objective   1 :   min C = C grid + C gas + C co 2 ( e ) + C cur
Objective   2 :   min e = e CHP + e GB + e grid
where C represents the total operating cost of the IES, and C g r i d , C g a s , C c o 2 ( e ) , and C c u r represent the costs of purchasing electricity, purchasing gas, carbon emissions, and curtailment of renewable energy, respectively. e represents the total carbon emissions of the IES, and e C H P , e G B , and e g r i d represent the carbon emissions from the CHP unit, GB, and grid-purchased electricity, respectively.
The operational constraints of the IES are as follows:
V t gas = V t CHP + V t GB
P t CHP + P t grid z t ch P t ch + η dch z t dch P t dch + P t grid + P t PV + P t WT = P t load
Q t CHP + Q t WHU + Q t GB = Q t load ( 1 ) ( 10 ) , ( 12 ) ( 18 )
The decision variables are as follows: V t C H P , V t G B , P t P V , P t W T , P t g r i d , P t c h , P t d c h .

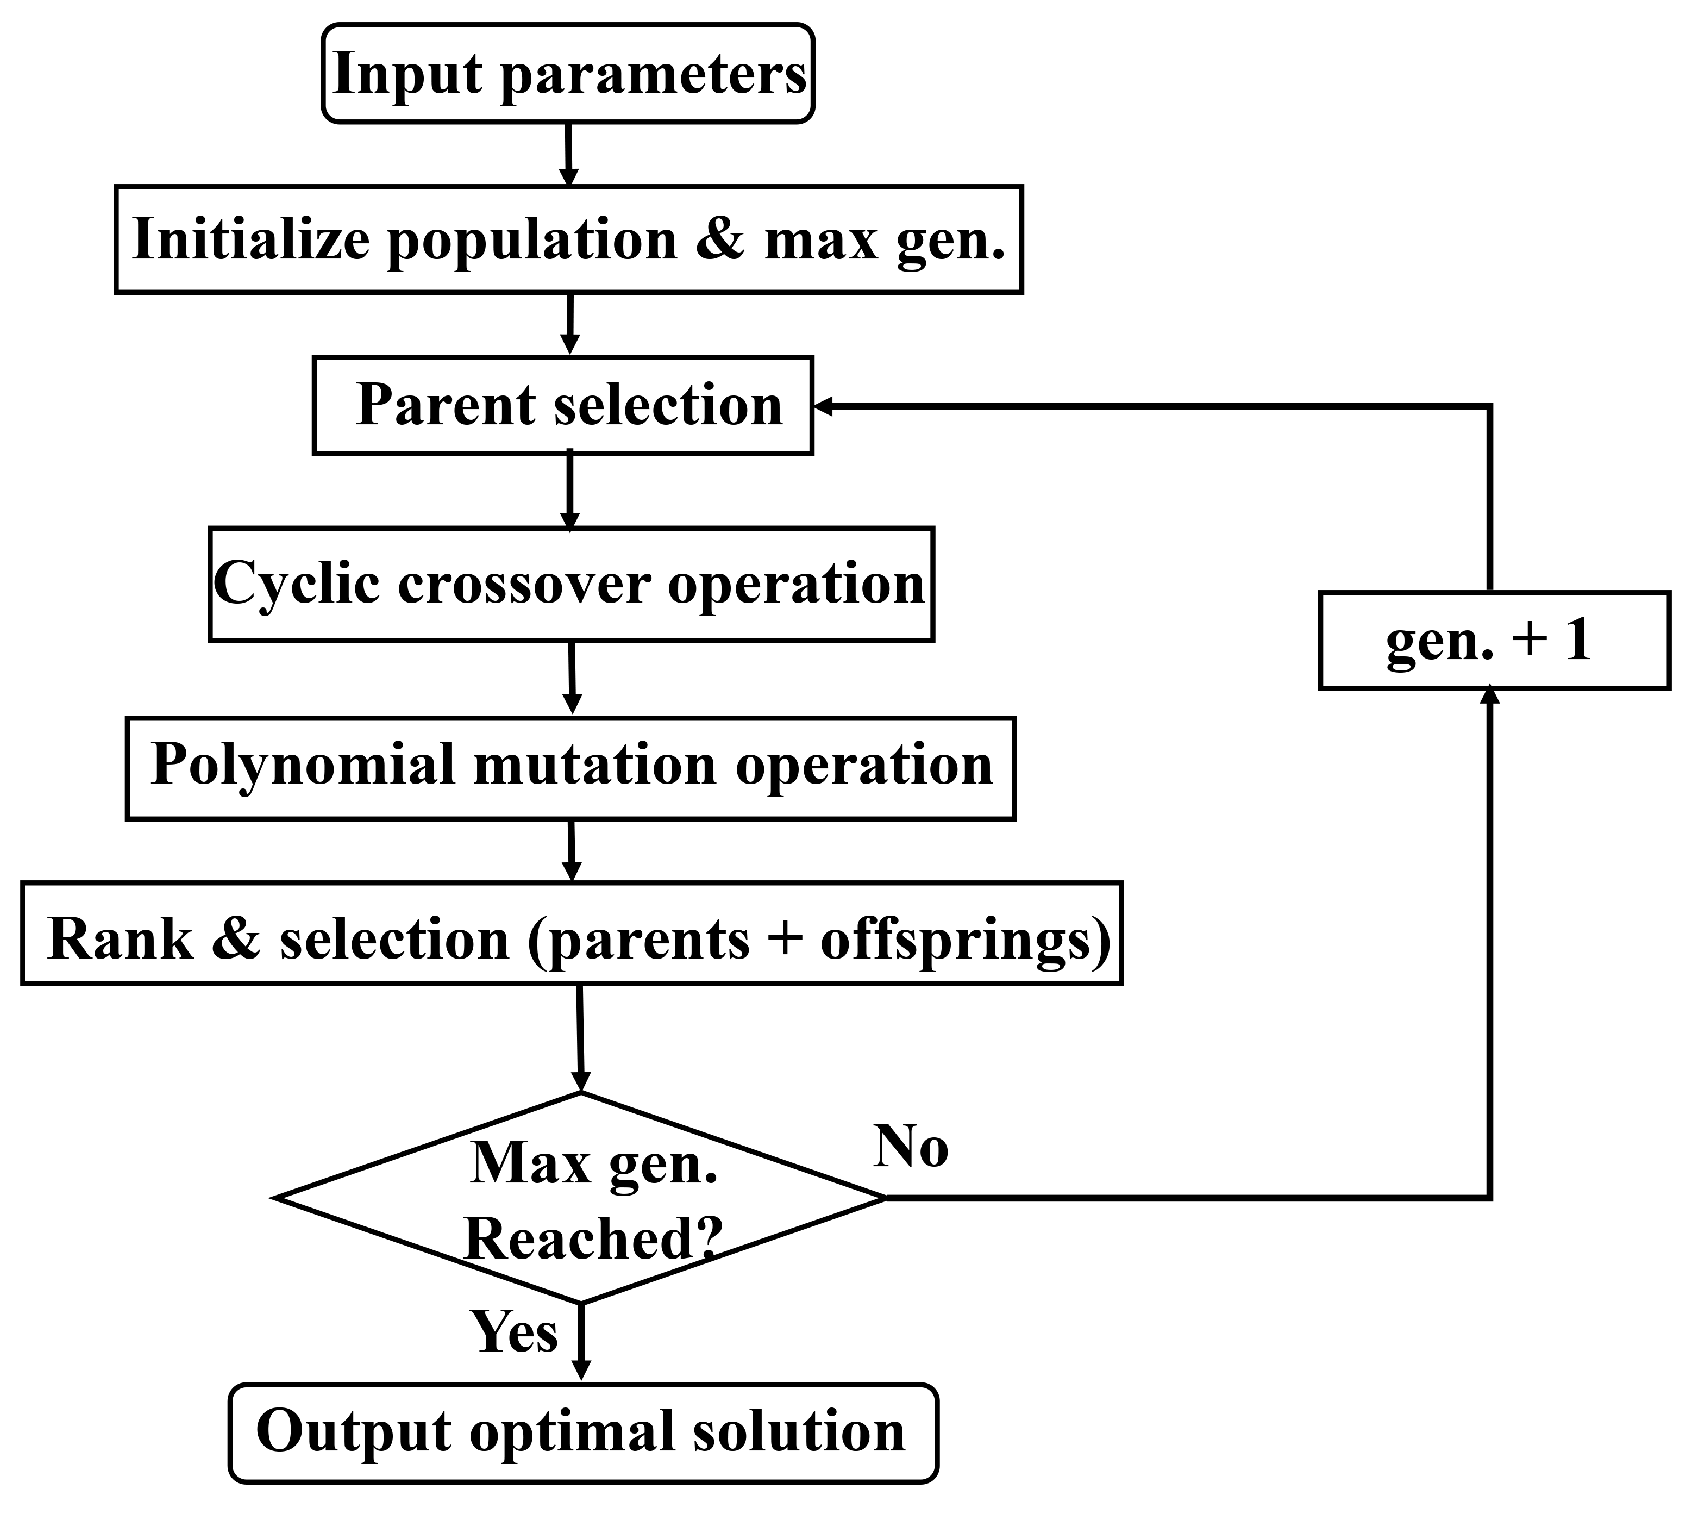
3. Improved Multi-Objective Genetic Algorithm

The GA is an optimization algorithm inspired by natural selection and evolution theory [22]. It is a population-based search algorithm that simulates the process of survival of the fittest and elimination of the weakest in a natural environment. By iteratively evolving individuals in the population, new populations are generated to search for the optimal solution. The five key elements of the GA are chromosome representation, selection, crossover, mutation, and fitness calculation. Chromosome representation refers to the encoding of a solution as a sequence of numbers, known as an individual. Selection involves choosing parent individuals based on their fitness values, with higher fitness values resulting in a higher probability of being selected. Crossover involves combining the chromosomes of two parent individuals to produce new offspring individuals. Mutation involves randomly altering the chromosomes of an individual to increase population diversity. Fitness calculation involves evaluating the quality of an individual, serving as the basis for selection and crossover. The IGA proposed in this paper improves upon the crossover, mutation, and fitness selection, enhancing the algorithm’s computational efficiency and search efficiency while also minimizing the violation of equality constraints.
Figure 2 illustrates the flow chart of the proposed IGA for IES optimization, where the aforementioned IES operational parameters serve as inputs to the algorithm. The process begins with population initialization and determination of the maximum generation count. The parent selection strategy described in Section 3.2 is then applied to identify mating candidates. The process continues with the cyclic crossover operation outlined in Section 3.3 and the polynomial mutation operation detailed in Section 3.4 to generate offspring solutions. Subsequent solution evaluation employs the methodologies from Section 3.5 and Section 3.6 to rank solutions, preserve elite individuals, and eliminate infeasible or poor-performing solutions, with the optimization process terminating upon reaching the maximum generation limit and outputting the optimal solution from the final population.

3.1. Population Initialization

The initial population, X i , consists of a set of decision variables randomly selected within their maximum and minimum boundary limits. The selection of the initial population provides a diverse starting point for the subsequent evolutionary process. In this initial population, each individual represents a set of decision variable values that vary randomly within their maximum and minimum boundary limits. This random selection method ensures that the initial population has sufficient diversity, providing a good starting point for the subsequent evolutionary process. The population initialization is as follows:
X i , j 0 U ( X j min , X j max )
where X i , j 0 represents the jth element of the ith individual in the initial population (0th generation), and X j m i n and X j m a x are the minimum and maximum values of the jth element, respectively. U denotes a uniform random distribution. Subsequently, the objective function values ( o 1 , o 2 ) are calculated for each individual.

3.2. Parent Selection

This paper employs a binary tournament selection method to select parents from the mating pool. The specific implementation process is as follows: two chromosomes are randomly selected from the population, and their objective function values and constraint violation situations are compared. According to the selection principle proposed in this paper, the winning chromosome is retained in the mating pool. This process is repeated until the mating pool is filled with chromosomes.
The selection principle for individuals in this paper is based on the following three principles: (1) Among the individuals that do not violate the constraints, the fast non-dominated sorting algorithm is used to sort the individuals. (2) When compared to individuals that violate the constraints, individuals who do not violate the constraints are considered winners. (3) Among individuals that violate the constraints, the individuals with smaller constraint violation degrees are considered winners.

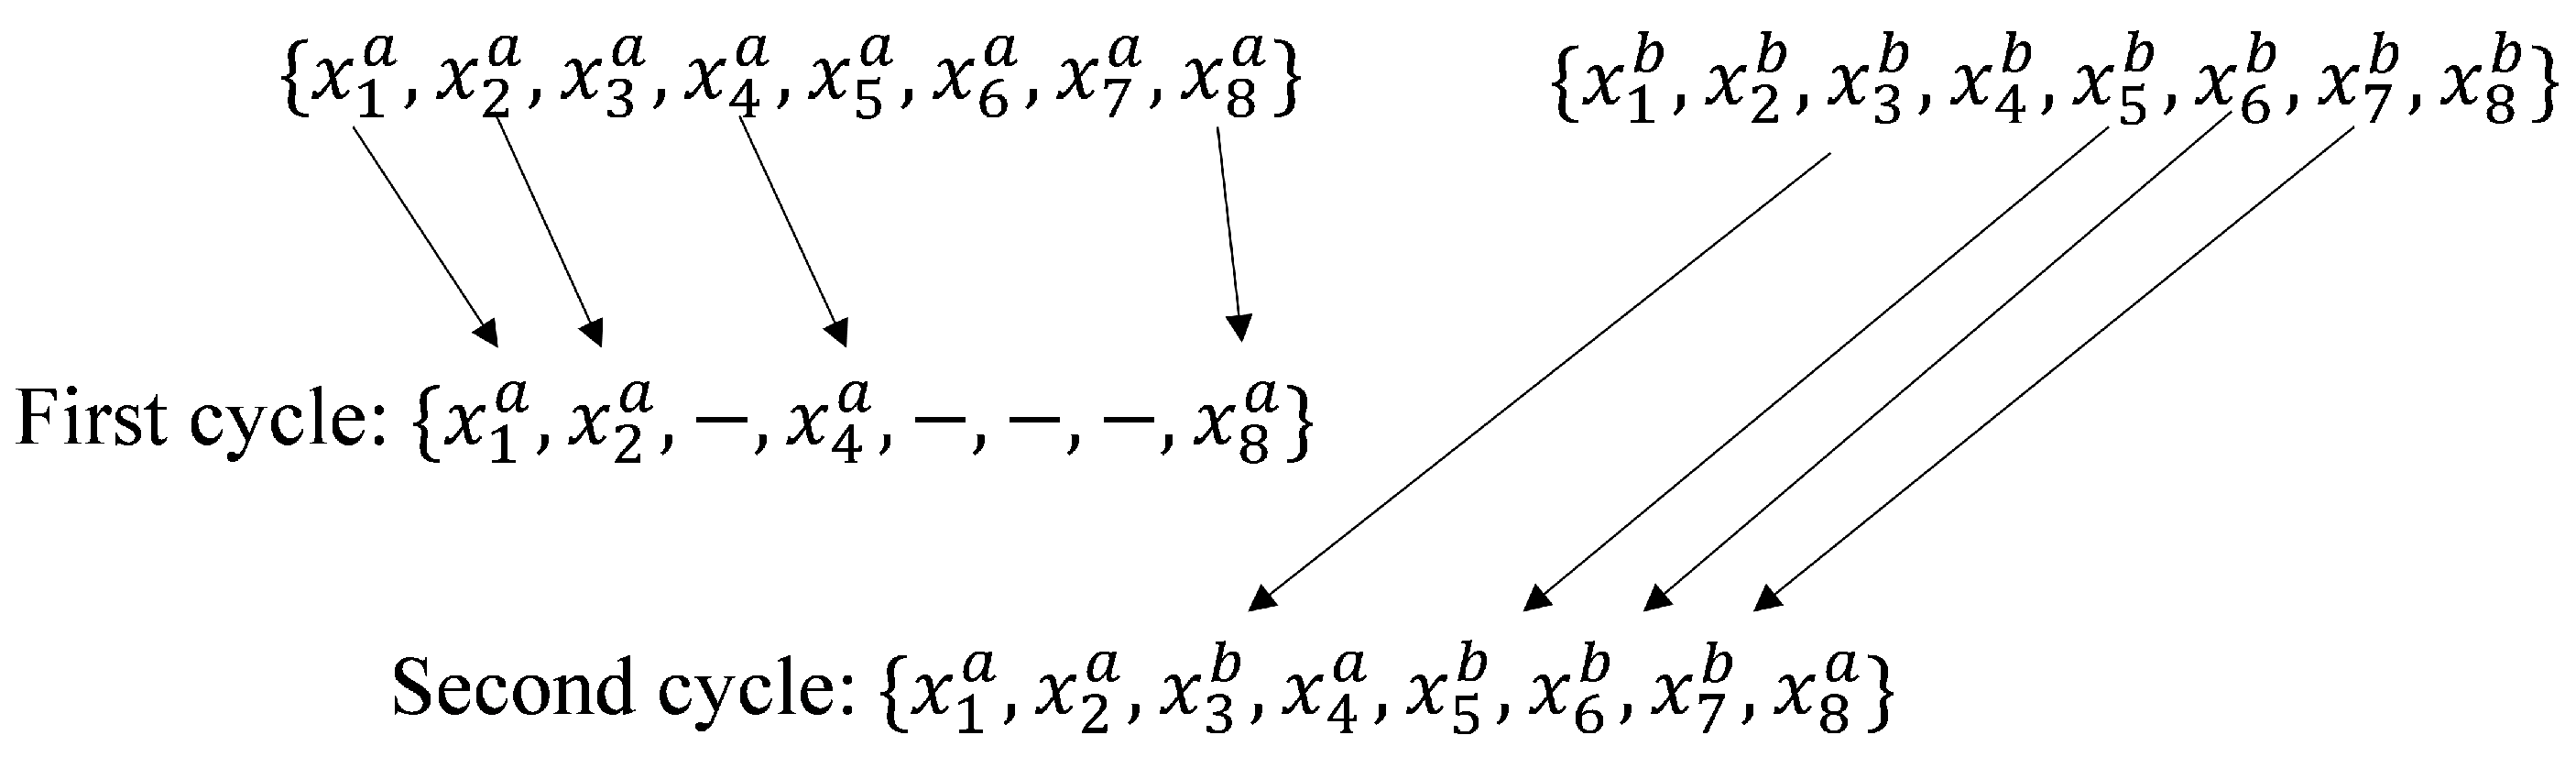
3.3. Cyclic Crossover Operation

This paper employs cyclic crossover operation to generate new offspring from the parents. This method creates a cyclic chain to exchange genes between the parent individuals. First, two parent individuals are selected, and a gene is randomly chosen as the starting point. This gene is copied from parent 1 to offspring 1. Then, the gene in parent 2 that is identical to the starting point gene is found and copied to offspring 2. If this gene already exists in offspring 2, the gene in parent 1 that is identical to this gene is found and copied to offspring 1. This process is repeated until all genes have been copied to the offspring individuals. Finally, the remaining genes are copied from parent 1 to offspring 2 and from parent 2 to offspring 1. A schematic illustration of the cyclic crossover is shown in Figure 3.
The cyclic crossover operation can preserve part of the genetic structure of the parent individuals and generate new offspring individuals. Compared to other crossover methods, the advantage of cyclic crossover lies in its ability to preserve the genetic structure of the parent individuals, making better use of their excellent genes. Additionally, cyclic crossover can avoid producing duplicate gene combinations, thereby increasing the diversity of the population.

3.4. Polynomial Mutation Operation

This paper employs a polynomial mutation operation to introduce new genetic variations. The operation involves randomly mutating the genes of an individual according to a polynomial distribution, which allows the mutation amplitude to be adaptively adjusted based on the individual’s fitness. This advantage enables the avoidance of the problems associated with traditional mutation methods, where the mutation amplitude is either too large or too small. Additionally, polynomial mutation can preserve the excellent genes of an individual, preventing the loss of good genes during the mutation process. The specific operation of polynomial mutation is as follows:
Generate a random number a between 0 and 1. Calculate the parameter σ according to the following formula.
σ = 2 a + ( 1 2 a ) ( 1 ψ ) ( β m + 1 ) 1 / ( β m + 1 ) 1 if a 0.5 1 2 a + ( 1 2 a ) ( 1 ψ ) ( β m + 1 ) 1 / ( β m + 1 ) if a > 0.5
The intermediate populations, x p 1 and x p 2 , are calculated as follows:
x p 1 = 0.5 [ x 1 + x 2 γ ( | x 1 x 2 | ) ]
x p 2 = 0.5 [ x 1 + x 2 + γ ( | x 1 x 2 | ) ]
ψ = min [ ( x p 1 x min ) , ( x max x p 2 ) ] ( x max x min )
where x 1 and x 2 are the two parent individuals, and γ is a random number that follows a polynomial probability distribution. The parameter β m is the distribution index of the mutation, which can take any non-negative value. In this paper, it is initially set to 1, as this value provides a balanced mutation distribution that neither overly favors large-scale exploration nor restricts the search to fine-tuned exploitation. A value of β m = 1 often corresponds to a symmetric and uniform-like distribution, ensuring a reasonable initial exploration capability while maintaining stability in early iterations. The value of β m can then be iteratively adjusted using the following formula:
β m = β m min + n
where β m m i n is the initial value of the mutation distribution index, and n is the number of iterations.
Then, the objective function values and constraint violation situations are calculated for each offspring.

3.5. Selection Between Parents and Offspring

In contrast to other heuristic algorithms, which often use penalty functions to guide the algorithm to comply with constraints, the IGA introduces the concept of population fitness, seeking the optimal solution through the evolution of the population. According to the selection principle proposed in this paper, the winning chromosomes are retained, and individuals that violate the constraints are eliminated. This ensures that the subsequent offspring can inherit the excellent genes from their parents, gradually reducing the degree of constraint violation and ultimately yielding a feasible solution.

3.6. Fast Non-Dominated Sorting

Fast Non-Dominated Sorting (FNS) is the core mechanism enabling our IGA to simultaneously minimize operating costs and carbon emissions in IES. The algorithm achieves this through a structured four-step process that maintains and evolves high-quality solutions across both objectives.
In the initialization phase, each solution in the population is evaluated against both objective functions: total operating cost (26) and carbon emissions (27). The algorithm then performs non-dominated sorting by systematically comparing solutions to identify those that are Pareto-optimal. A solution is considered non-dominated if there exists no other solution in the population that is better in both objectives. For our specific problem, this means identifying solutions where no alternative solution exists that has both lower operating costs and lower carbon emissions. These non-dominated solutions form the first Pareto front (rank 1).
The crowding distance calculation according to ref. [23] then ensures diversity preservation along both objective dimensions. For operating costs, we measure the normalized distance between adjacent solutions when sorted by cost values. Similarly, for emissions, we calculate the normalized distance between neighbors when sorted by emission values. The crowding distance is the sum of these individual objective distances. This dual-objective distance metric is crucial—it prevents the algorithm from clustering solutions that excel in just one objective (e.g., very low cost but high emissions), instead maintaining a diverse spread of trade-off solutions across the Pareto front.
The sorting process explicitly considers the relationship between our two optimization targets. When comparing two solutions, Solution A dominates Solution B only if A’s operating cost ≤ B’s cost and A’s emissions ≤ B’s emissions, with at least one strict inequality. This strict dual-criteria comparison ensures that the evolutionary process consistently moves the population toward solutions that genuinely improve both objectives, rather than just one.
Through iterative application of this non-dominated sorting and crowding distance calculation across generations, the IGA progressively builds a Pareto front representing the optimal trade-offs between cost and emissions. The final selection from this front using the weighted sum in (37) then provides operators with solutions that achieve the desired balance between economic and environmental performance for their specific integrated energy system.

3.7. Weight-Based Pareto Solution Selection
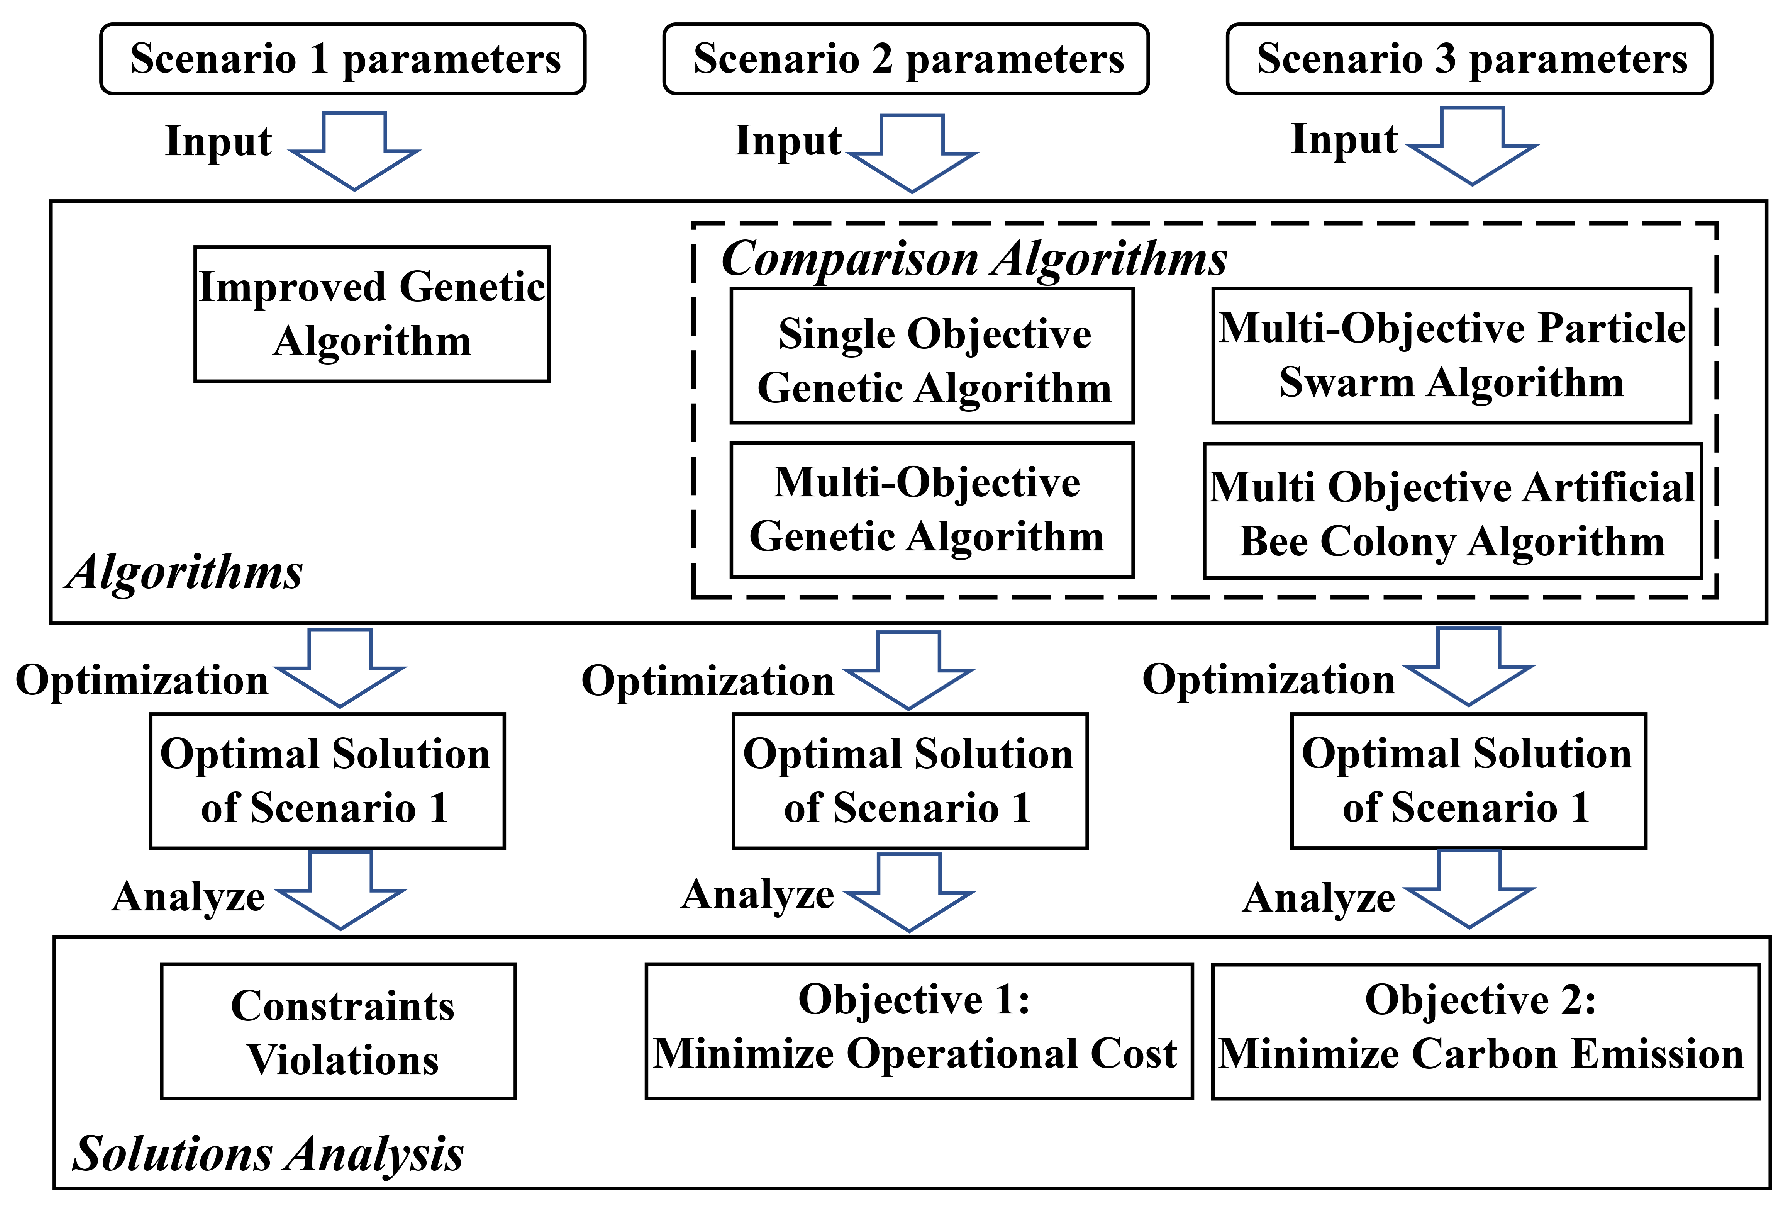
Since the multi-objective optimization algorithm yields a set of non-dominated solutions distributed on the Pareto front, further selection is required. This paper employs a weight-based method to select the Pareto solutions. We assume that a total of n solutions are obtained, and ( o 1 k , o 2 k ) represents the kth solution. Suppose that the operator of the IES considers minimizing operating costs and minimizing carbon emissions to be equally important, so the weight coefficients w 1 and w 2 are both set to 1. The score of the kth solution can be calculated as:
s k = w 1 o 1 k + w 2 o 2 k
where s k is the score of the kth solution. The solution with the lowest score is considered the optimal solution chosen by the operator of the IES.

4. Case Study

4.1. Case Study Setup

The operational parameters of various IES components serve as inputs for the IGA, which have been adapted from ref. [24]. Key optimization-sensitive parameters—like the output boundaries of the CHP unit and GB—have been modified to better suit our case study. For practical applications, these parameters can be configured with actual operational values to optimize real-world IES performance. The parameter settings of the IES in this paper are as follows: the efficiency of the CHP unit is η C H P = 0.9 , the efficiency of the WHU is η W H U = 0.6 , and the efficiency of the boiler is η G B = 0.85 . The lower heating value of natural gas is L N G = 9.7 kWh/m3. The upper and lower limits of the electrical power of the CHP unit are P t C H P , m i n = 50 kW and P t C H P , m a x = 250 kW, respectively, and the upper limit of the thermal power of the CHP unit is Q t C H P , m a x = 125 kW. The upper limit of the boiler’s heat production is Q t G B , m a x = 150 kW. The maximum charging and discharging power of the ESS are P t c h , m a x = P t d c h , m a x = 30 kW, and its initial state of charge is S O C 1 E S S = 50 % . The capacity of the ESS is E E S S = 200 kWh, and the critical values for the tiered electricity price are E 0 = 175 kWh. The critical values for the tiered carbon price are e 1 = 5000 m3, e 2 = 6000 m3, and e 3 = 6500 m3, and the critical value for the tiered gas price is V 0 = 50 m3. The relationship between unit heat supply and carbon emissions is γ h = 0.6 , and the conversion coefficient for the electrical and thermal power of the CHP unit is ϵ e h = 3.6 . The conversion coefficient for the unit electricity purchase and carbon emissions is γ e = 0.997 , and the unit gas price is c t g a s = 2.5 CNY/m3. The tiered carbon emission prices are c l 1 c o 2 = 0.2 CNY/m3, c l 2 c o 2 = 0.3 CNY/m3, and c l 3 c o 2 = 0.4 CNY/m3, and the maintenance and environmental costs of abandoned electricity are M c u r = 1.5 CNY/kWh and N c u r = 1 CNY/kWh, respectively.
Figure 4 illustrates the research framework of the case study, where the aforementioned IES operational parameters serve as inputs to the algorithm, while four comparative algorithms—Multi-Objective Genetic Algorithm (MGA), Multi-Objective Particle Swarm Optimization (MPSO), Single-Objective Genetic Algorithm (SGA), and Multi-Objective Artificial Bee Colony Algorithm (MABC)—are employed for performance benchmarking. Following optimization, the obtained optimal solutions across all scenarios are analyzed based on three key metrics: (1) degree of constraint violation, (2) objective function 1 value (IES operational cost), and (3) objective function 2 value (IES carbon emissions), thereby comprehensively evaluating each algorithm’s performance.

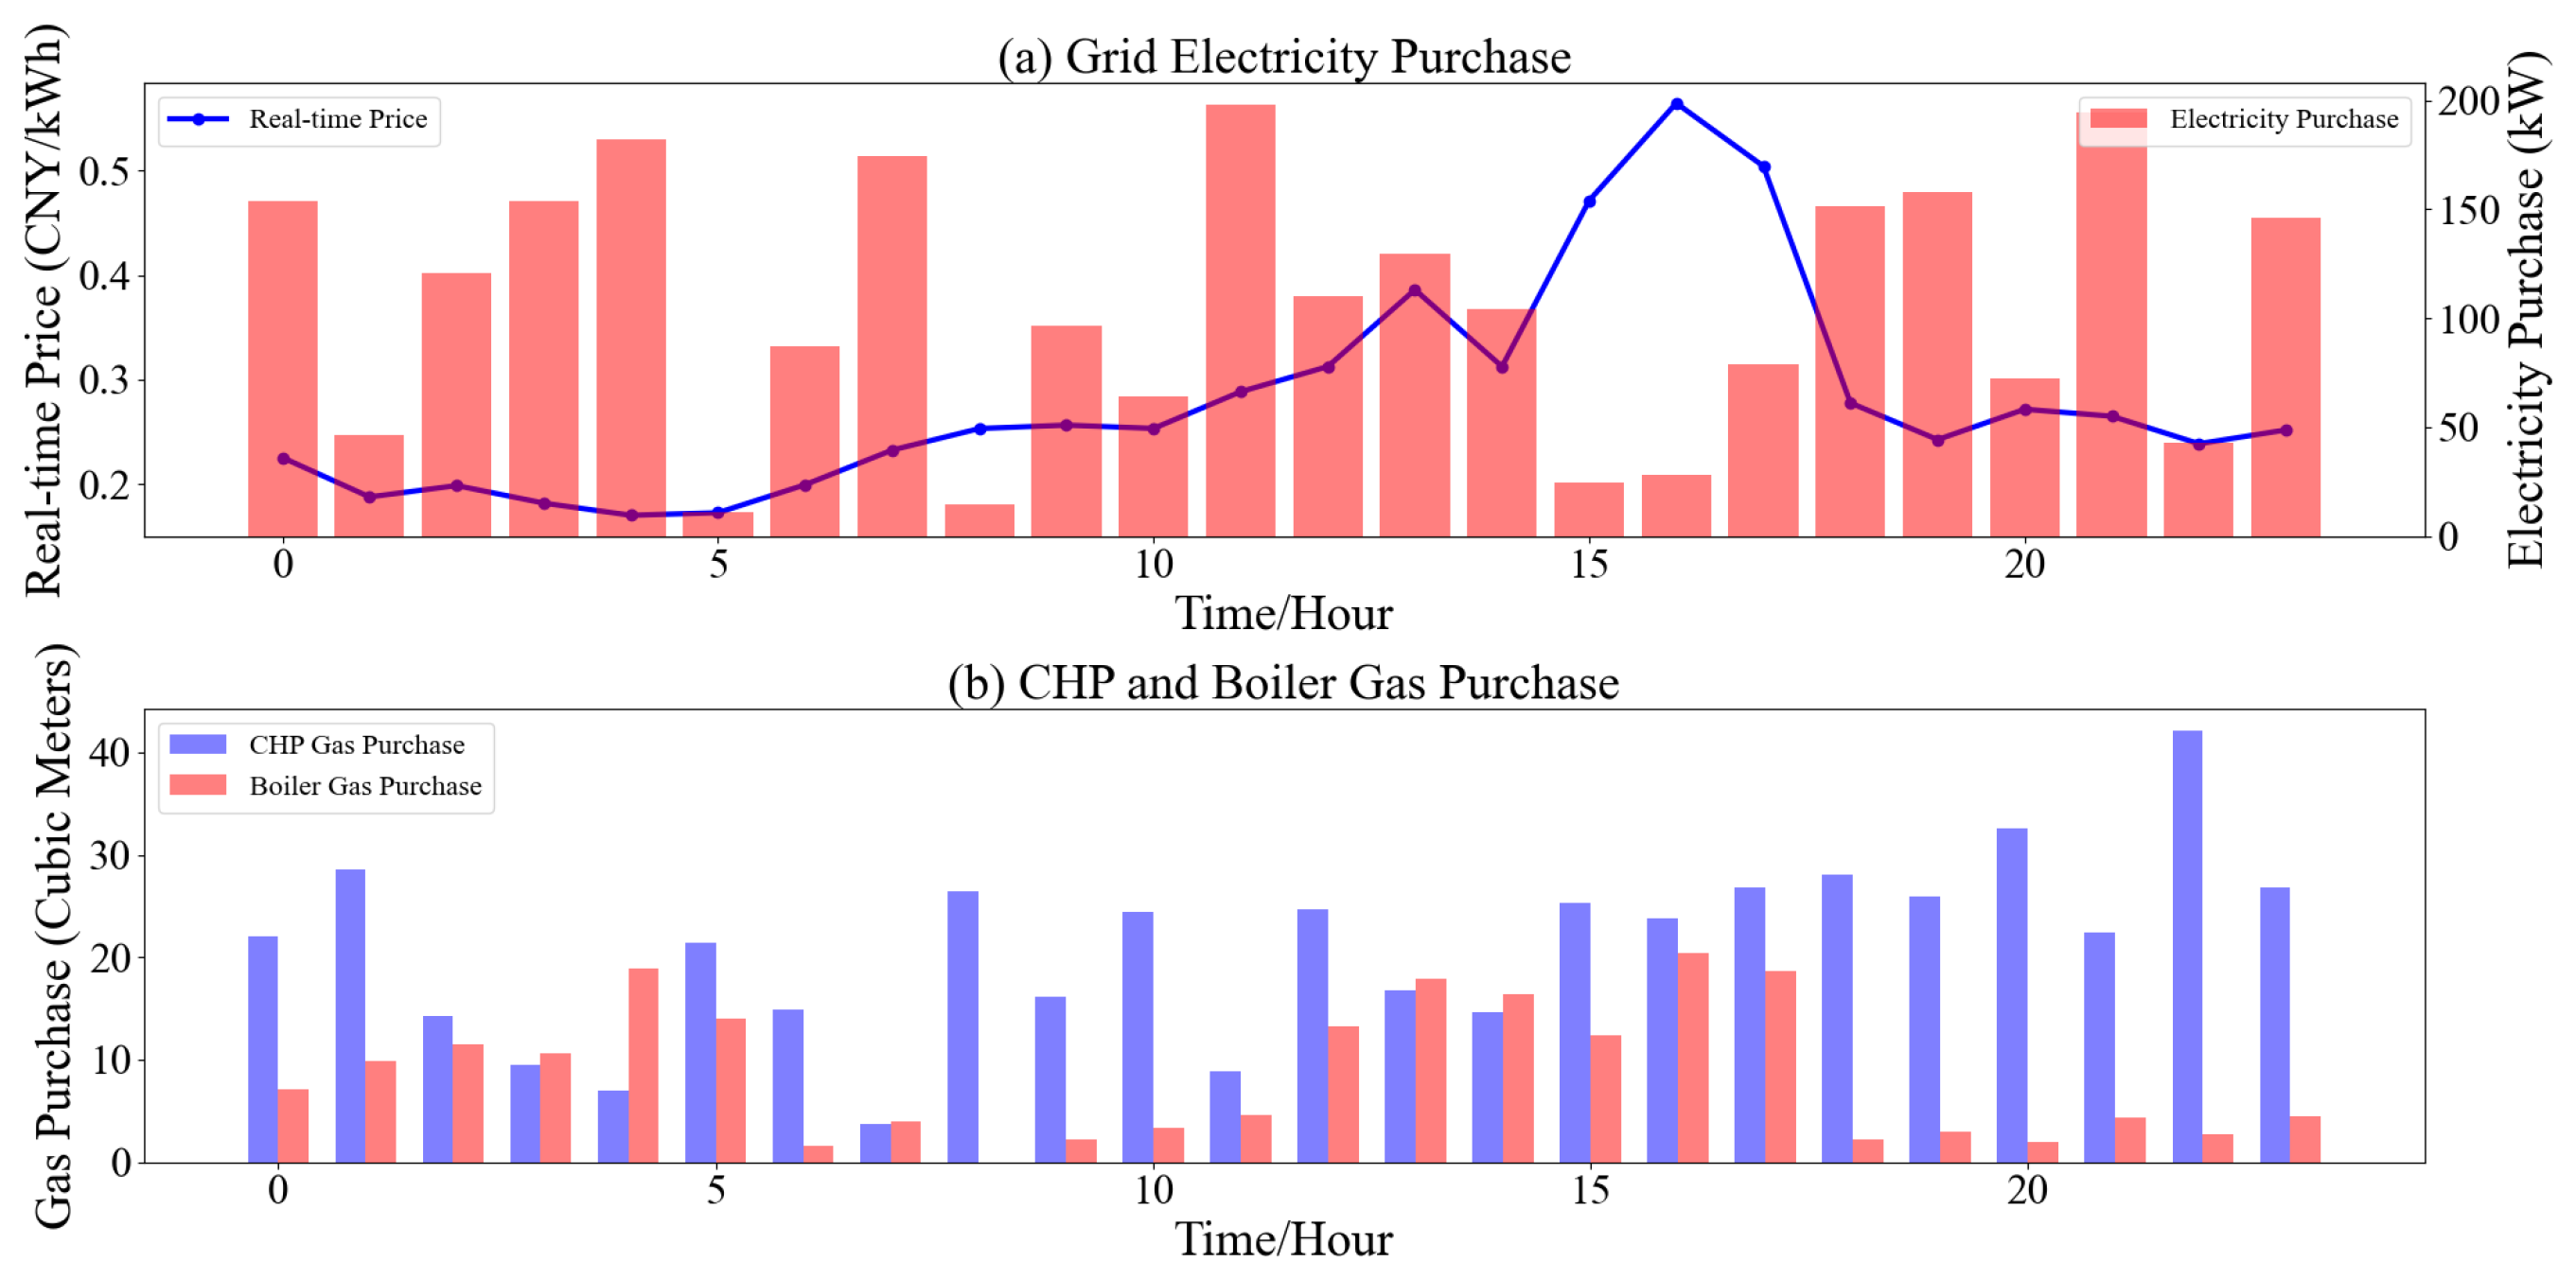
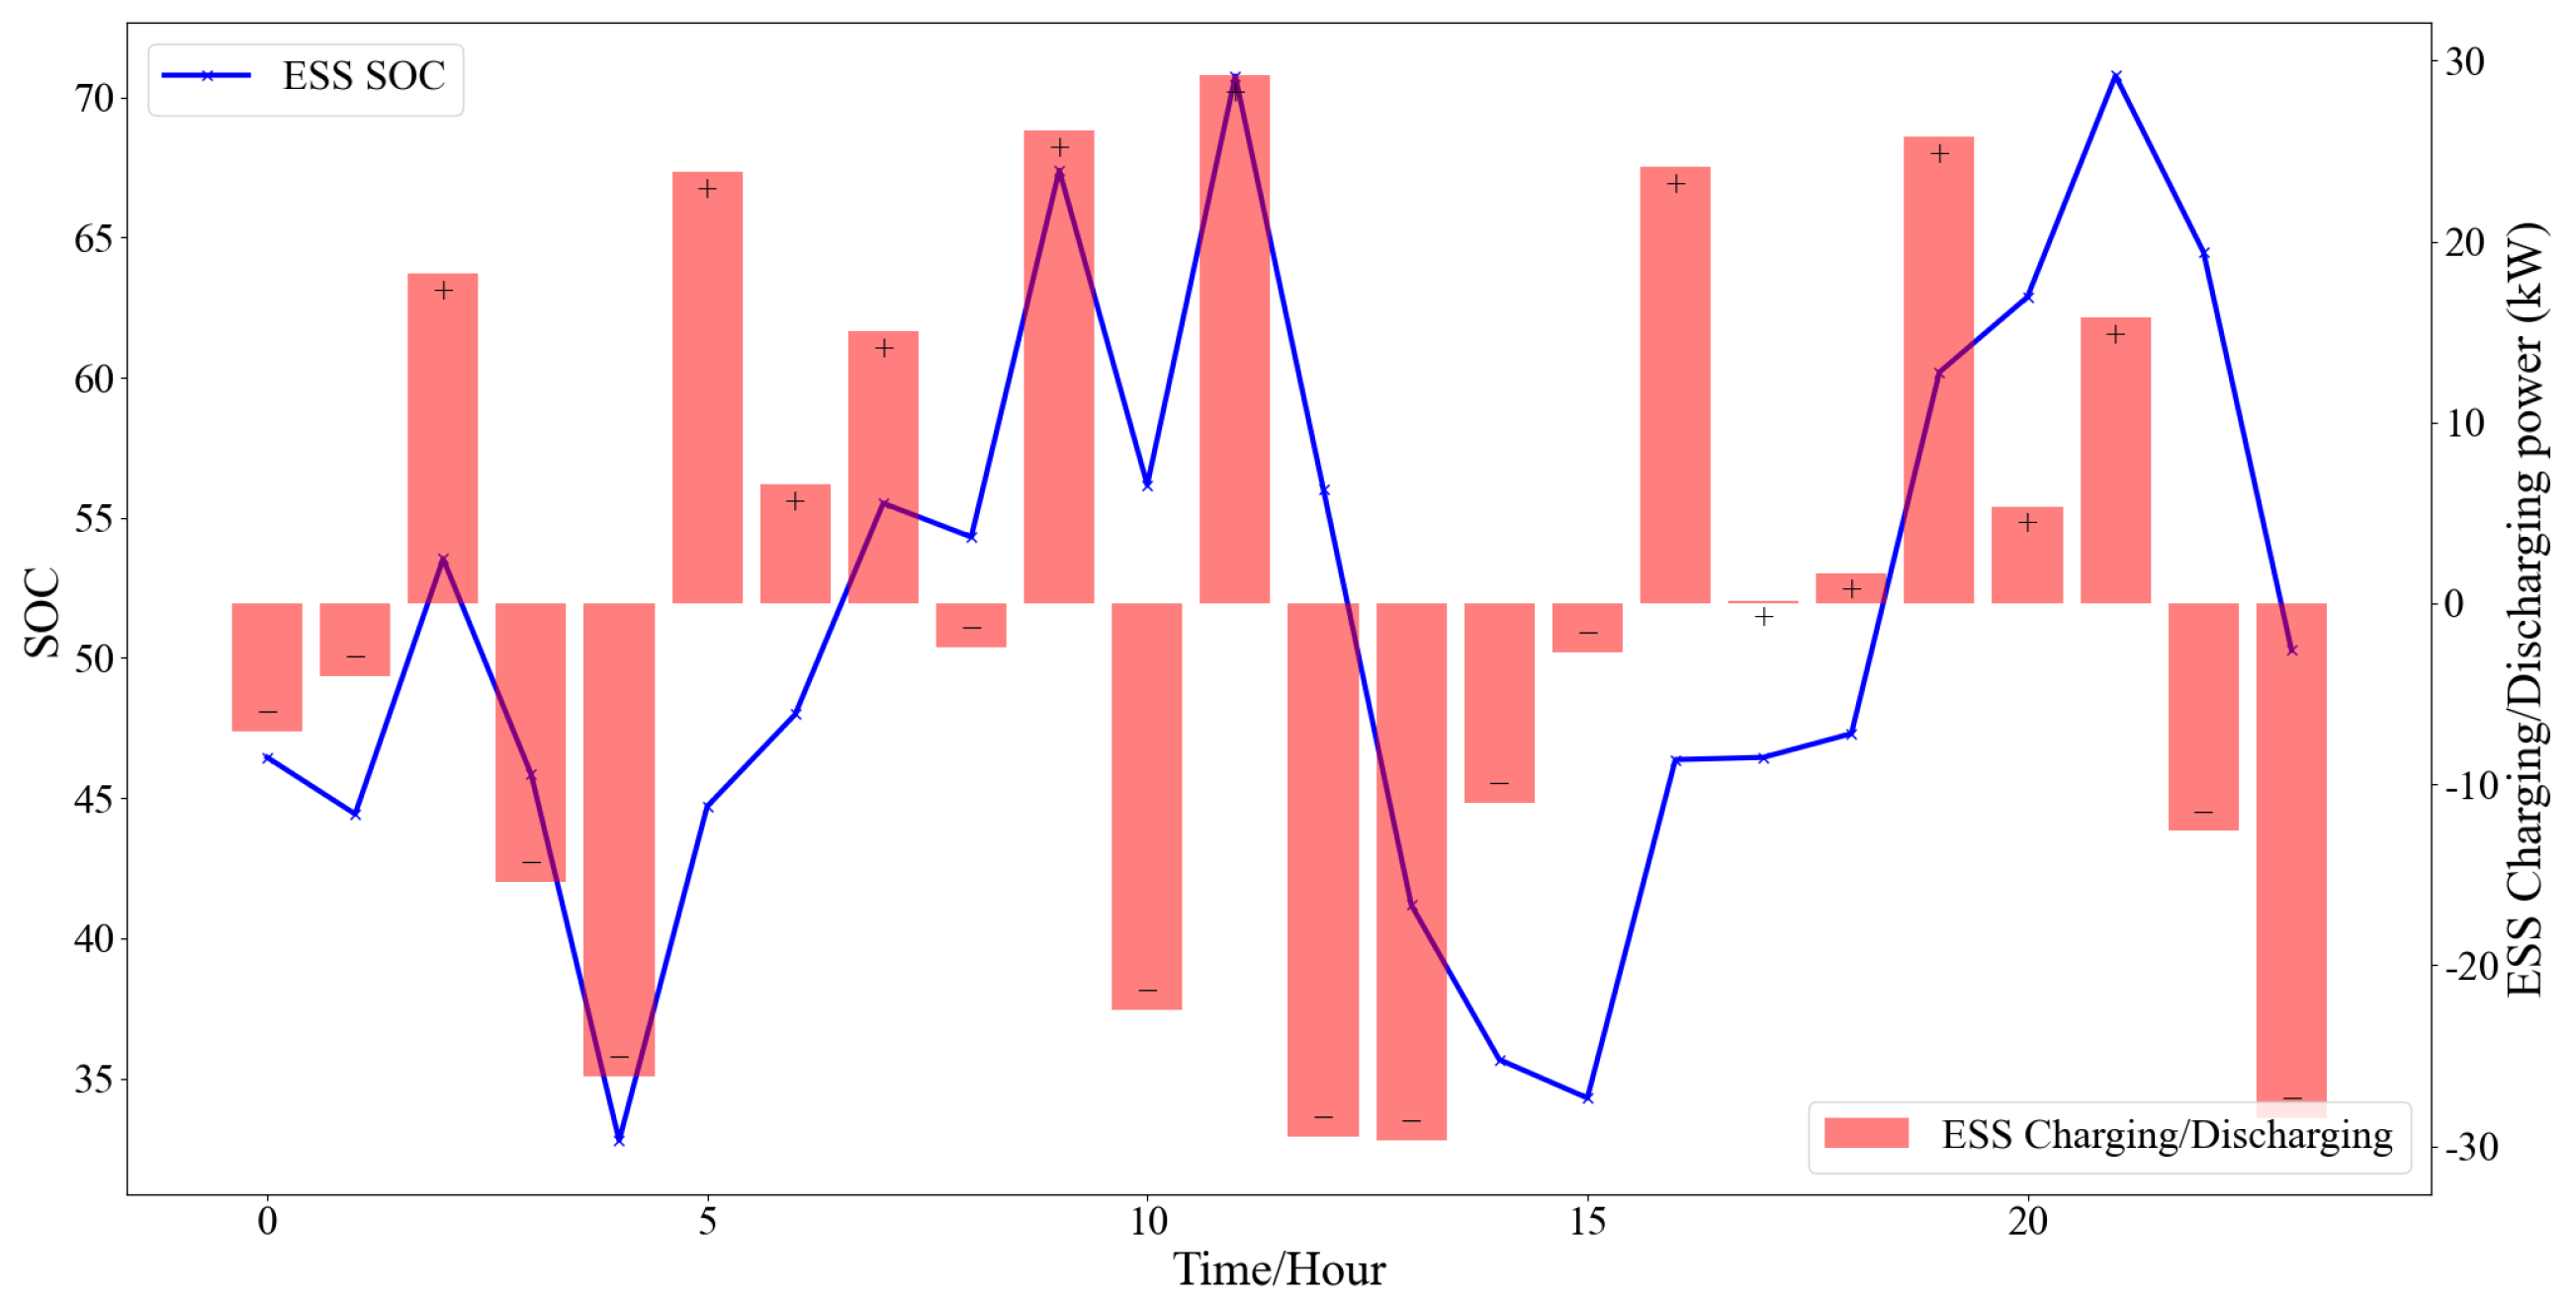
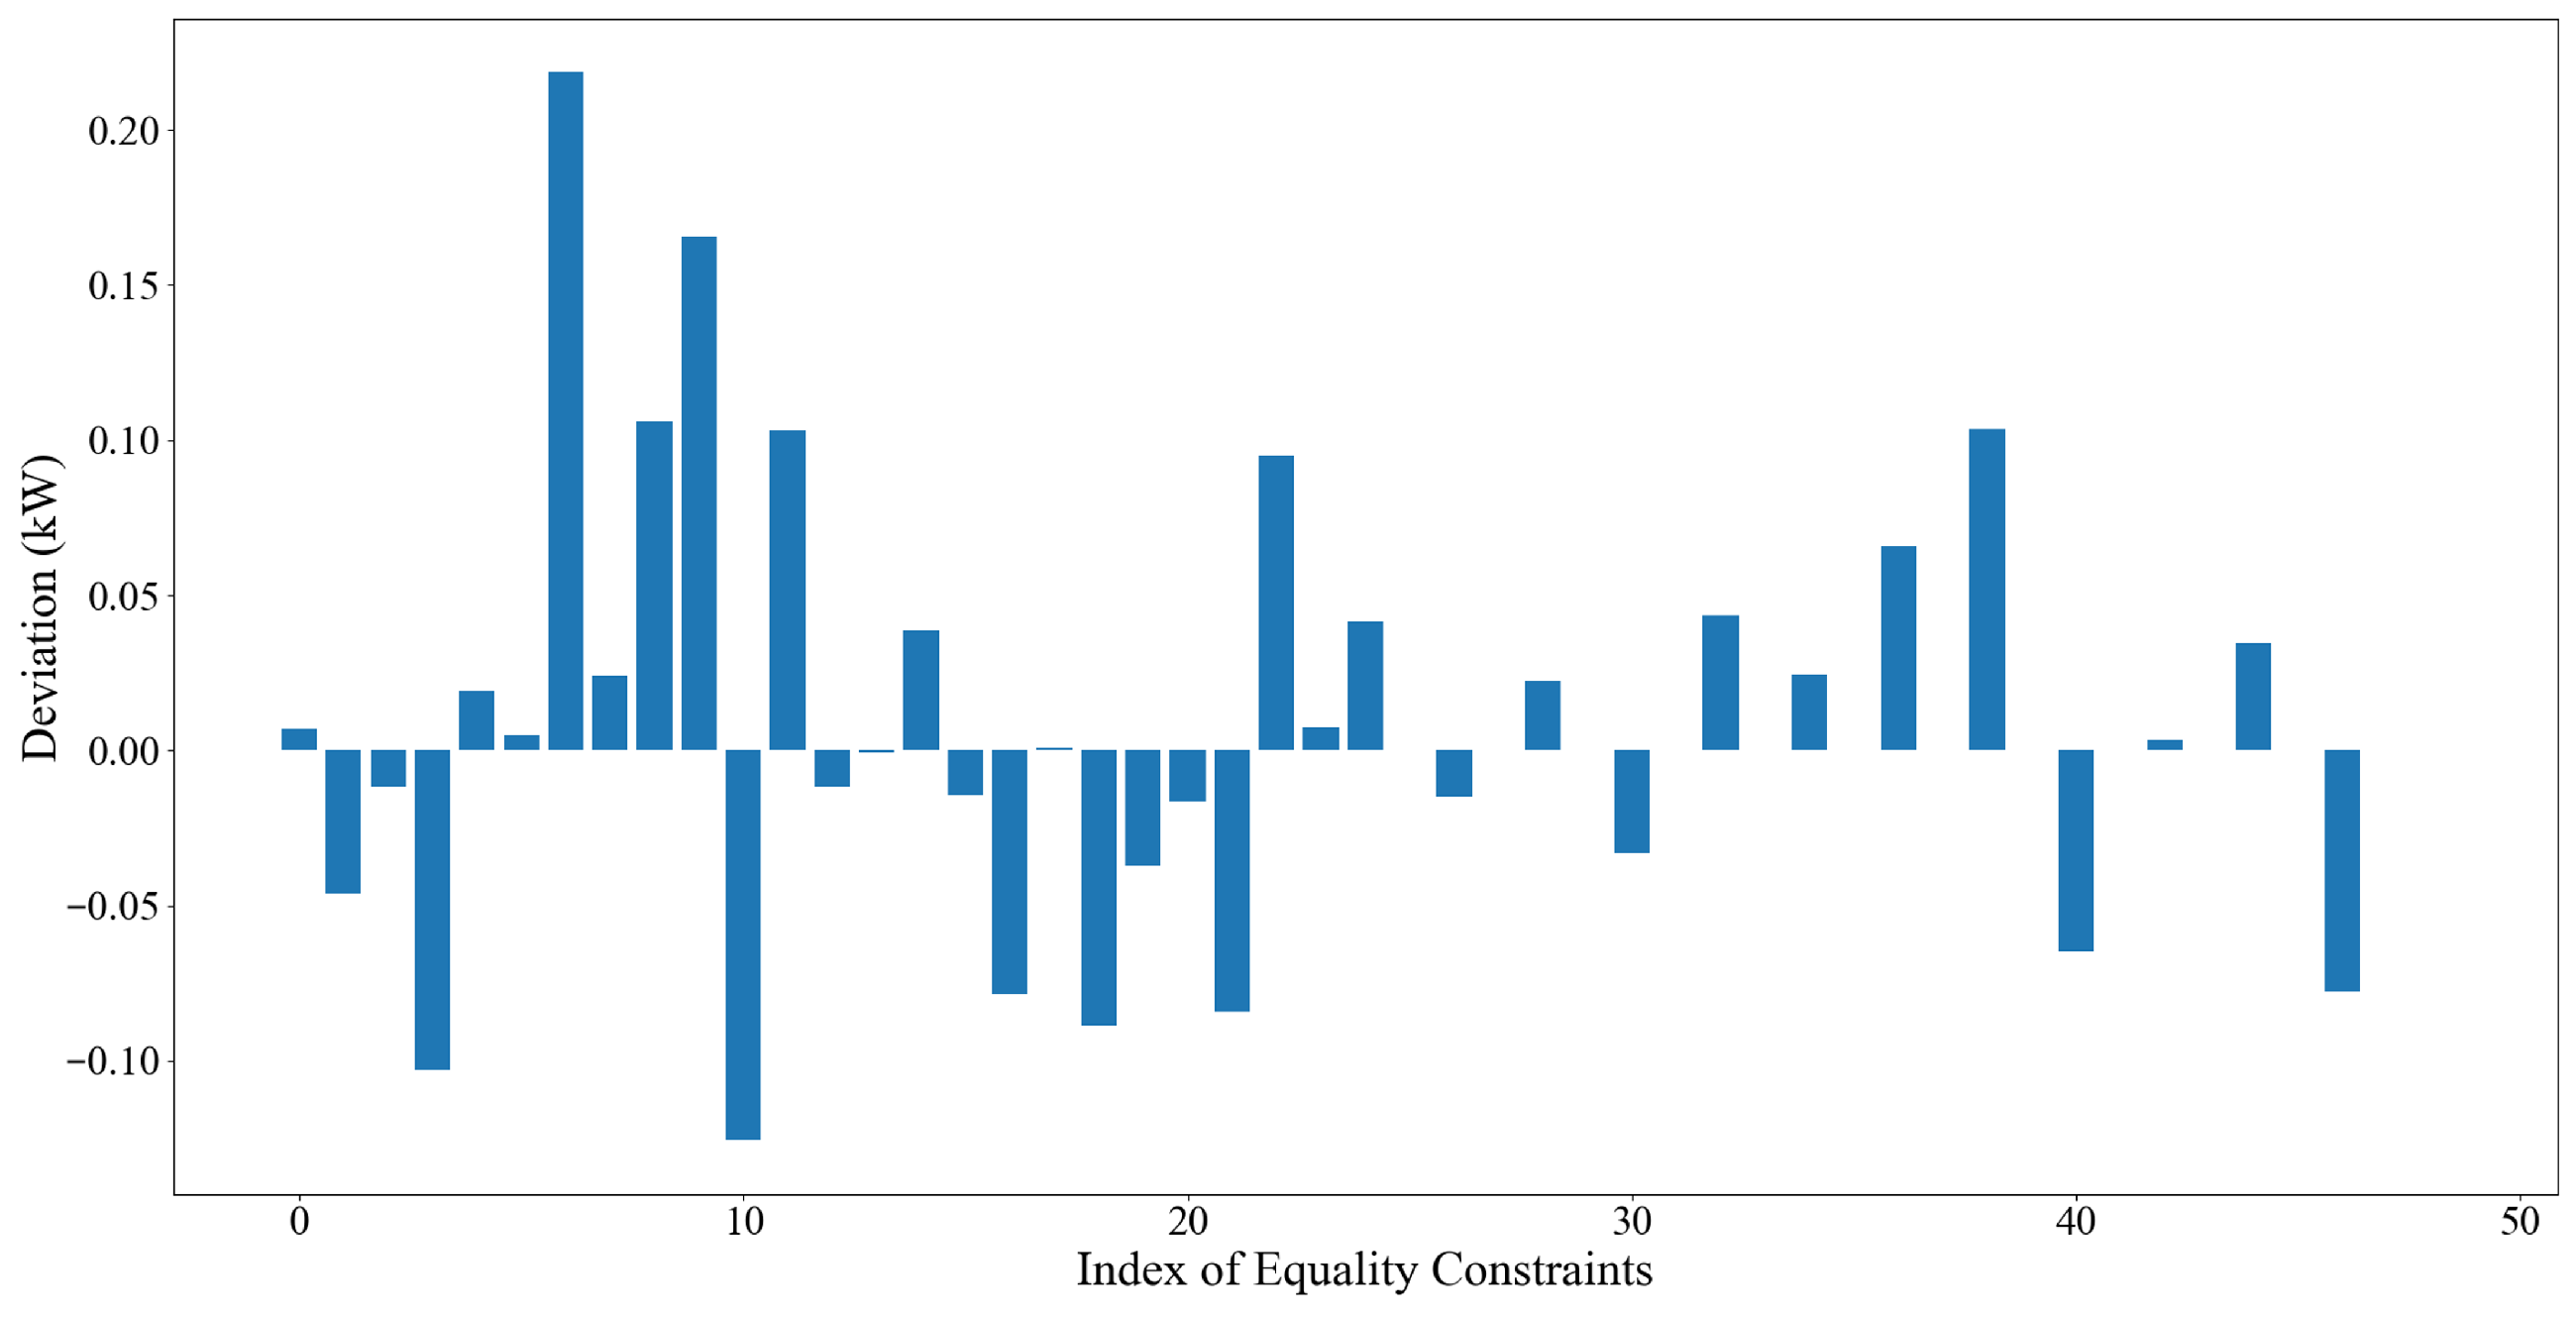
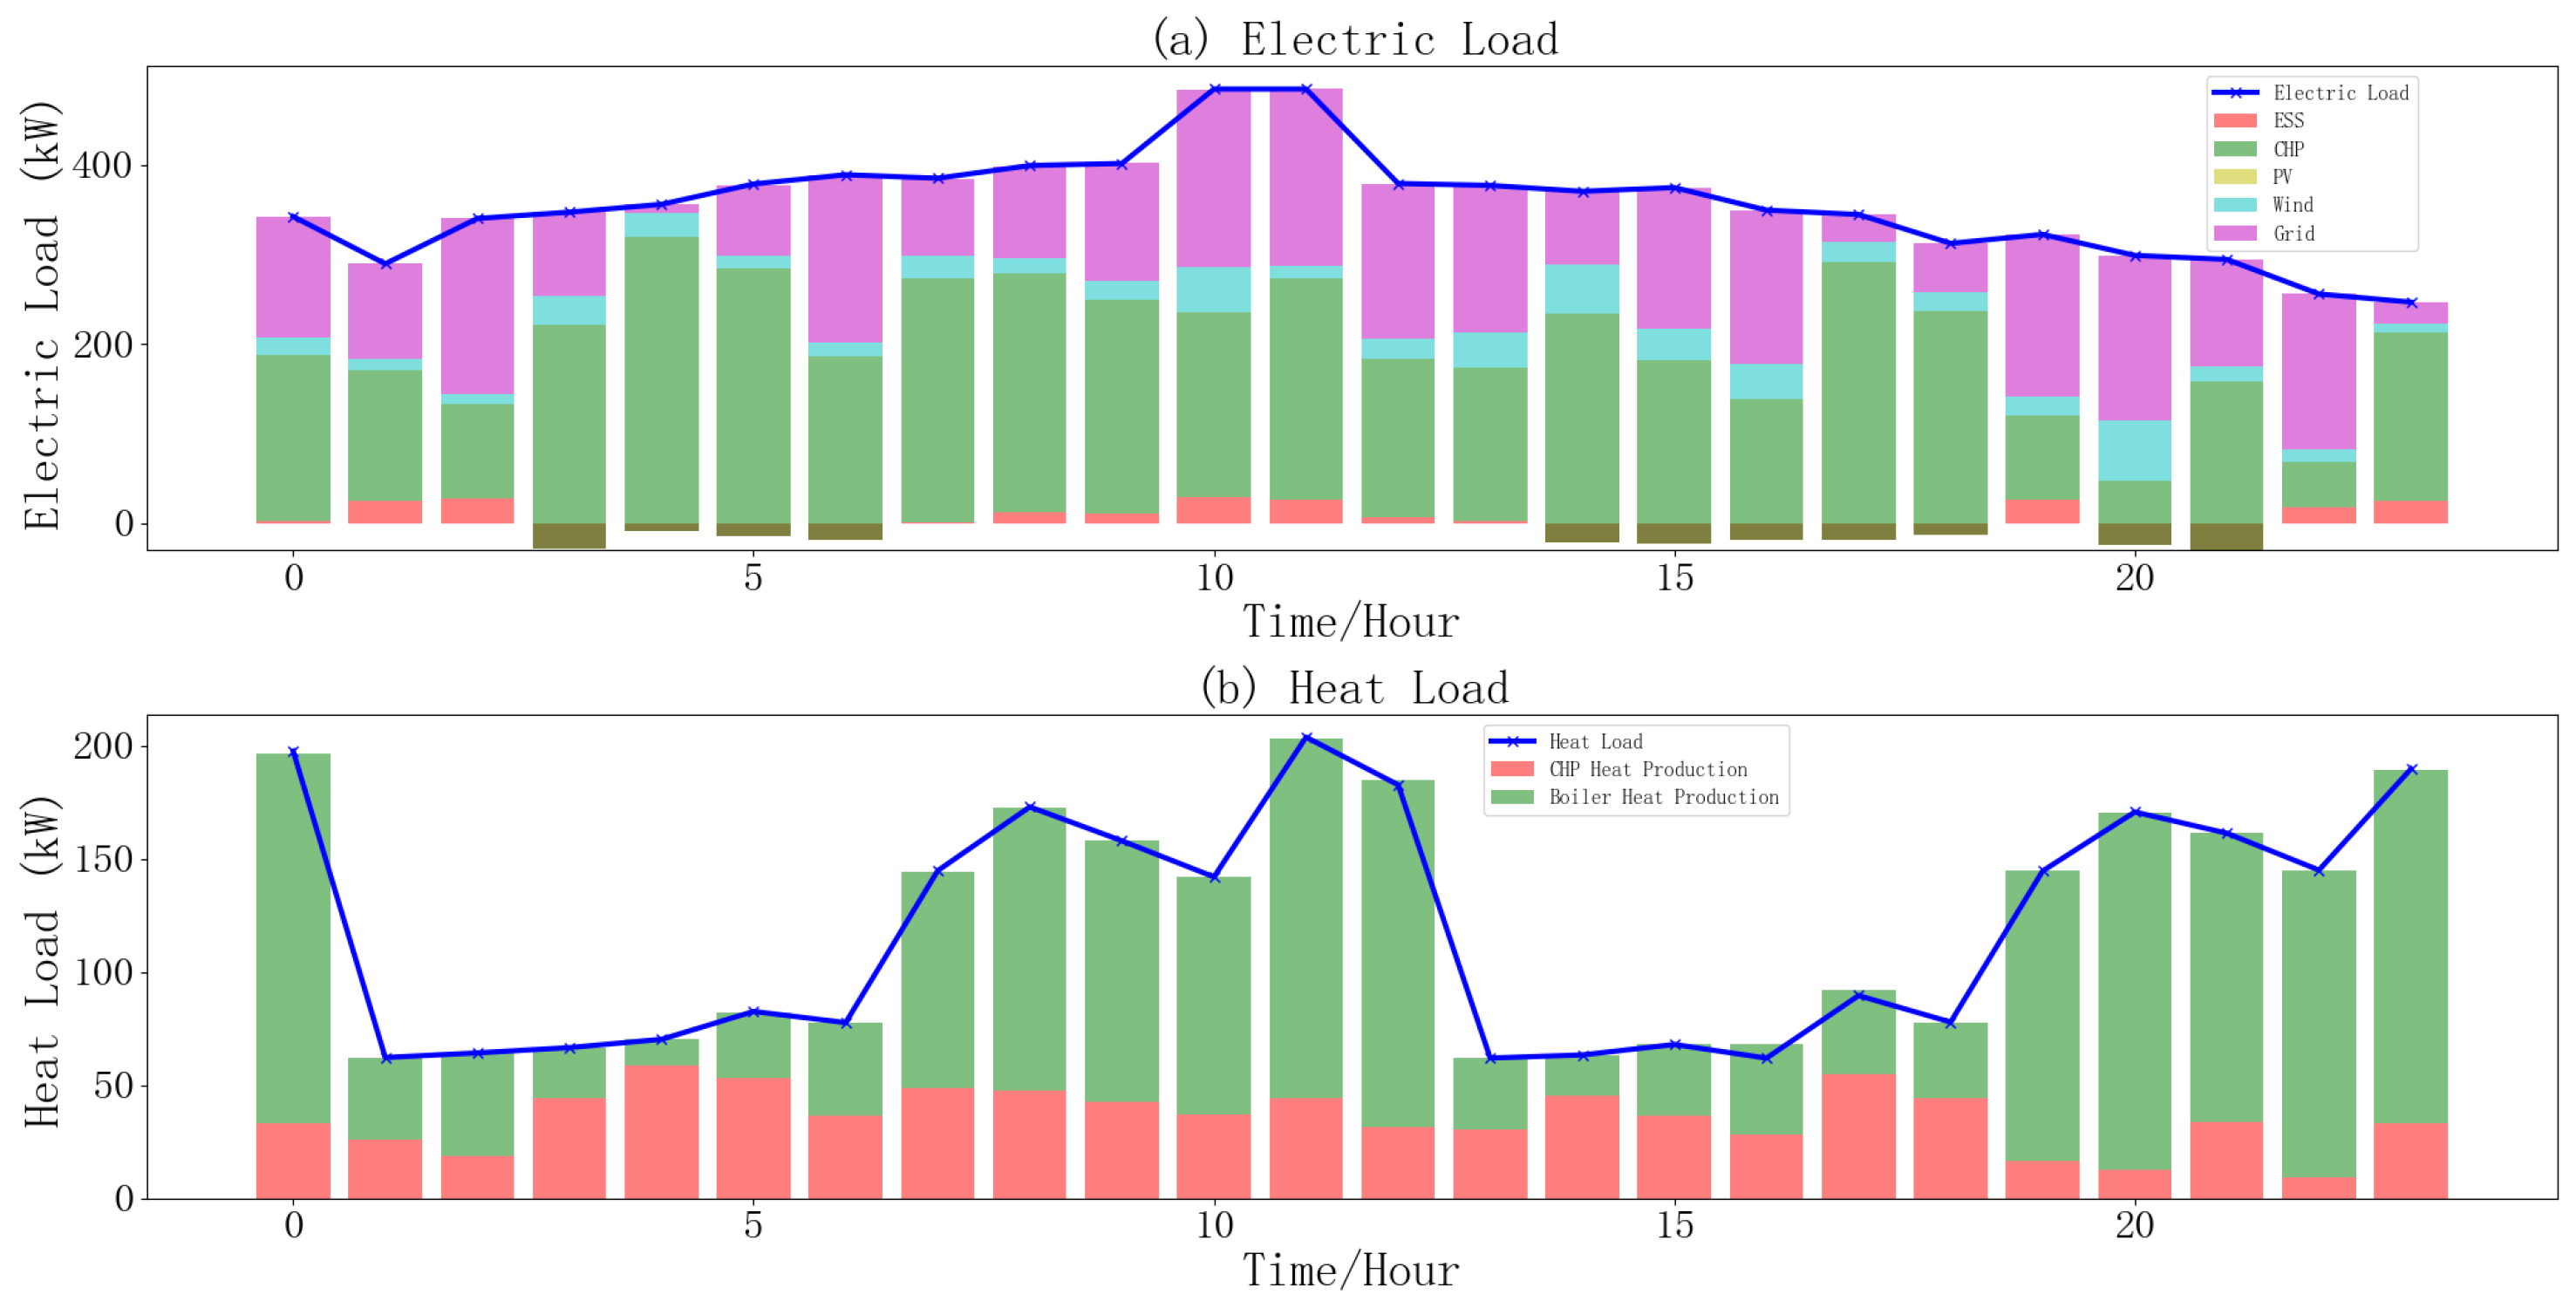
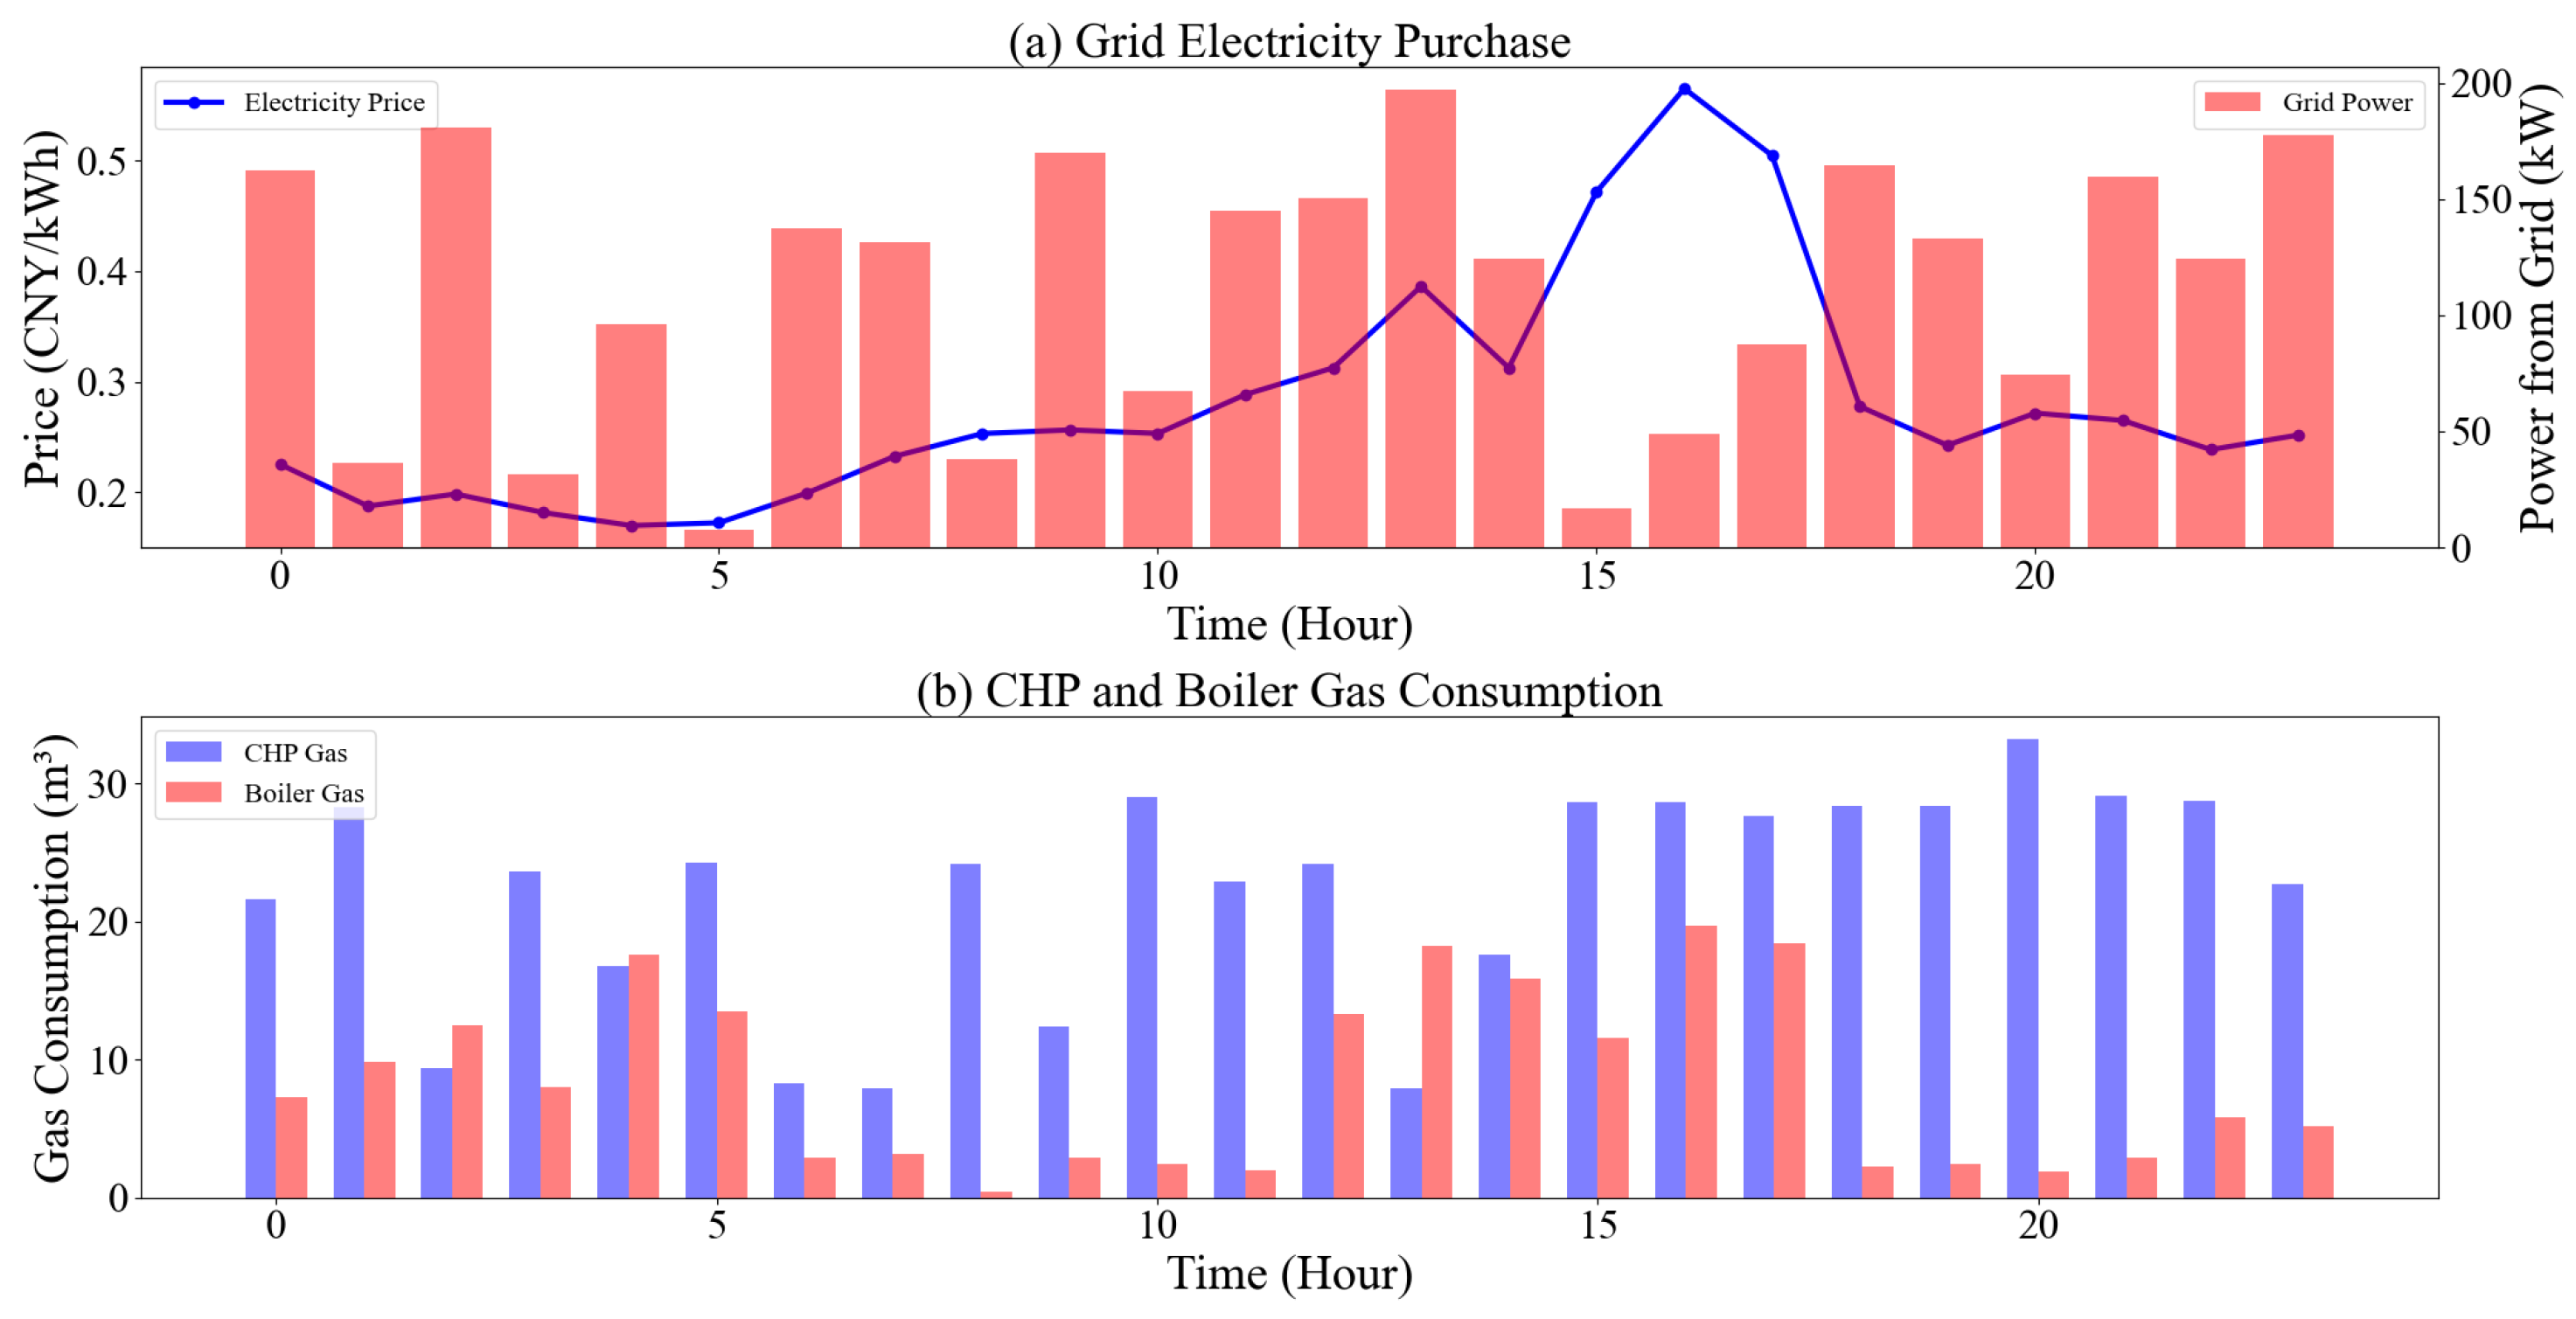
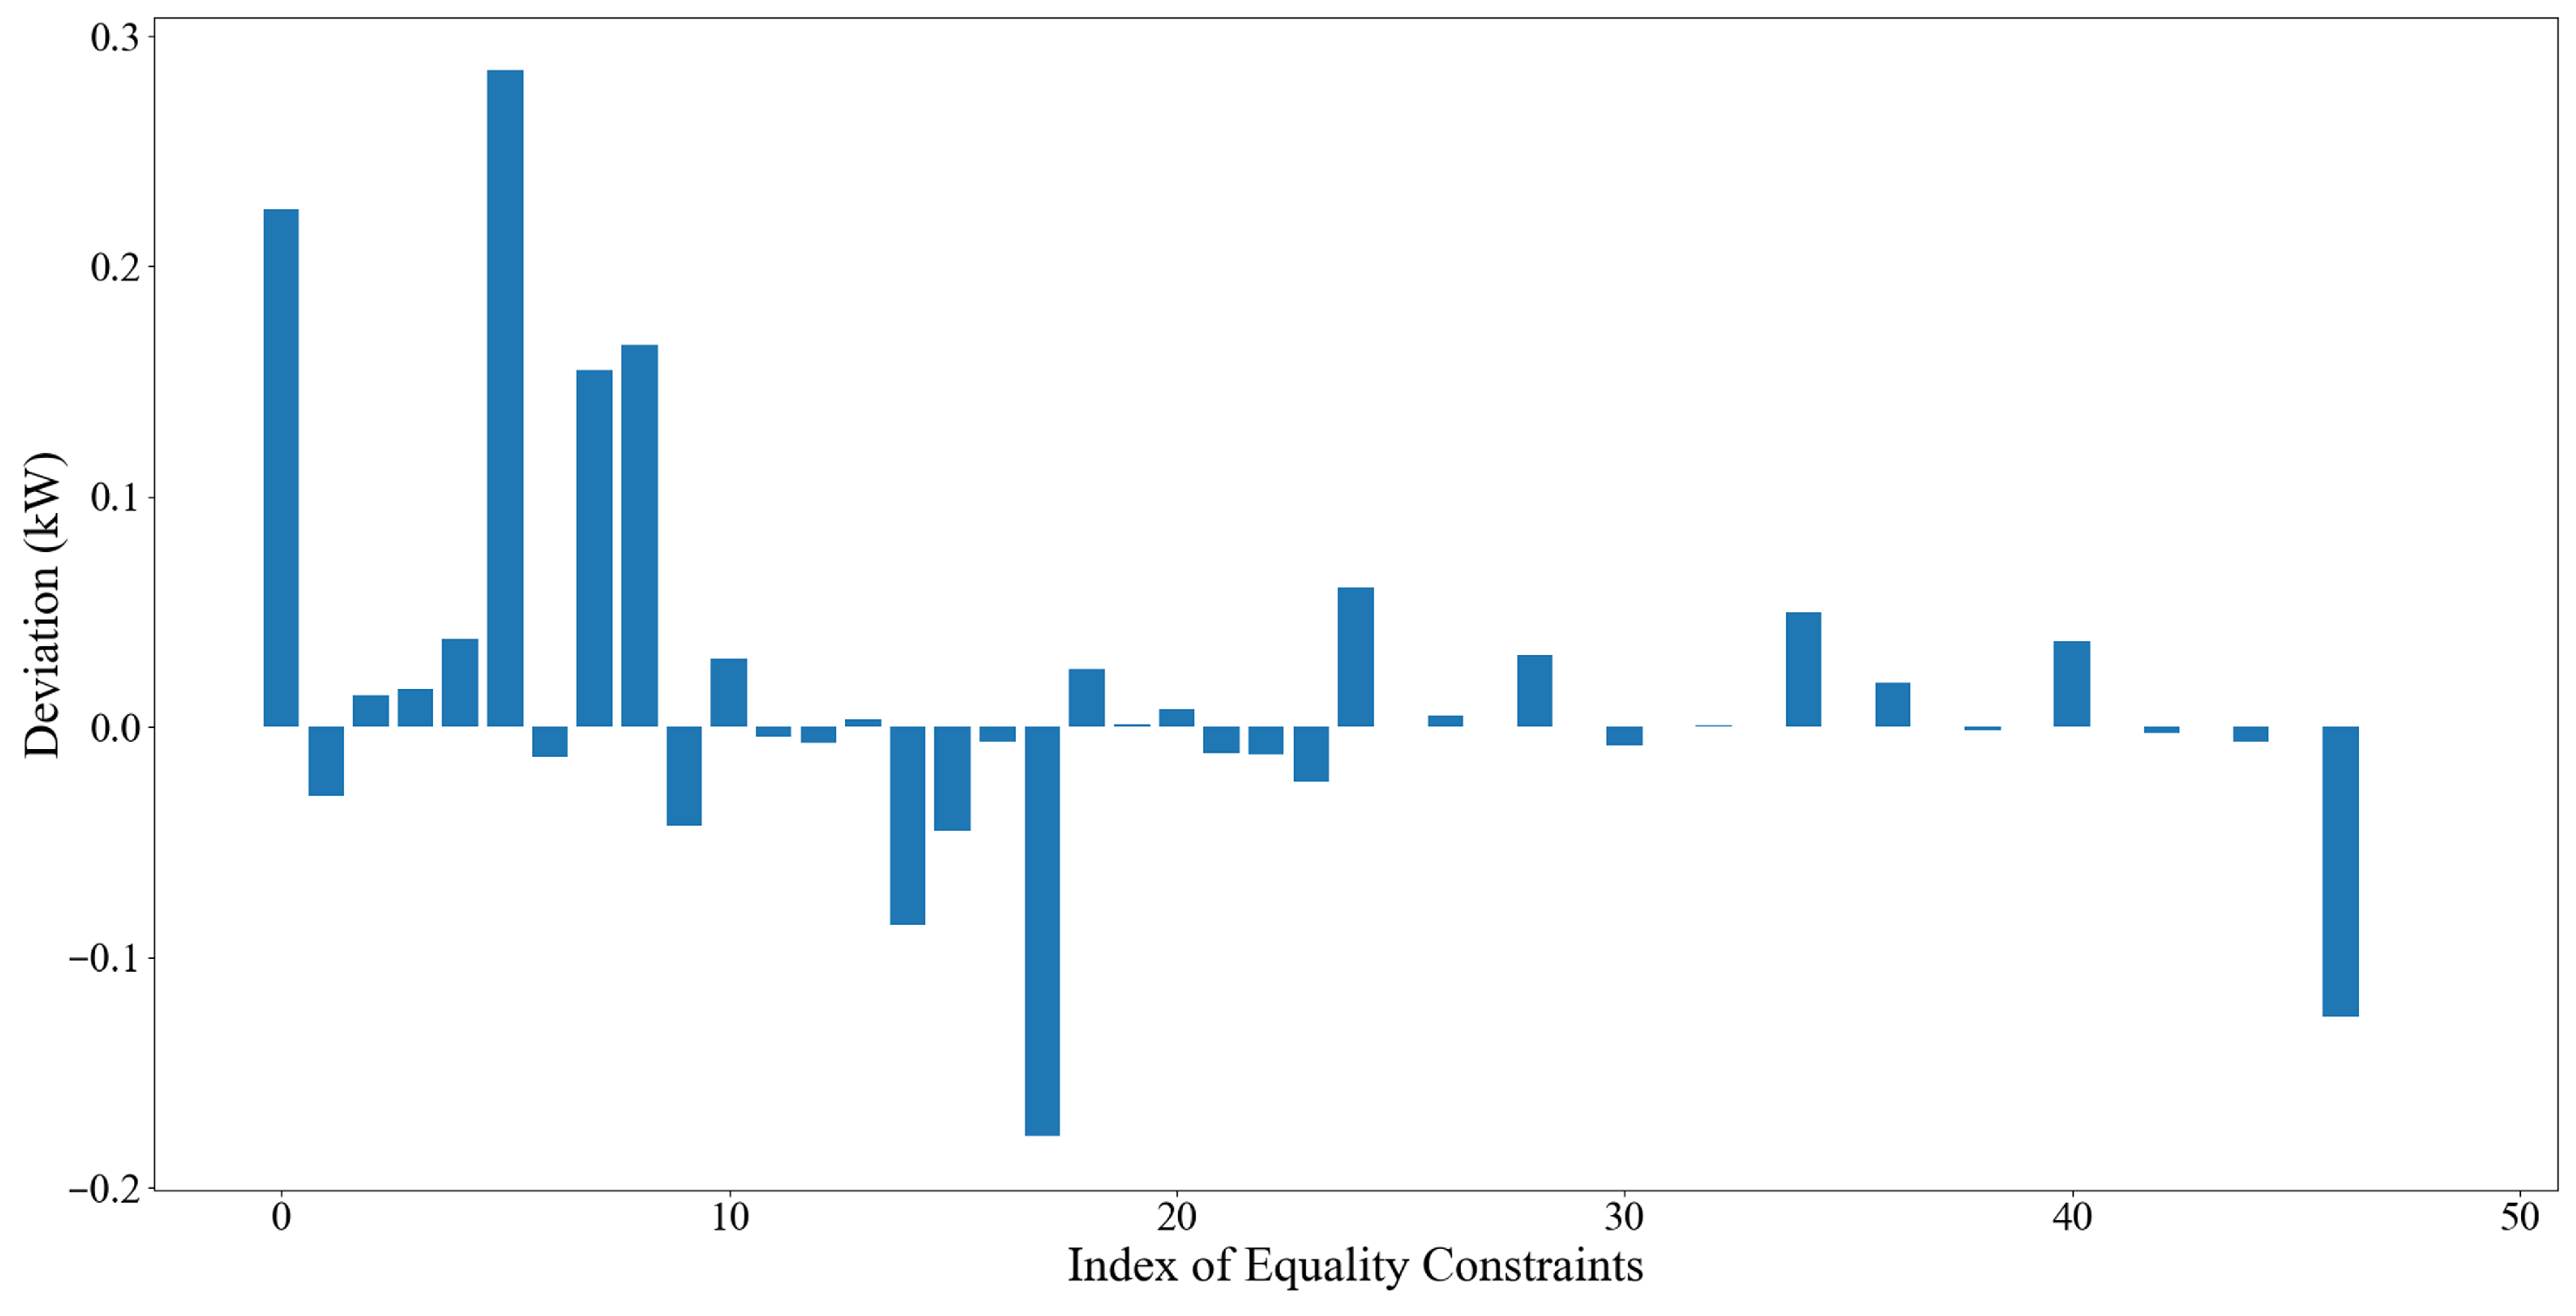
4.2. Optimization Results of the IES in Scenario 1

In Scenario 1, both PV and wind power systems operate normally. The optimized results of the IES operator’s electricity and gas purchases are shown in Figure 5, and the thermal load and electrical load are shown in Figure 6. Analysis indicates that after optimization using the IGA, the operator reduces electricity purchases during peak hours to minimize costs. Meanwhile, to meet the electrical and thermal load demands, the operator makes rational use of renewable energy sources and purchases gas for the CHP unit and gas boiler at appropriate times, while also purchasing electricity from the grid. This achieves optimal energy allocation and cost minimization, ensuring a stable supply of electrical and thermal loads. Figure 7 illustrates the operation of the ESS in Scenario 1, which, after optimization, operates according to economic demands and maintains its state of charge within the permitted range.
In the IES optimization problem, there are 49 equality constraints, including the balance constraints of electrical and thermal loads for 24 h, as well as the initial SOC constraints of the ESS. Figure 8 shows the violation of the 49 equality constraints after optimization using the IGA. It can be seen that the IGA exhibits significant advantages in handling equality constraints. Despite the large numerical values of the load balance constraints (both electrical and thermal loads are on the order of hundreds of kW), the algorithm is able to control the deviation within 0.2 kW, which is already a very small error in practical applications. This indicates that IGA is not only effective in solving the IES optimization problem but also maintains high precision in handling equality constraints. This demonstrates the reliability and practicality of the algorithm proposed in this paper.

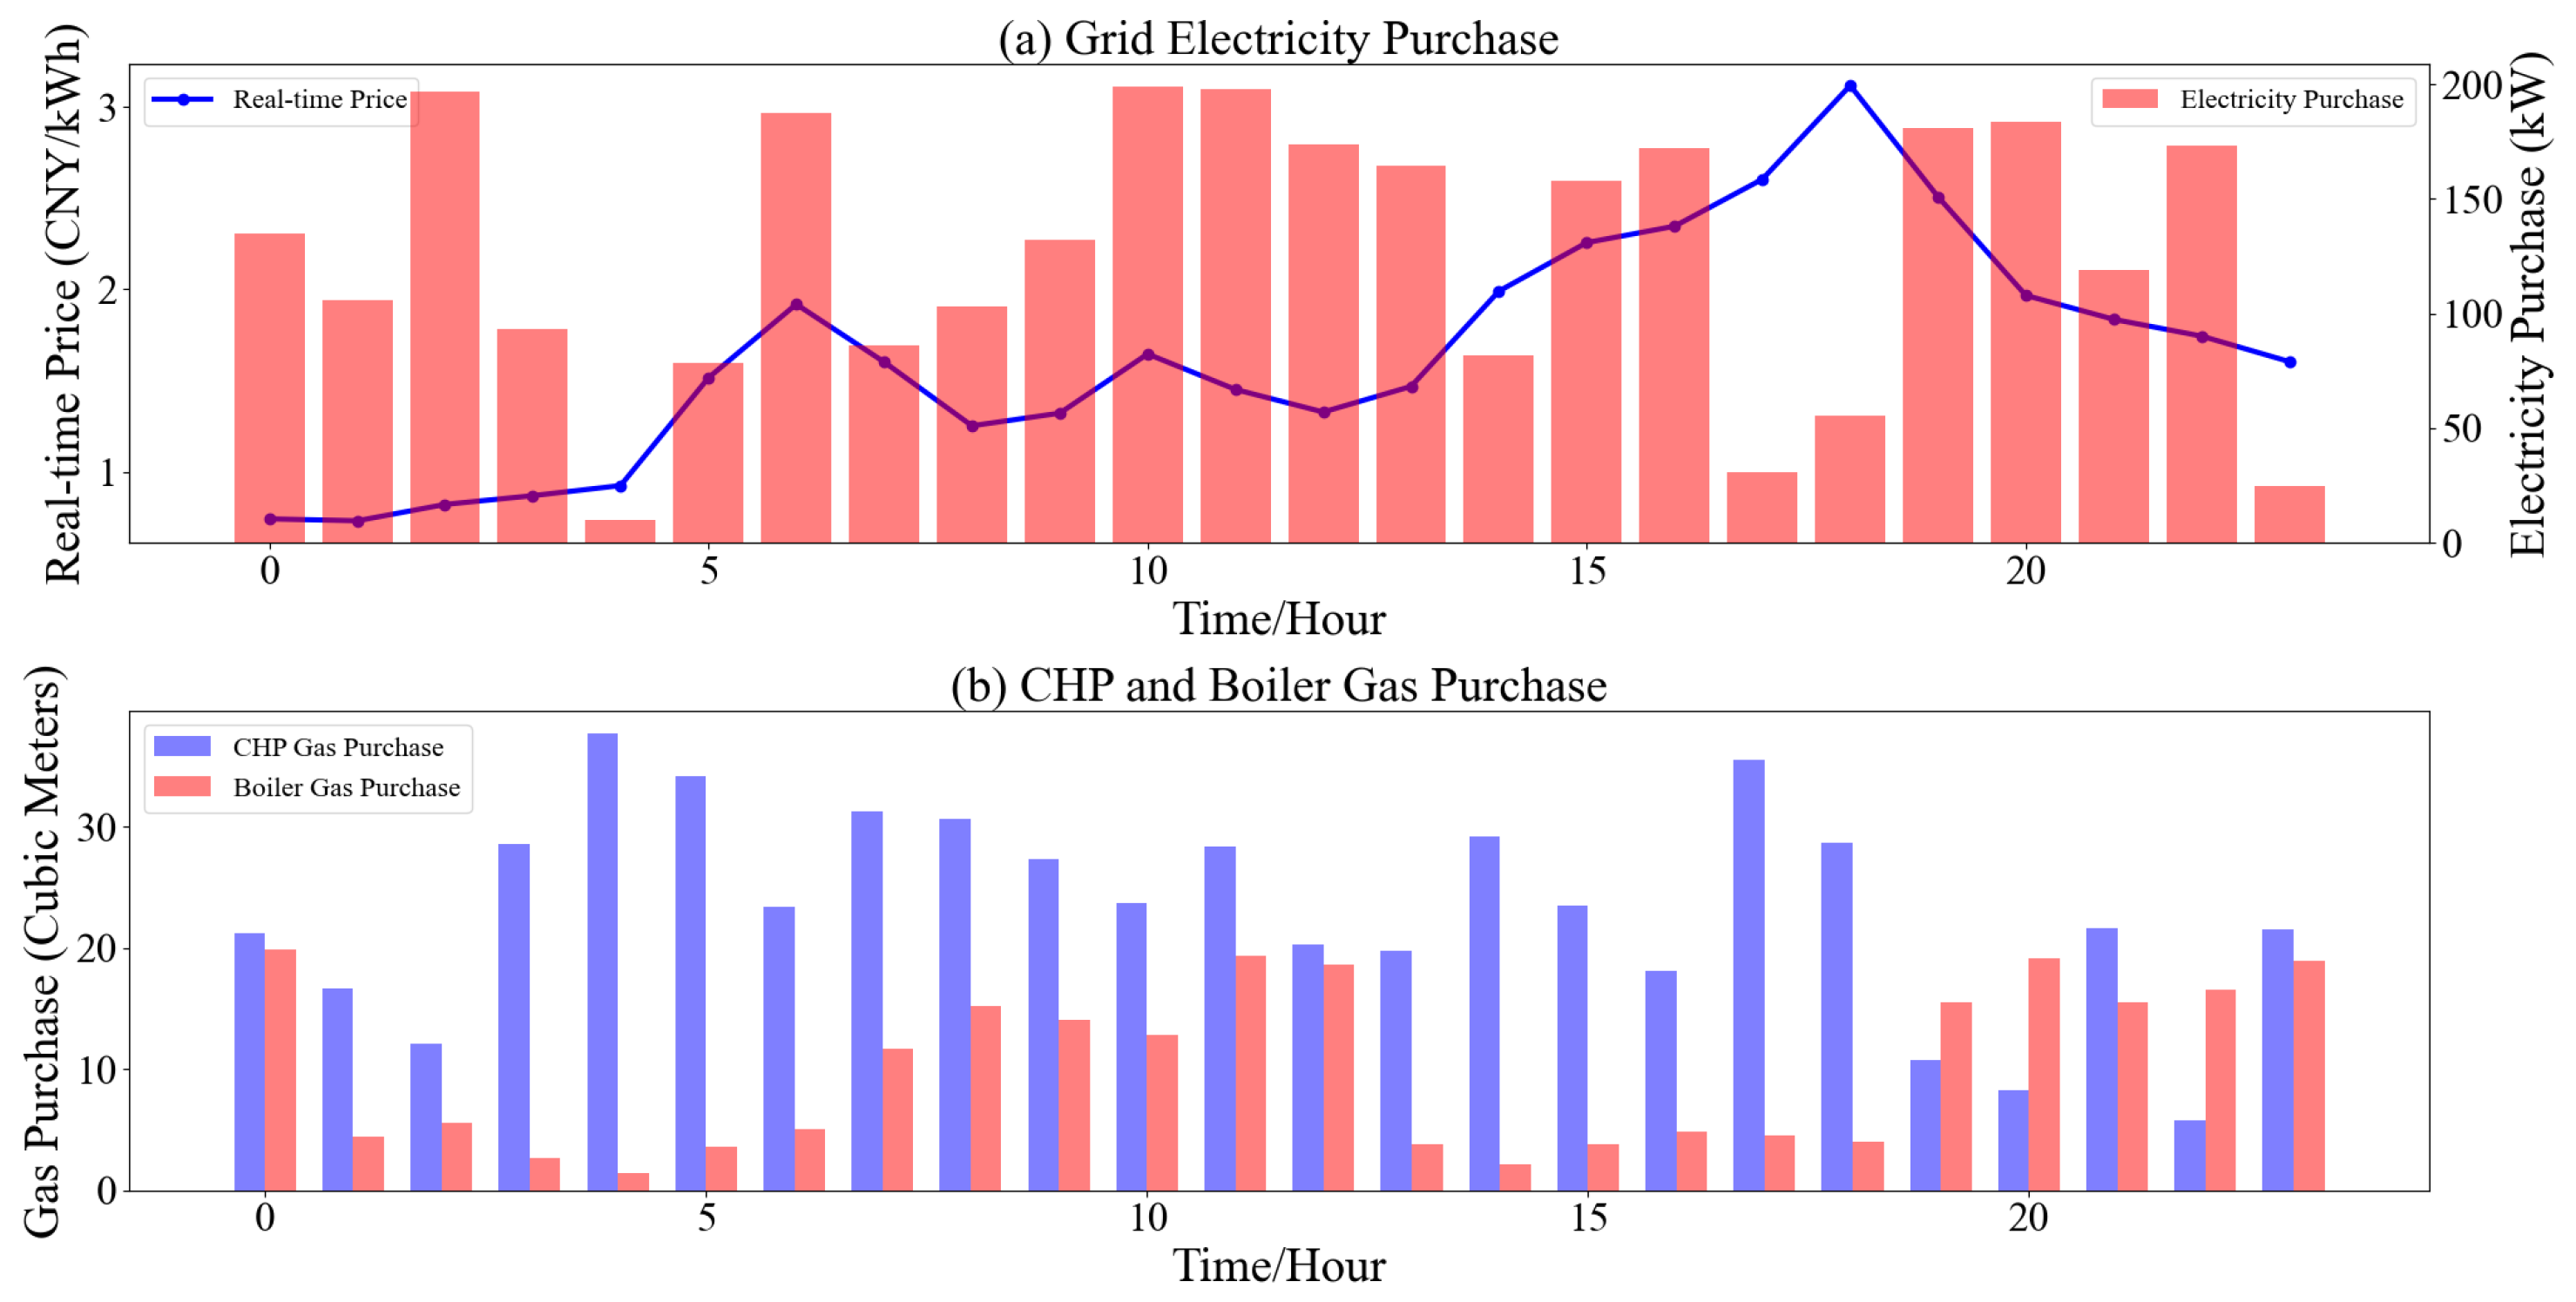
4.3. Optimization Results of the IES in Scenario 2

In Scenario 2, the load curves of electricity and heat were modified, and the impact of rainy days was considered, resulting in a power shortage due to the inability of the PV system to operate normally. Additionally, the electricity price was higher than usual. Under these extreme conditions, the question arises as to whether the IGA can maintain the economic and reliable operation of the IES. Figure 9 and Figure 10 show the optimized results of the IES’s electricity and gas purchases, as well as the electricity and heat load profiles in Scenario 2. From the figures, it can be seen that after optimization using the IGA, the system operator still avoided purchasing electricity during peak price hours and reasonably allocated the natural gas distribution between the CHP unit and the gas boiler. Moreover, the algorithm efficiently utilized wind energy, avoided wind curtailment, and ensured a stable supply of electricity and heat to meet the demand.
Figure 11 shows the optimization results of the ESS in Scenario 2. After optimization using the proposed IGA, the ESS charges during periods of low electricity prices and discharges during periods of high electricity prices, thereby alleviating the operational pressure on the IES.
Figure 12 illustrates the handling of inequality constraints in Scenario 2. It can be observed that the IGA is able to control the deviation of the equality constraints within 0.3 kW in Scenario 2, demonstrating that the IGA maintains high precision in handling equality constraints across different scenarios.

4.4. Optimization Results of the IES in Scenario 3

Scenario 3 maintains identical electricity load, heat load, and electricity price profiles to Scenario 1, with the sole distinction being the consideration of rainy weather conditions that render the photovoltaic system inoperable during normal operation. Figure 13 and Figure 14 present the optimized electricity and natural gas procurement results for Scenario 2, respectively, demonstrating that the IES reduces electricity purchases during peak price periods (15:00–17:00) while increasing CHP unit output to meet electrical load demands, consistently ensuring stable supply of both electrical and thermal loads throughout all time periods.
Figure 15 illustrates the ESS charging/discharging behavior and corresponding SOC variation in Scenario 3, demonstrating that the ESS effectively performs charge/discharge operations according to IES demands while maintaining the SOC at the predetermined 50% target by the scheduling period’s conclusion.
Figure 16 presents the equality constraint violations in the IGA’s optimization results for Scenario 3, demonstrating that all constraint violations are effectively constrained within 0.3 kW, thereby ensuring the validity and practical feasibility of the obtained solutions.

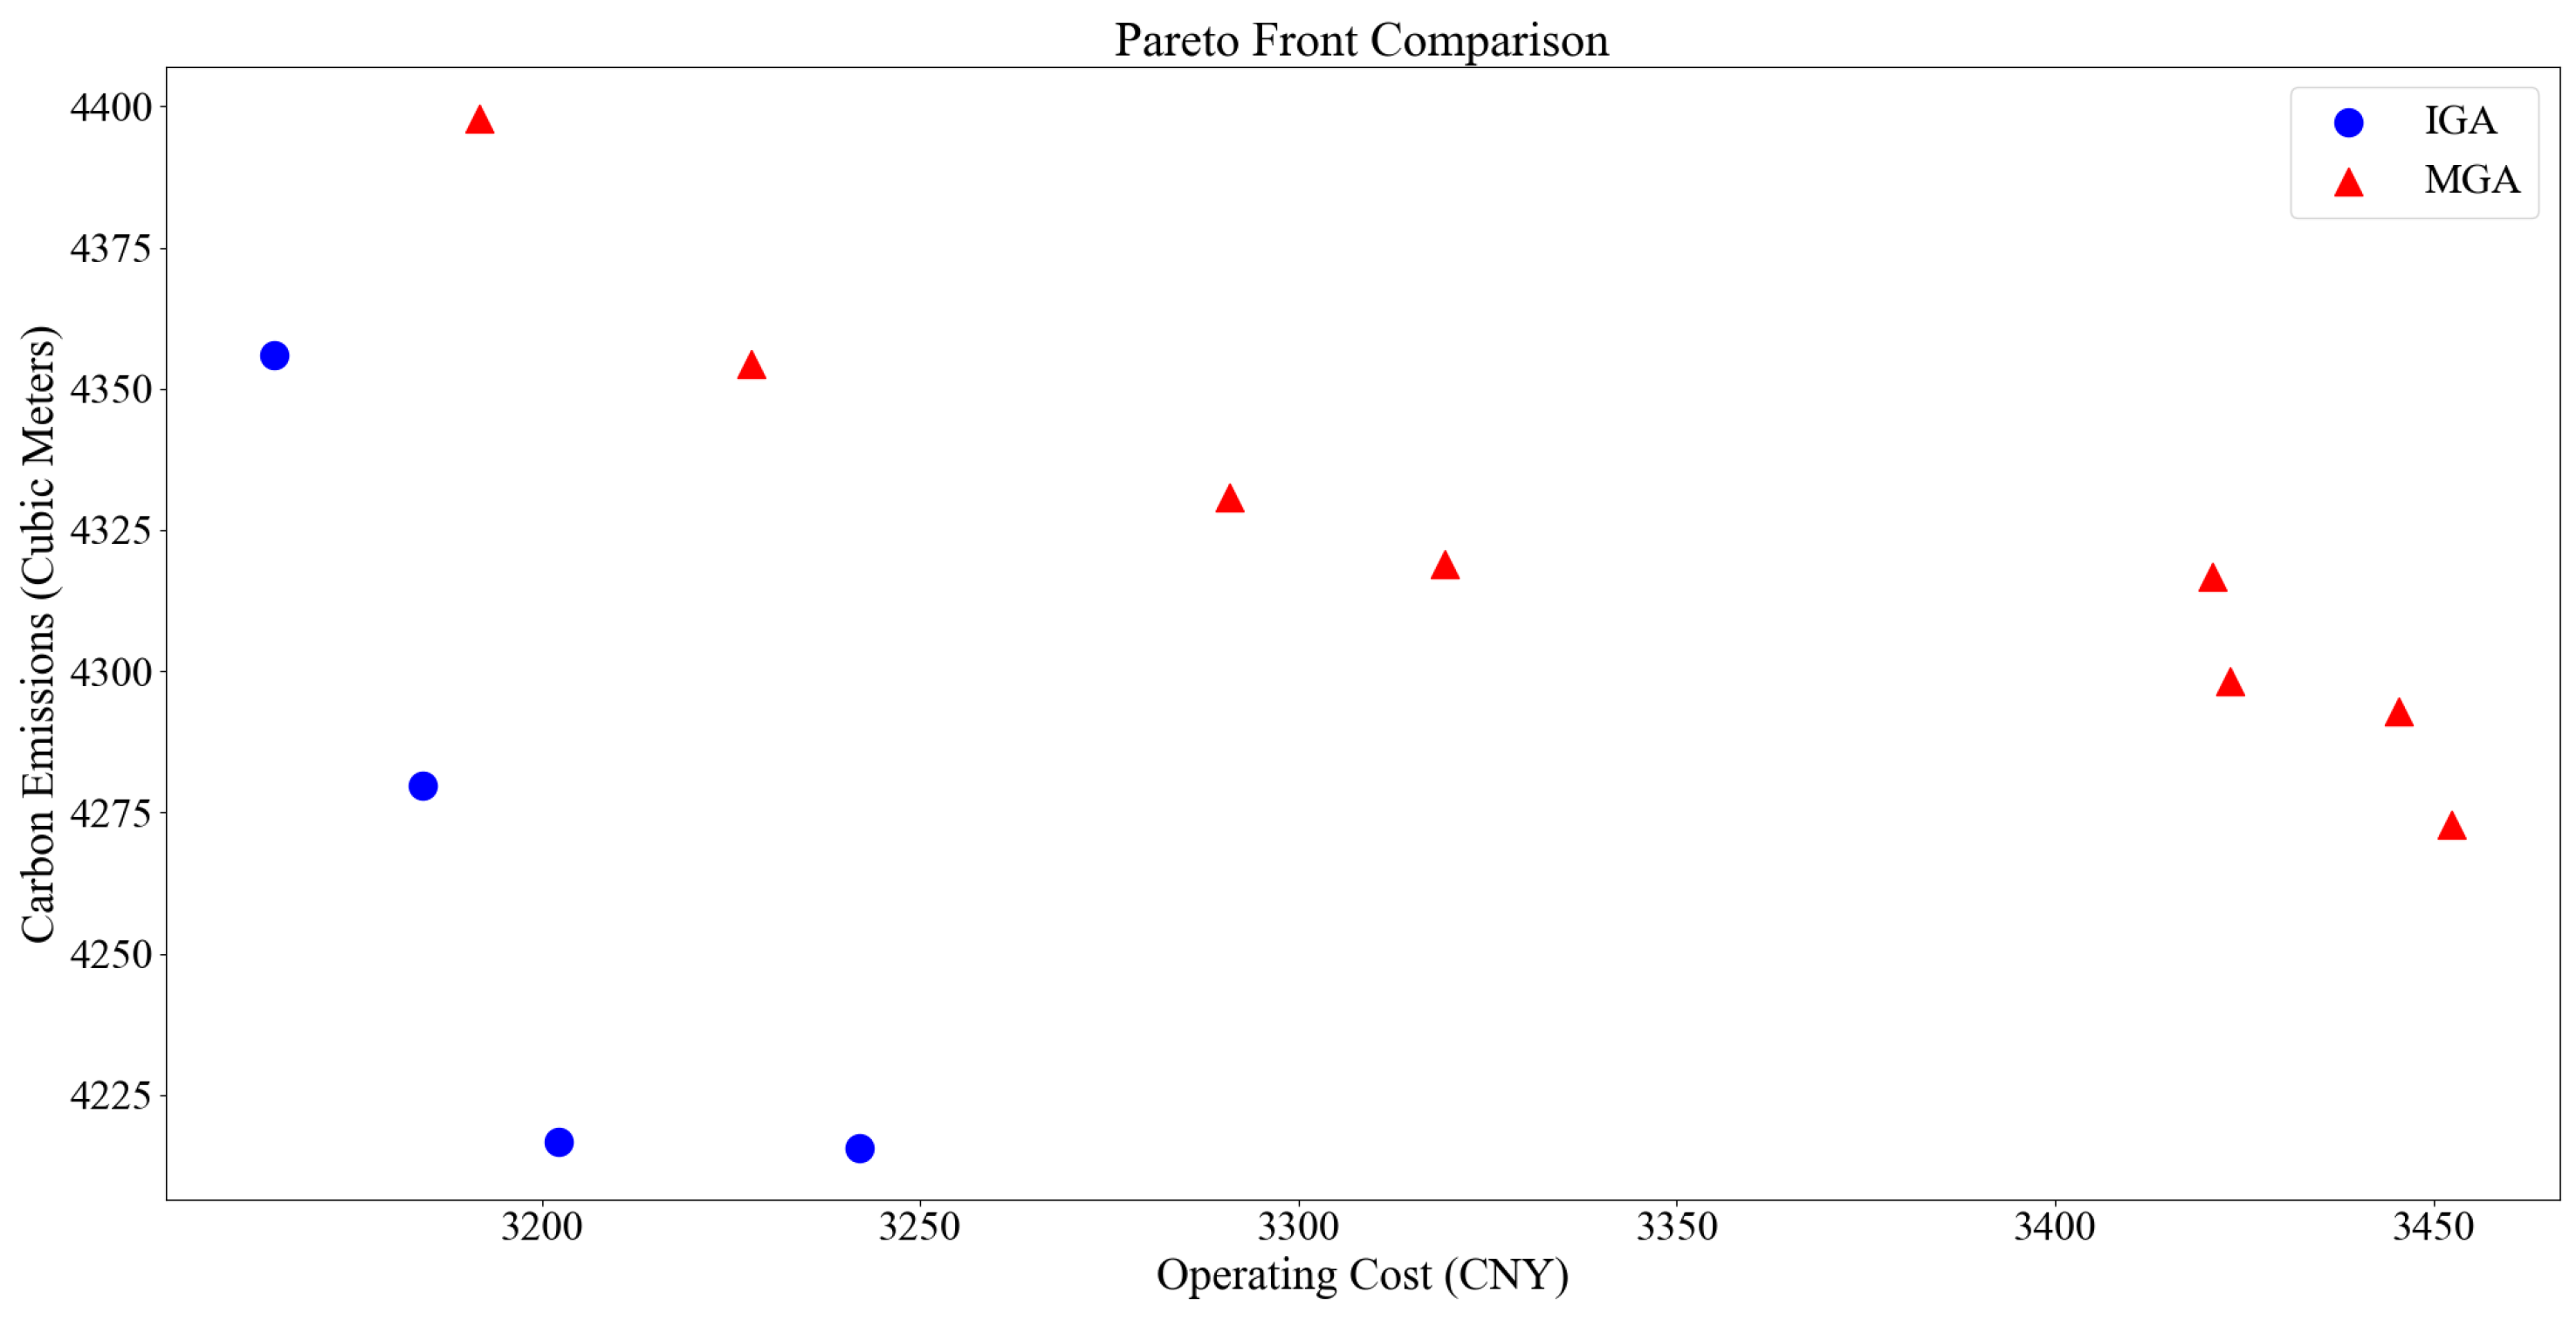
4.5. Comparison of the IGA with Other Heuristic Algorithms

To demonstrate the superiority of the IGA, this section presents a comprehensive comparison with other widely used heuristic algorithms—including MGA, MPSO, SGA, and MABC—for solving the integrated energy system optimization problems under three scenarios. The SGA [22] employs the classical genetic algorithm framework with the proposed parent selection method, while the MGA builds upon the NSGA-II algorithm [23] without modifying chromosome crossover and mutation operations, but it incorporates the parent selection method proposed in this study to preserve parent individuals. Both MPSO [25] and MABC [26] utilize penalty function methods to handle equality constraints, with their objective functions formulated as follows:
C = α 1 C + α 2 t = 0 T P t C H P + P t g r i d z t c h P t c h + η d c h z t d c h P t d c h + P t g r i d + P t P V + P t W T P t l o a d + Q t C H P + Q t W H U + Q t G B Q t l o a d
The equation consists of two parts: the first part represents the operating cost of the IES, and the second part is a penalty function. If the equality constraints are violated, a penalty term will be added to the objective function. The weights of α 1 and α 2 are set to 1. The objective function of the SGA is only Equation (26), which considers the cost of carbon emissions as part of the operating cost without separately minimizing carbon emissions.
Figure 17 shows a comparison of the Pareto fronts obtained by the IGA and MGA in scenario 1. Compared to the MGA, the IGA uses a cyclic crossover operation to preserve part of the genetic structure of the parent individuals, generating new offspring individuals. The polynomial mutation operation introduces new genetic variations, increasing the diversity of the population. This approach combines the excellent genetic structure of the parent individuals with new genetic variations, avoiding the problem of premature convergence and improving the global search ability of the IGA. Therefore, the solutions found by the IGA are superior to those found by the MGA.
Table 1 presents a comprehensive performance comparison of five algorithms across three distinct IES operational scenarios, evaluating both objective functions (including both IES operating costs and carbon emissions) and maximum constraint violations, with the results demonstrating the proposed IGA’s consistent superiority in all scenarios—achieving up to 5% improvement in both objectives relative to the baseline unimproved SGA—thereby validating the combined efficacy of its parent selection method, cyclic crossover operation, and polynomial mutation operation in facilitating thorough solution space exploration while maintaining generational solution stability for superior optimization outcomes.
Regarding maximum equation constraint violations, while the IGA shows slightly inferior performance to SGA in Scenario 1, it achieves the minimum equality constraint violations in both Scenario 2 and Scenario 3. This results from all the GA variants (IGA, MGA, and SGA) incorporating the proposed parent selection strategy that systematically eliminates infeasible solutions while preserving and stabilizing chromosomes satisfying the constraints, thereby demonstrating the strategy’s effectiveness in minimizing constraint violations. In contrast, both MPSO and MABC employ penalty function methods that treat equality constraints as soft constraints, which not only fails to prevent constraint violations effectively but also degrades their optimization capability due to the interference of penalty terms, ultimately leading to their inferior solution quality compared to GA-based approaches.

5. Conclusions

This paper proposes an IGA to effectively address the low-carbon multi-objective optimization problem in IESs, incorporating three key enhancements: (1) a cyclic crossover operation that preserves superior genetic information from parent populations by maintaining solutions optimally balancing operational costs and carbon emissions to meet IES low-carbon economic requirements; (2) an adaptive polynomial mutation operator that dynamically adjusts mutation intensity throughout the evolutionary process to thoroughly explore the solution space while preventing premature convergence to local optima; (3) a novel parent selection mechanism implementing a rigorous constraint-handling strategy that systematically eliminates infeasible solutions, ensuring final solutions adhere to critical equality constraints—particularly the power and heat balance equations essential for stable system operation—thereby guaranteeing solution practicality.
The proposed algorithm was rigorously tested across three operational scenarios of the IES and benchmarked against MGA, MPSO, SGA, and MABC, with results demonstrating that the IGA outperformed the competing algorithms by maintaining equality constraint violations below 0.3 kW (less than 0.2% of the IES’s normal operating power) while achieving maximum 5% reductions in both operating costs and carbon emissions compared to the unimproved SGA baseline, thereby conclusively validating its superior reliability and practical utility for IES optimization.
However, the IGA still exhibits certain limitations, as its overly complex crossover and mutation operations increase computational overhead and reduce operational efficiency, while as a day-ahead scheduling algorithm, it remains unable to handle potential fluctuations in renewable energy generation and load demand to ensure reliable power and heat supply. Future research directions could explore several extensions of this work: (1) Incorporating the uncertainty for renewable generation and load demand through stochastic or robust optimization approaches; (2) Expanding the multi-objective framework to include additional criteria such as system reliability or equipment lifespan; and (3) Developing hybrid algorithms that combine the strengths of IGA with other optimization techniques like deep reinforcement learning for more complex system configurations. These extensions would further enhance the practical applicability of the proposed approach in real-world energy management scenarios.

Author Contributions

Methodology and software, Y.D.; investigation, C.G. and Z.X.; validation, Y.D., C.G., Z.X. and D.W.; writing—review and editing, S.R.; visualization, S.R. and D.W.; supervision, S.R.; project administration, S.R. All authors have read and agreed to the published version of the manuscript.

Funding

This research was funded by by the Science and Technology Project of China Southern Power Grid (030000KC23040051 (GDKJXM20230334)).

Data Availability Statement

Dataset available on request from the authors.

Conflicts of Interest

Authors Yao Duan, Chong Gao, Zhiheng Xu were employed by the company Guangdong Power Grid Co., Ltd. The remaining authors declare that the research was conducted in the absence of any commercial or financial relationships that could be construed as a potential conflict of interest.

References

  1. Jia, C.; Liu, W.; He, H.; Chau, K.T. Deep reinforcement learning-based energy management strategy for fuel cell buses integrating future road information and cabin comfort control. Energy Convers. Manag. 2024, 321, 119032. [Google Scholar] [CrossRef]
  2. Jiang, B.; Yang, H.; Wang, Y.; Liu, Y.; Geng, H.; Zeng, H.; Ding, J. Dynamic Temporal Dependency Model for Multiple Steps Ahead Short-Term Load Forecasting of Power System. IEEE Trans. Ind. Appl. 2024, 60, 5244–5254. [Google Scholar] [CrossRef]
  3. Jiang, B.; Wang, Y.; Wang, Q.; Geng, H. A Novel Interpretable Short-Term Load Forecasting Method Based on Kolmogorov-Arnold Networks. IEEE Trans. Power Syst. 2025, 40, 1180–1183. [Google Scholar] [CrossRef]
  4. Song, D.; Meng, W.; Dong, M.; Yang, J.; Wang, J.; Chen, X.; Huang, L. A critical survey of integrated energy system: Summaries, methodologies and analysis. Energy Convers. Manag. 2022, 266, 115863. [Google Scholar] [CrossRef]
  5. Berjawi, A.; Walker, S.; Patsios, C.; Hosseini, S. An evaluation framework for future integrated energy systems: A whole energy systems approach. Renew. Sustain. Energy Rev. 2021, 145, 111163. [Google Scholar] [CrossRef]
  6. Wang, C.; Zhou, K.; Yang, S. A review of residential tiered electricity pricing in China. Renew. Sustain. Energy Rev. 2017, 79, 533–543. [Google Scholar] [CrossRef]
  7. Lv, G.; Zhang, Y.; Zhu, J.; Liu, L.; Wu, Y.; Wang, T. Low-carbon optimal operation of electricity—Heat—Gas systems based on bi-directional tiered-pricing carbon trading. Energy Rep. 2023, 9, 377–387. [Google Scholar] [CrossRef]
  8. Kuang, Y.; Lin, B. Performance of tiered pricing policy for residential natural gas in China: Does the income effect matter? Appl. Energy 2021, 304, 117776. [Google Scholar] [CrossRef]
  9. Keshavarzzadeh, A.H.; Ahmadi, P. Multi-objective techno-economic optimization of a solar based integrated energy system using various optimization methods. Energy Convers. Manag. 2019, 196, 196–210. [Google Scholar] [CrossRef]
  10. Yang, P.; Jiang, H.; Liu, C.; Kang, L.; Wang, C. Coordinated optimization scheduling operation of integrated energy system considering demand response and carbon trading mechanism. Int. J. Electr. Power Energy Syst. 2023, 147, 108902. [Google Scholar] [CrossRef]
  11. Chen, M.; Lu, H.; Chang, X.; Liao, H. An optimization on an integrated energy system of combined heat and power, carbon capture system and power to gas by considering flexible load. Energy 2023, 273, 127203. [Google Scholar] [CrossRef]
  12. Wang, Y.; Guo, L.; Ma, Y.; Han, X.; Xing, J.; Miao, W.; Wang, H. Study on operation optimization of decentralized integrated energy system in northern rural areas based on multi-objective. Energy Rep. 2022, 8, 3063–3084. [Google Scholar] [CrossRef]
  13. Zhong, J.; Li, Y.; Cao, Y.; Tan, Y.; Peng, Y.; Zeng, Z.; Cao, L. Stochastic optimization of integrated energy system considering network dynamic characteristics and psychological preference. J. Clean. Prod. 2020, 275, 122992. [Google Scholar] [CrossRef]
  14. Li, J.; Liu, J.; Yan, P.; Li, X.; Zhou, G.; Yu, D. Operation Optimization of Integrated Energy System under a Renewable Energy Dominated Future Scene Considering Both Independence and Benefit: A Review. Energies 2021, 14, 1103. [Google Scholar] [CrossRef]
  15. Zhang, A.; Zhang, H.; Qadrdan, M.; Yang, W.; Jin, X.; Wu, J. Optimal Planning of Integrated Energy Systems for Offshore Oil Extraction and Processing Platforms. Energies 2019, 12, 756. [Google Scholar] [CrossRef]
  16. Carvalho, É.C.; Bernardino, H.S.; Hallak, P.H.; Lemonge, A.C. An adaptive penalty scheme to solve constrained structural optimization problems by a Craziness based Particle Swarm Optimization. Optim. Eng. 2017, 18, 693–722. [Google Scholar] [CrossRef]
  17. Wang, Q.; Hobbs, W.B.; Tuohy, A.; Bello, M.; Ault, D.J. Evaluating Potential Benefits of Flexible Solar Power Generation in the Southern Company System. IEEE J. Photovoltaics 2022, 12, 152–160. [Google Scholar] [CrossRef]
  18. Niu, S.; Zhao, Q.; Niu, S.; Jian, L. A Comprehensive Investigation of Thermal Risks in Wireless EV Chargers Considering Spatial Misalignment from a Dynamic Perspective. IEEE J. Emerg. Sel. Top. Ind. Electron. 2024, 5, 1560–1571. [Google Scholar] [CrossRef]
  19. Li, W.; Wang, Q. A Linked Swing Contract Market Design with High Renewable Penetration and Battery Firming. IEEE Trans. Power Syst. 2024, 39, 2723–2734. [Google Scholar] [CrossRef]
  20. Yang, C.; Song, B.; Xie, Y.; Zheng, S.; Tang, X. Adaptive Identification of Nonlinear Friction and Load Torque for PMSM Drives via a Parallel-Observer-Based Network with Model Compensation. IEEE Trans. Power Electron. 2023, 38, 5875–5897. [Google Scholar] [CrossRef]
  21. Hong Kong Electric Company. Residential Electricity Price List. 2023. Available online: https://www.hkelectric.com/documents/zh/CustomerServices/Documents/HKE_Tariff_2023_Residential_zh.pdf (accessed on 24 April 2025).
  22. Michalewicz, Z.; Schoenauer, M. Evolutionary Algorithms for Constrained Parameter Optimization Problems. Evol. Comput. 1996, 4, 1–32. [Google Scholar] [CrossRef]
  23. Deb, K.; Pratap, A.; Agarwal, S.; Meyarivan, T.A.M.T. A fast and elitist multiobjective genetic algorithm: NSGA-II. IEEE Trans. Evol. Comput. 2002, 6, 182–197. [Google Scholar] [CrossRef]
  24. Zhang, J.; Yao, Y. A Multi-user Integrated Energy Service Sharing Method Considering Stepped Carbon Emission Cost. Mod. Electr. Power 2022, 38, 1–13. (In Chinese) [Google Scholar] [CrossRef]
  25. Coello, C.C.; Lechuga, M.S. MOPSO: A proposal for multiple objective particle swarm optimization. In Proceedings of the 2002 Congress on Evolutionary Computation. CEC’02 (Cat. No. 02TH8600), Honolulu, HI, USA, 12–17 May 2002; Volume 2, pp. 1051–1056. [Google Scholar]
  26. Akbari, R.; Hedayatzadeh, R.; Ziarati, K.; Hassanizadeh, B. A multi-objective artificial bee colony algorithm. Swarm Evol. Comput. 2012, 2, 39–52. [Google Scholar] [CrossRef]
Figure 1. Diagram of IES.
Energies 18 02283 g001
Figure 2. Research Flow chart of the proposed IGA.
Energies 18 02283 g002
Figure 3. Diagram of cycle cross.
Energies 18 02283 g003
Figure 4. Research framework of proposed IGA in IES optimization.
Energies 18 02283 g004
Figure 5. Power and gas purchase in IES in Scenario 1.
Energies 18 02283 g005
Figure 6. Electric load and heat load in IES in Scenario 1.
Energies 18 02283 g006
Figure 7. Operation of ESS in IES in Scenario 1.
Energies 18 02283 g007
Figure 8. Violation of equality constraints in Scenario 1.
Energies 18 02283 g008
Figure 9. Power and gas purchase for the IES in Scenario 2.
Energies 18 02283 g009
Figure 10. Electric load and heat load for the IES in Scenario 2.
Energies 18 02283 g010
Figure 11. Operation of ESS in IES in Scenario 2.
Energies 18 02283 g011
Figure 12. Violation of equality constraints in Scenario 2.
Energies 18 02283 g012
Figure 13. Power and gas purchase for the IES in Scenario 3.
Energies 18 02283 g013
Figure 14. Electric load and heat load in the IES in Scenario 3.
Energies 18 02283 g014
Figure 15. Operation of ESS in IES in Scenario 3.
Energies 18 02283 g015
Figure 16. Violation of equality constraints in Scenario 3.
Energies 18 02283 g016
Figure 17. Pareto front obtained by IGA and MGA in Scenario 1.
Energies 18 02283 g017
Table 1. Comparison of different algorithms.
AlgorithmScenario 1Scenario 2Scenario 3
V *o1 *o2 *V *o1 *o2 *V *o1 *o2 *
IGA0.203202.134216.660.298094.545246.460.303381.654948.82
MGA0.233290.704330.030.338156.915333.160.323447.344957.79
MPSO17.63365.404524.8113.48107.575348.4010.913478.294965.16
SGA0.183468.184463.210.328295.445453.690.303486.244975.41
MABC2.53234.074253.314.88120.605309.643.743397.344955.38
* V: Violation; o1: objective 1; o2: objective 2.
Disclaimer/Publisher’s Note: The statements, opinions and data contained in all publications are solely those of the individual author(s) and contributor(s) and not of MDPI and/or the editor(s). MDPI and/or the editor(s) disclaim responsibility for any injury to people or property resulting from any ideas, methods, instructions or products referred to in the content.

