Article

The Development and Evaluation of a Low-Emission, Fuel-Flexible, Modular, and Interchangeable Solid Oxide Fuel Cell System Architecture for Combined Heat and Power Production: The SO-FREE Project

1
Department of Engineering Science, Marconi University, 00193 Rome, Italy
2
Department of Basic and Applied Sciences for Engineering (SBAI), Sapienza University, Via del Castro Laurenziano 7, 00161 Rome, Italy
3
ICI Caldaie S.p.a., Via G. Pascoli 38, 37059 Campagnola di Zevio, Italy
4
Department of Science and Technology for Sustainable Development and One Health, University “Campus Bio-Medico” di Roma, Via Álvaro Del Portillo 21, 00128 Rome, Italy
5
Department of Energy Technologies and Renewable Sources (TERIN) Laboratory for Hydrogen and New Energy Vectors (H2V), ENEA Italian National Agency for New Technologies, Energy, and Sustainable Economic Development, C.R. Casaccia, Via Anguillarese 301, 00123 Rome, Italy
*
Authors to whom correspondence should be addressed.
Energies 2025, 18(9), 2273; https://doi.org/10.3390/en18092273
Submission received: 7 April 2025 / Revised: 24 April 2025 / Accepted: 28 April 2025 / Published: 29 April 2025

Abstract

:
Within the framework of the SOCIETAL CHALLENGES—Secure, Clean, and Efficient Energy objective under the European Horizon 2020 research and innovation funding program, the SO-FREE project has developed a future-ready solid oxide fuel cell (SOFC) system with high-efficiency heat recovery. The system concept prioritizes low emissions, fuel flexibility, modular power production, and efficient thermal management. A key design feature is the interchangeability of two different SOFC stack types, allowing for operation under different temperature conditions. The system was developed with a strong emphasis on simplicity, minimizing the number of components to reduce overall plant costs while maintaining high performance. This paper presents the simulation results of the proposed flexible SOFC system, conducted using Aspen Plus® software version 11 to establish a baseline architecture for real plant development. The simulated layout consists of an autothermal reformer (ATR), a high-temperature blower, an SOFC stack, a burner, and a heat recovery system incorporating four heat exchangers. Simulations were performed for two different anodic inlet temperatures (600 °C and 700 °C) and three fuel compositions (100% CH4, 100% H2, and 50% H2 + 50% CH4), resulting in six distinct operating scenarios. The results demonstrate a system utilization factor (UFF) exceeding 90%, electrical efficiency ranging from 60% to 77%, and an effective heat recovery rate above 60%. These findings were instrumental in the development of the Piping and Instrumentation Diagram (P&ID) required for the design and implementation of the real system. The proposed SOFC system represents a cost-effective and adaptable energy conversion solution, contributing to the advancement of high-efficiency and low-emission power generation technologies.

1. Introduction

The global demand for electricity and thermal energy is continuously increasing. Nowadays, this demand is still mostly fulfilled by fossil fuels, especially oil, coal, and natural gas. However, fossil fuels no longer have their appeal as an energy source due to global warming and climate change issues, and also due to the urgent need for countries to achieve energy independence [1,2]. For the reasons listed above, in recent years, researchers have focused on viable alternatives to fossil fuels. Green hydrogen [3] and biogas [4,5], as renewable fuels, are considered promising alternatives. Indeed, hydrogen has proven to be an efficient energy carrier which can be used for electrical and thermal power production without emitting CO2, ensuring high efficiency due to the high lower heating value (LHV) that is about three times the value of hydrocarbon fuels on a mass basis [6]. On the other hand, biogas is a gaseous biofuel mainly composed of CH4 and CO2 (typically 50–70% CH4 and 30–50% CO2) produced from bio-wastes under anaerobic conditions. Biogas also contains steam and some undesired contaminants such as H2S, NH3, siloxanes, and volatile organic compounds, the amount of which depends on the physical and chemical characteristics of bio-waste feedstock and the type of anaerobic digestion plant [7]. Hydrogen and biogas can be used for the combined production of electricity and thermal energy through different technologies, including gas turbines (GTs), internal combustion engines (ICEs), and fuel cells (FCs). While GTs and ICEs represent more mature and widely adopted solutions, they generally exhibit lower energy conversion efficiencies and higher pollutant emissions compared to FCs [8]. Furthermore, FCs can effectively utilize low-calorific value gases and operate with fluctuating compositions, making them particularly suitable for biogas applications, where the LHV strongly depends on the type of bio-waste feedstock and the anaerobic digestion process [9,10]. Among fuel cells, the most promising high-temperature cogeneration technology is the solid oxide fuel cell (SOFC), a high-temperature electrochemical system in which chemical energy contained in the inlet fuel is directly converted into electrical energy and heat, and that is capable of working with different energy carriers (e.g., hydrogen) and renewable sources (e.g., biogas) [11,12]. The electrical efficiency of an SOFC stack goes up to 60%, while emissions are very low, making the exhaust gases clean, which is especially important in urban areas [13]. It is important to note that the integration of biogas with SOFCs can provide a viable solution for the electrification of rural areas, allowing villages to be energy-independent and simultaneously solving the issue of bio-waste. Recent research in the field of SOFCs has shifted its focus toward system integration and control, following advancements in SOFC technology, particularly in stack assembly and cell manufacturing of different cell types [14,15]. In the existing literature, different works related to SOFCs have been extensively analyzed across various aspects such as modeling, optimization, technical and economic performance analysis, the development of control strategies, and fault diagnosis. Regarding SOFC systems fueled by natural gas or hydrogen, Jiang et al. [16,17] conducted thorough static and dynamic analyses, addressing optimal power-switching control schemes to navigate SOFC system power across optimal operation points during load tracking. Regarding External Steam Reforming SOFC (SR-SOFC) configurations, they offer fuel flexibility and relatively simple system layouts. Papurello et al. [18] illustrated the necessity of an external reformer in an SOFC system, typically employed under steady operating conditions. Comprehensive models of complete external SR-SOFC systems were developed to examine temperature distribution within the stack and formulate control strategies [19,20]. Fault diagnosis for the SR-SOFC system was performed using fault maps [21], while economic analyses were conducted for SR-SOFC cogeneration or trigeneration systems [22,23]. The approach adopted in this analysis involves performing fuel reforming upstream of the SOFC stack. Although SOFC systems have been widely discussed in the literature, most studies focus on the use of a single pure fuel or a mixture of pure fuels, without analyzing the impact of switching between hydrogen, natural gas/methane, and hydrogen–methane mixtures, despite the significant influence these variations can have on system performance, as highlighted in previous research. Moreover, the literature typically considers systems based on a single SOFC technology, without exploring the possibility of operating the same plant with different stacks characterized by distinct operating parameters. For these reasons, the objective of the present paper is to model an SOFC system which is truly modular and flexible, allowing us to integrate different SOFC stack technologies fed with any fuel mixture of natural gas and hydrogen. Two different SOFC technologies are considered to achieve full interchangeability of stacks in the same system, in pursuit of a barrier-free market for stack and system manufacturers alike, by standardizing the stack module–system interface. To achieve this goal, a novel architecture system is defined that encompasses an autothermal reformer connected to an SOFC stack and a downstream burner connected to a heat recovery system incorporating four heat exchangers. The added value of the present study is the ability to provide a wide range of fuels to different SOFC stacks in a single-system layout while integrating a few key components. The developed system promotes broader renewable energy integration, increases the penetration of hydrogen and biofuels in natural gas infrastructure, reduces emissions, and enhances consumption efficiency. In this context, the capability of the system to offer fuel flexibility, encompassing renewable fuels (e.g., biogas and renewable hydrogen), and technological flexibility, encompassing different SOFC technologies while ensuring high electrical efficiency using a compact system layout, is very relevant considering the evolving panorama of the energy system at all levels of implementation: increasing injections of renewable fuels in the gas network, reducing the dependency of the power sector on natural gas, reducing emissions, increasing efficiency and reliability, and lowering the cost of low-emission and high-efficiency generation systems. SOFCs’ ability to operate with different fuels aligns with efforts to decarbonize natural gas grids by incorporating biomethane, H2, or biomass-derived gas mixtures.

2. Preliminary Discussion

Through a preliminary discussion, the authors try to describe how they arrived at a control strategy of the power plant proposed in this work, highlighting the similarity and differences with systems presented in the literature. The discussion will be integrated in the next paragraphs. Unlike most studies in the literature that consider external reforming using standard reformer units, the present work introduces an innovative solution based on the use of an autothermal reformer (ATR). This configuration enables the generation of the thermal energy required to sustain endothermic reactions such as steam methane reforming (SMR) and to raise the fuel temperature to the SOFC inlet operating conditions. The necessary heat is provided through the partial combustion of the inlet fuel with a sub-stoichiometric air flow within the ATR. An SOFC coupled with gas turbine hybrid systems, which represent high-efficiency hybrid power solutions, has been analyzed in the literature to gain deeper insight into system layouts incorporating SOFC technology. Theoretical modeling and detailed analyses of SOFC-GT systems have been carried out. Barelli et al. [24] developed a zero-dimensional Aspen model of an SOFC-GT system composed of a gas turbine, a heat recovery section, a solid oxide fuel cell stack and reforming section, and an afterburner. In the SOFC section, the fuel cell stack was modeled using RGIBBS reactors for the reformer and anode blocks and the cathode was modeled as a splitter. There exists thermal recovery in preheating the air entering the cathode and the fuel through the exhaust from the turbine, but in this system, neither recirculation nor bypass has been considered to optimize the thermal recovery system. In some articles [25,26], a pressurized SOFC-GT system was presented with anodic recirculation and a thermal management strategy that involves an air bypass on the heat exchanger between input air and exhaust gases. The net system efficiency reached a maximum of 75.6% at 80% fuel utilization with a power split of 66.2% fuel cell to 33.8% turbine. In the work of Zhou et al. [27], the authors showed that, although there is significant opportunity for fuel flexibility in fuel cell systems, the increased complexity in distributed power plant control can lead to controller instabilities. Cuneo et al. [28] studied a control strategy of a hybrid SOFC system considering the degradation of electrochemical cells, while Chen et al. [29] studied the dynamic behavior of recirculation present in hybrid SOCF systems taking into consideration the transients before the steady-state condition. Similar works have been performed by Zaccaria et al. [30] on hybrid SOFC systems considering the dynamic behavior of present bypasses and by Azizi et al. [31], who highlighted that there is a significant need to develop control strategies for this kind of system. None of these aspects have been considered in the present work. However, the configuration developed in the present work features a system layout with components similar to those described by Barelli et al. [24], even if the present study introduces both anodic recirculation and multiple bypass strategies as reported by Oryshchyn et al. [25] and Harun et al. [26]. The performance of SOFC systems is also severely influenced by the inlet fuel [32]. Besides natural gas and hydrogen, in the literature, few studies investigate SOFC performance fueled by a mixture of hydrogen and methane (known as hythane), biogas (a mixture of CH4 and CO2), and methane-free biogas (a mixture of H2 and CO2). Among these, biogas stands out as the most extensively researched biomass-derived fuel for SOFCs [11]. Papurello et al. [33] used a biogas mixture in a three-cell short-stack SOFC for 500 h at 800 °C with a current density of 0.1 A/cm2. Gandiglio et al. [34] produced biogas from wastewater treatment and used it in a 174 kWe SOFC stack with a heat recovery system, achieving a net electric efficiency of the SOFC in the range of 50–55% and more than 5500 h of operation. Cozzolino et al. [35] modeled an SOFC system fed by biogas in steady-state conditions using Aspen Plus. In the work of D’Andrea et al. [36], the Direct Internal Reforming (DIR) of biogas has been simulated up to 60% of direct CH4 conversion into the fuel cell anode. They showed that DIR operation can be seen as an additional means to control the stack’s thermal behavior. In addition, the availability of the cathode air flow rate is essential to avoid overheating of the stack. In the work of Tjaden et al. [37], the authors analyzed a power plant very similar to the one proposed in this paper, although they discussed the results only for the use of biogas, working at an SOFC temperature of 800 °C and producing an electric power of 25 kW with an efficiency of about 50%. They used recirculation as well as bypass, but there are some differences such as the use of a different recovery system and the use of a reformer instead of an ATR. Moreover, in the present work, more scenarios are investigated to assess the desired flexibility of the power plant. Doherty et al. (2009) [38] studied the performance of an SOFC in a combined heat and power system using biomass-derived syngas. Also, in this work, the SOFC was modeled in Aspen and validated with literature data. They demonstrated an efficiency of about 85%, using a pre-reformer, an afterburner, and recirculation but no bypass and a different recovery system. Regarding the utilization of methane-free biogas in SOFCs, previous research is relatively limited. Leone et al. [39] showed that H2 and CO2 can be directly used with Ni-based anodes, while the utilization of bio-methane produces carbon deposition, negatively influencing the electrochemical performance and determining mechanical losses. Moreover, they showed that the R-WGS, which is an endothermic reaction, even if with a lower effect compared with the cooling effect of steam and dry reforming, provides self-cooling of the stack and allows for reductions in air flow for cooling purposes, with a reduction in blower consumption and higher system efficiencies. La Licata et al. [40] demonstrated that methane-free biogas has been successfully fed to an SOFC to produce electricity. Furthermore, the study reports that cell electrochemical performance is comparable to that of a cell fed by pure hydrogen. Laycock et al. [41] demonstrated that methane-free biogas feeding for electrochemical power generation and fuel conversion is closely linked to the reverse water–gas shift (R-WGS) reaction, which is mildly endothermic and thus facilitates moderate stack cooling. Concerning the application of hythane (CH4/H2) and biohythane (CH4/CO2/H2) mixtures in SOFCs, existing studies in the literature are not yet extensive. However, it was established that power generation from these mixtures primarily occurs through electrochemical H2 oxidation. Moreover, some studies observed that increasing the CH4 content reduces the electrical performance and durability of the cell, as carbon deposition becomes a growing concern [42]. Nikooyeh et al. [43] studied Ni/YSZ anodes fed with hythane, verifying that to avoid carbon deposition, the supplied gas composition needs a high H2/CH4 ratio. Cinti et al. [44] investigated the performance of an SOFC system operating at 750 °C, using a fuel blend ranging from pure H2 to pure CH4. The results showed that higher electrical efficiency was achieved when pure CH4 was used as fuel, while the use of a hydrogen–methane mixture led to lower efficiency. These findings are consistent with the results obtained in the present work. Additionally, the system configuration adopted in the work of Cinti et al. [44] shows similarities with the one proposed in this article, as it includes a pre-reformer, an afterburner, and a thermal recovery unit. However, features such as anodic recirculation and bypass lines, which are key elements in the present configuration, do not appear in the reported setup. The analyzed system operates with a steam-to-carbon ratio of 2.2, a hydrogen utilization factor of 80%, and delivers an electrical power output of 1.225 kW, with a stack temperature between 700 and 750 °C. Under pure methane operation, the electrical and total efficiencies reported are 48.44% and 75.07% (LHV-based), respectively. The work of Almutairi et al. [45] shows that the voltage of the SOFC increases with higher CH4 concentrations; indeed, the standard voltage for methane is higher than that for hydrogen. The open-circuit voltage of SOFCs supplied with an 80% H2–20% CH4 fuel mixture is 15.6% higher than that obtained with pure H2. However, these differences decrease as the current densities increase. Moreover, the authors highlighted that in the short term, SOFC performance improves with increasing methane concentrations from 0 to 20% in the fuel mixture. However, performance degraded in the long term when the CH4 concentration in the fuel mixture was high. Panagi et al. [46] worked with biohythane (CH4/CO2/H2), highlighting that compared with biogas (60/40 vol% CH4/CO2), they observed an increase in performance; moreover, they showed that dry reforming of CH4 and the R-WGS reaction have key roles in fuel conversion at the anode. In the work of Veluswamy et al. [47], biohythane performance was studied for a 120 kW SOFC stack using the Aspen process model and compared with other feed stocks. Comparisons showed that biohythane provides better efficiencies in hybrid SOFC systems with a gas turbine. The fuel utilization factor (UFf) varied from 0.60 to 0.95. Sensitivity studies recommend stack operation with biohythane at a steam-to-carbon ratio of 2.0 and a UFF of 0.85. Also, in this case, a pre-reformer and an afterburner are taken into account as well as the anodic recirculation but no bypass and recovery have been considered. Finally, in the Aspen simulation, a Gibbs reactor at equilibrium was used at 900 °C and the efficiency was about 50%.

3. Materials and Methods

This section describes the simulation model representing the SO-FREE system concept, developed with Aspen Plus® software version 11. Section 3.1 introduces the research objectives. Section 3.2 provides a comprehensive description of the system, starting with the initial assumptions, followed by the process flowsheet illustrating the developed model. This section continues with a tabular overview of the individual system components and a detailed explanation of the specific concept for each block. Section 3.3 focuses on the various control strategies for the model, detailing the different design specifications (DSs) used in the simulations. The results of the developed system model are presented in Section 4.

3.1. Overall Objectives

This work aimed to develop a unified system fed with different types of fuel as input while operating across a broad temperature range. This flexibility enables the integration of multiple SOFC technologies working at different temperatures. The system design prioritized minimizing components and costs to create an economical solution that can ensure control over parameters under varying operating conditions. It is worth noting that this phase represents an initial exploratory analysis aimed at identifying a configuration that can operate effectively under the different conditions examined. Through this process, a preliminary configuration was defined, allowing for an initial selection of components that could be integrated into the system. Subsequent phases will involve an optimization process, leveraging detailed information about the selected components to refine and enhance the system’s performance and overall feasibility.
The present study is based on the achievement of the following specific objectives:
  • The development of a versatile system capable of operating with multiple SOFC technologies working at different temperatures.
  • Fuel flexibility, allowing for the system to operate with pure hydrogen (H2), pure natural gas (CH4), or variable mixtures of methane and hydrogen in different proportions.
  • Simplification of the SOFC system, enabling operation across a broad range of fuel compositions and temperatures with only a few essential components, including an autothermal reformer, an SOFC stack, a burner, a high-temperature blower, four heat exchangers, low-temperature compressors, and various splitters/mixers.

3.2. System Architecture and Aspen Plus Modeling

The process simulation was conducted using Aspen Plus® software [48,49,50,51]. The following assumptions were applied:
  • The process operates under steady-state and isothermal conditions [48].
  • The Peng–Robinson equation of state is used to model the gas phase.
  • The gas phase includes N2, O2, H2, CO, CO2, CH4, and H2O as volatile species [49].
  • The system operates slightly above atmospheric pressure, with an inlet pressure of 1.07 bar and an outlet pressure of 1.03 bar, resulting in a total pressure drop of 40 mbar.
  • Two minimum stack temperatures are considered: 600 °C for low-temperature (LT) operation and 700 °C for high-temperature (HT) operation.
  • The system is designed to deliver a constant power output of around 5 kWe, regardless of the fuel composition.
  • The blower’s maximum operating temperature is 750 °C, as specified by the manufacturer.
  • The burner’s maximum operating temperature is set at 950 °C.
The assumption of steady-state conditions is consistent with the process temperatures under operating conditions and the catalysts selected for critical components. Moreover, several studies on integrated SOFC systems assume that thermochemical reactions occur at equilibrium [52,53,54]. While this assumption may not always capture the exact behavior of real systems, it is generally accurate enough to provide reliable predictions, especially during the early stages of system design. Indeed, equilibrium-based modeling is widely adopted as a preliminary step for the analysis and optimization of thermochemical and electrochemical systems. In the present study, the validity of this approach is further supported by the agreement between simulation results and experimental data, confirming its suitability for system-level SOFC analysis. The Aspen Plus flowsheet of the developed model is presented in Figure 1. To enhance clarity, the flowsheet is divided into four sections, each highlighted in a different color: fuel input and anodic recirculation (black), the autothermal reformer (blue), the SOFC stack (red), and the thermal recovery system, including the burner and four heat exchangers (green) with 2% of thermal losses. The system consists of four input streams, one for fuel and three for air, which are directed to the ATR, SOFC stack cathode, and burner, respectively. These input streams are indicated in orange in Figure 1, while the single output stream is shown in purple.
Table 1 reports the description of each unit represented in the flowsheet.
A detailed description of the different sections of the plant is provided below; when introducing a new stream, its name is provided in brackets as it appears in Figure 1.

3.2.1. Fuel Input and Anodic Recirculation

The input fuel stream (FUEL) is initially compressed and then directed through a heat exchanger (HEXFUEL). In this exchanger, thermal energy from the anodic recirculation stream (RECHOT) is transferred to the input fuel, thereby preheating it while simultaneously cooling the recirculated stream coming from the anodic output before it reaches the blower (BLOWER), which provides the necessary pressure to reintroduce the recirculated stream into the system. This HEXFUEL process serves as a thermal recovery stage, which not only preheats the incoming fuel but also reduces thermal stress on the blower by cooling the recirculated flow. The recirculation system is designed to improve overall fuel utilization, increase the H2O content in the fuel stream to prevent carbon deposition, and improve thermal management between the anode and cathode. The flow rate of the recirculated stream is controlled by the SPLITAN component.
After being preheated in the HEXFUEL, the input fuel (FUELPRHT) is divided into two streams by the SPLITFUE component. One stream is sent directly to the anode of the SOFC stack (FUELPHAN), while the other (FUELPATR) is mixed with the recirculated anodic output from the SOFC stack, coming from the blower (RECPRESS). The resulting mixture (MIXEDFUEL) is then directed to the ATR.

3.2.2. Autothermal Reformer

During feeding with carbon-based fuels, the autothermal reformer is employed to convert a portion of the inlet hydrocarbons, primarily methane in this case, into hydrogen and carbon monoxide via the steam methane reforming reaction. Subsequently, the CO is further converted into hydrogen and carbon dioxide through the water–gas shift (WGS) reaction. While these reactions can occur within the stack anode itself via internal reforming, pre-reforming is implemented to enhance the conversion efficiency, increase overall fuel utilization, and mitigate the risk of carbon deposition within the stack anode. In addition, the use of an ATR ensures greater system flexibility, enabling adjustments to the stack inlet fuel composition (ANODEIN), specifically by increasing the concentrations of hydrogen (H2) and carbon monoxide (CO) relative to other hydrocarbons. The fraction of the inlet fuel passing through the ATR unit (FUELPATR) is a design parameter that can be varied to optimize system performance. Furthermore, in this unit, the heat required for the endothermic reactions (such as SMR), as well as the heat needed to bring the outgoing flow to SOFC inlet operating temperatures (typically in the range of 600–700 °C), is generated by burning a portion of the incoming fuel with a sub-stoichiometric amount of air introduced into the ATR. This concept also applies when the inlet fuel is composed of only pure hydrogen. In such cases, since no reforming reactions can occur, the ATR unit operates only as a pre-burner. However, this process also leads to a reduction in the LHV of the outgoing gas stream. Therefore, the main function of the ATR within the system is to maintain a constant temperature during the conversion reactions of CH4 and CO, ensuring compliance with the plant’s design constraints. This is essential to achieve the precise anodic flow temperatures required for the optimal operation of the SOFC stack. To simulate the ATR in Aspen, an RGIBBS reactor was employed, with six reactions defined to occur within this block: steam methane reforming (R1), water–gas shift (R2), partial (R3) and complete (R4) combustion of methane, CO combustion (R5), and hydrogen combustion (R6). The reactions are detailed in Table 2.

3.2.3. SOFC Stack

After the ATR, the reformed fuel exiting the unit (FUELREF) is combined with the portion of input fuel that bypasses the ATR (FUELPHAN) in the MIXFUEL component, and the resulting flow (ANODEIN) is used to feed the stack anode. The SOFC stack is the core of the system. Its main design parameters are the stack operating voltage (Vop), which depends on the cell voltage and the number of cells in the stack, and the fuel utilization factor (UFF). For a given stack fuel input, the UFF is directly linked to the stack current. Specifically, the UFF is defined as the ratio between the fuel converted within the stack and the total fuel input. The converted fuel determines the number of electrons released during the electrochemical reactions, directly linking the fuel utilization factor to the current generated by the stack, as described by Faraday’s law. Fuel conversion results in the production of both electrical and thermal powers. While the electrical power is extracted from the system for user applications, the thermal power is partly distributed between the anode and cathode, causing a temperature increase in the streams, and partly released into the environment. It is important to note that the increase in electrical power generation is directly associated with a corresponding rise in thermal generation, which may result in unacceptable temperature gradients within the stack. Moreover, when the stack is fueled with carbonaceous fuels, additional reactions, such as steam methane reforming (SMR) and water–gas shift (WGS), can occur alongside the direct conversion of input fuel into electrical power. Considering the endothermic nature of SMR, the fraction of fuel bypassing the ATR and entering the stack directly is a key parameter for internal heat management. A higher bypass rate increases the methane concentration at the anode inlet, raising the SMR heat demand and thereby helping to balance the excess thermal energy produced by electro-oxidation reactions. The stack data used for modeling were provided by manufacturers ELCOGEN and IKTS. Moreover, experimental data from short-stack tests conducted by ENEA were used to validate the SOFC model in ASPEN, as detailed in Section 4.1 Assessment and validation of SOFC core model. Performance maps from these experiments, along with direct operational parameter data (Vop, I and UFF) from the manufacturers, were integrated into the SOFC model within the developed system. Due to Aspen’s modeling limitations, the SOFC stack was simulated using multiple components rather than a single block. The anode and cathode were represented separately by an RGIBBS reactor and a separator (ANODE and CATHODE in Figure 1), respectively. The RGIBBS reactor, modeling the anode, is the main component of the stack model and includes three key reactions set as preferred reactions: steam methane reforming (SMR), water–gas shift (WGS), and hydrogen combustion (R1, R2, and R6 in Table 2). Within this reactor, chemical equilibrium is established for the anodic input stream, resulting in the generation of the converted output flow. In line with the selected reaction scheme, it was assumed that electro-oxidation occurs exclusively for H2, while CO and CH4 are converted through WGS and SMR reactions, respectively. Although theoretical, this assumption is widely adopted in the literature and aligns with the simplifications used in most SOFC models, which typically consider only hydrogen oxidation [26,55,56]. Moreover, the good agreement between the simulated results and experimental data from short-stack tests, detailed in the Results Section, supports the validity of this approach. The cathode is represented by a separator that extracts O2 from the cathodic input air and supplies it to the anode reactor, simulating the migration of O2− ions through the electrolyte. The amount of O2 supplied is calibrated by a design specification to ensure hydrogen consumption aligns with the fuel utilization factor (UFF) values set as input. At the outputs of the anode and cathode, two fictitious heat exchangers (AN-HEAT and CAT-HEAT in Figure 1) are introduced. These heat exchangers absorb a portion of the thermal energy generated by the RGIBBS reactor representing the anode and transfer it to the anodic and cathodic flows, resulting in a temperature increase that reflects the heat transfer occurring within the SOFC system due to the exothermic reactions in the stack. The amount of heat transferred to the flows is controlled by a DS.

3.2.4. Burner and Heat Recovery System

The fuel path downstream of the stack (ANOUTHOT) is split into two streams: one recirculated (RECHOT, already described in the Section 3.2.1) and the other directed to the burner (FUELBURN). At the burner, there are three input streams: the air leaving the cathode (AIRBURN), the portion of the anode output not recirculated (FUELBURN), and an additional air flow at ambient temperature (AIRPRES). This latter flow is used to regulate the burner temperature if it reaches excessively high values. The burner is modeled as a stoichiometric reactor, with fractional conversions for the residual fuel elements set to 1, to ensure complete combustion. The gas flow exists from the burner (BURNEDHT), containing significant sensible energy, and is utilized to power a heat recovery system. This system preheats the incoming air for both the cathode (AIRCATH) and the ATR (AIRREFPH) via the HEAIRCAT and HEAIRATR heat exchangers, respectively. Additionally, a downstream heat exchanger (QSENS) was included to represent the potential recovery of residual enthalpy for cogeneration purposes.

3.2.5. Global System Considerations

The SOFC system presented in this work introduces several innovative design features compared to the existing literature. The fuel preheating strategy, which is essential for avoiding thermal shocks, eliminates the need for external heat sources and simultaneously allows for control of the inlet temperature of the recirculated flow to the blower. Moreover, the proposed configuration achieves preheating by recovering heat from the SOFC outlet stream, thereby reducing thermal stresses and enhancing energy efficiency. The system also incorporates a flexible fuel-splitting approach, distributing the fuel between the autothermal reformer (ATR) and the SOFC stack anode. This allows for precise control of stack operating conditions and ensures optimal operation across a variety of input fuels without requiring layout modifications or additional plant units. By adjusting the fuel split according to the supplied gas composition, the system achieves a broad range of operational flexibility and ensures efficient performance under variable conditions. A key innovation of the system is its compatibility with two different SOFC stacks, each with distinct operating conditions, using the same plant components and relying only on control-level adjustments. The layout was developed with the goal of integrating all components into a single plant capable of handling multiple fuel types and different stack types while balancing the optimal operating parameters of each subsystem. This holistic approach represents a significant advancement in SOFC plant design, combining innovative thermal management, modular simulation techniques, and adaptive control strategies to deliver a robust and versatile energy system.

3.3. System Control

To properly design the system in Aspen Plus, nine design specifications are used. DS 1–4 regulates the fuel and air inputs in the system. Specifically, DS 1, 2, and 3 control the amount of air sent to the ATR, cathode, and burner, respectively. These variables were associated through the DS with the control of the temperatures of the anodic and cathodic input streams and of the burner operating temperature. DS-4, on the other hand, sets the input fuel flow to the system, related to the control of the electrical current generated by the SOFC stack. DS 5 and 6 manage the temperature difference between the inlet and outlet of the anode and cathode. This is achieved by adjusting the share of fuel sent directly to the SOFC stack instead of the ATR (DS-5) and by controlling the heat exchange in the HEAIRCAT (DS-6), the upstream heat exchanger for the cathode air stream. Finally, DS 7, 8, and 9 are related to the operating conditions of the SOFC stack. Specifically, DS-7 determines the amount of oxygen extracted from the cathode air and redirected to the anode to control the stack’s fuel utilization factor (UFF). DS 8 and 9 regulate the heat absorbed by the anodic and cathodic streams in the stack by adjusting the distribution of heat generated by the exothermic reactions occurring at the anode. A detailed description of each DS follows.

3.3.1. Design Spec 1—Air to ATR: TAnode In Control

As previously discussed, the partial oxidation of fuel in the autothermal reformer generates the heat required to achieve the desired stack anode inlet temperature. A design specification adjusts the air flow and therefore the oxygen supplied to the reformer (AIRREF in Figure 1). By modulating the air flow, the extent of fuel oxidation varies, influencing the heat produced, and consequently, the temperature increases. The stack inlet temperature was imposed as input for the simulations based on the stack type following the manufacturers’ specifications.

3.3.2. Design Spec 2—Air to Cathode: TCathode In Control

Using a similar approach to DS-1, a design specification (DS-2) is applied to regulate the cathode inlet temperature by adjusting the flow rate of the cathodic input air stream (AIRCATIN). The variation in the inlet air flow rate directly influences the temperature rise of the air as it absorbs heat in the HEAIRCAT, located upstream of the cathode inlet (and controlled by DS-6, described later). Specifically, increasing or decreasing the air flow rate results in a smaller or larger temperature rise, respectively. It is important to note that DS-2 works iteratively in tandem with DS-6 to ensure coherence between the cathode inlet temperature (set by DS-2) and the temperature difference (ΔT) across the cathode (controlled by DS-6). This dynamic interaction allows the system to achieve consistent thermal management of the cathode air stream. A detailed explanation of the role of DS-6 and its interplay with DS-2 can be found in the DS-6 description. The cathode inlet temperature is set as input for the simulations based on the stack type, following the manufacturers’ specifications.

3.3.3. Design Spec 3—Air to Burner: TBurner Control

To control the burner outlet temperature, a design specification was used that varies the amount of additional air that is sent to the burner (AIRBURNO). This air stream is used to prevent excessive temperatures within the component. By introducing cool air, heat is extracted from the system, thereby maintaining temperature control.

3.3.4. Design Spec 4—Input Fuel: Control of Stack Current Values

This DS was elaborated to ensure the supply of the correct fuel amount to the stack anode to meet the current requirement specified by the manufacturers. Equation (1) is used to establish this relationship:
( m ˙ H 2 C o n s u m e d · n e · F ) N c e l l = I
where N c e l l represents the number of cells in the stack, while n e and F denote the number of electrons released during the electro-oxidation reaction of the fuel (2 for hydrogen) and Faraday’s constant, respectively. Indeed, m ˙ H 2 C o n s u m e d corresponds to the hydrogen effectively consumed inside the stack; taking the UFF into account, it can be expressed as shown in Equation (2).
m ˙ H 2 C o n s u m e d = U F F · m ˙ e q H 2 A n o d e   I n
where m ˙ e q H 2 A n o d e   I n represents the molar flow rates of the equivalent hydrogen calculated considering complete conversion through WGS and SMR of the anodic fuel elements (CH4 and CO) in hydrogen, which is treated as the sole combustible element used by the system. It can be expressed by Equation (3):
m ˙ e q H 2 A n o d e   I n = m ˙ H 2 A n o d e   I n + m ˙ C O A n o d e   I n + 4 · m ˙ C H 4 A n o d e   I n
Thus, the UFF can be expressed by Equation (4):
U F F = m ˙ H 2 C o n s u m e d m ˙ e q   H 2 A n o d e   I n = 1 m ˙ e q H 2 _ A n o d e   O u t m ˙ e q   H 2 A n o d e   I n
The equivalence of Equation (3) is derived from the stoichiometry of SMR and WGS reactions (R1 and R2 in Table 2): In WGS, for every mole of CO, one mole of H2 is produced. In SMR, for every mole of CH4, four moles of H2 are produced, three directly from SMR and an additional one from the CO produced by SMR, which further reacts via WGS.
Using Equation (1), the actual amount of fuel converted is directly related to the current generated by the stack. In the design specification, the input fuel flow rate of the entire system (FUEL) is adjusted, as this directly influences the fuel supplied to the stack anode. By varying the system’s input fuel, the anodic fuel input (ANODEIN) is proportionally modified, enabling control over the current generated by the stack.

3.3.5. Design Spec 5—Fraction of Fuel Sent Directly to SOFC Stack: ΔTAnode Control

To control the temperature difference between the inlet and outlet of the anode streams, a design specification was implemented to adjust the fraction of fuel sent directly to the SOFC stack (FUELPHAN) relative to the fuel sent to the ATR (FUELPATR). As previously explained, when carbon-based fuels are used, the fraction bypassing the ATR enters the stack unreformed. Internal reforming occurs within the stack due to its high operating temperatures, meaning it absorbs heat. By varying the flow rate of this bypassed fuel, the temperature rise in the anode compartment can be regulated. It is worth emphasizing that the inlet temperature is set by DS-1; therefore, varying the heat absorbed by the endothermic reactions affects the outlet temperature. Additionally, the target temperature difference between the inlet and outlet was specified by the manufacturers.

3.3.6. Design Spec 6—Duty of HEAIRCAT: ΔTCathode Control

To maintain the temperature difference between the inlet and outlet of the cathode streams within a specified range, a design specification (DS-6) was implemented to adjust the amount of heat exchanged in the HEAIRCAT. It is important to highlight that the inlet temperature of the cathode air is set by DS-2, which controls the air flow rate entering the system. While it might appear counterintuitive that a heat exchanger located upstream of the cathode affects the temperature difference (ΔT) across the cathode, the connection lies in how DS-2 and DS-6 operate in tandem. Specifically, to ensure that cathode inlet temperature matches the desired setpoint, DS-2 may increase the air flow rate. This increase reduces the ΔT across the cathode because a higher air flow results in a lower temperature rise during heating at the cathode. In this iterative process, DS-2 and DS-6 work together to achieve the desired thermal balance. Furthermore, it is worth noting that even in real SOFC systems, the air flow rate to the cathode is a critical variable for controlling heat exchange within the stack, both at the anode and cathode. Operating with excess air flow allows for better heat removal, ensuring efficient thermal management of the system. Additionally, the target temperature difference between the inlet and outlet was specified by the manufacturers.

3.3.7. Design Spec 7—The Fraction of the O2 Sent to the Anode: UFF Control

The O2 separated from the air stream at the cathode is determined through a design specification to achieve the target UFF values set for the two stacks. Taking into account what is already said in DS-4, especially Equations (2) and (3), and the stoichiometry of the H2 electro-oxidation reaction (R6 in Table 2), the total mol of oxygen needs to react with all the equivalent hydrogen in the inlet stream to obtain a fixed utilization factor that can be expressed by Equation (5):
m ˙ O 2 _ N E E D = 1 2 · m ˙ e q H 2 A n o d e   I n · U F F

3.3.8. Design Spec 8 and 9: Duty of Anode and Cathode Fictious Heat Exchangers

The amount of thermal power supplied by the fictitious heat exchangers, ANHEAT and CATHEAT, to the anode (ANOUT) and cathode (CATOUT) streams, respectively, is determined through two design specifications. These are grouped together as they are based on the same calculation principles. The heat exchanged with the anode and cathode streams is calculated as a fraction of the total thermal power generated by the Gibbs reactor representing the anode. This total power is expressed as the sum of the electrical and thermal power produced by the stack conversion, as described in Equation (6):
PANODE = PELECTRICAL + PTHERMAL
The electrical power PELECTRICAL is derived from the amount of hydrogen consumed in the stack, using the operational current and voltage values specified by the manufacturers. This is expressed in Equation (7):
P ELECTRICAL = 2 · m ˙ e q H 2 C O N S U M E D · F · V O P
As already explained in the description of Equation (1), F represents Faraday’s constant, and the factor 2 accounts for the two moles of electrons produced for each mole of hydrogen consumed. The difference between the values of PANODE and PELECTRICAL corresponds to the thermal power, PTHERMAL, generated from the stack. The thermal power (Equation (8)) is composed of the heat distributed to the anode and cathode flows and the stack’s thermal losses.
PTHERMAL = PAN_HEAT + PCAT_HEAT + PTHERMAL_LOSSES
where PTHERMAL_LOSSES is assumed at 20% of PTHERMAL as input for the simulation. This value is related to a constraint about the maximum thermal losses that we considered acceptable for an SOFC system, namely about 5–7%. Those values represent about 20% of the total thermal power generated into the stack, 80% of which comes out from the stack together with anodic and cathodic flows. This assumption is consistent with the literature, such as [57] that reports power losses <10% for an SOFC stack. Thus, Equation (8) can be rewritten as Equation (9):
0.8∙PTHERMAL = PAN_HEAT + PCAT_HEAT
The sum of the thermal energy provided from anode and cathode heaters is therefore equal to the 80% of the total thermal energy generated by the stack. To determine the individual contributions of PAN_HEAT and PCAT_HEAT, the thermal power is scaled based on the relative input flow rates of the anode (ANODEIN) and cathode (AIRCATH) streams. This scaling accounts for the ratio of the anode or cathode input flow rate ( m ˙ A N ,   m ˙ C A T ) to the total stack input flow rate ( m ˙ A N + m ˙ C A T ). Equations (10) and (11) show the formulations used for heat distribution at the anode and cathode:
P AN _ HEAT = 0.8 ·   P THERMAL ·   m ˙ A N m ˙ A N + m ˙ C A T
P CAT _ HEAT = 0.8 ·   P THERMAL ·   m ˙ C A T m ˙ A N + m ˙ C A T
This method ensures a proportional allocation of the thermal power generated in the stack to the anode and cathode streams based on their respective flow rates. This approach aligns with the physical reality observed in solid oxide fuel cell systems, where the cathode operates with an excess air flow. Consequently, the cathode flow rate is higher than that of the anode, resulting in a greater amount of heat being absorbed by the cathode.

4. Results and Discussion

This section presents the simulation results for the system described in Section 3. Section 4.1 provides validation of the SOFC stack model by comparing simulation results with experimental data from short-stack tests. Section 4.2 outlines the analysis performed on the system, considering three different fuel inputs and two distinct operating temperatures. Finally, Section 4.3 presents the P&ID of the real plant, developed on the basis of the simulation results.

4.1. Assessment and Validation of SOFC Core Model

The initial step in system development consisted of the validation of the SOFC stack Aspen model comprising a Gibbs reactor, a separator, and fictitious heat exchangers, highlighted in red in Figure 1. The model results were compared with experimental data obtained from tests performed on a short stack provided by IKTS. Specifically, the consistency between the simulation and experimental results was evaluated by comparing the output gas compositions under identical input conditions and by verifying the distribution of thermal energy between the anode and cathode.

4.1.1. Output Composition Validation

Experimental outlet compositions, produced by the ENEA partner, were compared with the simulated output in volume percentage (vol%) under fixed input conditions, with identical fuel utilization factors (UFF) and inlet–outlet temperatures. Three feeding scenarios were analyzed: (1) 67% H2 and 33% CH4, (2) 100% CH4, and (3) 100% H2. The output results showed coherence across all cases, demonstrating the reliability of the model. Table 3, Table 4 and Table 5 present a detailed comparison of the experimental and simulated results for the three scenarios. For the pure hydrogen case, only H2 and H2O are reported in the tables, as the concentrations of other species were 0. The gas composition in the experimental tests was measured using a Clarus 680 GC (Perkin Elmer, Waltham, Massachusetts, USA), with a measurement accuracy of 2%.
The comparison for each input stream reveals that the SOFC module developed in Aspen aligns well with the experimental data. This validates its applicability for representing the stack component in the overall power plant system simulation.

4.1.2. Heat Distribution Validation

To validate the heat distribution between the anode and cathode, 20 experimental datasets were analyzed. Each dataset was used to calculate the ratio of thermal energy carried away from the stack by the anodic and cathodic flows. As shown in Figure 2, this thermal energy ratio was normalized by dividing it by the corresponding flow rate ratio of the anode and cathode in each experiment.
As expected, the results in all cases are very close to 1, confirming the assumption adopted in the design specifications. The average value of the ratio is 1.07, with a variance of 0.022, indicating minimal data dispersion. A ratio close to 1 suggests that the thermal powers absorbed by the anode and cathode flows are proportional to their respective flow rates. This proportionality is consistently observed across nearly all analyzed cases, reinforcing the validity of the design assumptions in DS-8 and DS-9. In particular, the assumption that heat distribution between the anode and cathode is proportional to the corresponding flow rates—excluding the assumed 20% thermal losses—is confirmed by the experimental results. This validation supports both the accuracy of the model in simulating heat management within the SOFC stack and its consistency with real operating behavior.

4.2. Performance Evaluation of Global SOFC Simulation

This section presents the results of the analyses conducted on the system described in Section 3, considering three different fuel inputs and two distinct operating temperatures, corresponding to the two stacks analyzed, in line with literature values. The tables in this section, presenting the simulation results, are categorized into high-temperature (HT) and low-temperature (LT) conditions. The HT condition corresponds to a stack inlet temperature of 700 °C, while the LT condition is set at 600 °C. Within each temperature category, the data are further organized by fuel type: the CH4-H2 section represents a blended fuel feed, while the CH4 and H2 sections correspond to cases with pure methane or hydrogen as the fuel streams.

4.2.1. System Inputs

Regarding the system inputs, as described in Section 3 within the flowsheet section, the system has four input streams: three for air and one for fuel. The temperature and pressure of all input streams are initially set to 25 °C and 1 bar, respectively. Table 6 presents the flow rate and composition of the input fuel stream (FUEL in Figure 1). For the air streams (AIRREF for ATR and AIRCATIN for cathode in Figure 1), only the flow rates are reported, as their composition corresponds to standard air. The fresh air input to the burner (AIRBURNO in Figure 1) is not included in the table, as its value remains zero in all simulations.
The fuel inlet values are relatively low, particularly when compared to the air flow entering the cathode. However, it is important to consider that the incoming fuel is mixed with the recirculated stream (RECPRESS in Figure 1) before entering the stack. This recirculation has significantly higher flow rates, as detailed later in the discussion on recirculation, which explains the observed differences. The reported inlet composition includes only hydrogen and methane, but these compositions change throughout the system before reaching the anode inlet of the stack. At the stack inlet, the gas mixture contains additional components, which will be discussed later in the stack section. The air flow to the ATR is minimal, which aligns with the requirement for a highly sub-stoichiometric air supply. This limited air input is necessary to combust only a small fraction of the fuel, ensuring the appropriate inlet temperature for the anode. This operating principle was described in Section 3, and the associated data are presented later in the ATR section. The air flow to the cathode was adjusted to optimize heat absorption within the stack.

4.2.2. HEXFUEL and Recirculation

After being compressed, the input fuel reaches the HEXFUEL, where, as described in Section 3, it is preheated by absorbing heat from the recirculation stream. On the other hand, the recirculated stream is cooled before entering the blower to mitigate thermal stress on this component. Table 7 shows the key values for understanding the heat exchange process in HEXFUEL and the blower operation, including the flow rates and temperatures of the two fluids within the exchanger. The recirculation rate, defined as the ratio between the recirculated anodic flow (RECHOT in Figure 1) and the outgoing anode flow rate (ANOUTHOT in Figure 1), was set to 0.7 for simulations using blended and pure methane feed, while it was increased to 0.8 in simulations with pure hydrogen to enhance heat distribution between the anode and cathode. This adjustment was made to increase the anode flow rate while maintaining a constant cathode flow rate. As described in Equations (10) and (11) in Section 3.3.8, this variation allows for a higher share of heat to be absorbed by the anode compared to the cathode. Considering the HEXFUEL values, it is evident that two very different flow rates evolve within this component: on the fuel side, flow rates are relatively low, leading to a large ΔT, whereas on the recirculation side, flow rates are significantly higher, resulting in a low ΔT.
The temperature of the recirculated stream at HEXFUEL output represents a constraint that must be met. Specifically, at the blower input, the flow temperature should not exceed 750 °C to avoid excessive thermal stresses in this component. In all cases, the T Out Rec values comply with this constraint. However, as expected, the temperature values are significantly higher for the HT simulations. The blower generates a pressure increase of 40 mbar in all cases, ensuring a similar workload for the different analyzed scenarios. Upon exiting HEXFUEL, the fuel stream is split into two branches. One stream bypasses the ATR section (FUELPHAN in Figure 1), while the other (FUELPATR in Figure 1) is first mixed with the recirculation flow exiting the blower and then is sent to the ATR. The outlet stream from the ATR is then remixed with the bypassed stream before entering the cell. Table 8 shows the value of the split fuel streams. The simulations with pure hydrogen were not considered, as they were deemed non-influential. As previously explained, with pure hydrogen, the ATR operates solely as a pre-burner, with no reforming reactions taking place.
It can be observed that most of the fuel is directly sent to the stack to better control the temperature difference between the inlet and outlet. Despite the small amount of fuel directed to the autothermal reformer (ATR), the desired effect of increasing temperature is still achieved. Furthermore, sending minimal fuel to the ATR means that this component can be sized according to the flow rates. In the H2 case, the amount of fuel sent to the ATR is used just to meet the temperature requirements at the anode inlet burning a portion of the input hydrogen. In the CH4–HT case, a higher ATR bypass ratio is used compared to other configurations. This choice aims to increase the share of unconverted fuel entering the SOFC stack in this case, enhancing internal reforming reactions and their associated endothermic effect. This approach helps to compensate for the lower efficiency observed that would lead to a higher heat value if no sufficient reforming was present into the stack that allows for better thermal regulation. The combination of ATR bypass, anodic recirculation, and ATR air flow proves to be an effective strategy for controlling stack temperature profiles under high-temperature conditions.

4.2.3. Autothermal Reformer

As stated in Section 3, the primary function of the ATR is to maintain a constant temperature during the conversion reactions of CH4 and CO, ensuring that the anodic flow temperatures meet the requirements for the optimal operation of the SOFC stack. To achieve this function, the process results in a reduction in the LHV of the output gas stream (FUELREF in Figure 1). This reduction in LHV within the ATR is considered the total power required to achieve the necessary stack inlet temperatures and is limited as expected. This approach does not distinguish between the thermal power consumed by the SMR reaction and that required to reach the desired temperature level. Table 9 presents the inlet and outlet flow rates and temperatures of the ATR streams, the LHV before and after this component, and the percentage of sub-stoichiometric O2. As previously explained, the low values obtained for the input air flow rate align with the requirement for a sub-stoichiometric air supply. The ATR fuel input flow rate shown in Table 9 (MIXEDFUEL in Figure 1) is significantly higher than the system input fuel rate reported in Table 7 (FUEL in Figure 1), as it also accounts for the recirculated flow. Both the fuel and air entering the ATR are not at room temperature, as thermal recovery is performed upstream by the heat exchangers HEXFUEL and HEAIRATR, respectively.
The O2/O2 stoichiometric ratio is sub-stoichiometric across all cases, as expected, with slightly higher values observed in the HT simulations compared to the LT ones. This result could be attributed to the greater heat required to achieve the higher inlet temperatures of the HT stack. The 0% value in the H2-LT case can be explained by considering the critical heat management requirements in this scenario. In this case, the recirculation exhibits higher values both in mass flow rate and temperature, resulting in a TATR FUEL INPUT that exceeds the required stack inlet temperature, even before reaching the ATR.
Consequently, in this case, no additional air flow was required for this component, leading to the absence of chemical conversion within this block. Table 10 reports the fuel composition at the inlet and outlet of the ATR.

4.2.4. SOFC Stack

As discussed in Section 3, the anodic stack compartment was modeled considering that CH4 and CO reach equilibrium through SMR and WGS reactions, with only H2 undergoing electro-oxidation. Regarding the cathodic compartment, air was used as the primary element for heat management within the stack; in addition to achieving a good air-to-fuel ratio, an air excess in the range of 2.43 to 3.36 was maintained throughout the simulations. The stack model was validated based on the description provided in Section 3.1. The data presented in this section are divided into temperatures, flow rates, and compositions at the anode and cathode inlet and outlet, as shown in Table 11, and the distribution of electrical and thermal power flows within the stack, detailed in Table 12. Table 11 shows the values of the stack UFF, temperatures, flow rates, and compositions for the anodic and cathodic flows entering and exiting the simulated stack. The values of the UFF and the anodic and cathodic inlet temperatures were set as input, respectively, through DS-7, 5, and 6, to which reference is made for a detailed description of the method applied.
The stack UFF values used as input are in line with the literature results reported in [25,41,43]. The molar flow of the anodic input (ANODEIN in Figure 1) is instead a result of the variation made in DS-4 to achieve the needed current values. The anodic output (ANOUTHOT in Figure 1), on the other hand, results from the conversion process occurring within the Gibbs reactor representing the anode in the simulation. Finally, only the total output air flow rate is reported, as the composition of oxygen depleted air was not considered significant.
The obtained anode inlet temperatures comply with the manufacturers’ specifications. The constraint was set at 700 °C for HT and 600 °C for LT. In the case of H2-LT, the inlet temperature slightly exceeds the setpoint value but remains within the stack specifications. The input composition shows a molar percentage of combustible elements, obtained by summing the percentages of H2, CO, and CH4, ranging between 21% and 24%, with hydrogen as the predominant element. Due to the high recirculation rate, the concentration of combustible species at the anode inlet is significantly diluted with H2O as the largest component. Despite this occurrence, the electrical efficiency of the stack is quite good, as indicated in Table 12. Regarding the anodic output composition, hydrogen is still the predominant fuel element, CO is present in a minimal quantity, while CH4 is never recorded for all scenarios. This result indicates that inside the stack, deep conversion of carbonaceous fuels such as CH4 and CO into hydrogen occurs. The presence of N2 is due to the contribution of the air stream used in the ATR, while oxygen, as expected, is never present, because it is always sub-stoichiometric in the upstream ATR section. Moreover, as already mentioned for H2 simulations, to improve heat management, it was necessary not only to increase the recirculation rate from 0.7 to 0.8, but also to decrease, in the HT case, the current load. Indeed, if simulations with 100% H2 are conducted at the same load of the other two power supplies, it generates a greater value of thermal power, since in this case there are no reactions that absorb heat in the stack (e.g., SMR).
The air flow rates entering the cathode (AIRCATH in Figure 1) are significantly higher than those entering the anode (ANODEIN in Figure 1), despite the high recirculation. As previously mentioned, the cathode air plays a critical role in removing most of the heat generated within the stack. It is important to note that, considering the temperature difference between the inlet and outlet anodic flows (streams ANODEIN and ANOUTHOT), even if the ratio between the anodic and cathodic design spec (Equations (10) and (11)) was different from 1.0, in the worst case (1.25 in Figure 2), this temperature difference still would remain within the manufacturers’ specifications.
Table 12 reports the electrical and thermal power flows of the stack. PTOT STACK represents the total power generated from the Gibbs reactor representing the anode, while stack current and voltage electrical parameters, and thus the electrical power produced, were used as input in the simulations because their values were provided by the manufacturers. The electrical power produced is extracted from the system, while the thermal power generated contributes partly to the temperature increase of the anode and cathode gas flows and is partly dissipated outside the system.
In all simulations, the electrical power values are around 5 kW, which was the nominal power set for the system. The electrical production represents the largest share of the total power, with their ratio ranging from 60% to 77%. Using the calculations provided in Design Spec 8 and 9, it was possible to determine the residual thermal power, which varies between 23% and 40% of the PTOT STACK. The highest thermal power value was obtained in the simulation with 100% H2, where thermal management was critical, and no current reduction was applied. The contributions to the total thermal power from the anode and cathode range between 5 and 8% and between 15 and 27%, respectively. This result clearly demonstrates that by increasing the cathode air flow, an effective thermal management strategy was achieved, with the cathode absorbing significantly more heat from the stack than the anode. Finally, thermal losses consistent with the value expected account for approximately 20% of the total thermal power.

4.2.5. Burner and Heat Recovery System

As discussed in Section 3, at the burner, the portion of residual fuel from the anode output that is not recirculated is fully combusted with the cathodic exhaust air. An additional ambient-temperature air stream was initially considered to control the temperature increase in the component, but the results showed that this stream was never required in any of the analyzed scenarios. The high sensible energy content at the burner outlet is utilized to power a heat recovery system, which preheats the air streams entering the stack and reformer and supports cogeneration, thereby maximizing overall system efficiency. Table 13 reports the enthalpy content of the two input streams at the burner, the LHV of the residual fuel, and the outgoing enthalpy represented by HBURNER OUTPUT. These values are energetically balanced with the values of Qi representing the heat exchanged in the respective heat recovery system heat exchangers, and allow to understand how the sensible energy exiting the burner is distributed among the three exchangers. From the data reported in Table 13, it can be observed that the thermal content of the stream at the burner outlet is primarily influenced by the enthalpy of the air stream coming from the cathode, followed by the sensible heat of the residual fuel stream, and lastly by the remaining LHV of the unreacted fuel. This indicates that fuel utilization within the system is high, contributing to the overall efficiency of the system.
Regarding the distribution of thermal power within the recovery system, more than 65% of the heat from the burner outlet is transferred to the HEAIRCAT exchanger, which preheats the cathodic air inlet. In contrast, less than 1% is absorbed by the HEAIRATR exchanger, which transfers heat to the ATR inlet air. Despite this, a significant portion of the thermal energy remains available downstream. This difference arises because the cathodic air represents the highest mass flow in the system and must be preheated to match the stack input temperature, whereas the ATR inlet air has a lower flow rate and requires heating to lower temperatures. These results highlight that the system effectively utilizes the sensible heat from the cathodic air outlet to preheat incoming air streams, reducing the need for additional heating.
The thermal management strategy developed in this work is based on a simplified yet flexible system architecture that minimizes the number of components while enabling effective preheating of the inlet streams without requiring additional external heating sources. The optimized arrangement of heat exchangers was designed to follow the thermal profile of the streams to be heated: cathodic air, which requires the highest temperature, is preheated first; this is followed by the air feeding the ATR, which operates at intermediate temperatures and is further heated by partial fuel combustion; finally, the remaining low-temperature heat is recovered for potential cogeneration purposes. This thermal gradient-driven configuration allows for efficient energy recovery at each stage while leaving a portion of residual thermal energy available for secondary uses, such as gas-to-air or gas-to-water heating for common utility applications. Compared to more complex SOFC thermal recovery architectures found in the literature, the proposed design relies on low-cost elements such as bypasses, flow-splitting devices, and a recirculation loop. As stated by Zhou et al. [27], the flexibility of a system could introduce an increase in difficulty in the power plant distributed control and produce controller instabilities. So, the strategy is to increase the freedom degree, increasing the bypass and flow splitting units, foreseeing an ATR instead of a reformer, causing recirculation, and increasing the air flow entering the system. These features increase the system’s degrees of freedom and enhance its adaptability under varying operating conditions and fuel compositions while avoiding the introduction of costly or sophisticated control systems. The overall system design thus represents a pragmatic trade-off between operational adaptability and implementation feasibility in real-world applications.

4.2.6. Overall Analysis

This section presents a comprehensive analysis of the overall SOFC-based system. It begins with an overall chemical balance, evaluating the distribution of the input chemical power across the three main components that utilize it: the autothermal reformer (ATR), the SOFC stack, and the burner. Subsequently, key performance indicators are provided, including electrical and thermal efficiencies, heat recovery rate, and emissions. These parameters allow for complete characterization of the system’s performance and provide insights into its conversion rates and environmental impact.
The overall chemical balance of the system can be expressed as the sum of the fuel consumption in the ATR, stack, and burner (Equation (12)).
P F U E L = P A T R + P S T A C K + P B U R N E R
The values for the chemical content at the input and across the different system blocks are reported in Table 14, which quantifies the contributions of the ATR, stack, and burner to the total input power. PFUEL represents the chemical input power of the fuel that is introduced in the system. At higher temperatures, reaction kinetics improve, influencing overall performance. As a result, operating at higher temperatures generally leads to higher electrical efficiency. This efficiency increase means that the required fuel flow rates for high-temperature operation, and thus the PFUEL values, are slightly lower compared to under low-temperature conditions. PATR is the portion of the input chemical power converted into sensible heat within the ATR to meet the specified inlet temperature requirements for the stack. Given that the incoming gas streams are already preheated before entering this component, the additional heat required to bridge the thermal gap is minimal.
As a result, PATR represents the smallest fraction of the total power input PFUEL, ranging from 0% to 4%. As mentioned earlier, the 0% value in the H2-LT case is due to the critical heat management in this scenario, which results in no chemical conversion in this block. PSTACK is related to the SOFC stack and accounts for the largest utilization of input power. The conversion fraction in the stack ranges from 85% to 95% of the total chemical energy input. Finally, PBURNER represents the chemical energy consumed in the burner during the complete combustion of residual fuel. Similarly to PATR, this contribution, ranging from 5 to 12%, accounts for a small fraction of the total input. The results from the overall chemical balance indicating that nearly all of the input chemical power is consumed in the component responsible for the primary useful effect, which is the generation of electrical power. Only minimal portions of the power, between 5% and 14%, are used to optimize the thermal regime of the system, indicating a good balance between the share of the different components.
Table 15 reports the key performance indicators of the system. The selected indicators include the system’s electrical (ηelectrical) and heat recovery rate (ηThermal). The electrical efficiency was calculated as the ratio between the electrical power generated by the SOFC stack and the chemical power of the fuel input to the system. The heat recovery rate of the system was determined as the ratio between the thermal power recovered by the QSENS heat exchanger and the chemical power of the input fuel, reported in Table 13 and Table 14, respectively. Additionally, the system utilization factor (UFF) is reported, calculated by comparing the fuel entering the system with the unconverted fuel reaching the burner. This choice reflects the fact that although the burner ensures complete fuel combustion, it does not contribute to any functional or technological enhancement of the system. The expression used to calculate the system’s UFF is provided in Equation (13):
S y s t e m   U F F = 1 m ˙ e q u i v a l e n t   H 2 _ F U E L B U R N m ˙ e q u i v a l e n t   H 2 _ F U E L
Finally, the amount of CO2 contained in the system exhaust stream is also reported, providing an estimate of the system’s emission levels.
The system exhibits electrical efficiencies (ηelectrical) ranging from 59% to 66%, showing values consistent with those reported by Oryshchyn et al. [25], slightly higher than values reported by Gandiglio et al. [34], Tjaden et al. [37], Cinti et al. [44], and Veluswamy et al. [47], and slightly lower than the value reported by Doherty et al. [38]. With regard to the heat recovery rate (ηThermal), the values are relatively consistent across all cases, averaging around 30%. These variations in efficiency are primarily due to changes in operating voltage, which influence the amount of heat produced relative to the electrical power generated. In all scenarios, the system’s fuel utilization factor (UFF) exceeds 90%, indicating a high level of fuel conversion. The overall UFF is governed by three main factors: fuel consumption in the ATR, where a portion of the fuel is combusted to raise the temperature of the stream entering the stack; fuel consumption in the SOFC stack, where the primary electrochemical conversion occurs; and the fraction of unconverted fuel that is recirculated back into the system. Regarding emissions, the amount of CO2 produced ranges from 1.19 to 1.76 kg/h, considering only the cases using carbonaceous fuels. In the pure hydrogen case, CO2 emissions are absent due to the carbon-free nature of the fuel.
Overall, the system demonstrates stable electrical and thermal performance across all analyzed cases, despite operating with different fuel compositions and SOFC technologies. While efficiency values exhibit slight variations, these are a natural consequence of changes in operating voltage and fuel utilization factor. Nonetheless, the system remains well balanced and operates within acceptable ranges for all key performance indicators under all tested conditions.

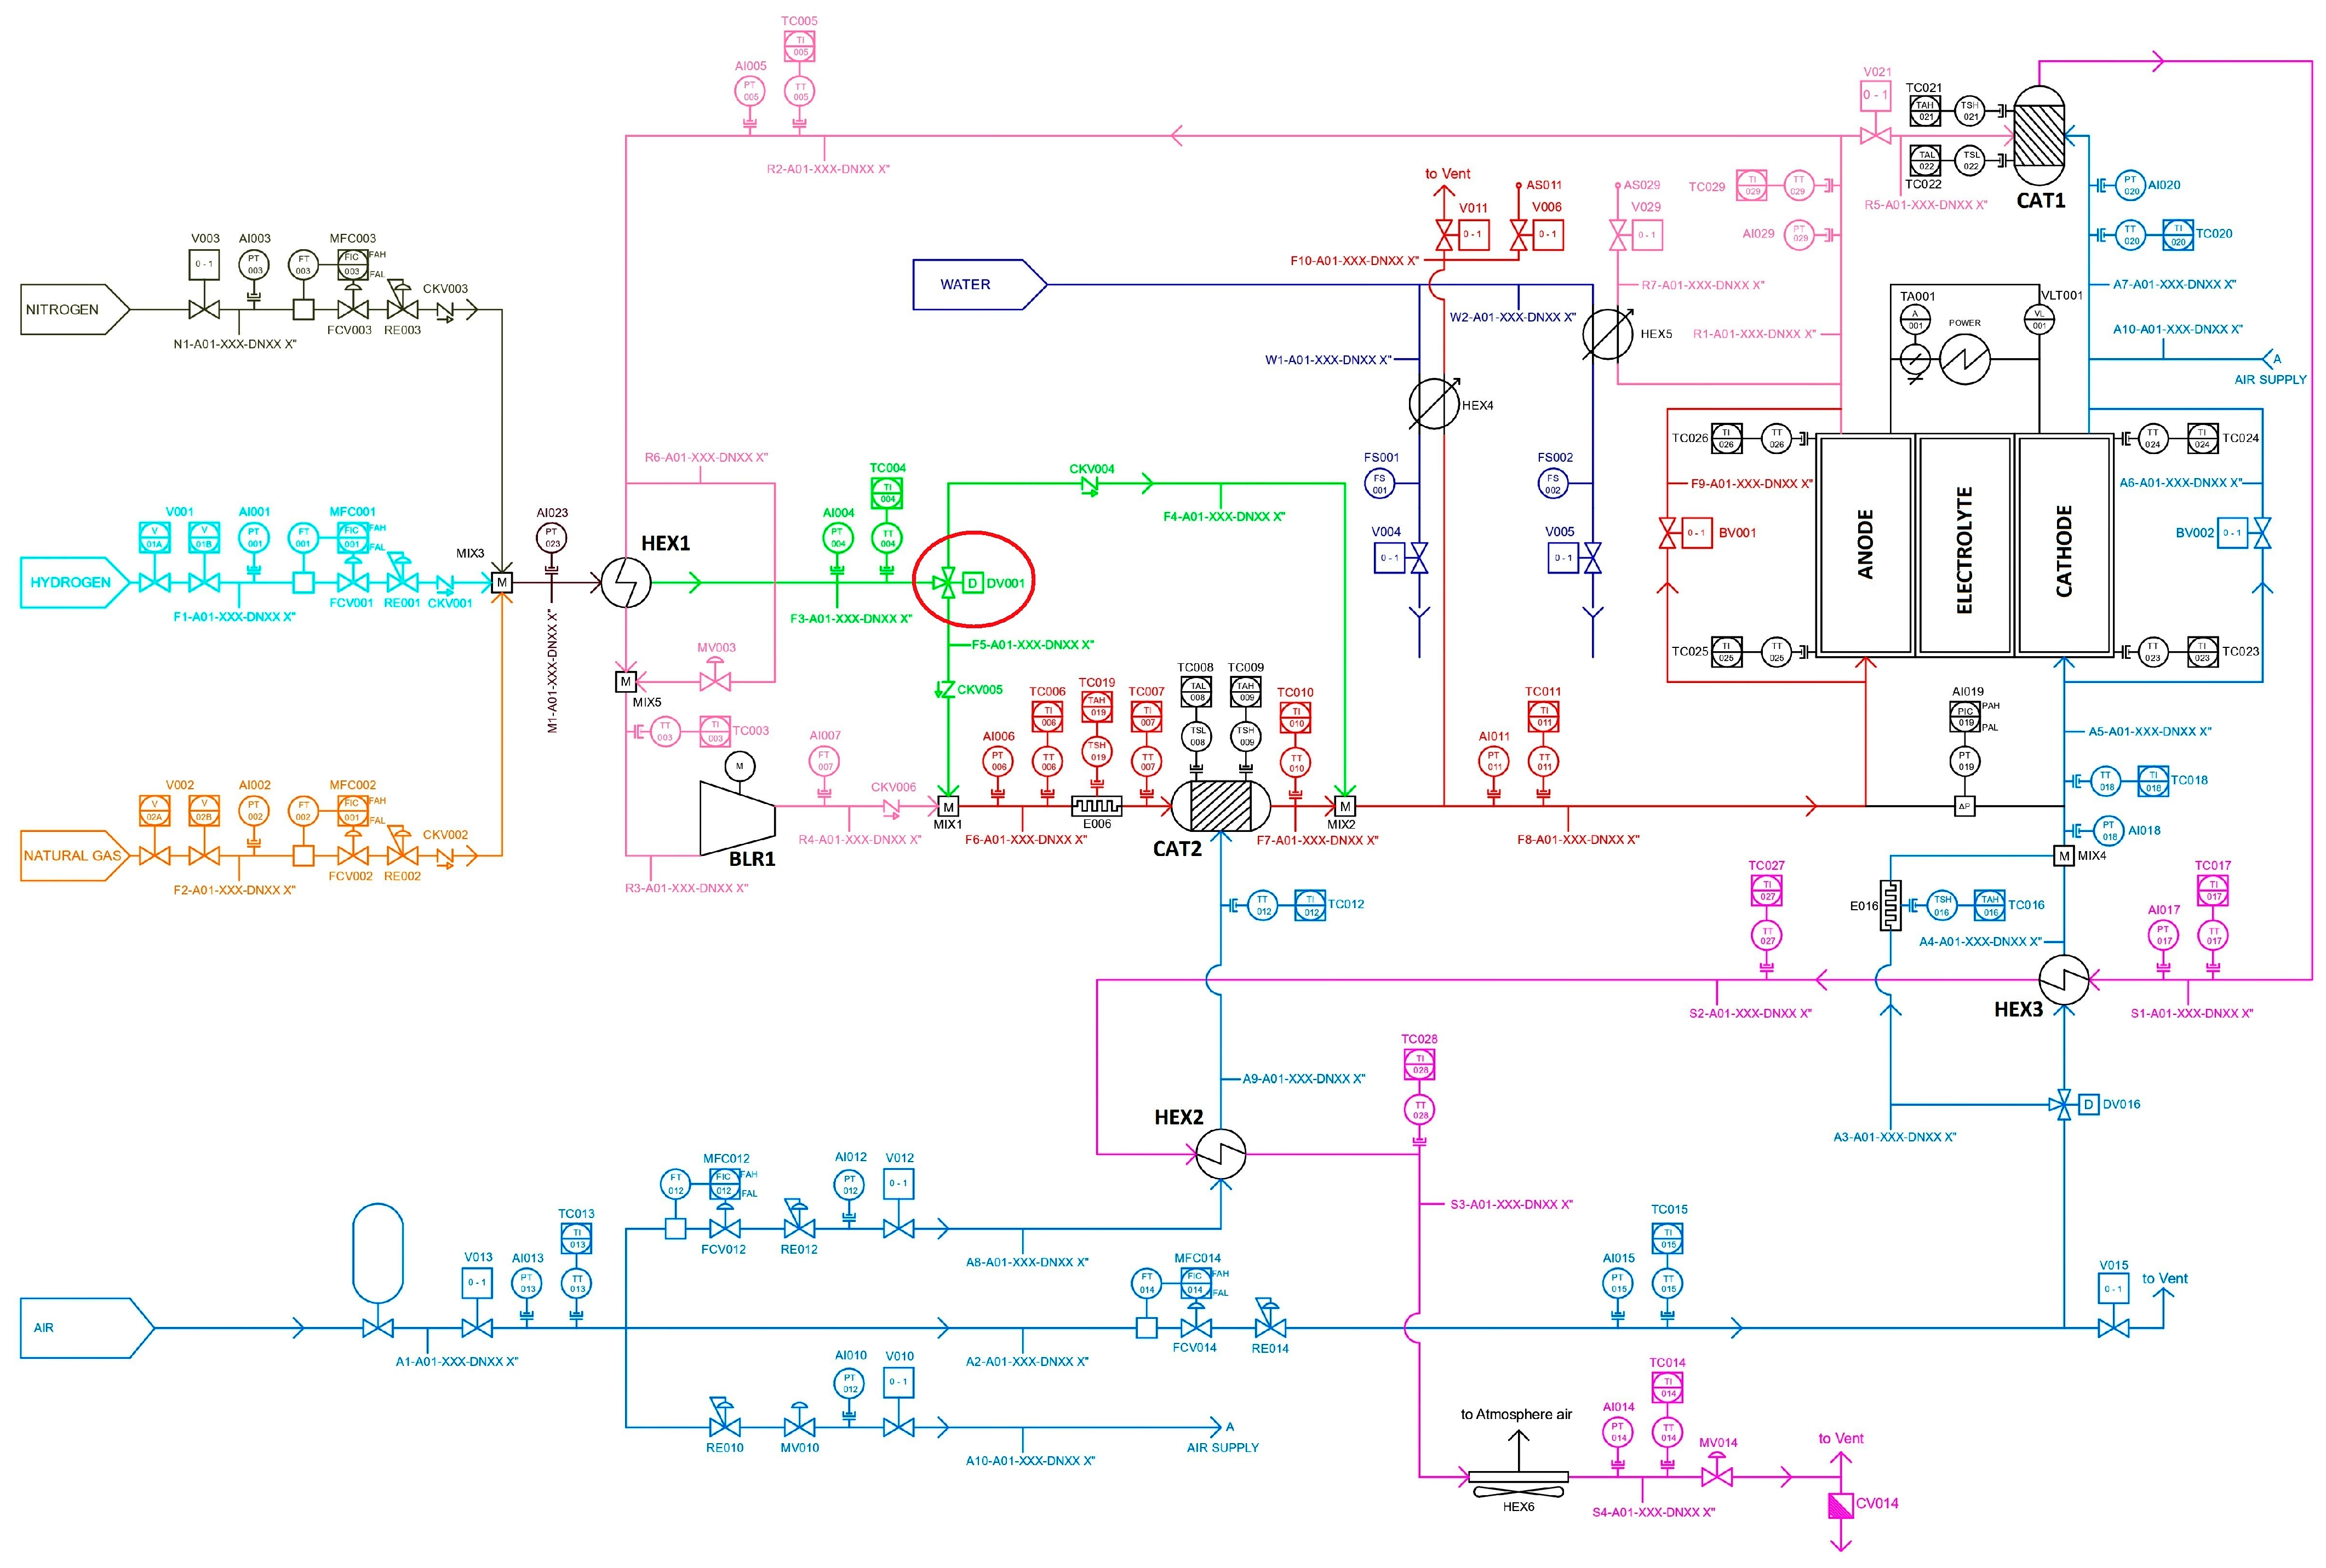
4.3. The PI&D of the Real System

Based on the analyses derived from Aspen Plus simulations, ICI Caldaie develop a P&ID of the real plant. The P&ID, shown in Figure 3, introduces several novelties compared to the existing literature on the topic. To control the system represented in the P&ID, the following parameters can be varied:
  • Fuel input: The amount of fuel entering the system and its composition can be varied to regulate the mixture at the SOFC anode inlet.
  • Fuel split between ATR and stack: The proportion of fuel directed to the ATR versus the fraction sent directly to the SOFC stack can be adjusted to manage the temperature gradient between the anode input and output.
  • Air supply to the ATR: The amount of air fed into the ATR can be regulated to control the pre-reforming process and the temperature increases before the anode inlet.
  • Anodic recirculation: The fraction of anode exhaust gas that is recirculated can be varied to regulate heat absorption by the anode flow relative to the cathode, to ensure compliance with the steam-to-carbon ratio, and to improve overall system efficiency by reducing the fuel sent to the burner.
  • Cathodic air management: The total amount of air supplied to the cathode can be adjusted, including the fraction bypassing the HEX3 heat exchanger. This is the main parameter used to control heat absorption within the stack.
  • Additional air input to the burner: The quantity of extra air entering the burner can be varied to regulate the maximum temperature rise inside the burner.
These control parameters ensure flexibility in system operation, allowing for optimization of thermal management and fuel utilization based on different input conditions. One of the most significant advancements concerns the preheating of the inlet fuel stream before entering the SOFC, which is necessary to prevent thermal shock. In the proposed configuration, the fuel undergoes initial partial preheating to the required temperature through heat recovery from the SOFC outlet stream. Subsequently, the splitting of the fuel between the autothermal reformer and the stream that directly reaches the stack allows us to control the thermal conditions required at the stack entrance, without any additional external heat source, and the increase in temperature inside the stack. This regulation is achieved through a three-way modulating valve (highlighted in red in Figure 3), which dynamically adjusts the fuel distribution between the ATR and the stack anode, enabling a broad range of operational flexibility without requiring modifications to the plant units.
Unlike the simulation flowsheet presented in Figure 1, the P&ID (Figure 3) incorporates multiple pipelines for the input fuel. Regarding the inlet air, the P&ID features a single air stream that is subsequently split to supply the ATR, stack, and burner. In contrast, the simulation model defines three separate inlet air flows for each component to simplify computational processing. Moreover, in the simulation, each inlet stream first passes through a compressor, raising the pressure slightly above atmospheric levels (1.07 bar). These compressors are not included in the P&ID, because it was assumed that the system will be fed with pre-compressed inlet streams. The fuel path downstream of the heat exchanger that preheats the fuel (HEXFUEL in Figure 1, HEX1 in Figure 3), passing through the ATR before reaching the stack inlet, remains the same in both the P&ID and the Aspen flowsheet. Notably, the three-way valve circled in red in Figure 3 of the P&ID corresponds to the SPLITFUEL component in the simulation, which handles the fuel distribution between recirculation and the burner. Additionally, the P&ID introduces an extra control for the cathodic inlet air via a bypass around HEX3.
By adjusting the amount of cold air bypassing this exchanger, the inlet temperature at the cathode can be regulated while maintaining a fixed heat exchange in HEX3. A further bypass system has been implemented in the P&ID for both anodic and cathodic input flows to address potential abnormal conditions that may require the temporary exclusion or replacement of the stack. Moreover, sampling points have been established at both the inlet and outlet of the anode compartment. Before discharge, the gas streams pass through gas-to-water heat exchangers to reduce their temperatures. Downstream of the stack, the anodic and cathodic flows follow the same path in both the P&ID and the simulation. After the burner, the heat recovery system in the P&ID is composed of the heat exchangers HEX3, HEX2, and HEX6 that correspond to HEAIRCAT, HEAIRATR, and QSENS, respectively, in Figure 1. For the sizing of the heat exchangers, a conservative approach was adopted by considering the most critical operating condition from the simulation results, namely the one in which achieving the required thermal exchange within the defined flow rate ranges was most demanding. In conclusion, the P&ID developed illustrates a simple and potentially low-cost system, given the few components required that enables operation across a wide range of parameters. It encompasses different fuel inputs and SOFC stack technologies that can operate at varying temperatures, offering enhanced flexibility through the dynamic adjustment of multiple control parameters.

5. Conclusions

This study presents the development and analysis of an innovative SOFC system characterized by high fuel utilization (above 90%), electrical efficiency ranging from 59% to 66%, and a heat recovery rate of approximately 30% across the six scenarios analyzed. The proposed system architecture is composed of an autothermal reformer (ATR), four heat exchangers, an SOFC stack, a burner, a blower, and multiple splitters/mixers and demonstrated strong performance in both energy efficiency and operational flexibility.
Key innovations include a heat recovery-based preheating strategy, a flexible fuel-splitting mechanism, recirculation, and strategic bypasses. These features contribute to increasing the system’s degrees of freedom, enabling dynamic control of critical operating parameters without the need for additional subsystems. The replacement of an external reformer with an ATR further enhances integration and system simplicity while playing a stabilizing role in system operation despite minimal fuel consumption.
The system showed stable electrical and thermal behavior across all tested fuel compositions and SOFC stack technologies. Minor variations in efficiency were attributed to expected changes in operating voltage and fuel utilization. Nevertheless, the system remained well balanced and within acceptable limits for all key performance indicators.
A detailed P&ID was developed based on the simulation results, incorporating the proposed innovations and demonstrating the system’s feasibility for real-world application. Future work will focus on the implementation of the real system and evaluation of its long-term operational stability

Author Contributions

Conceptualization, E.B. and C.T.; methodology, E.B., A.D., G.T. and V.M. software, G.T. and V.M.; validation, E.B., A.D., C.T., G.T., V.M. and F.S.; formal analysis, E.B., A.D., C.T., G.T. and V.M. investigation, E.B., A.D., C.T., G.T., V.M. and F.S.; data curation, E.B., A.D., G.T. and V.M. writing—original draft preparation, A.D., G.T. and V.M.; writing—review and editing, A.D. and G.T.; supervision, E.B. and A.D. project administration, E.B. funding acquisition, E.B. and C.T. All authors have read and agreed to the published version of the manuscript.

Funding

This research was funded by the European Commission, under the program H2020-EU.3.3.8.1.—Increase the electrical efficiency and the durability of the different fuel cells used for power production to levels which can compete with conventional technologies, while reducing costs, call H2020-JTI-FCH-2020-1 within the funding number 101006667 SO-FREE project.

Data Availability Statement

Data supporting reported results can be found in SO-FREE project web site (https://cordis.europa.eu/project/id/101006667/results) and in the related open source repository (Zenodo).

Acknowledgments

The authors would like to acknowledge all the SO-FREE project partners, especially Elcogen and IKTS for providing the SOFC stacks used in the experiments. The authors would also acknowledge the collaboration with the project GICO (grant number 101006656) which contributed to the advancement of this research.

Conflicts of Interest

The authors declare no conflicts of interest. The funders had no role in the design of the study; in the collection, analyses, or interpretation of data; in the writing of the manuscript; or in the decision to publish the results.

Abbreviations

The following abbreviations are used in this manuscript:
ATRAutothermal Reformer
DSDesign Specification
FCFuel Cells
GTGas Turbine
HTHigh Temperature
ICEInternal Combustion Engine
LHVLower Heating Value
LTLow Temperature
P&IDPiping and Instrumentation Diagram
R-WGSReverse Water–Gas Shift
SMRSteam Methane Reforming
SOFCSolid Oxide Fuel Cell
SR-SOFCExternal Steam Reforming SOFC
UFFFuel Utilization Factor
VopStack Operating Voltage
WGSWater–Gas Shift

References

  1. Johnsson, F.; Kjärstad, J.; Rootzén, J. The threat to climate change mitigation posed by the abundance of fossil fuels. Clim. Policy 2019, 19, 258–274. [Google Scholar] [CrossRef]
  2. Gaulin, N.; Le Billon, P. Climate change and fossil fuel production cuts: Assessing global supply-side constraints and policy implications. Clim. Policy 2020, 20, 888–901. [Google Scholar] [CrossRef]
  3. Rosen, M.A.; Koohi-Fayegh, S. The prospects for hydrogen as an energy carrier: An overview of hydrogen energy and hydrogen energy systems. Energy Ecol. Environ. 2016, 1, 10–29. [Google Scholar] [CrossRef]
  4. Kabeyi, M.J.B.; Olanrewaju, O.A. Biogas Production and Applications in the Sustainable Energy Transition. J. Energy 2022, 2022, 1–43. [Google Scholar] [CrossRef]
  5. Mishra, A.; Kumar, M.; Bolan, N.S.; Kapley, A.; Kumar, R.; Singh, L. Multidimensional approaches of biogas production and up-gradation: Opportunities and challenges. Bioresour. Technol. 2021, 338, 125514. [Google Scholar] [CrossRef] [PubMed]
  6. Balat, H.; Kirtay, E. Hydrogen from biomass—Present scenario and future prospects. Int. J. Hydrogen Energy 2010, 35, 7416–7426. [Google Scholar] [CrossRef]
  7. Wasajja, H.; Lindeboom, R.E.F.; van Lier, J.B.; Aravind, P.V. Techno-economic review of biogas cleaning technologies for small scale off-grid solid oxide fuel cell applications. Fuel Process. Technol. 2020, 197, 106215. [Google Scholar] [CrossRef]
  8. Sobrino, F.H.; Monroy, C.R.; Pérez, J.L.H. Critical analysis on hydrogen as an alternative to fossil fuels and biofuels for vehicles in Europe. Renew. Sustain. Energy Rev. 2010, 14, 772–780. [Google Scholar] [CrossRef]
  9. Su, B.; Han, W.; Zhang, X.; Chen, Y.; Wang, Z.; Jin, H. Assessment of a combined cooling, heating and power system by synthetic use of biogas and solar energy. Appl. Energy 2018, 229, 922–935. [Google Scholar] [CrossRef]
  10. Moradi, R.; Marcantonio, V.; Cioccolanti, L.; Bocci, E. Integrating biomass gasification with a steam-injected micro gas turbine and an Organic Rankine Cycle unit for combined heat and power production. Energy Convers. Manag. 2020, 205, 112464. [Google Scholar] [CrossRef]
  11. Saadabadi, S.A.; Thallam Thattai, A.; Fan, L.; Lindeboom, R.E.F.; Spanjers, H.; Aravind, P.V. Solid Oxide Fuel Cells fuelled with biogas: Potential and constraints. Renew. Energy 2019, 134, 194–214. [Google Scholar] [CrossRef]
  12. Marcantonio, V.; Monarca, D.; Villarini, M.; Di Carlo, A.; Del Zotto, L.; Bocci, E. Biomass Steam Gasification, High-Temperature Gas Cleaning, and SOFC Model: A Parametric Analysis. Energies 2020, 13, 5936. [Google Scholar] [CrossRef]
  13. Marcantonio, V.; Del Zotto, L.; Ouweltjes, J.P.; Bocci, E. Main issues of the impact of tar, H2S, HCl and alkali metal from biomass-gasification derived syngas on the SOFC anode and the related gas cleaning technologies for feeding a SOFC system: A review. Int. J. Hydrogen Energy 2022, 47, 517–539. [Google Scholar] [CrossRef]
  14. Kobayashi, Y.; Ando, Y.; Kishizawa, H.; Tomida, K.; Matake, N. Recent Progress of SOFC-GT Combined System with Tubular Type Cell Stack at MHI. ECS Trans. 2013, 51, 79–86. [Google Scholar] [CrossRef]
  15. Yoshida, H.; Seyama, T.; Sobue, T.; Yamashita, S. Development of Residential SOFC CHP System with Flatten Tubular Segmented-In-Series Cells Stack. ECS Trans. 2011, 35, 97–103. [Google Scholar] [CrossRef]
  16. Jiang, J.; Li, X.; Li, J. Modeling and Model-based Analysis of a Solid Oxide Fuel Cell Thermal-Electrical Management System with an Air Bypass Valve. Electrochim. Acta 2015, 177, 250–263. [Google Scholar] [CrossRef]
  17. Jiang, J.; Shen, T.; Deng, Z.; Fu, X.; Li, J.; Li, X. High efficiency thermoelectric cooperative control of a stand-alone solid oxide fuel cell system with an air bypass valve. Energy 2018, 152, 13–26. [Google Scholar] [CrossRef]
  18. Papurello, D.; Iafrate, C.; Lanzini, A.; Santarelli, M. Trace compounds impact on SOFC performance: Experimental and modelling approach. Appl. Energy 2017, 208, 637–654. [Google Scholar] [CrossRef]
  19. Jiang, J.; Li, X.; Deng, Z.; Yang, J.; Zhang, Y.; Li, J. Control-oriented dynamic model optimization of steam reformer with an improved optimization algorithm. Int. J. Hydrogen Energy 2013, 38, 11288–11302. [Google Scholar] [CrossRef]
  20. Vrečko, D.; Nerat, M.; Vrančić, D.; Dolanc, G.; Dolenc, B.; Pregelj, B.; Meyer, F.; Siu, F.A.; Makkus, R.; Juričić, Đ. Feedforward-feedback control of a solid oxide fuel cell power system. Int. J. Hydrogen Energy 2018, 43, 6352–6363. [Google Scholar] [CrossRef]
  21. Sorce, A.; Greco, A.; Magistri, L.; Costamagna, P. FDI oriented modeling of an experimental SOFC system, model validation and simulation of faulty states. Appl. Energy 2014, 136, 894–908. [Google Scholar] [CrossRef]
  22. Jiang, J.; Li, X.; Deng, Z.; Yang, J.; Zhang, Y.; Li, J. Thermal management of an independent steam reformer for a solid oxide fuel cell with constrained generalized predictive control. Int. J. Hydrogen Energy 2012, 37, 12317–12331. [Google Scholar] [CrossRef]
  23. Joneydi Shariatzadeh, O.; Refahi, A.H.; Rahmani, M.; Abolhassani, S.S. Economic optimisation and thermodynamic modelling of SOFC tri-generation system fed by biogas. Energy Convers. Manag. 2015, 105, 772–781. [Google Scholar] [CrossRef]
  24. Barelli, L.; Bidini, G.; Ottaviano, A. Part load operation of a SOFC/GT hybrid system: Dynamic analysis. Appl. Energy 2013, 110, 173–189. [Google Scholar] [CrossRef]
  25. Oryshchyn, D.; Harun, N.F.; Tucker, D.; Bryden, K.M.; Shadle, L. Fuel utilization effects on system efficiency in solid oxide fuel cell gas turbine hybrid systems. Appl. Energy 2018, 228, 1953–1965. [Google Scholar] [CrossRef]
  26. Harun, N.F.; Tucker, D.; Adams, T.A. Technical challenges in operating an SOFC in fuel flexible gas turbine hybrid systems: Coupling effects of cathode air mass flow. Appl. Energy 2017, 190, 852–867. [Google Scholar] [CrossRef]
  27. Zhou, N.; Zaccaria, V.; Tucker, D. Fuel composition effect on cathode airflow control in fuel cell gas turbine hybrid systems. J. Power Sources 2018, 384, 223–231. [Google Scholar] [CrossRef]
  28. Cuneo, A.; Zaccaria, V.; Tucker, D.; Source, A. Gas turbine size optimization in a hybrid system considering SOFC degradation. Appl. Energy 2018, 230, 855–864. [Google Scholar] [CrossRef]
  29. Chen, J.; Li, J.; Zhou, D.; Zhang, H.; Weng, S. Control strategy design for a SOFC-GT hybrid system equipped with anode and cathode recirculation ejectors. Appl. Therm. Eng. 2018, 132, 67–79. [Google Scholar] [CrossRef]
  30. Zaccaria, V.; Tucker, D.; Traverso, A. Transfer function development for SOFC/GT hybrid systems control using cold air bypass. Appl. Energy 2016, 165, 695–706. [Google Scholar] [CrossRef]
  31. Azizi, M.A.; Brouwer, J. Progress in solid oxide fuel cell-gas turbine hybrid power systems: System design and analysis, transient operation, controls and optimization. Appl. Energy 2018, 215, 237–289. [Google Scholar] [CrossRef]
  32. Rokni, M. Addressing fuel recycling in solid oxide fuel cell systems fed by alternative fuels. Energy 2017, 137, 1013–1025. [Google Scholar] [CrossRef]
  33. Papurello, D.; Borchiellini, R.; Bareschino, P.; Chiodo, V.; Freni, S.; Lanzini, A.; Pepe, F.; Ortigoza, G.A.; Santarelli, M. Performance of a Solid Oxide Fuel Cell short-stack with biogas feeding. Appl. Energy 2014, 125, 254–263. [Google Scholar] [CrossRef]
  34. Gandiglio, M.; Lanzini, A.; Santarelli, M.; Acri, M.; Hakala, T.; Rautanen, M. Results from an industrial size biogas-fed SOFC plant (the DEMOSOFC project). Int. J. Hydrogen Energy 2020, 45, 5449–5464. [Google Scholar] [CrossRef]
  35. Cozzolino, R.; Lombardi, L.; Tribioli, L. Use of biogas from biowaste in a solid oxide fuel cell stack: Application to an off-grid power plant. Renew. Energy 2017, 111, 781–791. [Google Scholar] [CrossRef]
  36. D’Andrea, G.; Gandiglio, M.; Lanzini, A.; Santarelli, M. Dynamic model with experimental validation of a biogas-fed SOFC plant. Energy Convers. Manag. 2017, 135, 21–34. [Google Scholar] [CrossRef]
  37. Tjaden, B.; Gandiglio, M.; Lanzini, A.; Santarelli, M.; Järvinen, M. Small scale biogas-SOFC plant: Technical analysis and assessment of the European potential. Energy Fuels 2014, 28, 4216–4232. [Google Scholar] [CrossRef]
  38. Doherty, W.; Reynolds, A.; Kennedy, D. Modelling and Simulation of a Biomass Gasification-Solid Oxide Fuel Cell Combined Heat and Power Plant Using Aspen Plus; Technical Report; Technological University Dublin: Dublin, Ireland, 2009. [Google Scholar]
  39. Leone, P.; Lanzini, A.; Santarelli, M.; Calì, M.; Sagnelli, F.; Boulanger, A.; Scaletta, A.; Zitella, P. Methane-free biogas for direct feeding of solid oxide fuel cells. J. Power Sources 2010, 195, 239–248. [Google Scholar] [CrossRef]
  40. La Licata, B.; Sagnelli, F.; Boulanger, A.; Lanzini, A.; Leone, P.; Zitella, P.; Santarelli, M. Bio-hydrogen production from organic wastes in a pilot plant reactor and its use in a SOFC. Int. J. Hydrogen Energy 2011, 36, 7861–7865. [Google Scholar] [CrossRef]
  41. Laycock, C.J.; Panagi, K.; Reed, J.P.; Guwy, A.J. The importance of fuel variability on the performance of solid oxide cells operating on H2/CO2 mixtures from biohydrogen processes. Int. J. Hydrogen Energy 2018, 43, 8972–8982. [Google Scholar] [CrossRef]
  42. Chen, Z.; Bian, L.; Wang, L.; Chen, N.; Zhao, H.; Li, F.; Chou, K.C. Effect of hydrogen and carbon dioxide on the performance of methane fueled solid oxide fuel cell. Int. J. Hydrogen Energy 2016, 41, 7453–7463. [Google Scholar] [CrossRef]
  43. Nikooyeh, K.; Clemmer, R.; Alzate-Restrepo, V. Hill JM. Effect of hydrogen on carbon formation on Ni/YSZ composites exposed to methane. Appl. Catal. A Gen. 2008, 347, 106–111. [Google Scholar] [CrossRef]
  44. Cinti, G.; Bidini, G.; Hemmes, K. Comparison of the solid oxide fuel cell system for micro CHP using natural gas with a system using a mixture of natural gas and hydrogen. Appl. Energy 2019, 238, 69–77. [Google Scholar] [CrossRef]
  45. Almutairi, G.; Dhir, A.; Bujalski, W. Direct Operation of IP-Solid Oxide Fuel Cell with Hydrogen and Methane Fuel Mixtures under Current Load Cycle Operating Condition. Fuel Cells 2014, 14, 231–238. [Google Scholar] [CrossRef]
  46. Panagi, K.; Laycock, C.J.; Reed, J.P.; Guwy, A.J. Highly efficient coproduction of electrical power and synthesis gas from biohythane using solid oxide fuel cell technology. Appl. Energy 2019, 255, 113854. [Google Scholar] [CrossRef]
  47. Veluswamy, G.K.; Laycock, C.J.; Shah, K.; Ball, A.S.; Guwy, A.J.; Dinsdale, R.M. Biohythane as an energy feedstock for solid oxide fuel cells. Int. J. Hydrogen Energy 2019, 44, 27896–27906. [Google Scholar] [CrossRef]
  48. Zhang, W.; Croiset, E.; Douglas, P.L.; Fowler, M.W.; Entchev, E. Simulation of a tubular solid oxide fuel cell stack using AspenPlusTM unit operation models. Energy Convers. Manag. 2005, 46, 181–196. [Google Scholar] [CrossRef]
  49. Pianko-Oprych, P.; Palus, M. Simulation of SOFCs based power generation system using Aspen. Pol. J. Chem. Technol. 2017, 19, 8–15. [Google Scholar] [CrossRef]
  50. Di Carlo, A.; Bocci, E.; Naso, V. Process simulation of a SOFC and double bubbling fluidized bed gasifier power plant. Int. J. Hydrogen Energy 2013, 38, 532–542. [Google Scholar] [CrossRef]
  51. Marcantonio, V.; Bocci, E.; Ouweltjes, J.P.; Del Zotto, L.; Monarca, D. Evaluation of sorbents for high temperature removal of tars, hydrogen sulphide, hydrogen chloride and ammonia from biomass-derived syngas by using Aspen Plus. Int. J. Hydrogen Energy 2020, 45, 6651–6662. [Google Scholar] [CrossRef]
  52. Sadhukhan, J.; Zhao, Y.; Leach, M.; Brandon, N.P.; Shah, N. Energy integration and analysis of solid oxide fuel cell based microcombined heat and power systems and other renewable systems using biomass waste derived syngas. Ind. Eng. Chem. Res. 2010, 49, 11506–11516. [Google Scholar] [CrossRef]
  53. Rudra, S.; Kim, H.T. A simulation study of Solid oxide fuel cell (SOFC) for IGFC power generation using Aspen Plus. J. Energy Clim. Change 2010, 5, 24–35. [Google Scholar]
  54. Ameri, M.; Mohammadi, R. Simulation of an atmospheric SOFC and gas turbine hybrid system using Aspen Plus software. Int. J. Energy Res. 2013, 37, 412–425. [Google Scholar] [CrossRef]
  55. Wendel, C.H.; Kazempoor, P.; Braun, R.J. A thermodynamic approach for selecting operating conditions in the design of reversible solid oxide cell energy systems. J. Power Sources 2016, 301, 93–104. [Google Scholar] [CrossRef]
  56. Calise, F.; Palombo, A.; Vanoli, L. Design and partial load exergy analysis of hybrid SOFC–GT power plant. J. Power Sources 2006, 158, 225–244. [Google Scholar] [CrossRef]
  57. Blum, L.; Packbier, U.; Vinke, I.C.; de Haart, L.G.J. Long-Term Testing of SOFC Stacks at Forschungszentrum Jülich. Fuel Cells 2013, 13, 646–653. [Google Scholar] [CrossRef]
Figure 1. The flowsheet of the Aspen simulation of the SO-FREE system.
Energies 18 02273 g001
Figure 2. Anodic-to-cathodic heat power ratio vs. anodic-to-cathodic mass ratio for 20 experiments.
Energies 18 02273 g002
Figure 3. PI&D of SOFC system.
Energies 18 02273 g003
Table 1. Description of Aspen Plus flowsheet unit operations presented in Figure 1.
ASPEN Plus NameBlock
ID
Description
COMPRCOMPFUELCompressor—increases the pressure of the fuel inlet stream up to 1.07 bar
COMPCATCompressor—increases the pressure of the cathode air inlet stream up to 1.07 bar
COMPAIRCompressor—increases the pressure of the ATR air inlet stream up to 1.07 bar
COMPBURNCompressor—increases the pressure of the additional air inlet stream up to 1.07 bar
BLOWERCompressor—compensates for the pressure drop related to RECYCLE stream, restoring the pressure of the system (1.07 bar)
FSPLITSPLITFUESplitter—splits the fuel inlet stream into the stream FUELPATR and the stream FUELPHAN
SPLITANSplitter—splits the stream out of the anode into two sub-streams, one led to the afterburner (FUELBURN) and the other led to the recirculation part of the system (RECHOT)
MIXERMIXERMixer—combines the incoming fuel stream directed to the ATR (FUELPATR) with the recirculated stream from the blower (RECPRESS)
MIXFUELMixer—combines the ATR output (FUELREF) with the portion of fuel that is sent directly to the SOFC stack (FUELPHAN)
HEATERAN-HEATHeat Exchanger—it is a fictious exchanger that heats the temperature of the stream ANOUT in order to consider anode outlet temperature increase owing to SOFC exothermic reactions
CAT-HEATHeat Exchanger—it is a fictious exchanger that heats the CATOUT stream in order to consider cathode outlet temperature increase owing to SOFC exothermic reactions
QSENSHeat Exchanger—simulates the residual energy available downstream of preheating the system’s inlet air streams, which can be recovered for low-temperature cogeneration
HEATXHEXFUELHeat Exchanger—used to heat up the inlet fuel stream and to cool down the recycle stream before compression—heats the feed FUELPRES by means of the heat contained in the stream RECHOT
HEAIRATRHeat Exchanger—used to heat up the air sent to the ATR—heats the inlet stream of air AIRREFPR by means of the heat contained in the exhausted stream BURNEDMT
HEAIRCATHeat Exchanger—used to heat up the air sent to the cathode—heats the inlet stream of air AIRCATPR using the stream from the afterburner BURNEDHT
RGIBBSATRRGibbs reactor—simulates the autothermal reformer reactor.
ANODERGibbs reactor—simulates the SOFC anode
RSTOICBURNERRStoic reactor—simulates the burner downstream of the SOFC stack
SEPARATORCATHSeparator—simulates the SOFC cathode and splits the inlet stream AIRCATH into oxygen O2SUPP sent to the ANODE and cathode exhaust gas CATOUT
Table 2. Reactions imposed to ATR and SOFC stack anode.
NumberReactionDescription
R1CH4 + H2O → 3H2 + COSteam Methane Reforming
R2CO + H2O → H2 + CO2Water–Gas Shift
R3CH4 + 3/2 O2 → CO + 2H2OCH4 Partial Combustion
R4CH4 + 2 O2 → CO2 + 2H2OCH4 Full Combustion
R5CO + 1/2 O2 → CO2CO Combustion
R6H2 + 1/2O2 → H2OH2 Combustion
Table 3. Output composition [vol%] comparison: 67% H2 and 33% CH4 input.
67% H2 and 33% CH4—Input = 4.24 × 10⁻³ mol/s
INPUTEXP_OUTSIM_OUTΔ (EXP-SIM)
CH415.70%0.50%0%0.50%
CO1.70%2.87%3.30%−0.43%
CO29.50%17.34%17.20%0.14%
H233.80%14.10%15.43%−1.33%
H2O39.10%65.18%64.07%1.11%
T [°C]7638178170
Table 4. Output composition [vol%] comparison: 100% CH4 input.
100% CH4—Input = 2.45 × 10⁻³ mol/s
INPUTEXP_OUTSIM_OUTΔ (EXP-SIM)
CH48.00%0.83%0%0.83%
CO3.20%2.81%3.62%−0.81%
CO228.00%30.80%30.26%0.54%
H221.60%6.37%8.65%−2.28%
H2O38.90%59.19%57.47%1.72%
T [°C]7678148140
Table 5. Output composition [vol%] comparison: 100% H2 input.
100% H2—Input = 4.25 × 10⁻³ mol/s
INPUTEXP_OUTSIM_OUTΔ (EXP-SIM)
H257.50%14.70%14.10%0.60%
H2O42.50%85.30%85.90%−0.60%
T [°C]7588198190
Table 6. System inputs: fuel and air flows.
System InputsHTLT
CH4-H2CH4H2CH4-H2CH4H2
Input Fuel [kg/h]0.490.570.220.580.640.28
Input Fuel [kmol/h]0.050.040.110.060.040.14
H2 [%mol]50%0%100%50%0%100%
CH4 [%mol]50%100%0%50%100%0%
Input air ATR [kmol/h]0.0130.0330.0050.0240.0280
Input air Cathode [kmol/h]1.321.321.401.611.581.69
Table 7. Key parameters of HEXFUEL and blower operation.
HTLT
CH4-H2CH4H2CH4-H2CH4H2
Recirculation Rate70%70%80%70%70%80%
Input Fuel [kg/h]0.490.570.220.580.640.28
T In Fuel [°C]323233323228
T Out Fuel [°C]753730767663655714
Recirculation [kg/h]6.417.907.928.108.359.61
T In Rec [°C]768745782678670729
T Out Rec [°C]625638652559572603
Table 8. Portion of fuel sent to ATR and directly to stack.
HTLT
CH4-H2CH4CH4-H2CH4
ATR Fuel [kg/h]0.050.170.170.19
Bypass Fuel [kg/h]0.440.40.410.45
ATR Fuel [%]10.20%29.82%29.31%29.69%
Bypass Fuel [%]89.80%70.18%70.69%70.31%
Table 9. Autothermal reformer main data.
HTLT
CH4-H2CH4H2CH4-H2CH4H2
ATR Air Input [kg/h]0.380.940.160.690.800
ATR Fuel Input [kg/h]6.468.077.968.288.559.67
ATR Output [kg/h]6.849.018.128.979.349.67
TATR AIR INPUT [°C]259236232248243-
TATR FUEL INPUT [°C]635650664572584615
TATR FUEL OUTPUT [°C]689696690591593615
LHV(MIXEDFUEL) [kW]2.594.313.644.835.103.99
LHV(FUELREF) [kW]2.363.973.484.644.943.99
O2/O2-Stoich14%19%4%13%14%0%
Table 10. Autothermal reformer input and output fuel composition.
HTLT
CH4-H2CH4H2CH4-H2CH4H2
ATR Fuel Input [kmol/h]0.28060.32030.48040.36280.34350.5898
H28.6%6.5%11.3%9.9%8.4%10.1%
H2O59.4%45.4%85.1%54.7%46.0%89.9%
CO1.6%2.1%0.0%1.0%1.7%0.0%
CO220.8%23.9%0.0%19.7%25.5%0.0%
CH41.0%3.3%0.0%2.7%3.5%0.0%
N28.6%18.8%3.6%12.1%14.8%0.0%
ATR Fuel Output [kmol/h]0.29630.36740.48470.40070.38890.5898
H29.5%11.6%10.7%14.7%14.9%10.1%
H2O56.7%39.5%84.8%48.4%39.3%89.9%
CO2.0%3.8%0.0%2.0%3.2%0.0%
CO220.1%21.7%0.0%19.0%23.9%0.0%
CH40.0%0.0%0.0%0.0%0.1%0.0%
N211.6%23.4%4.5%15.7%18.7%0.0%
Table 11. Temperatures, flow rates, and compositions at anode and cathode inlet and outlet.
HTLT
CH4-H2CH4H2CH4-H2CH4H2
Stack UF76%75%71%76%73%80%
TINPUT ANODE [°C]700700700600600627
TOUTPUT ANODE [°C]768745782678670729
TINPUT CATHODE [°C]700700700586598590
TOUTPUT CATHODE [°C]815784810701696726
Anode Fuel Input [kg/h]7.289.418.309.379.799.89
Anode Fuel Input [kmol/h]0.39310.44220.57420.49080.47360.6955
H2 [% mol]15.2%10.8%24.6%18.3%13.9%23.7%
H2O [% mol]48.7%37.0%71.6%43.6%36.6%76.3%
CO [% mol]1.7%3.6%0.0%1.8%3.0%0.0%
CO2 [% mol]17.3%20.3%0.0%17.1%22.2%0.0%
CH4 [% mol]7.0%6.4%0.0%5.1%6.8%0.0%
N2 [% mol]10.0%21.9%3.8%14.1%17.5%0.0%
Anode Fuel Output [kg/h]9.1611.289.9011.5811.9312.01
Anode Fuel Output [kmol/h]0.39310.44220.57420.44550.41690.6955
H2 [% mol]7.8%6.7%7.2%7.6%8.8%4.7%
H2O [% mol]60.5%47.0%89.0%57.7%47.7%95.3%
CO [% mol]1.7%2.2%0.0%1.0%1.8%0.0%
CO2 [% mol]21.2%24.7%0.0%20.8%26.4%0.0%
CH4 [% mol]0.0%0.0%0.0%0.0%0.0%0.0%
N2 [% mol]8.8%19.4%3.8%12.8%15.4%0.0%
Cathode Air Input [kmol/h]1.32171.32171.39501.61411.57781.6915
Cathode Air Output [kmol/h]1.26281.26321.34511.54521.51091.6252
Air-to-Fuel Ratio [%]3.362.992.433.293.332.43
Table 12. Stack power flows.
HTLT
CH4-H2CH4H2CH4-H2CH4H2
PTOT STACK6.79 6.77 6.71 8.25 7.73 8.91
Stack current [A]35 35 30 31 30 30
Stack voltage [V]135 149 153 186 186 186
Pelectrical [kW]4.74 5.21 4.55 5.76 5.59 5.54
Pthermal [kW]2.08 1.57 2.32 2.53 2.14 3.74
Pelectrical/PTOT STACK [%]69%77%66%69%72%60%
Pthermal/PTOT STACK [%]31%23%34%31%28%40%
Panode/PTOT STACK [%]5%3%8%5%5%11%
Pcathode/PTOT STACK [%]20%14%20%19%17%22%
Pthermal-losses/PTOT [%]6%5%6%6%5%8%
Panode/Pthermal [%]15%15%23%17%18%27%
Pcathode/Pthermal [%]64%62%59%64%63%53%
Pthermal-losses/Pthermal [%]21%23%18%19%20%20%
Table 13. Powers flows at burner and heat recovery system.
HTLT
CH4-H2CH4H2CH4-H2CH4H2
HAIR BURNER INPUT [kW]9.268.879.809.539.2410.43
HFUEL BURNER INPUT [kW]1.041.120.981.111.061.11
LHV FUEL BURNER INPUT [kW]0.780.830.560.871.040.44
HBURNER OUTPUT [kW]11.0810.8211.3411.5111.3411.98
QHEAIRCAT [kW]7.607.687.857.547.607.73
QHEAIRCAT/HBURNER OUTPUT69%71%69%66%67%65%
QHEAIRATR [kW]0.040.060.020.040.060
QHEAIRATR/HBURNER OUTPUT0.36%0.55%0.18%0.35%0.53%0.00%
QSENS [kW]2.472.212.302.872.772.91
QSENS/HBURNER OUTPUT22%20%20%25%24%24%
Table 14. Chemical power balance: input, ATR, stack, and burner.
HTLT
CH4-H2CH4H2CH4-H2CH4H2
P F U E L [kW]7.807.947.439.318.939.35
P A T R [kW]0.230.340.150.180.160.00
P S T A C K [kW]6.796.776.718.257.738.91
P B U R N E R [kW]0.780.830.560.871.040.44
%ATR/FUEL3%4%2%2%2%0%
%SOFC/FUEL87%85%90%89%87%95%
%BURNER/FUEL10%10%7%9%12%5%
Table 15. System key performance indicators.
HTLT
CH4-H2CH4H2CH4-H2CH4H2
System ηelectrical61%66%61%62%63%59%
System ηThermal32%28%31%31%31%31%
Total System η92%93%92%93%94%90%
System UFF92%92%93%92%91%95%
Emissions [kg/h]CO21.191.570.001.411.760.00
Disclaimer/Publisher’s Note: The statements, opinions and data contained in all publications are solely those of the individual author(s) and contributor(s) and not of MDPI and/or the editor(s). MDPI and/or the editor(s) disclaim responsibility for any injury to people or property resulting from any ideas, methods, instructions or products referred to in the content.

