1. Introduction
One of the key challenges in integrating renewable energy sources into power systems is hosting capacity, which refers to the amount of a specific technology that can be integrated into a power distribution network without violating the operational constraints. The authors in [
1] discussed the historical development of this concept and the methods used for its assessment. Initially, hosting capacity was defined exclusively for distributed energy resources (DERs), and it is still discussed predominantly in the context of photovoltaic (PV) systems. However, its relevance has expanded to include other low-carbon technologies, such as electric vehicles and heat pumps [
2,
3,
4,
5].
Hosting capacity can be understood as the number of units of a specific technology that a network can support. This capacity depends on various factors, including the location and size of the devices within the network. To account for uncertainties in placement, generation, and consumption, researchers such as Navarro-Espinosa introduced the Monte Carlo method, enabling a probabilistic assessment of hosting capacity [
1]. This method improves the accuracy of the evaluation by simulating a wide range of possible scenarios.
Traditionally, network operators have relied on simplified rules to estimate hosting capacity. One common heuristic limits the installed capacity of DERs to 15% of a transformer’s nominal power [
6]. However, such rules often lead to inaccurate estimates, either underestimating or overestimating the actual hosting capacity [
7]. While power flow simulations yield more accurate results, they can be computationally demanding and require detailed network models, which limits their practicality for large-scale or real-time applications.
Although the network may have sufficient hosting capacity, connection requests for devices such as PV systems may still be denied [
6]. The main barrier to integrating new devices is the operational constraints, which include mainly voltage limitations at consumer nodes and thermal overloads of power lines. The authors in [
8] noted that, with the increasing installed capacity of PV systems in the grid, voltage level violations are the first to appear, followed by overheating of power lines, which, later, becomes the dominant issue. A study [
9] provided a detailed analysis, revealing that voltage amplitude is the primary limiting factor in rural networks, where a weak grid infrastructure leads to voltage fluctuations, whereas, in urban networks, thermal constraints due to a high load density pose the dominant challenge. This highlights the need for more localised and data-driven analyses of the hosting capacity.
Efforts to improve the hosting capacity in networks with high PV penetration focus on mitigating technical issues such as overvoltage, reverse power flows, thermal overloading, and declining power quality, which often necessitate curtailment of the PV output. Addressing these challenges typically requires grid reinforcement, which can be both technically complex and financially demanding. As noted by [
10], the current structure of the electrical network is the result of historical investments and accumulated technical expertise developed over the course of the past century.
To mitigate excess generation, some researchers propose active power curtailment [
11]; however, this approach involves the intentional reduction in available renewable energy, resulting in suboptimal utilisation of the generated power [
12].
DERs operate typically at a unity power factor, and the distributors usually do not impose additional operational requirements. Research shows that operating DERs with reactive power absorption can reduce voltage levels at individual consumer nodes. This effect is most pronounced at low DER penetration levels, where it can address localised overvoltage. However, at higher levels of integration—where such mitigation would be more critical—the effectiveness diminishes significantly. Moreover, this method only alleviates local voltage issues and does not resolve system-wide constraints [
13].
The authors in [
14] emphasised that a combination of traditional and novel measures will be necessary for future active grid control. In addition to energy storage systems, demand response mechanisms, and control of distributed resources, they foresee the use of transformer on-load tap changers (OLTCs) for voltage regulation. While OLTCs are common in transmission networks, they are rare in low-voltage (LV) networks. Nevertheless, several studies have demonstrated that OLTC technology can increase the hosting capacity of LV grids substantially for PV integration [
15,
16].
Some researchers underscore the need to reconsider traditional power grid paradigms to develop more flexible and efficient systems, with the role of energy storage being emphasised particularly [
10]. Battery energy storage systems (BESSs) have, thus, emerged as a key solution for enhancing hosting capacity in distribution networks with high PV penetration. Numerous studies have investigated their integration in combination with advanced control strategies to mitigate grid instability and enable higher levels of renewable energy integration. These methods typically focus on the optimal placement and sizing of BESSs, aiming to smooth power output fluctuations, improve voltage profiles, and prevent violations of operational constraints such as overvoltage or thermal overloading [
17,
18]. Energy storage systems can be centralised, distributed across the grid, or installed directly at the prosumer sites [
6,
8]. Deploying BESSs strategically allows for significantly enhancing the network’s ability to accommodate distributed generation without extensive grid reinforcement.
Furthermore, the use of BESSs is viewed increasingly not only as a technical solution but also as a cost-efficient alternative for network operators. Instead of relying solely on traditional infrastructural upgrades, Distribution Network Operators (DNOs) can reduce the need for capital-intensive reinforcement by incentivising prosumers to integrate energy storage systems into their self-sustaining PV setups [
19]. This approach allows for a more flexible and adaptive response to the challenges posed by variable renewable generation, while maintaining the overall reliability of the distribution system.
Advanced control strategies extend the capabilities of BESSs further. For example, several studies have explored the combination of active power curtailment and reactive power support with storage management to alleviate congestion and maintain voltage stability [
20]. In one approach, voltage at consumer nodes is monitored continuously, and the BESS is charged when excess PV generation causes local overvoltage. Adaptive curtailment is activated if the battery reaches its maximum state of charge and voltage issues persist [
21]. This layered strategy reduces reverse power flows effectively and mitigates voltage violations, thereby enhancing the hosting capacity [
20,
22].
Beyond distribution-level voltage and congestion management, BESSs also play a critical role in system-wide balancing and ancillary service provision. Their fast response capability allows them to support frequency regulation, particularly in power systems with high shares of renewable energy, where traditional synchronous generators are being displaced [
23]. In case of frequency dips due to contingencies, BESSs can discharge stored energy rapidly, helping stabilise the system before conventional generators restore the system stability fully.
The functionality of BESS extends across different grid levels—from microgrids to transmission systems. Studies such as [
24] categorised energy storage systems into mechanical, electrochemical, electrical, and thermal types, each with specific characteristics and control strategies suited to particular applications. These systems contribute to a variety of grid services, including output smoothing, voltage support, peak shaving, and other ancillary services essential for maintaining power system stability [
25].
Flexibility at the consumer level is also becoming increasingly important. With the proliferation of prosumers, technologies such as electric vehicles and household BESSs offer additional potential for active demand-side participation. These distributed storage resources can adjust their charging behaviour in response to grid conditions—for example, by increasing consumption during times of excess generation, thereby reducing curtailment and system losses [
26,
27].
Beyond conventional control strategies, machine learning-based approaches have shown great potential in optimising battery scheduling by predicting PV generation and household demand dynamically. Integrating forecasting with BESS operation not only improves energy management efficiency but also reduces the overall costs for residential users [
28]. Studies indicate that forecast-based storage management strategies outperform traditional self-consumption maximisation approaches, enabling proactive scheduling of charging and discharging cycles. This alleviates grid stress, particularly during peak PV generation periods, and enhances the overall hosting capacity [
29].
In addition, machine learning techniques such as regression models [
30], random forest [
6], and deep neural networks [
31,
32] have been applied successfully for tasks like voltage determination and prediction in distribution networks. These methods offer a significant advantage over traditional simulation models, as they can provide real-time predictions without the need for computationally expensive and time-consuming simulations. By learning directly from historical data, machine learning algorithms can offer accurate and efficient solutions for voltage management and other grid control tasks, reducing the dependency on detailed network models.
The success of these machine learning methods is tied fundamentally to the availability and quality of data. Most research relies on real-world production and consumption data collected over extended periods. A critical factor in data analysis is the selection of an appropriate time interval for averaging power measurements, as it impacts the accuracy of power quality assessment and energy management strategies directly. While many utilities and regulatory frameworks adopt a standard 15 min interval, some systems employ even shorter durations. High-resolution data collection has been shown to enhance the detection of rapid voltage fluctuations and transient events, which are crucial for optimising grid stability in networks with high PV penetration. This underscores the growing need for advanced data-driven methodologies that leverage granular measurements to improve forecasting accuracy, refine control algorithms, and maximise the hosting capacity [
33].
To leverage high-resolution datasets fully, it is essential to develop advanced analytical tools that facilitate optimal decision-making in power system planning and operation. By integrating mathematical models and algorithms, these tools can enhance the accuracy of PV generation models, improve battery storage management, and refine grid control strategies.
Several studies have addressed similar challenges related to hosting capacity in distribution networks, though they often rely on coarser data resolutions. For example, [
8] investigated an LV feeder with more than 800 household loads, but used only five typical load profiles based on the number of inhabitants. Additionally, the one-hour data resolution in [
8,
14] limits the ability to capture short-term fluctuations, which are important for precise voltage regulation. Similarly, [
34] explored both medium (MV) and LV levels using the IEEE 34-bus test system, but the load profiles are based on typical residential, industrial and commercial patterns, which may not reflect the dynamic behaviour of prosumers or individual households fully. In [
18], the authors proposed an optimisation-based approach using yearly simulations and metaheuristic techniques to size and locate PV and BESS installations. While effective for broader planning scenarios, this method relies on standardised test networks and does not utilise detailed real-world data. In contrast, this study focuses specifically on LV networks, which are particularly relevant for residential prosumers and household-level integration of renewable energy systems, a segment often overlooked in many MV studies [
20]. By utilising 15 min resolution data, this study captures finer operational dynamics and short-term fluctuations, which are crucial for accurate voltage regulation at the household level. While smart meter data in distribution grids are increasingly available, allowing for high-resolution analyses, access to such data is often restricted to specific regions or research groups.
To assess the impact of DERs and low-carbon technologies, researchers often rely on simulations and numerical calculations based on various power grid models. A critical question in this context is the level of detail needed for a model, and which voltage levels should be considered to provide reliable insights.
The analysis of power grids relies predominantly on simulation models, which remain the most widely used approach for evaluating the impacts of new technologies, operational strategies, and grid dynamics. These models function as in silico environments, enabling researchers and network operators to assess system performance across diverse scenarios, anticipate potential challenges, and validate solutions prior to real-world implementation.
Historically, distribution grids operated as consumer systems without components for the production or storage of electrical energy. Consequently, detailed analyses of conditions within LV networks were often deemed unnecessary, as changes were typically limited to occasional new customer connections. Grid planning focused primarily on identifying solutions to meet peak consumption demands [
35]. As a result, traditional modelling approaches did not prioritise the accuracy of LV grids. When larger areas involving thousands of consumers were analysed, only the MV portion of the grid was modelled explicitly, while the LV grids were simplified as lumped loads connected to the transformer’s secondary side. This approach overlooked the actual topology of LV grids and potential asymmetries, which are most prevalent at this voltage level [
7,
31,
36].
However, the modernisation of distribution grids, driven by both technical and economic factors, now demands more granular and accurate models. DNOs often have detailed information about grid equipment and topology, linked frequently to Geographic Information Systems (GIS) [
36]. Accurate data on load distribution across individual phases are essential, and some studies analyse consumers based on their phase connections, although spatial distances and network asymmetries are still often neglected [
7]. To meet contemporary requirements, more realistic modelling approaches are now being recommended, based on local design principles and guidelines.
Furthermore, an integrated approach that evaluates solutions “on both sides of the meter” is advocated increasingly [
34]. In contrast to earlier, less detailed approaches, recent research emphasises the need for comprehensive models that reflect the dynamics of both LV and MV grids accurately to assess the full impact of DER integration and low-carbon technologies better.
The aim of this paper is to investigate the impact of integrating PV systems and BESSs into LV distribution networks, with a particular focus on the management of overvoltage issues. This research examines specifically how the placement and number of PV systems, in combination with the integration of BESSs, influence the occurrence and severity of overvoltage in distribution networks characterised by a high penetration of PV power generation. Accordingly, we ask important questions: How do the placement and number of PV systems, together with the integration of BESSs, affect the occurrence and management of overvoltage issues in LV distribution networks?
To address these research questions, a novel stochastic simulation framework was developed, employing the Monte Carlo method, to model various scenarios of PV system integration and energy storage. Unlike conventional deterministic approaches, this method captures a wide range of real-world conditions by incorporating stochastic PV placement, real consumer load profiles, and actual network topology, thus providing a more precise and application-oriented analysis of voltage fluctuations. The paper analyses the dynamic behaviour of voltage rises in distribution networks under different levels of PV system penetration. The results highlight a clear correlation: as the number of PV systems increases, overvoltage issues become more prevalent. However, the integration of BESSs has proven to be an effective strategy for mitigating these voltage issues. By providing a buffer for excess energy generated by PV systems, BESSs delay the onset of overvoltage and reduce its overall severity, demonstrating the crucial role that energy storage plays in stabilising voltage fluctuations in networks with high PV generation.
The rest of this paper is structured as follows.
Section 2 presents the materials and methods used in this paper, including a description of the network and acquired smart meter data, as well as the Monte Carlo method for determining the hosting capacity for PV systems. It also details the algorithms used to simulate daily power flows, weather conditions, and the mathematical models of both PV systems and BESSs.
Section 3 summarises the results of the simulations, while
Section 4 discusses the implications of these findings for distribution network planning and operation.
2. Materials and Methods
This paper is based on a real electrical network, which serves as the foundation for designing a model used in simulations conducted within the MATLAB Simulink environment. The simulations account for challenging weather conditions that impact the operation of a network with a high penetration of PV systems significantly. The methodology employed in this paper consists of multiple stages, each addressing a critical aspect of modelling and analysing the integration of renewable energy sources and energy storage systems.
The investigated network represents an actual distribution grid. Its topology, voltage levels, and existing infrastructure are incorporated, to ensure realistic simulation conditions. The model includes essential network parameters, such as line impedances, transformer characteristics, and load profiles.
Smart meter data are utilised to obtain accurate consumption patterns, while historical weather data and building rooftop properties are considered, to generate precise PV system generation profiles. These datasets provide high-resolution temporal information on household electrical energy usage, enabling detailed modelling of demand-side behaviour and PV generation variability.
Monte Carlo simulations are applied, to estimate the hosting capacity of the network for additional PV installations. The impact of various penetration levels on voltage stability and network performance is analysed systematically by generating multiple stochastic scenarios. Furthermore, daily power flow simulations are performed, to evaluate the impact of renewable generation and storage on network operation. Voltage limits serve as operational constraints, ensuring that the analysis aligns with the realistic network operation conditions and regulatory requirements.
2.1. Network Description
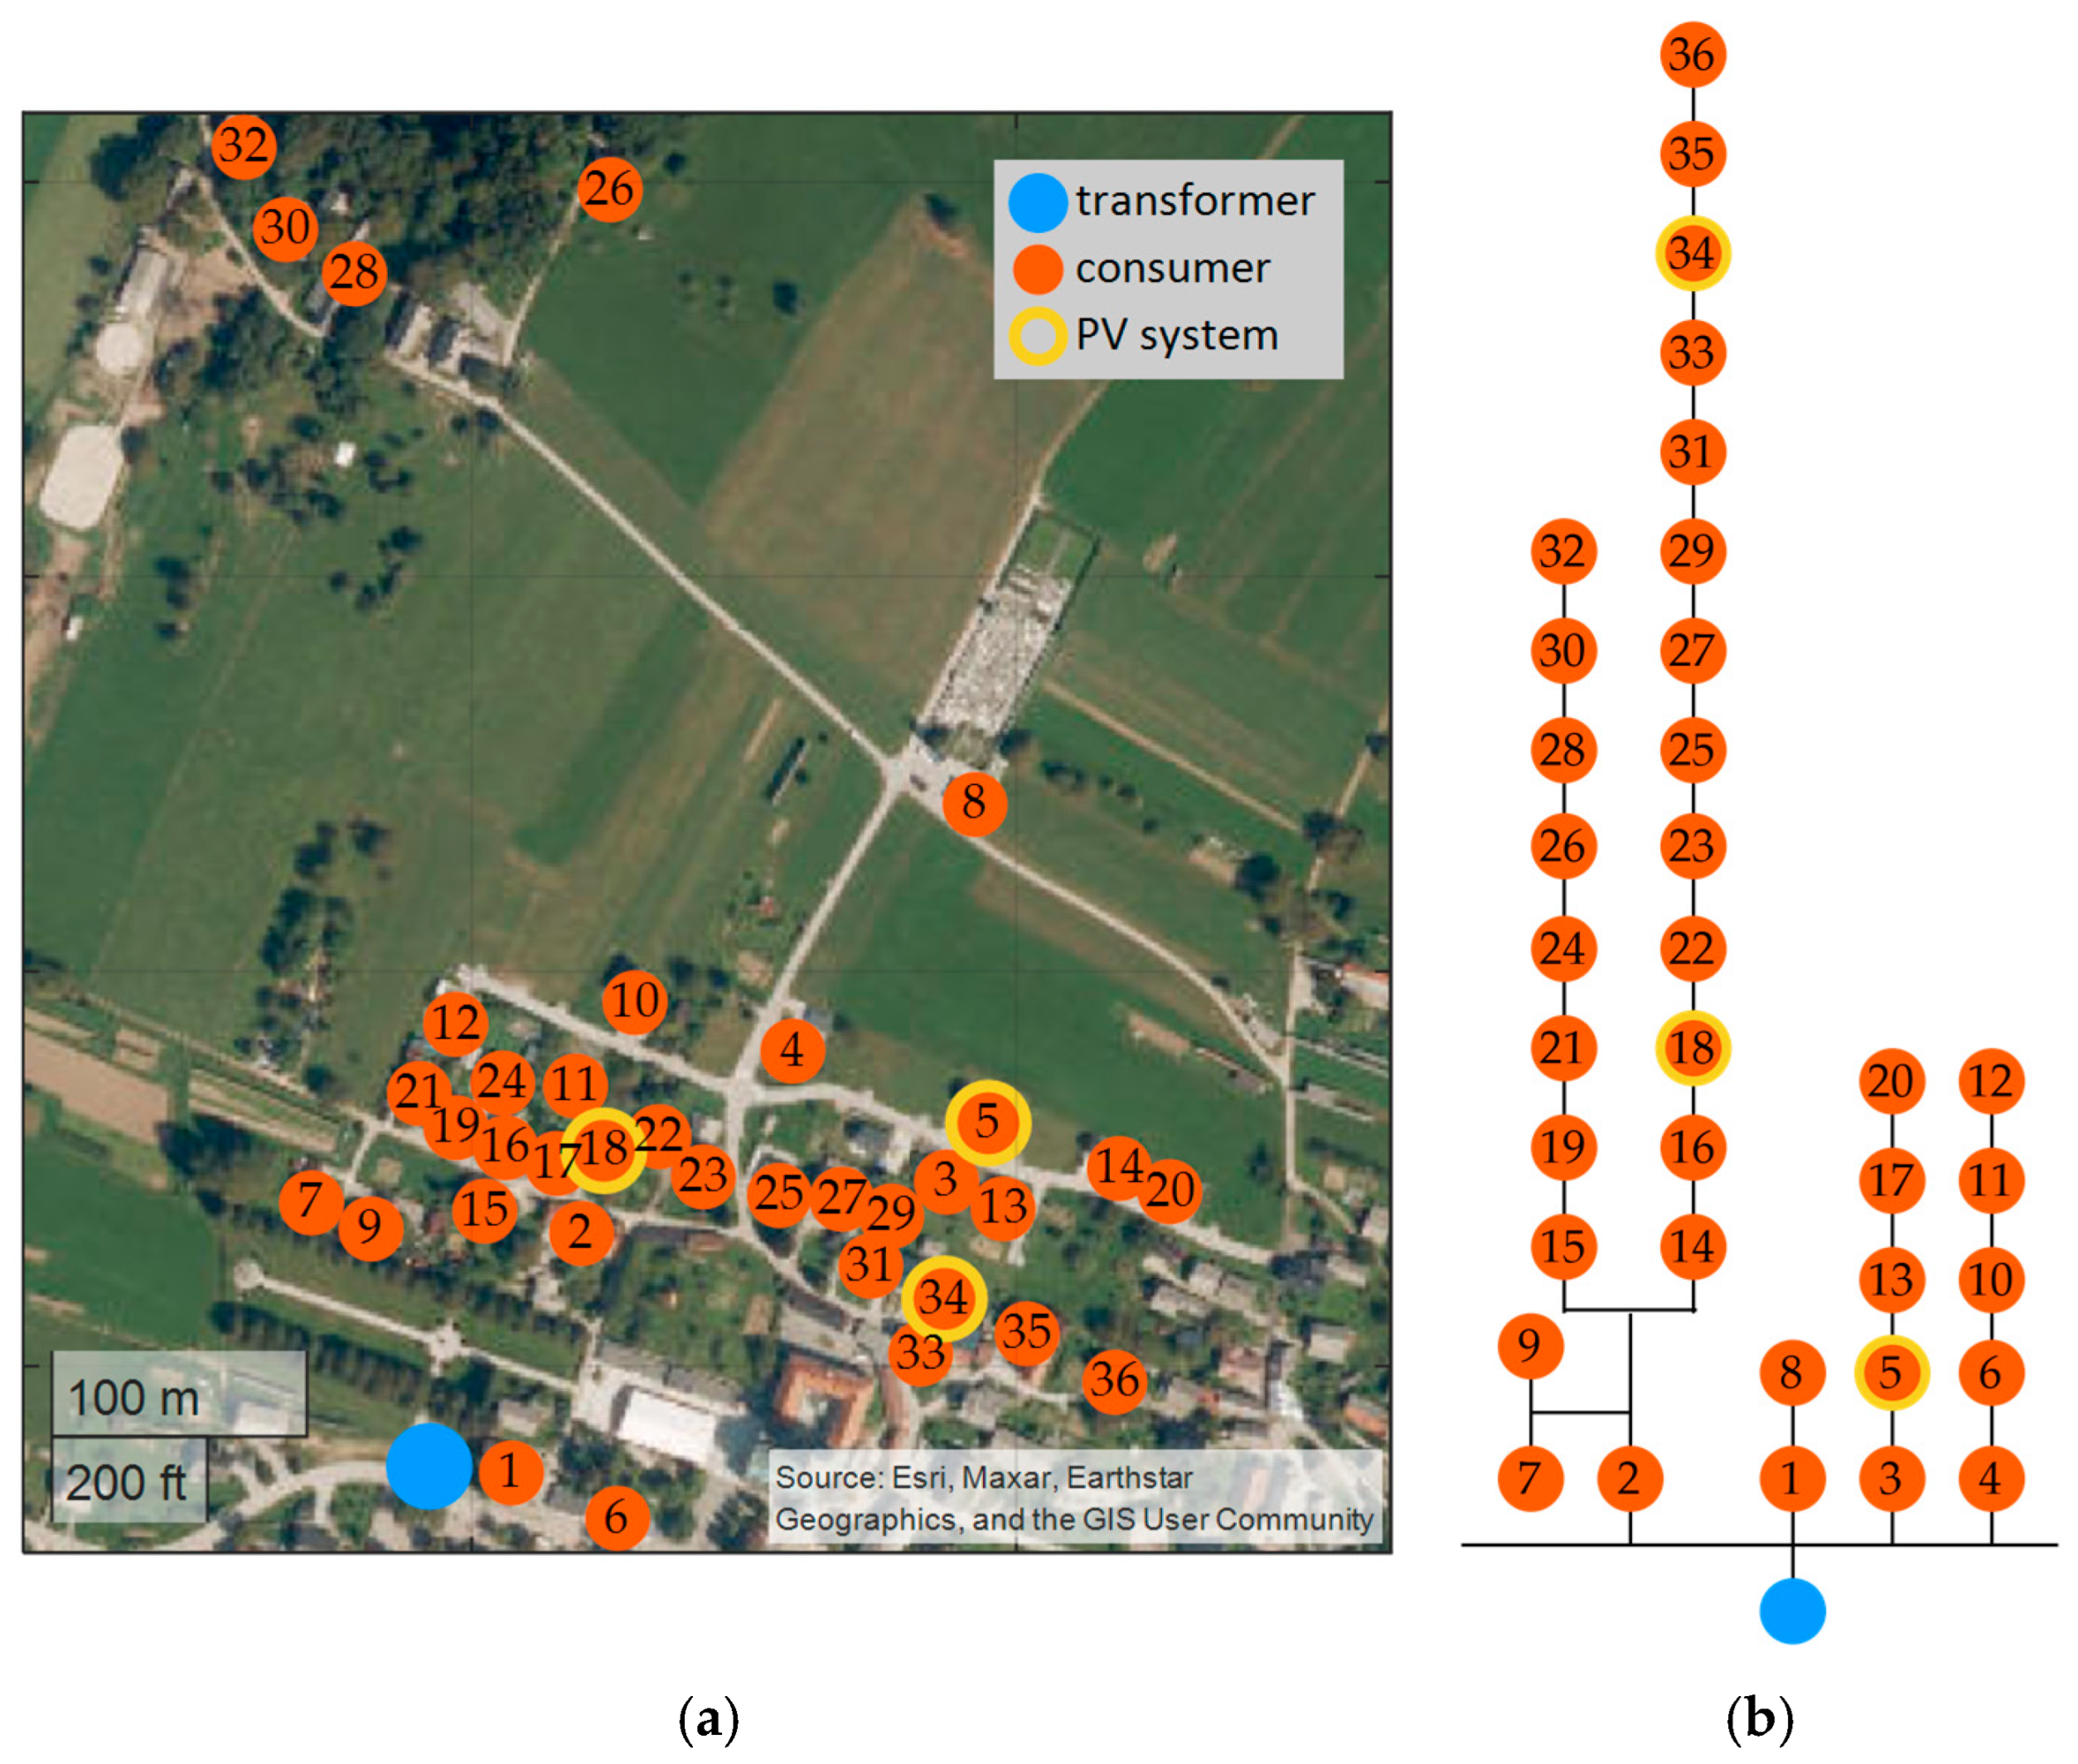
A single feeder of an LV distribution grid is selected as the case study. The grid is supplied by a 250 kVA, 20/0.4 kV Dy5 transformer, which serves a total of seven feeders. The analysed feeder supplies 36 consumers. Among them, three households have PV systems already in operation [
37]. The topology of the studied feeder and the single-line diagram, including the locations of existing PV installations, are depicted in
Figure 1. The consumers are numbered primarily according to the number of consumers preceding them, and secondarily by their distance from the transformer. The presented consumer ordering facilitates the network analysis and data interpretation of this paper.
The feeder connections consist primarily of underground cables with aluminium conductors, PVC insulation, and protection. Since the infrastructure has been developed over different periods, cable sections are classified according to the different previously applicable standards. The conductor cross-sections vary, ranging from 4 × 10 mm
2 to 4 × 150 mm
2, depending on the specific segment of the distribution network and its age [
37].
2.2. Smart Meter Data
To enhance the accuracy of the simulation results, each consumer is assigned their actual electrical energy consumption profile, which is obtained from the local DNO [
37]. The power exported to the grid is also included in cases where PV systems are already installed. The time-series data were collected over the course of one year, with the highest available resolution of 15 min, providing a detailed representation of consumption patterns. For residential consumers, only active power is measured, and therefore, their load is assumed to operate at a unity power factor, simplifying the modelling of power flow within the system.
2.3. Hosting Capacity for PV System Determination Using the Monte Carlo Method
The increasing integration of rooftop PV systems is evident; however, consumers make the decision to install a PV system independently [
19], leading to uncertainty about the specific locations of future systems. If every household can install a PV system, a network with 36 consumers can have 2
36 possible integration scenarios. Exploring all these scenarios is impractical. Therefore, a random sample of the possible integration scenarios is generated using the Monte Carlo method. Different levels of PV system integration are considered, starting with the addition of a single PV system, with the number of systems increasing incrementally at each level. Ten iterations of power flow simulations are performed at each level of integration, with each iteration representing a different scenario based on the locations of the PV systems. Simulations are carried out for a specific data point within the given daily time-series data, as discussed further in
Section 2.5. Algorithm 1 outlines the implementation of the Monte Carlo method.
| Algorithm 1. Monte Carlo method for PV system hosting capacity determination |
for i = 1 : total number of consumers
for j = 1 : 10- 1.
assign a PV system to i randomly selected consumers without repetition within j iterations - 2.
perform power flow simulation - 3.
check for overvoltage at all consumer buses
end
end |
As stated in Algorithm 1, the primary operational limit under consideration is the voltage across all consumer buses. The permissible voltage range at each consumer bus is set to + 5% of the nominal value, accounting for potential overvoltage issues that may arise from the integration of numerous PV systems into LV networks.
Following this, BESSs are integrated into the consumer buses where the PV systems have been added, to evaluate their impact in enhancing the hosting capacity of the network. The modified scenarios are then reevaluated by executing Algorithm 1 again, considering the new configuration with both PV systems and BESS. This allows for better management of the generated electrical energy, and potentially reduces the risk of overvoltage, improving the grid’s ability to accommodate additional PV systems further.
2.4. Daily Power Flow Simulations
Electrical energy generation from PV systems and household consumption patterns are inherently subject to temporal variations, resulting in fluctuations in voltage levels throughout the day. To assess these variations comprehensively, daily power flow simulations are conducted, enabling a detailed analysis of the impact of PV system and BESS operation on grid performance.
To explore the system’s behaviour further, simulations are performed at different levels of PV and BESS penetration, beginning with low integration and increasing the number of added systems gradually. This approach allows for a better understanding of how varying degrees of PV and BESS adoption influence grid stability and hosting capacity.
The simulations are carried out for the most critical day, characterised by favourable weather conditions that maximise PV generation, which is likely to present the greatest challenges to voltage regulation.
2.5. Weather Conditions and Data Acquisition
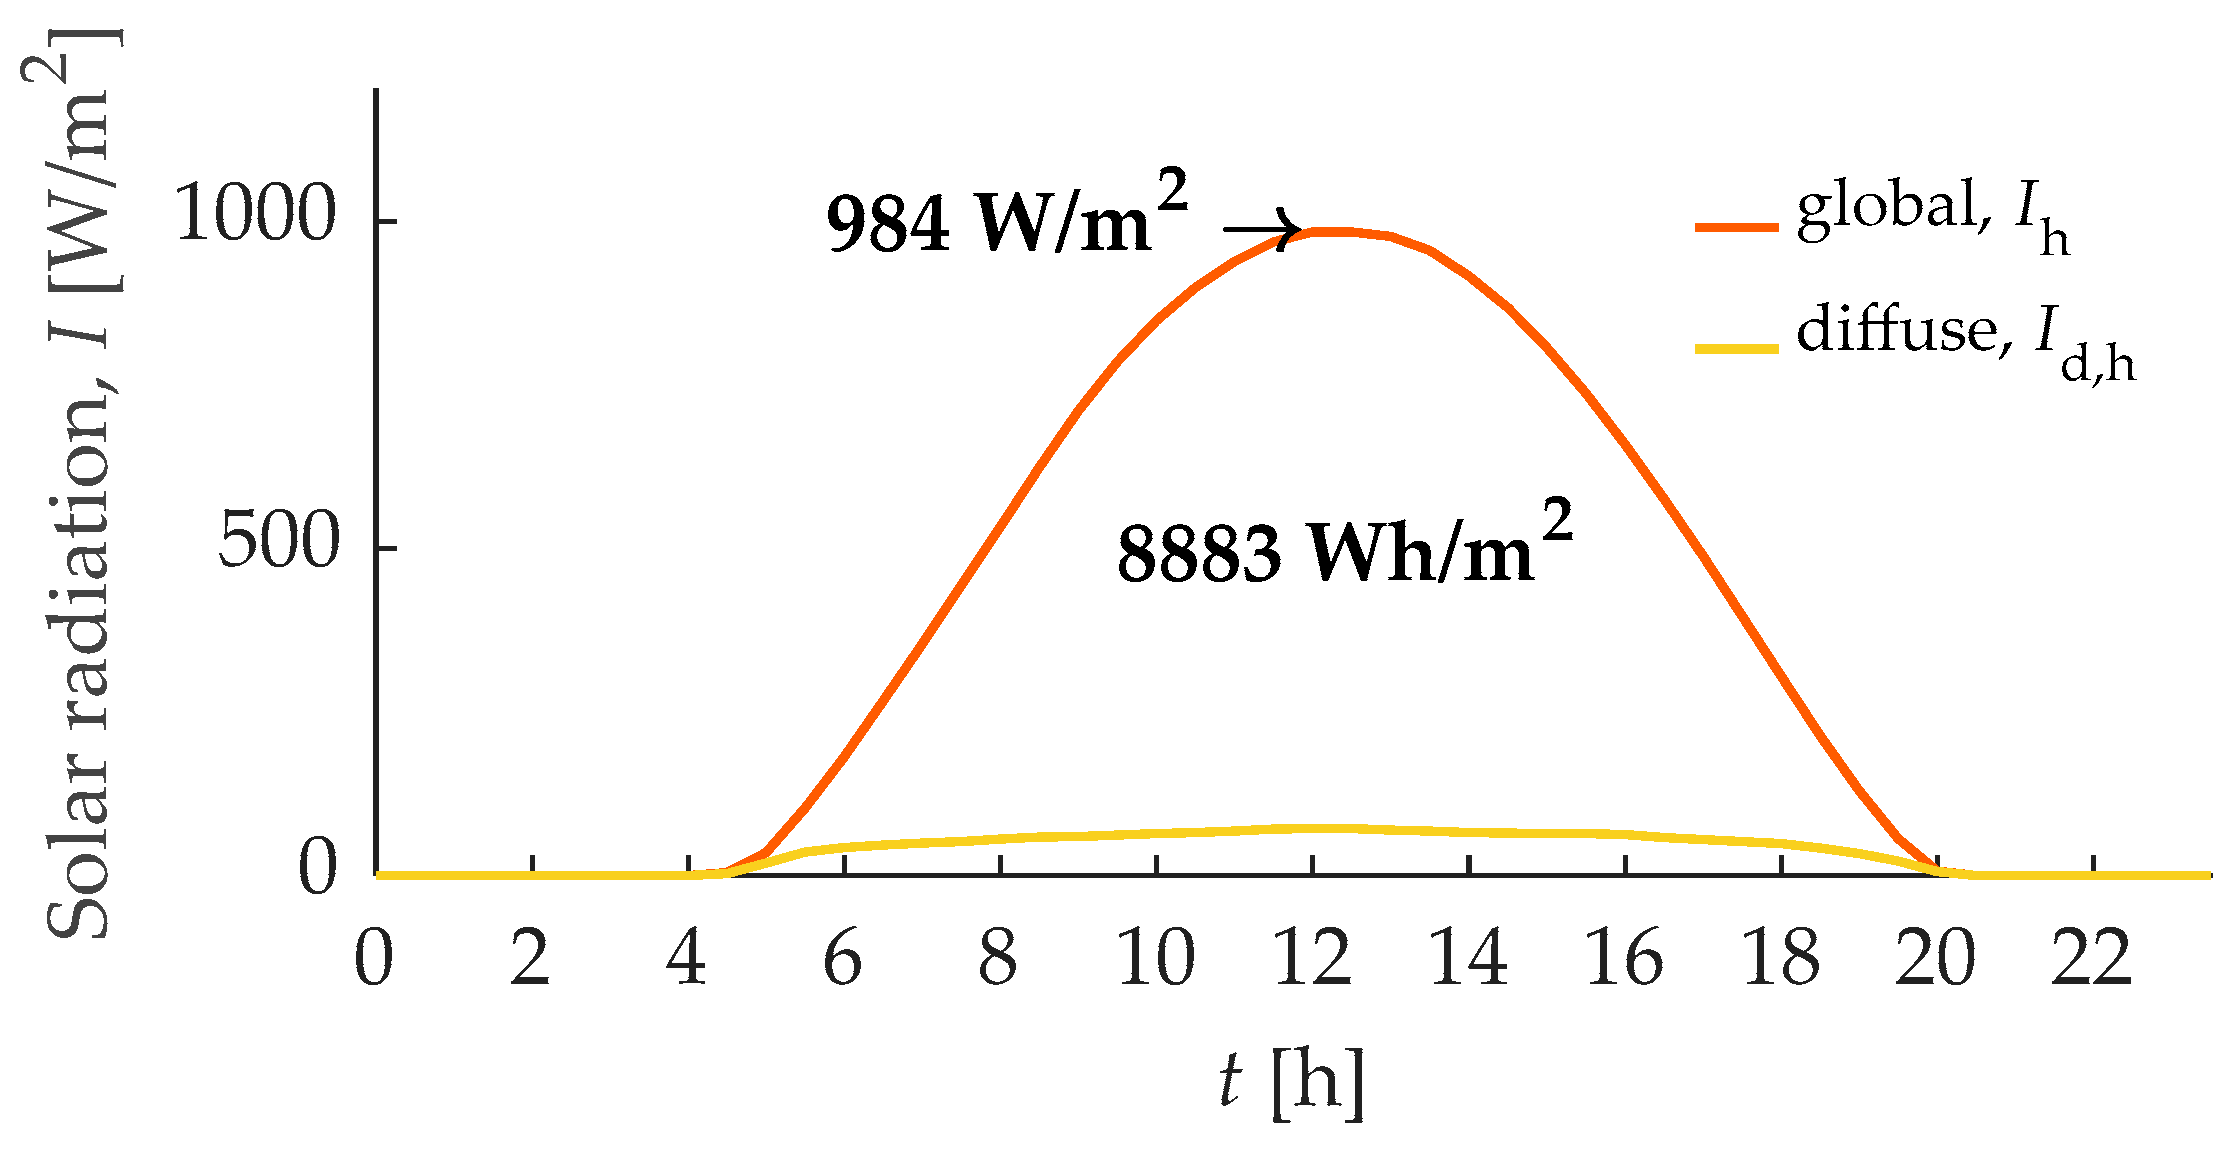
The aim of the simulations is to study the most challenging, yet realistic conditions for PV system integration. To identify these conditions, the sunniest day was selected as the worst-case scenario for grid performance. The first criterion for the sunniest day was the highest integral value of the daily solar radiance curve. The second criterion was the highest recorded instantaneous solar radiation at any given time during the day. Archival meteorological data [
38] from the past five years were analysed, to identify these extremes. The data on solar radiation were obtained from the nearest meteorological station, located approximately 6 km from the studied network. On 12 June 2020, the daily solar irradiance reached 8883 Wh/m
2, and the highest instantaneous measurement of solar radiation was 984 W/m
2.
Figure 2 illustrates the daily course of global and diffuse solar radiation for the selected day.
The peak solar radiance at noon on the selected day was used for the simulations within Algorithm 1. For the daily power flow simulations, detailed in
Section 2.4., the daily solar radiance profile was applied, as shown in
Figure 2.
2.6. Mathematical Model of PV System Electrical Energy Generation
Hypothetical new PV systems to be integrated into the network simulation model were modelled mathematically to simulate electrical energy generation. Solar radiance data, recorded by the Slovenian Environmental Agency [
38], were utilised to calculate the irradiance on different roof slopes and orientations, reflecting the potential installation configurations of PV systems. The capacities of these PV systems for individual households were determined based on the available roof surface area and current regulatory limitations. The electrical energy generation was subsequently estimated by considering the specific roof orientation and the corresponding solar irradiance. Unlike previous studies, which often relied on simplified irradiation models, this paper employs a highly detailed approach that accounts for geographic latitude, hourly solar position, roof inclination, and azimuth, resulting in a significantly more precise estimation of PV generation. This level of accuracy has not been applied in such analyses previously, providing a novel contribution to the field of Distribution Network Simulations. Algorithm 2 outlines the methodology for PV system generation output [
39]. This model, originally developed and validated by the authors [
39], has been in regular use for research purposes, and has shown strong agreement with the empirical PV generation data.
| Algorithm 2. PV system electrical energy generation |
input parameters:
geographic latitude L
tilt of PV system β
azimuth of PV system aw
PV system surface A
solar radiation I
efficiency η
for n day of the year
determine Earth’s declination δ (n)
for t = 1 : 24 h
determine:
hour angle for current time h (t)
solar altitude angle α (L, δ, h)
angle of sunlight incidence i (L, δ, β, aw, h)
tilt factors for direct, diffuse, and reflected radiation R (β, α, i)
output parameter:
instantaneous power output of PV system (I, R, A, η)
end
end |
2.7. Mathematical Model of a BESS
In the simulation model, energy storage systems are represented as ideal batteries that store excess energy during periods of high electrical generation and discharge stored energy during times of high consumption. Each consumer is assigned a specific BESS capacity, which corresponds to one day of autonomy based on their average daily consumption [
40]. The charging and discharging power are determined by a 0.25 C-rate, which is recommended commonly in residential applications [
41,
42].
The mathematical model of the BESS was implemented as an algorithm within the software code. The algorithm processes the input data, including the current consumption power and the PV generation power. When the surplus consumption over generation is positive, it indicates that the remaining required power must be sourced from the BESS or the grid. Power can be drawn from the BESS if there is sufficient stored energy. The battery can discharge at its maximum power output, with any additional required power being sourced from the grid. Conversely, when generation exceeds consumption, the surplus energy can be either stored in the BESS or fed into the grid. The battery can charge at its maximum power, with any remaining excess power being directed to the grid.
This control logic was developed based on practical recommendations from the literature [
40,
41,
42], and although it has not yet been validated using empirical BESS operation data due to limited access to real-world measurements, it provides a realistic theoretical foundation for residential storage behaviour.
A key novelty of this paper is also the precise modelling of BESS operation at the consumer level, incorporating real consumption profiles and dynamic interactions with PV generation. Unlike conventional models that often assume simplified or aggregated storage behaviour, this study introduces a detailed, time-resolved simulation of individual BESS charging and discharging processes, with the same temporal resolution as the PV generation model. This synchronised high-resolution approach ensures a more accurate assessment of the real impact of BESS integration on voltage regulation, offering valuable insights for network planning and management.
| Algorithm 3. BESS electrical energy storage |
if consumption power > generation power
if BESS energy > energy consumption
if required power > maximum BESS power
discharge BESS with maximum power
take remaining power from grid
else
discharge BESS with required power
end
else
take required power from grid
end
else
if BESS energy < energy generation surplus
if power surplus > maximum BESS power
charge BESS with maximum power
give remaining power to grid
else
charge BESS with surplus power
end
else
give surplus power to grid
end
end |
3. Results
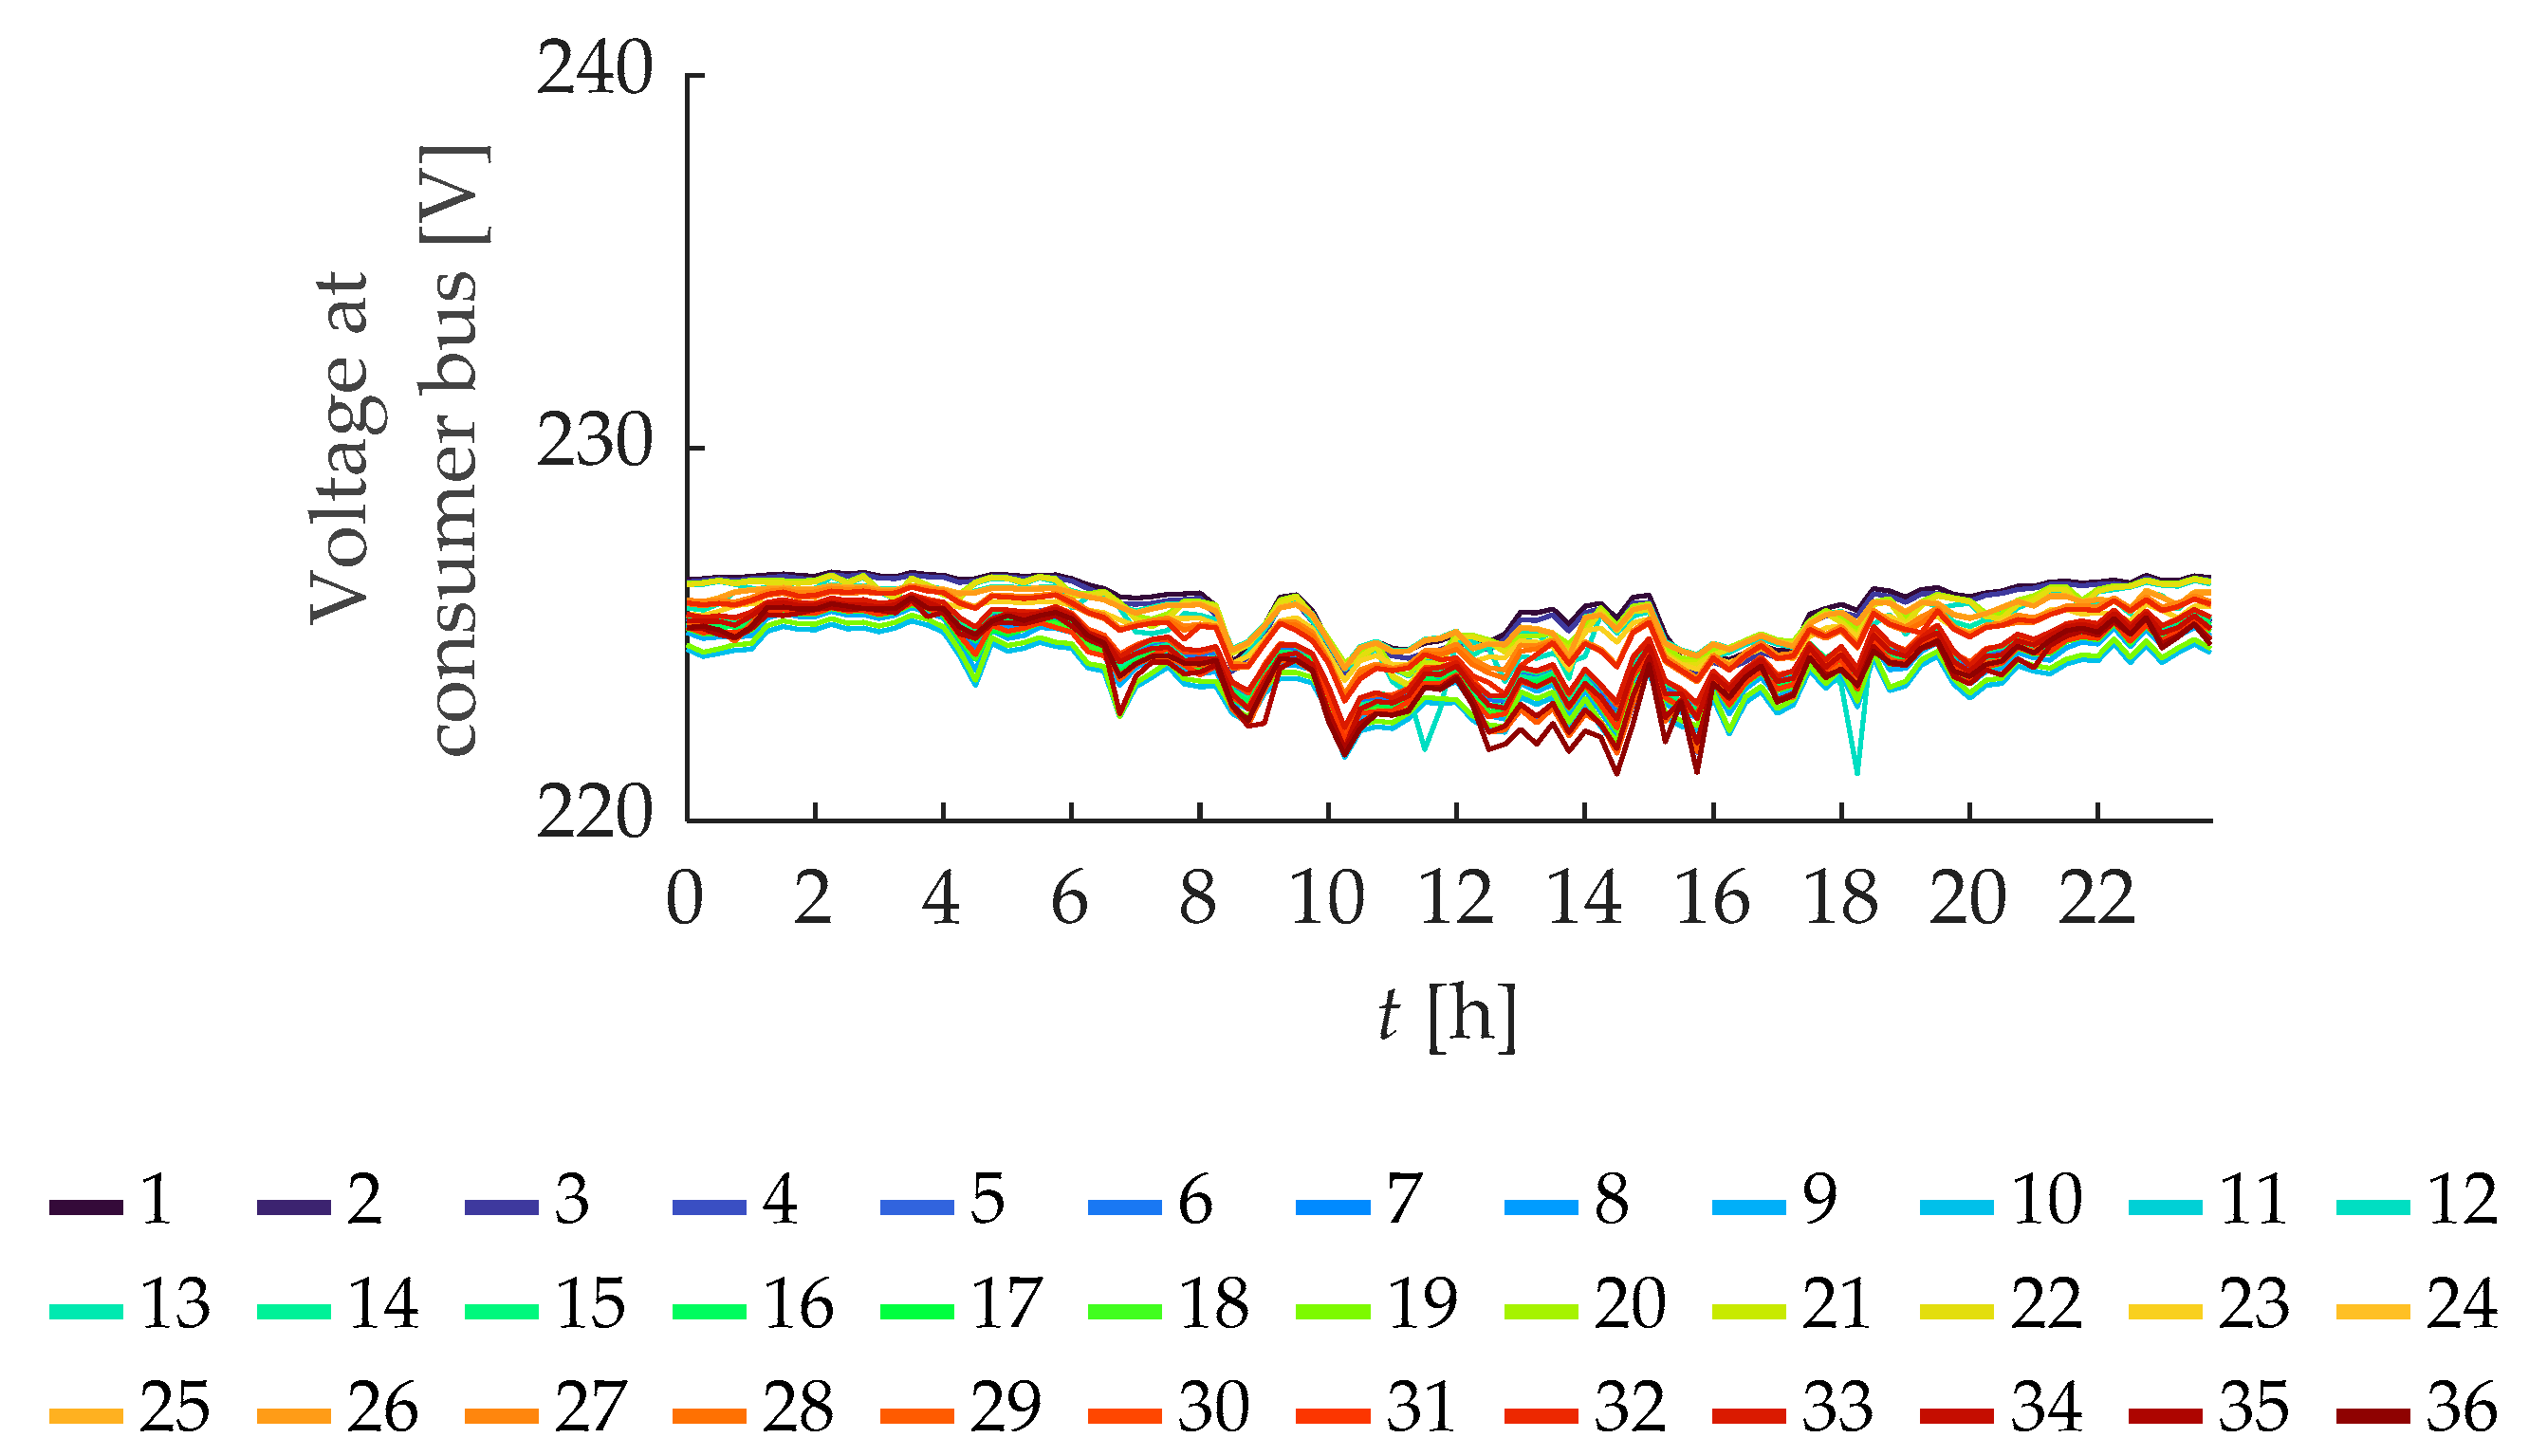
The analysed real-world network is characterised by operating at a slightly lower voltage than the nominal value. Therefore, an initial simulation of the existing network state was conducted for the selected day.
Figure 3 illustrates the daily voltage profile at all consumer buses in the original network state, showing that the voltage remained below the nominal
Vn = 230 V. The average daily voltage across all consumer buses was, in fact, 225 V.
To illustrate the impact of newly added PV and BES systems better, a baseline voltage Vn of 225 V was adopted for all subsequent simulations. This value was accepted as an operationally acceptable condition by the local DNO, and is thus considered the initial optimal state.
Figure 3 also includes a colour scale used consistently throughout the paper to represent individual consumers. The spectrum ranges from blue to green and yellow to red. Consumers located closer to the transformer (see
Section 2.1) are represented in the blue part of the spectrum, while those further from the transformer are shown in the red part.
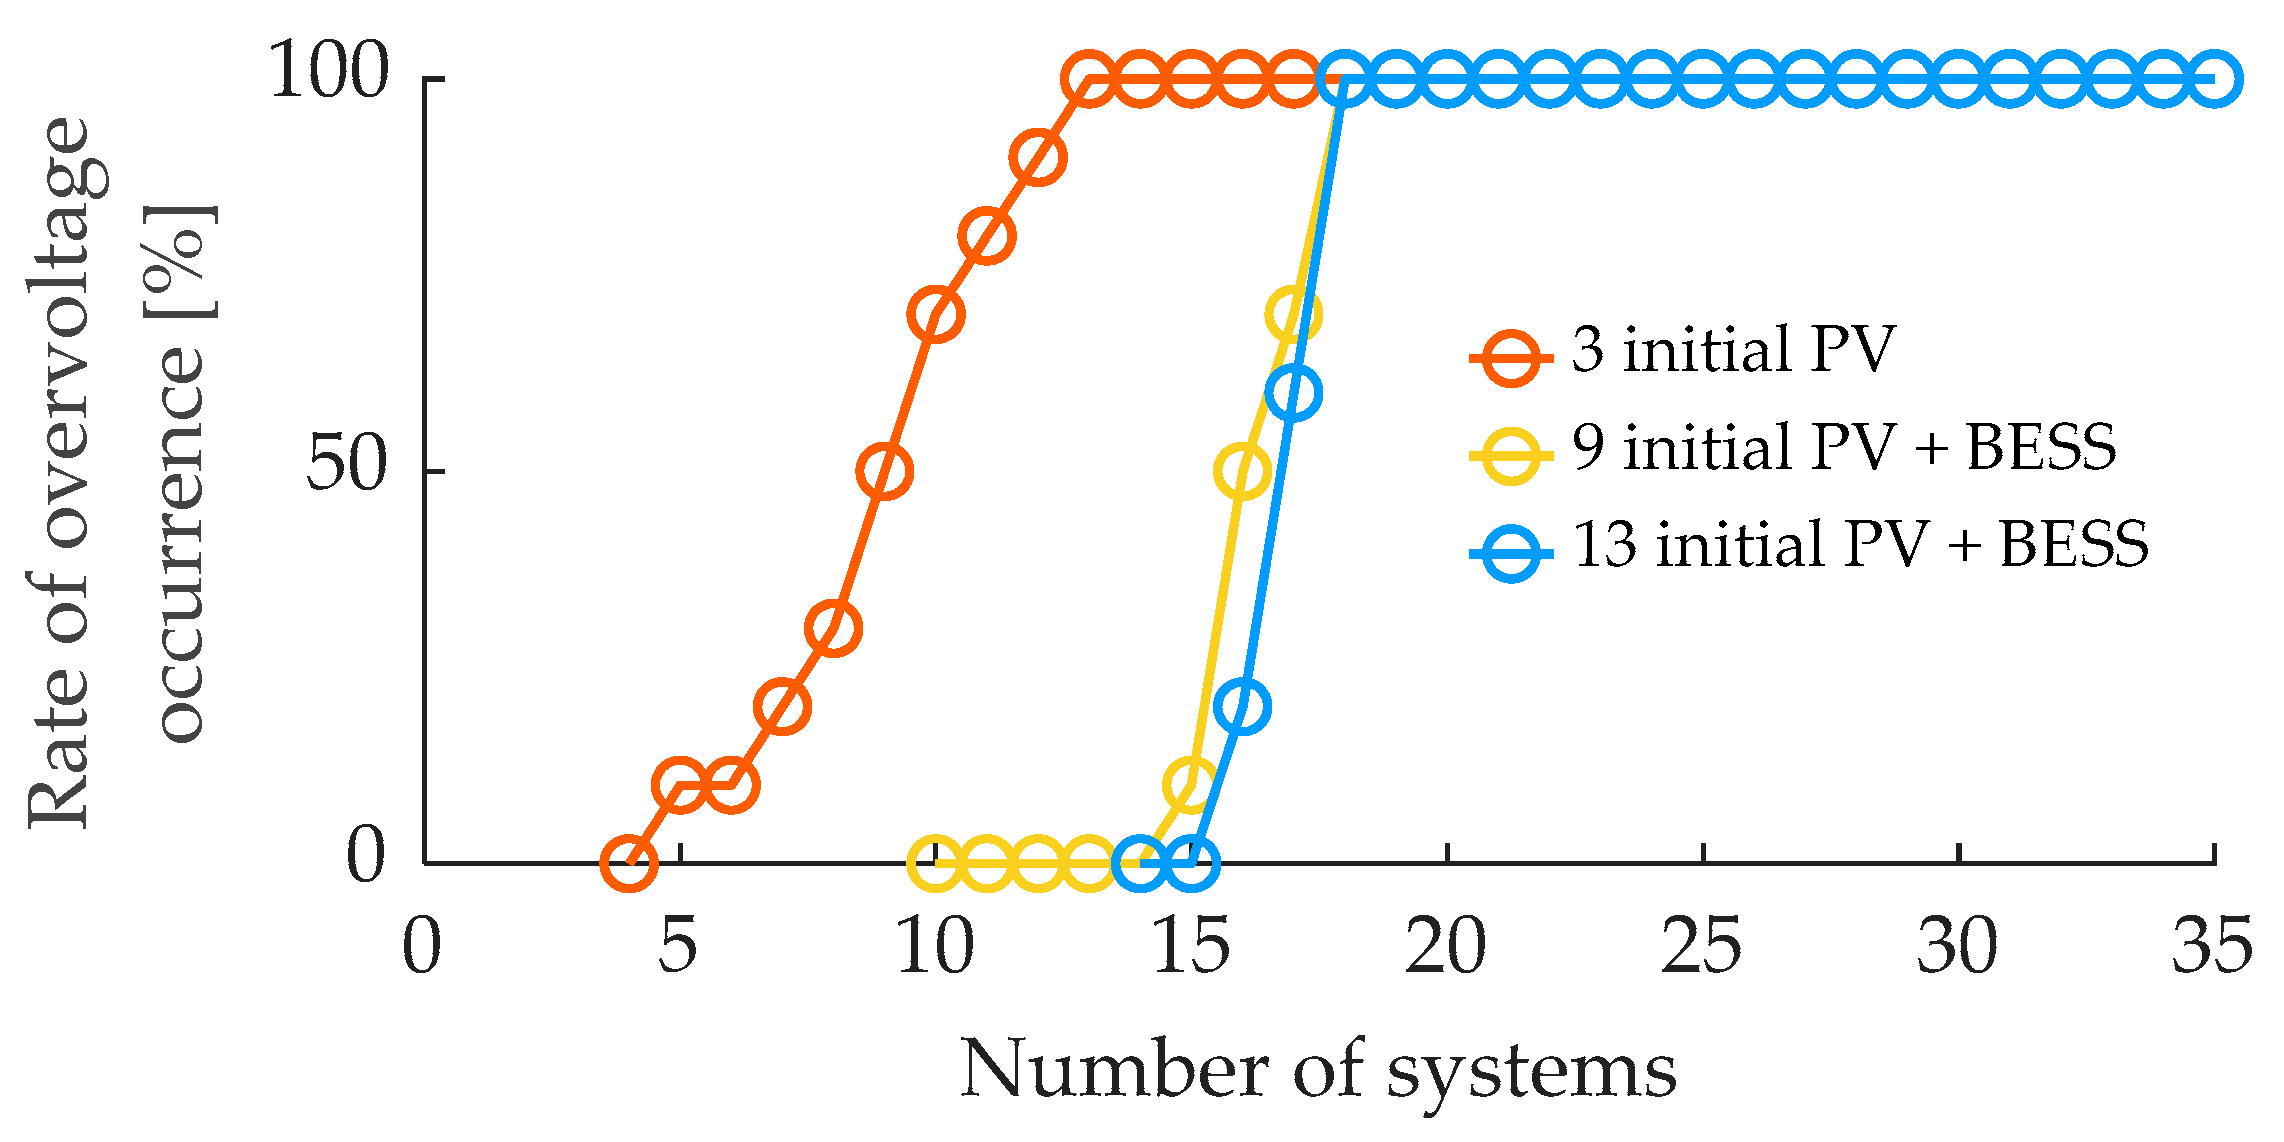
Firstly, Algorithm 1 was executed, to evaluate the rate of overvoltage occurrence as PV systems were added incrementally to a network that initially operated with three PV systems.
Figure 4 shows a rising trend in the overvoltage occurrence rate with the progressive integration of additional PV systems. The overvoltage occurrence rate is defined as the share of 10 simulation runs at each integration level in which overvoltage occurs at least at one consumer bus. The results indicated that, with six additional PV systems, totalling nine in the network, overvoltage occurred in 50% of the simulations. When the total number of PV systems reached 13 (10 newly added systems), the probability of overvoltage occurrence rose to 100%. This suggests that, with 13 or more PV systems, overvoltage is inevitable, regardless of the specific system locations within the network.
From the previously analysed cases with six and ten additional PV systems—resulting in 50% and 100% probabilities of overvoltage occurrence, respectively—one network configuration was selected randomly for further analysis in each scenario. First, additional PV systems were integrated incrementally into the network with nine existing PV systems. However, in this case, each initial PV system was paired with a BESS. As shown in
Figure 4, the inclusion of the BESS delayed the onset of overvoltage, which did not occur until the total number of systems reached 15. The probability of overvoltage occurrence reached 50% at a total of 16 systems in the network.
Next, PV systems were added to the network operating initially with 13 PV and BES systems. In this scenario, overvoltage first appeared when the total number of systems reached 16. At 17 systems, the overvoltage occurrence rate increased to 60%. In both examined cases, a 100% overvoltage occurrence rate was observed when the total number of systems reached 18.
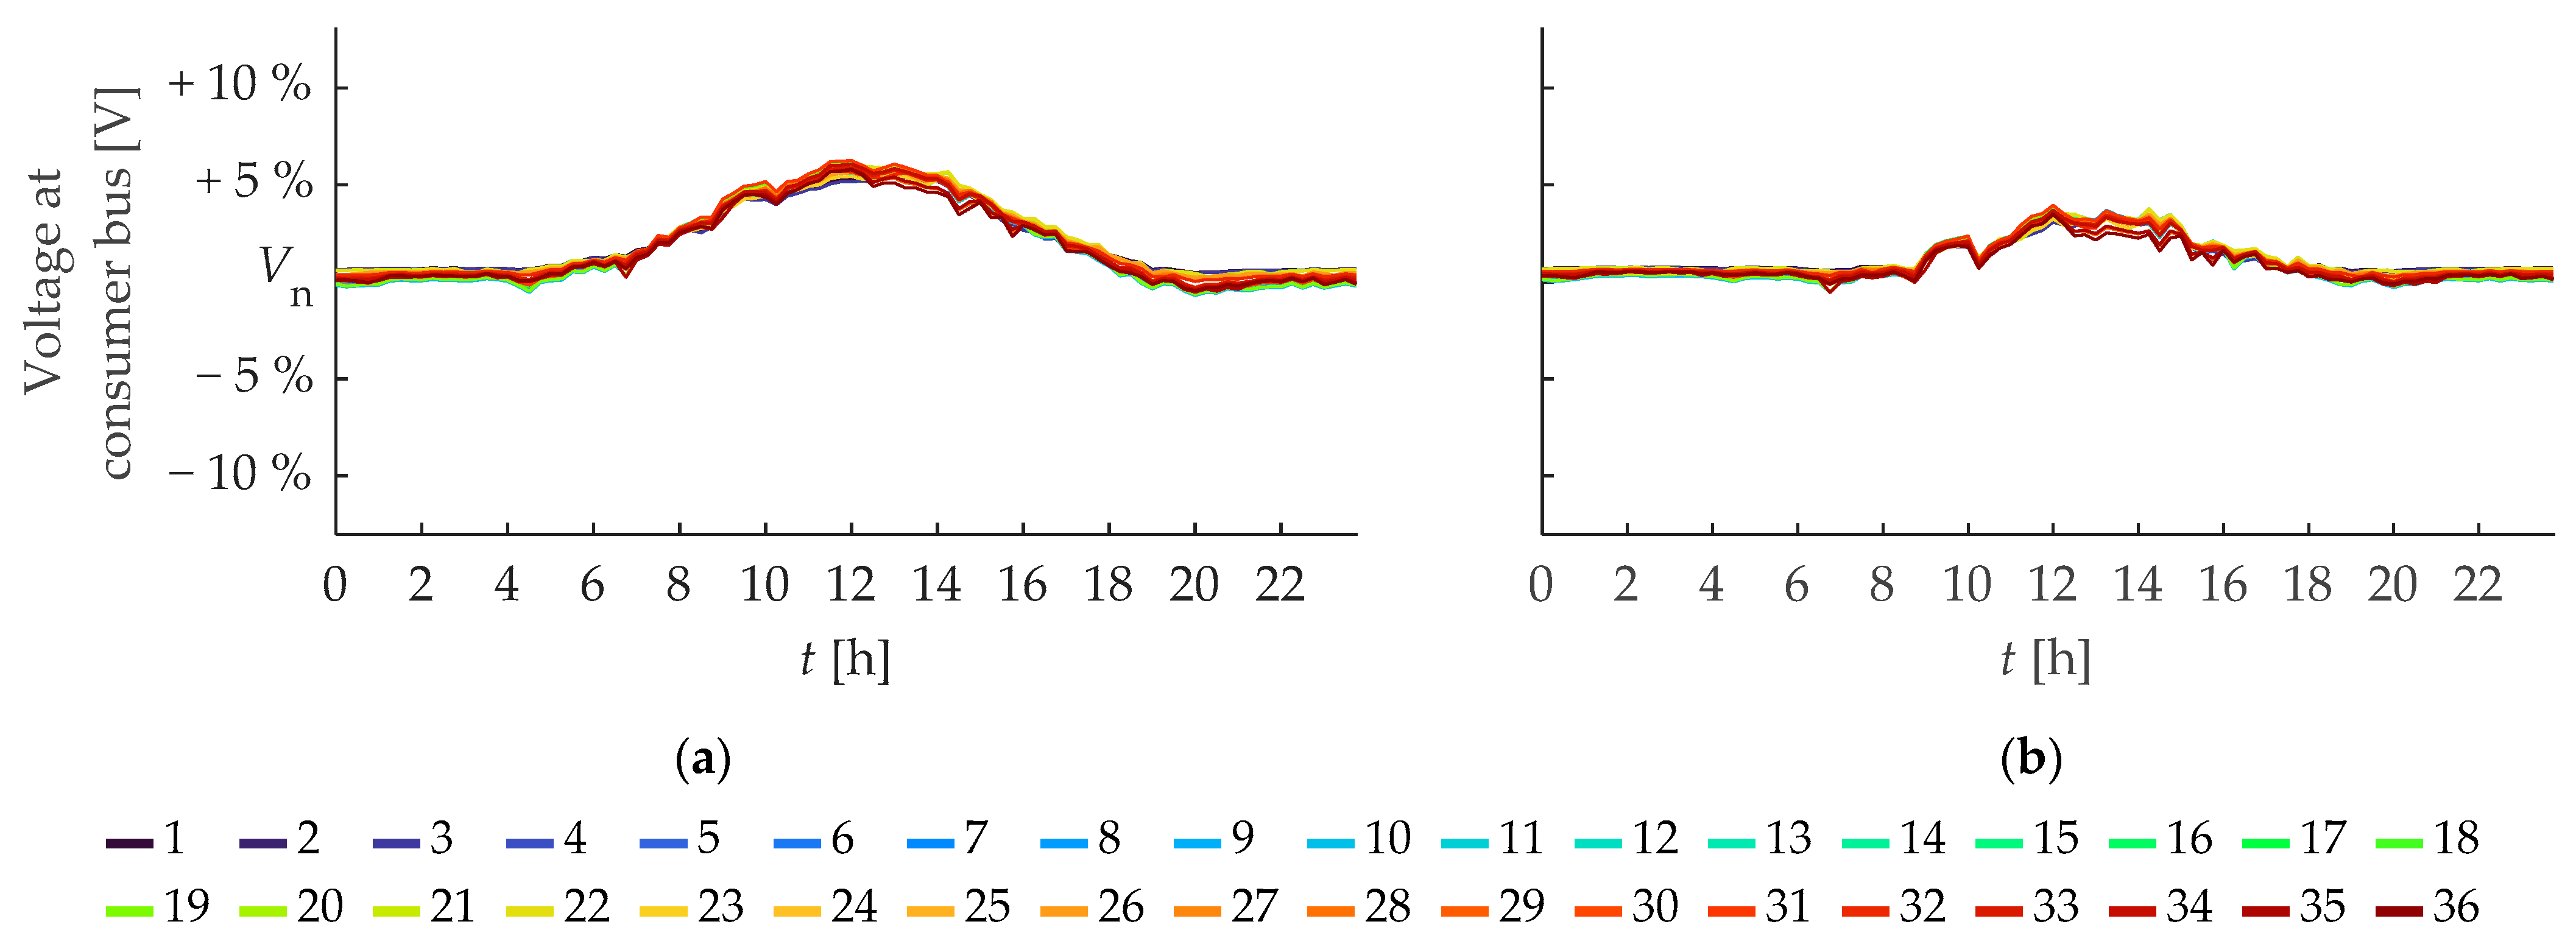
For the previously analysed case with six additional PV systems in a network initially operating with three PV systems, a daily power flow simulation was performed, as described in
Section 2.4.
Figure 5 presents the daily voltage profiles of all consumers in the network, where
Vn = 225 V.
Figure 5a illustrates the voltage rise during daylight hours when PV systems are generating actively. At noon, the voltage at all consumer buses reached or even exceeded a 5% deviation from the initial average value.
Figure 5b shows the voltage profiles when BESSs were integrated alongside all the PV systems. Due to energy storage, the voltage levels were reduced, not only for consumers with BESSs but also across the entire network. At noon, the voltage deviations at all consumer buses remained below 5%, demonstrating the effectiveness of BESSs in mitigating voltage rise.
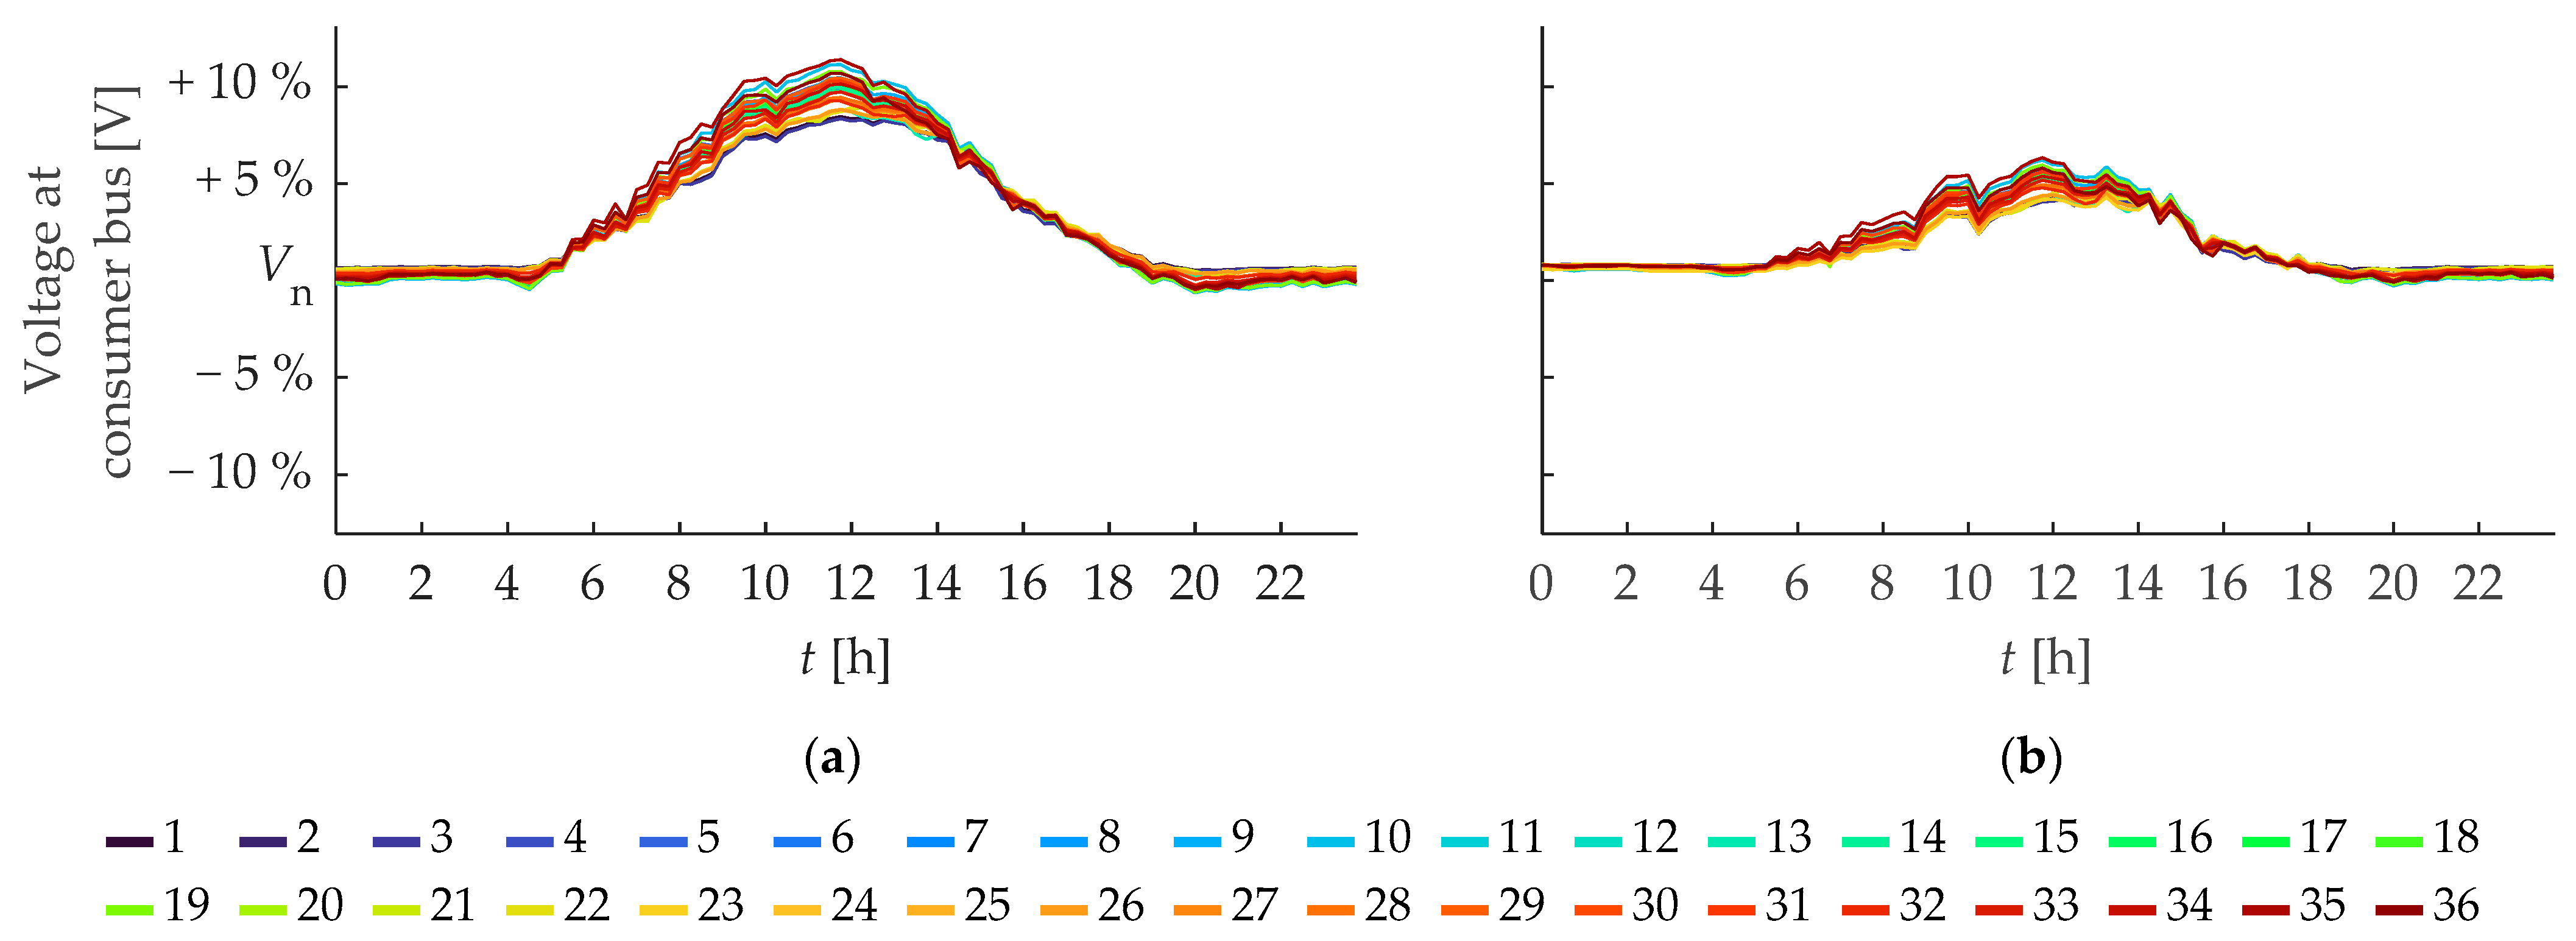
A case with ten additional PV systems is examined in the following. A daily power flow simulation was conducted, and
Figure 6 presents the daily voltage profiles for all the consumers within the network.
Figure 6a illustrates the voltage rise observed during daylight hours when the PV systems were generating actively. At noon, the voltage at all consumer buses exceeded a 5% deviation from the initial average value, with some consumer buses experiencing voltage deviations that reached, or even surpassed, 10%.
Figure 6b shows the voltage profiles when the BESSs were integrated alongside all the PV systems. At noon, the voltage deviations at all consumer buses were reduced significantly, to approximately 5%.
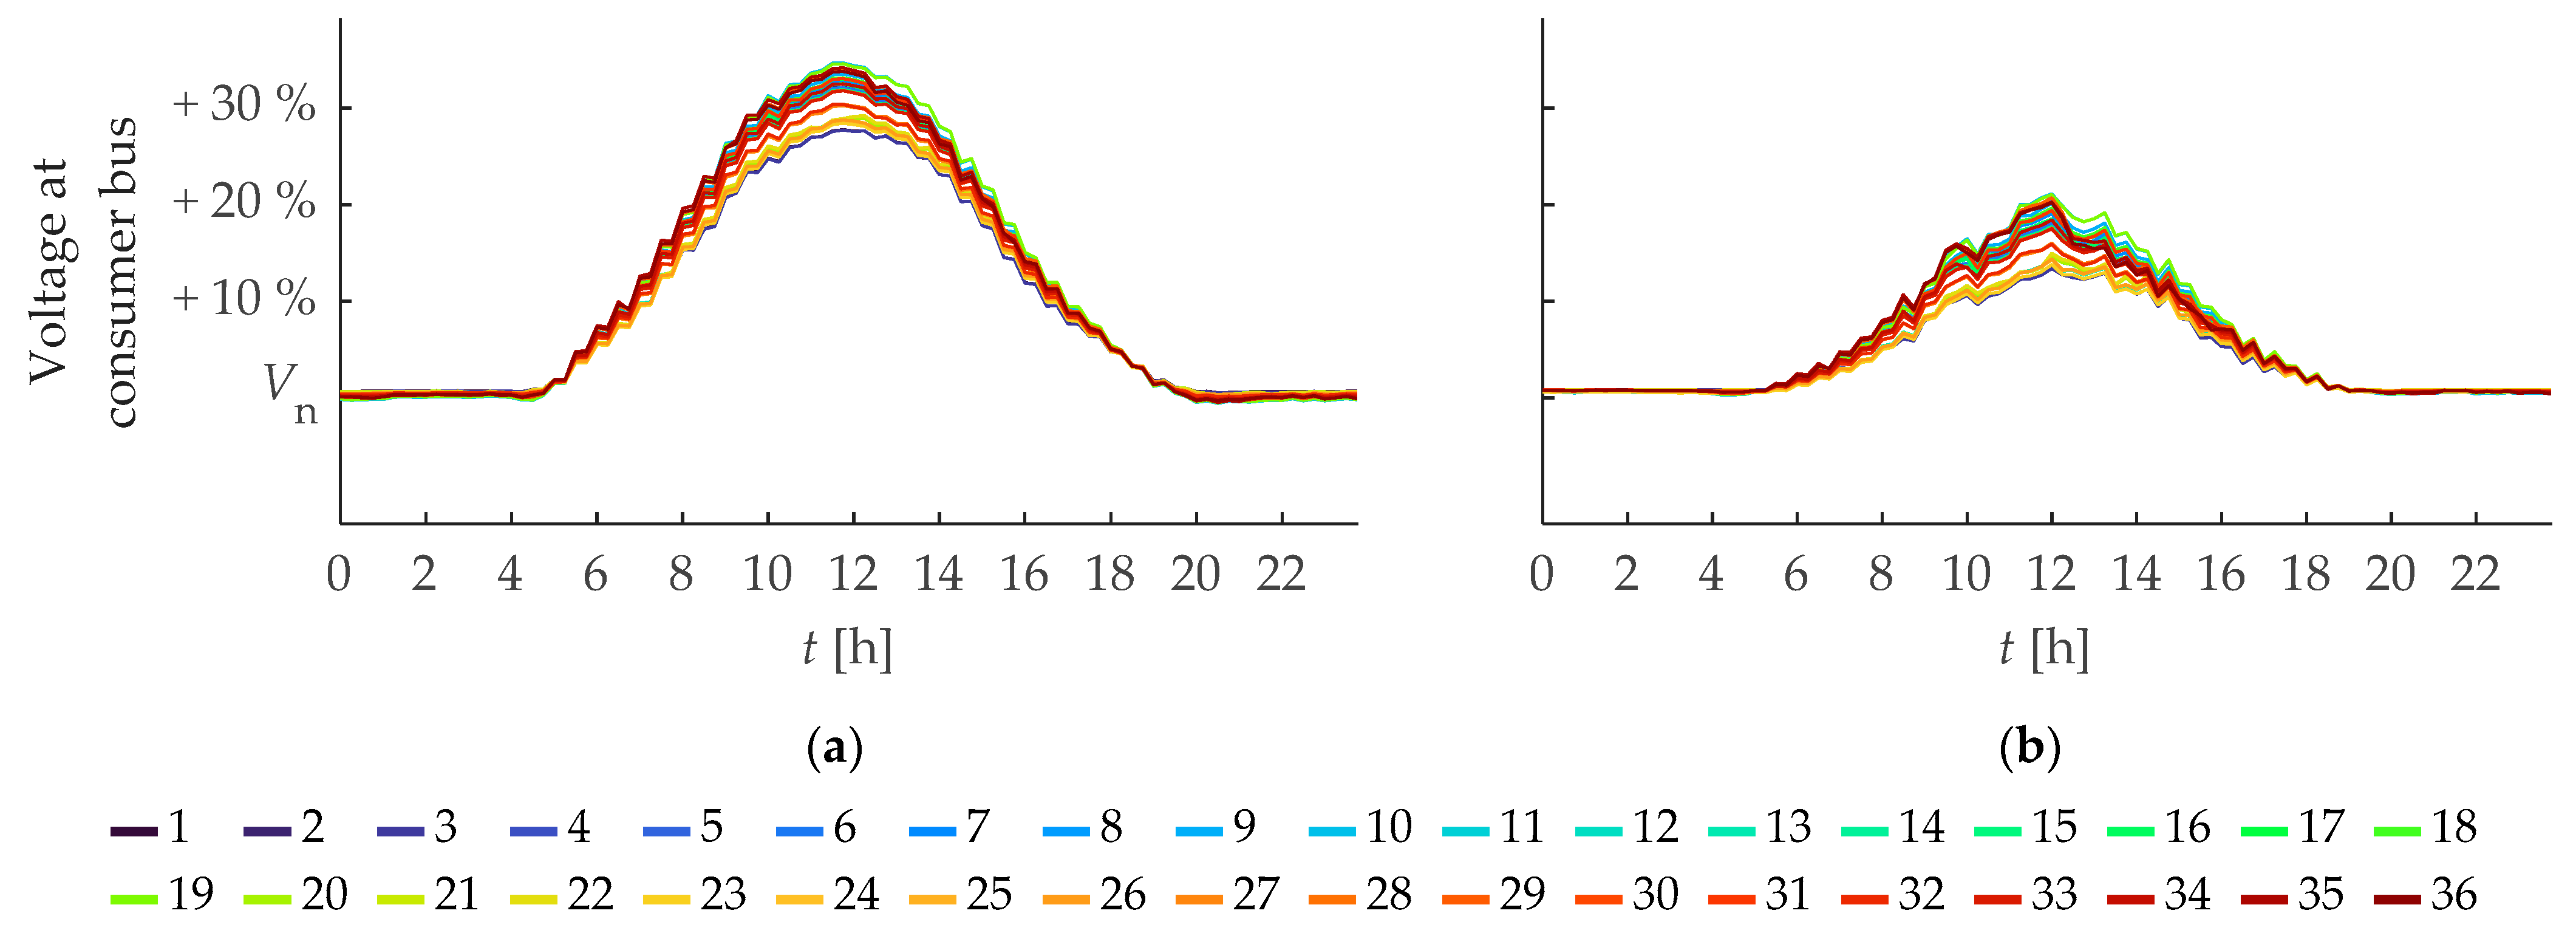
In the subsequent analysis, a scenario is considered in which PV systems are deployed across all consumers eligible for their installation. A daily power flow simulation was conducted, and the resulting data are illustrated in
Figure 7.
Figure 7a shows the voltage profiles when only the PV systems were integrated into the network. During daylight hours, the voltage at certain consumer buses exceeded a 30% deviation from the initial average value, indicating a significant voltage rise.
Figure 7b presents the voltage profiles when BESSs were incorporated in conjunction with the PV systems. While the voltage deviations were reduced, they remained at approximately 20%, which is considered too high for the system to operate within acceptable limits. This limited improvement is due primarily to the BESS sizing approach and operational constraints. BESS units are dimensioned based on the average daily consumption of each household, providing one full day of autonomy, without accounting for the potential surplus energy generated by PV systems. Furthermore, all BESS units operate with a fixed 0.25 C-rate, which limits their charging and discharging capabilities during periods of high PV output. These two factors reduce the system’s ability to mitigate overvoltage effectively under conditions of high PV penetration.
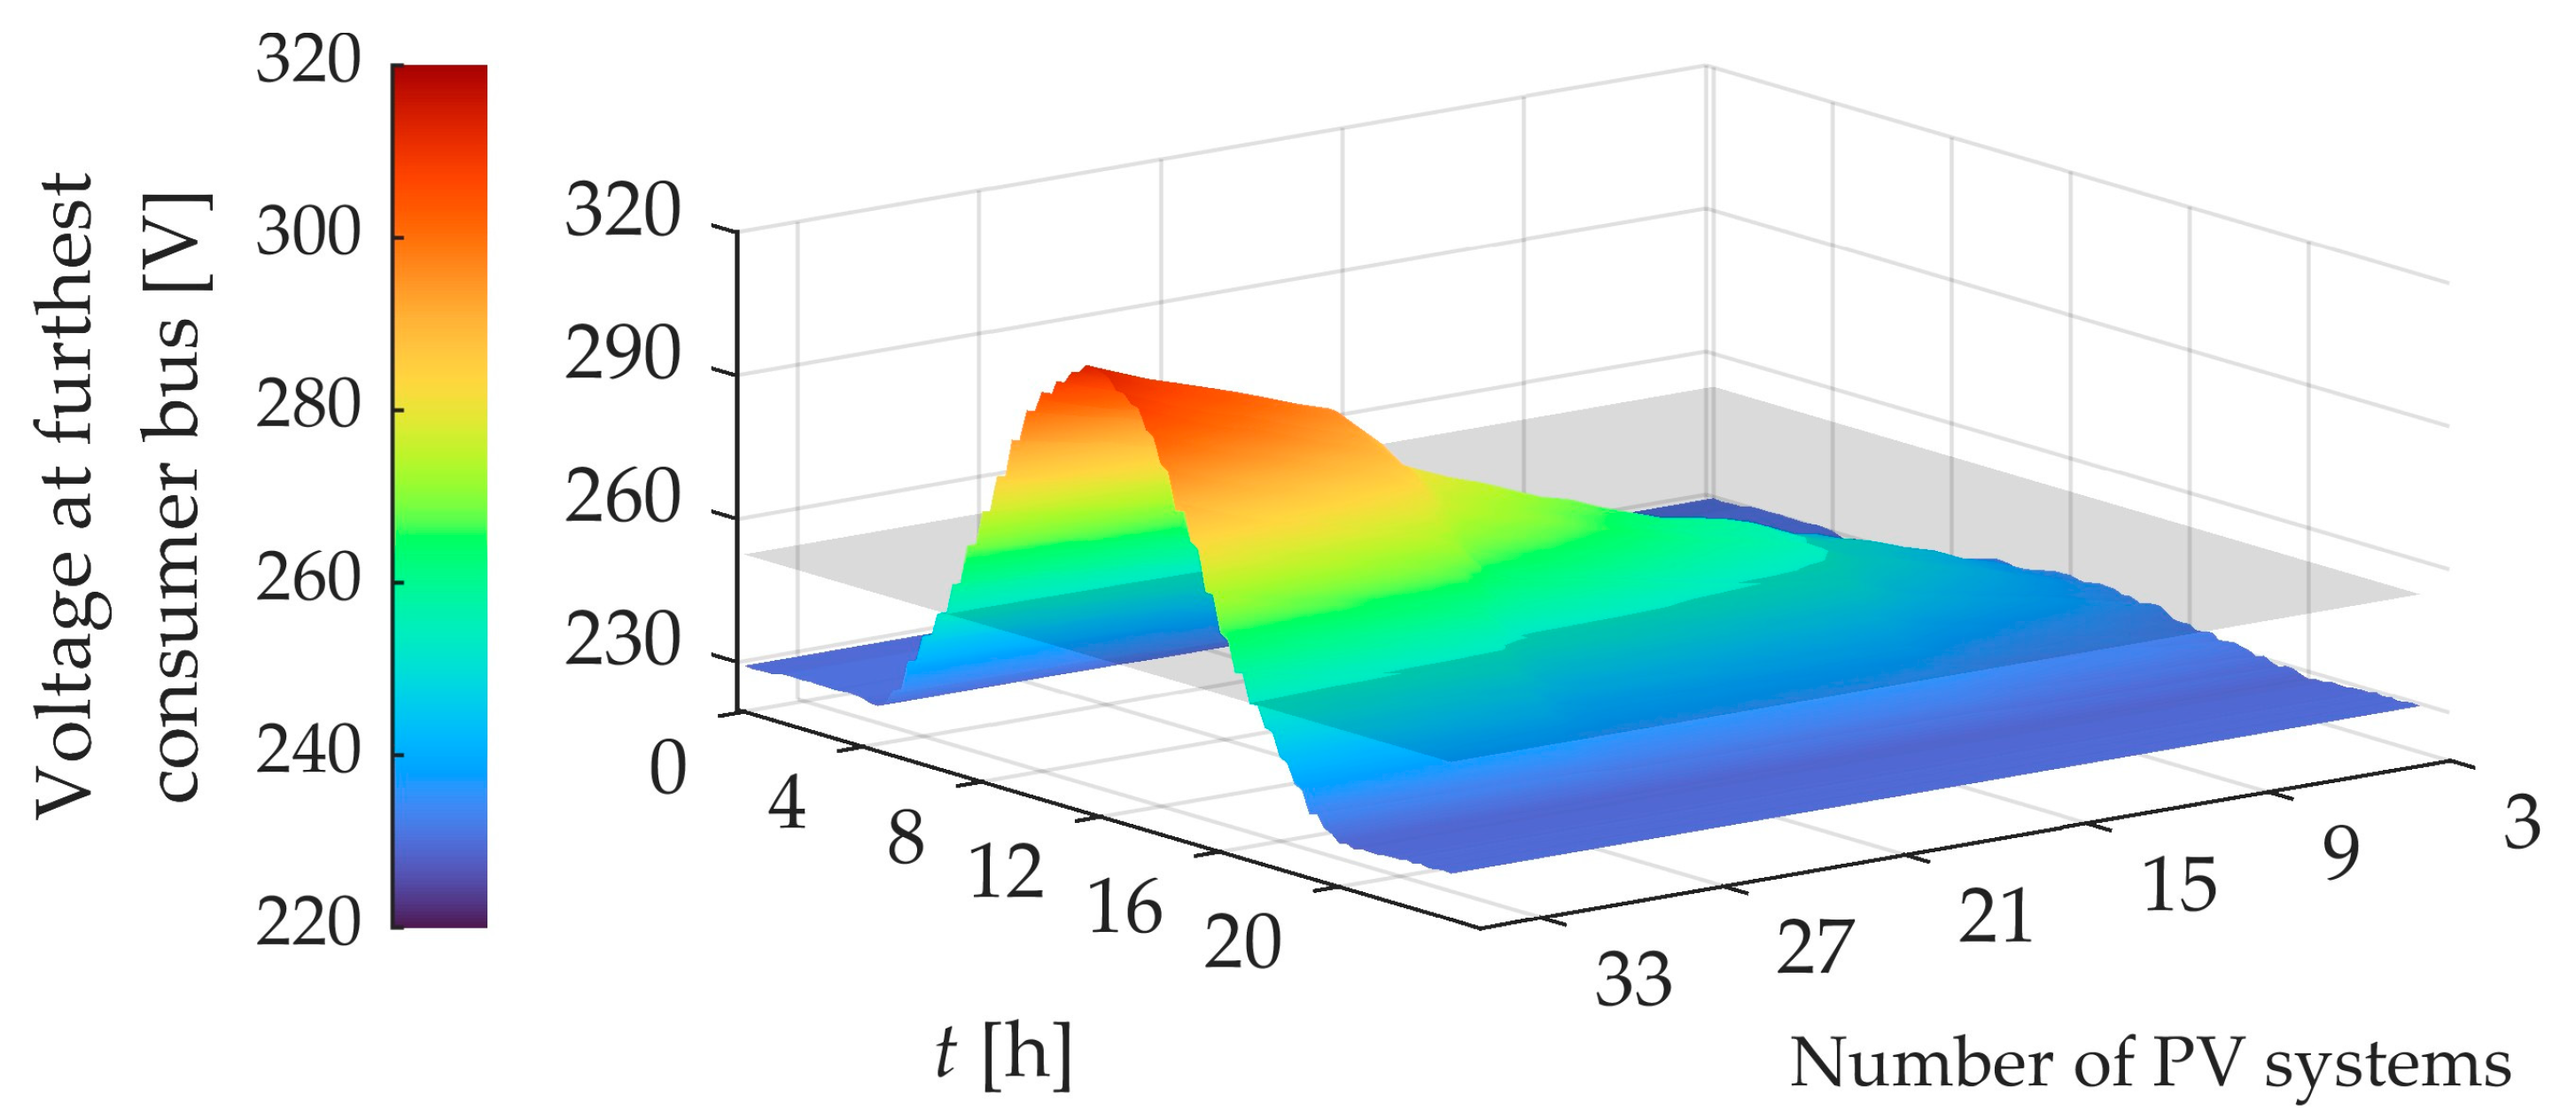
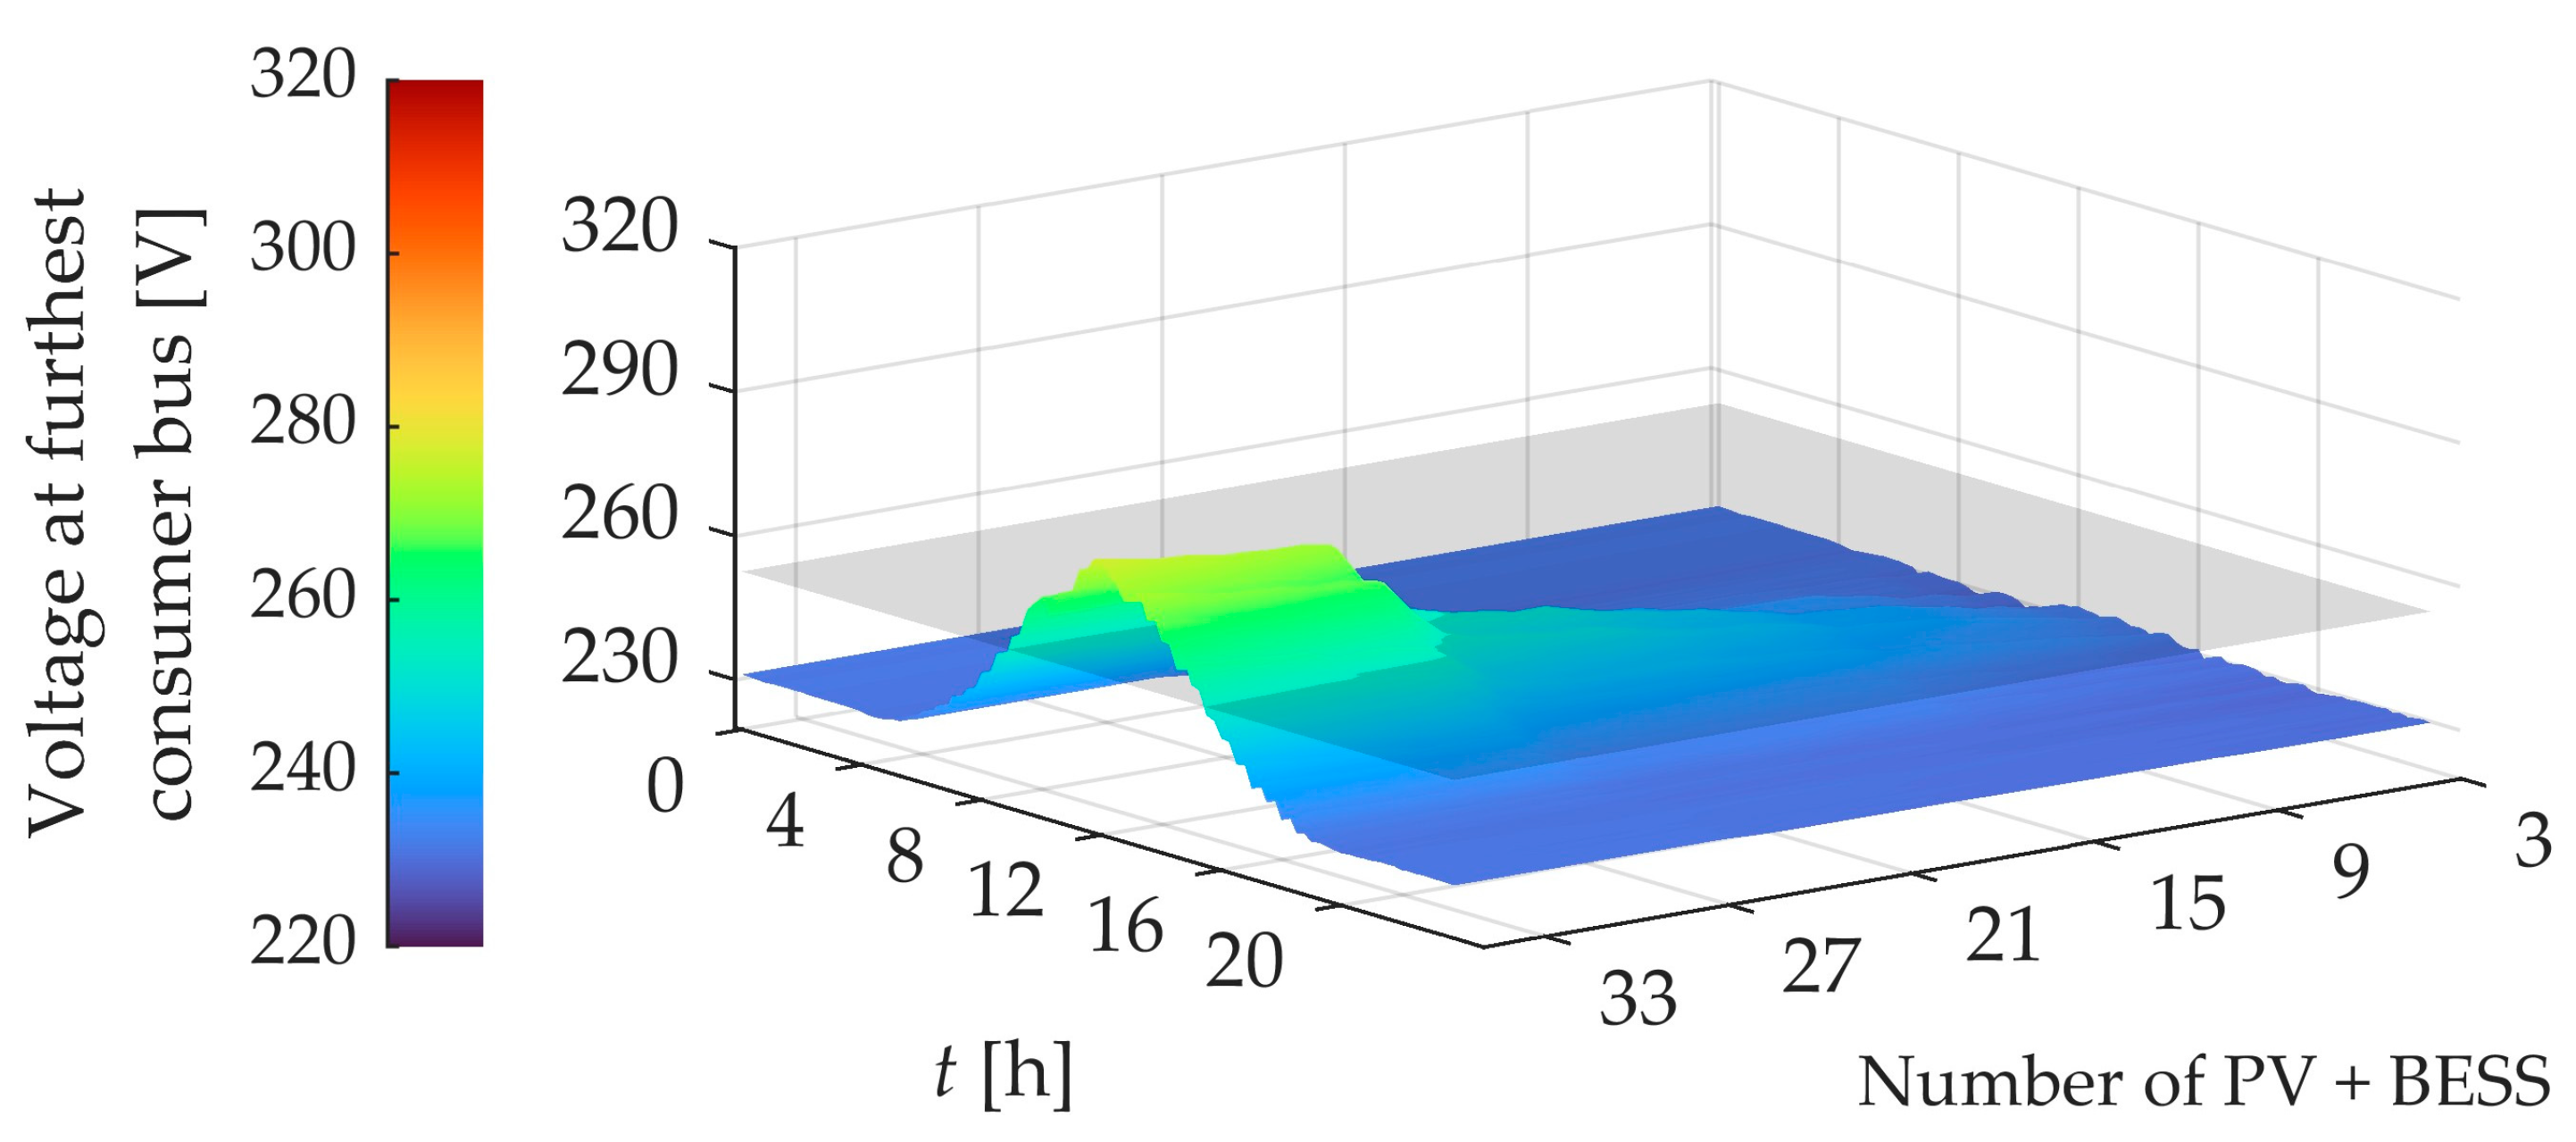
Additionally, daily power flow simulations were conducted, focusing solely on the voltage at the consumer bus located furthest from the transformer, as voltage issues were typically most pronounced at this location. PV systems were added to the network incrementally at random locations, starting from the original state, which included the three existing PV systems.
Figure 8 illustrates the daily voltage profiles at the observed consumer bus for various levels of PV penetration. It is evident that the voltage increased gradually, although the general shape of the profile remained consistent, as it was weather-dependent.
In general, the acceptable voltage range is represented by the blue spectrum on the graph, or lies below the grey surface, which indicates a 10% deviation from the nominal voltage value. The first significant deviations occurred when approximately nine PV systems were integrated into the network, which supports the findings shown in
Figure 4 further.
Next, the voltage at the furthest consumer bus was monitored after adding BESSs to the previously integrated PV systems.
Figure 9 illustrates the daily voltage profiles at the observed consumer bus for various levels of system penetration. The acceptable voltage conditions are generally represented within the blue spectrum or below the grey surface, which indicates a 10% deviation from the nominal voltage value. It is evident that the voltage was diminished successfully to some extent through the storage of electrical energy.
4. Discussion
A significant trend observed throughout the analysis was the increase in overvoltage occurrence at all the consumer buses as additional PV systems were added to the network. The real network already operated with three PV systems. When six additional PV systems were added, overvoltage occurred in 50% of the simulations, and, with ten added PV systems, overvoltage became inevitable in all the simulation scenarios. This suggests that exceeding 12 PV systems in the network would likely result in voltage issues, regardless of the systems’ placements. These findings underscore the importance of implementing strategies to mitigate voltage rise.
The integration of BESSs in conjunction with the PV systems delayed the onset of overvoltage. When BESSs were added to a network with nine PV systems initially, overvoltage did not occur until the network reached 15 PV systems. This effect was even more pronounced in networks starting with 13 PV systems. In this case, the integration of BESSs not only delayed the occurrence of overvoltage, but also reduced its overall probability, indicating that energy storage can play a critical role in mitigating voltage rise due to the intermittent nature of PV generation.
When PV systems were added to all eligible consumers in the network, the voltage rise became significantly more pronounced. At certain consumer buses, the voltage deviations exceeded 30%, demonstrating that adding PV systems across the network could potentially lead to substantial overvoltage issues, making this an unacceptable network configuration. However, when BESSs were also incorporated, the voltage deviations were reduced, although they remained around 20%. This suggests that, while BESSs can mitigate some of the voltage rise, their effectiveness is limited under high PV penetration. The primary factors contributing to this limitation are the BESS sizing, based on average household consumption, and their operational constraints, including the fixed 0.25 C-rate, which limits their ability to manage excess energy during peak generation periods. Future work should explore the sensitivity of system performance to different BESS sizing strategies and investigate more flexible operational parameters, which could reveal additional potential for overvoltage mitigation.
The analysis also focused on voltage behaviour at the furthest consumer bus from the transformer, where voltage issues are typically the most pronounced. The results showed that, as the number of PV systems increased, the voltage at this location rose gradually as well. The addition of BESSs provided some reduction in the voltage deviations. However, even with BESSs, the voltage remained above acceptable limits once the number of PV systems exceeded a certain threshold, reinforcing the necessity of managing PV system penetration carefully to avoid operational issues.
These findings suggest that DNOs must weigh the benefits of deploying BESSs against alternative solutions, such as traditional grid reinforcement or demand-side measures. While BESSs offer voltage regulation benefits, their effectiveness depends on sizing and control strategies, and their cost-effectiveness relative to grid upgrades remains a crucial consideration. In this context, demand response and dynamic pricing mechanisms could serve as complementary tools to BESSs. By incentivising consumers to shift their energy consumption periods, these strategies can help alleviate voltage rise without requiring significant infrastructural investments. Combined with BESSs, they offer a more flexible and potentially cost-effective solution for managing local voltage issues.
Although the simulations in this paper are based on a single LV feeder, the trends observed align with the general challenges typical of PV-rich residential areas. The selection of this feeder was motivated by the availability of detailed real-world data, including accurate household-level consumption, which enabled a highly realistic simulation framework. Nevertheless, we acknowledge that the generalisability of these results to other network configurations should be explored further. Future studies involving a broader set of feeder topologies and geographic locations are essential to confirm the applicability of these findings and refine the proposed methodology.
The authors acknowledge that the proposed method, which involves detailed time-series power flow simulations with a high temporal and spatial resolution, is computationally intensive. As such, it may not be directly scalable to very large distribution networks comprising hundreds of nodes without significant increases in computational resources or methodological adjustments. The presented approach is designed primarily to provide a detailed and realistic assessment of PV systems and BESSs’ performance in typical LV feeders. Nevertheless, the methodology could be adapted to larger networks by employing simplifications or approaches that balance accuracy and efficiency.


