Article

Effects of Defrost-Initiation Criteria and Orientations of an Outdoor Heat Exchanger on the Performance of an Automotive Reversible CO2 Heat Pump †

1
Air Conditioning and Refrigeration Center (ACRC), Department of Mechanical Science and Engineering, University of Illinois Urbana Champaign, Urbana, IL 61801, USA
2
School of Energy Science and Engineering, Central South University, Changsha 410083, China
*
Author to whom correspondence should be addressed.
Zhang, W.; Hrnjak, P. The effects of the orientation of outdoor microchannel heat exchanger on the performance of a transcritical R744 heat pump during frosting and defrosting. In Proceedings of the International Refrigeration and Air Conditioning Conference, West Lafayette, IN, USA, 10–14 July 2022.
Deceased 31 August 2022.
Energies 2025, 18(9), 2244; https://doi.org/10.3390/en18092244
Submission received: 17 March 2025 / Revised: 20 April 2025 / Accepted: 24 April 2025 / Published: 28 April 2025

Abstract

:
Heat pump (HP) technology has been widely adopted in electric vehicles (EVs) for cabin and battery heating in cold weather due to its high efficiency. However, when an HP works under low ambient temperatures and high humidity, frost grows on the surface of the outdoor evaporator, deteriorating system efficiency. This study experimentally investigated the performance of an automotive reversible CO2 HP system under cyclic frosting–defrosting conditions, with different defrost-initiation criteria and orientations of the outdoor heat exchanger. The relationship between the performance degradation of the heat pump system and the feature of frost accumulation on the outdoor heat exchanger is analyzed. The experimental data revealed that the heating capacity of the HP system only mildly degrades (~30%), even with an air-side pressure drop of the outdoor heat exchanger growing 10 times, which enables the system to work in HP mode for a longer time before the defrosting without significantly impacting passengers’ comfort. The horizontally installed outdoor heat exchanger is proven to have better refrigerant distribution, but with approximately a 0.16 bar (11.9%) higher pressure drop, reducing the evaporating temperature by about 0.4 K. Consequently, frost accumulates faster, and the working time in HP mode is shortened by 12 min (18.2%). Moreover, the vertical outdoor heat exchanger drains much more water during the defrosting. As a result, the defrosting time for the vertical outdoor heat exchanger is reduced by 17%.

1. Introduction

As more and more countries and regions announce bans on car-use internal combustion engines within a limited period, electric vehicles (EVs) have become increasingly important alternatives to conventional fuel cars. In most EVs, to maintain the proper cabin temperature and humidity, a reversible automobile air-conditioning system is usually used to provide cooling capacity in air-conditioning (AC) mode and heating capacity in heat pump (HP) mode. The reversible automobile air-conditioning system employing CO2 as the working fluid has advantages like high system efficiency and minimum environmental depletion, thus showing great potential in applications. However, when the reversible CO2 system works in HP mode in low temperatures (close to 0 °C) and high-ambient-humidity conditions, it faces frosting issues. In HP mode, the outdoor heat exchanger absorbs heat from the ambient air as an evaporator. When the surface temperature of the outdoor heat exchanger drops below the dew point of ambient air and the freezing point of water, water vapor condenses, and droplets freeze on the surface. Frost and ice block the airflow area, reduce the air flow rate, and add additional heat transfer resistance between air and evaporating refrigerant. As a result, the performance of the outdoor heat exchanger and system efficiency are deteriorated. Therefore, optimizing the HP system design and/or its control strategy is crucial to delay frost accumulation, extend the effective working time of HP mode, improve meltwater drainage, and maximize system efficiency.
Modifying the HP system design to delay or avoid frosting on the outdoor heat exchanger is one of the main research directions to alleviate the frosting–defrosting issue. Mei et al. [1] proposed a new system design by adding a resistance heater in the accumulator of a two-ton residential heat pump to retard frost accumulation. The operating conditions included an outdoor ambient temperature of 0.6 °C to 5 °C and 75% relative humidity. The data showed that by using this method, the suction temperature of the refrigerant was lifted by several degrees, and the frequency of the frosting–defrosting cycle could be reduced by a factor of 5. However, Mei et al. [1] also mentioned this method could not prevent frost accumulation when the ambient temperature is below 0 °C, which is often encountered for a residential or automotive HP system. Cernicin et al. [2] reported that adding an internal heat exchanger (IHX) to a transcritical CO2 HP could lift the evaporating temperature by up to 2.3 K under 0 °C outdoor air temperature. The efficiency of the HP system with IHX was also higher than without IHX by up to 11.6%. More research has focused on outdoor heat exchangers. Xu et al. [3] analyzed the transient performance of a microchannel outdoor heat exchanger under frosting and defrosting cycles with horizontally and vertically oriented flat tubes. Their results implied that the vertically oriented tubes had better water drainage performance, and the capacity showed a similar change in five continuous cycles. In contrast, the system capacity at the beginning of the fifth cycle was 27% lower than the first for the horizontally oriented tubes. Xu et al. [3] also observed that the working time of HP mode is shorter for horizontally oriented tubes (26 min) than the vertically oriented ones (38 min) in the first frosting cycle. The experimental data in Park et al. [4] showed that introducing a 20% gradual decrease in the louver pin pitch along the incoming air flow direction significantly delayed frost accumulation and thus improved thermal performance. More recently, Mahvi et al. [5] found that the superhydrophobic surface of a louvered fin helped prevent frost formation and heat transfer rate degradation in microchannel evaporators of a transcritical CO2 heat pump. However, such effects decayed over time due to water retention and incomplete defrosting. Westhaeuser et al. [6] concluded through their experiments that a larger fin pitch of 1.4 mm prolongs the frosting process up to 36% compared to a fin pitch of 1.15 mm. Moreover, an increase in heat exchanger depth from 28 mm to 34 mm also slows the frosting process by 26%.
In addition to delaying frost, various active defrost methods, such as electrical resistance heating, reversed cycle defrosting, and hot gas bypass defrosting, have also drawn great attention. Among these defrost methods, reversed cycle defrosting is widely used due to its high defrosting speed and energy efficiency [7]. In reversed cycle defrosting, the initiation criterion plays a significant role. Typically, a certain parameter of the HP system is monitored during operation, and when it reaches a threshold value, the defrosting starts. Various operating parameters have been chosen: the operating time in HP mode [8], the temperature difference between the evaporator surface and inlet air [9,10], the air-side pressure drop across the outdoor heat exchanger [3,5,11,12], the degree of superheat [13,14], the air discharge temperature of the outdoor or indoor heat exchanger [15,16], and the power of the outdoor exchanger fan [17]. Moreover, some advanced sensors, such as capacitance or photoelectric sensors, were also applied to monitor frost growth and determine the initiation time point of defrosting [18,19,20]. Instead of directly using the monitored parameters, more recently, researchers proposed some comprehensive index for initiating defrosting. Yoo et al. [21] calculated the frost volume and determined the defrost start time. A loss coefficient was proposed by Wang et al. [22] based on the nominal output heating energy and used to optimize the defrosting initiation time point by searching its minimum. A convolutional neural network was used to relate the appropriate defrost initiation time point to the HP system’s internal operating parameters in [23]. Specifically for EV applications, Wang et al. [24] considered the constant heating demand of the vehicle instead of the conventional constant compressor speed setting and came up with a novel defrosting control strategy that combined the discharge temperature, the suction temperature, and operating time so that the thermal comfort of the cabin was guaranteed.
Though extensive studies have been dedicated to the defrosting initiation criterion of HP systems, most existing works only focused on one single frosting–defrosting period and neglected the impact of the cyclic frosting–defrosting conditions. The melted frost and retained water on the outdoor heat exchangers by the end of the last cycle significantly influence the next cycle’s system performance and frosting–defrosting behaviors. Moreover, different system designs, especially the outdoor heat exchanger designs, interact with different defrosting initiation criteria and comprehensively determine the cyclic frosting–defrosting behaviors of the outdoor heat exchanger and the entire system. Therefore, there have been gaps between the existing studies and the optimized defrost-initiation criterion and system design that can maximize the efficiency of HP systems and maintain certain heating capacities in periodic frosting–defrosting cycles.
The objective of this study was to analyze the effects of two different defrost-initiation criteria, namely the air-side pressure drop of the outdoor heat exchanger (DPea) growing 5 or 10 times on the performance of a reversible automotive CO2 heat pump system under cyclic frosting–defrosting conditions. In addition, the impacts of the orientation of the outdoor heat exchanger were also explored. The results in this article provide physical insights into the frosting–defrosting behaviors of a heat pump system and could help in system optimization. This article is a revised and expanded version of a paper titled “The effects of the orientation of outdoor microchannel heat exchanger on the performance of a transcritical R744 heat pump during frosting and defrosting” [25], which was presented at the International Refrigeration and Air Conditioning Conference, West Lafayette, IN, USA, 10–14 July 2022.

2. Experimental Approach

This study is a follow-up of our previous work, Zhang et al. [26], in which the effects of the operating conditions on a reversible automotive CO2 HP system were investigated. This paper focuses more on the defrost-initiation criteria and the outdoor heat exchanger orientations, and uses a similar experimental facility and approach as the previous one.

2.1. Facility and Instrumentation

Figure 1 presents the experimental facility in two different working modes: HP and defrosting. Specifications of the key components in the system can be found in our previous work [26]. Sensors are installed to monitor the system behavior, and their ranges and uncertainties are given in Table 1. Adjusting the six ball valves in the refrigerant loop allows the system to switch between the two working modes by reversing the cycle. In addition, Figure 2 shows the microchannel outdoor heat exchangers used in this study, installed vertically and horizontally. It has one slab and two passes with 17 and 34 tubes in each pass. The overall dimension of the outdoor heat exchanger is 635 mm × 467 mm× 16 mm. The flow direction of the refrigerant in HP and defrost modes, as well as that of the air flow, is also given in the figure.

2.2. Experimental Procedure and Data Reduction

Each experiment in this study was conducted in four steps: (1) preconditioning the indoor/outdoor chambers; (2) system running in HP/frosting mode; (3) system running in defrosting mode; and (4) meltwater collection. Detailed descriptions of the procedures were given in our previous work [26]. Table 2 lists the experimental conditions of this study. It has been demonstrated in [26] that from the maximum working time in HP mode, 0 °C ambient temperature (Teai) and 90% relative humidity (RH) is the most challenging condition for an automotive HP system, and thus was employed here. Other operating parameters, such as the initial air velocity of the outdoor heat exchanger (Veai,ini) and the air flow rate of the indoor heat exchanger (Ucai), were set to reproduce the typical driving condition of vehicles. Two defrost-initiation criteria were tested in this study: air-side pressure drop of the outdoor heat exchanger growing to 5 times its initial value (5 × DPea,ini)or 10 times (10 × DPea,ini).
The air-side enthalpy change represents the cooling capacity of the outdoor evaporator in HP mode:
Q ˙ c o o l i n g = m ˙ e a i , d r y × ( h e a i h e a o )
m ˙ and h in Equation (1) represent mass flow rate and specific enthalpy. The subscripted “ e a i ” and “ e a o ” denote the air inlet/outlet of the evaporator.
The heating capacity provided by the indoor gas cooler in HP mode was based on the enthalpy changes of air and refrigerant:
Q ˙ h e a t i n g , a = m ˙ c a i , d r y × ( h c a o h c a i )
Q ˙ h e a t i n g , r = ( 1 O C R ) × m ˙ r × ( h c r i h c r o ) + O C R × m ˙ r × ( h c o i h c o o )
Q ˙ h e a t i n g = ( Q ˙ h e a t i n g , a + Q ˙ h e a t i n g , r ) / 2
The subscripted “ c a i ” and “ c a o ” in Equation (2) denote the air inlet/outlet of the gas cooler, and “ c r i ”, “ c r o ” in Equation (3) represent the refrigerant inlet/outlet of the gas cooler. In addition, “ c o i ” and “ c o o ” in Equation (3) mean the lubricant oil at the refrigerant inlet/outlet of the gas cooler. Equation (3) considered the contribution of the lubricant oil to the refrigerant-side heating capacity. In the tested system, OCR (oil circulation rate) was measured at around 2%. The discrepancy between the air-side and refrigerant-side heating capacities was below 3% in the first frosting period. In later frosting periods, the discrepancy increased to 9.4% at the beginning because the cycle was just reversed, but it dropped quickly to below 3%.
The system efficiency in HP mode (COPhp) is then given by:
C O P h p = Q ˙ h e a t i n g W ˙ c o m p = Q ˙ h e a t i n g Q ˙ h e a t i n g Q ˙ c o o l i n g
It is worth pointing out that the compressor work measured by the wattmeter includes all kinds of losses, making it slightly different from the value of Q ˙ h e a t i n g Q ˙ c o o l i n g . To maintain the energy balance relationship, Q ˙ h e a t i n g Q ˙ c o o l i n g is used to calculate C O P h p .
Based on the method in Moffat [27], the uncertainties of the outdoor cooling capacity and indoor heating capacity were 5.1% and 2.1%, respectively.
In addition, the frost formed during each frosting period and the meltwater generated during each defrosting period were also quantified. The total frost formation on the outdoor heat exchanger in one frosting period, Mfrost, was estimated by:
M f r o s t = 0 t f r o s t i n g m ˙ e a i , d r y ( ω e a i ω e a o ) d t
In Equation (6), ω is the humidity ratio of the air flow. The meltwater generation during one defrosting period included the water drained from the outdoor evaporator (Mdrained), the water retained on the evaporator (Mretained), and the water vaporized (Mvaporized). Each part of the meltwater was collected and quantified after the defrosting was terminated. Details of the collection and quantification procedure can be found in [26].

3. Results and Discussion

3.1. Effects of Different Defrost-Initiation Criteria

3.1.1. Effects of Defrost-Initiation Criterion on CO2 HP System Performance

Figure 3 shows the CO2 HP system performance with different defrost-initiation criteria (5 or 10 × DPea,ini) under the 0 °C and 90% RH condition. In addition, the transient frost accumulation is also quantified in the figure. Similarly, the scenarios with ambient temperature at −5 °C and −10 °C are in Figure 4 and Figure 5.
(1)
In the first frosting period
It could be anticipated that with a delayed defrost initiation, the system could work in HP mode for a longer period and more frost would accumulate on the evaporator surface, thus deteriorating system performance. Figure 3a shows that with 0 °C ambient temperature, the heating capacity Q ˙ h e a t i n g decreases from the peak value of 4.843 to 4.552 kW (6.1%) in the first frosting period with 5 × DPea,ini criterion, while it drops to 3.135 kW (36.0%) with 10 × DPea,ini criterion. Similarly, the cooling capacity Q ˙ c o o l i n g decreases by 53.4% and 86.2% in the first frosting period with 5 and 10 × DPea,ini as the defrost-initiation criterion. As Figure 3b shows, COPhp drops about 40% regardless of which defrost-initiation criterion is used. However, the working time in HP mode (or frosting time) of the first cycle, tfrosting, increases significantly from 32 to 68 min when the criterion changes from 5 to 10 × DPea,ini.
In the first frosting cycle of −5 °C outdoor temperature, as Figure 4a,b demonstrate, compared to the peak values, Q ˙ h e a t i n g , Q ˙ c o o l i n g , and COPhp decrease by 7.3%, 46.6%, and 32.2% with 5 × DPea,ini criterion, and they drop by 31.1%, 83.8%, and 39.8% with 10 × DPea,ini criterion. The working time in HP mode of the first cycle tfrosting almost triples from 34 to 94 min when switching to 10 × DPea,ini criterion.
When the outdoor ambient temperature drops to −10 °C, as Figure 5a,b indicate, the reductions in Q ˙ h e a t i n g , Q ˙ c o o l i n g and COPhp are 9.4%, 31.9%, and 19.3% with 5 × DPea,ini criterion, while with 10 × DPea,ini criterion, they increase to 28.2%, 69.9%, and 33.2%, respectively. The working time in HP mode of the first cycle tfrosting almost doubles from 108 to 198 min.
It is worth pointing out that the absolute frosting time difference between the two defrost-initiation criteria expands with lower ambient temperature. This could be due to two factors. (1) With the ambient temperature drops from 0 to −10 °C, the humidity ratio decreases from 3.4 to 1.4 g water per kg dry air, even though the relative humidity is constant (90%). That causes a significant reduction in the frost accumulating speed with low ambient temperature, and consequently the absolute frosting time difference between the two criteria increases. (2) In the early phase of frosting, the frost grows in both the planar direction (parallel to the evaporator frontal surface) and thickness direction (perpendicular to the evaporator frontal area) and the frost accumulates at almost the maximum speed. In the later phase, the frost barely expands in the planar direction and has a lower accumulation speed. This can be verified by the frosting images below. This further increases the absolute frosting time difference between the two criteria.
Under all conditions, the relative reductions in Q ˙ h e a t i n g are always smaller than those in Q ˙ c o o l i n g . This is because the accumulated frost directly worsens the heat transfer of the outdoor evaporator ( Q ˙ c o o l i n g ), while the influence on the indoor condenser ( Q ˙ h e a t i n g ) is exerted through the reduced refrigerant mass flow rate m ˙ r, which is the result of smaller refrigerant density ρcpri at the compressor suction line when the evaporating pressure decreases. Moreover, the cooling capacity Q ˙ c o o l i n g drops almost at a constant speed during the frosting period, while the heating capacity Q ˙ h e a t i n g stays relatively stable in the early stage and drops faster later. This is most likely because the Acc holds extra refrigerant at the early stage of the frosting period, but gets flooded later and cannot maintain the refrigerant state at the suction line.
Figure 6 plots the shift in the T-h diagram of the CO2 HP cycle in the first frosting period with different ambient temperatures. Key operating parameters are also listed on the plots. It can be observed from Figure 6 that the cycle does not change too much from the beginning (green line) to the time point that DPea increases five times (blue dashed–dotted line). Such an observation agrees with the fact that the heating performance of the HP system ( Q ˙ h e a t i n g and COPhp) only slightly degrades in the first frosting period with 5 × DPea,ini criterion. The major difference between the cycles at the beginning and when DPea increases five times is that as the frost grows on the outdoor evaporator and the cooling capacity drops, the refrigerant vapor quality at the evaporator exit xero decreases by 0.1–0.15. However, the vapor quality at the Acc exit xacc,ro stays almost the same, which indicates the liquid refrigerant migrates into the Acc. Therefore, the Acc holds the extra refrigerant due to frosting while the IHX keeps the suction superheat, and thus the discharge temperature Tcpro is almost constant when DPea increases five times under all three conditions. However, as the frost continues growing and densifying on the surface of the outdoor evaporator, the evaporating pressure and the cooling capacity further decrease. The Acc is completely flooded when DPea increases 10 times (purple dashed line in Figure 6). xero and xacc,ro drop by about 0.4 and 0.3 under the three conditions from the beginning to the time point when 10 × DPea,ini criterion is reached. The pressure and temperature at the compressor suction line decrease, so the mass flow rate m ˙ r drops with the reduced refrigerant density ρcpri at the inlet of the compressor. The discharge pressure pcpro also drops below the critical pressure of CO2 and the heating capacity drops significantly.
(2)
In the re-frosting periods
At the beginning of the second/third frosting periods, the system is establishing the pressure balance, and the thermal inertia of the two heat exchangers makes the heating and cooling capacities start at low values. That explains some outlier points in COPhp, as seen in Figure 3b. Therefore, in the re-frosting periods, the performance degradations, given in percentages in Figure 3, Figure 4 and Figure 5, are calculated based on the peak values instead of the initial values. Similar to the first frosting period, Q ˙ h e a t i n g slightly drops (less than 6%) during the second and third frosting periods if using a 5 × DPea,ini criterion (Figure 3a,b), while the heating capacity degradation of the HP system is much more significant if using a 10 × DPea,ini criterion. Similar results are obtained in the tests with the outdoor temperature at −5 °C (Figure 4a,b). Due to the limitation in the cooling load of the environmental chamber, only one frosting–defrosting cycle is examined in this study with the outdoor ambient at −10 °C (Figure 5). Moreover, it also can be seen from Figure 3a that the peak heating capacity Q ˙ h e a t i n g reduces from the first to the third frosting period by 1.7% and 2.5% with 5 and 10 × DPea,ini criteria, under 0 °C outdoor temperature. The reductions in the peak Q ˙ h e a t i n g under −5 °C outdoor temperature are 2.5% and 0.7% for the two different defrost-initiation criteria. The negligible differences in the peak Q ˙ h e a t i n g among different frosting periods indicate that the current defrost termination criterion (refrigerant exit temperature from the outdoor heat exchanger reaches 45 °C) is effective in recovering the heating performance of the HP system for both defrost-initiation criteria.
However, in the case of 0 °C outdoor temperature, the peak cooling capacity of the outdoor evaporator Q ˙ c o o l i n g decreases from the first to the third frosting period by 24.9% and 13.1% when using 5 and 10 × DPea,ini criteria, respectively. Figure 7 gives the working time of each frosting period tfrosting and defrosting period tdefrosting with the two defrost initiation criteria under various outdoor conditions. According to Figure 7, when the outdoor temperature is 0 °C, if using 5 and 10 × DPea,ini criteria, the frosting period tfrosting reduces from the first to the third frosting period by 8 and 26 min, respectively. A similar trend has been observed in the case of −5 °C outdoor temperature. This indicates that the incomplete water removal could lead to reduced working time tfrosting under all conditions. In addition, it is also clear in Figure 7 that at 0 °C outdoor temperature, it takes 1.7, 2.3, and 2.5 min to defrost the outdoor heat exchanger for the three continuous cycles using the 5 × DPea,ini criterion. When using the 10 × DPea,ini criterion, tdefrosting becomes 2.5 and 4.0 min for the two continuous cycles. Similar trends can be observed in the case of −5 °C outdoor temperature. The increasing defrosting time tdefrosting reveals that the retained water from the previous cycle degrades the defrosting efficiency of the next one.
Overall, the heating capacity of the CO2 HP system drops less than 10% during each frosting period if using the 5 × DPea,ini criterion under all the experimental conditions, while the heating capacity drops by about 30% during each frosting period if using the 10 × DPea,ini criterion. The working-time averaged heating performance reduction is even lower than the aforementioned values. In the winter, providing sufficient heating capacity is the first priority of an automobile HP system. Therefore, even with the noticeable decreases in efficiency, the mild heating performance degradations indicate the HP system has the potential to work in HP mode for a longer period. However, the optimal defrost initiation criterion is still open to discussion. The advantage of a longer working time in HP mode is that it allows defrosting the outdoor heat exchanger using indoor thermal energy when the EV is parked and no passenger is inside. By doing so, the residual heat in the cabin can be utilized for defrosting without impacting the passengers’ thermal comfort. Moreover, prolonging the working time can significantly reduce the percentage of defrosting time over the entire working time and potentially improve the overall system efficiency.

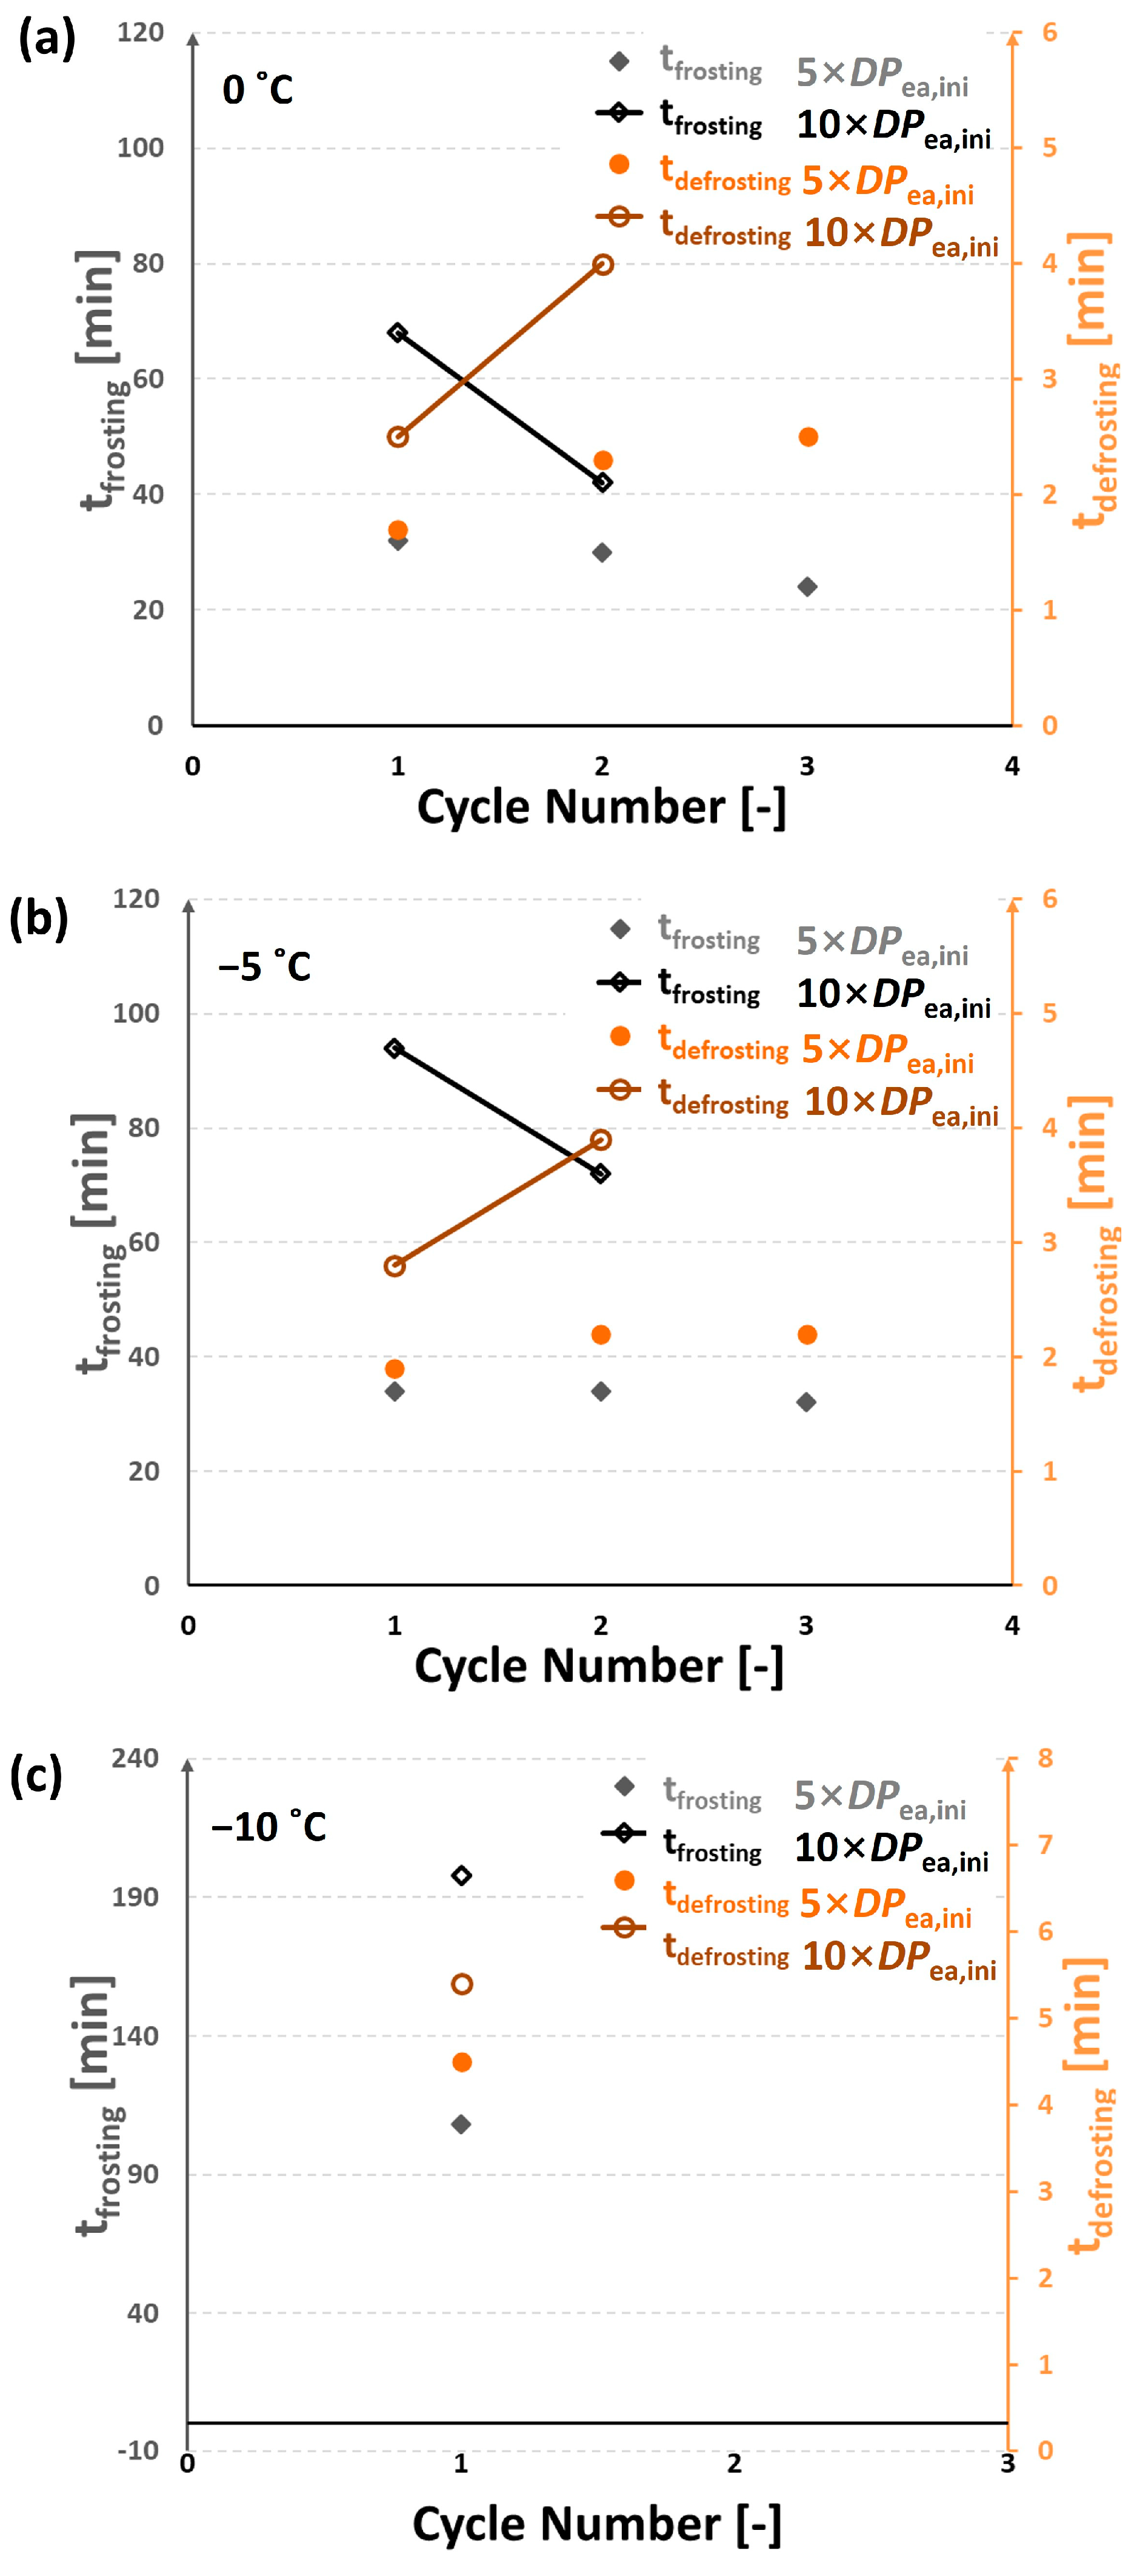
3.1.2. Effects of Defrost-Initiation Criterion on the Frosting and Defrosting Behaviors

(1)
In the first frosting period
Figure 8 shows frost distribution on the surface of the outdoor evaporator in the middle of (the 20th minute) and at the end of the first frosting period with 5 and 10 × DPea,ini defrost-initiation criteria. As shown in the left column in Figure 8, frost tends to form on the top of the second pass of the evaporator. This might be because in this area, the vapor quality of the refrigerant is moderate and the air flow is constrained by the intermediate header and thus the ratio between the thermal resistance of the air side and refrigerant side is relatively large, which makes the surface temperature close to the refrigerant saturated temperature and moisture in the air is more likely to condense and freeze nearby. Then, frost expands downstream along the microchannel tubes in the second pass. It is also worth mentioning that the frost distribution on the outdoor evaporator is not uniform, especially on the second pass. Frost is observed to concentrate on the middle channels of the second pass, while the channels near the two ends, especially near the rear end, are covered with less frost. Moreover, the uneven distribution of frost reveals the maldistribution of liquid refrigerant in the evaporator. In addition, because the evaporation heat transfer coefficient reaches its maximum at a relatively small vapor quality, the surface temperature is lower upstream than downstream of the second pass, making the frost thicker at the top.
Table 3 lists Mfrost, Mretained, Mdrained, and Mvaporized under all test conditions. By the end of the first frosting period, it accumulates 0.426 and 0.520 kg of frost under 0 °C outdoor temperature with 5 and 10 × DPea,ini criteria, respectively. As a result, the time required for defrosting tdefrosting is longer and the mass of drained water (Mdrained) and that of retained water (Mretained) are both higher with 10 × DPea,ini criterion. However, more water is vaporized in the first defrosting period with 5 × DPea,ini criterion because the smaller thermal resistance of the frost/water film increases the kinetic energy of the water molecules on the air–water interface. Similar results are obtained in the cases of −5 and −10 °C outdoor temperatures.
In summary, when DPea reaches five times its initial value, the frost grows in both a planar direction (parallel to the evaporator frontal surface) and thickness direction (perpendicular to the evaporator frontal area) and accumulates at almost the maximum speed, and more water vaporizes during the defrosting period afterward. When DPea reaches 10 times the initial value, the frost barely expands in the planar direction, and more water is retained on the outdoor evaporator after the defrosting period.
(2)
In the re-frosting periods
Figure 9 presents frost distribution on the surface of the outdoor evaporator at the beginning of (the 1st minute), and the end of the second frosting period with different defrost-initiation criteria. The leftmost zoomed-in images in Figure 9 clearly show that at the beginning of the second frosting period, the meltwater generated during the last defrosting period has not been completely drained or evaporated and is retained between the microchannel tubes and fins. Moreover, the retained water turns into transparent ice, which forms the “dark grooves” in contrast to the white frost-covered background in the zoomed frost images at the end of the second frosting period (right column of Figure 9). In addition, more retained water/ice is observed in the case of 0 °C outdoor temperature than in the case of −5 °C outdoor temperature, which supports the measurement in Table 3.
Reexamining the results in Figure 3 and combing the frost images in Figure 9, Figure 3b shows that compared to the first frosting period, the initial pressure drop of airflow DPea,ini of the second frosting period increases from 43.7 to 56.2 Pa (5 × DPea,ini criterion) and 58.0 Pa (10 × DPea,ini criterion) under 0 °C outdoor temperature. Similar results can be observed under −5 °C outdoor temperature (Figure 4b). The increased air-side pressure drop at the beginning of each frosting period verifies that a certain amount of water remains on the outdoor evaporator after defrosting, as shown in Figure 9.
The water removal during the defrosting period (MfrostMretained) is denoted by the long blue dashed lines in Figure 3c, 4c and 5c. The water removal is the combination of water drainage and vaporization. It is clear in Figure 3c that under 0 °C outdoor temperature, if the 5 × DPea,ini criterion is adapted, Mretained increases as the first two frosting–defrosting cycles proceed and stabilizes at about 0.3 kg in the third cycle (Figure 3c). However, if the 10 × DPea,ini criterion is adapted, Mretained keeps almost constant for the first two cycles. It is also interesting to see that even though the frost accumulation during the frosting period Mfrost with the 10 × DPea,ini criterion is clearly larger than that with the 5 × DPea,ini criterion, the stabilized water retention Mretained is almost the same for the two defrost-initiation criteria. This could be attributed to the longer defrosting time with the 10 × DPea,ini criterion, as Figure 7 shows. A similar trend can be seen under −5 °C outdoor temperature, though Mretained stabilizes at 0.25 kg in this case (Figure 4c).

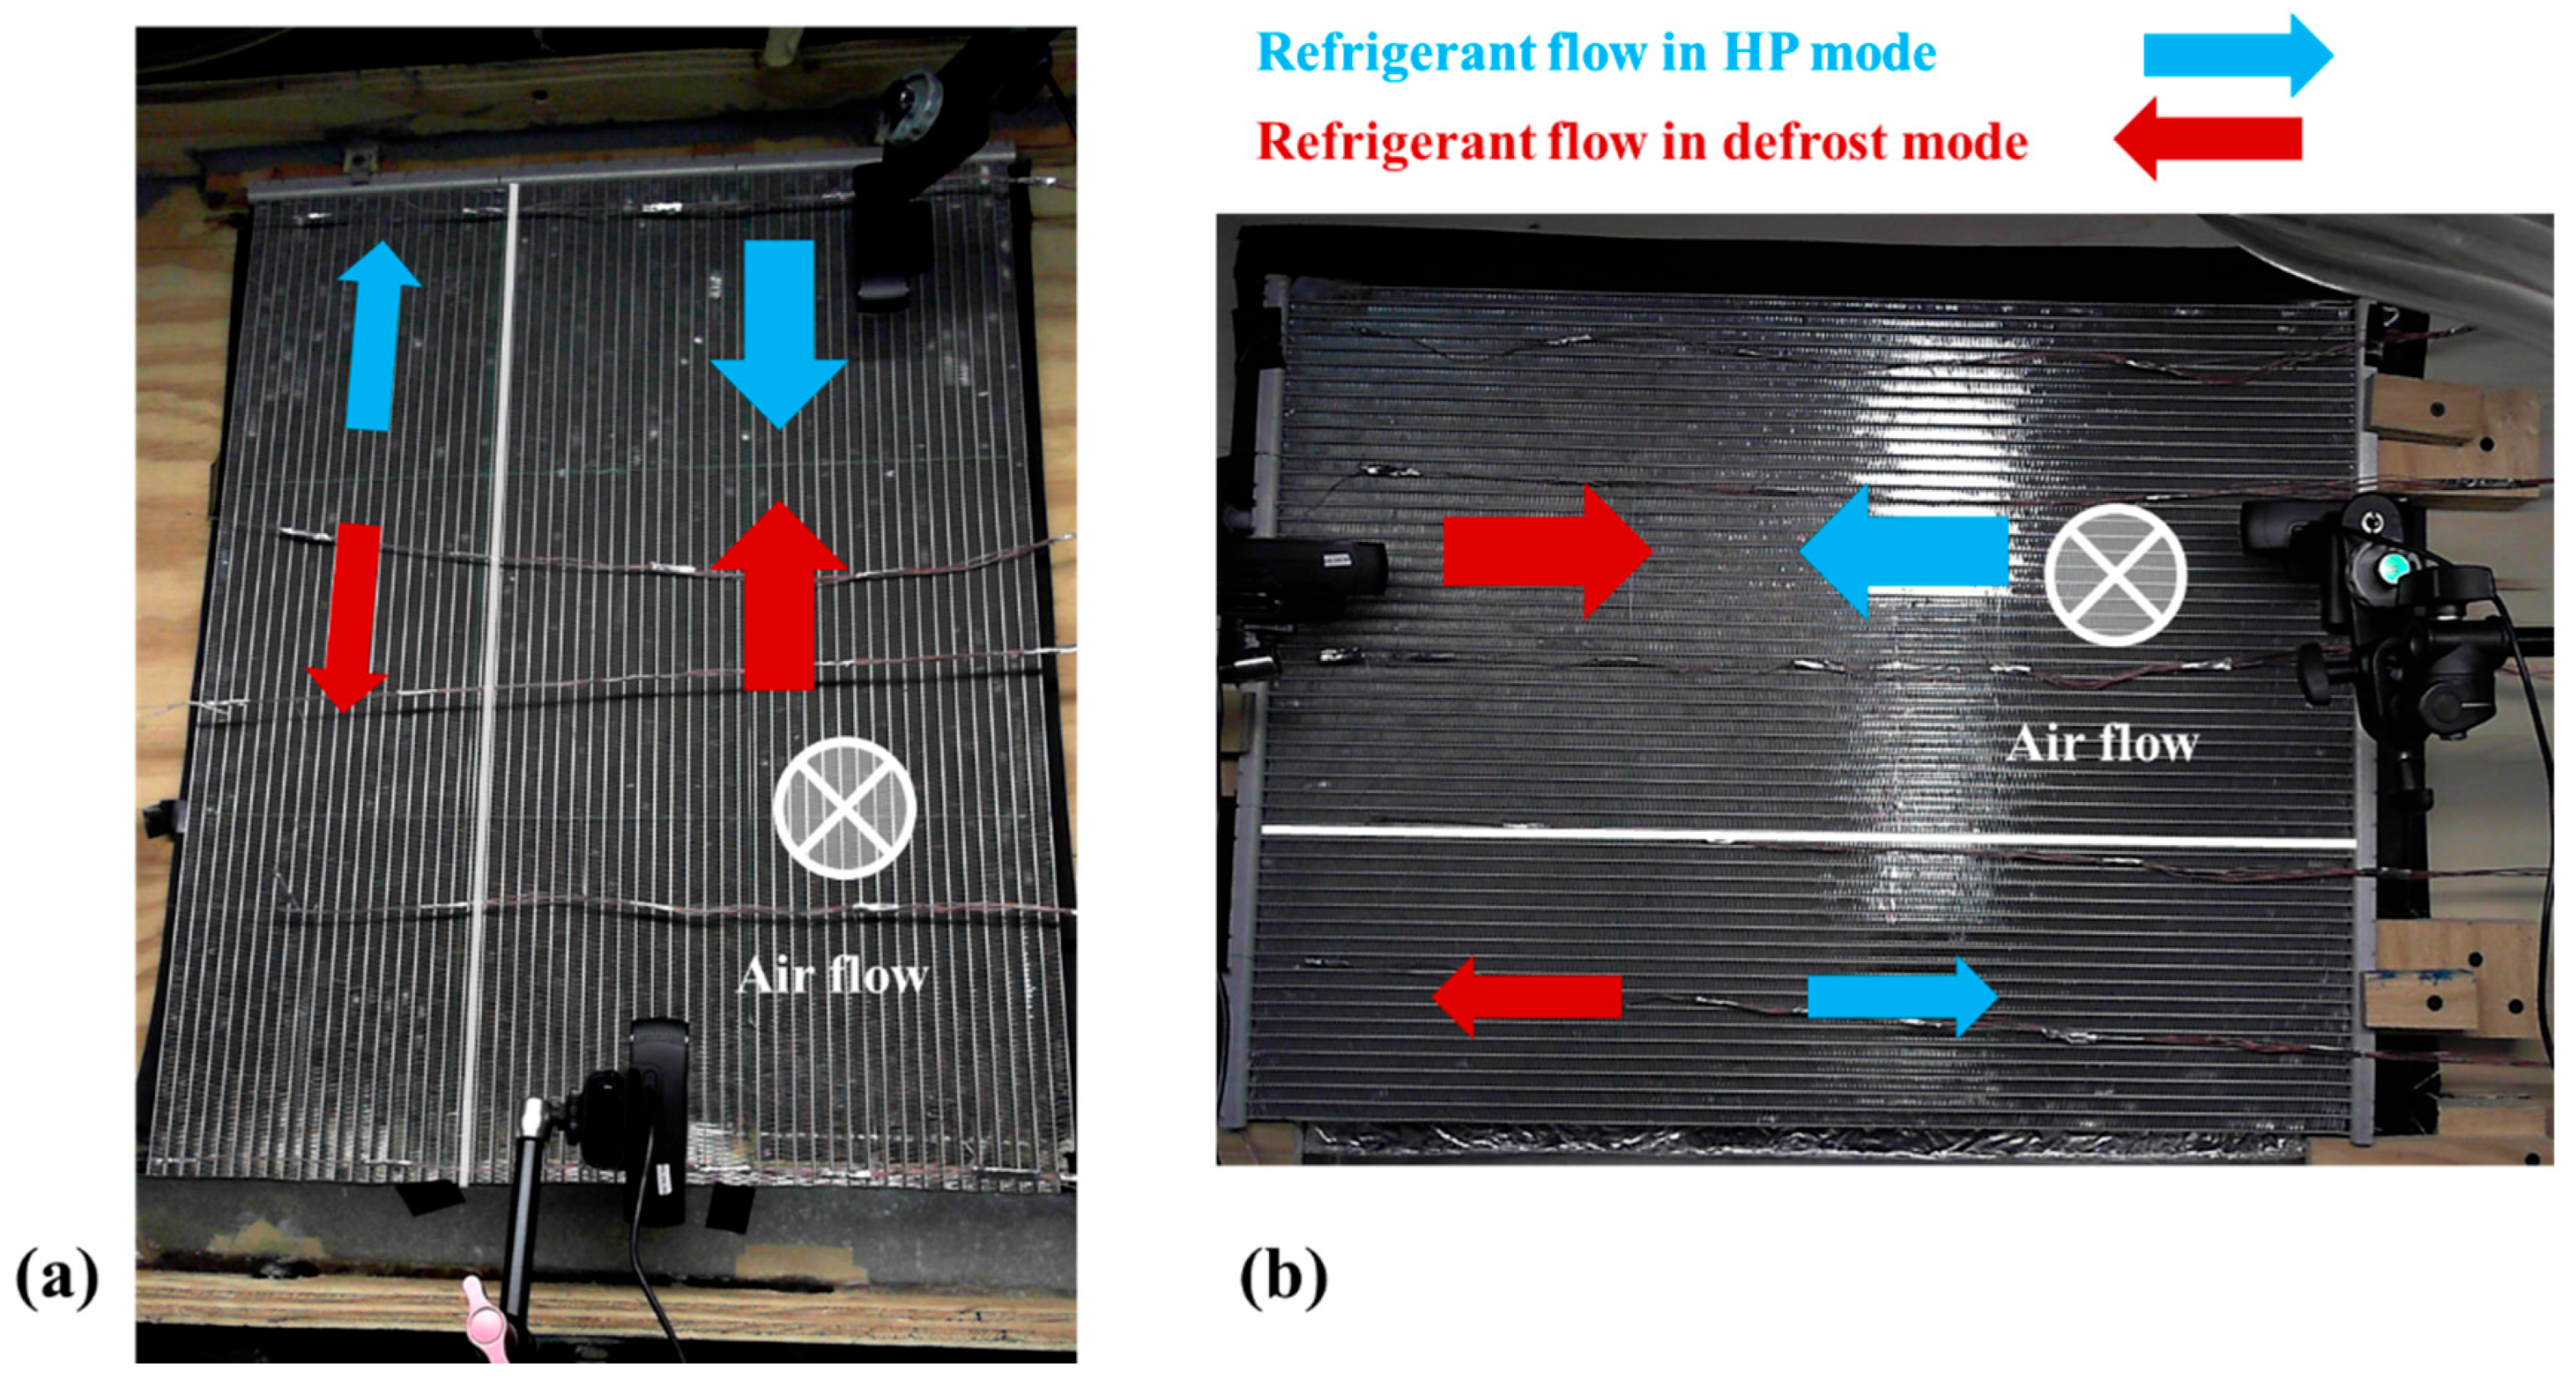
3.2. Effects of Outdoor Heat Exchanger Orientation

The effects of the outdoor heat exchanger orientation are explored under the 0 °C and 90% RH ambient condition with 10 × DPea,ini as the defrost-initiation criterion. The results are given in Figure 10.

3.2.1. Effects of the Outdoor Heat Exchanger Orientation on CO2 HP System Performance

It can be seen from Figure 10 that in the first frosting period, the changes in the heating capacity Q ˙ h e a t i n g for the HP systems with the two oriented outdoor heat exchangers are very close: Q ˙ h e a t i n g generally drops from 4.9 to 3.1 kW. At the beginning of the first frosting period, the cooling capacity Q ˙ c o o l i n g and the system efficiency with the horizontal outdoor heat exchanger ( Q ˙ c o o l i n g ~2.7 kW, COPhp~2.2) are noticeably higher than the vertical outdoor heat exchanger ( Q ˙ c o o l i n g ~2.3 kW, COPhp~1.9). This is because the horizontal outdoor heat exchanger has a better refrigerant distribution, which will be discussed later with the frost images. However, the initial advantage vanishes after 20 min due to faster frost accumulation. The cooling capacities and efficiencies of the two systems drop to the same level ( Q ˙ c o o l i n g ~0.3 kW, COPhp~1.1) at the end of the first frosting period. It is worth noting that even if the changes in the heating and cooling capacities are more or less similar, the working times in HP mode tfrosting are quite different in the two systems with different outdoor heat exchanger orientations. The higher cooling capacity Q ˙ c o o l i n g , as well as the higher efficiency of the system with the horizontally installed outdoor evaporator at the frosting beginning, may come from two factors:(1) better refrigerant distribution in the evaporator, which will be elaborated by the frost images later, and (2) larger refrigerant-side pressure drop in the evaporator, which is demonstrated in Figure 11. As Figure 11a shows, an approximately 0.16 bar (11.9%) higher refrigerant-side pressure drop for the horizontal evaporator is observed at the early stage of the first frosting period compared with the vertical one. As a result, the evaporating temperature Tero for the horizontal evaporator is about 0.4 K lower than the vertical one (Figure 11b). With a lower evaporating temperature Tero, the horizontally oriented outdoor evaporator has 24.9% higher Q ˙ c o o l i n g during the early stage of the first frosting period. However, a lower evaporating temperature makes frost accumulate faster and DPea grows 10 times after running for 54 min for the horizontal evaporator, which is 12 min earlier than the vertical one.
In conclusion, the horizontal evaporator improves the refrigerant distribution, but increases the refrigerant-side pressure drop, which decreases the evaporating temperature. Therefore, the first frosting period (HP mode) tfrosting is shortened by 12 min (18.2%).

3.2.2. Effects of Outdoor Heat Exchanger Orientation on Frosting and Defrosting Behavior

As demonstrated in Figure 10c, the frost accumulation Mfrost increases much faster in the early stage of the frosting period than it does in the later stage for both evaporator orientations: the initial frost growth in both planar and thickness directions has a much faster accumulation speed compared to the densification of frost solely in thickness direction in the later phase. Frost grows faster on the horizontal evaporator because of the lower surface temperature: it accumulates at 16.7 g/s for the horizontal outdoor evaporator and only 12.0 g/s for the vertical one. Figure 12 shows the frost images of the horizontal and vertical outdoor evaporators at the 40th minute and the end of the first frosting period. The thicker frost can be seen on the horizontal outdoor evaporator at the 40th minute of the first frosting. This agrees with the aforementioned analysis that the evaporating temperature is lower for the horizontal outdoor evaporator. The peak value of Mfrost is 0.64 kg at the 40th minute for the horizontal evaporator in the first frosting period, while it is 0.52 kg at the 68th minute for the vertically oriented evaporator. Moreover, from the frost images of the evaporators with two orientations, it is clear that the refrigerant distribution is more uniform in the horizontal evaporator since fewer channels are free of frost. Those channels are generally short of liquid refrigerant supply.
In addition, Figure 10c shows that slightly more water is retained on the vertical outdoor evaporator after the first defrosting. Figure 13 displays the images of the retained water on the outdoor evaporator at the beginning, the frost at the 30th minute, and the end of the second frosting period. The main difference is that the retained water stays in the middle of the louvered fins for the vertical outdoor heat exchanger, while for the horizontal outdoor heat exchanger, it flows downward along the fins and stays by the root of the fins. Moreover, for the horizontal evaporator, the retained water can likely be spread along the tube depth direction and thus become less obvious from the front view than the retained droplets on the vertical evaporator. However, after the second defrosting period, Mretained increases to 0.567 kg for the horizontally oriented outdoor heat exchanger and is not only almost twice the water retention of the vertically oriented outdoor heat exchanger (0.298 kg) but also doubles the water retention in the first defrosting period (0.277 kg). This indicates the current defrost-termination criterion is not appropriate in this case. Also, the water drainage is better for the vertically oriented outdoor heat exchanger: it drains 0.159 and 0.278 kg after the two continuous defrosting periods and 0 and 0.080 kg for the horizontal one. It is worth pointing out that two factors attributed to the near-zero water drainage in the first defrosting period of the horizontal outdoor heat exchanger. On the one hand, a large portion of downward-flow meltwater is blocked/trapped by the horizontal channels. On the other hand, in this study, the drained water is collected using a slightly inclined pan installed under the outdoor coil, connecting to a 500 mL beaker with a hose. Therefore, in the case of the horizontal heat exchanger, even a very small quantity of meltwater could reach the inclined pan. It forms a water film on the surface of the inclined pan and hose and cannot be collected/measured by the beaker.
It takes 2.5 and 4.0 min to defrost the vertically oriented outdoor heat exchanger in the two continuous defrosting periods. However, 2.6 and 5.2 min are needed for the horizontal one because more water is retained by the end of the first defrosting period. In the two continuous frosting–defrosting cycles or approximately two hours of operation, the defrosting takes up 5.6% and 7.0% of the total working time for the vertical and horizontal outdoor heat exchangers, respectively.

4. Summary and Conclusions
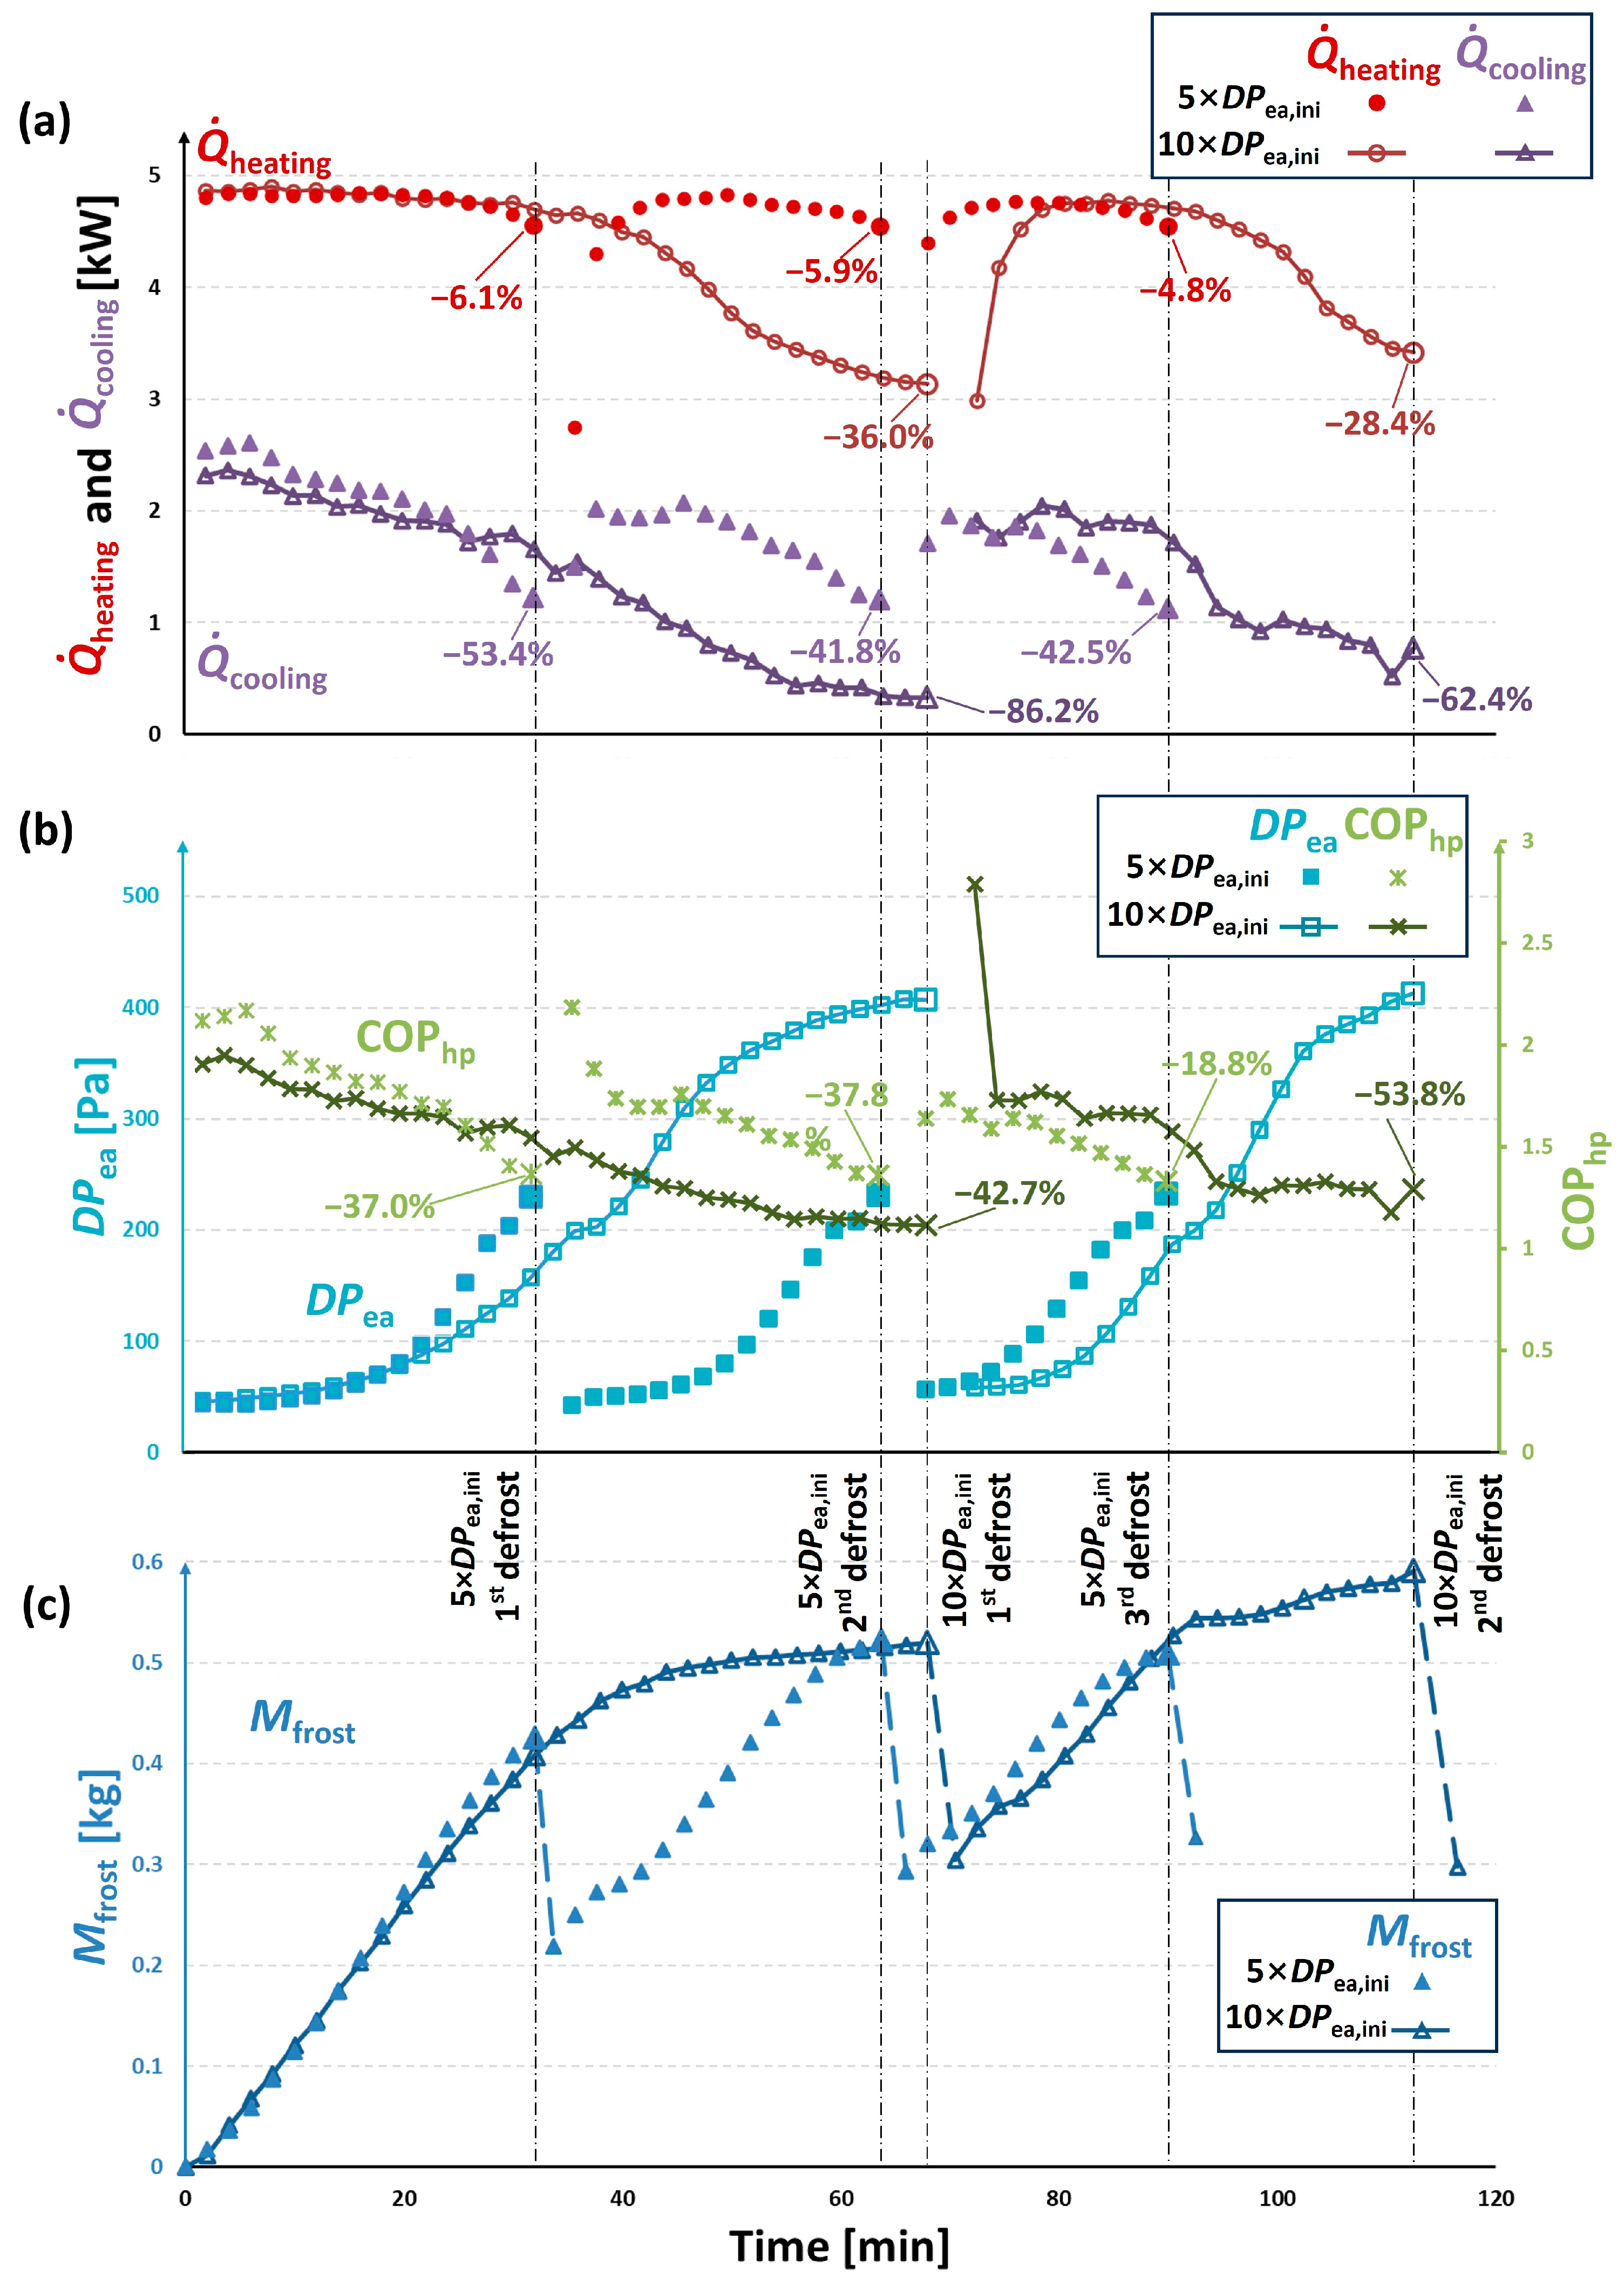
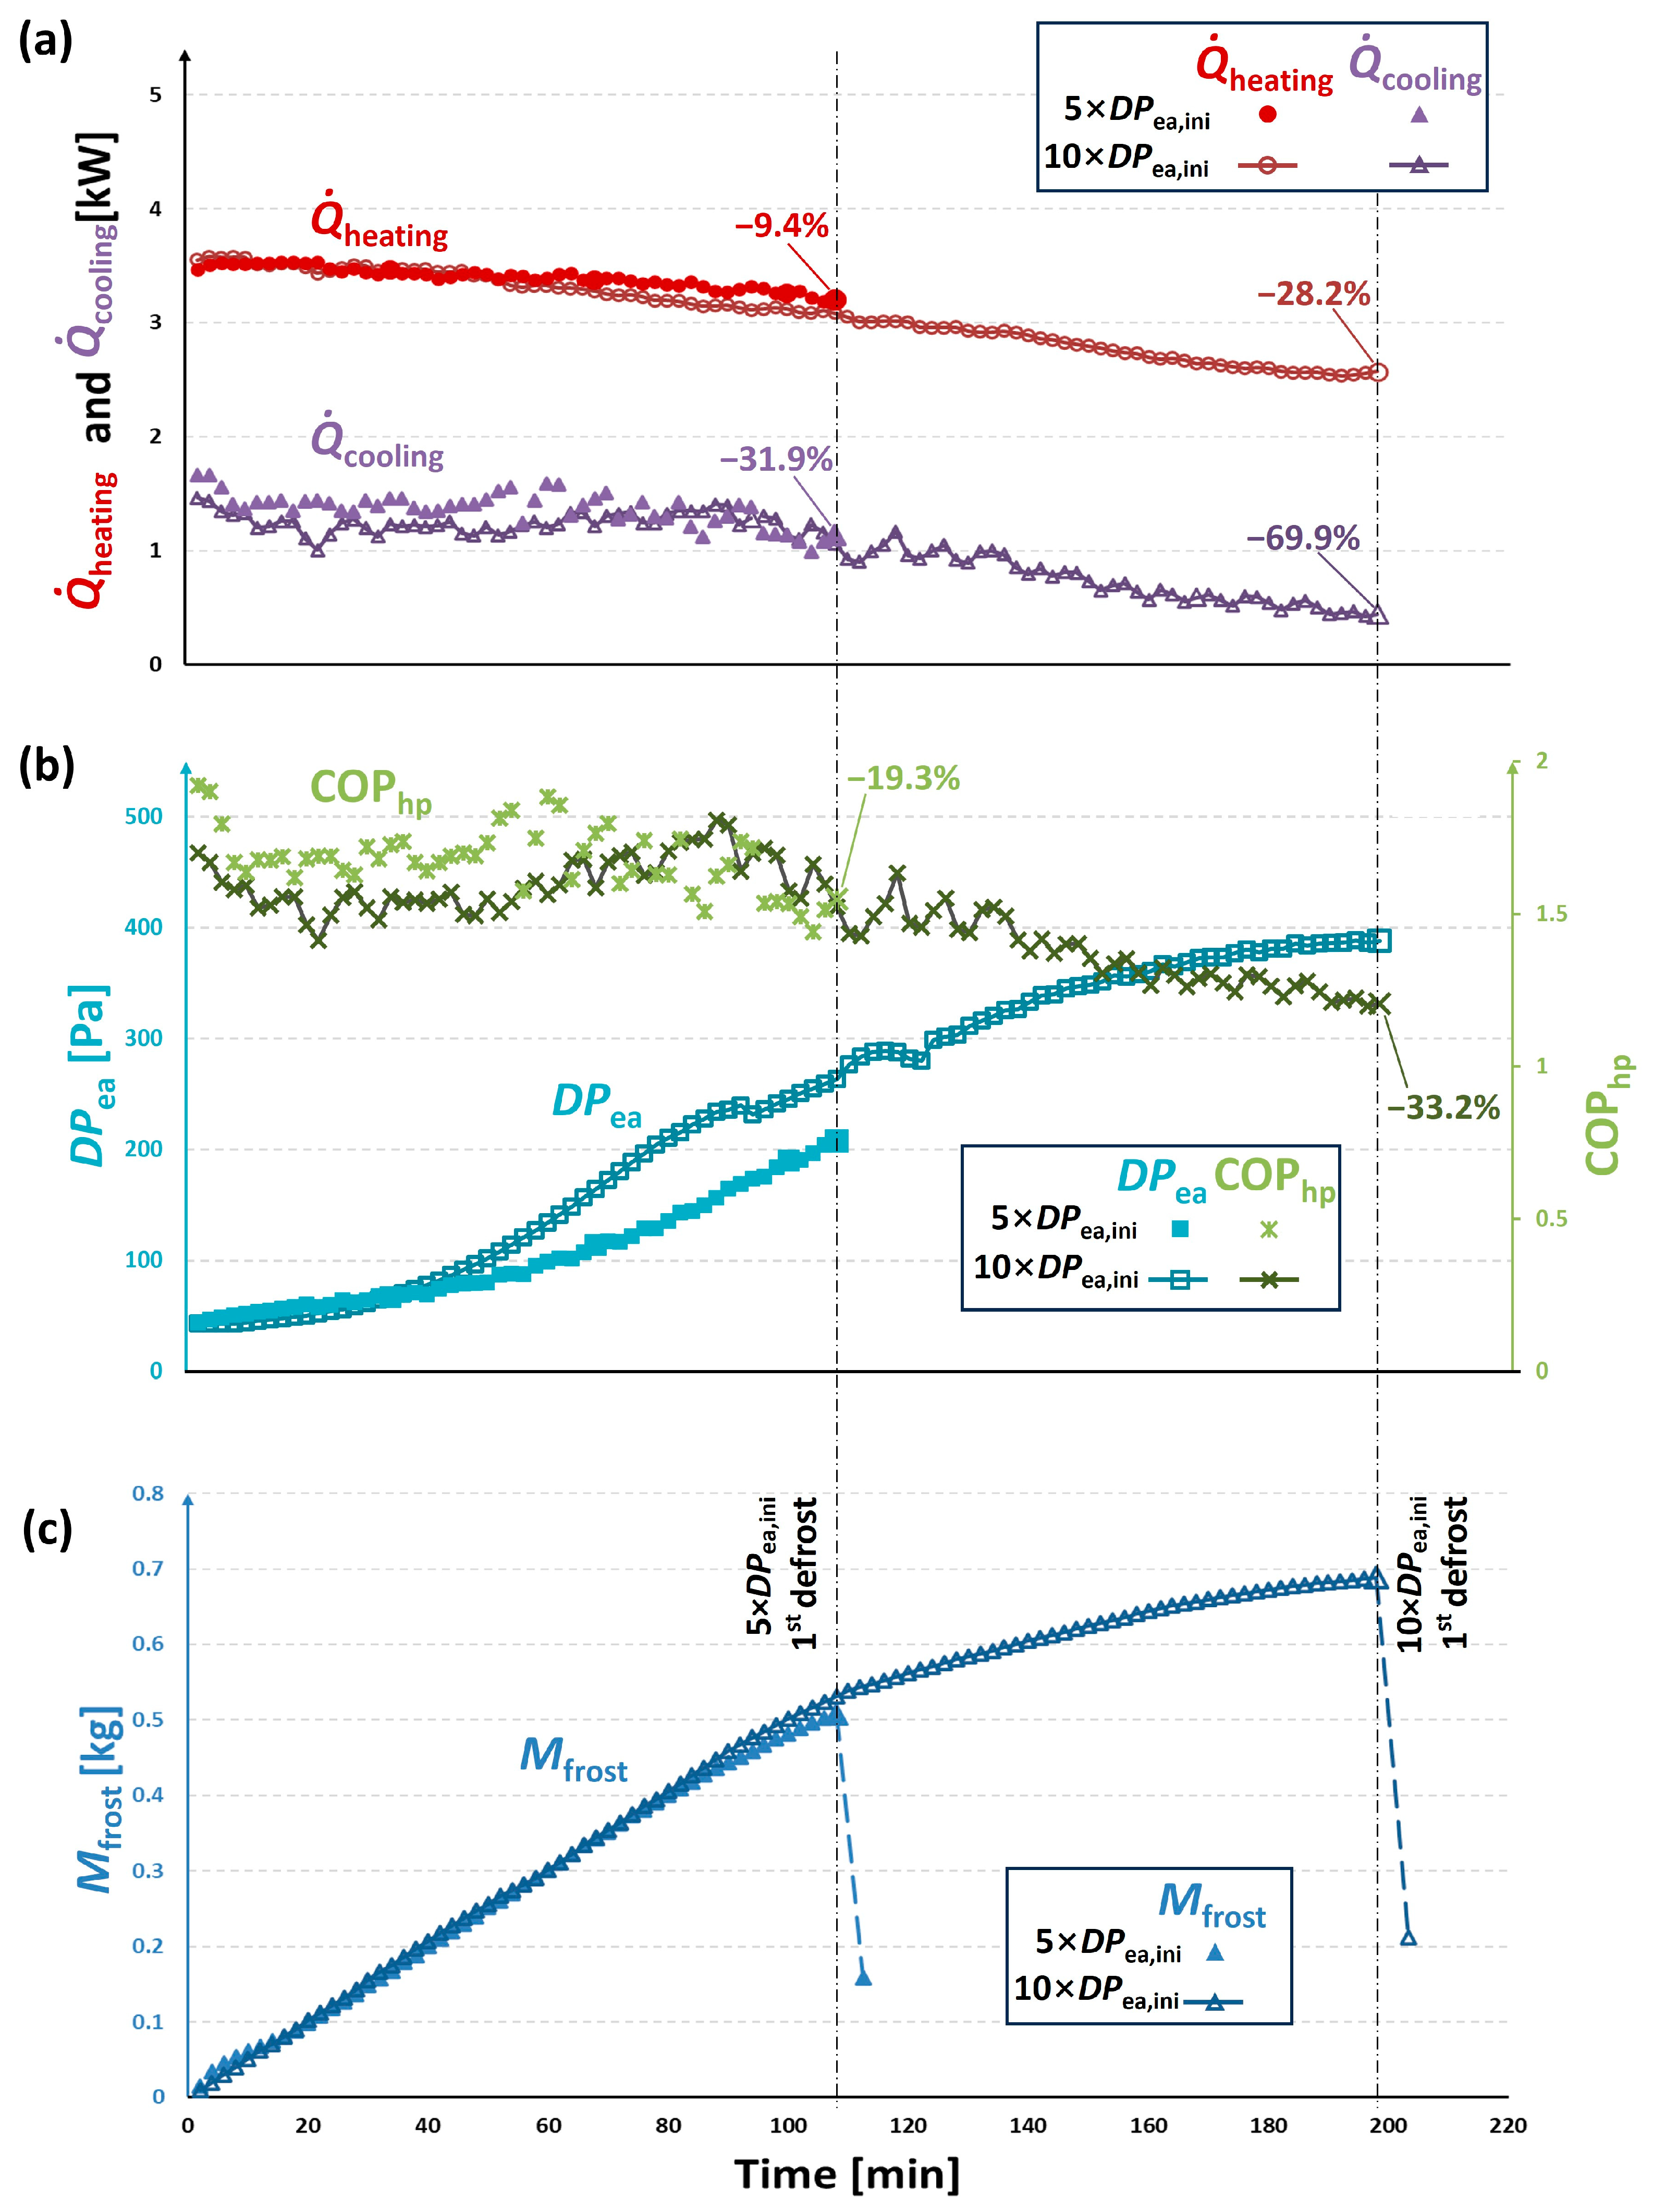
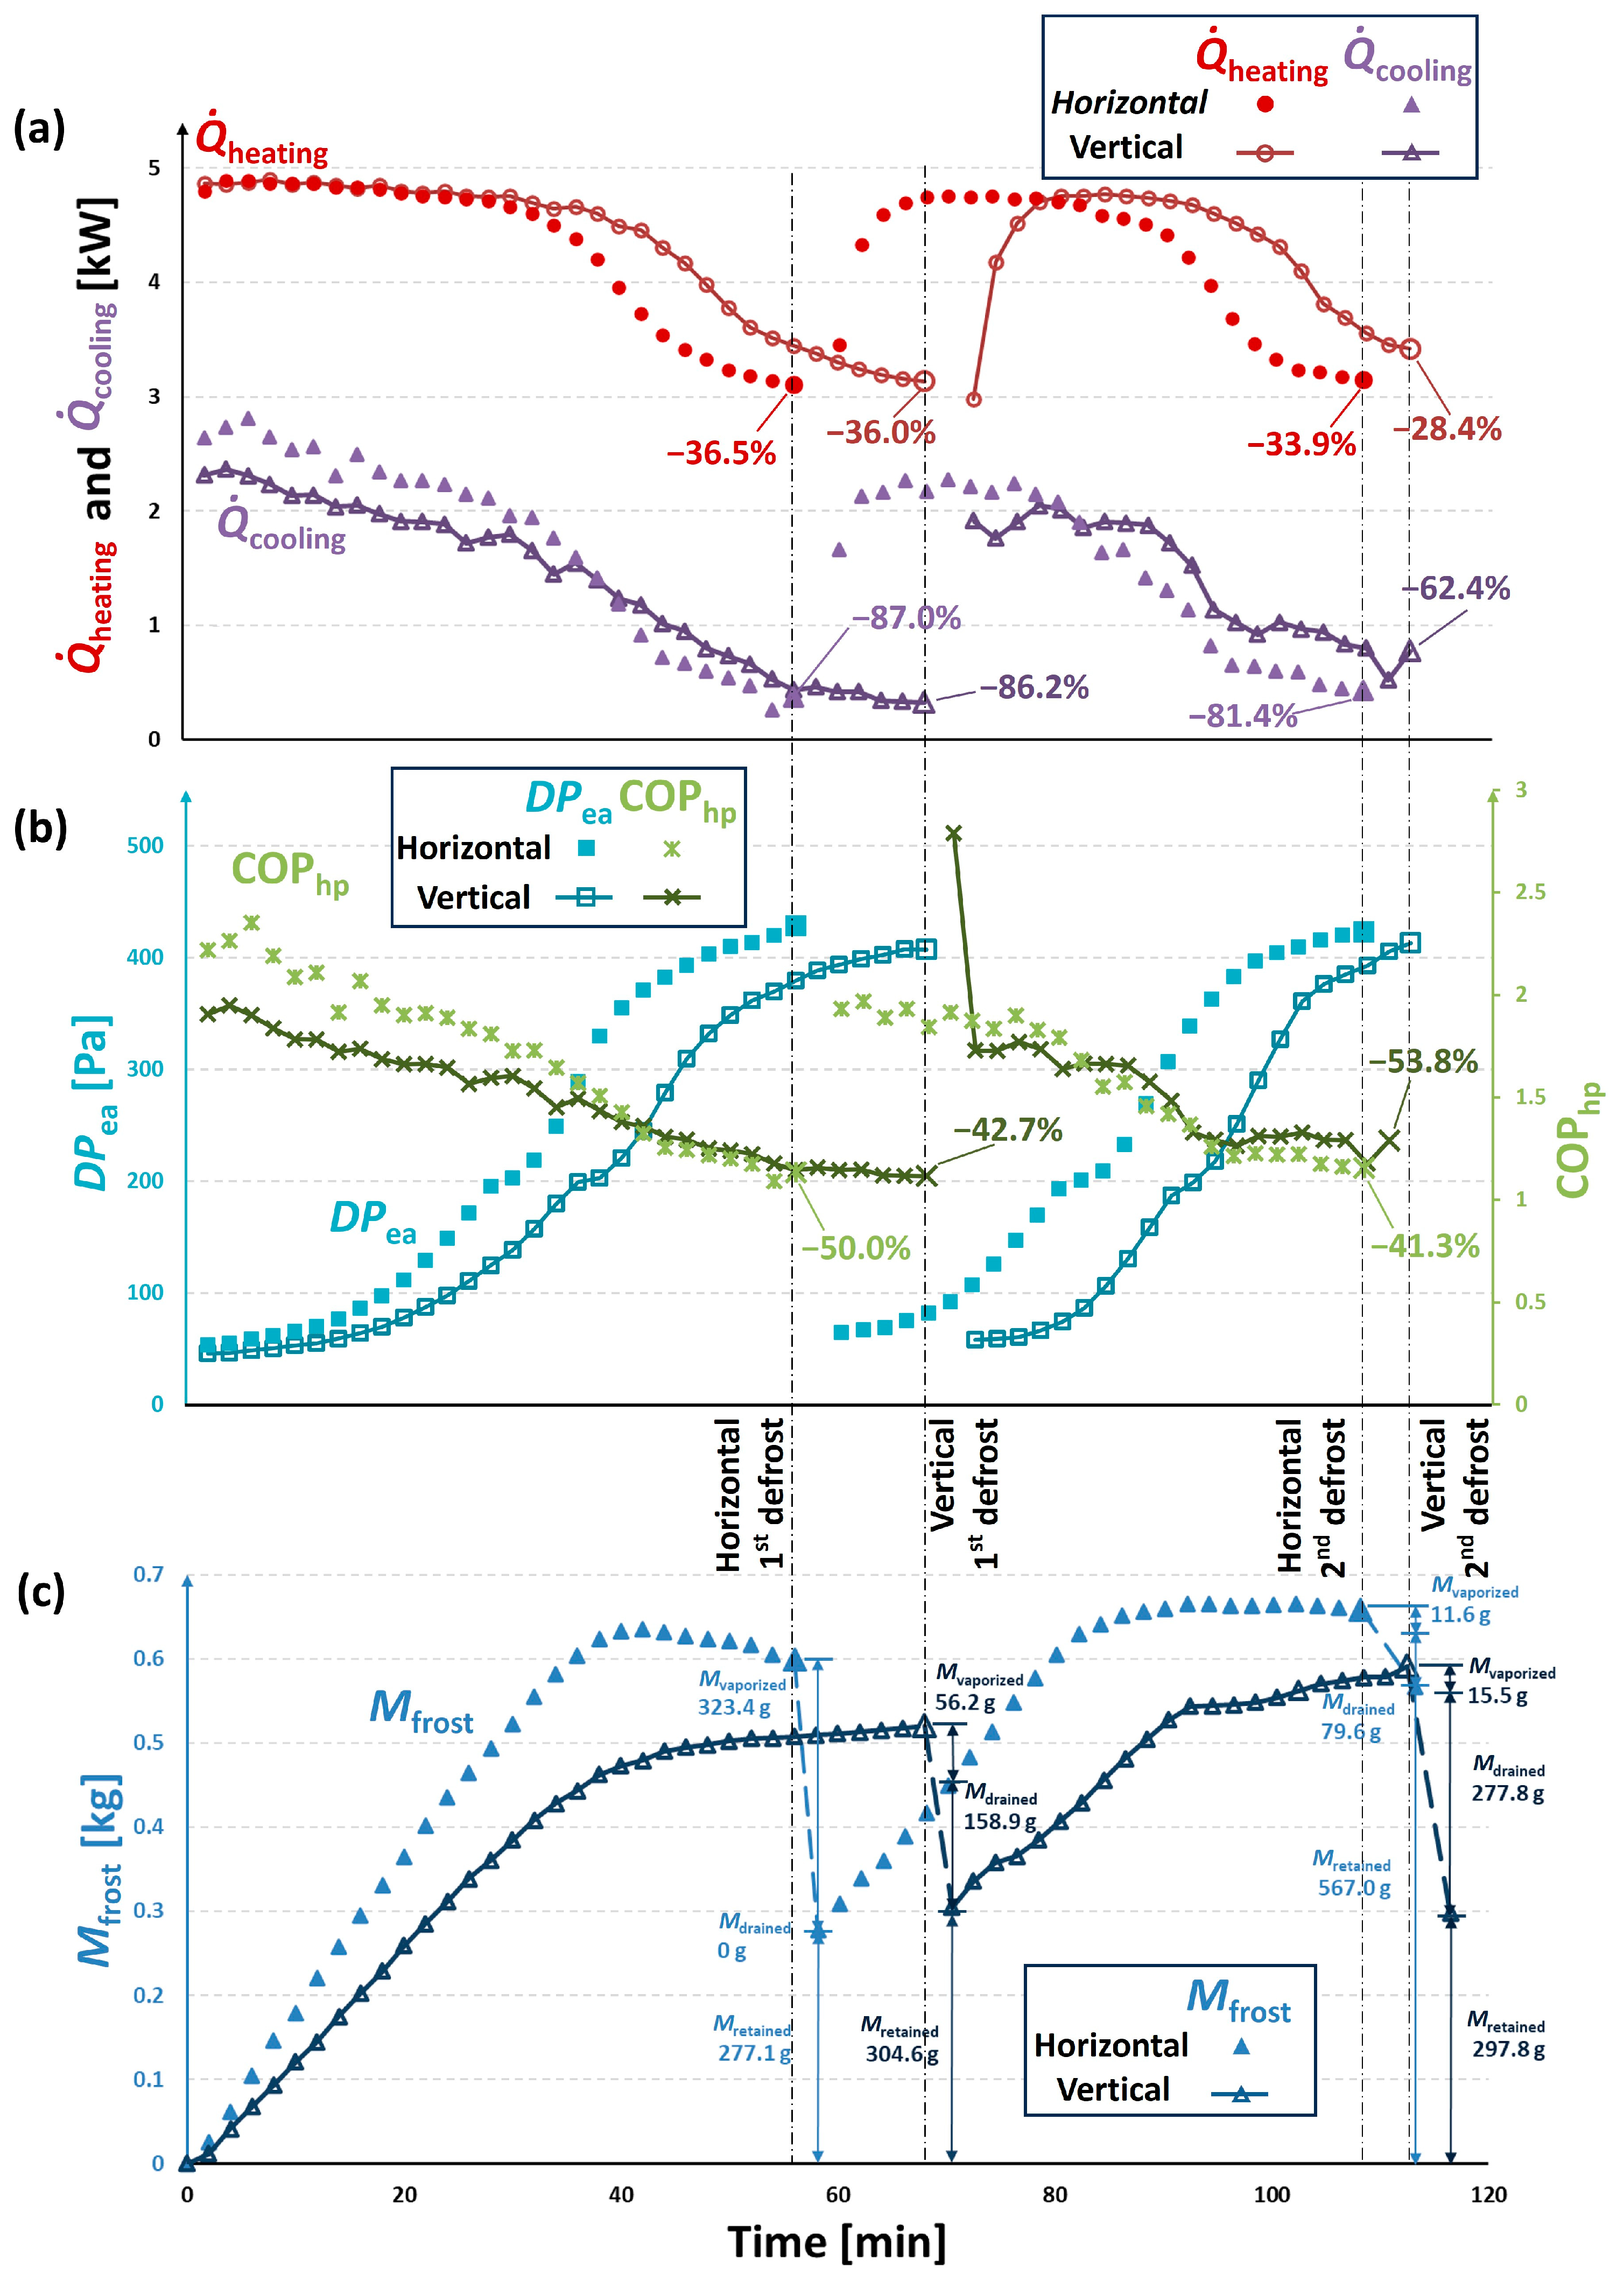
In this paper, we studied the effects of different defrost-initiation criteria and outdoor heat exchanger orientations on the performance of a reversible CO2 HP system under practical operating conditions. The results show the following.
  • The heating capacity Q ˙ h e a t i n g drops by less than 10% during the frosting periods with 5 × DPea,ini as the defrost-initiation criterion and degrades about 30% with 10 × DPea,ini criterion (Figure 3, Figure 4 and Figure 5). The mild heating capacity degradations indicate the HP system has the potential to operate in HP mode for a longer period.
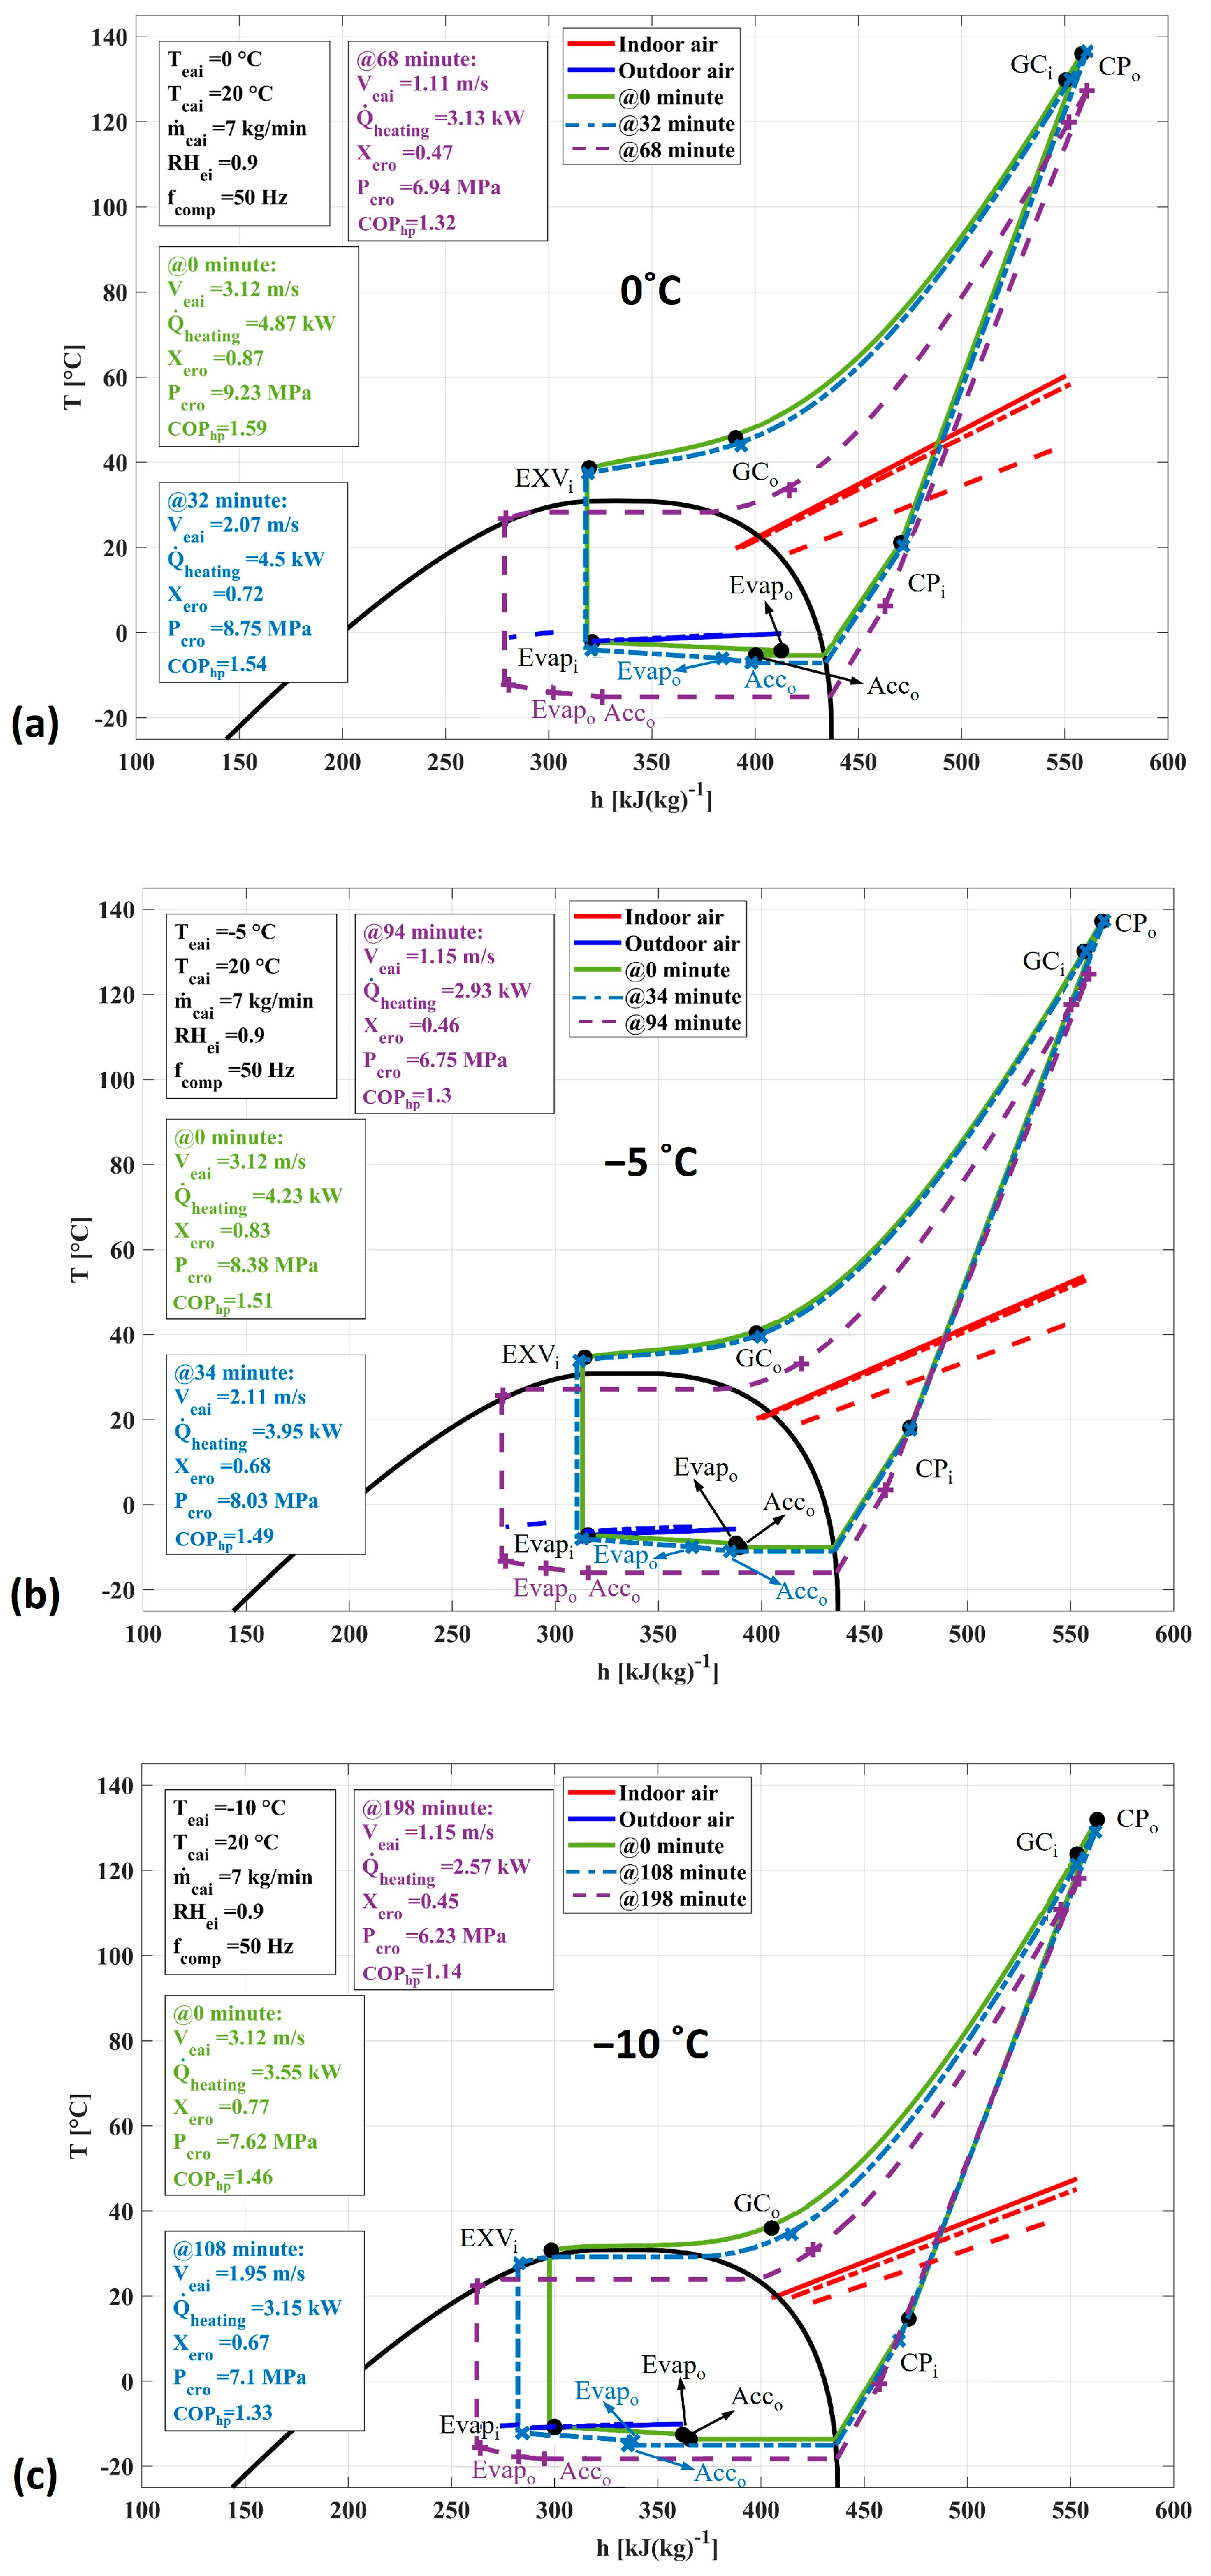
  • The heating capacity Q ˙ h e a t i n g drops faster in the later phase of frosting than in the early phase, since the accumulator has been flooded and the refrigerant mass flow rate starts to drop (Figure 6).
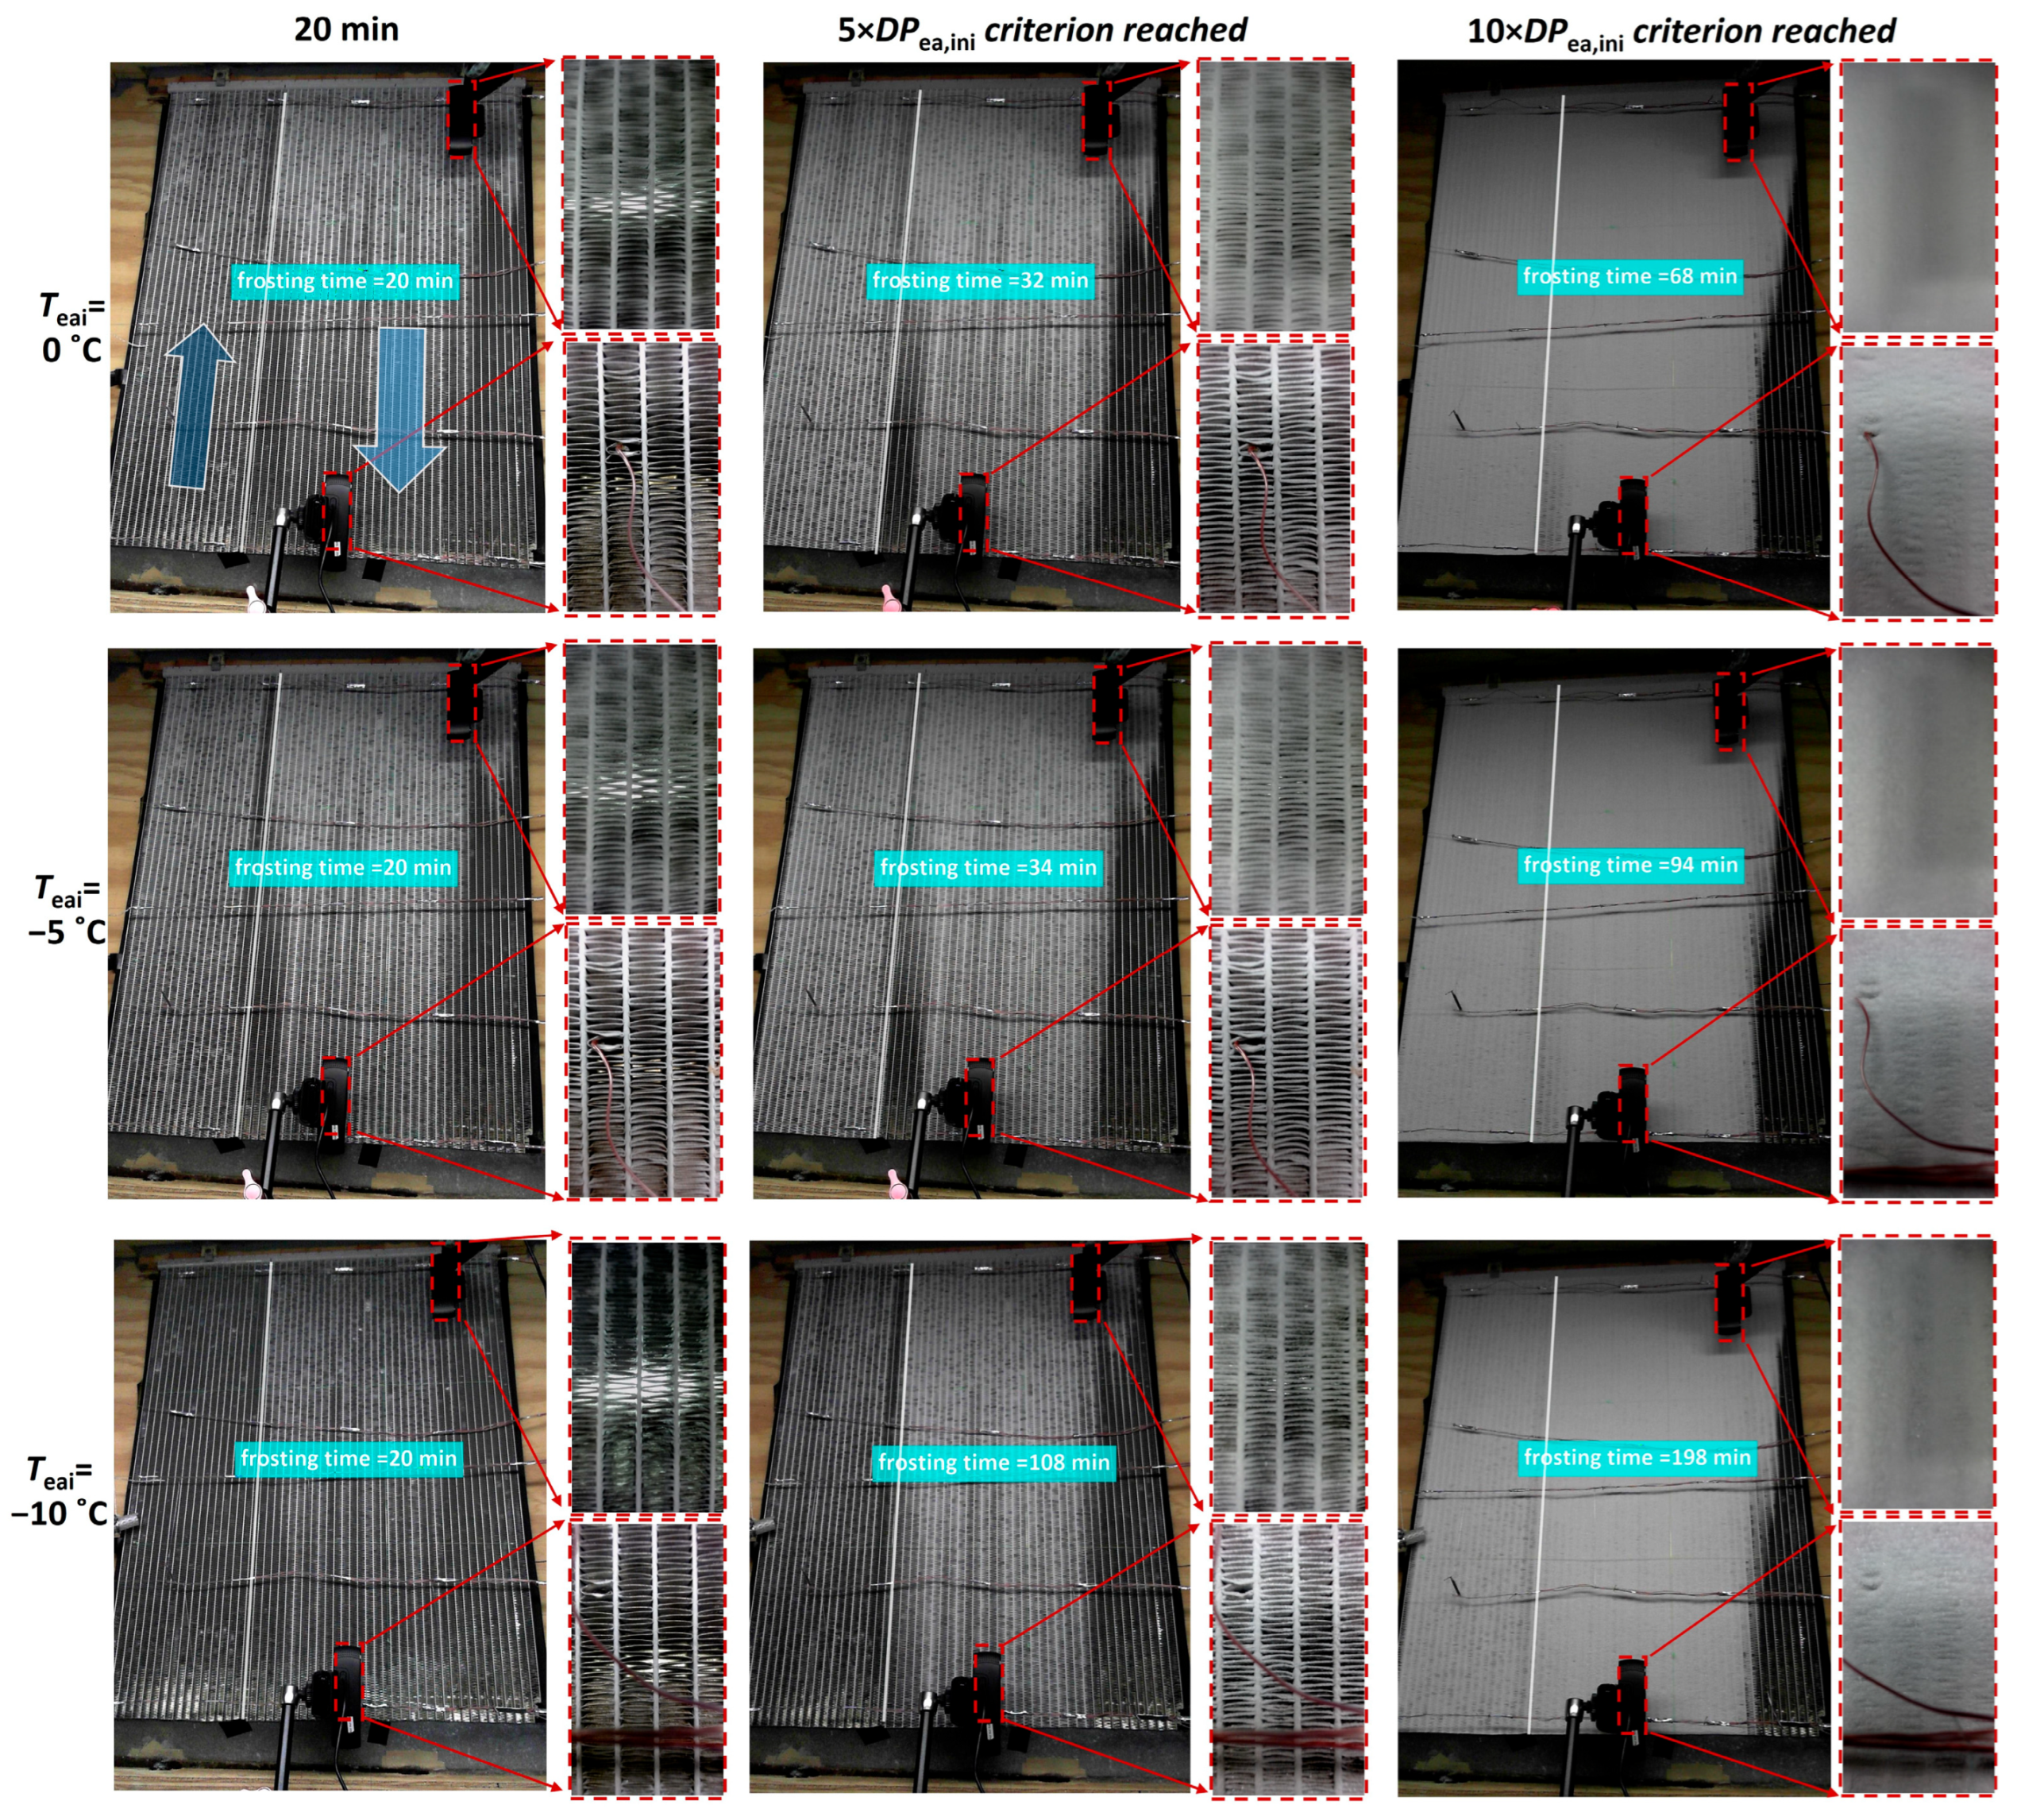
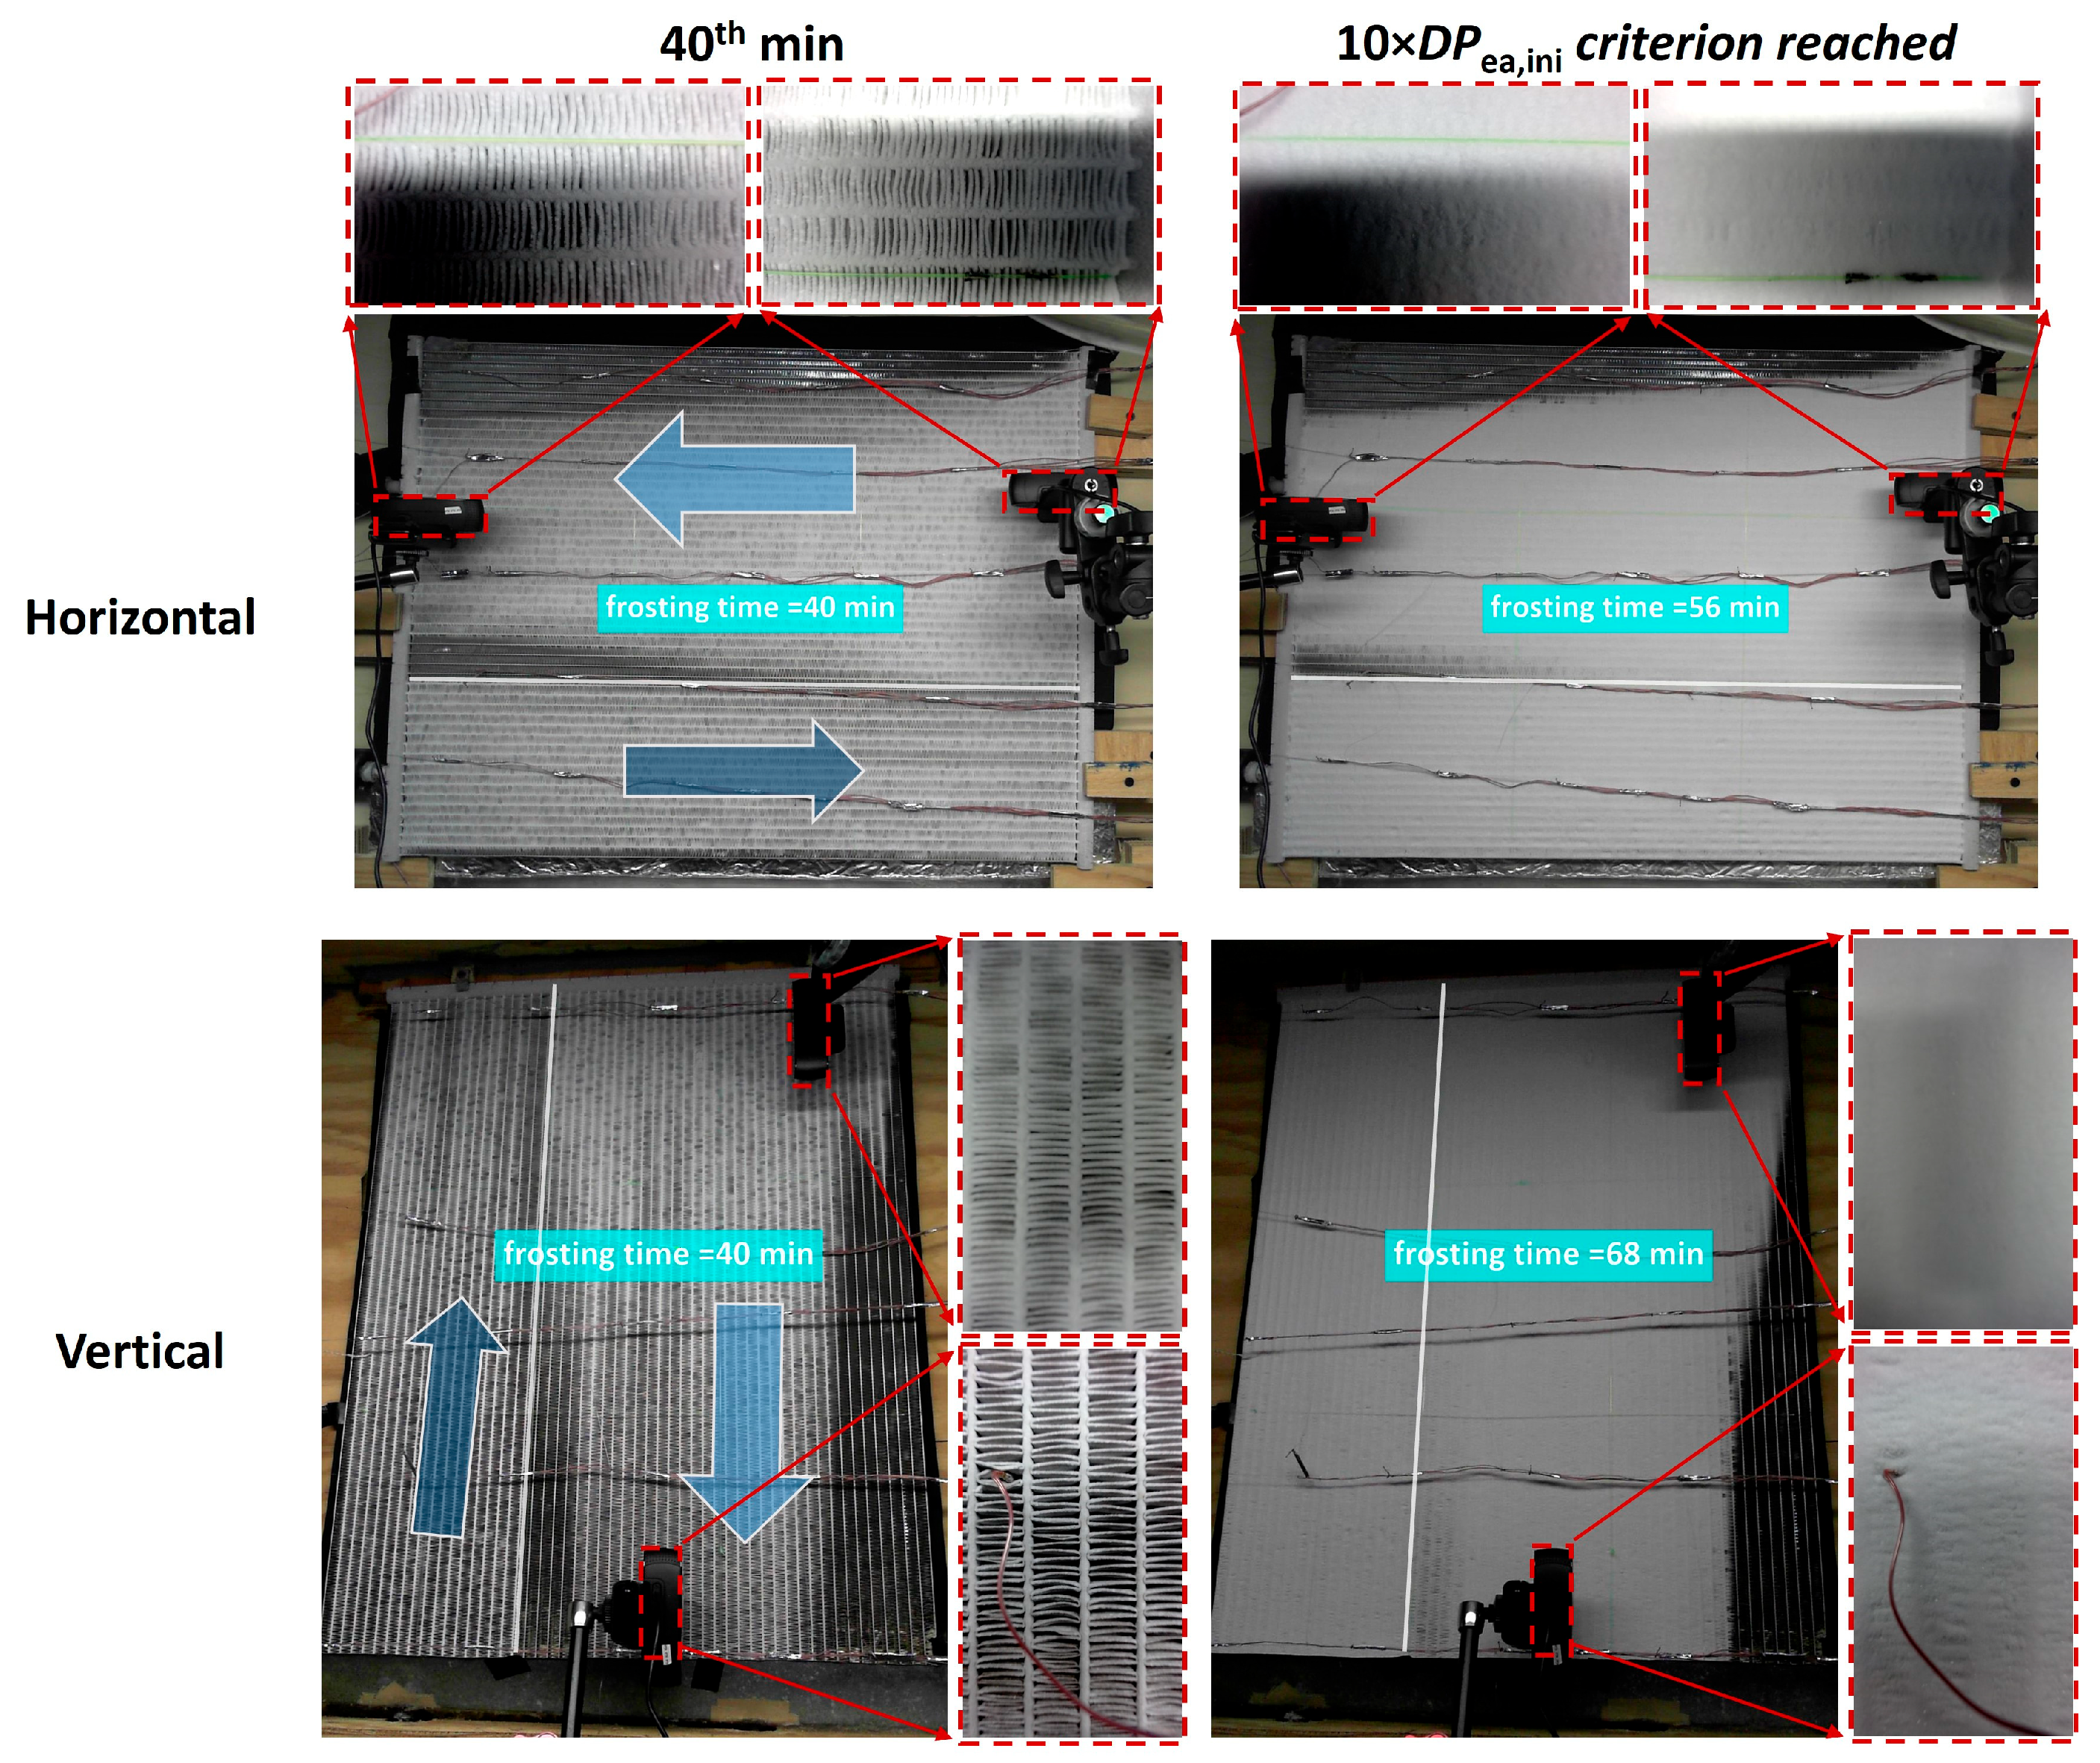
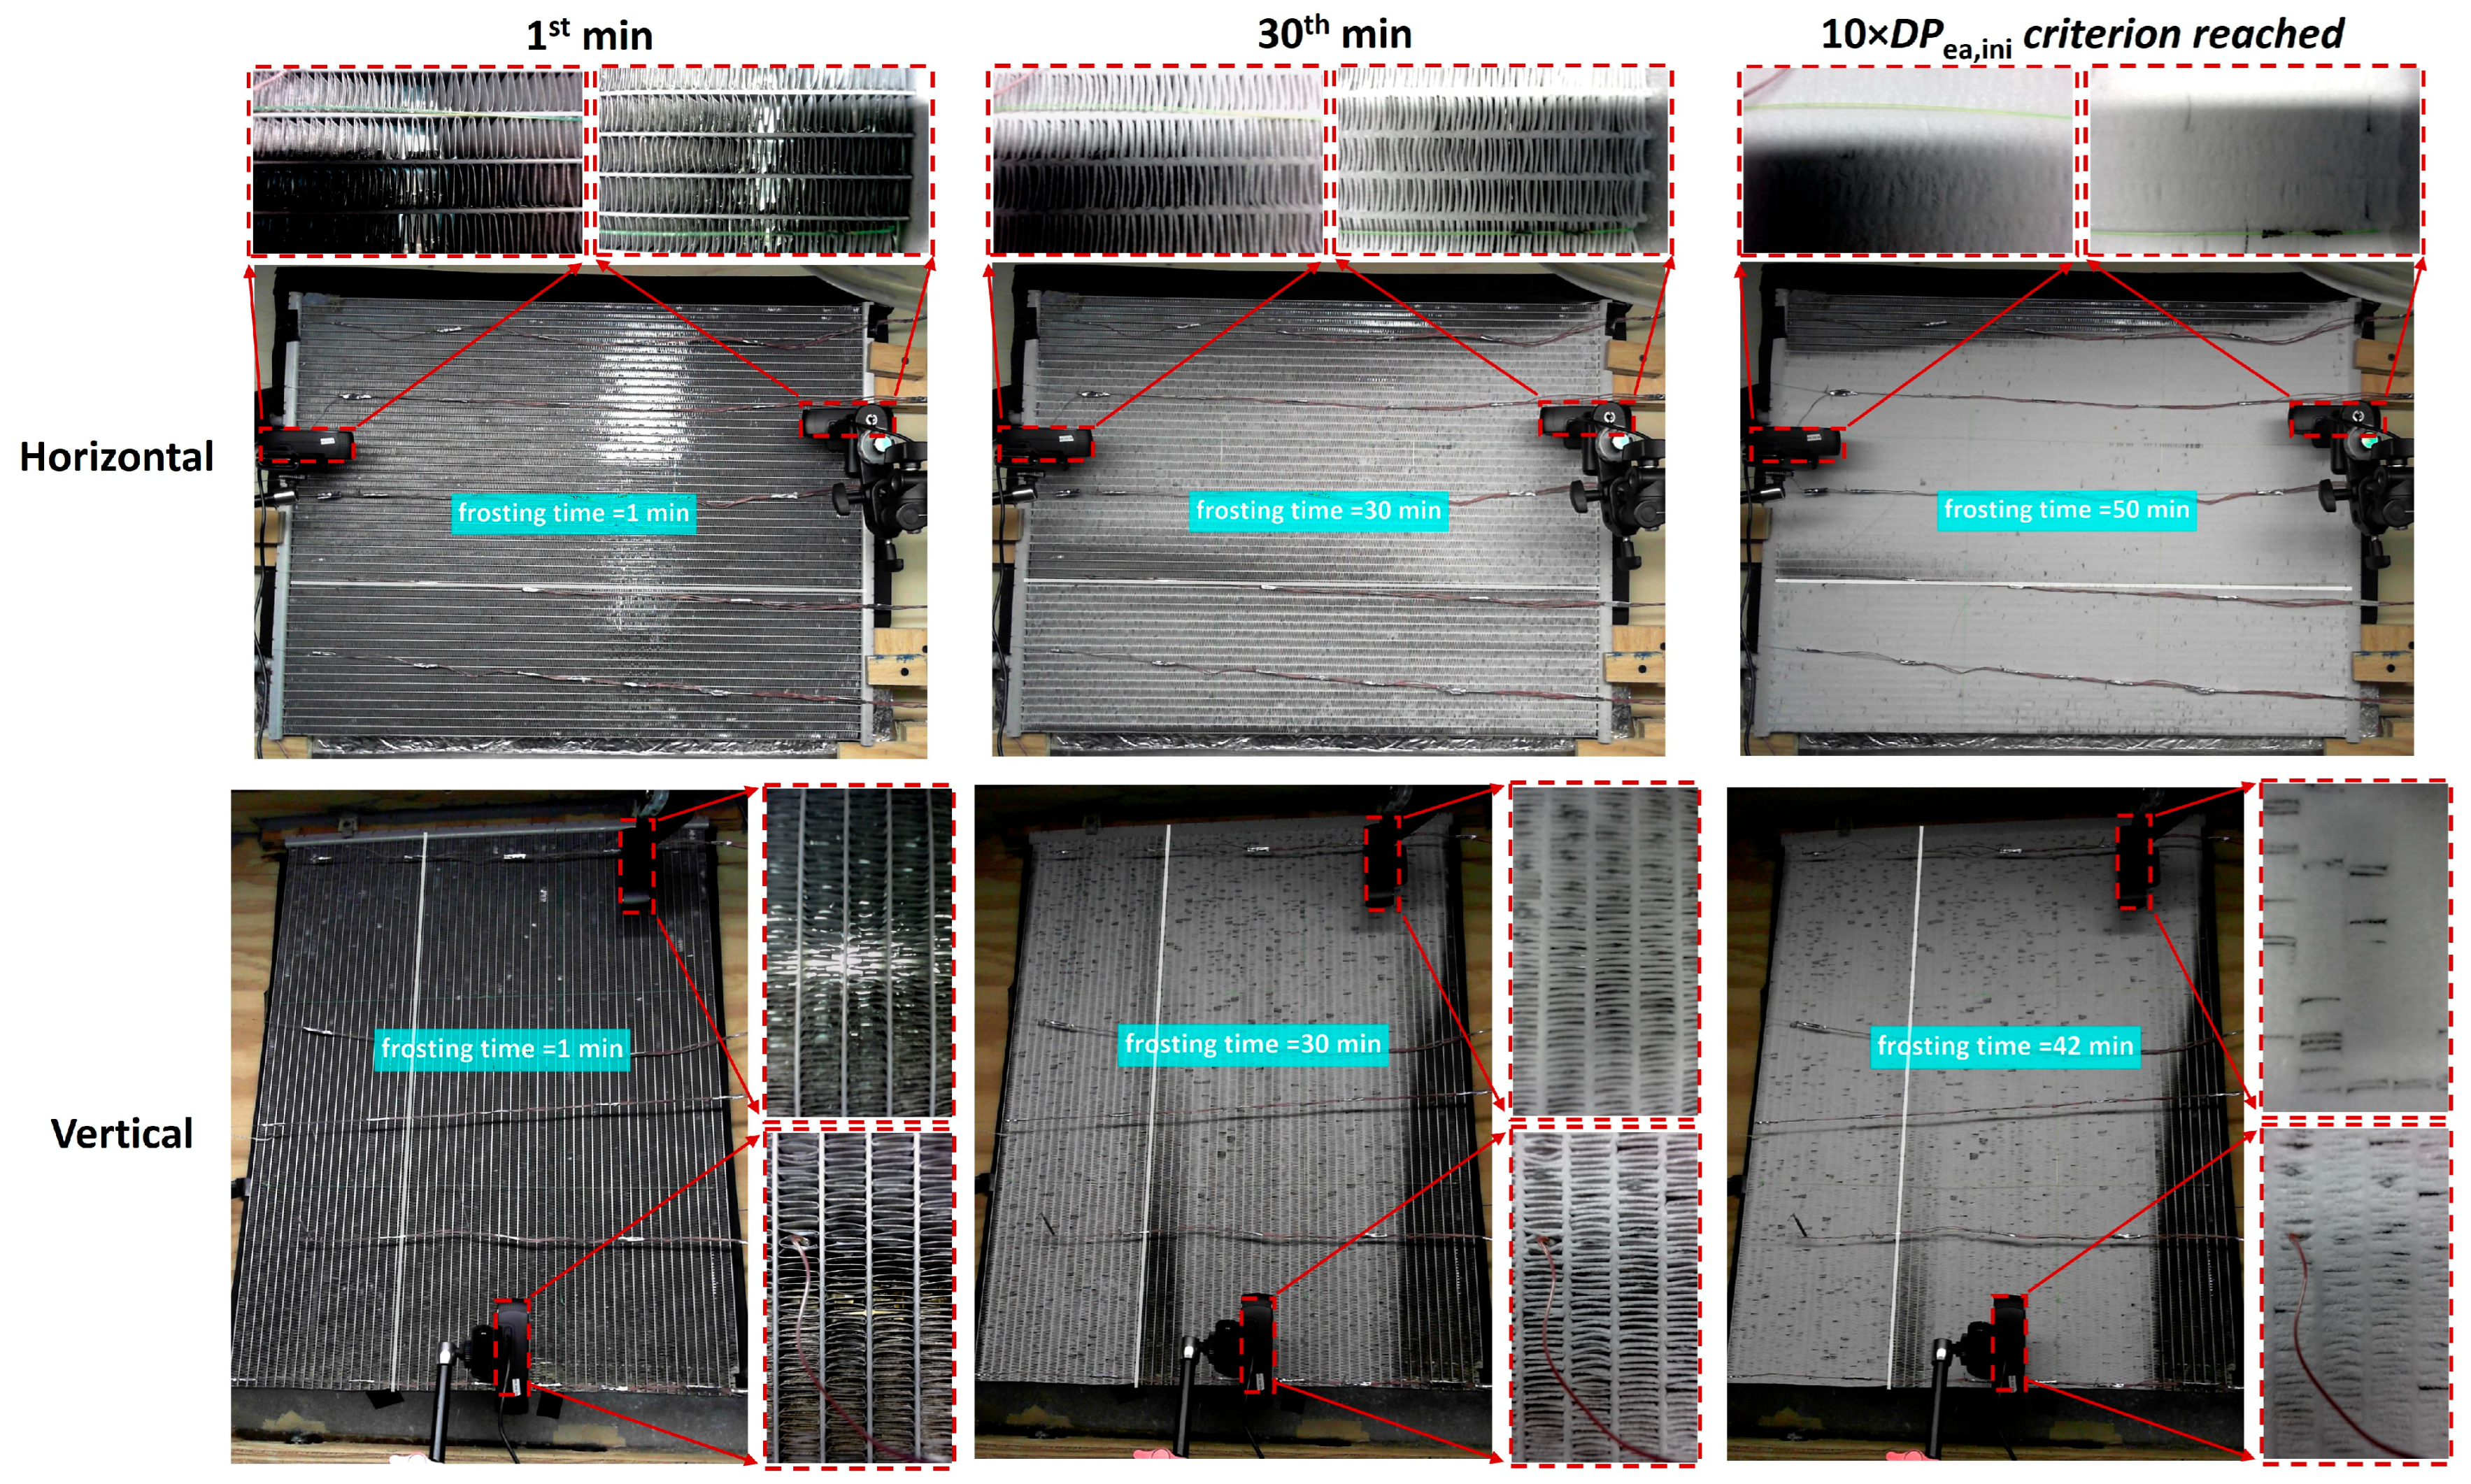
  • Frost grows on the evaporator surface in both planar and thickness directions in the early phase of frosting, accumulating at its maximum speed. In the later phase, the frost mainly accumulates in the thickness direction (Figure 8)
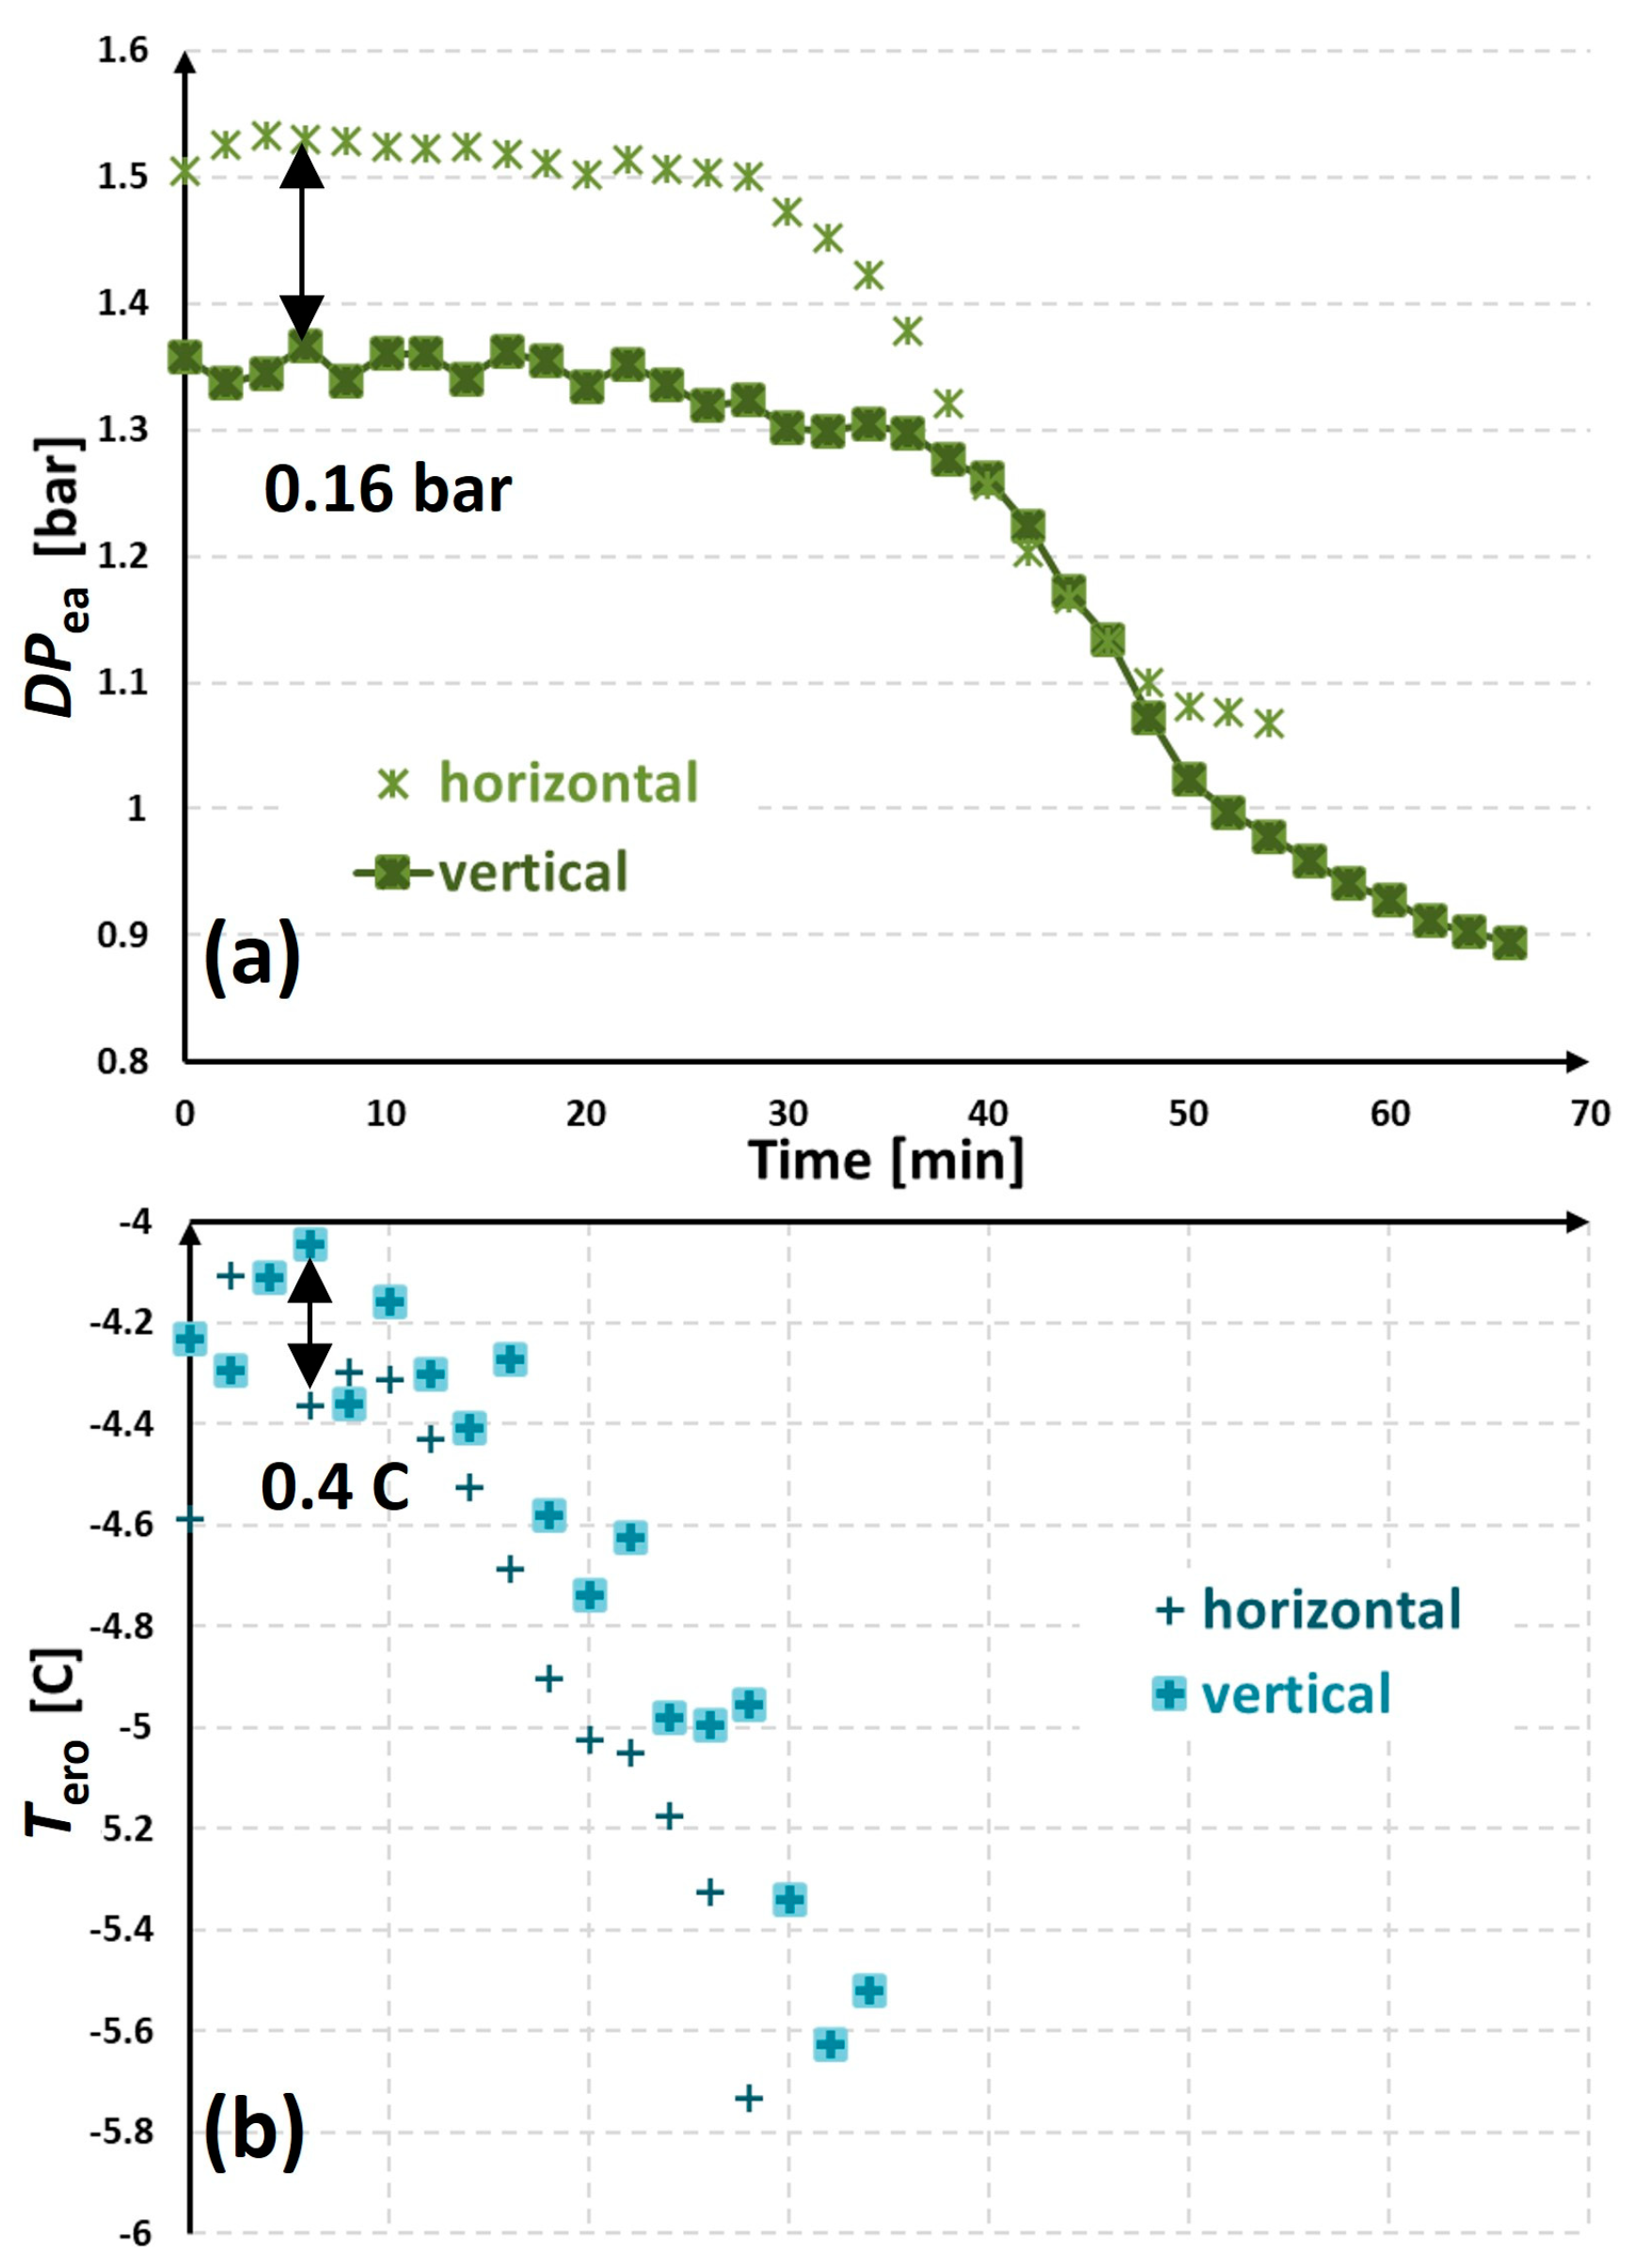
  • The horizontally oriented evaporator improves the refrigerant distribution, but has an approximately 0.16 bar (11.9%)-higher pressure drop, which lowers the evaporating temperature by about 0.4 K. Consequently, frost accumulates faster and the working time in HP mode is shortened by 12 min (18.2%) (Figure 10, Figure 11 and Figure 12).
  • The vertical outdoor heat exchanger drains much more water during the defrosting than the horizontal one. As a result, the defrosting time for the vertical outdoor heat exchanger is reduced by 20% (Figure 10).
Based on the above findings, several directions for future study are suggested to further improve the performance of automotive heat pumps:
  • Surface treatments or fin structure modifications to delay frost formation, improve meltwater drainage, and reduce meltwater retention.
  • Investigation under a wider range of operating conditions, including different air flow rates and refrigerants (R290).
  • Actual field measurements in moving vehicles under real environments.
  • More intelligent defrosting initiation and termination strategies that compromise between efficiency and complexity.

Author Contributions

Conceptualization, P.H.; Methodology, W.Z., W.L. and P.H.; Formal analysis, W.Z. and W.L.; Investigation, W.Z.; Resources, P.H.; Data curation, W.Z.; Writing—original draft, W.Z.; Writing—review & editing, W.L. and P.H.; Visualization, W.Z. and W.L.; Supervision, P.H.; Funding acquisition, W.L. and P.H. All authors have read and agreed to the published version of the manuscript.

Funding

This research was supported by the Air Conditioning and Refrigeration Center at the University of Illinois Urbana Champaign, the Natural Science Foundation of Hunan Province, grant number [2023JJ40730] and the Natural Science Foundation of Changsha City, grant number [kq2208276].

Data Availability Statement

The original contributions presented in this study are included in the article. Further inquiries can be directed to the corresponding author.

Conflicts of Interest

The authors declare no conflicts of interest.

References

  1. Mei, V.C.; Chen, F.C.; Domitrovic, R.E.; Kilpatrick, J.K. A Frost-Less Heat Pump. ASHRAE Trans. 2001, 108, 452. [Google Scholar]
  2. Cernicin, V.; Zhang, W.; Hrnjak, P. The Role of Internal Heat Exchanger in an R744 Vapor Compression System in the Heat Pump Mode Under Various Conditions. In Proceedings of the International Refrigeration and Air Conditioning Conference, West Lafayette, IN, USA, 10–14 July 2022; p. 2305. [Google Scholar]
  3. Xu, B.; Han, Q.; Chen, J.; Li, F.; Wang, N.; Li, D.; Pan, X. Experimental investigation of frost and defrost performance of microchannel heat exchangers for heat pump systems. Appl. Energy 2013, 103, 180–188. [Google Scholar] [CrossRef]
  4. Park, J.S.; Kim, D.R.; Lee, K.S. Frosting behaviors and thermal performance of louvered fins with unequal louver pitch. Int. J. Heat Mass Transf. 2016, 95, 499–505. [Google Scholar] [CrossRef]
  5. Mahvi, A.J.; Boyina, K.; Musser, A.; Elbel, S.; Miljkovic, N. Superhydrophobic heat exchangers delay frost formation and enhance efficency of electric vehicle heat pumps. Int. J. Heat Mass Transf. 2021, 172, 121162. [Google Scholar] [CrossRef]
  6. Westhaeuser, J.; Brauchle, L.; Albrecht, J.C.; Tegethoff, W.; Lemke, N.; Koehler, J. Flat tube heat exchangers: Experimental analysis of frosting and water retention. Appl. Energy 2023, 218, 119319. [Google Scholar] [CrossRef]
  7. Klingebiel, J.; Hassan, M.; Venzik, V.; Vering, C.; Müller, D. Efficiency comparison between defrosting methods: A laboratory study on reverse-cycle defrosting, electric heating defrosting, and warm brine defrosting. Appl. Energy 2023, 233, 121072. [Google Scholar] [CrossRef]
  8. Tassou, S.A.; Datta, D.; Marriott, D. Frost formation and defrost control parameters for open multideck refrigerated food display cabinets. Proc. Inst. Mech. Eng. Part A J. Power Energy 2001, 215, 213–222. [Google Scholar] [CrossRef]
  9. Buick, T.R.; McMullan, J.T.; Morgan, R.; Murray, R.B. Ice detection in heat pumps and coolers. Int. J. Energy Res. 1978, 2, 85–98. [Google Scholar] [CrossRef]
  10. Steiner, A.; Rieberer, R. Simulation based identification of the ideal defrost start time for a heat pump system for electric vehicles. Int. J. Refrig. 2015, 57, 87–93. [Google Scholar] [CrossRef]
  11. Hrnjak, P.; Zhang, P.; Rennels, C. Effect of louver angle on performance of heat exchanger with serpentine fins and flat tubes in frosting: Importance of experiments in periodic frosting. Int. J. Refrig. 2017, 84, 321–335. [Google Scholar] [CrossRef]
  12. Chung, Y.; Na, S.I.; Choi, J.; Kim, M.S. Feasibility and optimization of defrosting control method with differential pressure sensor for air source heat pump systems. Appl. Therm. Eng. 2019, 155, 461–469. [Google Scholar] [CrossRef]
  13. Lawrence, J.M.W.; Evans, J.A. Refrigerant flow instability as a means to predict the need for defrosting the evaporator in a retail display freezer cabinet. Int. J. Refrig. 2008, 3, 107–112. [Google Scholar] [CrossRef]
  14. Jiang, Y.; Dong, J.; Qu, M.; Deng, S.; Yao, Y. A novel defrosting control method based on the degree of refrigerant superheat for air source heat pumps. Int. J. Refrig. 2013, 36, 2278–2288. [Google Scholar] [CrossRef]
  15. Kim, M.H.; Lee, K.S. Determination method of defrosting start-time based on temperature measurements. Appl. Energy 2015, 146, 263–269. [Google Scholar] [CrossRef]
  16. Li, K.; Xia, D.; Bao, J.; Luo, S.; Zhang, H.; Liu, N.; Su, L.; Sheng, L. Investigation on reverse cycle defrosting strategy of an outdoor heat exchanger in air conditioning heat pump system for electric vehicles. Case Stud. Therm. Eng. 2021, 27, 101281. [Google Scholar] [CrossRef]
  17. Song, M.; Dong, J.; Wu, C.; Jiang, Y. Improving the frosting and defrosting performance for air source heat pump units: Review and outlook. HKIE Trans. 2017, 24, 88–98. [Google Scholar] [CrossRef]
  18. Xiao, J.; Wang, W.; Zhao, Y.H.; Zhang, F.R. An analysis of the feasibility and characteristics of photoelectric technique applied in defrost-control. Int. J. Refrig. 2009, 32, 1350–1357. [Google Scholar] [CrossRef]
  19. Wang, W.; Xiao, J.; Feng, Y.; Guo, Q.; Wang, L. Characteristics of an air source heat pump with novel photoelectric sensors during periodic frost-defrost cycles. Appl. Therm. Eng. 2013, 50, 177–186. [Google Scholar] [CrossRef]
  20. Shen, Y.; Wang, S. Condensation frosting detection and characterization using a capacitance sensing approach. Int. J. Heat Mass Transf. 2020, 147, 118968. [Google Scholar] [CrossRef]
  21. Yoo, J.W.; Chung, Y.; Kim, G.T.; Song, C.W.; Yoon, P.H.; Sa, Y.C.; Kim, M.S. Determination of defrosting start time in an air-to-air heat pump system by frost volume calculation method. Int. J. Refrig. 2018, 96, 169–178. [Google Scholar] [CrossRef]
  22. Wang, W.; Zhang, S.; Li, Z.; Sun, Y.; Deng, S.; Wu, X. Determination of the optimal defrosting initiating time point for an ASHP unit based on the minimum loss coefficient in the nominal output heating energy. Energy 2020, 191, 116505. [Google Scholar] [CrossRef]
  23. Wang, W.; Zhou, Q.; Tian, G.; Wang, Y.; Zhao, Z.; Cao, F. A novel defrosting initiation strategy based on convolutional neural network for air-source heat pump. Int. J. Refrig. 2021, 128, 95–103. [Google Scholar] [CrossRef]
  24. Wang, A.; Cao, F.; Jia, F.; Liu, Y.; Yin, X.; Song, Y.; Wang, X. Development of the effective defrosting criterion for electric vehicles transcritical CO2 heat pumps under constant heating capacity operation. Int. J. Refrig. 2023, 145, 388–396. [Google Scholar] [CrossRef]
  25. Zhang, W.; Hrnjak, P. The effects of the orientation of outdoor microchannel heat exchanger on the performance of a transcritical R744 heat pump during frosting and defrosting. In Proceedings of the International Refrigeration and Air Conditioning Conference, West Lafayette, IN, USA, 10–14 July 2022; Available online: https://docs.lib.purdue.edu/iracc/2301 (accessed on 1 January 2025).
  26. Zhang, W.; Li, W.; Hrnjak, P. Performance of an automotive reversible CO2 heat pump system during periodic frosting-defrosting cycles. Appl. Therm. Eng. 2024, 236, 121892. [Google Scholar] [CrossRef]
  27. Moffat, R.J. Describing the uncertainties in experimental results. Exp. Therm. Fluid Sci. 1988, 1, 3–17. [Google Scholar] [CrossRef]
Figure 1. The experimental facility of the CO2 HP system in (a) HP mode and (b) defrost mode.
Energies 18 02244 g001
Figure 2. The outdoor microchannel heat exchanger installed (a) vertically and (b) horizontally: 17 tubes in 1st pass and 34 tubes in 2nd pass in HP mode.
Energies 18 02244 g002
Figure 3. The effects of defrost-initiation criterion on (a) heat exchanger capacities, (b) system COPhp and DPea of the outdoor evaporator, (c) frost accumulation on the outdoor evaporator at 0 °C and 90% RH.
Energies 18 02244 g003
Figure 4. The effects of defrost-initiation criterion on (a) heat exchanger capacities, (b) system COPhp and DPea of the outdoor evaporator, (c) frost accumulation on the outdoor evaporator at −5 °C and 90% RH.
Energies 18 02244 g004
Figure 5. The effects of defrost-initiation criterion on (a) heat exchanger capacities, (b) system COPhp and DPea of the outdoor evaporator, (c) frost accumulation on the outdoor evaporator at −10 °C and 90% RH.
Energies 18 02244 g005
Figure 6. (ac) Cycle evolutions in the T-h chart during the first frosting period under different outdoor temperatures.
Energies 18 02244 g006
Figure 7. (ac) The effects of defrost-initiation criterion on the frosting and defrosting time during continuous frosting–defrosting cycles under various temperatures and 90% RH conditions.
Energies 18 02244 g007
Figure 8. Frost distributions on the outdoor evaporator during the first frosting period. The arrows in the top-left image represent the refrigerant flow direction in HP mode. Reexamining the results in Figure 3 combing the frost images in Figure 8 and taking the case of outdoor temperature at 0 °C as an example, in the first 20 min of the first frosting period, the air-side pressure drop DPea increases slowly (1.8 Pa/min) in this early stage (as shown in Figure 3b) because the frost coverage and thickness are small at this point. From the 20th to the 50th minute, DPea increases at a much higher rate (8.9 Pa/min) due to a fast increase in frost coverage and thickness, which blocks the air flow. After 50 min, the increasing rate of DPea reduces to 3.3 Pa/min since the frost coverage is almost saturated and frost mainly grows in thickness in this stage. This analysis is verified by comparing the frost images in the middle and right columns of Figure 8. The total frost accumulation Mfrost, on the other hand, increases almost linearly by a rate of 11.83 g/min in the first 40 min and then increases by 1.68 g/min from the 40th to the 68th minute, as shown in Figure 3c. In the later stage, with a higher thickness of frost attached to the heat exchanger surface, the thermal resistance between the refrigerant and wet air is larger and the frost accumulation beomes slower. Similar trends can be observed in the first frosting period under both −5 and −10 °C outdoor conditions, as shown in Figure 4 and Figure 5.
Energies 18 02244 g008
Figure 9. Frost distributions on the outdoor evaporator during the second frosting period.
Energies 18 02244 g009
Figure 10. The effects of the outdoor heat exchanger orientation on (a) heat exchanger capacities, (b) system COPhp and DPea of the outdoor evaporator, (c) frost accumulation on the outdoor evaporator at the 0 °C and 90% RH condition.
Energies 18 02244 g010
Figure 11. The effects of the outdoor heat exchanger orientation on (a) the refrigerant pressure drop of the outdoor evaporator DPer, (b) the refrigerant temperature at the evaporator exit Tero.
Energies 18 02244 g011
Figure 12. Frost distributions on the horizontally and vertically installed outdoor evaporators during the first frosting period at 0 °C and 90% RH. Arrows in the figure denote the refrigerant flow directions in HP mode.
Energies 18 02244 g012
Figure 13. Frost distributions on the horizontally and vertically installed outdoor evaporators during the second frosting period at 0 °C and 90% RH.
Energies 18 02244 g013
Table 1. Uncertainties of the instruments.
MeasurementInstrumentRangeUncertainty
Refrigerant temperature
[°C]
T-type thermocouple−50 to 150±0.2
Refrigerant pressure (low side)
[MPa]
Strain gage0 to 6.89±0.003
Refrigerant pressure (high side)
[MPa]
Strain gage0 to 20.68±0.007
Refrigerant mass flow rate
[kg·h−1]
Coriolis-type0 to 2180/
0 to 6800
±0.10% of reading
Compressor power consumption
[kW]
3-phase wattmeter0 to 6±0.20% of reading
Air temperature
[°C]
T-type welded thermocouple −50 to 150±0.2
Dew point
[°C]
Chilled mirror dew point sensor−80 to 85±0.2
Pressure drop of air-side
[Pa]
Differential pressure transducer0 to 600±0.25% of the full scale
Table 2. Operating conditions of the experiments.
Microchannel Tube OrientationTeai
[°C]
RHei
[%]
Veai,ini
[m/s]
Tcai
[°C]
Ucai
[kg/min]
# of Frosting CycleDefrost Initiation CriteriaDefrost Termination Criterion
Vertical0/−5/−1090%3.1207.01/2/35/10 × DPea,iniTcro = 45 °C
Horizontal01/210 × DPea,ini
Table 3. Mass of frost and meltwater for continuous frosting–defrosting cycles with different defrost-initiation criteria under various ambient temperature conditions.
Parameter0 °C and 90% RH−5 °C and 90% RH−10 °C and 90% RH
5 × DPea,ini10 × DPea,ini5 × DPea,ini10 × DPea,ini5 × DPea,ini10 × DPea,ini
1st Cycle2nd Cycle3rd Cycle1st Cycle2nd Cycle1st Cycle2nd Cycle3rd Cycle1st Cycle2nd Cycle1st
Cycle
1st
Cycle
Mfrost
[kg]
0.4260.5230.5090.5200.5910.3340.3310.4200.5000.5560.5070.688
Mdrained
[kg]
0.0430.1110.1550.0840.2780.0080.0160.1080.1640.2960.1130.333
Mretained
[kg]
0.2190.2930.3270.3050.2980.1380.2450.2490.2450.2390.1590.212
Mvaporized
[kg]
0.1640.1190.0280.1310.0160.1890.0690.0620.0920.0220.2360.142
Disclaimer/Publisher’s Note: The statements, opinions and data contained in all publications are solely those of the individual author(s) and contributor(s) and not of MDPI and/or the editor(s). MDPI and/or the editor(s) disclaim responsibility for any injury to people or property resulting from any ideas, methods, instructions or products referred to in the content.

