1. Introduction
The low-voltage distribution system, as the power system terminal link, directly affects the user’s electricity experience. Its supply reliability is crucial for ensuring social production and residents’ daily lives. With rapid economic development and a continuous increase in electricity demand, users are placing greater demands on the power supply system stability. However, at present, China’s low-voltage distribution network still faces issues, such as aging equipment, uneven management levels, and insufficient supply capacity, especially during peak electricity usage, where the power supply instability is more pronounced, severely affecting the quality of users’ electricity. In recent years, the rapid expansion of low-voltage distribution networks has exacerbated these problems. The data show that the number of low-voltage users in the Southern Power Grid has reached 86.91 million, whereas the State Grid has even more, with 447 million low-voltage users. There are approximately 4.4 million transformers, and the total low-voltage distribution line length is 5.54 million kilometers, indicating a vast network involving numerous users and lines. As the network scale increases dramatically, the electricity demands of low-voltage users have also become more diversified and complex, with significant differences in demand across different regions and user groups. This raises higher requirements for the management and supply reliability of the low-voltage distribution network. Therefore, it is especially important to consider the user demand level in the reliability assessment of low-voltage distribution networks.
Many scholars have conducted studies on user demand levels and reliability assessments of distribution networks. Reference [
1] proposed an interval analytical hierarchy process that combines traditional analytical hierarchy methods with interval mathematics, effectively addressing the uncertainty of decision factors and the fuzziness of expert judgments. However, it fails to resolve the issue of excessive subjectivity in expert evaluations. Reference [
2] introduced a fuzzy analytical hierarchy process based on triangular fuzzy numbers, which improved the rigidity of point scoring by reducing the influence of individual expert preferences to some extent. Reference [
3] proposed a comprehensive evaluation method that improved the ideal solution algorithm, substituting the cosine angle distance for the Euclidean distance to address the potential linear relationships among evaluation indicators. Reference [
4] focused on a comprehensive evaluation method that combines subjective and objective factors, combining them based on game theory after assigning weights to both. It then employs cosine similarity theory and the superiority–inferiority distance method to improve the accuracy of the results under equidistant conditions. Reference [
5] studied the optimization method for indicator weight factors, proposing subjective and objective weight factor coefficients and their constraints to determine the comprehensive weight. Reference [
6] analyzed and compared various methods for determining indicator weights and proposed a fuzzy evaluation model based on ridge-shaped membership functions. For the reliability assessment on the low-voltage side, reference [
7] presented a reliability evaluation model, considering the reliability of overhead lines, transformers, and switchgear. Reference [
8] introduced an active circuit breaker correlation matrix to accurately identify fault sources at load points, thereby recognizing circuit breaker active fault events involving different sequences of sudden incidents. Reference [
9] established an “electricity price–reliability” analysis model to evaluate the impact of the user-side demand response on the reliability of power systems. Reference [
10] proposed a reliability assessment of power systems considering the uncertainty of user-side load demands. Reference [
11] provides a comprehensive and systematic analysis of rural low-voltage distribution networks, using the analytic hierarchy process (AHP) to assess individual indicators and scoring the reliability of the network based on index weights. Reference [
12] evaluates the operational reliability of urban low-voltage distribution networks using big data technology, considering the load transfer capacity. Reference [
13] addresses the different roles of various terminal configurations in the operation of low-voltage distribution networks and proposes a collaborative approach for assessing the reliability of medium–low-voltage power supply.
Corresponding studies in China have explored the dependability of low-voltage distribution networks. Reference [
14] integrates graph theory and artificial intelligence algorithms to propose a new fault zone location method for low-voltage distribution networks, providing a foundation for reliability weakness analysis. Reference [
15] introduces a collaborative reliability assessment method for medium- and low-voltage distribution networks, addressing the diverse and incomplete consideration of terminal types. Regarding the reliability index system, references [
16,
17,
18] analyze the relationship between power quality and reliability. The 2012 Regulations for Evaluating the Reliability of Power Supply to Customers of Power Supply Systems define continuous and short-time outages, yet a complete continuous outage time index system remains undeveloped. Reference [
15] highlights the importance of voltage transient issues in reliability assessment and suggests adding three supplementary indicators, the number of events, transient energy, and economic loss. However, these additions focus solely on voltage transients and fail to fully capture the impact of power quality on electricity reliability. Reference [
19] establishes user-side and comparative indicators to construct an electricity reliability index system, assessing actual reliability from two aspects, power supply continuity and electrical energy availability.
In terms of system reliability evaluation, reference [
20] presented a new method based on sampling processes for analyzing the reliability of distribution networks with limited data. Reference [
21] proposed a low-voltage power supply reliability evaluation method for distribution networks based on the quality governance of network operation records and power outage time data, achieving reliability evaluation for low-voltage users. Reference [
22] simplified the complex network into a simple radial network based on network reliability equivalence. Reference [
23] introduced an approximate reliability evaluation theoretical formula based on simulation analysis methods and quantitatively analyzes the extent of various influencing factors.
In summary, the existing issues include the following:
- (1)
The existing “one-size-fits-all” reliability management system does not consider user-side characteristics, leading to insufficient capability for the differentiated management of low-voltage reliability.
- (2)
Due to the poor quality of basic data for low-voltage distribution networks, there are significant gaps in the operational status monitoring data of low-voltage equipment. The application of traditional component reliability modeling methods at the low-voltage level carries the risk of failure.
- (3)
Methods for reliability assessment and identification of weak links in low-voltage distribution networks that can comprehensively consider the differentiated needs of users, equipment operational status, and other multifactor spatial–temporal coupling are lacking.
To address these issues, this paper proposes a tiered classification management system that is based on user demand and combines the Delphi method and gray relational analysis to construct a reliability assessment model for low-voltage distribution networks. The model simplifies the network structure via equivalent series methods, enabling more efficient and intuitive reliability analysis. Through case studies of transformer substations, weak links within the system are identified, and corresponding improvement measures are proposed, aiming to provide effective references for enhancing the reliability of low-voltage distribution networks.
2. Grading and Classification Management System Based on the Reliability Needs of Low-Voltage Users
The stability and reliability of power systems have always been key objectives for grid operators. The existing “one-size-fits-all” reliability management system fails to account for the differentiated characteristics of users, especially regarding the reliability needs of low-voltage users, leading to significant imbalances. The main challenges facing power systems today include the varying impacts of power outages on different types of users and how to manage resources efficiently given their constraints.
To address these issues, this paper proposes a grading and classification management system based on users’ electricity usage characteristics, utilizing Delphi and gray relational analysis methods for comprehensive weighting to optimize the evaluation and management of users’ reliability needs.
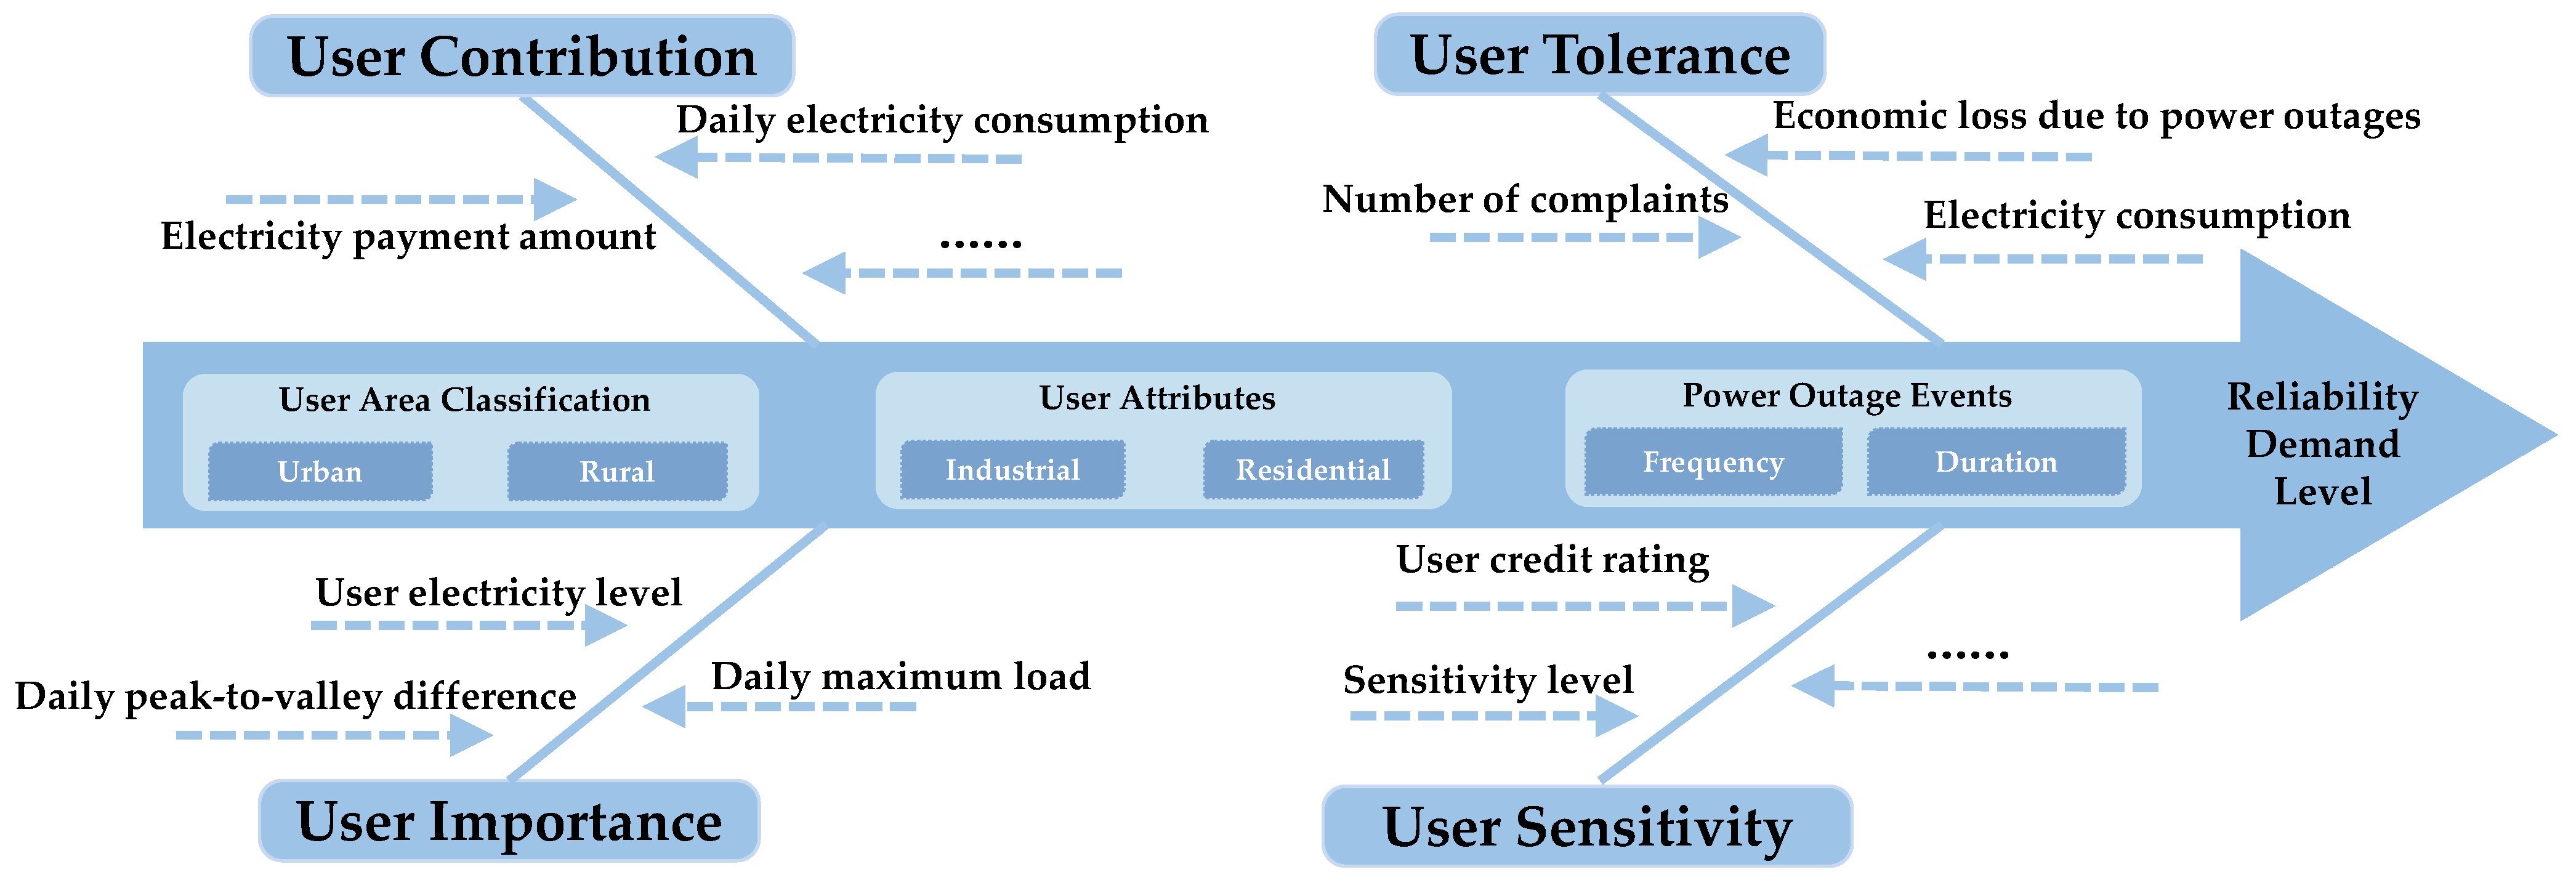
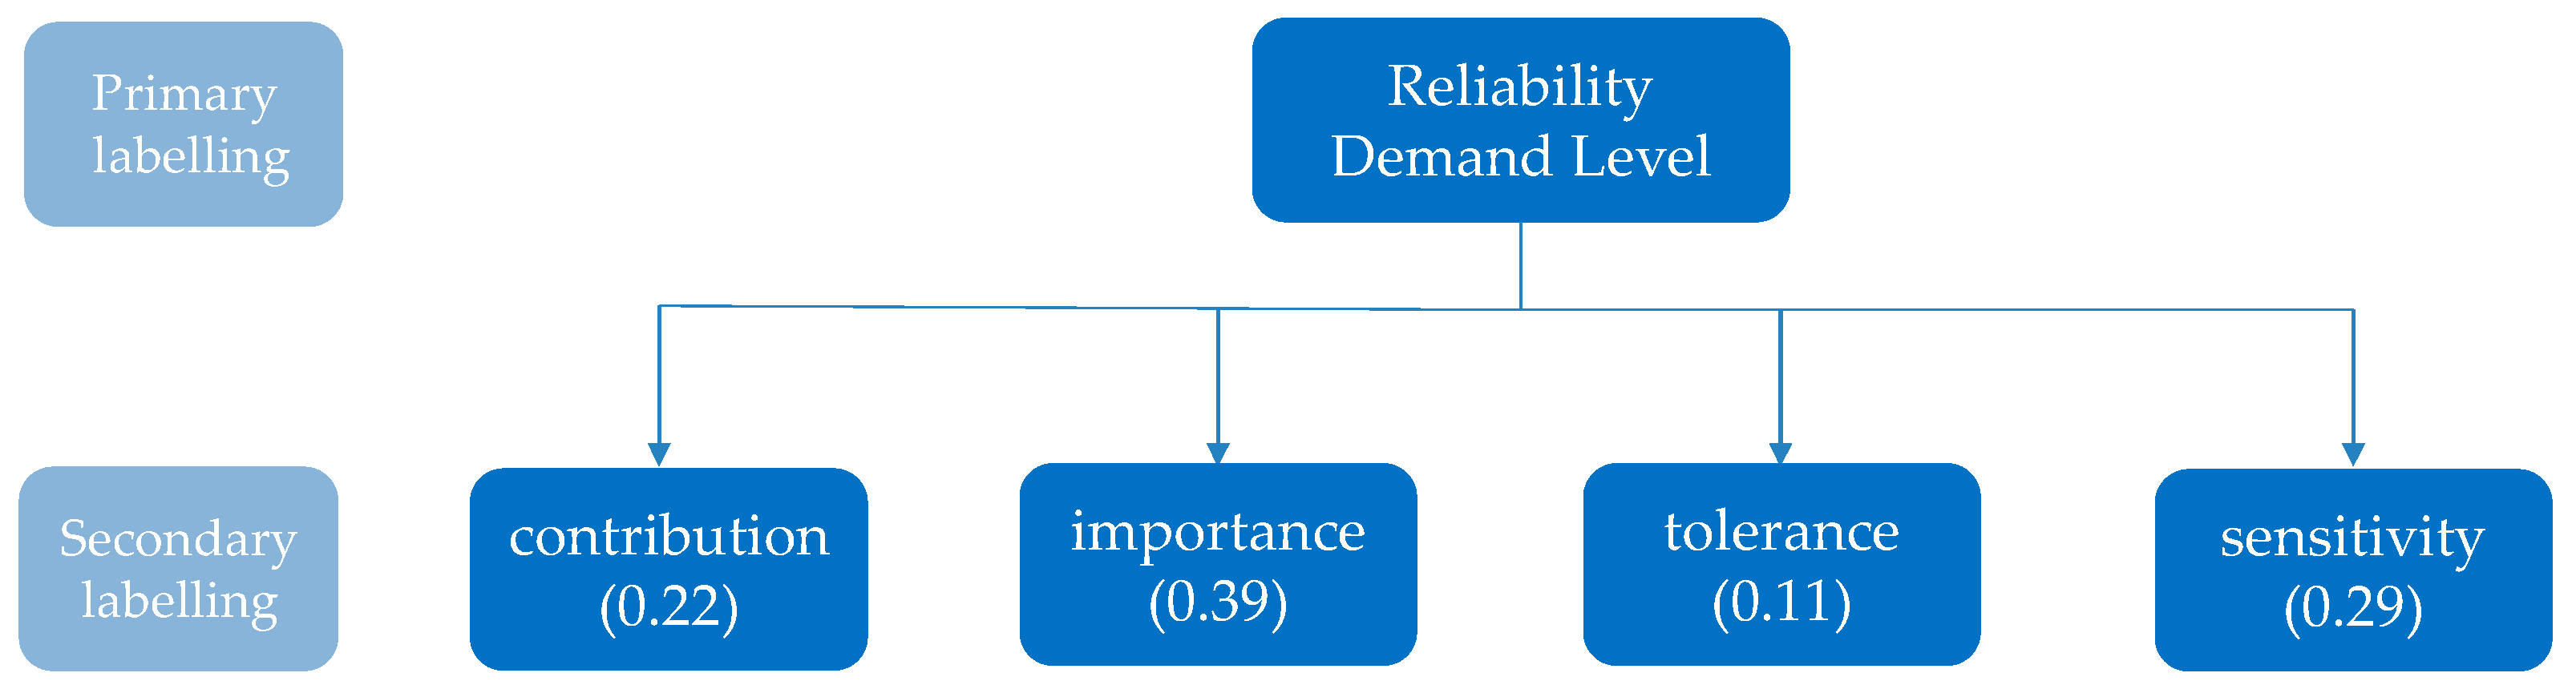
The proposed system establishes a three-level management framework tailored to the reliability needs of low-voltage users. The first-level indicator is the degree of reliability needs; the second-level indicator includes the user contribution, tolerance, importance, and sensitivity; and the third-level indicator incorporates the extracted user behavior characteristics. The specific grading and classification indicators are shown in
Figure 1.
2.1. Main Characteristic Indicators
To establish an effective hierarchical classification management system, an analysis of factors, such as daily electricity consumption, electricity bill payments, number of complaints, and outage duration, is conducted. These factors help extract the main characteristic indicators that influence user reliability needs, such as the contribution level, importance level, tolerance level, and sensitivity level. The following are electricity consumption characteristics.
- (1)
Daily electricity consumption: This reflects the intensity of a user’s power usage. Users with high electricity consumption typically demand higher supply reliability.
- (2)
Electricity bill payments: The amount paid for electricity is related to the user’s consumption level and economic capacity. Users with higher bills generally expect more stable and high-quality power services.
- (3)
Number of complaints: The frequency of complaints indicates a user’s satisfaction with and sensitivity to power services. Users who complain frequently are often highly concerned about power issues.
- (4)
Outage duration: This directly affects the user experience. Longer outages lead to higher demands for power supply reliability.
2.2. Weighting Methods and Model Construction
A hierarchical management system for low-voltage users’ reliability requirements has been fully developed, reflecting the reliability needs of different users from multiple levels and dimensions. The next step is to build an evaluation model to assess and compare the reliability requirements of low-voltage users, thereby obtaining quantitative analytical results. This process helps to identify and meet the low-voltage user reliability needs more accurately, improving the management efficiency and service quality of the power system [
24].
Typically, the construction steps of a comprehensive evaluation model include, first, clarifying the evaluation objectives and each level of the indicator system; second, collecting and organizing user electricity usage characteristics; third, applying appropriate weighting methods for comprehensive weighting of the indicators; and finally, using comprehensive evaluation methods to analyze the reliability needs of each user, forming a rational classification of user requirements. This process assists in precisely identifying and fulfilling the low-voltage user reliability needs, enhancing the management efficiency and service quality of the power system.
To more accurately evaluate user reliability requirements, this study adopts a combined comprehensive weighting method using gray relational analysis (GRA) and the Delphi method.
- (1)
Objective evaluation method—gray relational analysis: As an objective evaluation method, GRA determines the influence of each feature on user needs by analyzing the correlation between each user characteristic and reliability requirement. This method is particularly suitable for situations with limited data and incomplete information, revealing the relationships between different indicators to achieve a quantitative evaluation of user reliability needs.
- (2)
Subjective evaluation method—Delphi method: As a subjective evaluation approach, the Delphi method uses multiple rounds of expert feedback to reach consensus gradually, assigning weights to each indicator. This method leverages the knowledge and experience of experts to comprehensively evaluate subjective factors, such as user importance and sensitivity, ensuring the scientific and rational nature of the weighting process.
2.2.1. Objective Evaluation Method—Gray Relational Analysis
Gray relational analysis can analyze the degree of correlation among various factors within an indicator system. It is used to determine the weights of evaluation indicators by analyzing the correlation between a set of indicators and a certain ideal indicator set. The greater the degree of correlation is, the more consistent the indicators are with the ideal indicators, indicating a higher importance of the indicator within the overall indicator system and thus a larger weight. Conversely, a lower correlation results in a smaller weight. The GRA method can analyze the relationships between internal factors, while requiring low data quality; it can be applied even with a limited amount of data [
25].
The specific calculation steps are as follows:
- (1)
Determine the decision matrix
We need to find the attribute value
of the ideal sample scheme
for the indicator
.
Then, establish the decision matrix
.
where
and
.
- (2)
Determine the gray relational degree matrix
All the components of each row vector in the decision matrix are divided by the first component of the row. This results in the initialization matrix:
Calculate the gray relational degree of
with respect to
.
where
is the parent element,
is the child element, and
is the distinguishing coefficient with a value range of
, usually taken as
. Thus, the gray relational degree matrix
is obtained, as follows:
- (3)
Calculate the weight vector
Considering that
represents the gray correlation degree of
schemes for the
indicator, with
as the reference element and
as the compared element, it reflects the correlation between the actual value and the ideal value of the
indicator. The average value of each indicator’s row vector is taken to obtain the weight of the
indicator within the entire indicator space:
By normalizing , the weights of the indicators can be obtained, represented as , which forms the weight vector .
2.2.2. Subjective Evaluation Method—The Delphi Method
The Delphi method is a commonly used subjective expert opinion evaluation method that not only reduces the bias caused by the individual preferences of experts but also reflects the differences in opinions among them. In this study, the Delphi method is applied. Experts use their knowledge, experience, and personal views to assign weights to the indicators within the hierarchical classification system for reliability requirements, and the consistency of expert opinions is used as the criterion for determining the indicator weights [
26].
Assuming that the number of experts participating in the evaluation is , it can be represented as the expert set ; represents the expert, whose proposed weight allocation opinions for indicators are , and it satisfies . The calculation steps of the Delphi method are as follows:
- (1)
Calculating the concentration of expert opinions
Based on the weights
provided by experts in the field and the number of participating experts
, the expected value
of each weight can be calculated.
where
is the expected value of the weight for the
indicator; the weight expected value vector is
.
- (2)
Calculate the consistency of expert opinions
If the consistency of expert opinions is poor, the weighted expected values of the opinions obtained through Equation (7) may contradict the views of all the experts. Therefore, the Kendall coefficient of concordance is used to test the consistency of expert opinions, and the process is as follows:
For
, the provided weight vector is
, and the corresponding rank vector is constructed, as follows:
where
represents the rank of
in
. The specific assignment method is as follows: when
is the minimum value among all the components in
, assign
; when
is the second minimum value among all the components in
, assign
; and so on, to obtain the corresponding rank vector values.
The consistency of expert opinions can be represented by the Kendall concordance coefficient.
- (3)
Determine whether reconsultation is necessary
According to the Kendall coefficient significance critical value table (
Table 1), we check whether the significance level is reached. If it is greater than the critical value in the table, the significance level is considered achieved, indicating strong consistency among expert opinions, and the weight expectation values are output. Otherwise, it is necessary to reconsult the experts regarding the weights of each indicator until it exceeds the critical value in the table.
According to the Kendall coefficient significance critical value table (
Table 1), we check whether
reaches the significance level. If
is greater than the critical value
in the table, the significance level is achieved, suggesting strong consistency among expert opinions, and the weight expectation value
is output. Otherwise, it is necessary to reconsult the experts regarding the weights of each indicator until
exceeds the critical value
in the table.
2.2.3. Combined Subjective and Objective Weighting Method
The subjective weighting method (Delphi method) and the objective weighting method (gray relational analysis) each have advantages and disadvantages. By combining these two methods, the weights not only incorporate the information from the data itself but also reflect the subjective judgments of the experts. Currently available comprehensive weighting methods typically involve a weighted average of the results from subjective and objective weighting methods, which may lack rationality. Therefore, this study introduces game theory for comprehensive evaluation, using the NASH equilibrium as a coordination objective. The basic idea is to find consensus or compromise among different weights via a game theory model, minimizing the deviation between possible weights and their respective base weights, ultimately resulting in a more balanced comprehensive weight.
Using
methods to determine the weights of each indicator in the comprehensive evaluation index system, a basic weight set
is constructed. By linearly combining the
vectors within this set, a comprehensive weight set is established, as follows:
To find the most satisfactory weight
from the comprehensive weight set, a game theory model is employed to optimize the linear combination coefficients
in the above expression. The optimization goal is to minimize the deviation of
from each
. Therefore, the following countermeasure model can be derived:
The essence of this countermeasure model is a planning model that combines multiple weight vectors in a cross manner. Based on the differential properties of matrices, the first-order derivative condition for the optimization of the above expression can be derived, as follows:
Calculating yields
, which is then normalized, as follows:
Therefore, the comprehensive weight is obtained, as follows:
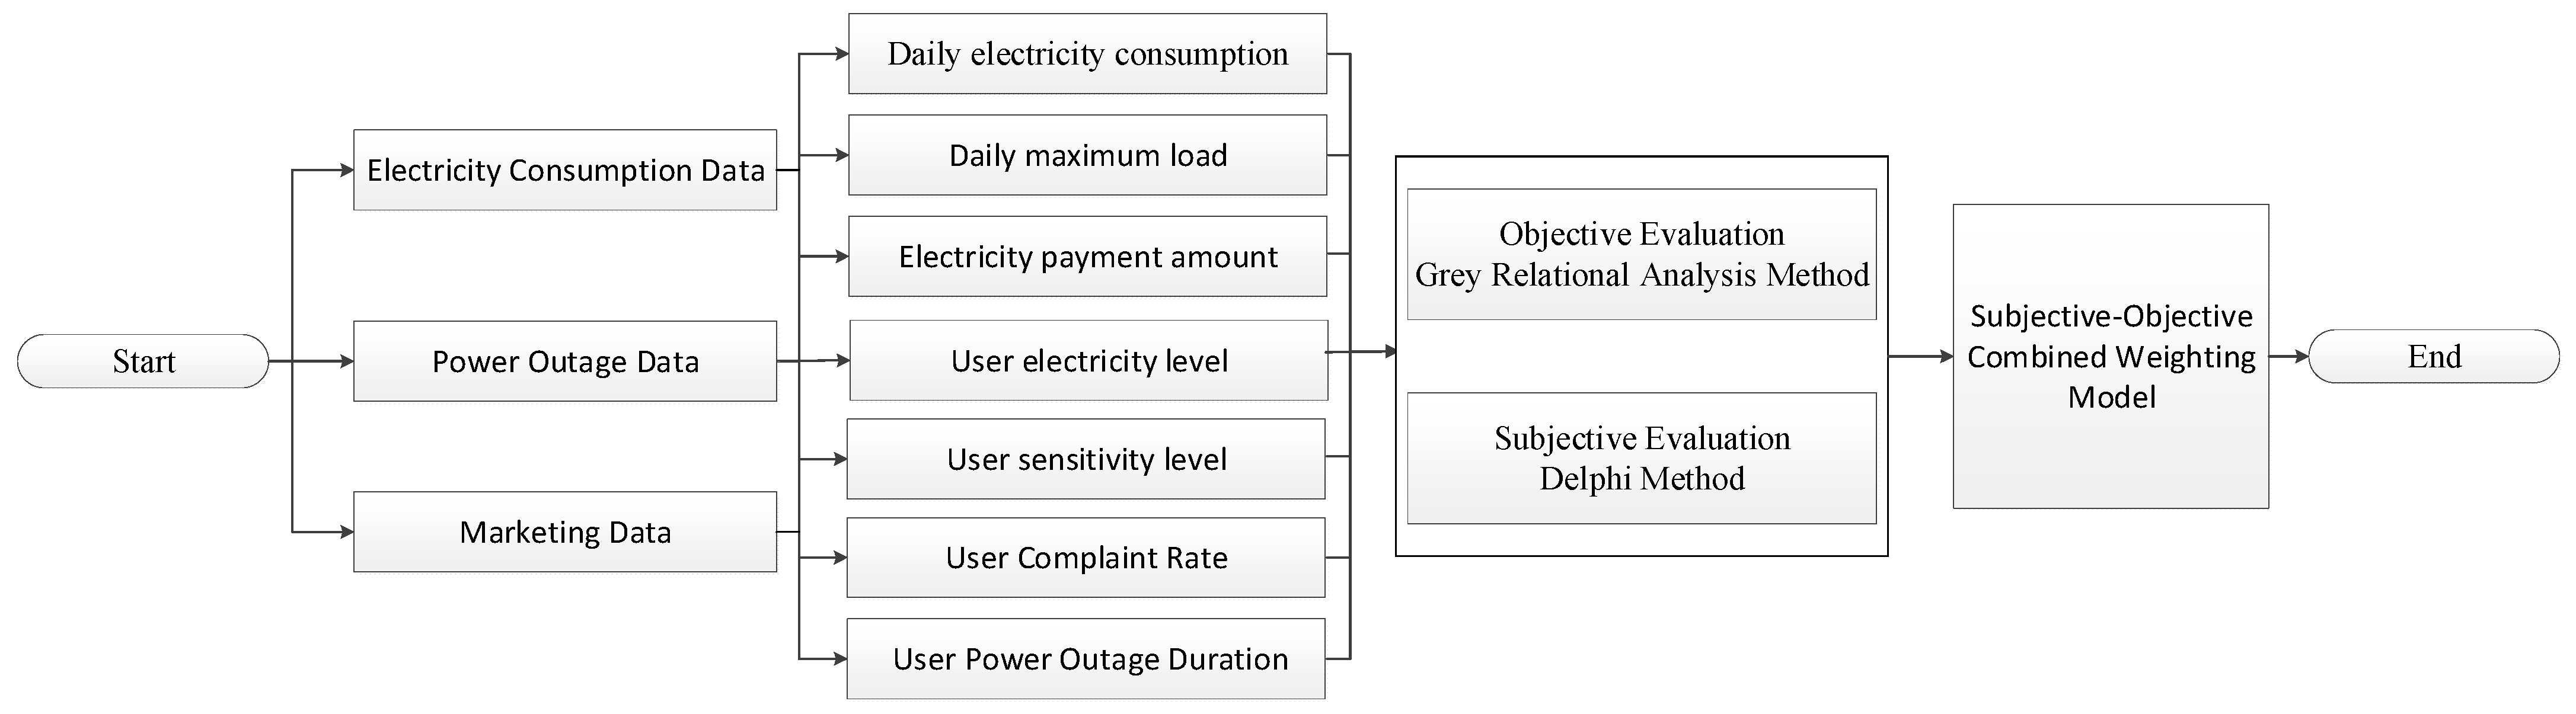
As shown in
Figure 2, by using the Delphi method and gray relational analysis to calculate the weights of various indicators, a basic weight set is constructed. The combination of these two methods through a game theory-based comprehensive weighting approach yields a more balanced overall weight, enabling the precise classification of user reliability requirements and providing data support for differentiated management in the power system.
3. Reliability Indicator System for Low-Voltage Distribution Networks
The evaluation of power supply reliability in low-voltage distribution networks is crucial for ensuring the efficient operation of the power system. With the increasing expectations of users regarding electricity services, traditional reliability assessment methods no longer adequately reflect the operational status of low-voltage networks and user experiences. Therefore, establishing a power supply reliability indicator system for low-voltage distribution networks that meets modern electricity demands is essential. This system should not only consider the operational status of equipment but also assess the impact of power outages from the user’s perspective.
3.1. Differences Between the Power Supply Reliability Indicator Systems of Medium- and Low-Voltage Distribution Networks
The medium-voltage distribution network typically covers a wide area, including industrial, commercial, and high-density residential users. Its main characteristic is that it supplies power to a broad range of loads through a relatively small number of transformers, substations, and lines. Owing to the strong power supply capacity of the medium-voltage network and its higher technical standards for equipment, its reliability assessment focuses primarily on indicators, such as outage frequency, fault restoration time, and system availability, particularly the ability to coordinate recovery during large-scale outages and between equipment. In the medium-voltage network, the reliability of distribution transformers and lines is crucial, with the performance of these devices being the main measure during assessment, ensuring the overall network’s stability and efficient power supply.
In contrast, the primary low-voltage distribution network users are households, small shops, and other end-users sensitive to power supply reliability. Given the smaller coverage area, higher user density, and more complex and smaller capacity equipment distribution in low-voltage networks, their reliability assessment emphasizes the actual user experience. For example, low-voltage network users are more sensitive to short-term outages or frequent interruptions, making customer outage duration (SAIDI) and outage frequency (SAIFI) the core indicators of low-voltage network reliability assessment. Additionally, low-voltage network outages are more susceptible to local faults, such as the failure or maintenance of a single piece of equipment causing power interruptions for a small number of users, which is quite different from the impact mechanism of large-scale events in medium-voltage networks. The key aspects focused on by the two objects can be seen in
Table 2.In summary, the focus of the medium-voltage distribution network’s reliability indicator system is on the supply stability and equipment coordination of large-scale networks, whereas the low-voltage distribution network places more emphasis on the user experience, highlighting user-perceived indicators, such as outage frequency and duration. This difference determines the distinct evaluation methods and management strategies for the two networks.
3.2. Construction of the Low-Voltage Distribution Network Power Supply Reliability Indicator System
The construction of the low-voltage distribution network power supply reliability indicator system must align with the characteristics of low-voltage networks, considering multiple factors, such as equipment status and user experience, to ensure stable network operation, while meeting diverse user demands. As shown in
Table 3, based on a differentiated evaluation system of user needs and equipment performance, this paper establishes a comprehensive power supply reliability indicator system aimed at scientifically assessing the reliability of low-voltage networks, thereby increasing the precision of distribution network management.
First, the low-voltage distribution network’s power supply reliability indicator system is divided into two major categories, equipment-side and user-side indicators. Equipment-side indicators mainly include the equipment failure rate, maintenance duration, and fault recovery time, reflecting the operational status and fault response capability of low-voltage distribution equipment. By statistically analyzing the failure data of transformers, low-voltage switches, and lines, the operational status of critical equipment in the network can be obtained, thus assessing their contribution to the overall reliability of the network.
Second, the user-side indicators focus on reflecting the user electricity consumption experience and include the system average interruption frequency index and the system average interruption duration index. User-side reliability indicators demonstrate the direct impact of power interruptions on users, serving as key benchmarks for assessing low-voltage distribution network reliability. For residential and small commercial users in particular, the frequency and duration of power outages are critical factors that directly affect the quality of the power supply. Therefore, such indicators hold a significant position in low-voltage distribution network evaluations.
Additionally, the reliability assessment of low-voltage distribution networks must consider user categorization and regional characteristics. Different users have varying power supply demands and reliability requirements; for example, critical load users (such as hospitals and data centers) have higher power supply requirements, whereas regular residential users tend to have greater tolerance. Therefore, the indicator system needs to provide tiered and classified evaluations to ensure that the needs of different categories of users are fully met. Regional characteristics also influence power supply reliability. For example, rural and urban low-voltage distribution networks differ significantly in equipment configuration and maintenance due to geographic conditions and user density. Hence, the indicator system must accommodate these regional characteristics, adjusting evaluation methods and standards accordingly.
By establishing a comprehensive and scientific low-voltage distribution network power supply reliability indicator system, the management efficiency and fault response capability of the power grid can be significantly improved, providing a theoretical foundation and practical support for achieving efficient and safe power supply services.
The average outage hours per low-voltage user per year is denoted as
, with the unit being ‘hours/(user·year)’. The calculation formula is as follows:
where
represents the expected value of the system’s average outage duration due to low-voltage equipment failures (such as cables, overhead lines, switches, etc.);
represents the expected value of the system’s average planned outage duration due to low-voltage equipment; and
represents the expected value of the system’s average outage duration caused by user-side equipment failures. The first two factors are the responsibility of the grid-side equipment, whereas the latter is the responsibility of the user-side equipment, thus achieving a division of responsibilities among multiple entities.
where
represents the expected outage duration for low-voltage users due to low-voltage equipment failure;
is the expected outage duration for low-voltage users due to scheduled outages of low-voltage equipment;
represents the expected outage duration for low-voltage users due to failures of user-side equipment; and
denotes the demand level of each user.
4. Reliability Assessment Method Based on an Equivalent Series Model
4.1. Equivalent Model of a Low-Voltage Power Supply System
The complexity of low-voltage power supply systems lies primarily in the diversity of their network structure and equipment composition. To increase the evaluation efficiency and reduce the computational complexity, this paper adopts an equivalent series model to simplify the reliability assessment of low-voltage power supply networks.
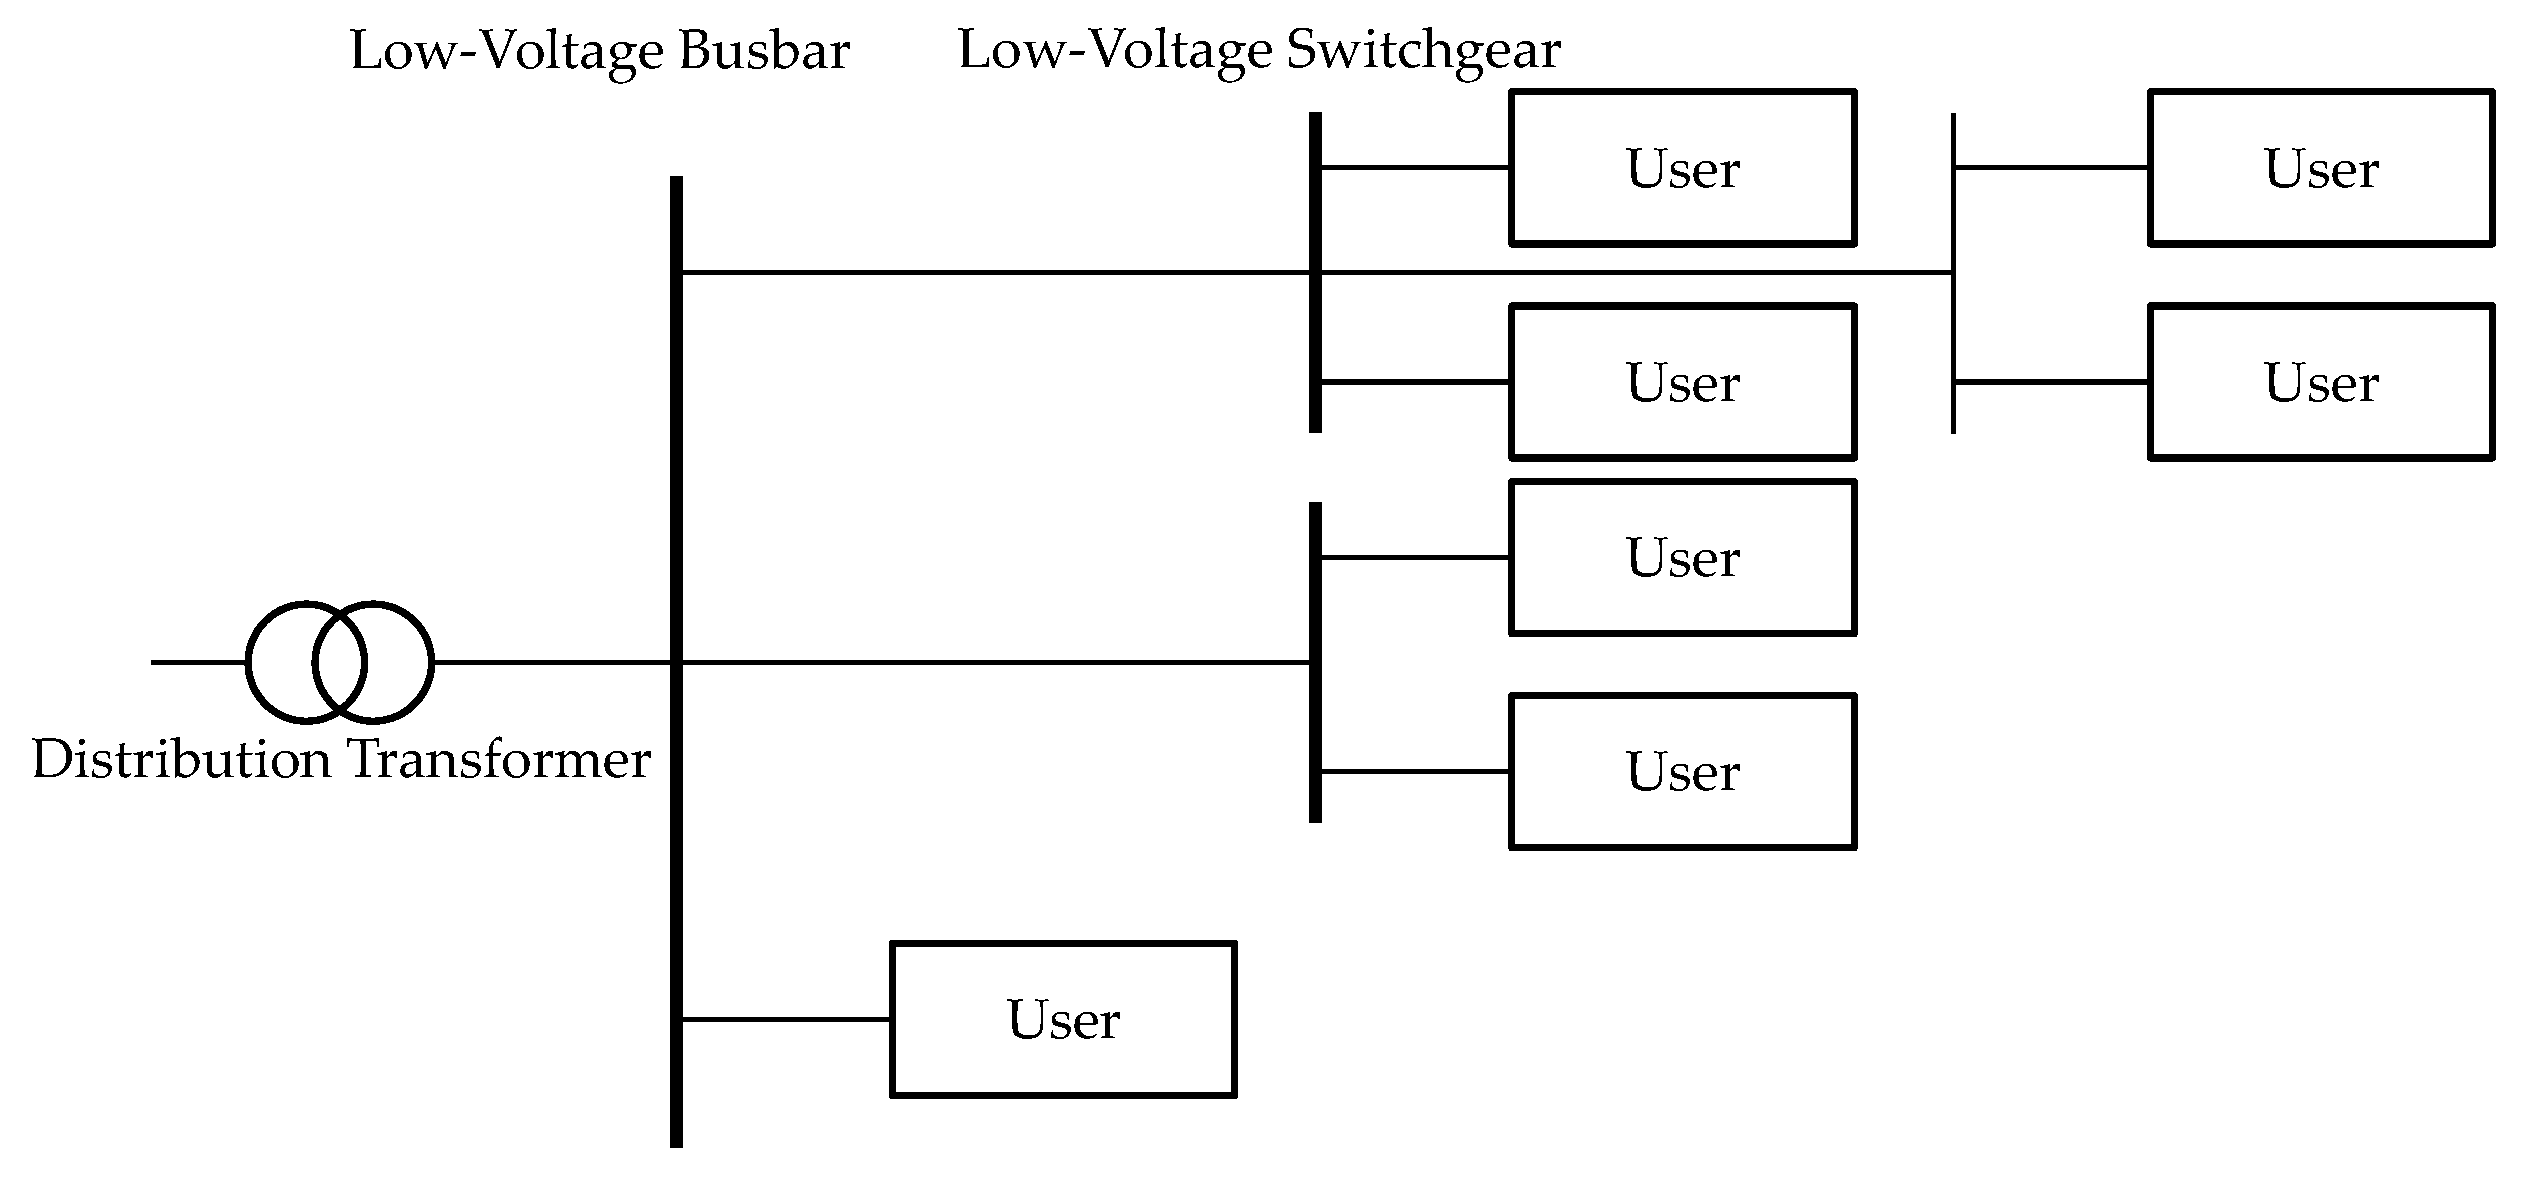
The construction of the equivalent model is based on the open-loop radial structure of low-voltage power supply networks. In this structure, electricity is transmitted from the main substation through several medium- and low-voltage devices to end users. Each segment of the power transmission path may lead to supply interruptions due to equipment failure; thus, the entire system can be viewed as a supply chain composed of multiple series devices. As shown in
Figure 3 and
Figure 4, this simplified model transforms complex network topology into several serial links with clear fault impact relationships, where the reliability of each device directly affects the power supply status for users.
In the equivalent model, each device unit (such as low-voltage switches, transformers, and lines) is simplified to an independent reliability node. The failure probability and repair time for each node can be assessed via historical data and statistical models. This equivalent series approach effectively reduces the need to consider complex fault propagation relationships within the network, making the overall assessment process more intuitive and efficient.
Moreover, the equivalent model of low-voltage power supply systems demonstrates good adaptability and is suitable for handling different load distributions and equipment configurations in low-voltage network structures. By equivalently processing the failure rates of various device nodes within the network, evaluators can quickly identify which devices have the greatest impact on power supply reliability, thus providing strong support for formulating targeted equipment maintenance strategies. This model not only simplifies the calculation process but also enhances the efficiency of identifying weak links within the system.
The failure rates and repair times of the equipment in this study are derived from fault work orders, which can be obtained through the following equation:
Among them, the types of equipment used include switches, low-voltage cables, overhead lines, and electric meters.
Among them, M represents the set of devices along the path from the transformer to device (including the faults of the user-side devices themselves).
4.2. Evaluation Process
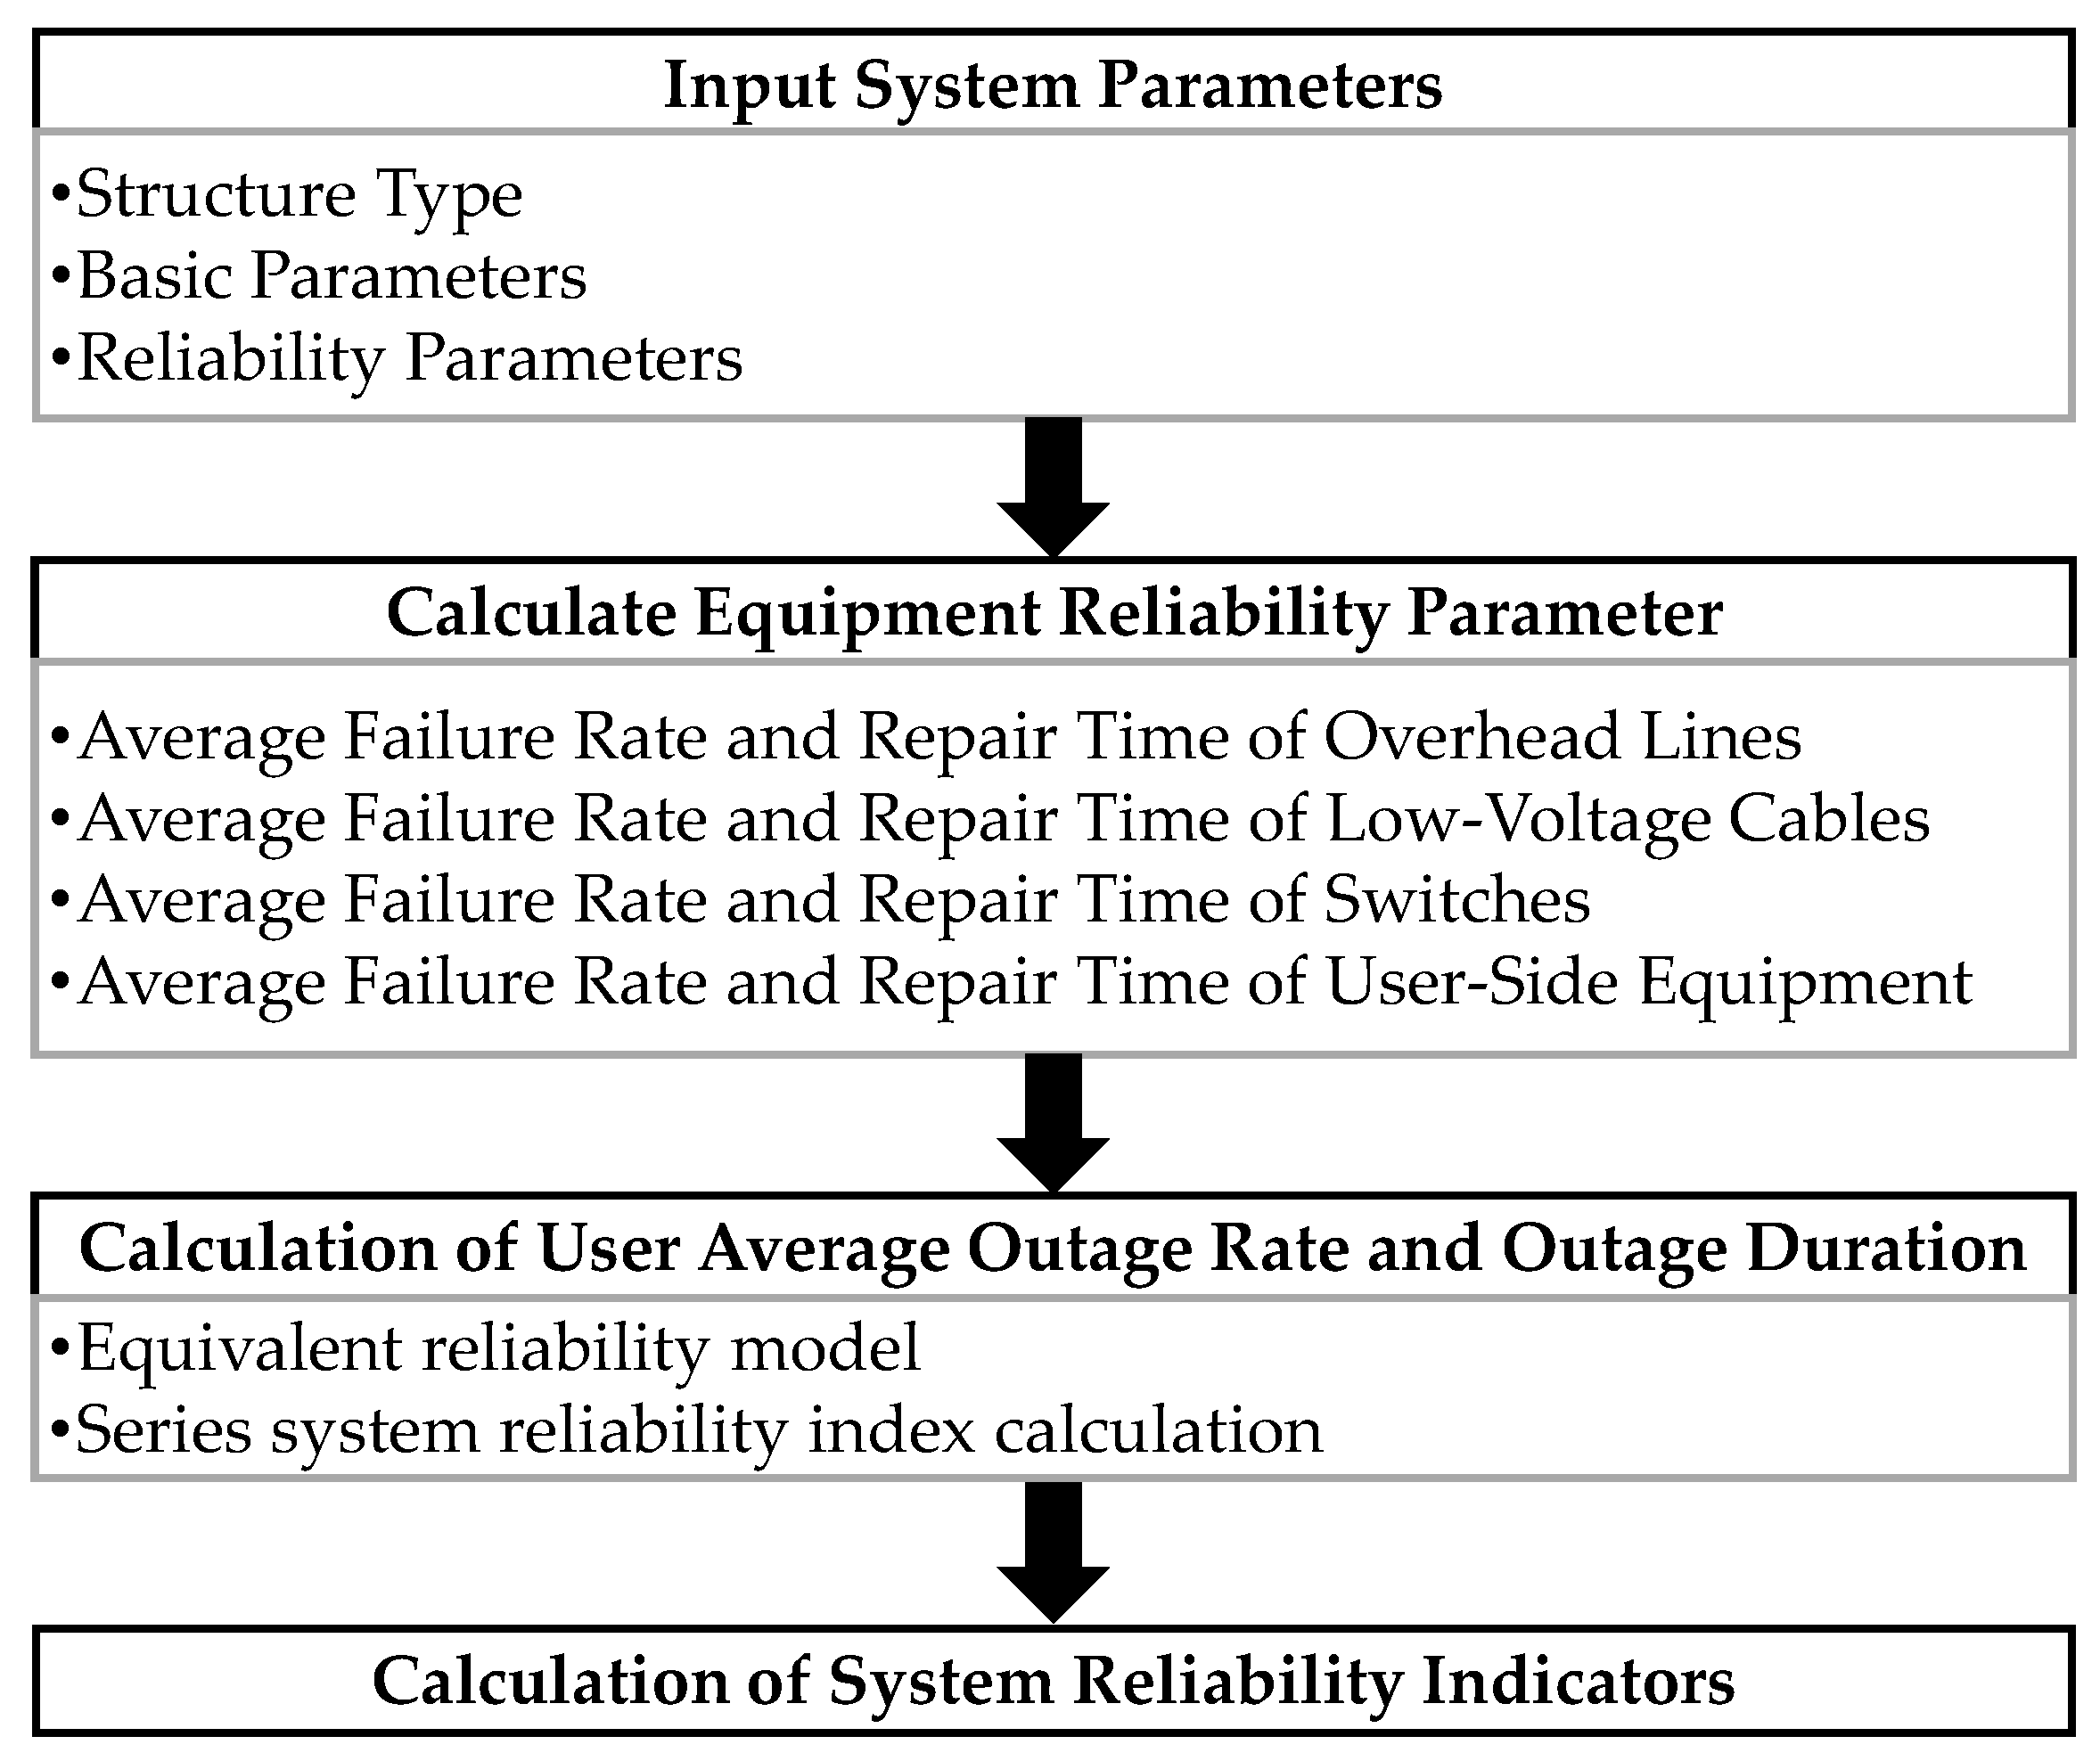
The reliability evaluation process of the low-voltage power supply system covers several steps, from inputting system parameters to calculating reliability indices, each of which significantly impacts the overall evaluation results. Based on the equivalent model and evaluation method, the process can be divided into the following four main stages: inputting system parameters, calculating equipment reliability parameters, calculating the user outage rate and outage duration, and calculating system reliability indices. The detailed evaluation process is shown in
Figure 5.
- (1)
Step 1: Input System Parameters
In the evaluation process, the first step is to input the system parameters related to the low-voltage distribution network. These parameters serve as the foundation for the subsequent evaluation and specifically include the following.
Structure type: This type refers to the topology of the distribution network, such as overhead lines, underground cables, or hybrid structures. This directly impacts the evaluation results of power supply reliability, as different types of structures have varying probabilities of failure and repair times.
Basic parameters: These parameters include the number of devices, load types, and line lengths within the network. These fundamental parameters reflect the scale and complexity of the distribution network and influence the calculation of failure rates for equipment and users.
Reliability parameters: These parameters refer to the failure rate and repair time of various equipment types. These data are usually obtained through historical operational statistics and serve as the core basis for evaluating the reliability of equipment and the overall system.
- (2)
Step 2: Calculate Equipment Reliability Parameter
After the system parameters are input, the next step is to calculate the reliability of various equipment within the network. The main equipment reliability parameters include the following categories:
Average failure rate and repair time of overhead lines: Due to their exposure to external environments, overhead lines have a relatively high failure rate. It is essential to pay close attention to their outage frequency and repair time during evaluation.
Average failure rate and repair time of low-voltage cables: Low-voltage cables are typically buried underground and are less affected by environmental factors; however, they have longer repair times. Therefore, their specific characteristics should also be considered in reliability evaluation.
Average failure rate and repair time of switches: Switches in low-voltage networks are critical devices for fault isolation and power restoration. Their performance directly affects the speed of power recovery.
Average failure rate and repair time of user-side equipment: User-side equipment represents the final stage of power transmission and is a crucial factor in end-users’ perception of power quality. By analyzing the failure data of the user-side equipment, the user-level outage duration and failure frequency can be obtained.
- (3)
Step 3: Calculation of the User Average Outage Rate and Outage Duration
After completing the calculation of equipment reliability parameters, the assessment process moves to the analysis on the user side. The average outage rate and outage duration for users are key indicators reflecting the user’s electricity experience. They are calculated based on an equivalent model. This mainly includes the following:
Reliability model for each instance: By using the failure rates and repair times of user-side equipment, the average frequency and duration of outages experienced by users can be calculated.
Calculation of the user outage rate: Based on the failure rates of equipment, the scope of outage impact, and the system topology, a comprehensive evaluation is conducted to determine the number of outages experienced by users.
Calculation of user outage duration: The length of the outage duration depends on the speed of equipment repair and the fault isolation capability. In the assessment, the average outage duration for users is derived by considering the repair time and impact range for each fault.
- (4)
Step 4: Calculation of System Reliability Indicators
The final step is to calculate the reliability indicators of the entire low-voltage power supply system. The core reliability indicators of the system are derived based on the fault conditions of the equipment and the user outage experience. These indicators include the following.
System average interruption frequency index: This index reflects the frequency of outage events experienced by users within a specific period.
System average interruption duration index: This index represents the average duration of outages experienced by users within a specific period.
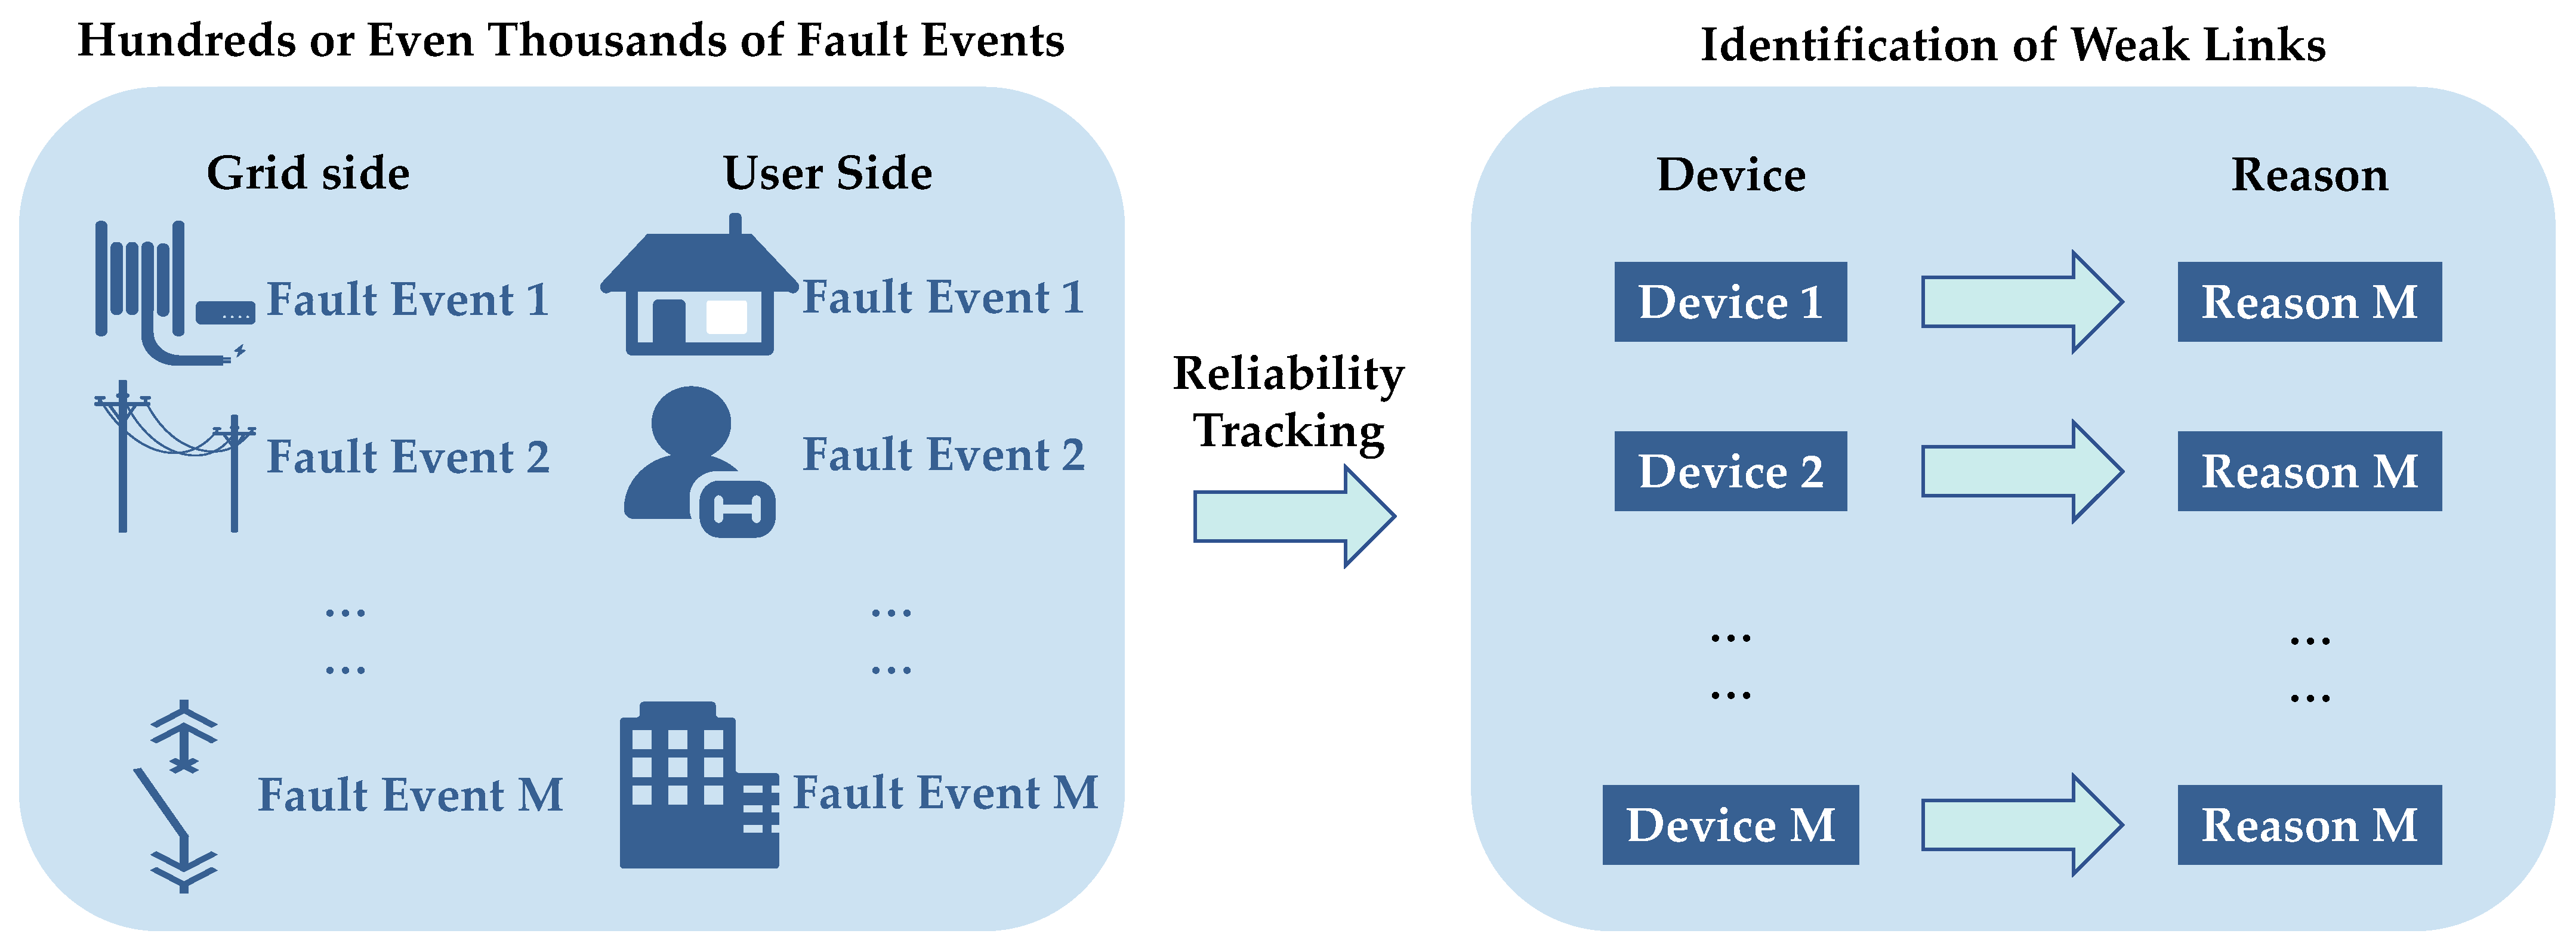
5. Tracking Reliability and Identifying Weaknesses in Low-Voltage Distribution Networks
5.1. Tracking Reliability of Low-Voltage Distribution Networks
According to the power system reliability assessment principles, each system failure state is caused by one or more component failures, and their impacts on the corresponding reliability indicators vary. The purpose of reliability tracking is to identify the proportional relationship of how faulty components contribute to the unreliability indicators of failure events, further revealing the “contribution” proportions of each component to the system’s unreliability indicators. To achieve this, establishing a criterion for allocating the “responsibility” of a failure event is necessary. Given that the concept of proportional allocation is widely used in areas such as power system flow calculations and is straightforward, this study adopts a similar approach to investigate the reliability tracking issues of large power systems, the specific idea is shown in
Figure 6. First, two basic criteria for reliability tracking are presented.
Criterion 1: The unreliability of the system is borne by the faulty components, meaning that normally operating components do not participate in the allocation of unreliability indicators. In other words, normally operating components do not bear the “responsibility” for any outage event.
Criterion 2: The allocation of unreliability indicators among components is performed proportionally, using a proportional allocation criterion.
Based on these criteria, the proportional allocation method for the system’s unreliability can be derived, as follows: assume a system has components denoted as , where represents the performance parameters of component iii, and denotes the reliability indicators of a certain event in the system, which is a function of .
For simplicity, we assume that a certain failure event is caused by the failure of components and . Let be divided into three parts:
Part 1: is related only to the component BBB;
Part 2: is related only to component DDD;
Part 3: is related to other components excluding and .
According to Criterion 1, the system failure event
should be the responsibility of the faulty components
and
. Let
and
represent the reliability indices allocated by the faulty components
and
, respectively. Then, by Criterion 2:
Equations (30) and (31) indicate that the proportional allocation criterion has two obvious characteristics:
- (1)
The proportional allocation criterion exhibits symmetry, meaning that is merely a symbol that can represent any component.
- (2)
The proportional allocation criterion possesses identity, allowing for the complete allocation of the system’s reliability indices:
Let the probability of a failure event
occurring be:
where
and
represent the failure probabilities of components
and
, respectively, and where
and
denote the sets of failed and operational components, respectively.
According to reliability tracking Criterion 1 and 2, the allocation
of the probability of failure event
for any component
is as follows:
Here, a method for allocating SAIDI for any equipment and cause in a low-voltage distribution network is presented.
If there are a total of
different types of equipment in the system, let
represent them. The probability corresponding to any component
of the system equipment is
:
Let set
represent all the event sets corresponding to equipment
in the system. According to Equation (36), the allocation of
for a specific component
is
:
5.2. Identification of Reliability Weak Links Based on Chain Tracking
- (1)
First allocation
The objects participating in the initial allocation are the equipment. The probability distribution results of the
states of equipment
contributing to the
states of the reliability of the low-voltage distribution network can be expressed in matrix form as:
In the equation , the matrix element represents the probability distribution result of equipment state on the reliability state of the low-voltage distribution system .
- (2)
Second distribution
Let a certain device
have a total of
states
, and let
have a total of
failure causes
. The probability distribution results corresponding to
failures for the
states can be represented in matrix form as:
where
, the matrix element
represents the probability distribution result of failure causing
in device
with respect to state
.
- (3)
Combining the two distributions
After matrices
and
are obtained, the results of the two distributions can be combined. First, each row of matrix
is normalized to obtain matrix
(if all the elements in a row of
are zero, normalization for that row is not required):
Similarly, matrix is normalized to obtain matrix . Matrix represents the distribution ratio of the probabilities of internal causes within equipment for the states, whereas matrix indicates the distribution ratio of the probabilities of the states of equipment to the overall system state probabilities in the low-voltage distribution network.
Therefore, the distribution results of the
causes within equipment
for the reliability indicators of the low-voltage distribution network can be expressed as:
As shown in
Figure 7, this method is not limited to faulty equipment; tracking and distributing multiple outage events enables identification at both the equipment level and the cause level. The chain-tracking method is divided into the first distribution and the second distribution. The first focuses on the impact of equipment failure, whereas the second focuses on specific causes of failure, such as overload tripping or faults in the lines before the meter.
7. Conclusions
This paper addresses reliability issues in low-voltage distribution networks in China by proposing a tiered classification management system based on user demands. We constructed a comprehensive evaluation model utilizing the Delphi method and gray relational analysis. To enhance the reliability assessment of low-voltage networks, we simplified the complex network structure using an equivalent series model, effectively integrating low-voltage topology and fault work order data. This approach not only ensures the feasibility of the model but also its practical application in engineering contexts.
Through case studies of Substations A and B, we successfully identified key factors affecting power supply reliability and devised a method for the rational allocation of electrical resources to meet the diverse needs of different user groups, thereby significantly improving the overall quality of power supply services. This research provides a solid foundation for advancing the intelligent management of low-voltage distribution networks and lays the groundwork for future studies that combine real-time monitoring with big data analysis. By doing so, we can achieve more precise assessments and management of power supply reliability.
The novelty of this study lies in its integration of multiple methodologies, including the Delphi method and gray relational analysis, to provide a robust and innovative framework for assessing and improving the reliability of low-voltage distribution networks. Specifically, the introduction of an equivalent series reliability assessment method allows for simplifying the complex network structure, making the reliability evaluation more efficient and practical. Additionally, the identification of weak links in the system through a chain tracing method represents a novel approach to pinpointing and addressing reliability issues in low-voltage networks. These innovations contribute significantly to the advancement of tiered classification management based on user demands, ensuring that power supply systems can adapt to the varied needs of modern society. This study not only contributes to the sustainable development of China’s power system but also offers valuable insights and a reference for power supply management in other regions with similar infrastructure challenges.


 ,
, 


