Article

Exploring the Future Energy Value of Long-Duration Energy Storage

National Renewable Energy Laboratory, Golden, CO 80401, USA
*
Author to whom correspondence should be addressed.
Energies 2025, 18(7), 1751; https://doi.org/10.3390/en18071751
Submission received: 22 January 2025 / Revised: 25 March 2025 / Accepted: 26 March 2025 / Published: 31 March 2025
(This article belongs to the Section D: Energy Storage and Application)

Abstract

:
Long-duration energy storage is commonly viewed as a key technology for providing flexibility to the grid and broader energy systems over a multidecadal time frame. However, prior work has typically used present-day grid infrastructures to characterize the relationship between the duration and arbitrage value of storage in electricity markets. This study leverages established National Renewable Energy Laboratory grid planning and operations tools, analysis, and data to execute a price-taker model of an energy storage system for several 8760 h price series representative of current and future contiguous United States grid infrastructures with varying shares of variable renewable energy (VRE). We find that the total value of energy storage typically increases with VRE shares, but any increase in the relative value of longer storage durations over time depends on the region and grid mix. Some regions see incremental value increasing notably, up to 20–40 h in 2050, while others do not. The negative effect of lower roundtrip efficiency on value is also found to be scenario-dependent, with the energy value in higher VRE scenarios being less sensitive to roundtrip efficiency and more supportive of longer storage durations. Long-duration storage value and deployment potential are a function of evolving electricity sector infrastructure, markets, and policy, making it critical to consistently revisit potential long-duration storage contributions to the grid.

1. Introduction

The electricity sector is experiencing accelerated deployment of weather-driven, variable renewable energy (VRE). Increasing shares of VRE on the grid create challenges with balancing supply and demand, as weather cannot be perfectly forecast and VRE technologies such as wind and solar photovoltaics (PV) generally provide electricity to the grid on an as-available basis (i.e., their energy output is not fully dispatchable to meet grid needs at any and all times). These challenges present opportunities for energy storage to respond to fluctuations in energy supply and help balance the grid on multiple timescales, from sub-second to seasonal, improving VRE integration at lower system cost [1].
The majority of storage deployed in the United States since 2010 has been lithium-ion battery storage with durations of 4 h or less [2]. These shorter-duration storage facilities have been dispatched primarily in ancillary services markets [2]. However, ancillary services markets are relatively limited and can become saturated relatively quickly, driving down prices and, therefore, participants’ potential revenue [3,4,5].
Durations of exactly 4 h have become increasingly common because many jurisdictions designate 4 h as the threshold for receiving full capacity credit, which is a metric to quantify the storage resource’s contributions to resource adequacy, an important aspect of grid reliability. Revenue from capacity markets has become increasingly important to the value proposition of storage. Studies examining the continued deployment of energy storage show that, at some point, 4 h of duration will no longer be sufficient for addressing resource adequacy in most regions, with the specific requirements depending on the load shape, the share of solar PV, and whether the system is winter versus summer peaking [6,7,8,9].
One of the key drivers of the deployment of energy storage is its ability to provide—and receive compensation for—multiple services at once, which is known as value stacking [10]. Survey data collected by the U.S. Energy Information Administration (EIA) indicate that over 75% of energy storage assets in the United States in 2022 provided multiple services, with an average number of 2.4 services provided per asset [11]. That same survey indicates that price arbitrage, i.e., buying at low prices and selling at high prices, is becoming a more common service provided by storage facilities. Aurora Energy Research reports that, in the future, the value of energy storage will derive primarily from capacity revenue and arbitrage revenue, but both revenue streams are highly sensitive to location [12,13]. Understanding how location-specific, grid-dependent factors influence the arbitrage value of storage at varying durations is a step towards understanding the future role and deployment potential of long-duration energy storage in the electricity sector as it evolves over time.

2. Literature Review

Lithium-ion battery costs have declined over the past 15 years and are expected to continue to decline through to 2050 [14]. Further cost reductions could enable lithium-ion batteries to be cost effective at longer durations. For example, an 8 h battery system in 2050 might cost the same as a 4 h battery system today, so if the value of the 4 h system has declined, an 8 h system could be deployed and capture a greater share of potential value. However, even with these cost declines, lithium-ion battery storage is unlikely to be cost effective for multi-day storage durations. For example, 12 h lithium-ion batteries are expected to be more than 2000 USD/kW in 2050 and 24 h batteries more than 4000 USD/kW [14].
The current literature on long-duration energy storage (LDES) looks to technologies besides lithium-ion batteries. Shan et al. [15] compared seven different categories of LDES, evaluating their cost, land footprint, and performance, among other factors. Hunter et al. [16] reviewed 14 potential energy storage or flexible power generation options, using both current and projected costs, and found many potential technologies that might be competitive as LDES options. Similarly, Amir et al. [17] and Smdani et al. [18] reviewed electromagnetic, mechanical, thermal, chemical, electromechanical, and electrochemical storage technologies, many of which are appropriate for LDES. Other technology assessments find strong potential for LDES, with a need to push energy storage costs down to very low numbers (1–10 USD/kWh) in order to displace most or all firm capacity from fossil fuel power plants [19,20,21,22]. Guerra [23] notes that LDES technology improvements will need to encompass not just the storage medium, such as hydrogen, but also the power capacity costs and the roundtrip efficiency. Additionally, though many modeling efforts focus on well-known LDES technology such as compressed hydrogen storage and pumped-storage hydropower, other LDES technologies or strategies could become more cost-competitive than those options. For example, Peng et al. [24] documented the conditions and innovations needed for materials-based hydrogen storage to outcompete compressed hydrogen storage. And Hunt et al. [25] discussed the potential for gravity storage technologies to provide ultra-long durations and very low costs. Vecchi and Sciacovelli [26] discussed how long-duration thermo-mechanical storage systems can also achieve significant cost reductions.
The potential role of LDES increases as more wind and solar are deployed because of seasonal mismatch between variable renewable energy technologies and electricity demand [19,27]. As VRE shares increase and lithium-ion batteries saturate the diurnal market for energy storage, there could be an increasing opportunity for longer storage durations (10+ h [28,29]) to respond to events such as multiday droughts in wind or solar due to weather events or disasters like wildfires or polar vortexes [30]. Analysis conducted for the U.S. Department of Energy estimated that, in a scenario with VRE shares close to 90% in the California Independent System Operator (CAISO) territory in 2050, 12 h storage would have more than double the arbitrage value of 4 h lithium-ion battery storage [31]. Conlon et al. studied the role of storage and transmission in meeting renewable generation targets for the New York Independent System Operator (NYISO); they found that storage began to be deployed above 50% renewable shares and jumped from about 2 h of average demand at the 65% target to almost 16 h of average demand at the 80% target [32]. Sánchez-Pérez et al. [33] demonstrated that for the western interconnection of the United States under a zero-carbon scenario, it can be cost-effective to deploy LDES with durations of 10–620 h. Staadecker et al. [34] used the same model and energy system to show that LDES potential is cost-effective when costs decline to 5 USD/kWh. Dowling et al. [35] showed that LDES of 10+ h can substantially lower system costs when decarbonizing electricity systems in the United States. And for the United Kingdom, Cárdenas et al. [36] found that both medium- and long-duration energy storage are part of a least-cost mix for decarbonizing the electricity system when relying only on wind and solar. Giovanniello and Wu [37] showed that there can be synergies between LDES and short-duration storage systems, as they can work together to balance microgrids on daily and seasonal timescales at lower total costs than either technology would be able to do on its own.
Even with these studies, it is challenging to understand how the value of LDES will evolve as the grid mix and electricity demand profiles evolve. This gap in understanding is what we aim to fill. This work uses a price-taker modeling approach to evaluate the value and operation of storage with durations of up to three months. The goal of this work is to provide additional insight and perspective on the behavior of LDES systems under a variety of conditions for grid regions throughout the contiguous United States.
While price-taker analysis has frequently been used to evaluate the value of energy storage, most studies focus on storage devices with 2–10 h of duration. Our analysis extends the prior literature by quantifying storage arbitrage value for LDES up to thousands of hours under possible future grid infrastructure conditions where VRE shares are significantly higher than today. We explore the relationships among value, storage duration and roundtrip efficiency, VRE share, and natural gas fuel prices. This work presents a thorough analysis of the potential future energy arbitrage value of LDES, with the associated implications for storage operations and modeling needs to capture the value of these storage systems in long-term planning models.

3. Methods

3.1. Price-Taker Modeling to Assess Storage Arbitrage Value

For this analysis, we used the Revenue, Operation, and Device Optimization (RODeO) price-taker modeling tool (available on GitHub at https://github.com/NREL/RODeO; accessed on 3 August 2023) [38], which maximizes the operating revenue of a representative grid asset given static input prices. RODeO is a mixed-integer linear program (MILP) that allows for a detailed representation of energy storage systems and other generation, storage, and demand-side technologies. For energy storage, it characterizes systems by power capacity limits, energy storage capacity, and efficiency of charging and discharging. Additionally, RODeO requires that the initial state of charge (or energy level as a percentage of the maximum allowed) be predefined, and we also required that the final state of charge equals the initial state of charge. This constraint is particularly important for extremely long durations (e.g., ~1000+ h) because it ensures that the storage incurs costs associated with charging and not just revenue associated with discharging; without it, the storage could sell the seemingly free initial amount of energy without recharging, overstating the possible arbitrage revenue.
We optimized storage system operation directly in response to a full 8760 h set of prices, meaning that the operating plan has perfect foresight over the year. While not true to actual operation, this method enabled us to study idealized relationships between storage duration and energy arbitrage value. Although RODeO is capable of optimizing operation in response to both energy and ancillary service prices, we used only energy prices to maintain a focused scope. Future work could expand in any of these areas.

3.2. Simulated Future Price Time Series

We used the Regional Energy Deployment System (ReEDS) capacity expansion model to project future electricity infrastructures from which we can derive future electricity price time series to use in studying storage arbitrage value. ReEDS is a large-scale linear program that performs a least-cost optimization of investment and operation across all utility-scale generation, transmission, and storage resources in the contiguous United States. Typically, the model is used to optimize a sequence of model years through 2050, using the previous year solution to initialize the system before solving the current model year. ReEDS represents competition among an extensive suite of generation, storage, and transmission technologies, including fossil, nuclear, multiple independent storage durations, and multiple categories and resource classes for variable renewable generation (e.g., wind and solar PV). Technologies compete to meet electricity demand, operating reserve requirements, resource adequacy requirements, and policy stipulations along with other physical system constraints.
This work was based on the 2022 ReEDS model version (available on GitHub at https://github.com/NREL/ReEDS-2.0; accessed on 29 November 2022) used to produce the 2022 Standard Scenarios report [39], which subdivides the contiguous United States into 134 load balancing areas (BAs), uses 17 intra-annual time slices to co-optimize operation and investment, and uses 7 years of hourly wind, solar, and load data to calculate curtailment and firm capacity credit for variable renewables and storage as these quantities change with the system evolution. The ReEDS model has been used for a wide range of analysis for the U.S. Department of Energy and others, including the Storage Futures Study [40,41,42,43].
Once ReEDS capacity expansion results are produced for a given scenario, a future grid infrastructure for a chosen scenario–year can then be instantiated as an electricity system representation in the PLEXOS production cost model, which can simulate hourly operations at the zonal 134-BA spatial resolution [44,45]. This model workflow uses utilities developed previously by NREL that downscale the generator and storage capacity expansion into individual units and uses the ReEDS transmission expansion to update line capacities. In addition to higher time resolution, PLEXOS is able to better capture realistic operating constraints such as unit commitment, ramp limits, and minimum runtime, which allow a better simulation of price dynamics than can be achieved by ReEDS alone. However, PLEXOS does not produce negative prices, and price volatility is typically lower than seen in real markets. PLEXOS output hourly electricity prices, which were aligned with the NREL Cambium 2022 dataset [44] for this analysis, were used for the scenarios described below.

3.3. Infrastructure and Storage System Scenarios

A key contribution of this work is its ability to examine LDES value up to seasonal storage durations for a variety of future infrastructures and demonstrate how the market for LDES can change over time with broader system trends. The price-taker approach can assess marginal storage value for any ReEDS scenario–year combination, and for this work we chose five scenario–year combinations to compare storage value and operation across a wide range of capacity mixes. The national capacity and generation mixes for these scenarios, taken from the 2022 NREL Standard Scenarios [39], appear in Figure 1.
  • The 2024 Mid Case provides a baseline for comparison and represents the current U.S. electricity system as described in the 2022 Standard Scenarios report [39].
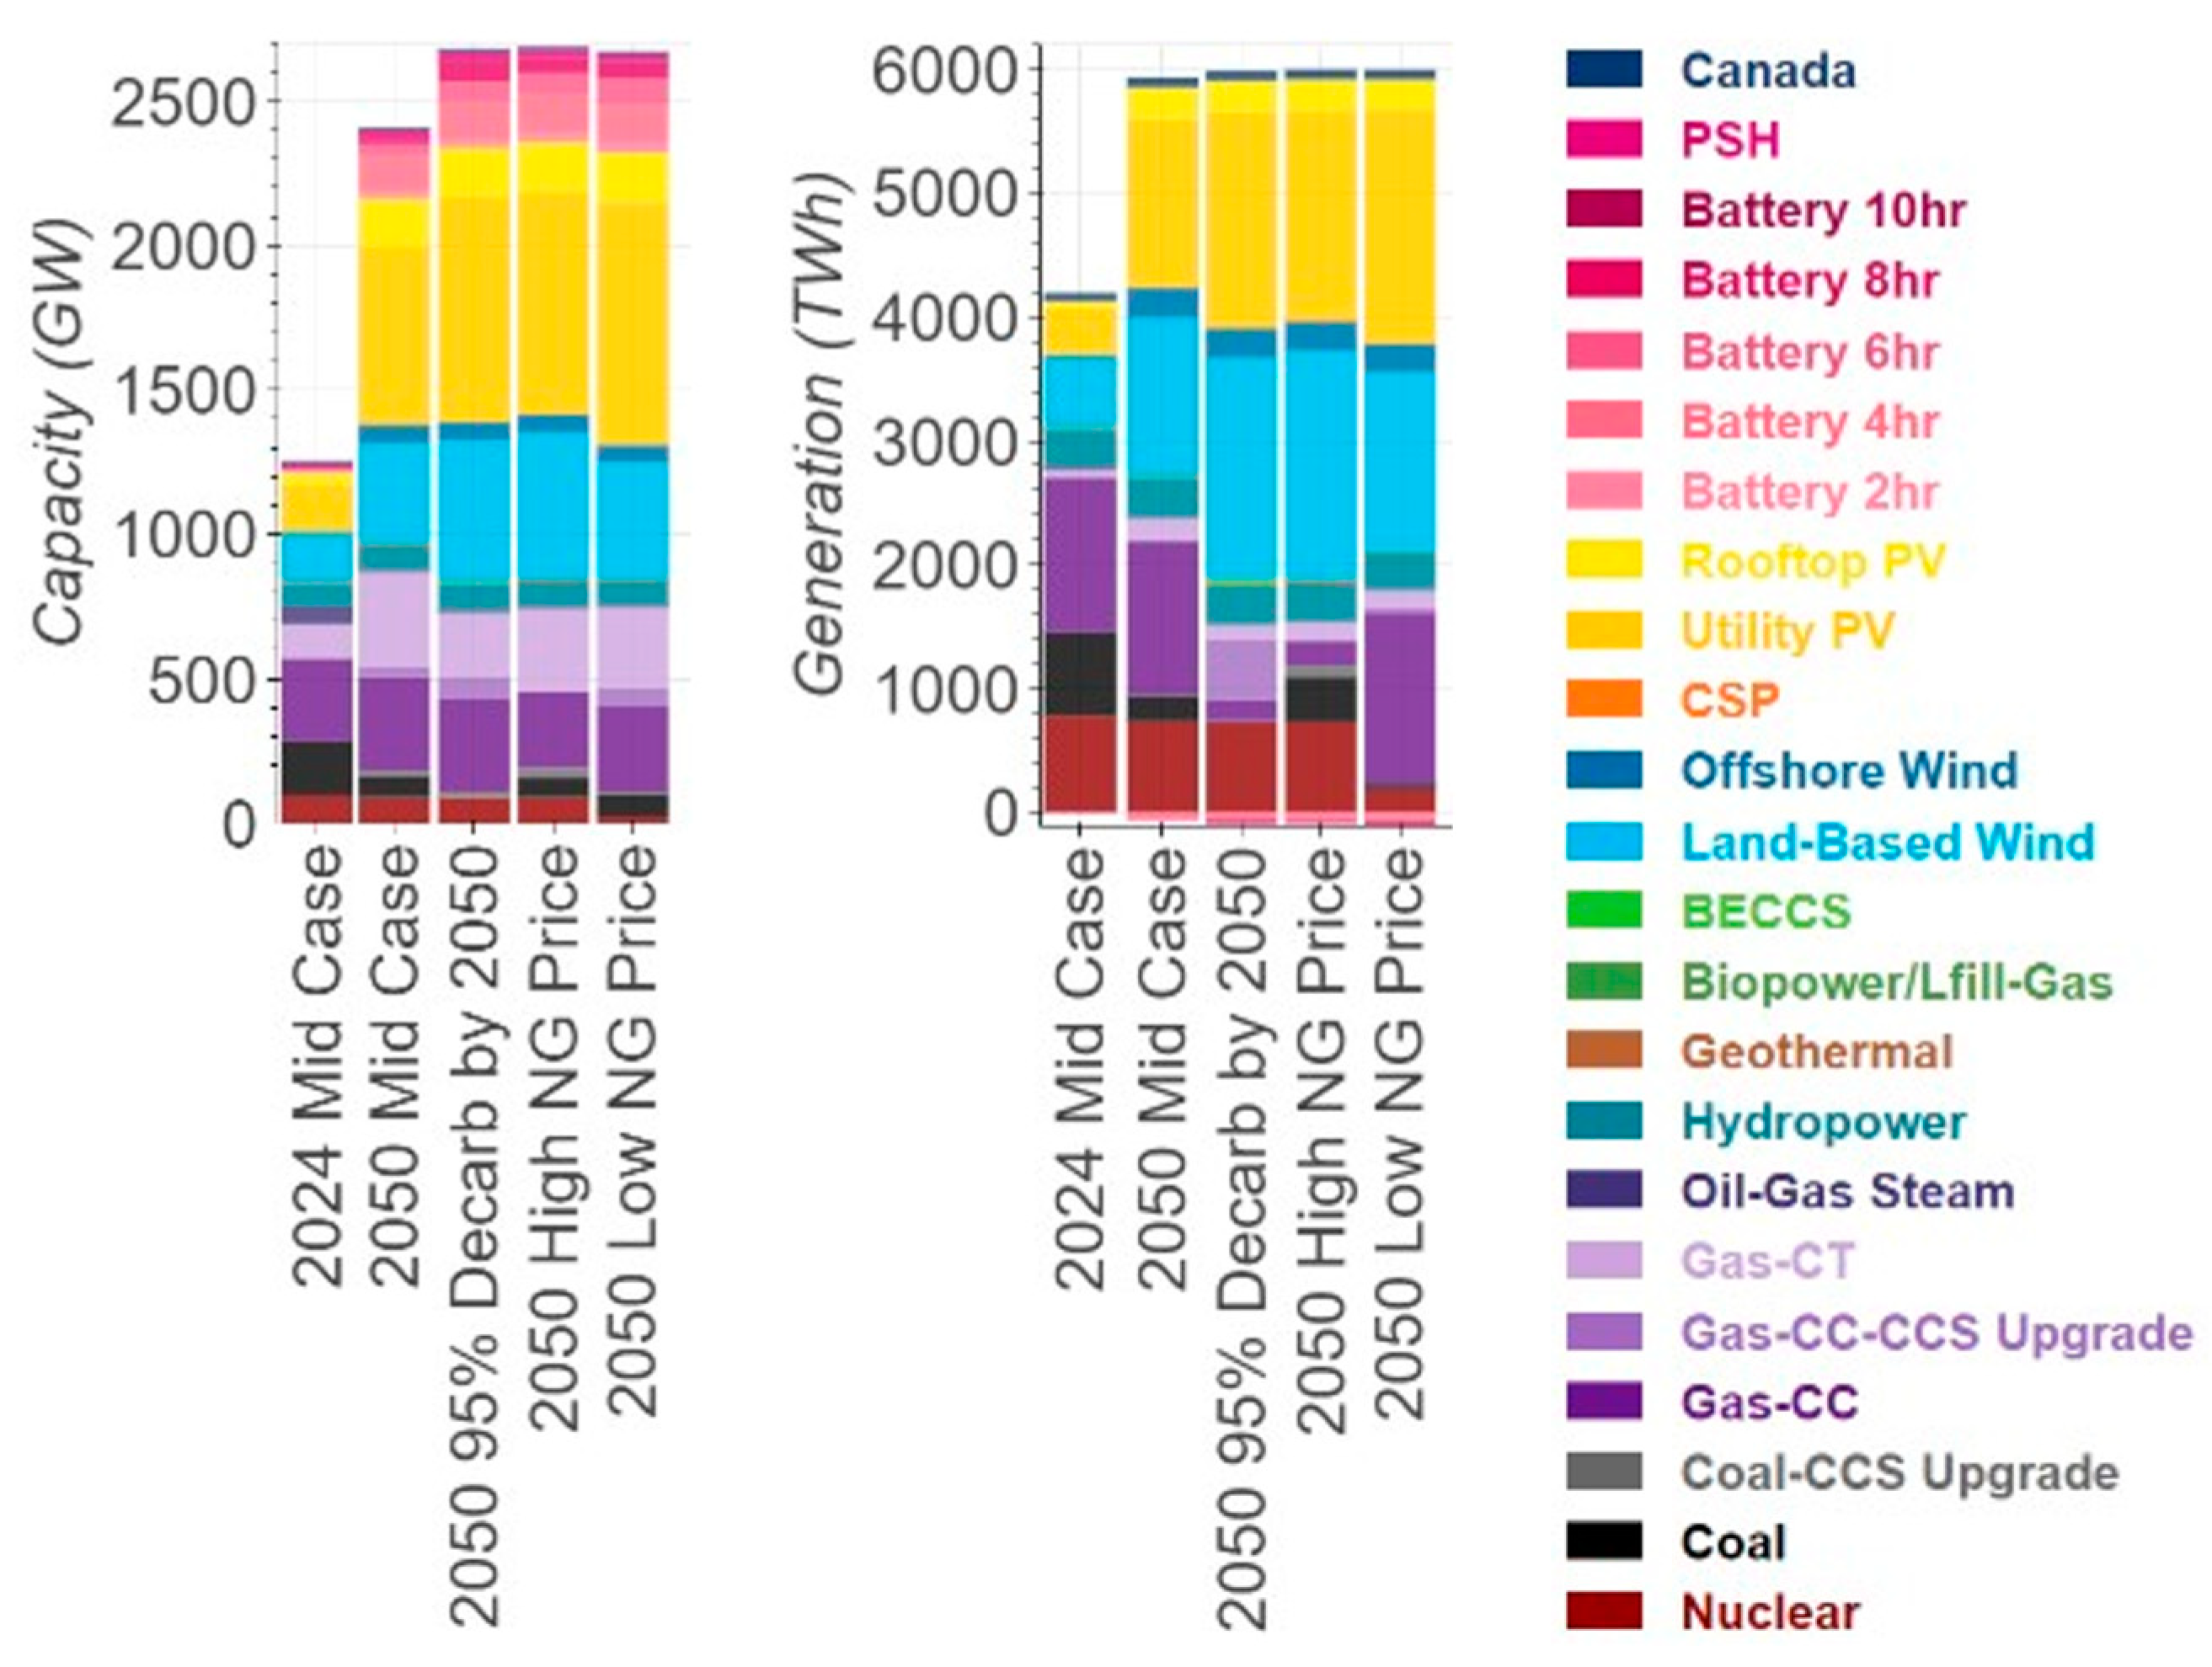
  • The 2050 Mid Case represents a future year under the default ReEDS assumptions in the 2022 Standard Scenarios report. It provides a baseline for comparing future infrastructures in a future year. As shown in Figure 1, this scenario has substantially greater deployment of wind, solar, and battery technologies, and the generation mix is a balance of wind, solar, natural gas, and nuclear electricity.
  • The 2050 95% Decarb by 2050 scenario uses the 2050 infrastructure for a scenario that requires 95% zero-carbon electricity by 2050. This scenario was chosen to represent a deep decarbonization scenario with shares of low/zero-carbon technologies above those in the Mid Case. It also includes a substantive contribution of natural gas generation with carbon capture and sequestration (CCS).
  • The 2050 High NG Price scenario uses natural gas prices based on the EIA AEO2022 Low Oil and Gas Resource case [46]. It represents a market-driven way to achieve a low-carbon electricity system compared to the policy-driven representation of the 95% Decarb by 2050 scenario. It has slightly higher contributions of wind and solar compared to the 95% Decarb scenario but also has the second-highest coal usage among the five scenarios.
  • The 2050 Low NG Price scenario uses natural gas prices based on the EIA AEO2022 High Oil and Gas Resource case. It was chosen to incorporate a future with higher natural gas usage, although it still uses substantive quantities of wind and solar generation and displaces some nuclear with low-cost natural gas.
All 2050 scenarios have substantive battery storage deployment, ranging from 207 GW in the Mid Case to 312 GW in the Low NG Price scenario. Marginal arbitrage value calculated by the price-taker model thus incorporated substantial existing battery deployment for all 2050 scenarios, and this existing storage impacted the results. In addition, the High NG Price and Decarb scenarios appeared more favorable towards longer storage durations than the Mid Case, with 20 GW of 8 h batteries in the 2050 Mid Case and 52 GW or more in the other scenarios.
In addition to varying the future grid infrastructure, we included scenarios for alternative storage system specifications to understand relationships between these specifications and arbitrage value. For this exercise, we included storage durations ranging from 2 h to 2190 h (a quarter of a typical year) to compare energy arbitrage value from diurnal (or shorter) to seasonal time scales. The default storage system RTE was 85%, which is aligned with typical Li-ion battery RTE [47]. We compared 85% RTE results to those assuming a much lower RTE of 40%. Our analysis was technology agnostic, but 40% was the chosen lower bound because it is a common lower bound for multiple storage technologies with storage durations in the order of ten to hundred hours [18] and is discussed as the target RTE for producing and using hydrogen fuel, which could be a backstop technology for LDES [48]. Lower RTE can be a result of lower charging and discharging efficiencies and higher rates of self-discharge due to, for example, continuous internal chemical reactions or hydrogen (or other storage medium) leakage.
We represented the storage technology as having constant charge and discharge power ratings and efficiencies, no ramping or minimum generation constraints, no self-discharge, no start-up or shut-down costs, and no variable operations and maintenance or fuel costs. This technology-agnostic approach allowed us to isolate the effects of duration independent of other technology-specific characteristics such as cycle and calendar degradation, temperature-dependent operating constraints and characteristics, or risks associated with catastrophic events such as thermal runaway. It also allowed us to keep computational expense low, as representing things like dynamic efficiencies or power ratings can increase run time from seconds to days [49]. Such technology-specific factors, in addition to investment and operational costs, would be crucial to understanding the suitability and cost-effectiveness of individual technologies in a price arbitrage application, but questions around specific technologies are outside the scope of this analysis.
We also explored the impact of varying the specified initial and final state of charge at the beginning and end of the year. While this parameter has a negligible effect on annual outcomes for diurnal storage durations, it could have a noticeable effect on outcomes for LDES, particularly as it approaches seasonal durations. We studied a fixed initial (and final) state of charge of 0, 0.5, and 1, and compared outcomes to an alternative where we repeated the 8760 h price series for three years of simulations where state of charge was fixed only at the beginning of the first year and end of the third year. Thus, the second year of the three-year simulations effectively had an optimized start–end state of charge that can be region- and scenario-specific. All results in the main body of the report used the optimized central year approach, and results for other fixed state of charge values are included in the Supplementary Materials.

3.4. Key Metrics of Interest

There were several key metrics we used to understand how storage value and operation changes across scenarios, time, region, and with storage design specifications. The core focus of this work was on energy arbitrage value assessed by calculating system revenue based on the optimal operations from price-taker optimization, based on energy prices only. In addition to the absolute quantity of annual revenue (USD/kW/year), we also calculated revenue normalized by the maximum observed revenue across storage durations (i.e., revenue for the longest duration) as well as the incremental change in revenue per change in storage duration (USD/kW/year per hour). Revenue accumulation over time was also shown to demonstrate seasonal differences in storage system operation, and revenue ratios across scenarios were calculated to show how storage value differs across future grid infrastructure scenarios.
To better understand physical operation of storage systems, we also explored storage state of charge across the full 1-year time series. State of charge time series can show how storage operation can fundamentally differ across regions and for different storage durations and RTEs.

4. Results and Discussion

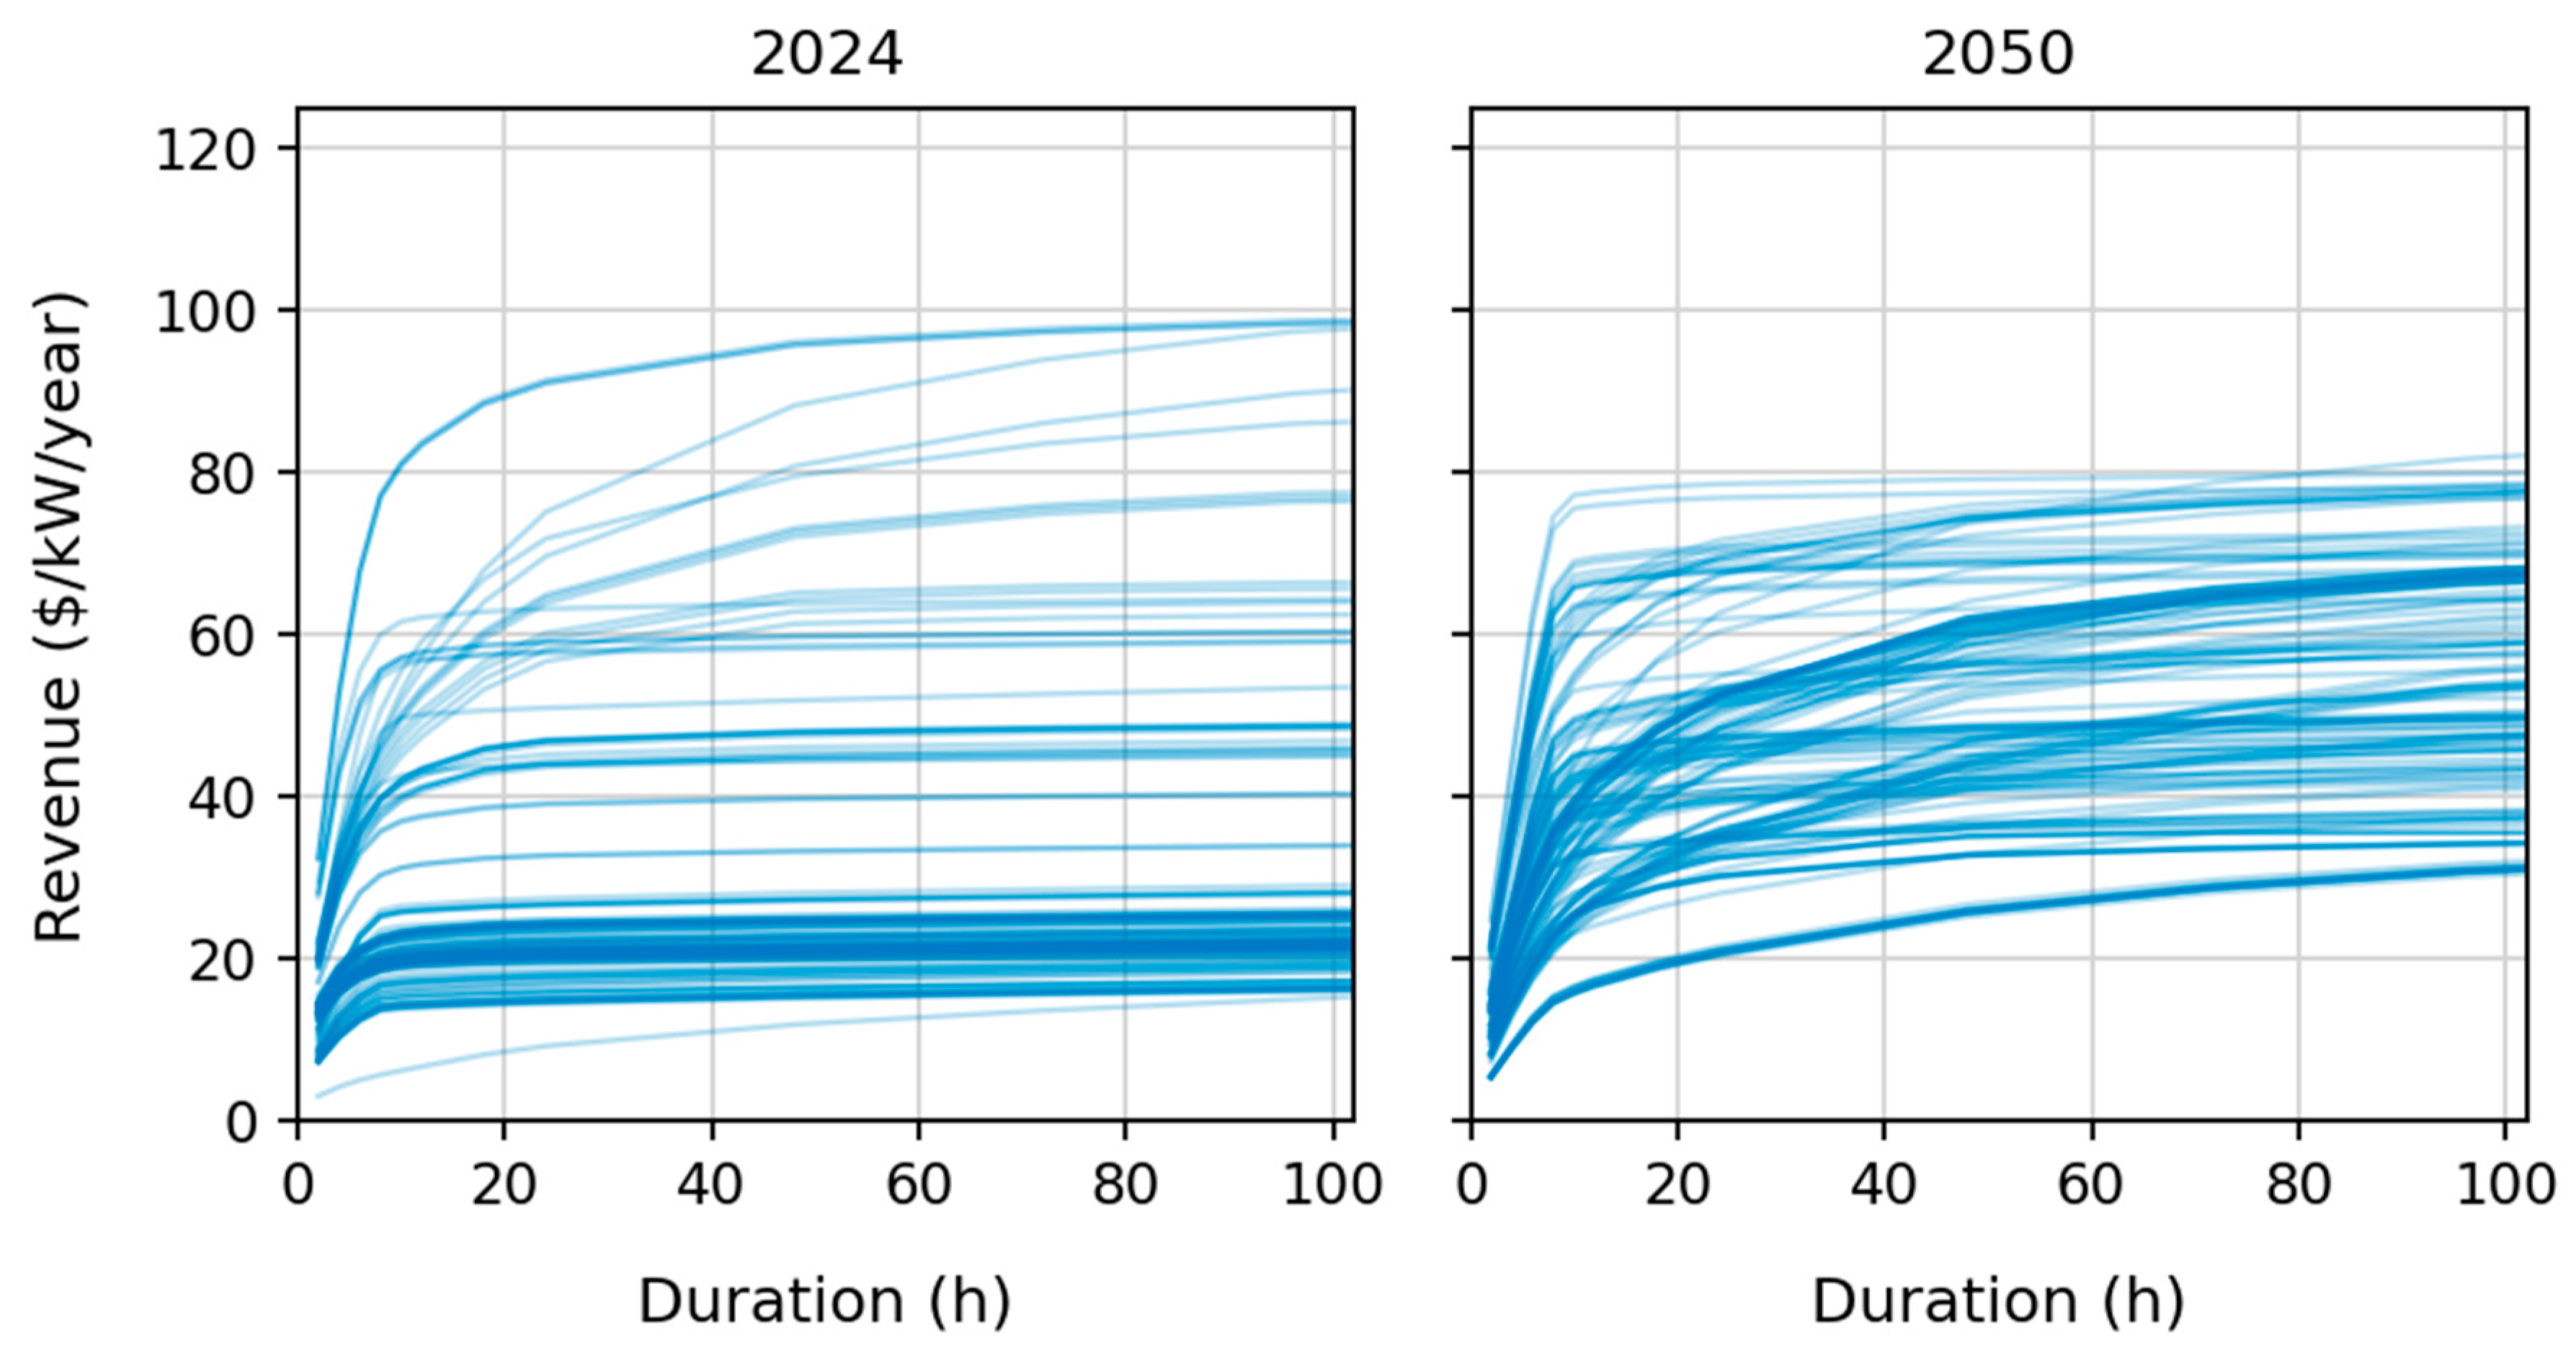
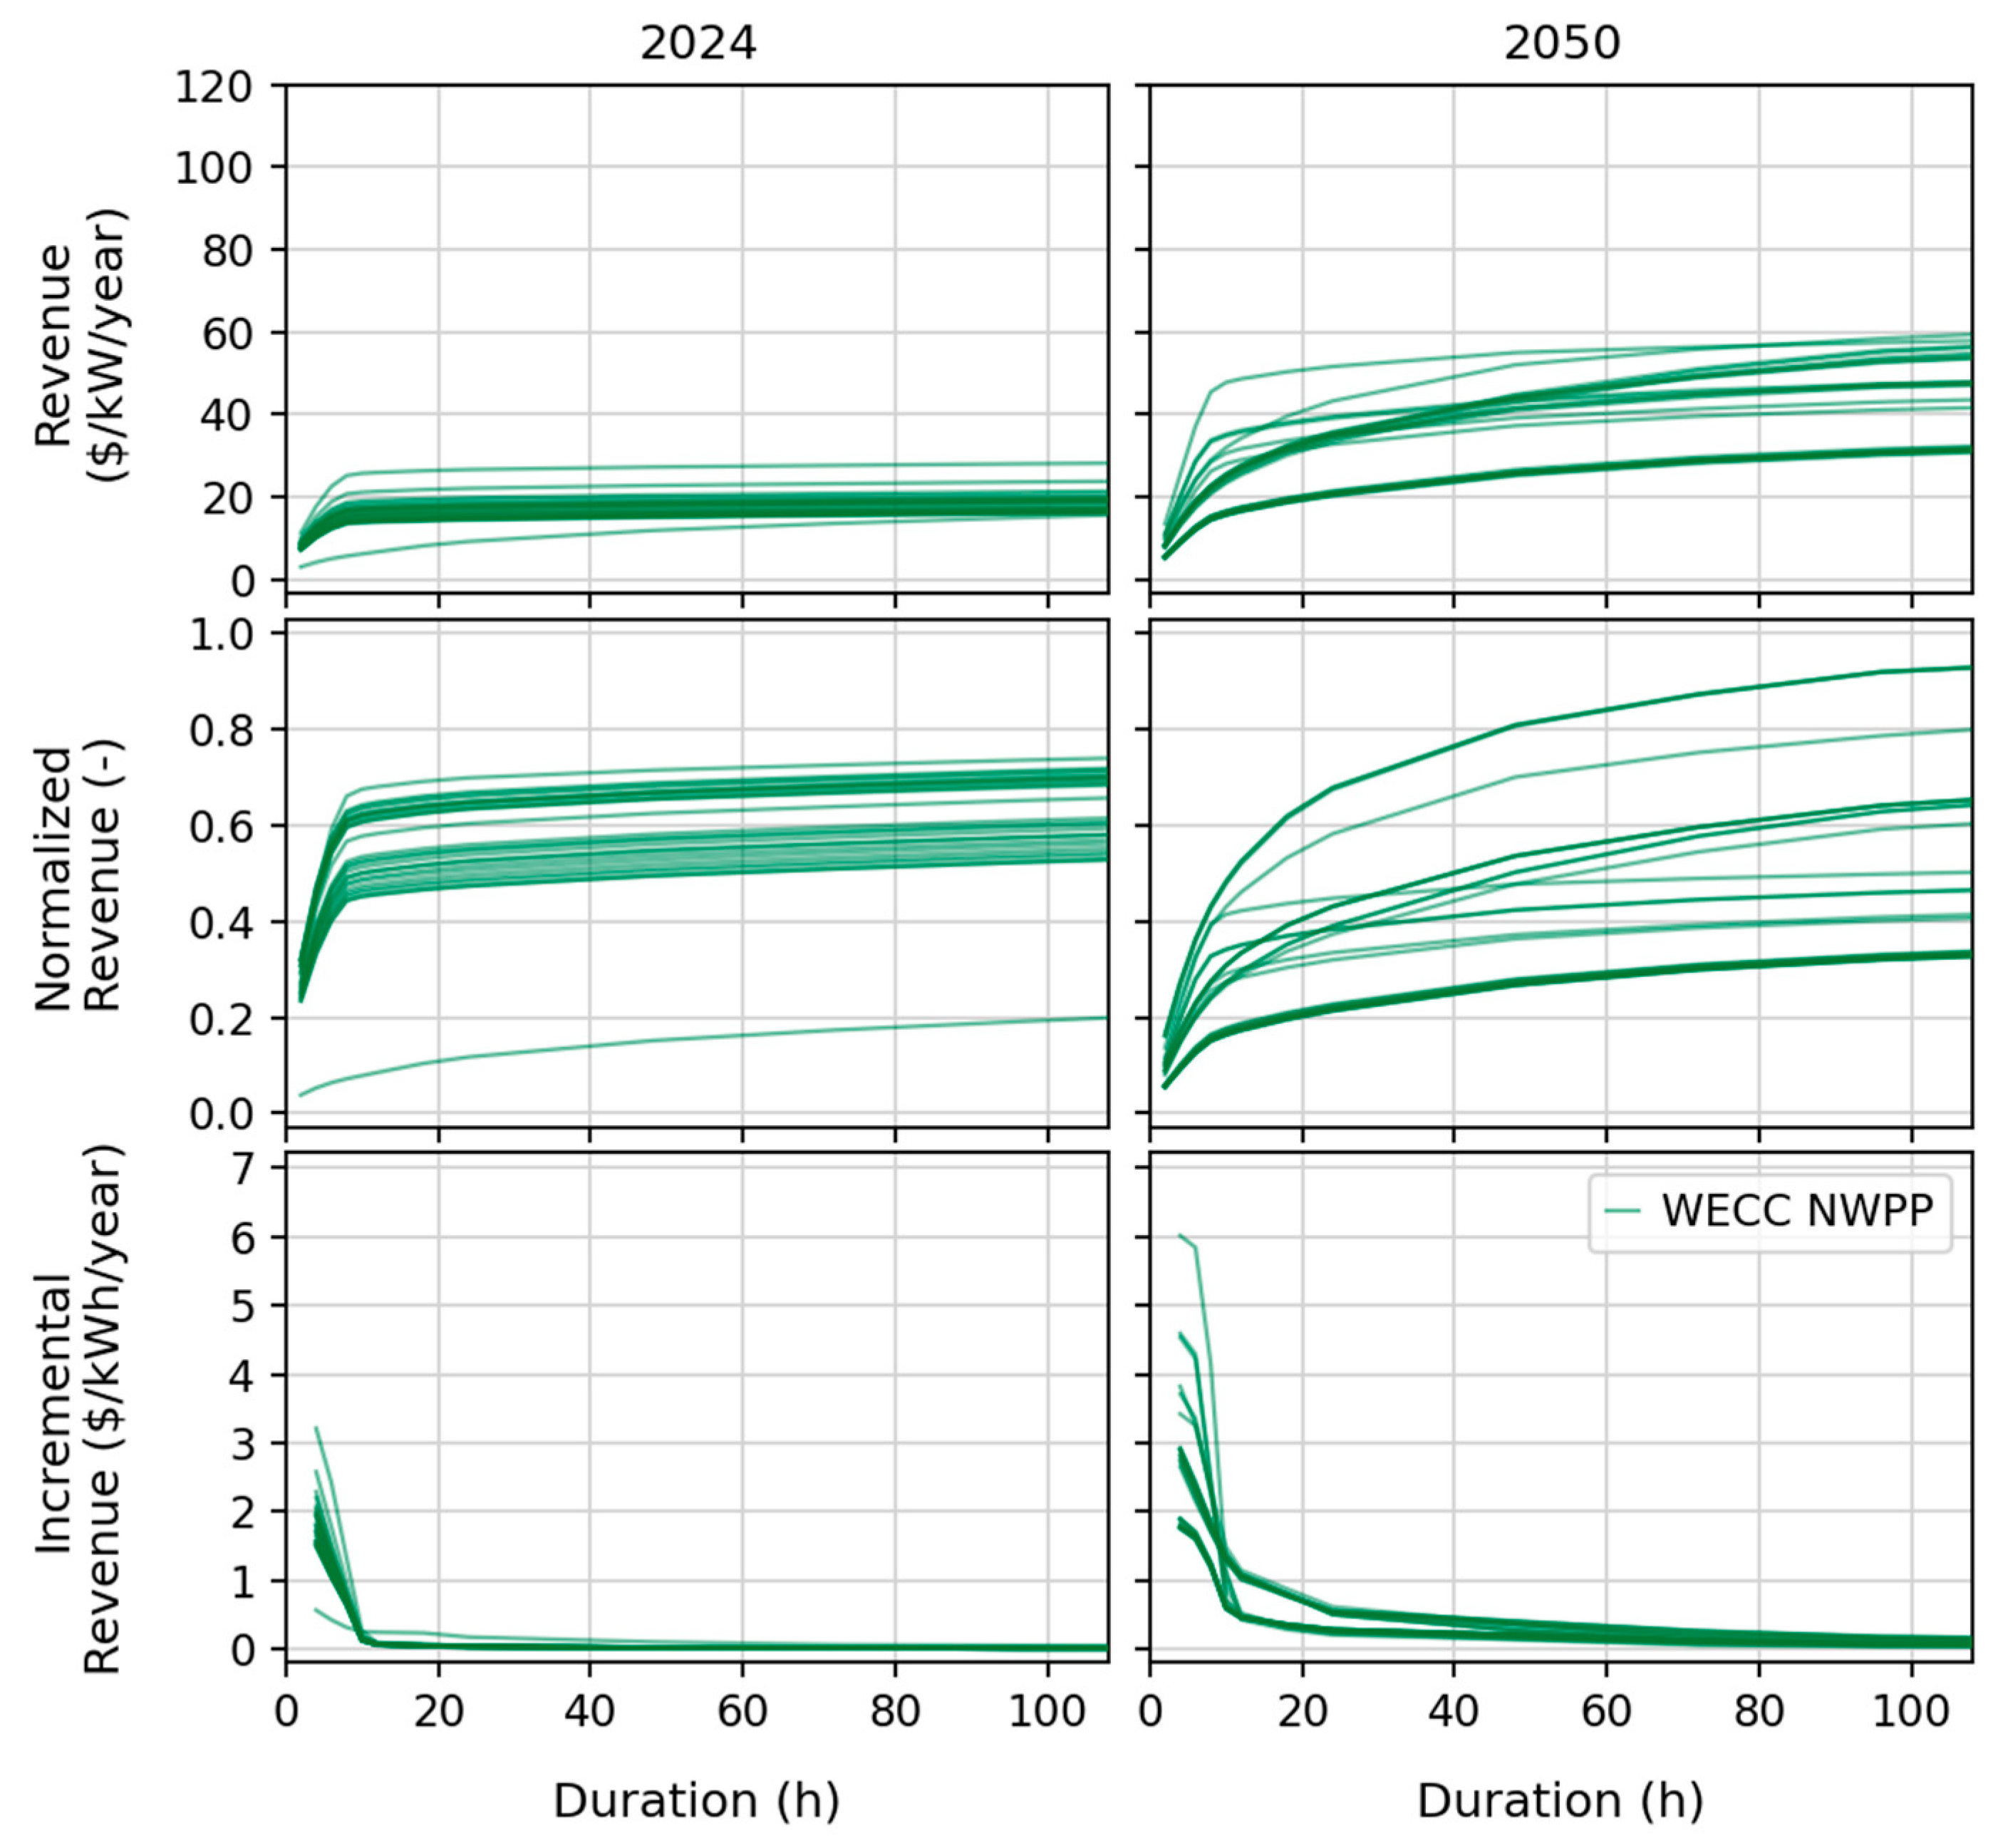
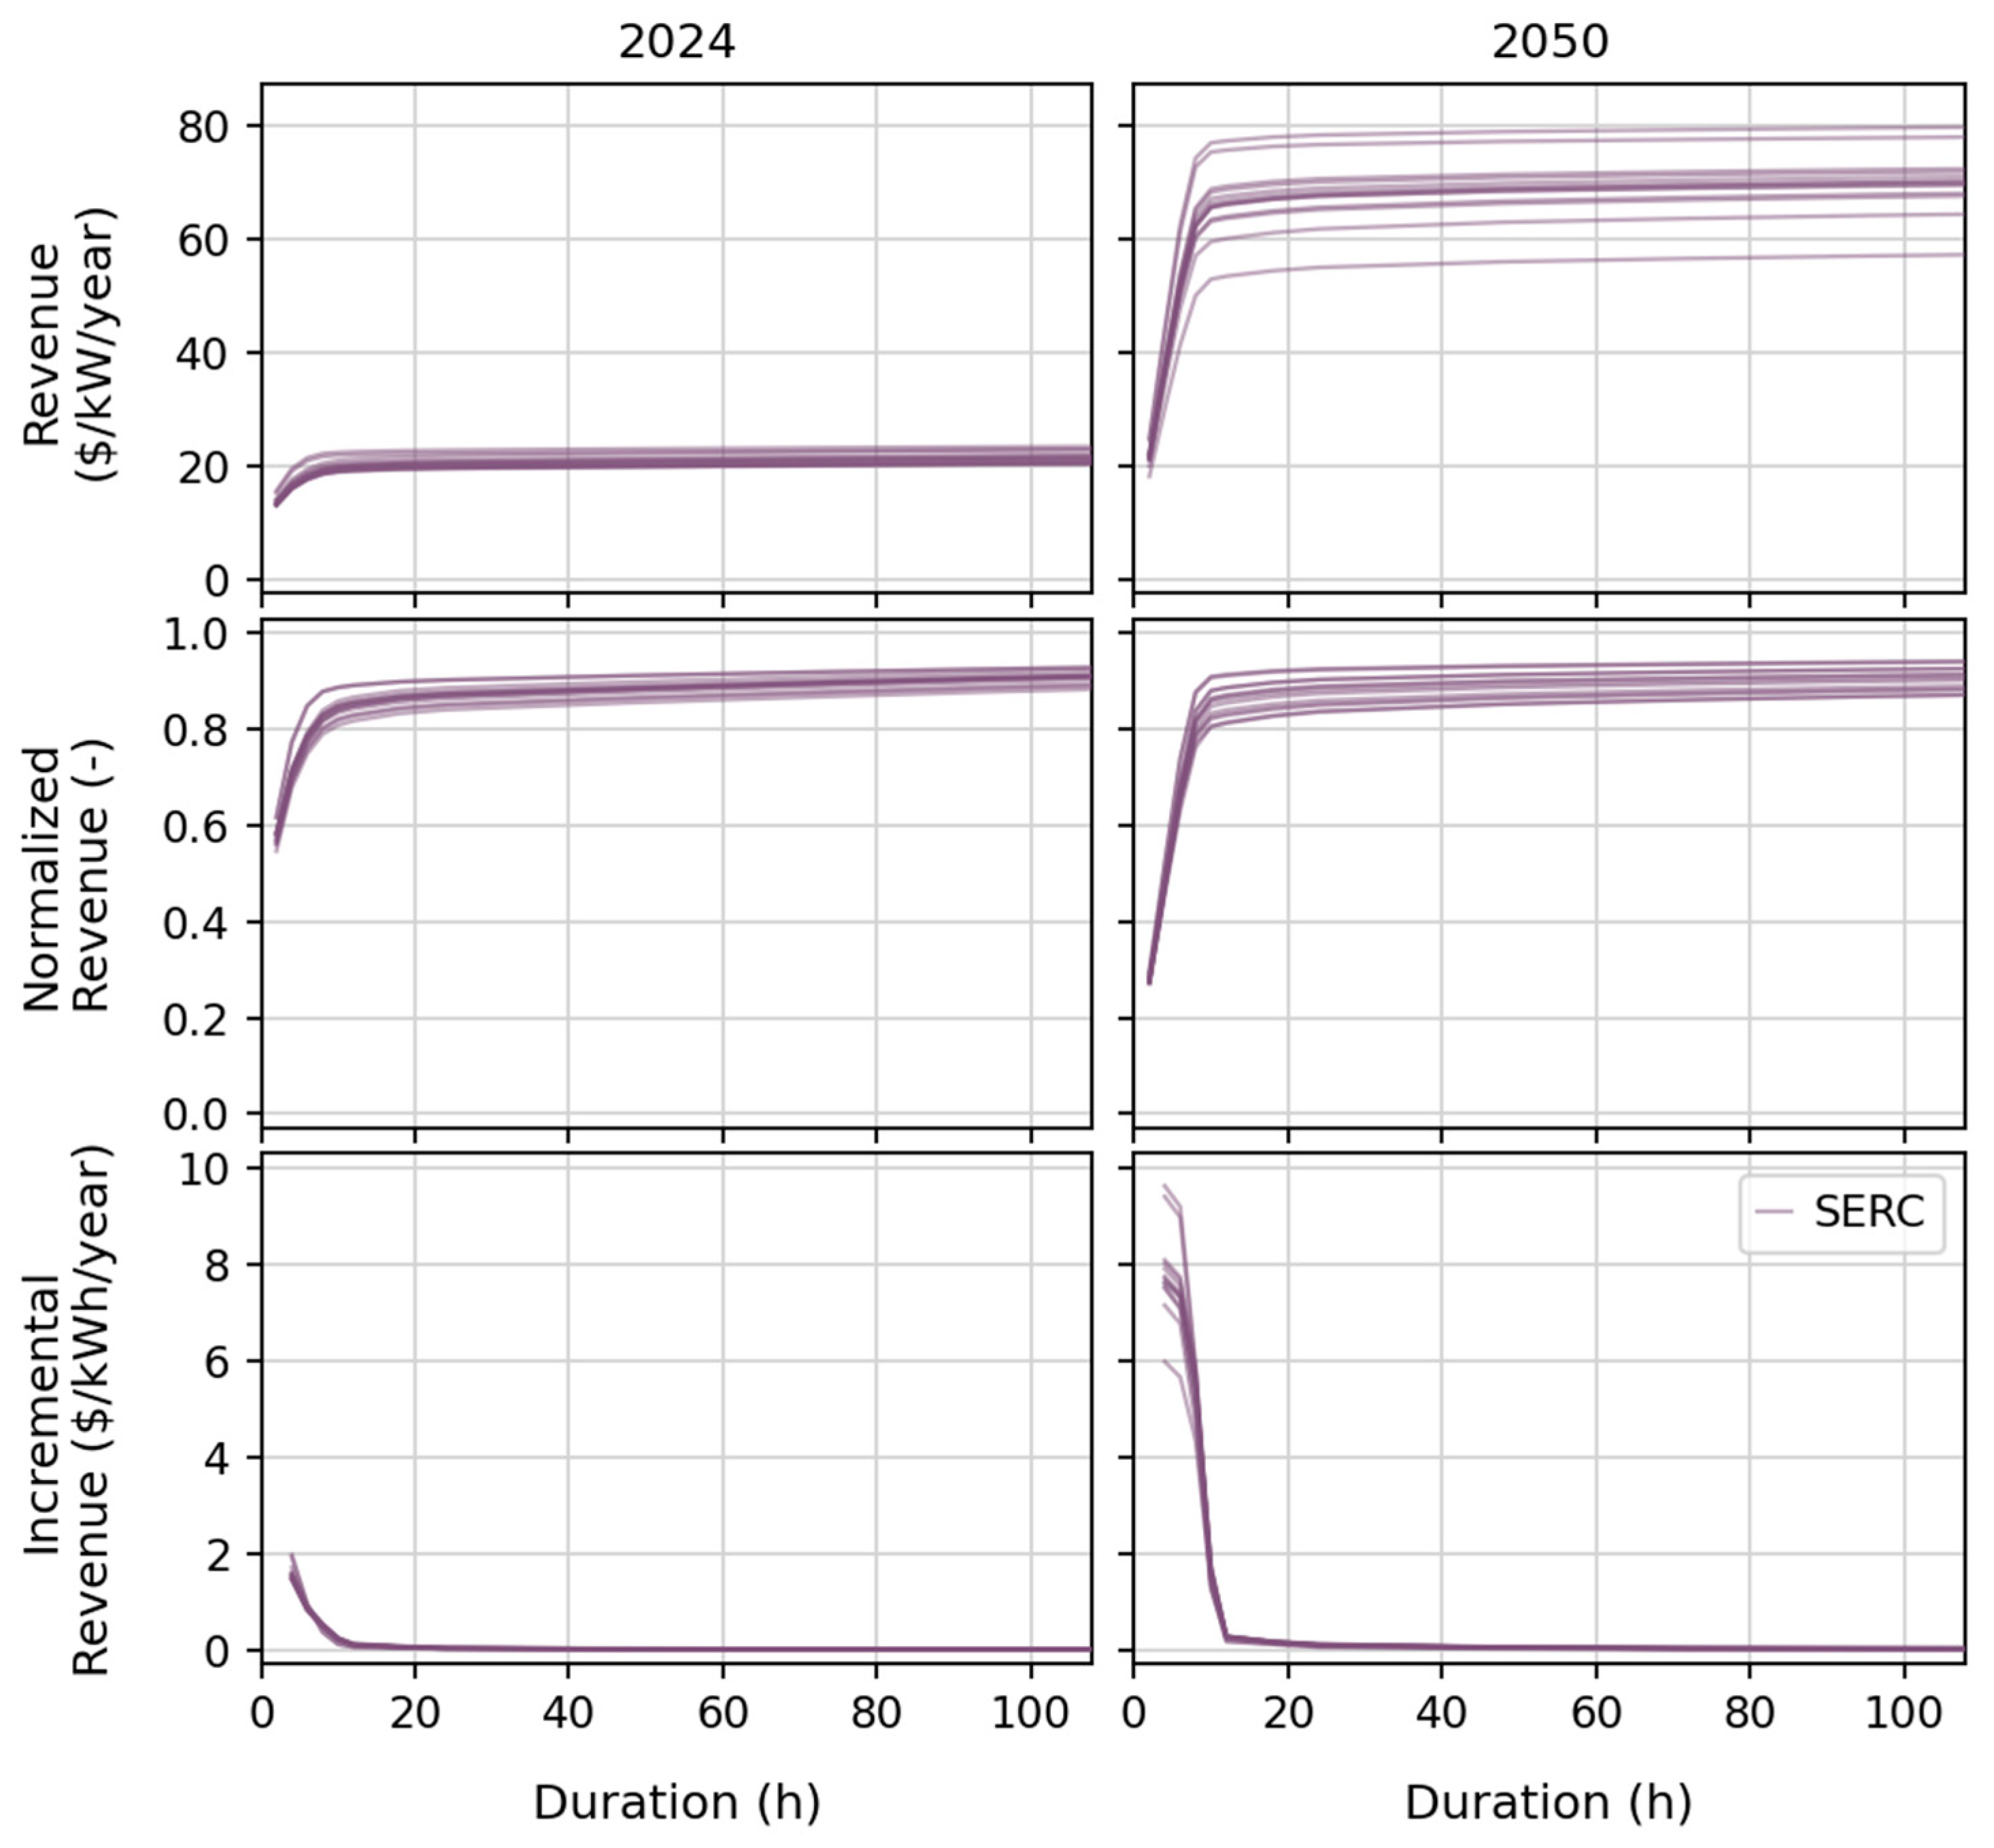
4.1. Arbitrage Revenue Relationships

In this section we demonstrate key relationships between arbitrage revenue, storage duration, and price distribution using the 2024 and 2050 Mid Case results. Doing so allows us to demonstrate how arbitrage value could change over time in an evolving system and identify regional variability and trends.
Figure 2 shows the relationship between the absolute magnitude of energy arbitrage revenue and storage duration for each of the 134 ReEDS BAs in the 2024 and 2050 Mid Cases up to 100 h duration. Results up to 2190 h storage are included in the Supplementary Materials. There is substantial regional variability in both cases, with a larger overall spread of results in 2024, indicating that some regions had higher arbitrage value in 2024 than 2050. However, arbitrage revenue for most regions was lower in 2024, with most regions clustered together in a band where revenue was approximately 15–30 USD/kW/year. For most regions, the total revenue for a given storage duration was higher in 2050 even at low durations, and 100 h duration revenue was above 30 USD/kW/year for all regions. These results imply that the 2050 system has higher price variability in most but not all regions due to the interactions among higher VRE shares, battery deployment, and natural gas usage for flexible and peaking generation.
The shapes of the curves in Figure 2 indicate how the incremental value of storage at longer durations could change over time. Most curves in 2024 had a relatively steep increase in revenue at durations under 12 h, followed by a rapid leveling off at a near-maximum, asymptotic value (except for a small number of high-revenue BAs).
In contrast, 2050 appeared to have more BAs where the revenue continued to rise with duration beyond 20 or 40 h, suggesting that longer durations could be more competitive in this future system. For some regions, there was sufficient arbitrage opportunity in 2050 that revenue continued to grow nearly linearly with duration up to 2190 h, suggesting that storage with sufficiently low incremental cost of energy storage capacity could be very attractive under certain circumstances (see Figure S2 in the Supplementary Materials).
Revenue–duration relationships and regional differences became more apparent by plotting absolute revenue along with normalized and incremental revenue for BA groups within a single market region. Normalized revenue for each BA is the ratio of revenue for a particular storage duration to the maximum calculated revenue for that BA, which in practice is the revenue for a 2190 h storage duration. Incremental revenue is the marginal increase in revenue per hour increase in storage duration between two successively modeled storage durations.
Figure 3, Figure 4 and Figure 5 show these three quantities for the 2024 and 2050 Mid Case for three market regions: the Western Electricity Coordinating Council Northwest Power Pool (WECC NWPP), the Southeast Power Pool (SPP), and the Southeast Reliability Corporation (SERC) regions. In each panel, each line represents a unique BA. Equivalent figures for other regions are included in Supplementary Materials, but these three regions were chosen because they demonstrate a range of possible outcomes for the evolving relationship between storage duration and value. Regional and temporal differences in arbitrage value can be attributed to changes in price dynamics, so price–duration curves for these regions are included in Figure 6.
WECC NWPP is an example region where the 2050 system had greater incremental value of storage at longer durations than in 2024, as the shape of the normalized and incremental revenue curves shifted right from the 2024 to the 2050 panels. While shorter durations below 12 h still had the highest incremental value, the increase in value with duration persisted to some degree beyond 24 h, relative to 2024 where all but one BA had little incremental value above 12 h. Other than one outlier BA in 2024, absolute revenue was also generally higher in 2050 in WECC NWPP. A driver of these changes was the relative lack of zero-price periods in 2024 compared to a more frequent occurrence of zero-price periods in all WECC NWPP BAs in 2050. This change in price behavior leads to increased arbitrage opportunities, especially if storage durations allow energy to be shifted across longer time periods.
SPP had substantial variability in the revenue–duration relationships in 2024, with a large spread in absolute and incremental revenue where it appeared that, even in the near term, there were some SPP regions with continued incremental value at durations up to 48 h. This result corresponded to BAs with a high frequency of zero-price periods in 2024. As the SPP system changed to 2050, the variability in both storage revenue and price dynamics diminished somewhat, with a more evenly distributed range of results across BAs that reflects a general trend of increasing frequencies of zero-price periods. Unlike other regions, SPP saw lower peak prices and fewer hours with the highest prices, so absolute storage revenues did not generally increase in 2050.
The SERC results showed a clear increase in the magnitude and variability of absolute revenue from 2024 to 2050, showing robust increases in storage value overall. This result followed from there being higher peak prices and more zero-price periods in 2050 compared to 2024, which had nearly no zero-priced periods. However, SERC BAs generally had about half the number of zero-price periods as WECC NWPP and SPP BAs in 2050, so SERC BAs maintained relatively little incremental value in storage durations above 12 h from 2024 to 2050. SERC thus demonstrated the possibility of increasing competitiveness of <12 h storage, but no substantive increase in the competitiveness of >12 h storage as the grid evolved, at least not on the basis of energy arbitrage alone.
Other regions largely behave similarly to one of these three examples (see Supplementary Materials). Other WECC regions were qualitatively similar to WECC NWPP, indicating that on the whole, the Western Interconnection might be relatively attractive for LDES deployment. The New York and New England regions also showed an increase in the incremental value of longer durations. MISO and ERCOT were more similar to SPP in that some regions saw an increase in LDES value over time while others did not. PJM was largely similar to SPP, but there were some exceptions where arbitrage value increased to longer durations even in 2024.
These results demonstrate that increasing arbitrage value of storage at longer durations depends heavily on the number of hours at which storage can charge at no cost and that the cost-effectiveness and competitiveness of energy storage at different durations will likely have wide regional variability, depending on grid conditions. They also show that even a system with a roughly 60% share of VRE exhibits a relatively rapid decline in incremental energy arbitrage value with storage duration. The values reported here are not necessarily representative of revenues in actual markets because the prices were simulated from a production cost model that does not incorporate all real-world market mechanisms and constraints. For example, use of a zonal versus nodal model reduces the occurrence of price increases driven by transmission congestion and losses [50]. However, they can still be used to understand the relative competitiveness of different storage durations in different regions and scenarios for the future electricity system.

4.2. LDES Operation

Arbitrage revenue is an important metric to understand the energy value of storage, and detailed operating behavior can be inspected to better understand how that value is realized. We demonstrate operation revenue relationships here by plotting time series of cumulative revenue over the course of the year (Figure 7) and the normalized storage state of charge (SoC) (Figure 8). Figure 7 includes the same three regions as the previous section, and Figure 8 plots results for two individual balancing areas in 2024, one in WECC NWPP and another in SPP. In this section we also show how operation and revenue compare between a high- and low-RTE storage system (85% versus 40%), comparing operation and its effect on annual revenue–duration relationships.
Cumulative revenue was plotted only for the 2190 h storage duration to show the upper bound in arbitrage revenue with LDES of sufficient size for seasonal storage. The direction and steepness of the trajectories in Figure 7 indicate what times of year were preferable for charging versus discharging and which time periods were more or less valuable for LDES. The behaviors offer insight into both storage operational patterns and grid characteristics. In all three of the representative regions and in both years, revenue rises at the beginning and end of the year, suggesting that the winter is a particularly lucrative time for LDES to discharge. In 2024, WECC NWPP revenue declined throughout the spring in most regions before increasing for the second half of the year, whereas in 2050, the same period simply maintained steady cumulative revenue. This difference reflects the need for WECC NWPP regions to charge storage with nonzero prices in 2024 much more often than in 2050, where zero-price periods are more prevalent. One SPP region exhibited a similar 2024-to-2050 comparison, but most regions had relatively steady spring and fall revenue in SPP even in 2024 because zero-price periods were already frequent. Limited zero-price periods in SERC in 2024 limited overall cumulative revenue due to purchased electricity during spring and fall charging periods, but this effect was less pronounced in 2050. As in WECC NWPP, increasing frequency of zero-price periods in SERC allowed LDES to achieve greater total revenue in 2050 relative to 2024.
The revenue trajectories in Figure 7 are reflected in the SoC behaviors in Figure 8, which included storage durations from 96 to 672 h to show the various ways that LDES might be operated to achieve maximum revenue outcomes. Diurnal and week-long storage operation has been well studied in the literature, so we focused on SoC patterns observed across an entire year of operation to show the time scales that LDES could be used for energy arbitrage. We used the 2024 Mid Case results for this part of the discussion because there were greater qualitative differences in behavior across BAs than in 2050, as reflected in the converging patterns of cumulative revenue plots (Figure 7).
A few notable outcomes arose from results with 85% RTE. First, partial storage cycles at week-to-month timescales were common at a 96 h duration. Longer durations also utilized these shorter-term arbitrage opportunities, but their operations were increasingly dominated by a longer-term seasonal trend.
A lower storage system RTE inhibited the ability to exploit short-term energy arbitrage opportunities, having substantive implications on how LDES would be optimally operated. Because it takes longer to recover its SoC in preparation for future arbitrage opportunities, the 40% RTE system was unable to respond to many of the short-term opportunities that the 85% RTE system responded to at a 96 h duration. With lower RTE, there is ultimately a maximum storage duration beyond which the system fully discharges, i.e., a maximum duration beyond which arbitrage opportunities are insufficient to justify the additional storage capacity. This maximum value storage duration was closer to 168 h (or one week) for the WECC NWPP region and closer to 336 h (or two weeks) for the SPP region, demonstrating that it depends on a host of factors including storage system design and grid specifications.
The two BAs highlighted in Figure 8 were chosen because they demonstrate two qualitative LDES SoC patterns observed throughout the data, particularly at lower RTE. The WECC NWPP region is an example where there were two full or nearly full charge-discharge cycles at 85% RTE but only one notable cycle at 40% RTE. The SPP region similarly had two major cycles at 85% RTE and maintained a notable second cycle at 40% RTE for durations at least up to 168 h. These differences point to the importance of intra-annual differences in price arbitrage opportunities, where perhaps the SPP region had larger price differences in the winter that can sustain arbitrage revenue for low RTE storage better than in WECC NWPP.
We compared annual revenues with 85% and 40% RTE in Figure 9, which shows the revenue ratio between the two RTEs in the 2024 Mid Case. As would be expected, the reduced operational flexibility with lower RTE reduced annual revenue, consistent with other work such as Walawalkar et al., 2007 [51]. This result was observed across all storage durations, with 40% RTE systems typically earning approximately 25–40% of the revenue of an 85% RTE system of a similar duration. Beyond 6 h duration, the efficiency effect on revenue was relatively stable, including the quartile distribution. One might argue that the reduced impact of efficiency at lower durations is not practically relevant because storage devices up to 6 h duration are largely expected to be high-RTE systems.

4.3. The Effects of Alternative Electricity Futures

Thus far, all results have used the same underlying Mid Case scenario, and it is important to consider how the relationship between storage duration and value can change under alternative future electricity system configurations. A change in grid mix can have substantial impacts on optimal LDES operation and how that operation depends on storage duration and RTE. Figure 10 provides an example of these differences by mirroring Figure 8 but using data from the 95% Decarb by 2050 case in the year 2050, which is the scenario with the highest share of VRE in our study.
The first difference from the 2024 Mid Case is that many regions trend towards a single charge-discharge cycle as in the left panel. In many regions, this cycle was characterized by springtime charging, winter discharge, and shorter-term cycling in between. In other regions with a single overall charge cycle at long durations, summer was the primary discharge period.
A second difference is that lower-RTE storage was able to take advantage of shorter-term arbitrage opportunities and deeper cycle depths at longer durations, meaning effectively that the 2050 95% Decarb by 2050 system allowed lower-RTE storage to act more like high-RTE storage. This result stems from the increase in zero- and low-price periods so that RTE losses were less consequential to operating strategies. There remain many regions that trend towards two-cycle behavior, as shown in the right panel of Figure 10. As shown, higher-RTE systems were able to utilize a larger range of discharge in some regions, but other regions showed a deeper cycle depth with 40% RTE, which is a third key difference from the 2024 Mid Case. The difference in RTE clearly influenced the exact timing and frequency of charging and discharging, but a higher-VRE system generally allows operating strategies to converge across RTE.
Figure 11 plots the same 40% to 85% RTE revenue ratio metric as Figure 9 but for the 95% Decarb by 2050 case in 2050. Following from the operating behavior, the higher frequency of zero prices in this case improved the arbitrage opportunity of lower-RTE systems so that they can achieve a much higher revenue share than the 2024 Mid Case, generally above 60% for most BAs. The revenue ratio was, on average, steady across storage durations beyond 6 h, and there were even some instances where storage duration 96 h or above achieved the same revenue with 40% RTE as with 85% RTE. Although 40% RTE systems did not take advantage of short-term arbitrage opportunities like 85% RTE systems, the relative loss of revenue decreased with an increase in zero-price periods that corresponded to zero-marginal-cost renewable energy.
Figure 12 presents a broader cross-scenario comparison, plotting the distribution across BAs of the ratio of annual revenue between one of the alternative electricity scenarios and the Mid Case in 2050 for durations up to 168 h. At low gas prices, storage arbitrage value was generally lower because natural-gas-fired generators are typically the marginal generating facility setting electricity prices, so lower natural gas prices lead to lower electricity prices. Low electricity prices then lead to lower storage arbitrage revenue. However, the relationship between revenue and storage duration was largely unchanged with low gas prices. There was still an increase in revenue with duration, but because this relationship was roughly the same as in the Mid Case, the revenue ratio was not a function of duration.
In contrast, both high natural gas prices and the high-VRE case increased absolute revenue while also having an increasing revenue ratio with duration. The high gas price scenario had higher revenue by the same logic as the low gas price scenario but in the opposite direction. The 95% Decarb scenario had higher prices because it included the deployment of natural gas combined cycle with carbon capture and sequestration (CCS) technologies, which affect prices as a relatively high-cost marginal generating technology. The most important result in the context of storage arbitrage value, however, is that the relative advantage of longer durations was higher in these scenarios. These results demonstrate how the attractiveness of LDES is highly sensitive to price dynamics and the underlying generation mix, meaning that the national and regional trends observed for the Mid Case could be amplified to increase both the absolute revenue and incremental revenue with storage duration, at least in regions where these trends exist in the first case.

4.4. Limitations

The experimental design of this work was intended to capture a wide range of possible operating regimes for energy storage systems, with the goal of providing a thorough understanding of how LDES value and operation can change over space and time. However, there were inherent limitations that prevented a truly comprehensive approach.
While we used future grid scenarios with substantive battery deployment to produce price series that were more representative of what would exist in the presence of LDES systems, price-taker modeling, by definition, does not account for any price responsiveness to the operation of the specific LDES systems we analyzed. Our scope was also limited by our scenario selection, which covered a wide range of futures but was certainly not comprehensive. For example, the existence of hydrogen turbines or new nuclear capacity could have notable effects on energy prices and arbitrage opportunities. Scenarios with greater and/or more flexible demand could also create alternative price behaviors that influence the value of LDES.
Even with more scenarios, many realistic electricity price dynamics are difficult to produce with our modeling approach. For example, zonal spatial resolution inherently reduces the occurrence of transmission congestion and congestion-driven price spikes. The load and renewable energy time-series used as input also did not include extreme events, and there was no stochastic representation of generator or transmission outages, all of which can affect price arbitrage opportunities. Least-cost optimization in both ReEDS and PLEXOS also did not capture the full set of market rules and procedures that can drive prices in an actual wholesale electricity market or rate structure. The zonal locational marginal prices produced by PLEXOS for the Cambium dataset reflected marginal operating costs in a market setting but did not incorporate the effect of non-market electricity sales through bilateral contracts or other mechanisms.
Lastly, all the price-taker modeling herein implies perfect foresight, which is not how real systems operate. This results in two competing effects: an overestimation of arbitrage value based on perfect visibility into future prices, which is at least partially offset by the avoided potential from responding to some of the behaviors discussed in the previous paragraph. Nevertheless, perfect foresight modeling could overstate quantified LDES value reported in this work, particularly given that foresight becomes more difficult across longer timescales relevant to LDES. Future work could explore the impact of forecasting and realistic operating strategies on the idealized value quantification described in this work.

5. Conclusions

This analysis used price series from a linked electric grid planning and operations model workflow to study how energy arbitrage opportunities for LDES change over time, by region, and under alternative future grid infrastructure scenarios. It demonstrates that at a high level, the relative attractiveness of energy storage at different durations is highly system-dependent, meaning it will be region-specific and evolve over time as a function of numerous storage system and electric grid drivers. The total arbitrage value and relative attractiveness of longer-duration storage increases with the frequency of low- or zero-marginal-electricity-price periods that can be used for charging. These low prices increase the price spread and thus opportunities for energy arbitrage. These low-to-zero-price periods often correlate to higher VRE shares, but the ultimate value for LDES depends on the system-specific interactions among VRE, deployed storage systems, and higher-cost marginal generators that set electricity prices. In our scenarios, LDES became more competitive over time in electricity market regions including the western interconnection, New York, and New England, while southeastern and mid-Atlantic regions did not see a relative improvement in LDES value over time. Results were mixed for central plains regions including Texas. In regions with the highest relative value of LDES, incremental revenue increased with duration up to about 20 to 40 h under Mid Case assumptions.
Operational patterns of LDES up to seasonal durations demonstrate that in our scenarios, systems converge to a 2-cycle annual pattern in the near term, with charging in the spring and fall and discharging in the summer and winter. Summer is often a full discharge cycle with a smaller magnitude discharge in the winter, and some regions have a relatively small winter cycle if insufficient arbitrage opportunities exist. The maximum cumulative revenue that could be achieved with LDES depends on the price of charging electricity throughout these cycles, with greater total revenue in regions with more low/zero-price periods for charging. Some regions can undergo a long-term charging cycle with little to no lost revenue.
While LDES is often discussed as using technologies with lower RTE, the increase in required charging energy can substantially reduce the revenue and energy arbitrage value of LDES. Lower RTE narrows the competitive SoC window and prevents the storage system from taking advantage of shorter-term energy arbitrage opportunities. In our scenarios, we found there was often a maximum duration above which a storage system will not fully discharge, and this maximum duration becomes shorter as RTE becomes lower. However, these effects were region- and scenario-specific. For example, the average reduction in LDES revenue going from 85% to 40% RTE was 75% in our Mid Case but 30–40% in a higher-VRE scenario. The higher VRE scenario also demonstrates that operating behavior becomes more similar between 40% and 85% RTE, and many regions trend more towards a 1-cycle annual pattern with charging in the spring and discharging either in the winter or summer. Scenarios with greater VRE shares, either through a policy requirement or market forces (e.g., high natural gas prices), were relatively more favorable to LDES, meaning that favorable regional system topologies and broader policy and market environments can compound LDES value.
The market potential for LDES remains complex and uncertain. This work demonstrates that, from a theoretical perspective, longer storage durations up to 20–40 h can measurably increase energy arbitrage value beyond what would be observed today. Future electricity systems with higher VRE shares could create a better value proposition for LDES, but increased value is not a given, and deployment potential will ultimately depend on LDES cost relative to that value. From an analyst’s perspective, any modeling and analysis tools being used to study high VRE energy systems should be adapted to capture the operating patterns and long-term value proposition of LDES. For industry stakeholders, we intend this analysis to motivate decision-makers to look beyond near-term energy storage trends and consider whether longer-duration storage might hold value given expected future storage equipment cost and performance along with location-specific factors. It is important for discussions and decisions about LDES deployment to consider future changes to electricity sector infrastructure, markets, and policy to represent a world consistent with the potential need for LDES. This work shows that the relationship between storage duration and value is likely to change over time, making it important to consistently revisit the potential LDES contribution to the future grid. While it is impossible to universally demonstrate LDES value, it is naïve to universally disregard it.

Supplementary Materials

The following supporting information can be downloaded at https://www.mdpi.com/article/10.3390/en18071751/s1. Figure S1: ReEDS model balancing areas (BAs) grouped into model market regions. Figure S2: Absolute mid-case arbitrage revenue for durations from 2h to 2190 h (one line for each BA). Figure S3: Absolute mid-case arbitrage revenue for durations from 2h to 2190 h (one line for each BA); these results reflect a single optimization year, not the optimized central year approach. Figure S4: Absolute, normalized, and incremental mid-case arbitrage revenue versus storage duration for the ERCOT region. Figure S5: Absolute, normalized, and incremental mid-case arbitrage revenue versus storage duration for the MISO region. Figure S6: Absolute, normalized, and incremental mid-case arbitrage revenue versus storage duration for the NPCC NE region. Figure S7: Absolute, normalized, and incremental mid-case arbitrage revenue versus storage duration for the NPCC NY region. Figure S8: Absolute, normalized, and incremental mid-case arbitrage revenue versus storage duration for the PJM region. Figure S9: Absolute, normalized, and incremental mid-case arbitrage revenue versus storage duration for the WECC CA region. Figure S10: Absolute, normalized, and incremental mid-case arbitrage revenue versus storage duration for the WECC SRSG region. Figure S11: Cumulative revenue accrual over the calendar year for each BA in WECC, calculated for a 2190 h storage duration to represent an upper bound. Hour 0 is midnight 1 January. Figure S12: Cumulative revenue accrual over the calendar year for each BA in SPP, MISO, and ERCOT, calculated for a 2190 h storage duration to represent an upper bound. Hour 0 is midnight 1 January. Figure S13: Cumulative revenue accrual over the calendar year for each BA in PJM, NPCC, and SERC, calculated for a 2190 h storage duration to represent an upper bound. Hour 0 is midnight 1 January. Figure S14: State of charge for 2190 h storage for all BAs within WECC regions. Figure S15: State of charge for 2190 h storage for all BAs within SPP, MISO, and ERCOT regions. Figure S16: State of charge for 2190 h storage for all BAs within PJM, NPCC, and SERC regions. Figure S17: Storage system state of charge (SoC) and cumulative revenue throughout the year for 336-h storage, given 85% and 40% RTE and varying initial and final SoC, for an example BA in WECC NWPP in the 2024 Mid Case. Figure S18: Storage system state of charge (SoC) and cumulative revenue throughout the year for 336-h storage, given 85% and 40% RTE and varying initial and final SoC, for an example BA in SPP in the 2024 Mid Case. Figure S19: Storage system state of charge (SoC) and cumulative revenue throughout the year for 336-h storage, given 85% and 40% RTE and varying initial and final SoC, for an example BA in SERC in the 2024 Mid Case. Figure S20: Storage system state of charge (SoC) and cumulative revenue throughout the year for 336-h storage, given 85% and 40% RTE and varying initial and final SoC, for an example BA in MISO in the 2024 Mid Case.

Author Contributions

Conceptualization, A.H.S., S.M.C., W.C., P.D. and N.B.; Methodology, A.H.S. and S.M.C.; Software, A.H.S.; Formal analysis, A.H.S. and S.M.C.; Investigation, A.H.S.; Data curation, A.H.S.; Writing—original draft, A.H.S., S.M.C. and W.C.; Writing—review & editing, A.H.S., S.M.C., W.C., P.D. and N.B.; Visualization, A.H.S.; Supervision, W.C., P.D. and N.B.; Project administration, S.M.C., W.C., P.D. and N.B.; Funding acquisition, W.C., P.D. and N.B. All authors have read and agreed to the published version of the manuscript.

Funding

This work was authored by the National Renewable Energy Laboratory, operated by Alliance for Sustainable Energy, LLC, for the U.S. Department of Energy (DOE) under Contract No. DE-AC36-08GO28308. Funding provided by the U.S. Department of Energy Office of Energy Efficiency and Renewable Energy Strategic Analysis Office, the U.S. Department of Energy Office of Energy Efficiency and Renewable Energy Water Power Technologies Office, and the U.S. Department of Energy Office of Energy Efficiency and Renewable Energy Solar Energy Technologies Office. The views expressed in the article do not necessarily represent the views of the DOE or the U.S. Government. The U.S. Government retains and the publisher, by accepting the article for publication, acknowledges that the U.S. Government retains a nonexclusive, paid-up, irrevocable, worldwide license to publish or reproduce the published form of this work, or allow others to do so, for U.S. Government purposes.

Data Availability Statement

Publicly available datasets were used in this study; these data can be found here: https://scenarioviewer.nrel.gov/. The data presented in this study are available on request from the corresponding author.

Conflicts of Interest

The authors declare no conflict of interest.

References

  1. McPherson, M.; Tahseen, S. Deploying storage assets to facilitate variable renewable energy integration: The impacts of grid flexibility, renewable penetration, and market structure. Energy 2018, 145, 856–870. [Google Scholar] [CrossRef]
  2. Battery Storage in the United States: An Update on Market Trends; Technical Report; U.S. Energy Information Administration: Washington, DC, USA, 2021. Available online: https://www.eia.gov/analysis/studies/electricity/batterystorage/archive/2021/pdf/battery_storage_2021.pdf (accessed on 21 March 2025).
  3. Denholm, P.; Cole, W.; Frazier, A.W.; Podkaminer, K.; Blair, N. The Four Phases of Storage Deployment: A Framework for the Expanding Role of Storage in the U.S. Power System; Technical Report NREL/TP-6A20-77480; National Renewable Energy Laboratory: Golden, CO, USA, 2021. Available online: https://www.nrel.gov/docs/fy21osti/77480.pdf (accessed on 21 March 2025).
  4. Zhao, D.; Jafari, M.; Botterud, A.; Sakti, A. Strategic energy storage investments: A case study of the CAISO electricity market. Appl. Energy 2022, 325, 119909. [Google Scholar] [CrossRef]
  5. Figgener, J.; Stenzel, P.; Kairies, K.-P.; Linßen, J.; Haberschusz, D.; Wessels, O.; Robinius, M.; Stolten, D.; Sauer, D.U. The development of stationary battery storage systems in Germany—Status 2020. J. Energy Storage 2021, 33, 101982. [Google Scholar] [CrossRef]
  6. Carden, K.; Wintermantel, N. Energy Storage Capacity Value on the CAISO System; Astrape Consulting: Hoover, AL, USA, 2019; Available online: https://www.astrape.com/wp-content/uploads/2024/01/2019-20-IRP-Astrape-Battery-ELCC-Analysis.pdf (accessed on 3 April 2024).
  7. Parks, K. Declining Capacity Credit for Energy Storage and Demand Response with Increased Penetration. IEEE Trans. Power Syst. 2019, 34, 4542–4546. [Google Scholar] [CrossRef]
  8. Frazier, A.W.; Cole, W.; Denholm, P.; Machen, S.; Gates, N.; Blair, N. Storage Futures Study: Economic Potential of Diurnal Storage in the U.S. Power Sector; Technical Report NREL/TP-6A20-77449; National Renewable Energy Laboratory: Golden, CO, USA, 2021. Available online: https://www.nrel.gov/docs/fy21osti/77449.pdf (accessed on 3 April 2024).
  9. Denholm, P.; Nunemaker, J.; Gagnon, P.; Cole, W. The potential for battery energy storage to provide peaking capacity in the United States. Renew. Energy 2020, 151, 1269–1277. [Google Scholar] [CrossRef]
  10. Hjalmarsson, J.; Thomas, K.; Boström, C. Service stacking using energy storage systems for grid applications—A review. J. Energy Storage 2023, 60, 106639. [Google Scholar] [CrossRef]
  11. McGrath, G. Electricity Monthly Update with Data for April 2023. Energy Information Administration. Available online: https://www.eia.gov/electricity/monthly/update/archive/june2023/ (accessed on 28 July 2023).
  12. Hoos, J.; Lohmeyer, T.; Graham, J. The Case for Battery Storage in PJM. 23 January 2025. Available online: https://auroraer.com/webinar/battery-storage-in-pjm/ (accessed on 21 March 2025).
  13. Munoz, J.; Liu, A.; Hunt, E.; Pharande, S. The Case for Battery Storage in MISO: Market Reforms and Opportunities. 11 February 2025. Available online: https://auroraer.com/webinar/flexible-energy-add-on-in-miso/ (accessed on 21 March 2025).
  14. Cole, W.; Karmakar, A. Cost Projections for Utility-Scale Battery Storage: 2023 Update; Technical Report NREL/TP-6A40-85332; National Renewable Energy Laboratory: Golden, CO, USA, 2023. Available online: https://www.nrel.gov/docs/fy23osti/85332.pdf (accessed on 3 April 2024).
  15. Shan, R.; Reagan, J.; Castellanos, S.; Kurtz, S.; Kittner, N. Evaluating emerging long-duration energy storage technologies. Renew. Sustain. Energy Rev. 2022, 159, 112240. [Google Scholar] [CrossRef]
  16. Hunter, C.A.; Penev, M.M.; Reznicek, E.P.; Eichman, J.; Rustagi, N.; Baldwin, S.F. Techno-economic analysis of long-duration energy storage and flexible power generation technologies to support high-variable renewable energy grids. Joule 2021, 5, 2077–2101. [Google Scholar] [CrossRef]
  17. Amir, M.; Deshmukh, R.G.; Khalid, H.M.; Said, Z.; Raza, A.; Muyeen, S.M.; Nizami, A.-S.; Elavarasan, R.M.; Saidur, R.; Sopian, K. Energy storage technologies: An integrated survey of developments, global economical/environmental effects, optimal scheduling model, and sustainable adaption policies. J. Energy Storage 2023, 72, 108694. [Google Scholar] [CrossRef]
  18. Smdani, G.; Islam, M.R.; Yahaya, A.N.A.; Safie, S.I.B. Performance Evaluation of Advanced Energy Storage Systems: A Review. Energy Environ. 2023, 34, 1094–1141. [Google Scholar] [CrossRef]
  19. Sepulveda, N.A.; Jenkins, J.D.; Edington, A.; Mallapragada, D.S.; Lester, R.K. The design space for long-duration energy storage in decarbonized power systems. Nat. Energy 2021, 6, 506–516. [Google Scholar] [CrossRef]
  20. Jenkins, J.D.; Sepulveda, N.A. Long-duration energy storage: A blueprint for research and innovation. Joule 2021, 5, 2241–2246. [Google Scholar] [CrossRef]
  21. Albertus, P.; Manser, J.S.; Litzelman, S. Long-Duration Electricity Storage Applications, Economics, and Technologies. Joule 2020, 4, 21–32. [Google Scholar] [CrossRef]
  22. McNamara, J.W.; DeAngelis, V.; Byrne, R.H.; Benson, A.; Chalamala, B.R.; Masiello, R. Long-duration energy storage in a decarbonized future: Policy gaps, needs, and opportunities. MRS Energy Sustain. 2022, 9, 142–170. [Google Scholar] [CrossRef]
  23. Guerra, O.J. Beyond short-duration energy storage. Nat. Energy 2021, 6, 460–461. [Google Scholar] [CrossRef]
  24. Peng, P.; Jiang, H.Z.H.; Collins, S.; Furukawa, H.; Long, J.R.; Breunig, H. Long Duration Energy Storage Using Hydrogen in Metal–Organic Frameworks: Opportunities and Challenges. ACS Energy Lett. 2024, 9, 2727–2735. [Google Scholar] [CrossRef]
  25. Hunt, J.D.; Zakeri, B.; Jurasz, J.; Tong, W.; Dąbek, P.B.; Brandão, R.; Patro, E.R.; Đurin, B.; Filho, W.L.; Wada, Y.; et al. Underground Gravity Energy Storage: A Solution for Long-Term Energy Storage. Energies 2023, 16, 825. [Google Scholar] [CrossRef]
  26. Vecchi, A.; Sciacovelli, A. Long-duration thermo-mechanical energy storage—Present and future techno-economic competitiveness. Appl. Energy 2023, 334, 120628. [Google Scholar] [CrossRef]
  27. Cole, W.; Denholm, P.; Carag, V.; Frazier, W. The peaking potential of long-duration energy storage in the United States power system. J. Energy Storage 2023, 62, 106932. [Google Scholar] [CrossRef]
  28. Twitchell, J.; DeSomber, K.; Bhatnagar, D. Defining long duration energy storage. J. Energy Storage 2023, 60, 105787. [Google Scholar] [CrossRef]
  29. Denholm, P.; Cole, W.; Blair, N. Moving Beyond 4-Hour Li-Ion Batteries: Challenges and Opportunities for Long(er)-Duration Energy Storage; Technical Report NREL/TP-6A40-85878; National Renewable Energy Laboratory: Golden, CO, USA, 2023. Available online: https://www.nrel.gov/docs/fy23osti/85878.pdf (accessed on 3 April 2024).
  30. Jafari, M.; Botterud, A.; Sakti, A. Estimating revenues from offshore wind-storage systems: The importance of advanced battery models. Appl. Energy 2020, 276, 115417. [Google Scholar] [CrossRef]
  31. Scott, K.; Hendrickson, S.; Ryan, N.; Dawson, A.; Kort, K.; Shrager, B.; Siberry, V.; Spitsen, P.; Babinec, S.; Balducci, P.; et al. Pathways to Commercial Liftoff: Long Duration Energy Storage; Department of Energy: Washington, DC, USA, 2023. Available online: https://liftoff.energy.gov/wp-content/uploads/2023/03/20230320-Liftoff-LDES-vPUB.pdf (accessed on 25 March 2023).
  32. Conlon, T.; Waite, M.; Modi, V. Assessing new transmission and energy storage in achieving increasing renewable generation targets in a regional grid. Appl. Energy 2019, 250, 1085–1098. [Google Scholar] [CrossRef]
  33. Sánchez-Pérez, P.A.; Staadecker, M.; Szinai, J.; Kurtz, S.; Hidalgo-Gonzalez, P. Effect of modeled time horizon on quantifying the need for long-duration storage. Appl. Energy 2022, 317, 119022. [Google Scholar] [CrossRef]
  34. Staadecker, M.; Szinai, J.; Sánchez-Pérez, P.A.; Kurtz, S.; Hidalgo-Gonzalez, P. The value of long-duration energy storage under various grid conditions in a zero-emissions future. Nat. Commun. 2024, 15, 9501. [Google Scholar] [CrossRef]
  35. Dowling, J.A.; Dowling, J.A.; Rinaldi, K.Z.; Ruggles, T.H.; Davis, S.J.; Yuan, M.; Tong, F.; Lewis, N.S.; Caldeira, K. Role of Long-Duration Energy Storage in Variable Renewable Electricity Systems. Joule 2020, 4, 1907–1928. [Google Scholar] [CrossRef]
  36. Cárdenas, B.; Swinfen-Styles, L.; Rouse, J.; Garvey, S.D. Short-, Medium-, and Long-Duration Energy Storage in a 100% Renewable Electricity Grid: A UK Case Study. Energies 2021, 14, 8524. [Google Scholar] [CrossRef]
  37. Giovanniello, M.A.; Wu, X.-Y. Hybrid lithium-ion battery and hydrogen energy storage systems for a wind-supplied microgrid. Appl. Energy 2023, 345, 121311. [Google Scholar] [CrossRef]
  38. Fernandez, G.; Jose, O.; Koleva, M.; Eichman, J.; Townsend, A. RODeO (Revenue Operation and Device Optimization Model) [SWR 20-67]; National Renewable Energy Laboratory: Golden, CO, USA, 2020. [Google Scholar] [CrossRef]
  39. Gagnon, P.; Brown, M.; Steinberg, D.; Brown, P. 2022 Standard Scenarios Report: A U.S. Electricity Sector Outlook; Technical Report NREL/TP-6A40-84327; National Renewable Energy Laboratory: Golden, CO, USA, 2022. [Google Scholar]
  40. Jorgenson, J.; Frazier, A.W.; Denholm, P.; Blair, N. Storage Futures Study: Grid Operational Impacts of Widespread Storage Deployment; Technical Report NREL/TP-6A40-80688; National Renewable Energy Laboratory: Golden, CO, USA, 2022. Available online: https://www.nrel.gov/docs/fy22osti/80688.pdf (accessed on 3 April 2024).
  41. U.S. Department of Energy. Solar Futures Study; DOE/GO-102021-5621; U.S. Department of Energy Office of Energy Efficiency and Renewable Energy: Washington, DC, USA, 2021. Available online: https://www.energy.gov/sites/default/files/2021-09/Solar%20Futures%20Study.pdf (accessed on 3 April 2024).
  42. Murphy, C.; Mai, T.; Sun, Y.; Jadun, P.; Muratori, M.; Nelson, B.; Jones, R. Electrification Futures Study: Scenarios of Power System Evolution and Infrastructure Development for the United States; Technical Report NREL/TP-6A20-72330; National Renewable Energy Laboratory: Golden, CO, USA, 2021. Available online: https://www.nrel.gov/docs/fy21osti/72330.pdf (accessed on 3 April 2024).
  43. Murphy, C.; Cole, W.; Bistline, J.; Bragg-Sitton, S.; Dixon, B.; Eschmann, E.; Ho, J.; Kwon, A.; Martin, L.; Namovicz, C.; et al. Nuclear Power’s Future Role in a Decarbonized U.S. Electricity System; Technical Report NREL/TP-6A20-84451; National Renewable Energy Laboratory: Golden, CO, USA, 2023. Available online: https://www.nrel.gov/docs/fy23osti/84451.pdf (accessed on 3 April 2024).
  44. Gagnon, P.; Cowiestoll, B.; Schwarz, M. Cambium 2022 Scenario Descriptions and Documentation; Technical Report NREL/TP-6A40-84916; National Renewable Energy Laboratory: Golden, CO, USA, 2023. Available online: https://www.nrel.gov/docs/fy23osti/84916.pdf (accessed on 1 March 2023).
  45. Gagnon, P.; Perez, P.A.S.; Obika, K.; Schwarz, M.; Morris, J.; Gu, J.; Eisenman, J. Cambium 2023 Scenario Descriptions and Documentation; Technical Report NREL/TP-6A40-88507; National Renewable Energy Laboratory: Golden, CO, USA, 2024. Available online: https://www.nrel.gov/docs/fy24osti/88507.pdf (accessed on 3 April 2024).
  46. U.S. Energy Information Administration. Annual Energy Outlook 2022. Available online: https://www.eia.gov/outlooks/aeo/ (accessed on 3 March 2023).
  47. Mirletz, B.; Vimmerstedt, L.; Akar, S.; Avery, G.; Stright, D.; Akindipe, D.; Augustine, C.; Beiter, P.; Cohen, S.; Cole, W.; et al. Annual Technology Baseline: The 2023 Electricity Update. July 2023. Available online: https://www.osti.gov/biblio/1992829 (accessed on 3 April 2024).
  48. Maestre, V.M.; Ortiz, A.; Ortiz, I. Challenges and prospects of renewable hydrogen-based strategies for full decarbonization of stationary power applications. Renew. Sustain. Energy Rev. 2021, 152, 111628. [Google Scholar] [CrossRef]
  49. Sakti, A.; Gallagher, K.G.; Sepulveda, N.; Uckun, C.; Vergara, C.; de Sisternes, F.J.; Dees, D.W.; Botterud, A. Enhanced representations of lithium-ion batteries in power systems models and their effect on the valuation of energy arbitrage applications. J. Power Sources 2017, 342, 279–291. [Google Scholar] [CrossRef]
  50. Sioshansi, R.; Denholm, P.; Jenkin, T.; Weiss, J. Estimating the value of electricity storage in PJM: Arbitrage and some welfare effects. Energy Econ. 2009, 31, 269–277. [Google Scholar] [CrossRef]
  51. Walawalkar, R.; Apt, J.; Mancini, R. Economics of electric energy storage for energy arbitrage and regulation in New York. Energy Policy 2007, 35, 2558–2568. [Google Scholar] [CrossRef]
Figure 1. National capacity and generation mix for each infrastructure scenario, showing a range of fossil vs. renewable energy portfolios [39]. PSH = pumped storage hydropower, PV = solar photovoltaic, CSP = concentrating solar power, BECCS = bio-energy with carbon capture and sequestration, Lfill-Gas = landfill gas, CT = combustion turbine, CC = combined cycle.
Energies 18 01751 g001
Figure 2. Absolute mid-case arbitrage revenue for durations from 2 h to 96 h (one line for each BA). $ = USD.
Energies 18 01751 g002
Figure 3. Absolute, normalized, and incremental revenue versus storage duration for the WECC NWPP region. $ = USD.
Energies 18 01751 g003
Figure 4. Absolute, normalized, and incremental revenue versus storage duration for the SPP region. $ = USD.
Energies 18 01751 g004
Figure 5. Absolute, normalized, and incremental revenue versus storage duration for the SERC region. $ = USD.
Energies 18 01751 g005
Figure 6. Price duration curves for all BAs in 2024 (left) and 2050 (right) for Mid Case. $ = USD.
Energies 18 01751 g006
Figure 7. Cumulative revenue accrual over the calendar year for each BA in WECC NWPP, SPP, and SERC, calculated for a 2190 h storage duration to represent an upper bound. Hour 0 is midnight 1 January. $ = USD.
Energies 18 01751 g007
Figure 8. Storage system state of charge (SoC) throughout the year in the 2024 Mid Case for select storage durations given 85% and 40% RTE. The left panel is an example BA in WECC NWPP, and the right panel is a BA in SPP.
Energies 18 01751 g008
Figure 9. Ratio of annual arbitrage revenue of storage with 40% RTE to the revenue of storage with 85% RTE (Mid Case, 2024, all BAs).
Energies 18 01751 g009
Figure 10. Storage system state of charge (SoC) throughout the year in the 95% Decarb by 2050 case in 2050 for select storage durations given an 85% and 40% RTE. The left panel is an example BA in WECC NWPP, and the right panel is a BA in SPP.
Energies 18 01751 g010
Figure 11. Ratio of annual arbitrage revenue of storage with 40% RTE to the revenue of storage with 85% RTE (95% Decarb by 2050 case, 2050, all BAs).
Energies 18 01751 g011
Figure 12. Ratio of the arbitrage revenue for each scenario to the arbitrage revenue for the Mid Case in 2050.
Energies 18 01751 g012
Disclaimer/Publisher’s Note: The statements, opinions and data contained in all publications are solely those of the individual author(s) and contributor(s) and not of MDPI and/or the editor(s). MDPI and/or the editor(s) disclaim responsibility for any injury to people or property resulting from any ideas, methods, instructions or products referred to in the content.

