Article

Comprehensive Analysis and Optimization of Day-Ahead Scheduling: Influence of Wind Power Generation and Electric Vehicle Flexibility

1
State Grid Shandong Electric Power Company, Dezhou Power Supply Branch, Dezhou 253000, China
2
Institute of the Building Environment & Sustainability Technology, School of Human Settlements and Civil Engineering, Xi’an Jiaotong University, Xi’an 710049, China
*
Author to whom correspondence should be addressed.
Energies 2025, 18(7), 1639; https://doi.org/10.3390/en18071639
Submission received: 26 February 2025 / Revised: 17 March 2025 / Accepted: 19 March 2025 / Published: 25 March 2025
(This article belongs to the Collection State of the Art Electric Vehicle Technology in China)

Abstract

:
With an increasing global emphasis on reducing carbon emissions and enhancing energy efficiency, the rising popularity of electric vehicles (EVs) has played a pivotal role in facilitating the transition to electrification within transportation sectors. However, the variability in their charging behavior has posed challenges for grid loads. In this study, a day-ahead scheduling model is developed for an integrated energy system to assess the impact of various electric vehicle charging modes on energy economics during typical days in summer, winter, and transition seasons. Additionally, the influence of optimized charging strategies on increasing the utilization of renewable energy and enhancing the operational efficiency of the grid is explored. The findings reveal that the abandonment rates of wind and solar energy associated with the orderly charging mode are 0 during typical days in winter and summer but decrease by 64.83% during the transition seasons. Furthermore, the power purchased from the grid declines by 18.79%, 19.34%, and 53.31% across these seasonal conditions, in respective. Consequently, the total load cost associated with the ordered charging mode decreases by 29.69%, 25.96%, and 43.71%, respectively, for summer, winter, and transition seasons.

1. Introduction

In the process of the global energy transition, addressing climate change and achieving sustainable development have emerged as primary concerns for the international community [1,2]. Within this framework, renewable energy sources, particularly wind and photovoltaic power, are gaining prominence due to their zero carbon emissions, abundant availability, and other significant advantages. As a result, the proportion of these renewable sources in the global power generation mix is steadily increasing, positioning them as a crucial driver of the clean energy transition [3].
However, the inherent intermittent and fluctuating nature of wind and solar power generation presents challenges for the stable operation and efficient consumption of power systems [4,5]. In recent years, the issue of the curtailment of wind and PV power generation has intensified [6], resulting in substantial quantities of renewable resources remaining untapped and effectively wasted. From a stability perspective, these characteristics contribute to the inherent instability of energy supply within power systems. From the standpoint of energy strategy, the waste of renewable energy resources undermines the advancement of energy transformation initiatives [7]. Therefore, it is important to enhance the development of energy storage systems to improve the flexibility and responsiveness of system resources, thereby addressing the timing mismatch between energy generation and consumption [8]. Furthermore, energy storage solutions can mitigate the unpredictability, volatility, and discontinuity associated with renewable energy sources on the grid, while simultaneously minimizing waste generated from wind and solar energy resources [9].
With the advancement of electric vehicles (EVs), the number of electric vehicles has increased exponentially. This provides innovative solutions to the issue of the curtailment of wind and PV power generation [10]. As mobile energy storage units, EVs exhibit significant flexibility in both charging and discharging behaviors [11]. This adaptability allows EVs to actively regulate the supply–demand relationship in power systems, thereby enabling effective management of power grid loads through optimized charging and discharging strategies [12]. Ahmad et al. [13] investigated the joint real-time load scheduling and energy storage management of grid-connected solar-powered EVs. They demonstrated that the proposed algorithm could achieve a daily photovoltaic utilization rate of 50.50% for EVs, while it reduced monthly energy costs by 72.61%. Lu et al. [14] suggested that, on a temporal scale, the initiation of EV charging after the completion of a journey follows a uniform distribution. Jian et al. [15] indicated that the timing of EV charging often coincides with periods of low power demand and contributed to economic benefits. Han et al. [16] employed a Markov chain model to simulate EVs in different conditions and at various times. Their model estimated that total charging costs could be reduced by up to 16.89% as user responsiveness reached 90%. Alghamdi et al. [17] explored the spatial characteristics of EV charging loads and analyzed the interactions between electric vehicles and their charging stations across different temporal and spatial dimensions. Sekhar et al. [18] developed a sensor-based model utilizing a hierarchical Bayesian regularization method to enhance the predictive accuracy of electric vehicle driving behaviors. They argued that the improved accuracy reduced concerns regarding driving range limitations.
As for the charging strategies of EVs, there are significant distinctions between orderly and disorderly charging modes. Disorderly charging modes are typically characterized by a variation in charging time and power level which is driven by individual habits and preferences. The absence of unified coordination and management in this approach exacerbates the load pressure, affecting the stability and security of grid operations [19]. Conversely, orderly charging relies on a comprehensive analysis of the real-time state of the power grid, forecasts of renewable energy generation, and user demand. This strategy optimizes charging times, power levels, and other parameters for electric vehicles through advanced intelligent control systems [20,21]. Torre et al. [22] proposed enhancements to the economic viability of EVs by optimizing routing and charging/discharging strategies. Their model successfully considered fluctuations in energy prices, charging facility locations, and travel itineraries in the model. By analyzing actual driving data, Tao et al. [23] explained physically the interfacing relationship between the number of EVs and other factors including the grid, stopping durations, and initial state of charge (SOC) distributions at the commencement of charging. Their findings demonstrated that the optimized orderly charging approach significantly reduced the peak–valley difference and equivalent load fluctuation of the power grid by 22% and 22.7%, respectively. The designed approach satisfactorily met the user charging demands. Ahmad et al. [24] observed that orderly management of EV charging could mitigate the peak–valley difference in charging loads. Liu et al. [25] suggested that EV users could optimize benefits by charging during periods of low grid load and selling power back to the grid during high-demand periods. Aiming to reduce electricity rates and managing peak load conditions, Xu et al. [26] developed a layered coordinated charging framework for plug-in EVs involving multiple aggregators. Wu et al. [27] introduced a layered scheduling and control framework that allowed plug-in EVs to provide essential services to the power grid while accommodating the mobility needs of vehicle owners. Cai et al. [28] designed an optimal scheduling control scheme for EV aggregators. The optimization enabled them to offer adjustment capabilities to the system while ensuring that each EV maintains an adequate SOC prior to its next trip. As the population of EVs continues to grow, existing electric vehicle charging stations (EVCSs) have become increasingly inadequate in meeting the charging demands [29]. In response, Zhang et al. [30] developed an innovative planning model for EVCSs that employed single-output multi-cable charging technology. Their model enabled a single charging station to connect multiple EVs simultaneously and manage their charging processes effectively, which caused the configuration of EVCSs to be optimized.
The methodology described in previous studies aims to guide EVs to charge during periods of curtailed wind and PV power generation or low grid load. This action transforms otherwise wasted wind and solar energy into electrical energy in EV batteries, thus facilitating the absorption of renewable energy. Nevertheless, there has been limited attention paid to the fluctuations of wind and solar energy during winter, summer, and transition seasons, particularly in relation to the flexibility of EV charging. This paper addresses this knowledge gap by analyzing typical days across different seasons and developing a day-ahead scheduling model. Furthermore, the time-utilization algorithm (TUA) is also integrated to optimize and adaptively adjust charging time through a comprehensive energy system strategy. This approach aims to store renewable energy in EV batteries and enhance the efficient utilization of renewable energy through balancing the load on the power grid and supporting the development of a more sustainable and flexible energy system.
This paper is organized as follows: Section 2 describes the system model and optimization method. Section 3 presents the modeling results related to operation strategy optimization, economic analysis, and comprehensive analysis under different seasons. Finally, conclusions are summarized, and recommendations are proposed in Section 4.

2. Methodology

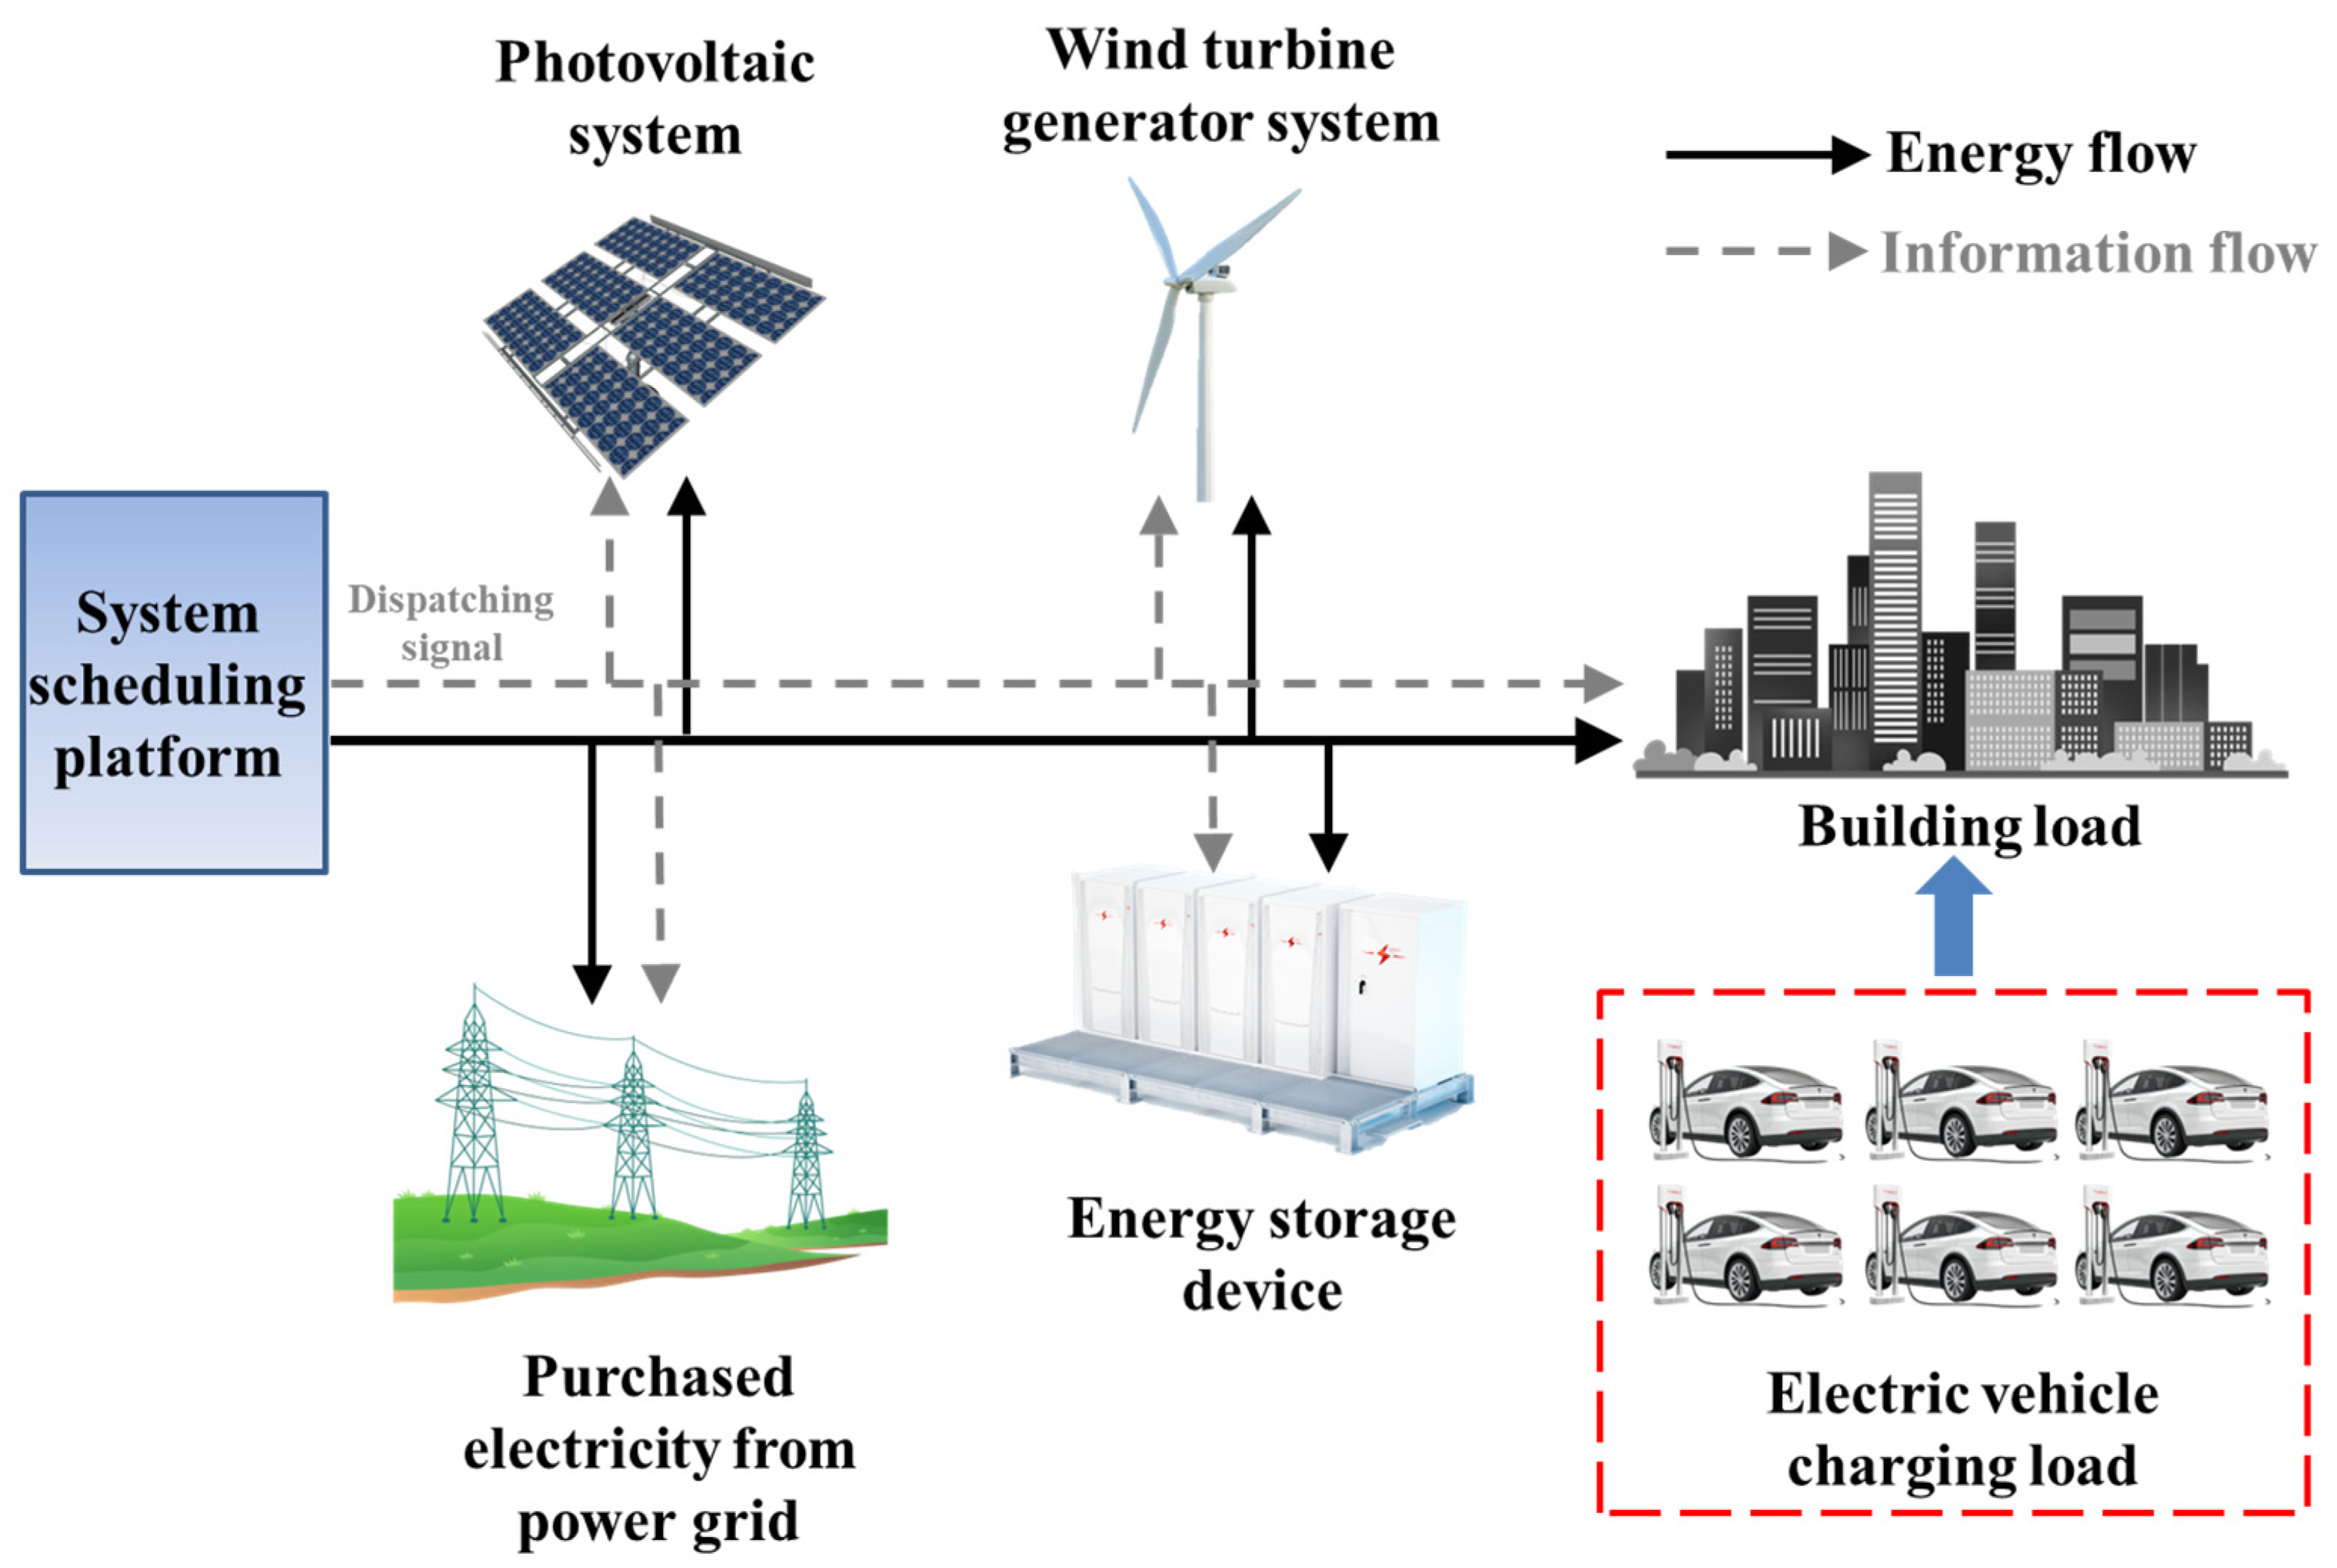
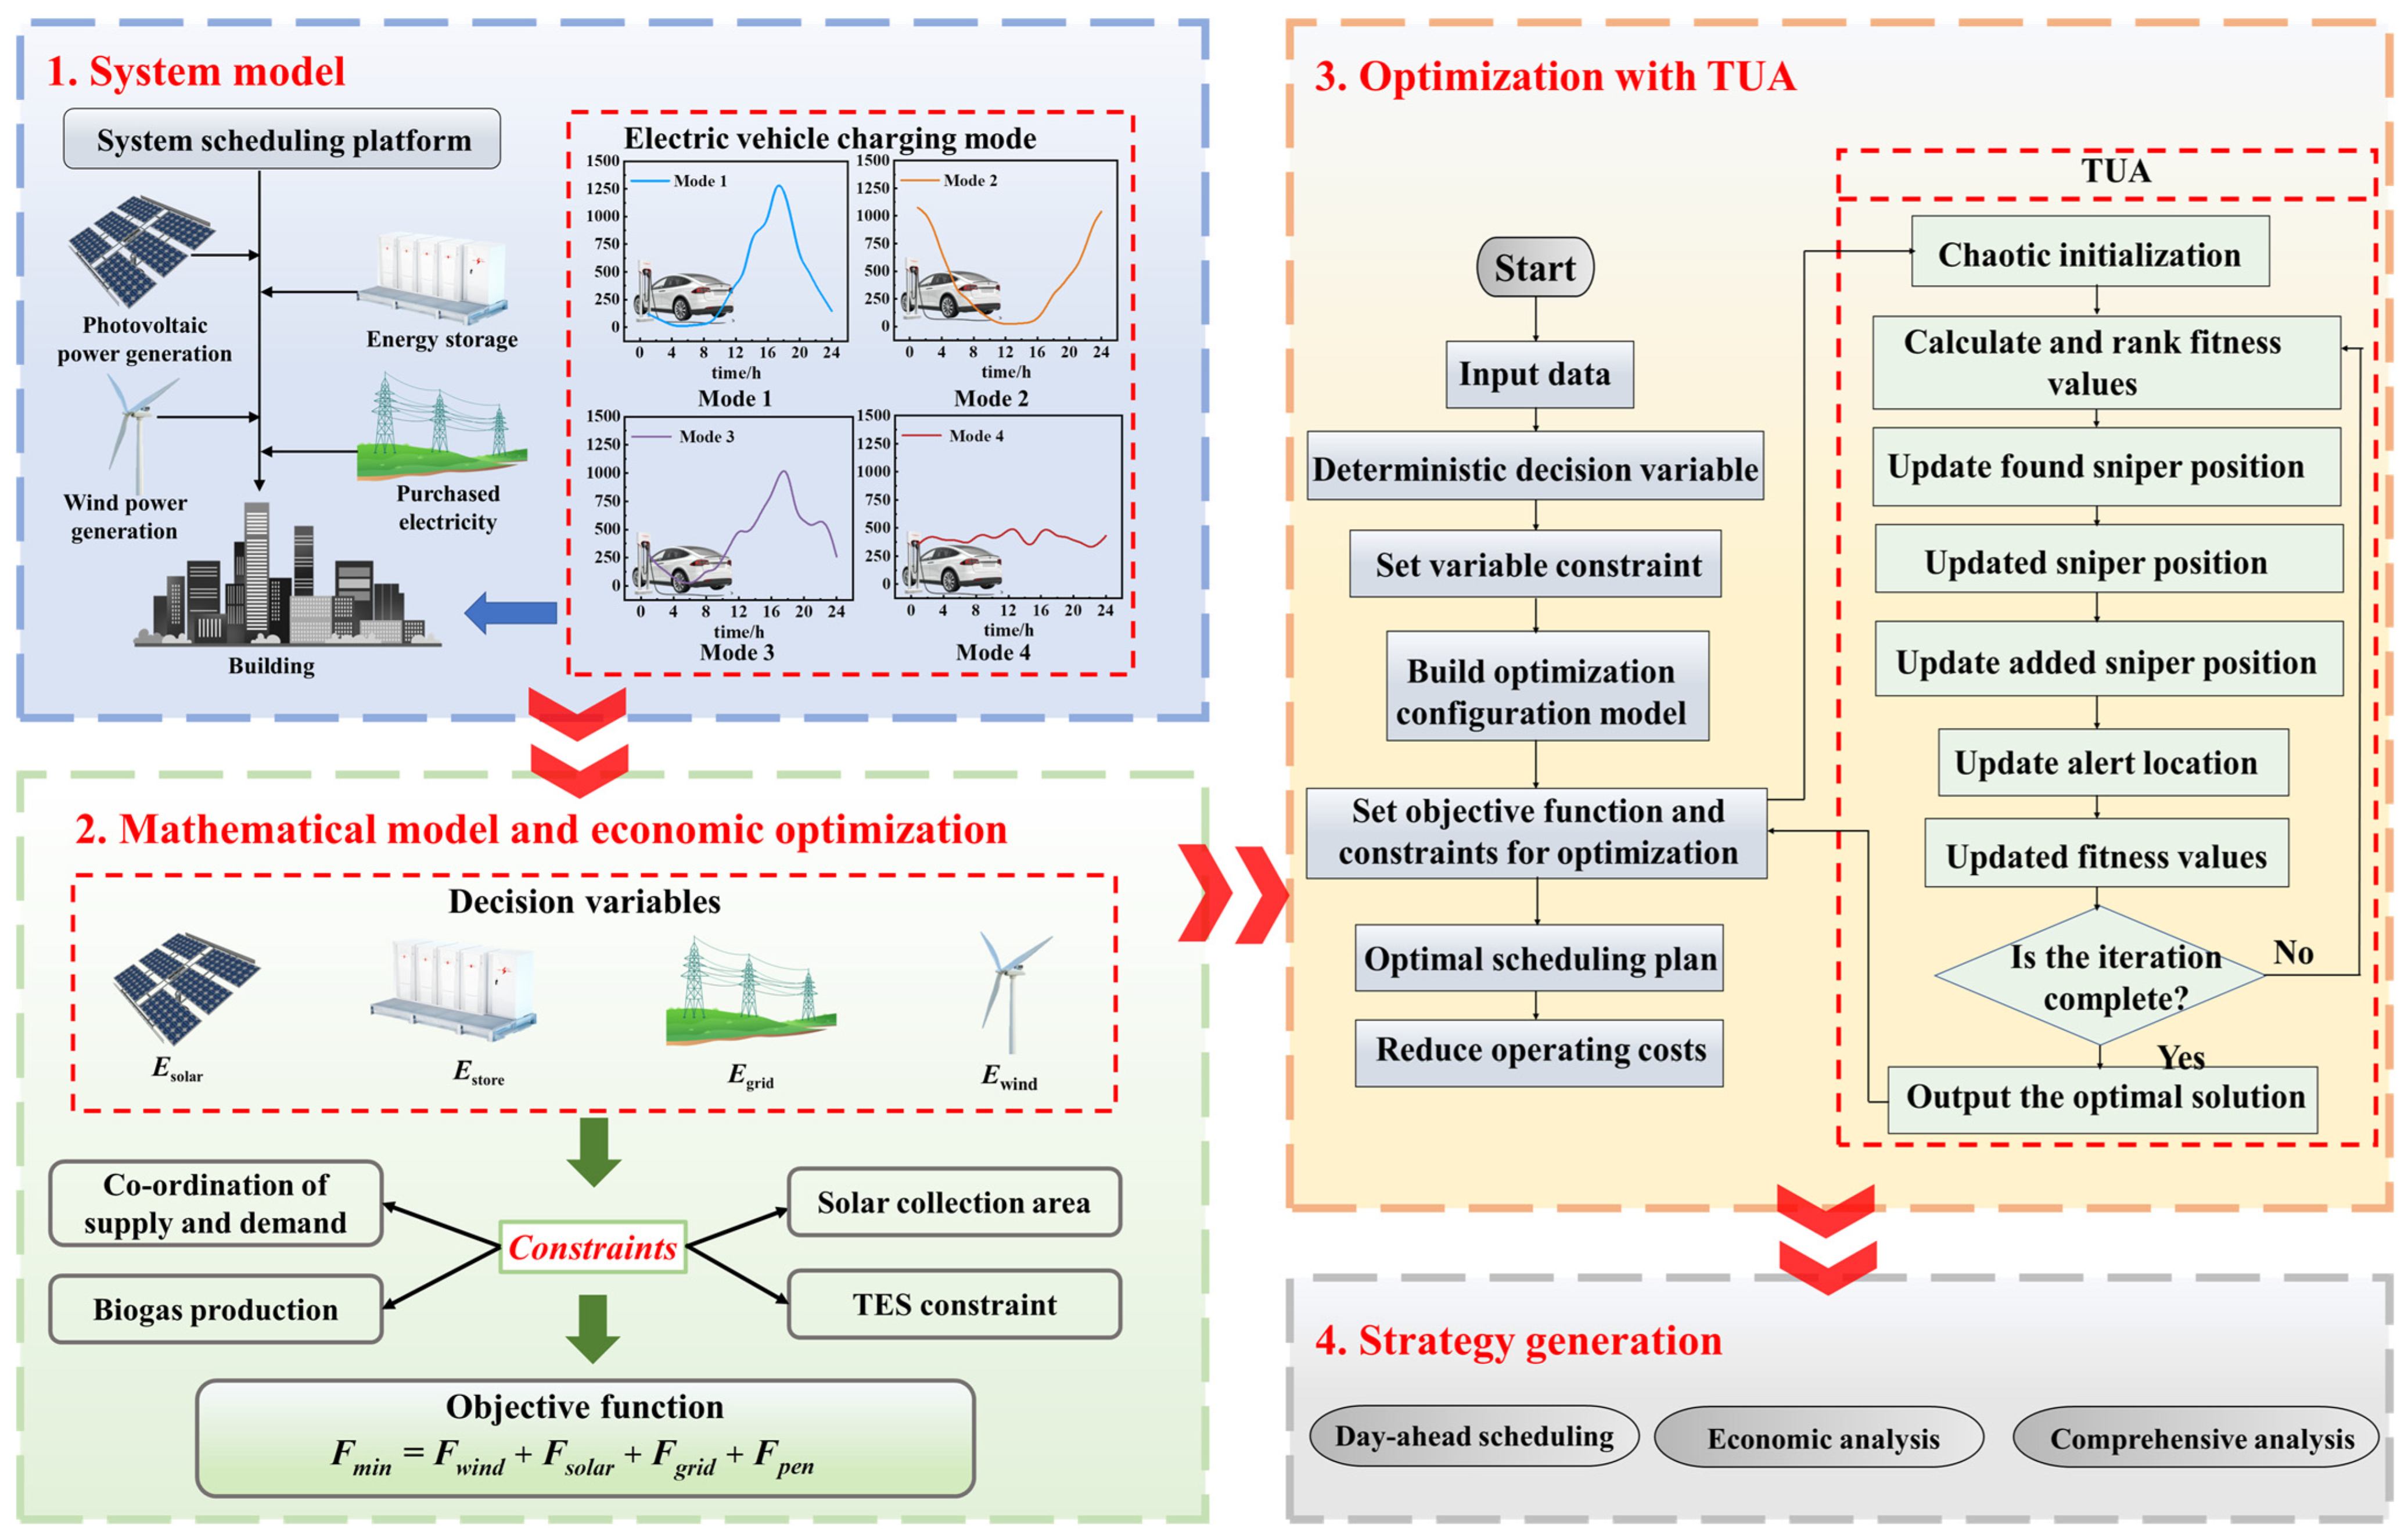
2.1. System Structure

This paper examines the flexible scheduling of integrated energy systems that combine wind, energy storage, and EVs. Figure 1 illustrates the framework of the energy storage system, which is interconnected with wind and solar energy sources, alongside the load side related to buildings and EVs. The system is primarily composed of a photovoltaic system, a wind turbine generator, an energy storage device, and the power grid (purchased electricity), while the load side includes the building energy demand and electric vehicle charging load. The system scheduling platform enhances the optimization of both the power system and the energy storage system in relation to load demands and the generation of renewable energy. Through this, an effective balance between supply and demand can be achieved.
In the practical operation of integrated energy systems, the load side must account for both EV charging loads and building loads. For estimating the EV charging load, this paper employs the Monte Carlo sampling method, using the method and data as referenced in [31]. The Monte Carlo sampling stage mainly provides input parameters such as the mean and variance for the daily mileage distribution function and the charging start time distribution function. It provides data support for the peak-shaving, equalization, and valley-filling of electric vehicles. Based on the input probability density function, a random sample of n = 2000 electric vehicles is generated using the Monte Carlo method, and the daily driving mileage and charging start time sample-set generated by Monte Carlo random sampling are obtained. That is, the daily driving mileage is extracted based on the probability distribution of the daily driving mileage, and the charging start time is determined by combining the probability distribution of the starting to charge time. Then, the total charging power of the electric vehicle is obtained from the probability distribution of the charging power and the probability distribution of the battery capacity, respectively. This approach utilizes the probability distribution of daily driving mileage to extract the driving distance for each day is combined with the probability distribution of starting to charge time to determine the initiation moment for charging. Subsequently, the total charging power for EVs is obtained through the probability distribution of both charging power and battery capacity. To investigate the flexibility of EVs, four distinct charging modes are proposed to regulate the charging start time of 2000 EVs within the park, which is helpful for facilitating the load peaking. The specific charging modes are illustrated in Figure 2, including four typical modes of the disordered mode, the ordered mode, the peak-load shifting mode, and the equalization mode. The results of the sampling calculations for the daily loads across these four modes are presented in Figure 3a. Additionally, the load characteristics of typical buildings are analyzed, and the typical daily loads in summer, winter, and transition seasons are calculated using EnergyPlus 8.7.0 based on the meteorological data of 2024, as shown in Figure 3b.

2.2. Mathematical Model

A comprehensive modeling approach for the energy system integrated with wind and solar storage is proposed. The photovoltaic (PV) power output can be estimated by the following [32]:
P PV ( t ) = P STC G ( t ) G STC ( 1 + k ( T ( t ) T STC ) )
where Ppv(t) represents the output power of PV array at time t with light intensity G(t). GSTC, TSTC, and PSTC are the light intensity, photovoltaic array temperature, and maximum output power in the standard test environment, respectively. k is the temperature coefficient, equaling to 0.45. T(t) indicates the surface temperature of the PV array at time t.
In the wind power model, the relationship between the input wind speed and the output power Pt of a single wind turbine is expressed in Equation (2) [33]. The wind turbine does not generate electricity effectively when the wind speed falls below 3 m/s, and it will automatically shut down for protection when the wind speed exceeds 25 m/s. Equation (2) is as follows:
P t = 0 v v i 0.5 ρ π R 2 v 3 v i < v v n P n v n < v v 0 0 v > v 0
where v represents the actual wind speed; vi, vn, and v0 represent the cut-in, rated, and cut-out wind speed, respectively; p is the specified power; ρ stands for air density; R represents the length of the turbine blade.
Based upon this, the predicted power generation of wind power generation system yields the following equation [33,34]:
P w , t = j = 1 M P t Δ t
where M denotes the total number of turbines; p represents the predicted wind power at time t; Δ t indicates the adjacent period.
The energy storage system principally utilizes batteries, where the input and output power of the energy storage battery differs from the overall input and output power of the energy storage system due to the operational efficiency of the converter. Consequently, a mismatch arises between energy capacity and power output [35]. The calculation relationship is expressed by the following:
P s t o = λ E
where E represents the stored energy of the battery; λ is the efficiency (90%); Psto donates the output power of the battery.

2.3. Objective Function and Optimization Algorithm

Day-ahead optimization scheduling for a wind–solar-storage integrated energy system has been conducted. The optimization scheduling takes into account the contribution of electric flexibility to minimizing the overall operational costs within a single scheduling day. Figure 4 illustrates the optimization framework, demonstrating the optimization objectives, constraints, and algorithms employed.

2.3.1. Cost Optimization

The primary objective of the day-ahead scheduling model is to minimize the operational costs for the system, which encompasses the operational costs associated with three aspects: (1) wind power and PV generation; (2) the penalty costs for curtailing wind and PV power generation; (3) the costs of electricity purchased from the grid.
The operational costs for wind power and PV power plants can be determined by the following [34,35]:
F wind = C w P w ( t )
F PV = C PV P PV ( t )
where Fwind and FPV separately represent the operating costs of wind power and PV power plants, and Pw(t) and Ppv(t) denote the predicted wind power and PV power generation at time t, respectively. Cw and CPV indicate the operating cost factors of wind and photovoltaic power plants (0.03 and 0.04 CNY/kW) [34,35], respectively.
The cost of purchased electricity from external power grid is calculated using the following formula [36]:
F grid = P grid ( t ) C grid
where Fgrid indicates the cost of electricity purchased from the grid, Pgrid(t) donates the purchased electricity at time t, and Cgrid refers to the real-time price for industrial electricity on the grid.
The penalty cost for curtailing wind and PV power generation is described by the following equation [34]:
F pen = c w P w C ( t ) + c PV P PV C ( t )
where Fpen is the wind and PV curtailment penalty cost; cw and cPV are the penalty cost coefficient for the wind and PV curtailment (both 0.24 CNY/kW) [34], respectively; c w P w C ( t ) + c PV P PV C ( t ) separately indicates the curtailment power of wind and PV at time t.
In summary, the objective function of the daily operating cost optimization can be finalized as:
F min = F wind + F solar + F grid + F pen
In this analysis, the installed capacities of the wind generation plant, the PV power generation plant, and the energy storage device are 2400 kW, 2700 kW, and 3000 kWh, respectively, and the typical daily light intensity and wind speed are derived from the measured data. The power grid employs a time-of-use tariff mechanism, as detailed in Table 1, which segments the 24 h day into multiple periods as detailed by the National Energy Administration. In the optimization scenario presented in this study, a 1 h interval is utilized to determine the daily scheduling. Subsequently, a comprehensive energy system model is established in MATLAB R2021a based on the mathematical framework presented in Section 2.2.

2.3.2. Constraint Condition

The model under consideration incorporates constraints related to system power balance, electricity purchases, and battery operation.
The system power balance constraint takes the form of the following:
P w ( t ) + P PV ( t ) + P grid ( t ) = P load ( t )
where Pload(t) represents the building load and EV load at time t.
The storage network interactive power constraint is the following:
0 P grid ( t ) P grid max
where P grid max denotes the maximum power limit for purchased electricity.
Battery constraints encompass the state of charge and discharge, charging and discharging power limits, capacity limitations, and periodic energy balance conditions, as separately defined below:
u sto + u static + u ch = 1 u ch P ch , min P ch , t u ch P ch , max u sto P sto , min P sto , t u sto P sto , max E min E E max E T = E 0
where u sto ,   u static ,   and   u ch are the mutually exclusive states, indicating the discharge state, no charge state, and charging state during the running of the battery energy storage, respectively; P ch , min   and   P ch , max denote the lower and upper limits of charging power for battery storage operations, respectively. Similarly, P sto , min   and   P sto , max separately indicate the lower and upper limits of discharging power for the battery storage system. E min   and   E max represent the minimum and maximum energy states of the battery energy storage system, respectively. The variable E T = E 0 indicates the real-time energy state of the battery energy storage system at time t. Finally, the equation ensures that the total power at the beginning and end of the two scheduling cycles remains balanced.

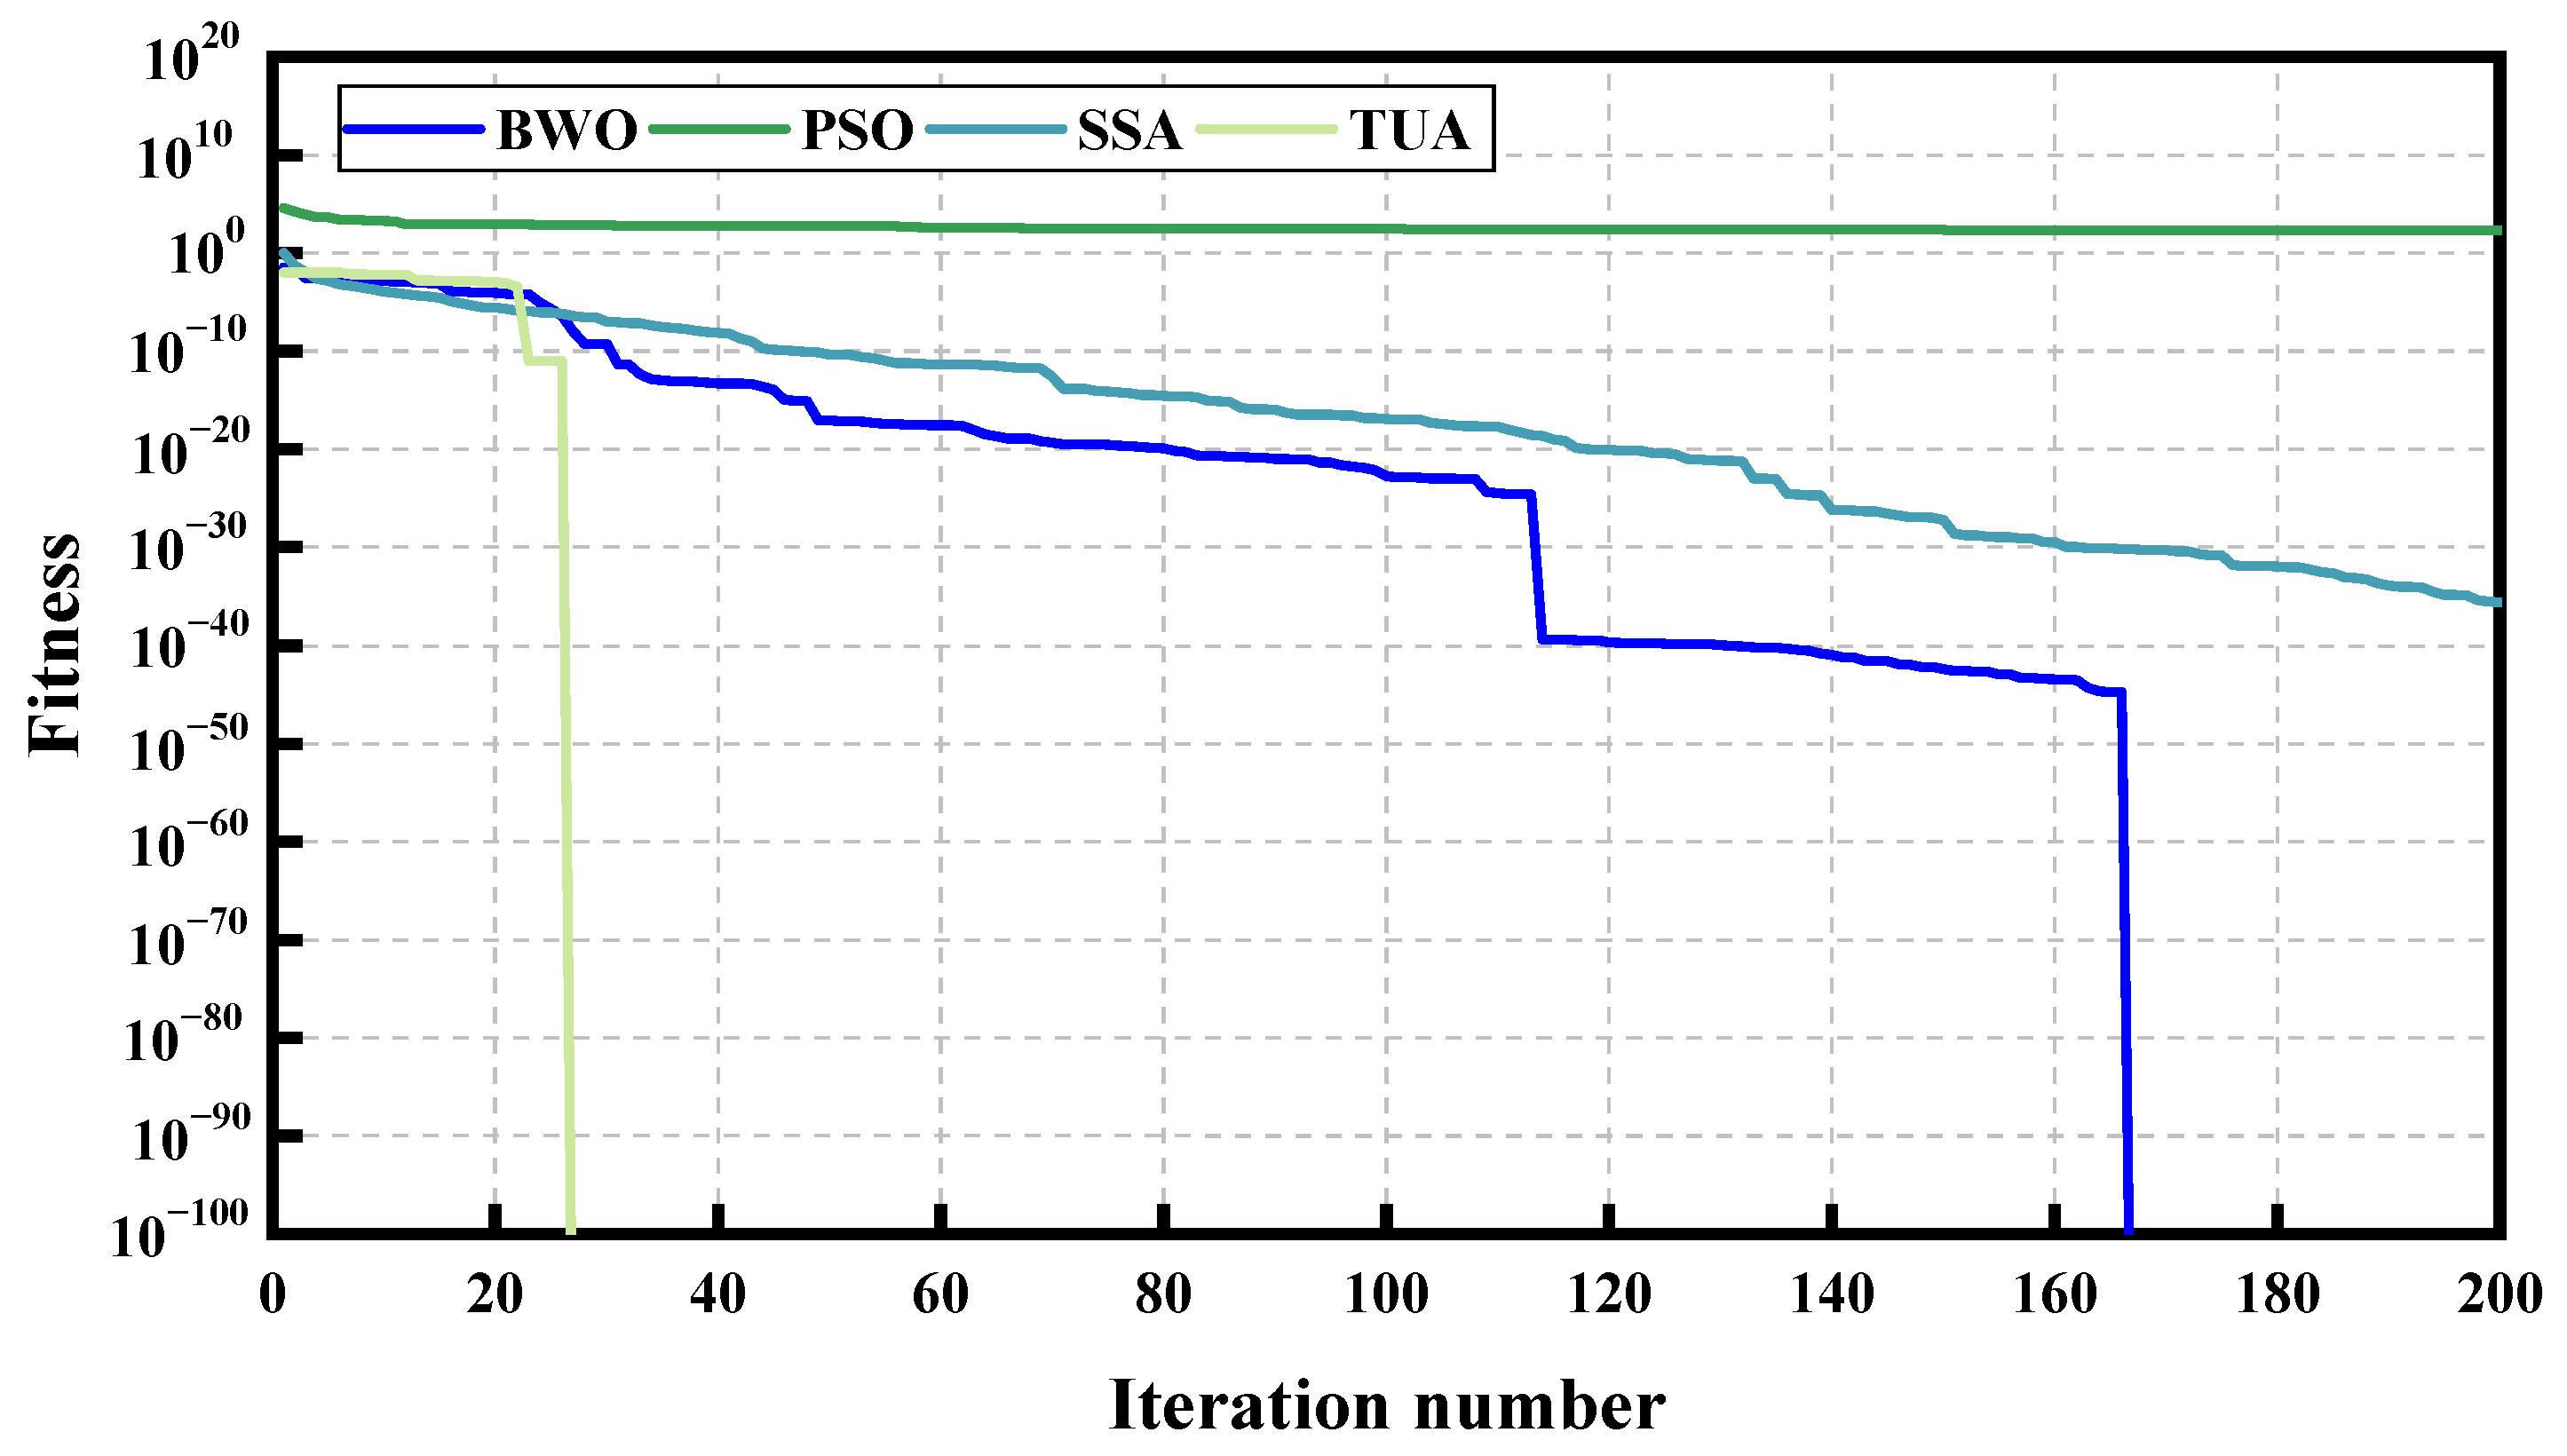
2.3.3. Optimization Algorithm

The tactical unit algorithm (TUA) [37] is employed to optimize the energy solution. The algorithm is described by Equations (13)–(20), with the corresponding flow diagram presented in Figure 4.
Position of each combatant yields the following:
X = x 1 , 1 x 1 , 2 x 1 , d x 2 , 1 x 2 , 2 x 2 , d x n , 1 x n , 2 x n , d
where n represents the population and d donates the dimension.
Population initial fitness takes the form of the following:
F X = f ( x 1 , 1 x 1 , 2 x 1 , d ) f ( x 2 , 1 x 2 , 2 x 2 , d ) f ( x n , 1 x n , 2 x n , d )
where FX stands for the fitness value.
The position of searchers is determined by the following:
X i , j t + 1 =     X i , j t exp ( i 2 2 γ 1 T max ) when     R 1 < T S C X i , j t + exp ( 2 i T max ) P M when     R 1 TSC  
where t donates the current iteration, X i , j t + 1 represents the location for the ith searcher on jth dimension, T max indicates the maximum iteration, γ ranges randomly from 0 to 1 ( γ ( 0 ,   1 ] ), and M presents the matrix of 1 × d . R 1 stands for the capability of searchers and TSC donates the coefficient ( T S C [ 0.7 ,   1.0 ] ).
The position of executors is predicted by the following:
X i , j t + 1 = X b e s t S t + 1 + p t ( X i , j t X b e s t s t + 1 ) when   i < p o p s i z e / 2 X i , j t + p t ( X i , j t X i , j , k t ) when   i   p o p s i z e / 2
where X b e s t S t + 1 presents optimal position information; X i , j t + 1 is the position of one executor; and pt presents the following action coefficient:
p t = exp t T max P M
where t indicates the current iteration number.
The position of current assessors is calculated by the following:
X i , j t = 1 3 ( X b e s t S t + 1 + X b e s t E t + 1 + X i , j t )
where X b e s t S t + 1 and X b e s t E t + 1 are the optimal positions for the searcher and executor.
Assessors in the new generation are estimated by the following:
X i , j t + 1 = α X i , j t + β X i , j t
where β indicates the random number ( β ( 0 ,   1 ] ); X i , j t describes the current position for assessors; and α (adaptive function) is determined by the following:
α = exp t / T max when   t < T max / 2 exp T max t / T max when   t   T max / 2
In order to present the performance of the optimization algorithm used in this paper, BWO, PSO, and SSA are selected as the comparison algorithms, and the number of iterations is set to 200 and the number of populations to 30. The convergence ability of different optimization algorithms to test the benchmark function is obtained, among which the TUA has the fastest convergence speed, and the fitness function is lower when converging. At the same time, the average time values of the test results of the four algorithms for the benchmark function are 0.128 s, 0.073 s, 0.079 s, and 0.014 s. In summary, the TUA has the fastest solving speed and good convergence ability, so it is chosen as the optimization algorithm (Figure 5).

3. Results and Discussion

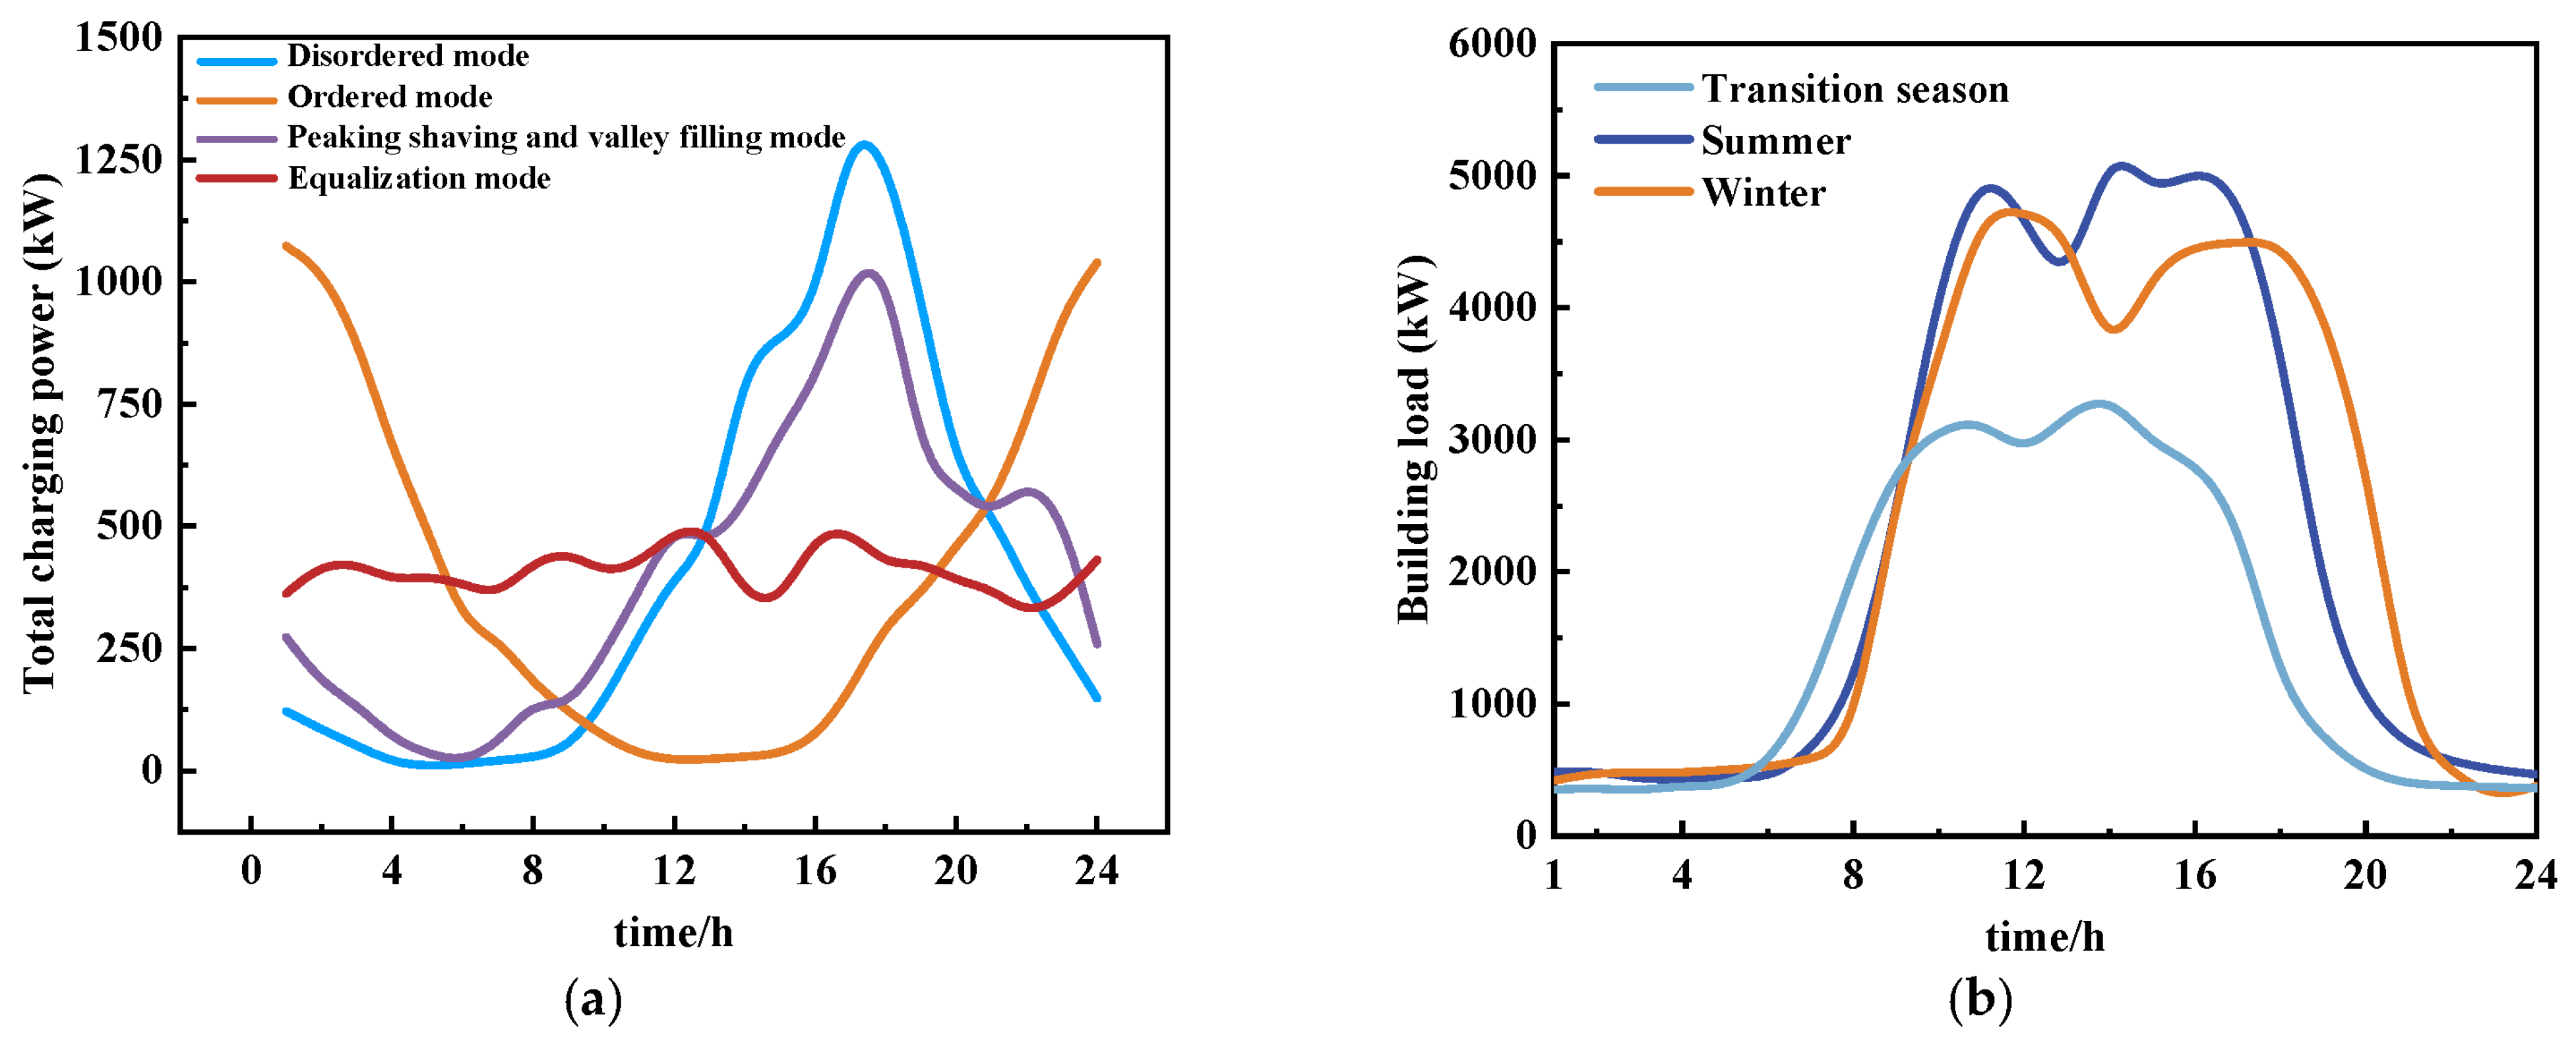
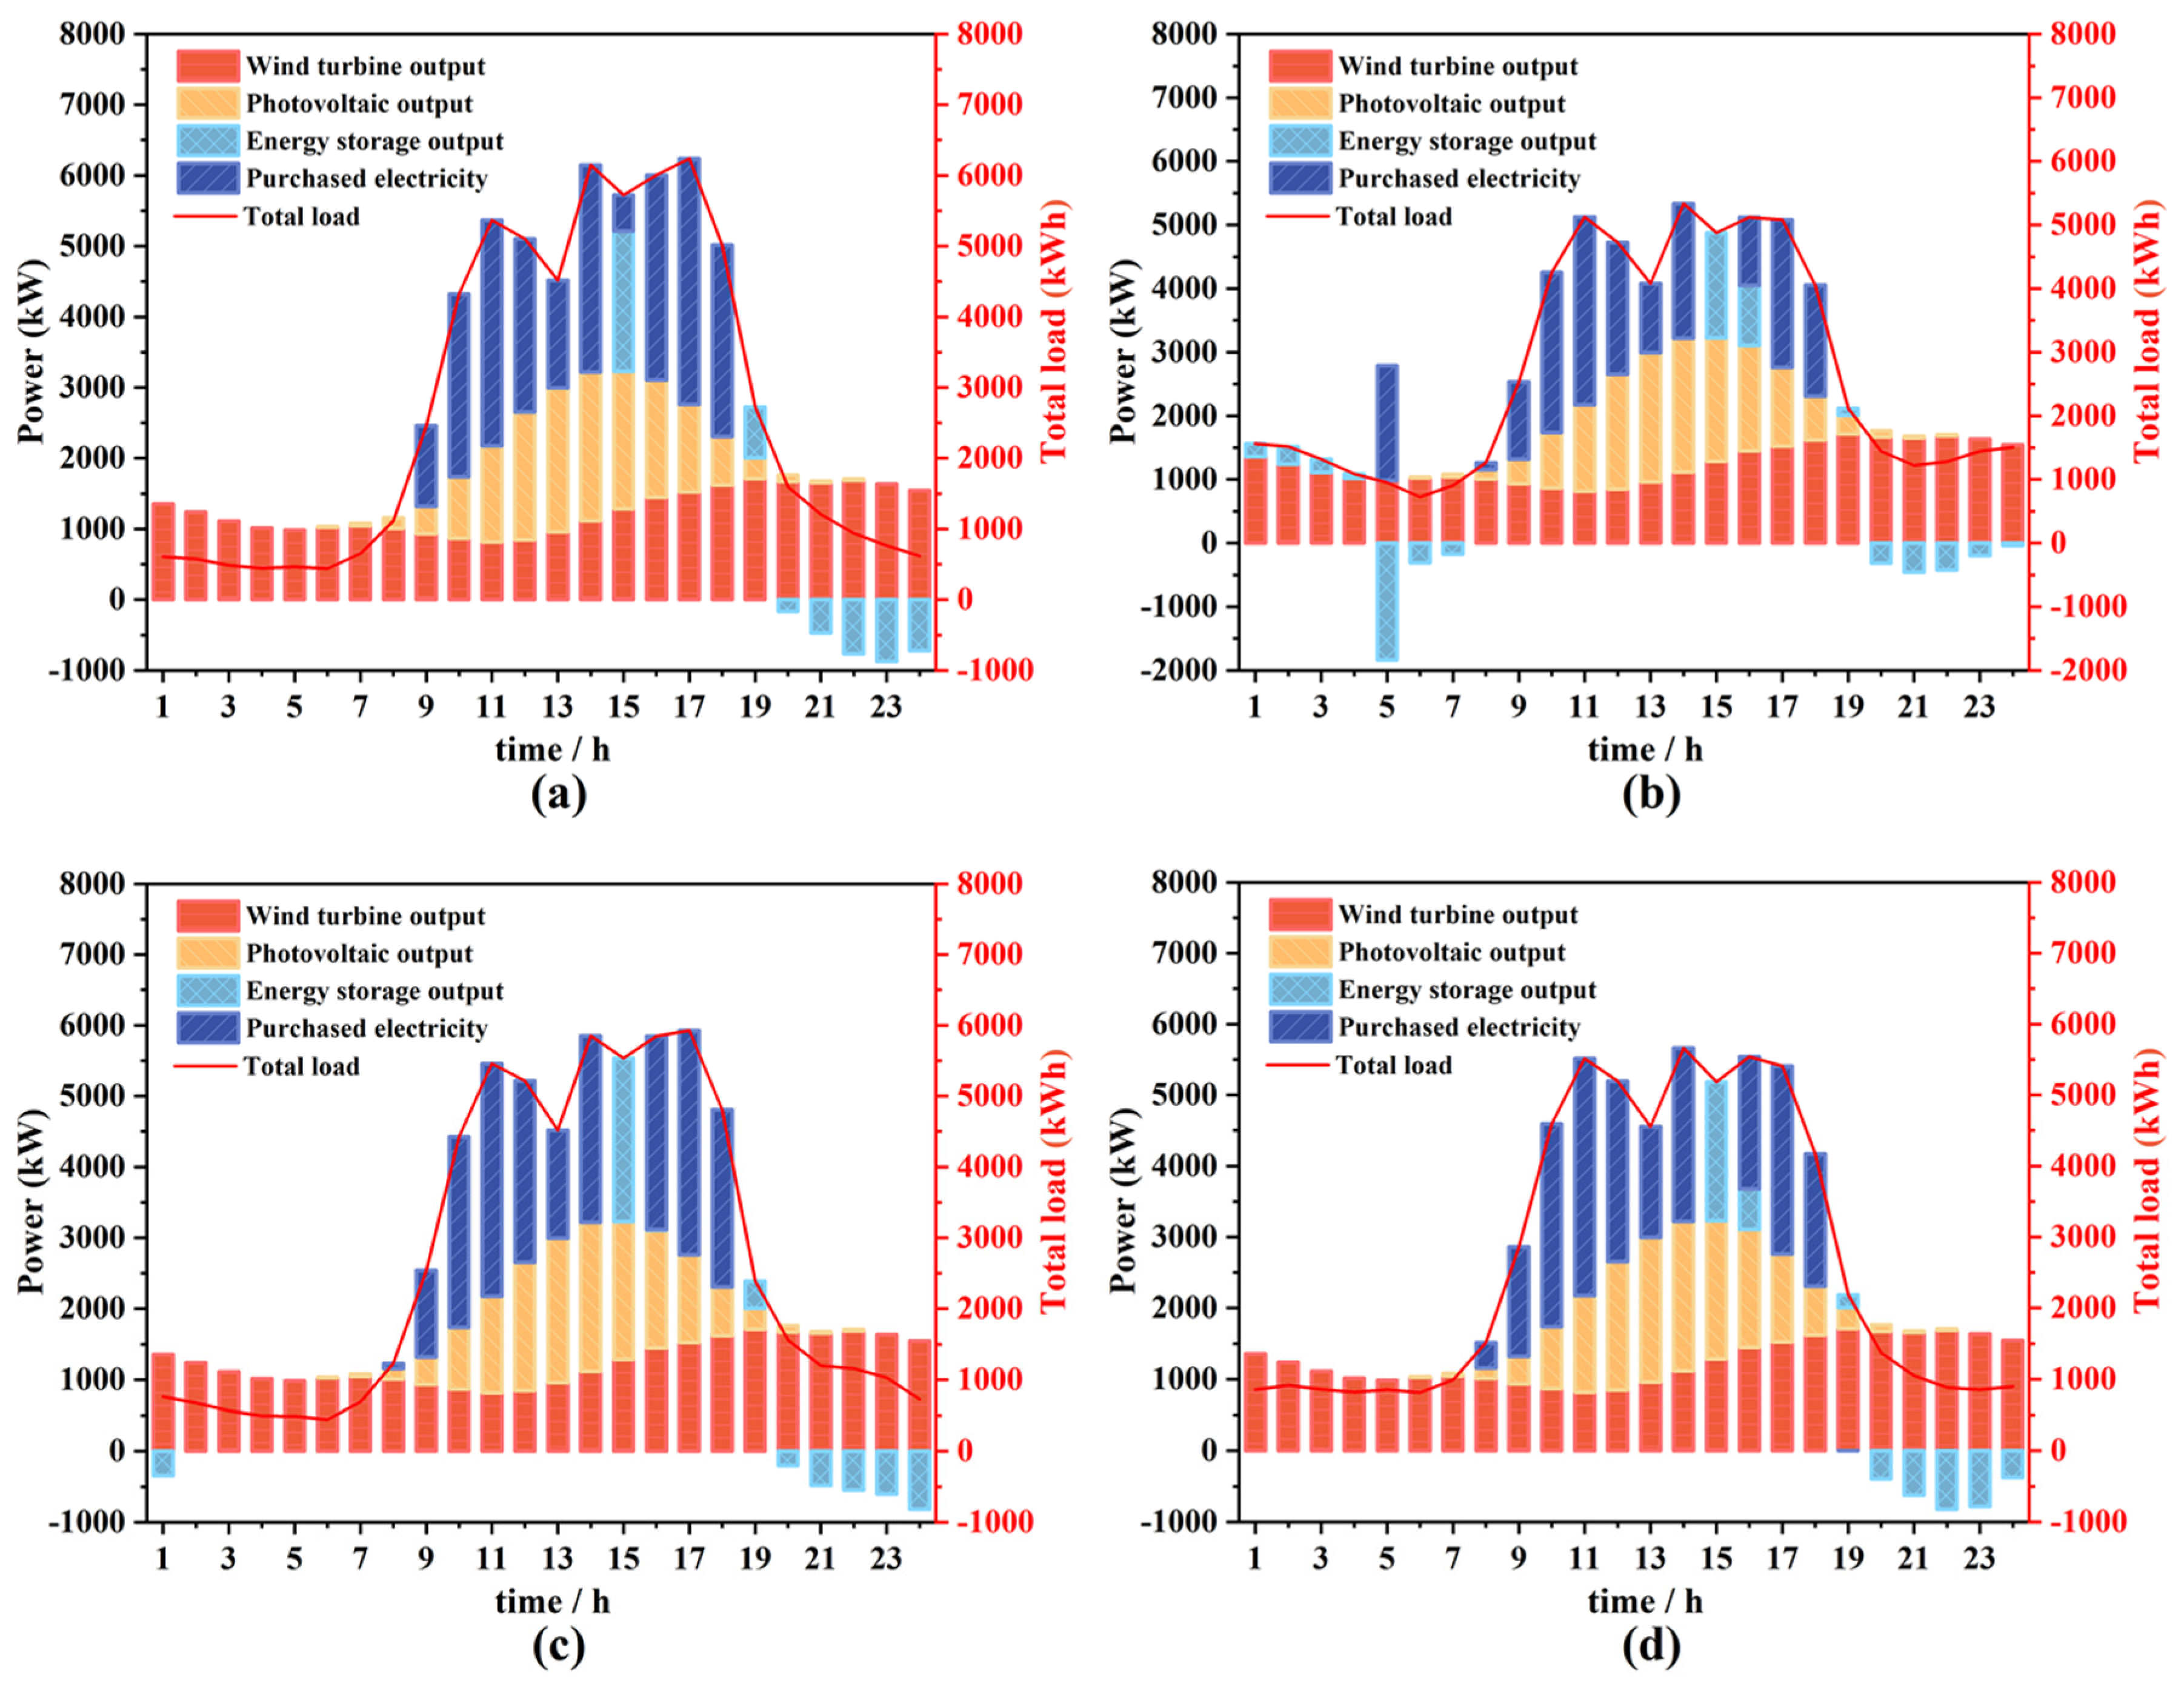
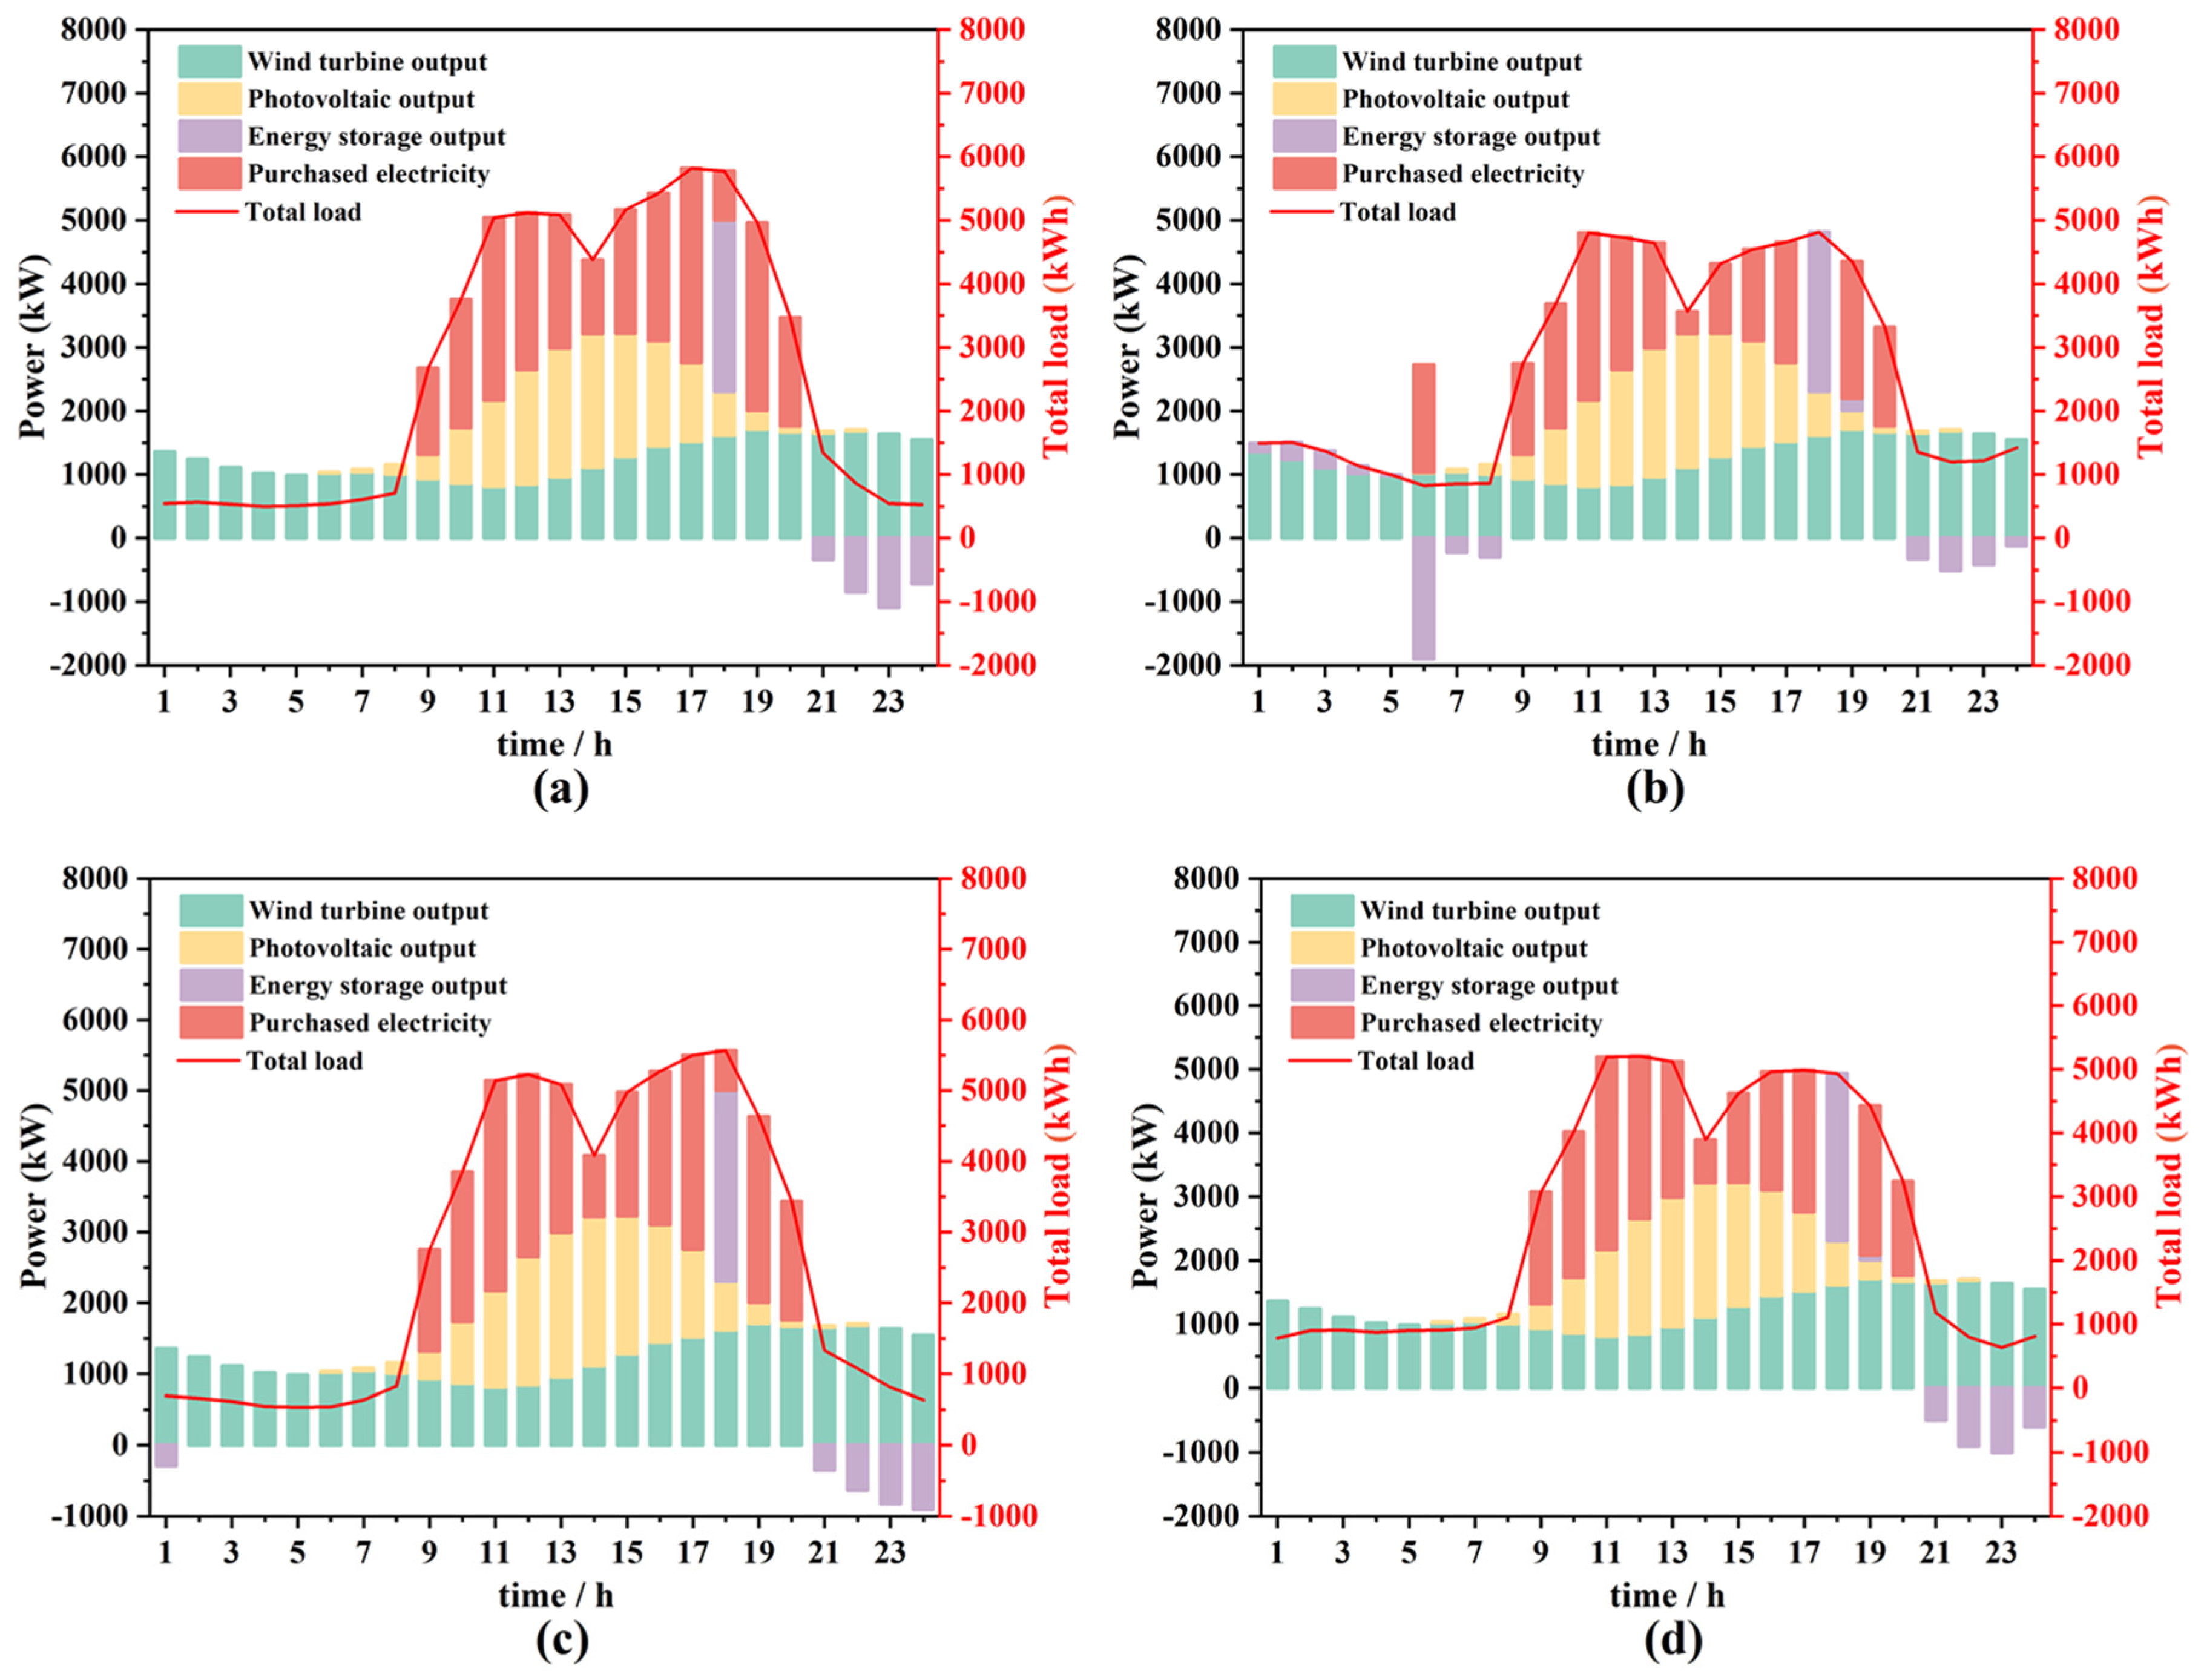
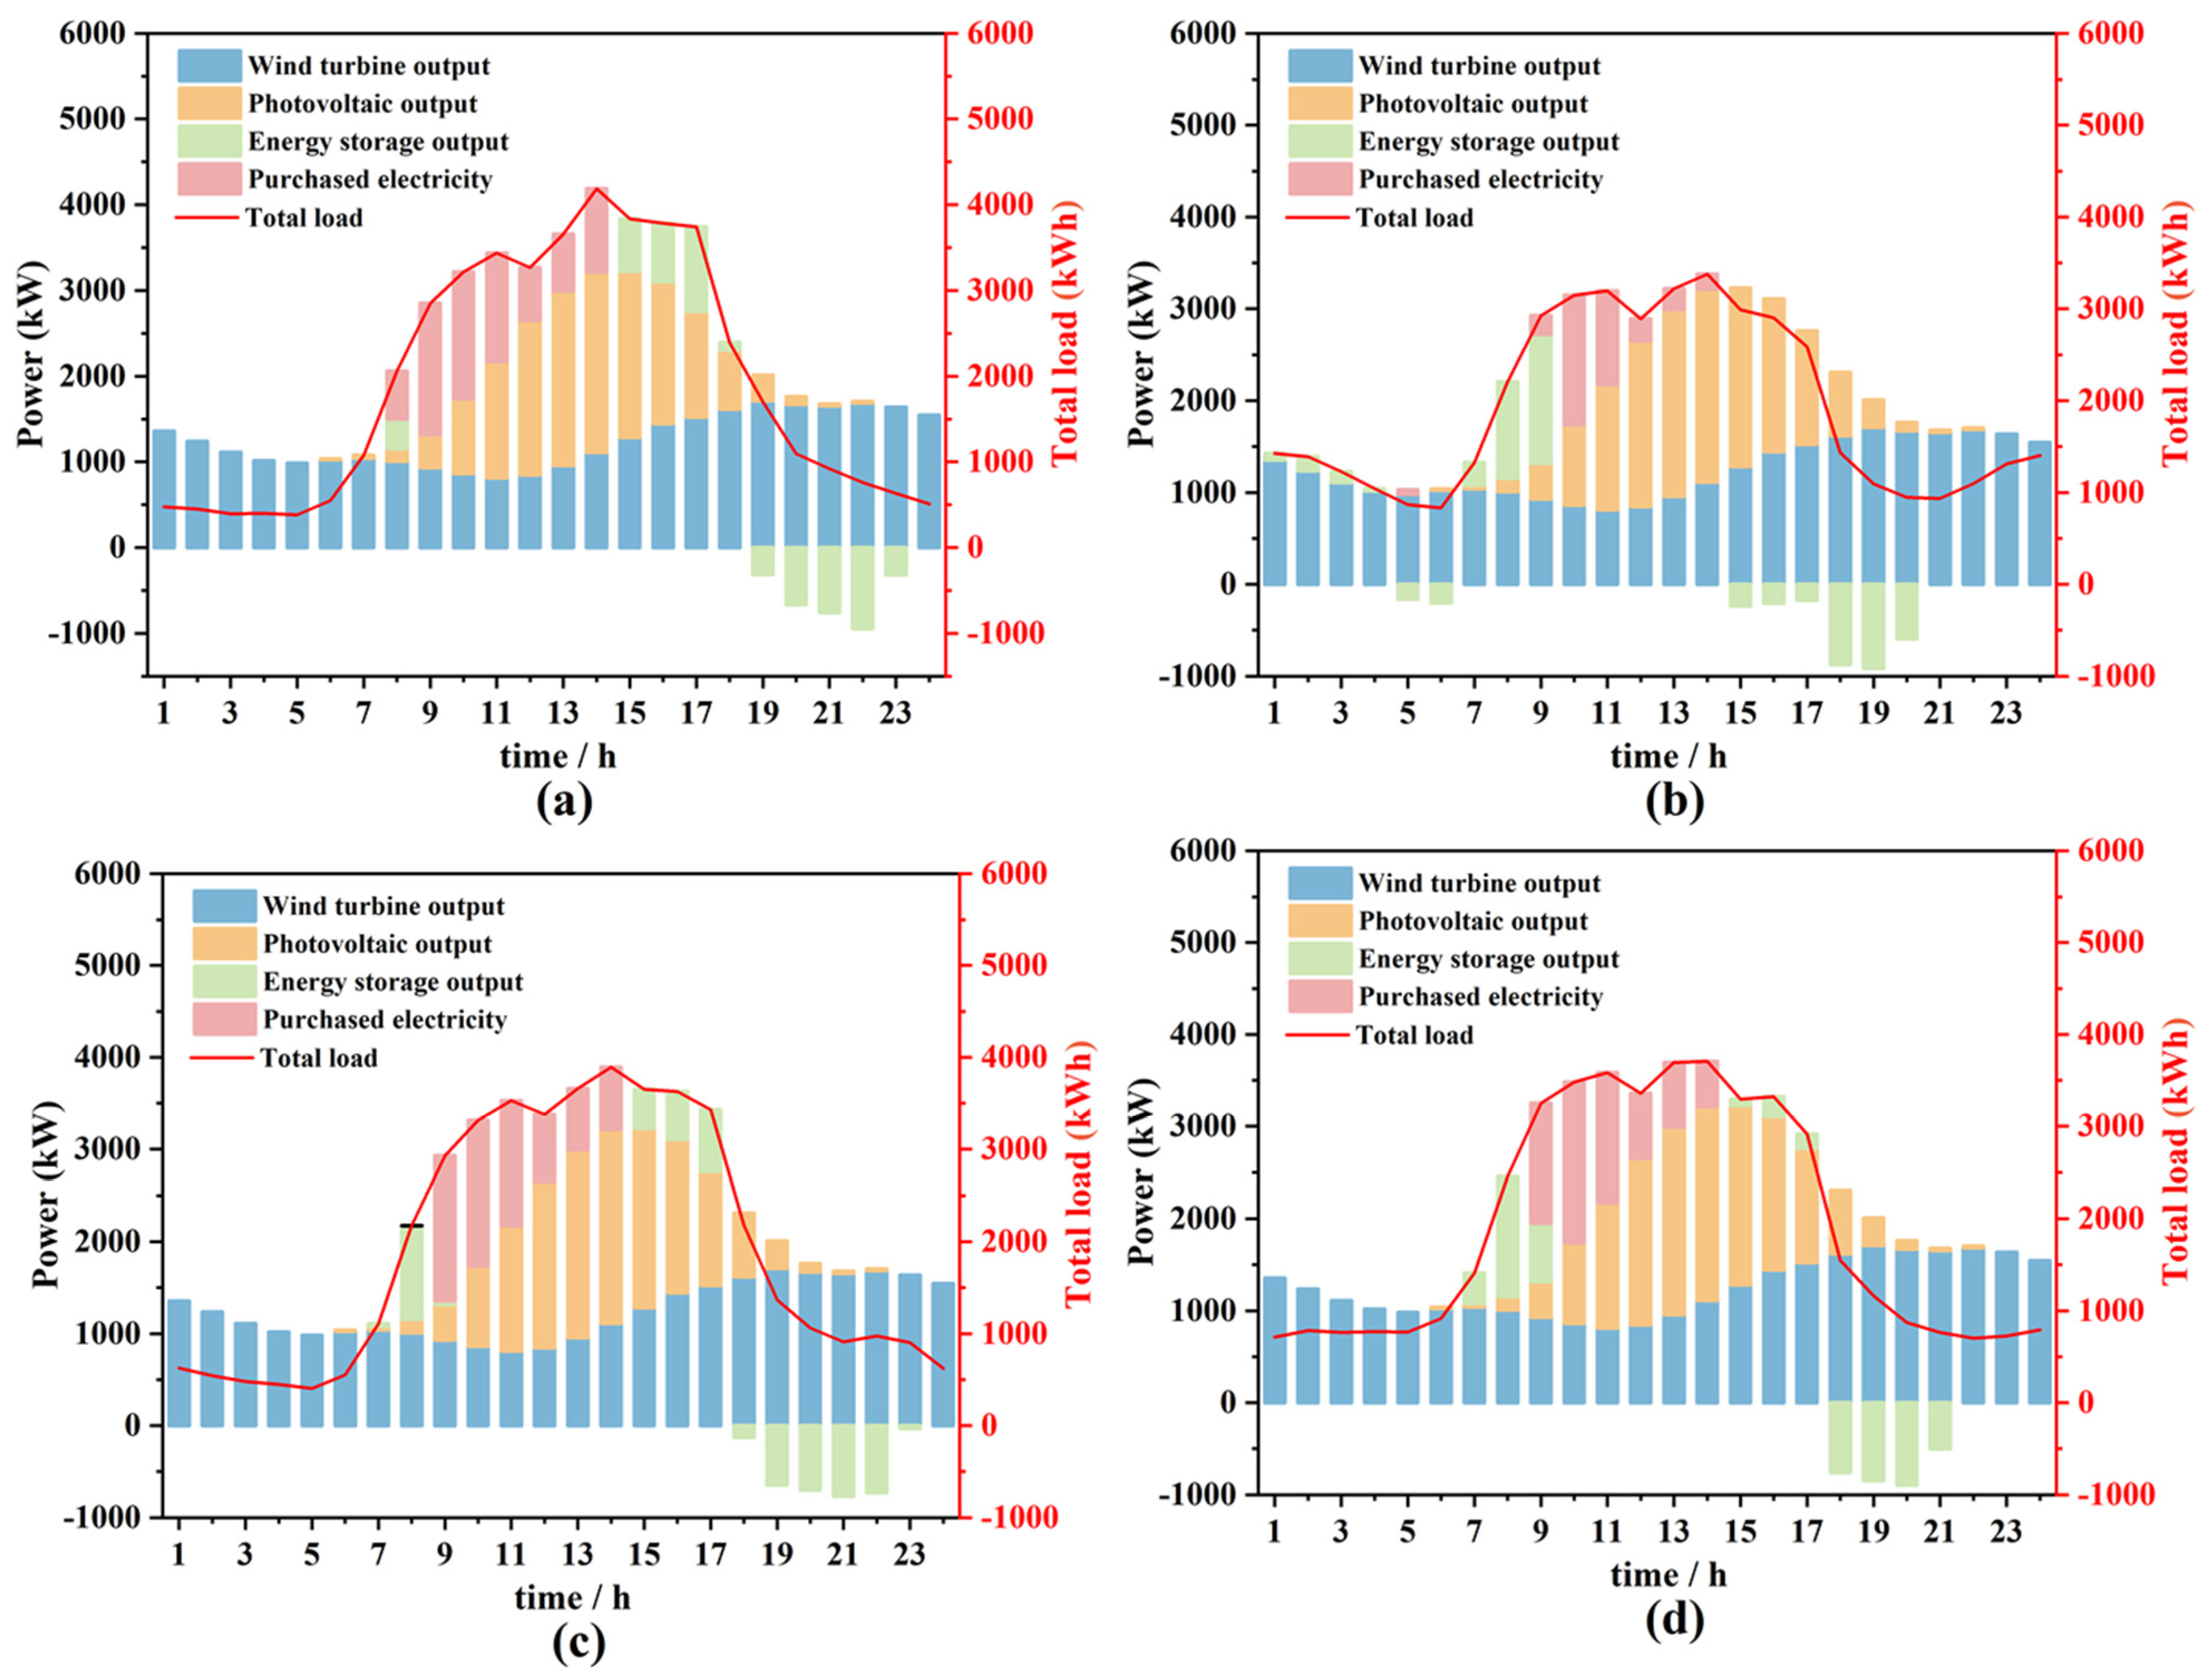
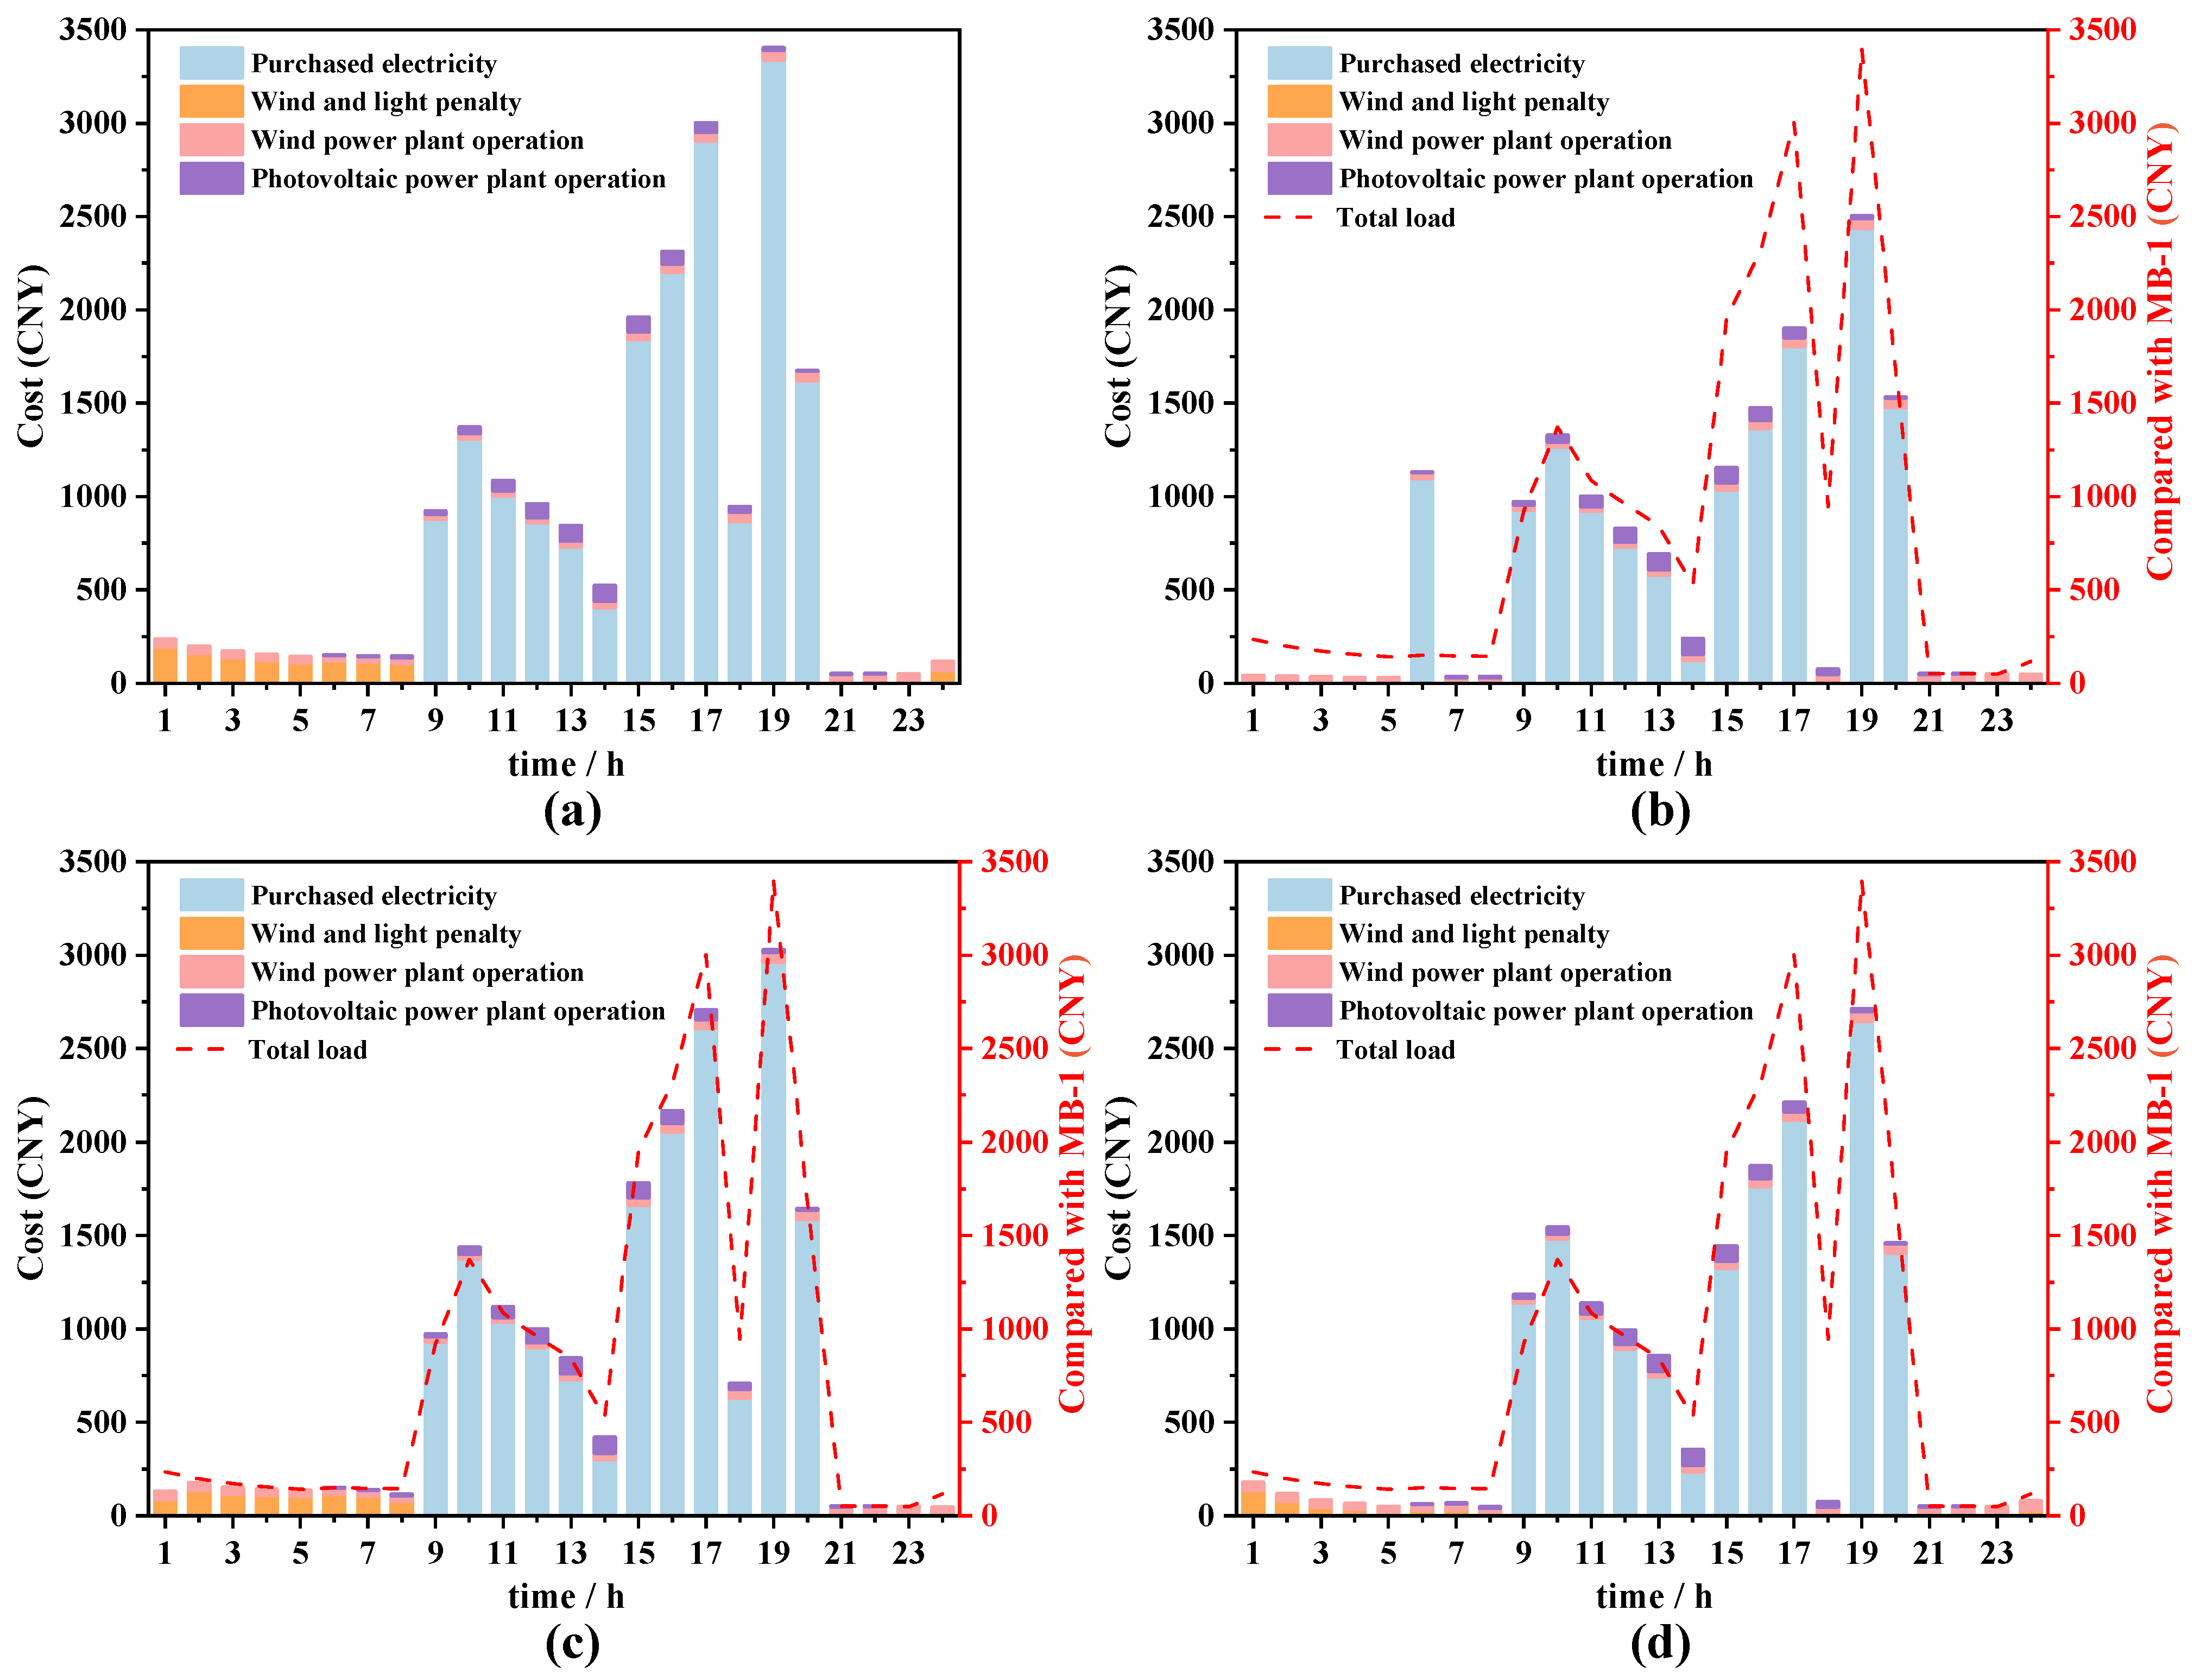
3.1. Operation Strategy Analysis

Figure 6 illustrates the dynamics of wind power generation, purchased power, energy storage, and total loads (including flexible EV charging and building load) under various charging modes on a typical summer’s day. In Figure 6a, when EVs are charged in disordered mode (MA-1), the total load curve exhibits significant fluctuations, with a pronounced peak. The alignment between the wind power generation and the total load is suboptimal, resulting in a 9.81% curtailment of wind and PV power generation. Additionally, the power purchased during peak hours is substantial, and the energy storage output displays numerous fluctuations throughout the day. Figure 6b shows a scenario where EVs are charged in ordered mode (MA-2). In this charging mode, the total load curve is relatively smooth, and the peak value is reduced compared to the disordered charging mode. This results in a more efficient utilization of wind power generation, with no occurrences of the curtailment of wind and PV power generation. Moreover, by optimizing valley power dispatch and energy storage, the peak power purchase demand decreases. This significantly leads to an 18.79% reduction in outsourced power during peak hours, compared to the disorganized charging scenario. In Figure 6c, when EVs are charged in peak-load shifting mode (MA-3), the overall purchased power decreases by 4.43% relative to MA-1 and the load fluctuations throughout the day become smaller. The alignment between wind power generation and total load is improved, thereby decreasing the curtailment of wind and PV power generation by 2.31% compared to the disordered setting. During this period, purchased power utilization is higher in daylight hours, while the energy storage output exhibits some fluctuations. Figure 6d outlines a scenario in which EVs charge in equalization mode (MA-4). Due to the inherent load for a building during daylight, the total load remains elevated and fluctuates frequently throughout the day. Consequently, both the wind power generation and purchased power must continuously meet this high demand. In this context, the curtailment of wind and PV power generation is reduced by 5.34% compared to the disordered charging scenario, whereas the purchased power decreases by 10.23%. However, the energy storage output remains high and fluctuates significantly. It indicates that the MA-2 demonstrates notable advantages in load regulation, the efficient utilization of renewable energy, the control of outsourced power, and the stability of the energy storage system.
Figure 7 illustrates the impacts of various EV charging strategies on wind power generation, purchased electricity, energy storage, and total load during typical winter days. In Figure 7a, when EVs are charged in disordered mode (MB-1), the total load experiences a sharp increase during day-time peak hours, leading to a heightened demand for purchased electricity. During this time, wind and PV outputs fluctuate naturally, exhibiting lower levels at night. Consequently, the energy storage systems charge overnight and discharge during the day to help maintain balance. In contrast, Figure 7b depicts the charging of the EVs in ordered mode (MB-2), which results in a smoother total load curve. This approach mitigates load growth during peak hours, reduces the demand for purchased power, and efficiently schedules wind power and electricity generation without any curtailment of wind and PV power generation. In Figure 7c, EV charging occurs in peak-load shifting mode (MB-3), focusing on a scenario in which EVs are predominantly charged during night-time off-peak periods. This strategy significantly reduces the total load and purchased power demand during the day, thereby allowing the energy storage system to store more electricity overnight and discharge it during the day to meet load requirements. Finally, in Figure 7d, EV charging occurs in equalization mode (MB-4), which maintains the total load at a high level, consequently increasing the demand for purchased electricity. Compared to the MB-1, the wind curve-up rate under MB-2, MB-3, and MB-4 is reduced by 100%, 23.93%, and 62.37%, respectively. Concurrently, these strategies achieve savings in purchased power of 19.34%, 4.63%, and 12.06%.
Figure 8 illustrates the scheduling outcomes across four distinct modes during the transition season. Due to the reduced heating and cooling requirements in the building during this period, the overall load on a typical day is lower compared to the other two seasonal scenarios, resulting in a decrease in purchased power and more frequent energy storage scheduling. Compared with the disordered mode (MC-1), the wind and PV generation of the ordered mode (c), peak-load shifting mode (MC-3), and equalization mode (MC-4) are reduced by 64.83%, 8.67%, and 12.44%. Correspondingly, the purchased power decreases by 53.31%, 7.13%, and 10.23%, respectively. Overall, this comparison indicates that, during typical transition season days, MC-2 demonstrates the lowest curtailment of wind and PV power generation and the least requirement for purchased power. To be conclusive, the analysis of various EV charging modes across typical summer, winter, and transition season days reveals significant differences in the utilization of wind power generation, power management, load regulation, and energy storage stability. The effective planning of EV charging strategies is essential for enhancing the utilization of wind power generation, reducing the demand for purchased electricity, optimizing the load curve, and stabilizing the energy storage system. Among the evaluated options, the orderly charging mode consistently exhibits superior comprehensive performance in most scenarios.

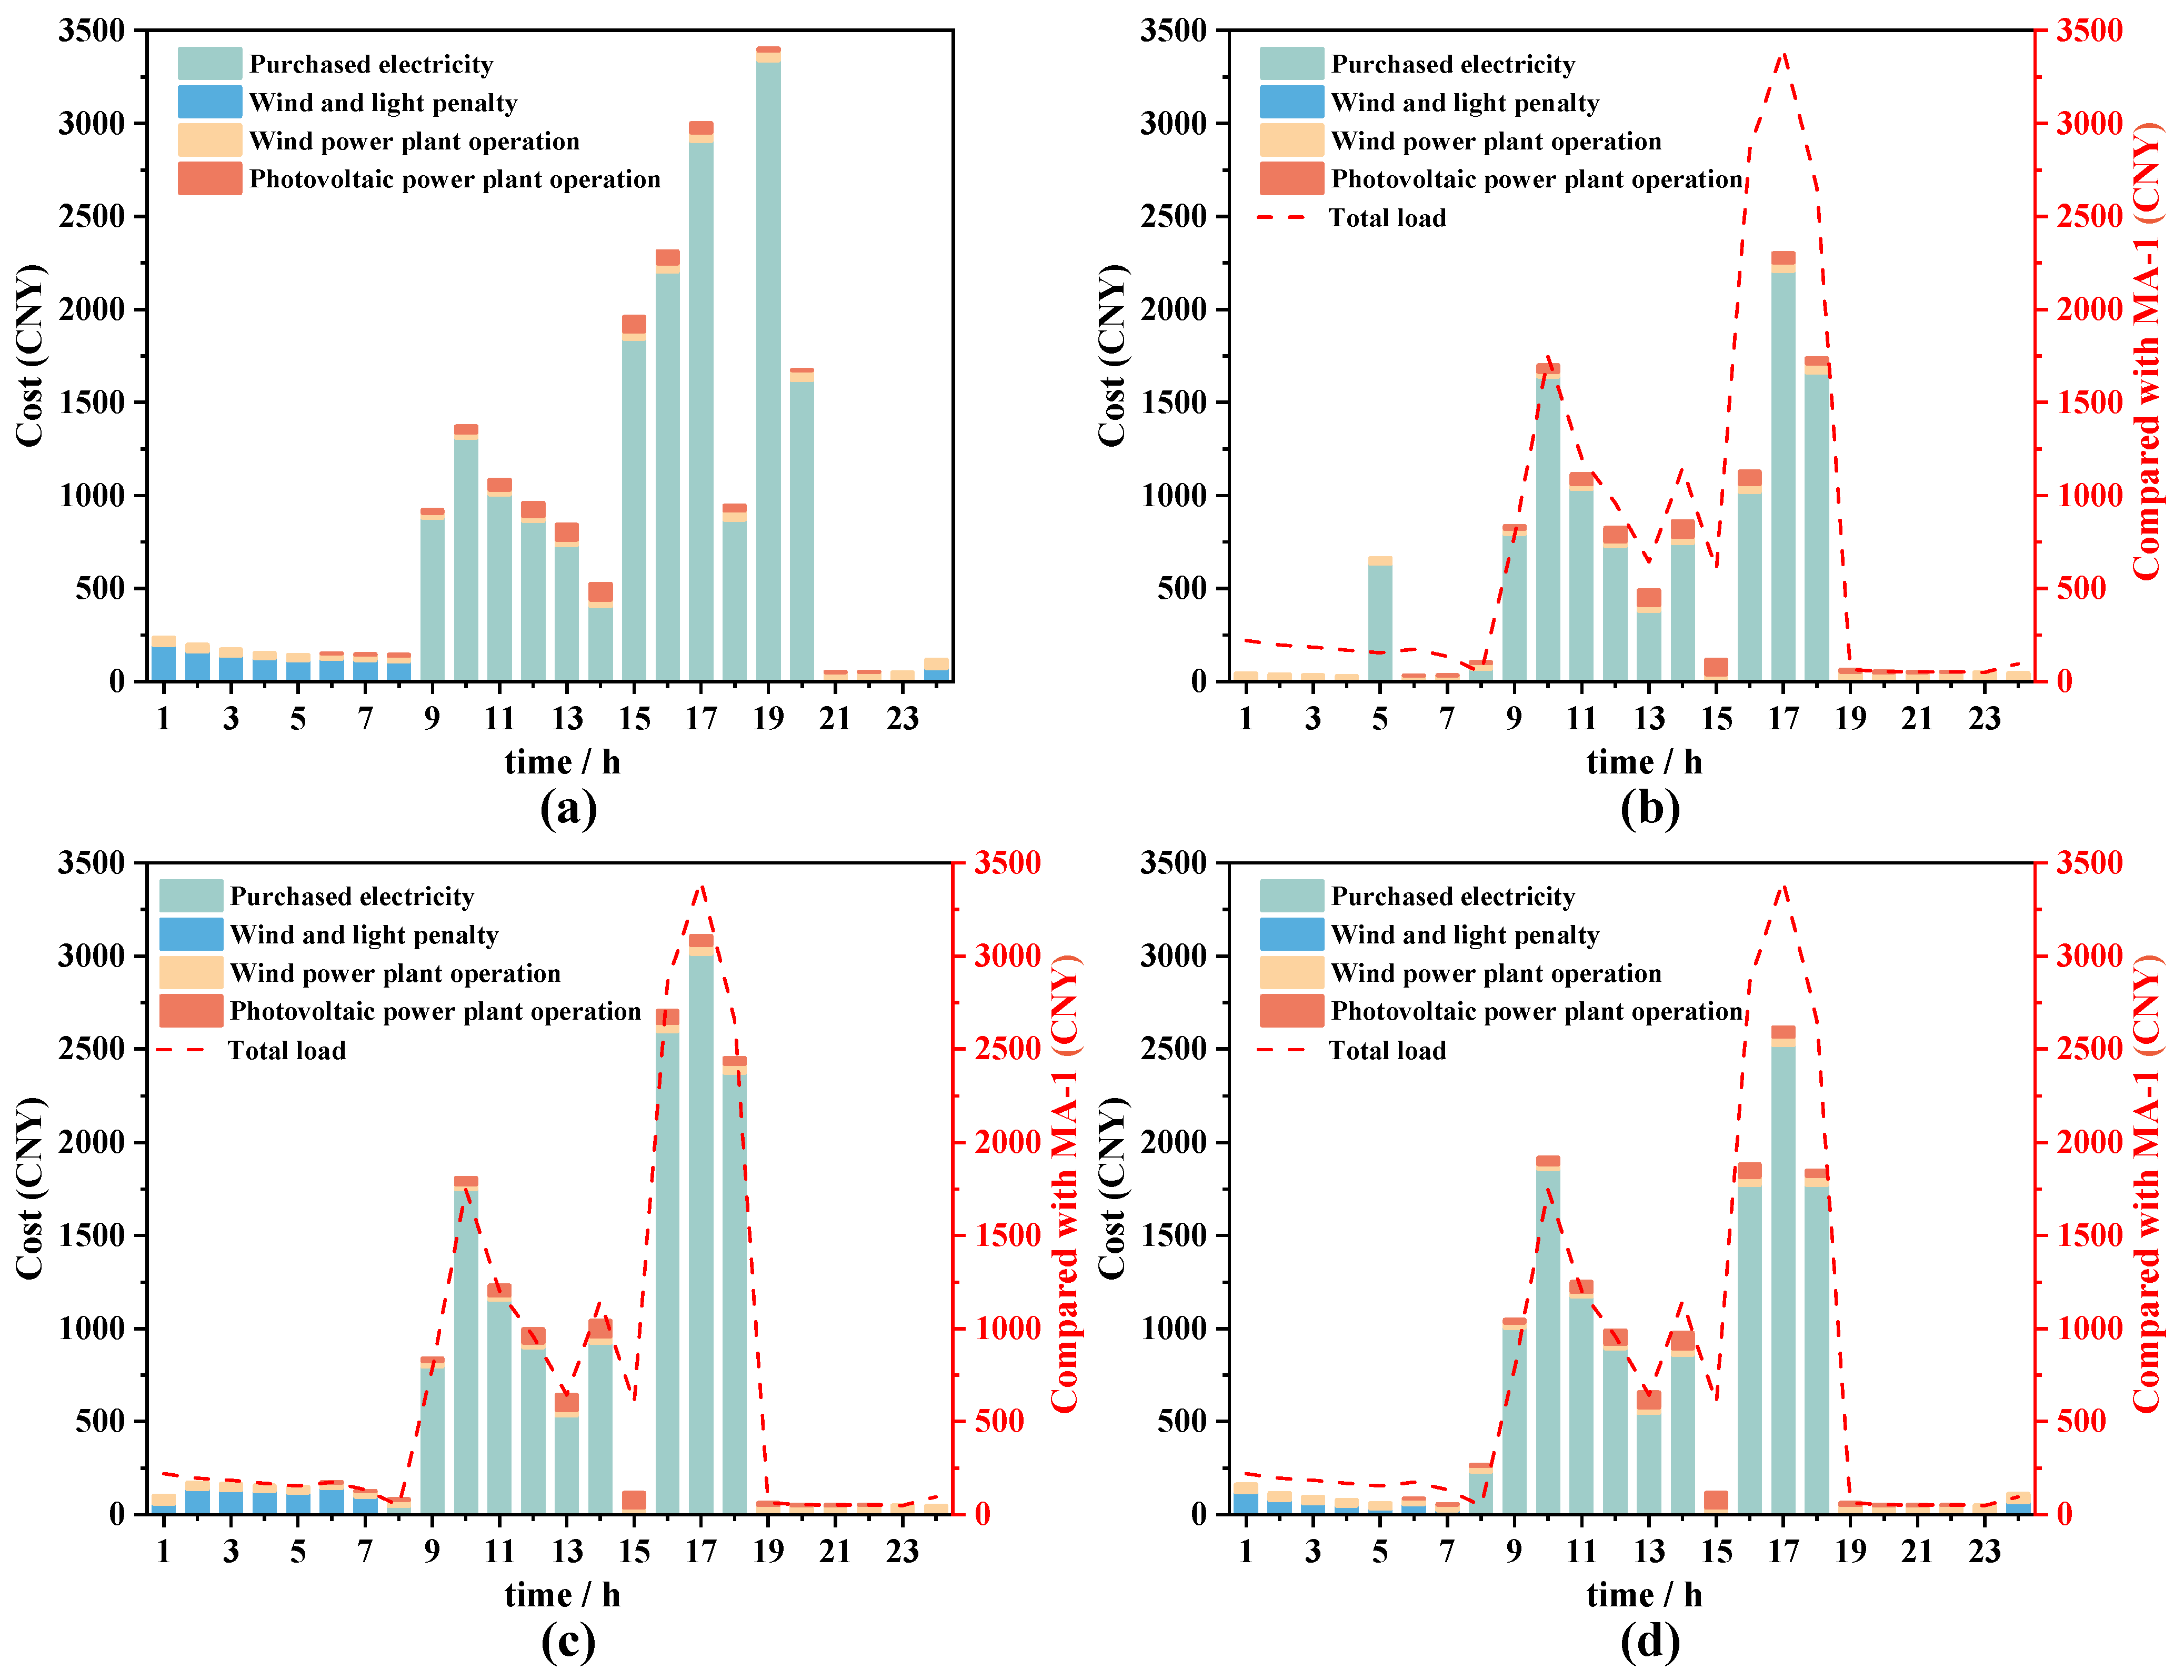
3.2. Economic Analysis

Figure 9 illustrates the accumulated costs associated with purchased electricity, operating wind and PV power plants, and wind and solar penalties under various charging modes on a typical summer day. These costs collectively represent the total load cost. Notably, the red dashed lines in Figure 9b–d depict the cost accumulation at different intervals within MA-1, facilitating a comparative analysis between the ordered and disordered patterns.
In Figure 9a, where EV charging is conducted in a disordered mode, there are notable variations in total load costs at different times throughout the day. The composition of different cost types relative to the total load cost fluctuates over the course of the day. During peak hours, the cost of purchased electricity constitutes a substantial portion of the total, with a prominent peak. The maximum cost for purchased electricity reaches CNY 3309.15, accounting for 97.21% of the total costs. This highlights that, during periods of peak demand, purchasing electricity is the predominant source of expenses. Conversely, the wind and PV penalty costs are relatively high during low-demand periods, with the highest proportion reaching 82.11%. This indicates that inadequate utilization of wind and solar energy occurs during low demand, causing unsatisfied consumption from wind and PV power plants, i.e., resulting in electricity waste. Moreover, operational costs for wind power plants are present continuously, whereas operational costs for PV plants are confined to day-time hours, typically between 7:00 and 19:00. In Figure 9b, when EV charging is performed in an orderly mode, the variation in total load costs at different times is significantly diminished. This finding suggests that MA-2 effectively balances the load and mitigates substantial cost fluctuations observed in MA-1. The costs associated with purchased electricity during peak hours demonstrate a marked reduction. Specifically, compared to MA-1, the total daily cost of purchased electricity in summer declines from CNY 15,089.97 to CNY 10,908.26, representing a decrease of 27.71%. Furthermore, the total wind and solar penalty costs consequently diminish from CNY 1055.48 in MA-1 to zero. This outcome indicates that wind and solar energy resources are more effectively absorbed and utilized within this mode, as the charging demands of EVs align with the generation periods of wind and solar power, thus eliminating instances of the curtailment of wind and PV power generation.
In Figure 9c, EV charging operates in peak-load shifting mode. Although the total load costs at different times remain similar to those observed in MA-1, the improvements are still evident. The primary objective of MA-3 is to balance peak and valley loads. While its effectiveness in minimizing cost fluctuations is not as pronounced as in MA-2, it does contribute to mitigating the impact of peak loads to some extent. During peak hours, the cost of purchased electricity continues to represent a significant proportion of the total costs, and instances of curtailment of wind and PV power generation occur during off-peak periods. In comparison to MA-1, the total purchased electricity cost in a single summer day decreases from CNY 15,089.97 to CNY 14,082.47, reflecting a reduction of 6.68%. Additionally, the wind and solar penalty costs decline from CNY 1055.48 to CNY 806.72 (a decrease of 48.06%). This suggests that while the mode has enhanced the utilization of wind and solar power (reducing instances of curtailment), it has not entirely eliminated the phenomenon. In Figure 9d, EV charging occurs in MA-4, which results in a significant reduction in total load costs at various time throughout the day. MA-4 can effectively balance the fluctuations in EV charging and power demand, contributing to overall cost reductions. When compared to the MA-1, the total purchased electricity cost in summer decreases by 16.32%, while the wind and solar penalty costs decrease by 42.75%.
A comprehensive evaluation of Figure 9 reveals that the total load cost associated with MA-2 is the lowest, with no wind and solar penalty costs. This mode demonstrates significant advantages in load regulation, utilization of wind and solar power, control of purchasing electricity, and stability of the energy storage system. The effectiveness of this charging mode in regulating the timing of EV charging helps to reduce peak hour electricity demand, decrease reliance on external power grids, and enhance overall system stability. Furthermore, it facilitates the full integration of wind and solar energy, thereby maximizing the utilization of renewable resources.
Figure 10 illustrates the accumulated costs associated with purchased electricity, operating wind and PV power plants, and wind and solar penalties under various charging modes on a typical winter’s day. These costs collectively comprise the total load cost. Notably, the red dashed lines in Figure 10b–d represent the cost accumulation over different times within MB-1.
In Figure 10a, EV charging occurs in MB-1, resulting in significant variations in total load costs at different times throughout the day. The fluctuations in load demand notably impact on cost changes, particularly during peak hours, where surging electricity demand causes a substantial increase in costs. Specifically, the purchased electricity cost in winter reaches CNY 117,982.77, which constitutes 87.21% of the total load cost. The wind and solar penalty costs amount to CNY 1145.31, accounting for 5.56% of the total load cost. This indicates that wind and solar power resources are not being fully utilized. In contrast, Figure 10b depicts EV charging in MB-2, which significantly reduces the differences in total load costs at various time. This mode effectively balances load demand and enables the decrease in purchasing electricity requirements during peak hours. Furthermore, the charging demand for EVs aligns with the generation periods of wind and solar energy. It is therefore providing control in eliminating instances of the curtailment of wind and PV power generation.
In Figure 10c, EV charging operates in MB-3. The total load costs at various time are like those observed in MB-1, although optimization has been achieved in partial operations. The cost of purchased electricity during peak hours continues to constitute a significant proportion of total costs. This mode has enhanced the utilization of wind and solar power and has reduced instances of the curtailment of wind and PV power generation. While this mode improves the efficiency of power resource utilization, its optimization effect is less pronounced than that of MB-2. In Figure 10d, EV charging takes place in MB-4, resulting in a substantial reduction in total load costs over different time periods. This mode effectively balances fluctuations in EV charging and power demand, thereby lowering overall costs. A comparative analysis of Figure 10 indicates that, relative to MB-1, MB-2, MB-3, and MB-4 modes have reduced the total purchased electricity costs in winter by 23.41%, 6.59%, and 17.56%, respectively. Furthermore, the wind and solar penalty costs have decreased by 100%, 23.93%, and 62.37% for the same modes, respectively.
Figure 11 presents the accumulated costs associated with four main contributors including the cost of purchased electricity, the cost of operating wind and PV power plants, and the cost of wind and solar penalties. The predicted costs are obtained under various charging modes on a typical day during the transition season. Notably, the red dashed lines in Figure 11b–d indicate the cost accumulation at different times in MC-1. Unlike the summer (Figure 9) and winter (Figure 10), the transition season typically experiences moderate temperatures and a reduced demand for heating and cooling, leading to relatively minor fluctuations in the overall electricity load. Consequently, this results in a relatively flat daily load curve and minimal differences between peak and valley values. Additionally, transition monsoon conditions and PV power generation are favorable, contributing to a low overall electricity demand. The total load cost during this season has decreased from the range of CNY 12,300–21,000 observed in summer and winter to a value between CNY 3600 and 6400. When compared to MC-1, the total purchased electricity costs during the transition season under MC-2, MC-3, and MC-4 decreases by 53.76%, 8.48%, and 11.55%, respectively. Furthermore, the costs associated with wind and solar penalties decreases by 64.83%, 8.67%, and 12.44%, respectively. Among these modes, MC-2 exhibits the most significant reductions in both purchased electricity costs and wind and solar penalty costs. Under this mode, the demand for electricity purchased from the grid during peak hours is substantially diminished, which demonstrates an advantage in enhancing the utilization of renewable energy resources.

3.3. Comprehensive Comparison

To facilitate a comprehensive comparison of load costs across four distinct charging modes on three representative days, the total load costs for twelve cases are presented collectively in Figure 12. This figure clearly illustrates that during the transition season (MC), the total load costs across all modes are lower than the corresponding costs in summer (MA) and winter (MB) due to favorable temperatures and decreased electricity demand. However, it is noteworthy that the wind and solar penalty costs remain relatively high. Across all seasons, the ordered modes (MA-2, MB-2, and MC-2) demonstrate the most pronounced advantages, reflecting significant reductions in both purchasing costs and wind and solar penalty costs. Notably, both MA-2 and MB-2 do not exhibit instances of the curtailment of wind and PV power generation. This indicates substantial improvement in the economic efficiency of the system and the consumption rate of renewable energy.
Among the four charging modes evaluated during typical summer days (MA-1 to MA-4), MA-1 has the highest total load cost. In contrast, MA-2, MA-3, and MA-4 achieve reductions in total load costs of 29.69%, 7.12%, and 17.23%, respectively, compared to MA-1. Similarly, for the four modes assessed on typical winter days (MB-1 to MB-4), MB-1 also has the highest total load cost. Conversely, MB-2, MB-3, and MB-4 decreased total load costs by 25.96%, 7.08%, and 18.78%, respectively, relative to MB-1. In the context of typical days during the transition season (MC-1 to MC-4), MC-1 again presents the highest total load cost, whereas MC-2, MC-3, and MC-4 achieve reductions of 43.71%, 6.56%, and 9.07%, respectively, when compared to MC-1.
Based on the above discussion, seasonal variations significantly influence electricity demand, thereby affecting the load configuration and cost structure of the energy system. Consequently, developing a well-considered charging strategy for EVs is essential for effective grid load management. Such strategies play a vital role in enhancing renewable energy utilization, minimizing electricity purchase costs, optimizing grid stability, and advancing environmental sustainability. This approach will provide valuable support for the planning of future energy system transformations.

4. Conclusions

This paper presents a day-ahead scheduling model that integrates the TUA optimization algorithm and incorporates the charging flexibility of EVs, enabling an analysis of the operational strategy for the integrated energy system. The principal conclusions are as follows:
(1)
On typical days across different seasons, the orderly charging mode for EVs significantly enhances the utilization of wind power generation and mitigates instances of the curtailment of wind and PV power generation. Under such a charging mode, the demand for purchased electricity is effectively reduced and simultaneously the operational stability of the energy storage system is improved.
(2)
In the ordered mode, the wind and solar penalty rate is zero on typical winter and summer days, whereas it decreases by 64.83% during the transition season. Concurrently, the purchased electricity decreases by 18.79%, 19.34%, and 53.31%, respectively, across the assessed seasons. The total load costs of the ordered mode during the summer, winter, and transition seasons declines by 29.69%, 25.96%, and 43.71%, respectively.
(3)
During summer and winter, high demand for cooling and heating leads to increased electricity consumption, resulting in elevated purchasing costs and significant occurrences of the curtailment of wind and PV power generation. The ordered mode effectively reduces both the purchased electricity costs and the wind and solar penalty costs by optimizing the charging time. Although the transition season features moderate temperatures and lower electricity demand, the orderly mode continues to demonstrate optimal performance.
(4)
Seasonal variations induce changes in electricity demand, which in turn alters the load configuration and consumption costs within the system. As a result, well-planned EV charging strategies are crucial for the effective management of grid load, the utilization of renewable energy, and the costs of purchased electricity. The proposed strategy can provide essential support for the planning of future energy system transformations.
This paper presents the influence of electric vehicle charging flexibility on energy savings and the economics of integrated energy systems in an industrial park in different seasons. In subsequent studies, we will discuss the adaptability of TUA to larger or more heterogeneous urban systems, including multi-node grids and hybrid electric vehicle penetration, as well as more climate condition studies to provide data support for model expansion and application.

Author Contributions

Conceptualization, G.L., J.Z. and Z.L.; methodology, G.L., C.W. and J.Z.; software, G.L., C.W. and J.Z.; validation, C.W., J.Z., Z.L., Z.Z. and S.B.; formal analysis, Z.L.; investigation, G.L., C.W., Z.Z. and J.C.; resources, X.Y.; data curation, X.G.; writing—original draft preparation, G.L.; writing—review and editing, S.B., X.G. and X.Y.; visualization, J.C; supervision, X.Y.; project administration, X.Y.; funding acquisition, X.Y. All authors have read and agreed to the published version of the manuscript.

Funding

This research was supported by Research and Application of Flexible Load Aggregation Mining and Flexible Control Technology for Electric Vehicles Based on Swarm Intelligence (520608240005).

Data Availability Statement

Dataset available on request from the authors.

Conflicts of Interest

Authors Guocheng Li, Cong Wang, Jian Zheng, Zeguang Lu, Zhongmei Zhao, Jinglan Cui, and Shaocong Bi were employed by the State Grid Shandong Electric Power Company Dezhou Power Supply Branch. The remaining authors declare that the research was conducted in the absence of any commercial or financial relationships that could be construed as a potential conflict of interest.

References

  1. Cerón, J.A.; Gómez-Luna, E.; Vasquez, J.C. Driving the Energy Transition in Colombia for Off-Grid Regions: Microgrids and Non-Conventional Renewable Energy Sources. Energies 2025, 18, 1010. [Google Scholar] [CrossRef]
  2. Cobos-Torres, J.-C.; Idrovo-Ortiz, L.-H.; Cobos-Mora, S.L.; Santillan, V. Renewable Energies and Biochar: A Green Alternative for Reducing Carbon Footprints Using Tree Species from the Southern Andean Region of Ecuador. Energies 2025, 18, 1027. [Google Scholar] [CrossRef]
  3. Moreno-Pacheco, L.A.; Sánchez-Hueto, L.J.L.; Barbosa-Saldaña, J.G.; Martínez-Trinidad, J.; Toledo-Velázquez, M.; García-León, R.A. Assessment of Wind Energy Potential Generated by Vehicles: A Case Study in Mexico. Designs 2024, 8, 126. [Google Scholar] [CrossRef]
  4. Tahir, M.F.; Haoyong, C.; Guangze, H. A comprehensive review of 4E analysis of thermal power plants, intermittent renewable energy and integrated energy systems. Energy Rep. 2021, 7, 3517–3534. [Google Scholar]
  5. Tang, C.; Liu, X.; Zhang, C. Does ChinA’s green power trading policy play a role?—Evidence from renewable energy generation enterprises. J. Environ. Manag. 2023, 345, 118775. [Google Scholar]
  6. Adib, M.; Nasiri, F.; Haghighat, F. Integrating wind energy and compressed air energy storage for remote communities: A bi-level programming approach. J. Energy Storage 2023, 72, 108496. [Google Scholar]
  7. Liu, B.; Lai, M.; Wang, Y.; Wang, Y.; Chen, J.; Song, C. Assessment of green hydrogen production by volatile renewable energy under different SSPs scenarios in China. Renew. Energy 2024, 235, 121296. [Google Scholar]
  8. Liu, X.; Wu, Y.; Li, H.; Zhou, H. Design and development of pilot plant applied to wind and light abandonment power conversion: Electromagnetic heating of solid particles and steam generator. J. Clean. Prod. 2024, 470, 143313. [Google Scholar]
  9. Sharma, P.K.; Kumar, D.A.; William, P.; Obulesu, D.; Pandian, P.M.; Khan, T.K.H.; Manikandan, G. Energy storage system based on hybrid wind and photovoltaic technologies. Meas. Sens. 2023, 30, 100915. [Google Scholar]
  10. Wu, Z.; Wang, C.; Wolfram, P.; Zhang, Y.; Sun, X.; Hertwich, E. Assessing electric vehicle policy with region-specific carbon footprints. Appl. Energy 2019, 256, 113923. [Google Scholar]
  11. Ma, Z.; Wang, R.; Pu, D.; Yuan, G. Coordinated optimization scheme for active distribution networks considering electric vehicle charging and discharging optimization under combined heat and power generation. J. Energy Storage 2024, 101, 113699. [Google Scholar] [CrossRef]
  12. Sarda, J.; Patel, N.; Patel, H.; Vaghela, R.; Brahma, B.; Bhoi, A.K.; Barsocchi, P. A review of the electric vehicle charging technology, impact on grid integration, policy consequences, challenges and future trends. Energy Rep. 2024, 12, 5671–5692. [Google Scholar] [CrossRef]
  13. Ahmad, A.; Khan, J.Y. Real-Time Load Scheduling and Storage Management for Solar Powered Network Connected EVs. IEEE Trans. Sustain. Energy 2020, 11, 1220–1235. [Google Scholar] [CrossRef]
  14. Lu, X.X.; Li, K.P.; Xu, H.C.; Wang, F.; Zhou, Z.Y.; Zhang, Y.G. Fundamentals and business model for resource aggregator of demand response in electricity markets. Energy 2020, 204, 117885. [Google Scholar] [CrossRef]
  15. Jian, L.; Zheng, Y.; Shao, Z. High efficient valley-filling strategy for centralized coordinated charging of large-scale electric vehicles. Appl. Energy 2017, 186, 46–55. [Google Scholar] [CrossRef]
  16. Han, X.; Wei, Z.; Hong, Z.; Zhao, S. Ordered charge control considering the uncertainty of charging load of electric vehicles based on Markov chain. Renew. Energy 2020, 161, 419–434. [Google Scholar] [CrossRef]
  17. Alghamdi, T.G.; Said, D.; Mouftah, H.T. Decentralized Electric Vehicle Supply Stations (D-EVSSs): A Realistic Scenario for Smart Cities. IEEE Access 2019, 7, 63016–63026. [Google Scholar] [CrossRef]
  18. Sekhar, R.; Shah, P.; Panchal, S.; Fowler, M.; Fraser, R. Distance to empty soft sensor for ford escape electric vehicle. Results Control Optim. 2022, 9, 100168. [Google Scholar] [CrossRef]
  19. Qian, K.J.; Zhou, C.K.; Allan, M.; Yuan, Y. Modeling of Load Demand Due to EV Battery Charging in Distribution Systems. IEEE Trans. Power Syst. 2011, 26, 802–810. [Google Scholar] [CrossRef]
  20. Hu, Z.; Zhan, K.; Zhang, H.; Song, Y. Pricing mechanisms design for guiding electric vehicle charging to fill load valley. Appl. Energy 2016, 178, 155–163. [Google Scholar] [CrossRef]
  21. Su, W.; Chow, M.-Y. Computational intelligence-based energy management for a large-scale PHEV/PEV enabled municipal parking deck. Appl. Energy 2012, 96, 171–182. [Google Scholar]
  22. Torre, S.d.l.; Aguado, J.; Sauma, E.; Lozano-Martos, A. Optimal routing for electric vehicle macro-groups in urban areas: Application to the city of Santiago, Chile. Energy 2024, 313, 133996. [Google Scholar]
  23. Tao, Y.; Huang, M.; Chen, Y.; Yang, L. Orderly charging strategy of battery electric vehicle driven by real-world driving data. Energy 2020, 193, 116806. [Google Scholar]
  24. Ahmad, F.; Iqbal, A.; Ashraf, I.; Marzband, M.; Khan, I. Optimal location of electric vehicle charging station and its impact on distribution network: A review. Energy Rep. 2022, 8, 2314–2333. [Google Scholar]
  25. Liu, Z.; Qin, Z. Real-time coordination for grid-friendly community-level electric vehicle charging based on discrete state by enhanced hysteresis model incorporating electricity price. Electr. Power Syst. Res. 2023, 220, 109269. [Google Scholar]
  26. Xu, Z.; Hu, Z.; Song, Y.; Zhao, W.; Zhang, Y. Coordination of PEVs charging across multiple aggregators. Appl. Energy 2014, 136, 582–589. [Google Scholar]
  27. Wu, D.; Radhakrishnan, N.; Huang, S. A hierarchical charging control of plug-in electric vehicles with simple flexibility model. Appl. Energy 2019, 253, 113490. [Google Scholar]
  28. Cai, S.; Matsuhashi, R. Optimal dispatching control of EV aggregators for load frequency control with high efficiency of EV utilization. Appl. Energy 2022, 319, 119233. [Google Scholar]
  29. Al-Dahabreh, N.; Sayed, M.A.; Sarieddine, K.; Elhattab, M.; Khabbaz, M.J.; Atallah, R.F.; Assi, C. A Data-Driven Framework for Improving Public EV Charging Infrastructure: Modeling and Forecasting. IEEE Trans. Intell. Transp. Syst. 2024, 25, 5935–5948. [Google Scholar] [CrossRef]
  30. Zhang, H.; Hu, Z.; Xu, Z.; Song, Y. Optimal Planning of PEV Charging Station With Single Output Multiple Cables Charging Spots. IEEE Trans. Smart Grid 2017, 8, 2119–2128. [Google Scholar] [CrossRef]
  31. Qiao, S. Research on Multi Source Collaborative Operation Optimization of Active Distribution Network. Master’s Thesis, Shandong University, Jinan, China, 2021. [Google Scholar]
  32. Luo, C.; Tu, L.; Cai, H.; Gu, H.; Chen, J.; Wang, P. Energy Scheduling of Wind-Solar Integrated Hydrogen Production System Based on Wind Solar Power Prediction. In Proceedings of the 2024 China International Conference on Electricity Distribution (CICED), Hangzhou, China, 12–13 September 2024; pp. 729–734. [Google Scholar]
  33. Ju, L.; Tan, Z.; Yuan, J.; Tan, Q.; Li, H.; Dong, F. A bi-level stochastic scheduling optimization model for a virtual power plant connected to a wind–photovoltaic–energy storage system considering the uncertainty and demand response. Appl. Energy 2016, 171, 184–199. [Google Scholar]
  34. Ma, R.; Hao, X.; Jin, F.; Li, J.; Du, T. An Optimal Dispatching Model for Day-ahead Operation Considering Coupling of Wind and Photovoltaic Power Generation and Hydrogen Storage System. Mod. Electr. Power 2025, 1–10. [Google Scholar] [CrossRef]
  35. Li, C.; Jia, X.; Zhou, Y.; Li, X. A microgrids energy management model based on multi-agent system using adaptive weight and chaotic search particle swarm optimization considering demand response. J. Clean. Prod. 2020, 262, 121247. [Google Scholar]
  36. Liu, J.; Xu, F.; Lin, S.; Cai, H.; Yan, S. A Multi-Agent-Based Optimization Model for Microgrid Operation Using Dynamic Guiding Chaotic Search Particle Swarm Optimization. Energies 2018, 11, 3286. [Google Scholar] [CrossRef]
  37. Li, Z.; Gao, X.; Huang, X.; Gao, J.; Yang, X.; Li, M.-J. Tactical unit algorithm: A novel metaheuristic algorithm for optimal loading distribution of chillers in energy optimization. Appl. Therm. Eng. 2024, 238, 122037. [Google Scholar]
Figure 1. Framework of solar–wind power generation and load side of buildings and EVs.
Energies 18 01639 g001
Figure 2. Probability distribution of charging onset moments for four charging modes: (a) Disordered mode; (b) Ordered mode; (c) Peak-load shifting mode; (d) Equalization mode.
Energies 18 01639 g002
Figure 3. Loads of four different modes: (a) electric vehicle charging load; (b) building load.
Energies 18 01639 g003
Figure 4. Optimization framework.
Energies 18 01639 g004
Figure 5. Optimization algorithm convergence curve comparison.
Energies 18 01639 g005
Figure 6. Daily scheduling diagram of the integrated energy system for a typical day in summer: (a) disordered mode (MA-1); (b) ordered mode (MA-2); (c) peak-load shifting mode (MA-3); (d) equalization mode (MA-4).
Energies 18 01639 g006
Figure 7. Daily scheduling diagram of the integrated energy system for a typical day in winter: (a) disordered mode (MB-1); (b) ordered mode (MB-2); (c) peak-load shifting mode (MB-3); (d) equalization mode (MB-4).
Energies 18 01639 g007
Figure 8. Daily scheduling diagram of the integrated energy system for a typical day in the transition season: (a) disordered mode (MC-1); (b) ordered mode (MC-2); (c) peak-load shifting mode (MC-3); (d) equalization mode (MC-4).
Energies 18 01639 g008
Figure 9. Economic analysis of an integrated energy system for a typical day in summer: (a) disordered mode (MA-1); (b) ordered mode (MA-2); (c) peak-load shifting mode (MA-3); (d) equalization mode (MA-4).
Energies 18 01639 g009
Figure 10. Economic analysis of an integrated energy system for a typical day in winter: (a) disordered mode (MB-1); (b) ordered mode (MB-2); (c) peak-load shifting mode (MB-3); (d) equalization mode (MB-4).
Energies 18 01639 g010
Figure 11. Economic analysis of the integrated energy system for a typical day in the transition season: (a) disordered mode (MC-1); (b) ordered mode (MC-2); (c) peak-load shifting mode (MC-3); (d) equalization mode (MC-4).
Energies 18 01639 g011
Figure 12. Comprehensive comparison of costs among twelve modes.
Energies 18 01639 g012
Table 1. Time-of-use electricity pricing mechanism.
Time TypeSpecific Time PeriodElectricity Price (CNY/kWh)
Time of trough11:00–15:00, 1:00–6:000.351
Normal time period6:00–11:00, 23:00–1:000.651
Peak hours15:00–23:000.951
Summer peak hours19:00–21:001.131
Winter peak hours18:00–20:001.131
Disclaimer/Publisher’s Note: The statements, opinions and data contained in all publications are solely those of the individual author(s) and contributor(s) and not of MDPI and/or the editor(s). MDPI and/or the editor(s) disclaim responsibility for any injury to people or property resulting from any ideas, methods, instructions or products referred to in the content.

