
Strategic Bidding to Increase the Market Value of Variable Renewable Generators in Electricity Markets


Abstract
1. Introduction
2. Literature Review on the Active Participation of vRESs in Electricity Markets
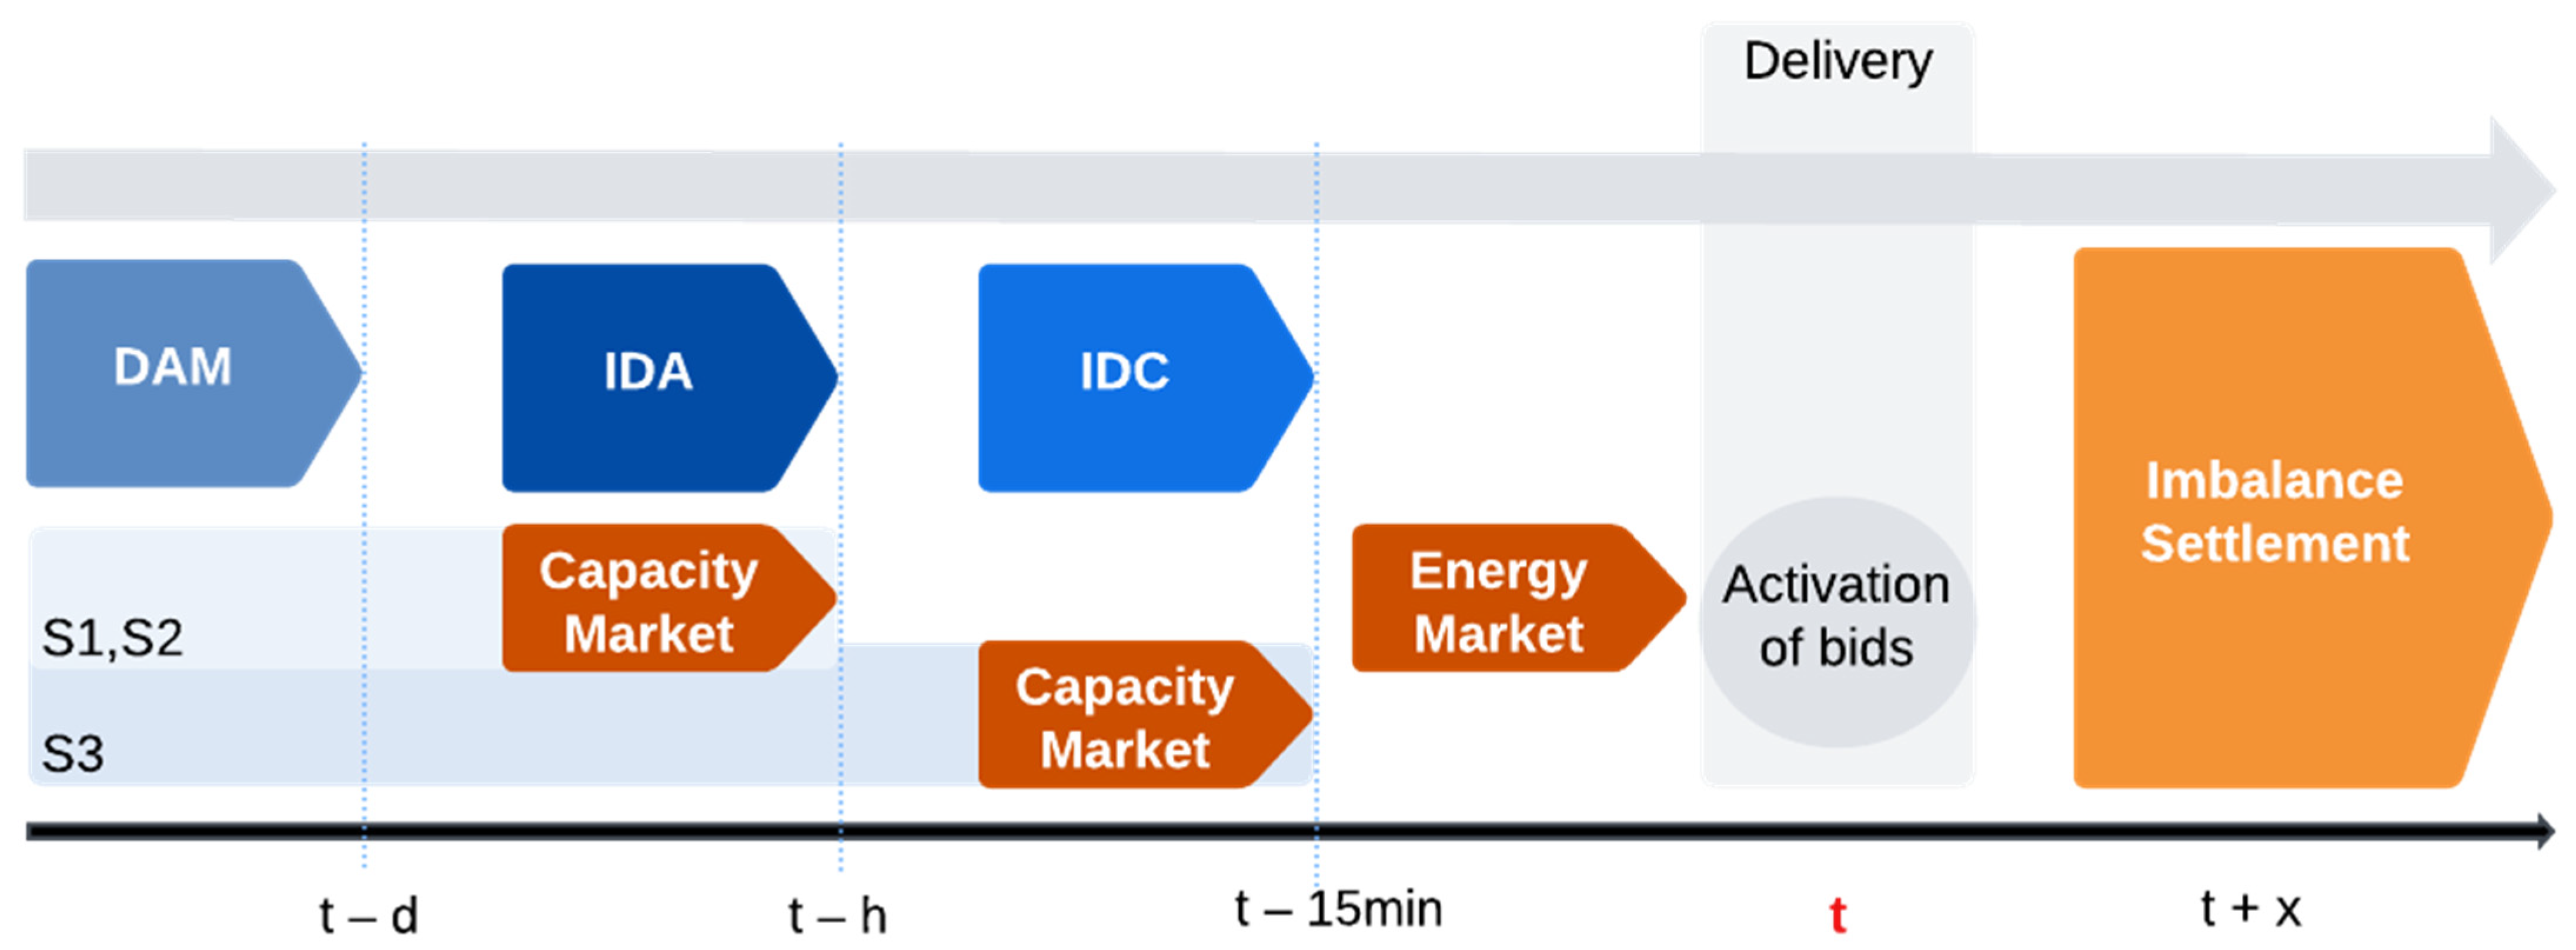
3. Electricity Markets
- Spot Markets: Agents submit bids (minimum 0.1 MW) to electricity pools through day-ahead and intraday marginal auctions.
- Continuous Markets: Trading occurs in real time, with transactions settled to 15 min before delivery.
- Derivative Markets: Includes forwards, futures, swaps, and options, allowing hedging against spot price volatility and consumption uncertainty.
- Non-Organized (Private Bilateral Contracts, such as PPAs): Agents negotiate directly, setting customized terms and conditions outside organized exchanges.
- Ancillary Service Markets: Managed by Transmission System Operators (TSOs) to ensure system stability by balancing supply and demand deviations.
3.1. European Electricity Markets
- Intraday Auctions: Conducted a few hours before real-time operation.
- Continuous Trading: Operates on a pay-as-bid basis, allowing transactions up to 15 min before real-time delivery.
- Frequency Containment Reserve (FCR):
- First response mechanism, activated within 15 s to counteract frequency disturbances.
- The European synchronous grid reserves 3000 MW for the FCR to maintain system stability.
- Automatic Frequency Restoration Reserve (aFRR):
- Activated within 30 s, replacing the FCR.
- Maintains grid frequency stability for up to 15 min.
- TSOs define a power band for each period, with symmetric band requirements set by ENTSO-E or set by each TSO according to its own methodology.
- Manual Frequency Restoration Reserve (mFRR):
- Used after the aFRR to support extended balancing needs.
- Addresses medium- and long-term deviations caused by generation or load fluctuations.
- TSOs activate 15 min market blocks, allowing generators to bid in auctions.
- Replacement Reserve (RR):
- Used for long-term disturbances beyond aFRR and mFRR capabilities.
- Activated within 15 min and remain active for several hours.
- Typically managed through bilateral agreements between TSOs and providers, rather than real-time market activations.
3.2. Portuguese Electricity Markets
- FCR:
- The FCR is mandatory and non-remunerated for all technically capable generators connected to the grid.
- Generators must reserve 5% of their nominal power under stable conditions to support the FCR.
- Portugal contributes to the continental European synchronous grid.
- aFRR:
- The Portuguese TSO requires an asymmetrical aFRR power band, where up-regulation capacity is twice the down-regulation capacity.
- Historically, Portugal’s aFRR power band is more used for up-regulation than down-regulation.
- To align with ENTSO-E guidelines, Portugal’s TSO upscales up-regulation capacity to 60% and downscales down-regulation to 40%.
- Hourly aFRR capacity auctions are held, allowing all technically capable generators to participate.
- Generators must offer both up-regulation and down-regulation, with up capacity being twice the down capacity.
- Due to limited competition, combined cycle gas turbines (CCGTs) dominate the aFRR market.
- The price of upwards aFRR energy is regulated and set by the national regulator.
- mFRR:
- mFRR energy is procured through hourly auctions, with separate bids for upward and downward regulation in marginal markets.
- Since mFRR is based on hourly auctions, it may not be sufficient for balancing long-term frequency deviations.
- RR:
- Based on annual marginal capacity procurement, its marginal energy procurement is defined through hourly auctions, with separate bids for upward and downward regulation.
- RRs are activated for long-term system imbalances that cannot be resolved through aFRRs or mFRRs.
- RRs can be activated within 15 min and remain active for extended periods.
4. Strategic Bidding of vRESs in Electricity Markets
- The schedule in the EMs is limited by the nominal power of the vRES power plant. The producer cannot sell more energy than what can be physically produced.
- The producer cannot bid more downward balancing capacity than the scheduled injection.
- Bids in the BMs are limited by the request of the TSO.
- Position: The portfolio of the vRES that accounts for the bid in the DAM, increasing when selling in the IDM and decreasing when purchasing energy.
- Final offer: The position of the vRES after the capacity market and before the activation of energy bids. This represents the adjusted position based on initial bids and the balancing capacity market.
- Final schedule: After the activation of reserves by the TSO, the final schedule reflects the adjusted energy injection into the grid. It is derived from initial positions from the DAM and IDMs, increasing when upward reserves are activated and decreasing when downward reserves are called upon. This adjustment reflects the energy increased or reduced in response to the TSO’s requests.
- Final deviation: The difference between the actual production and the final schedule, which will be settled during the IS period.
4.1. Ideal Case
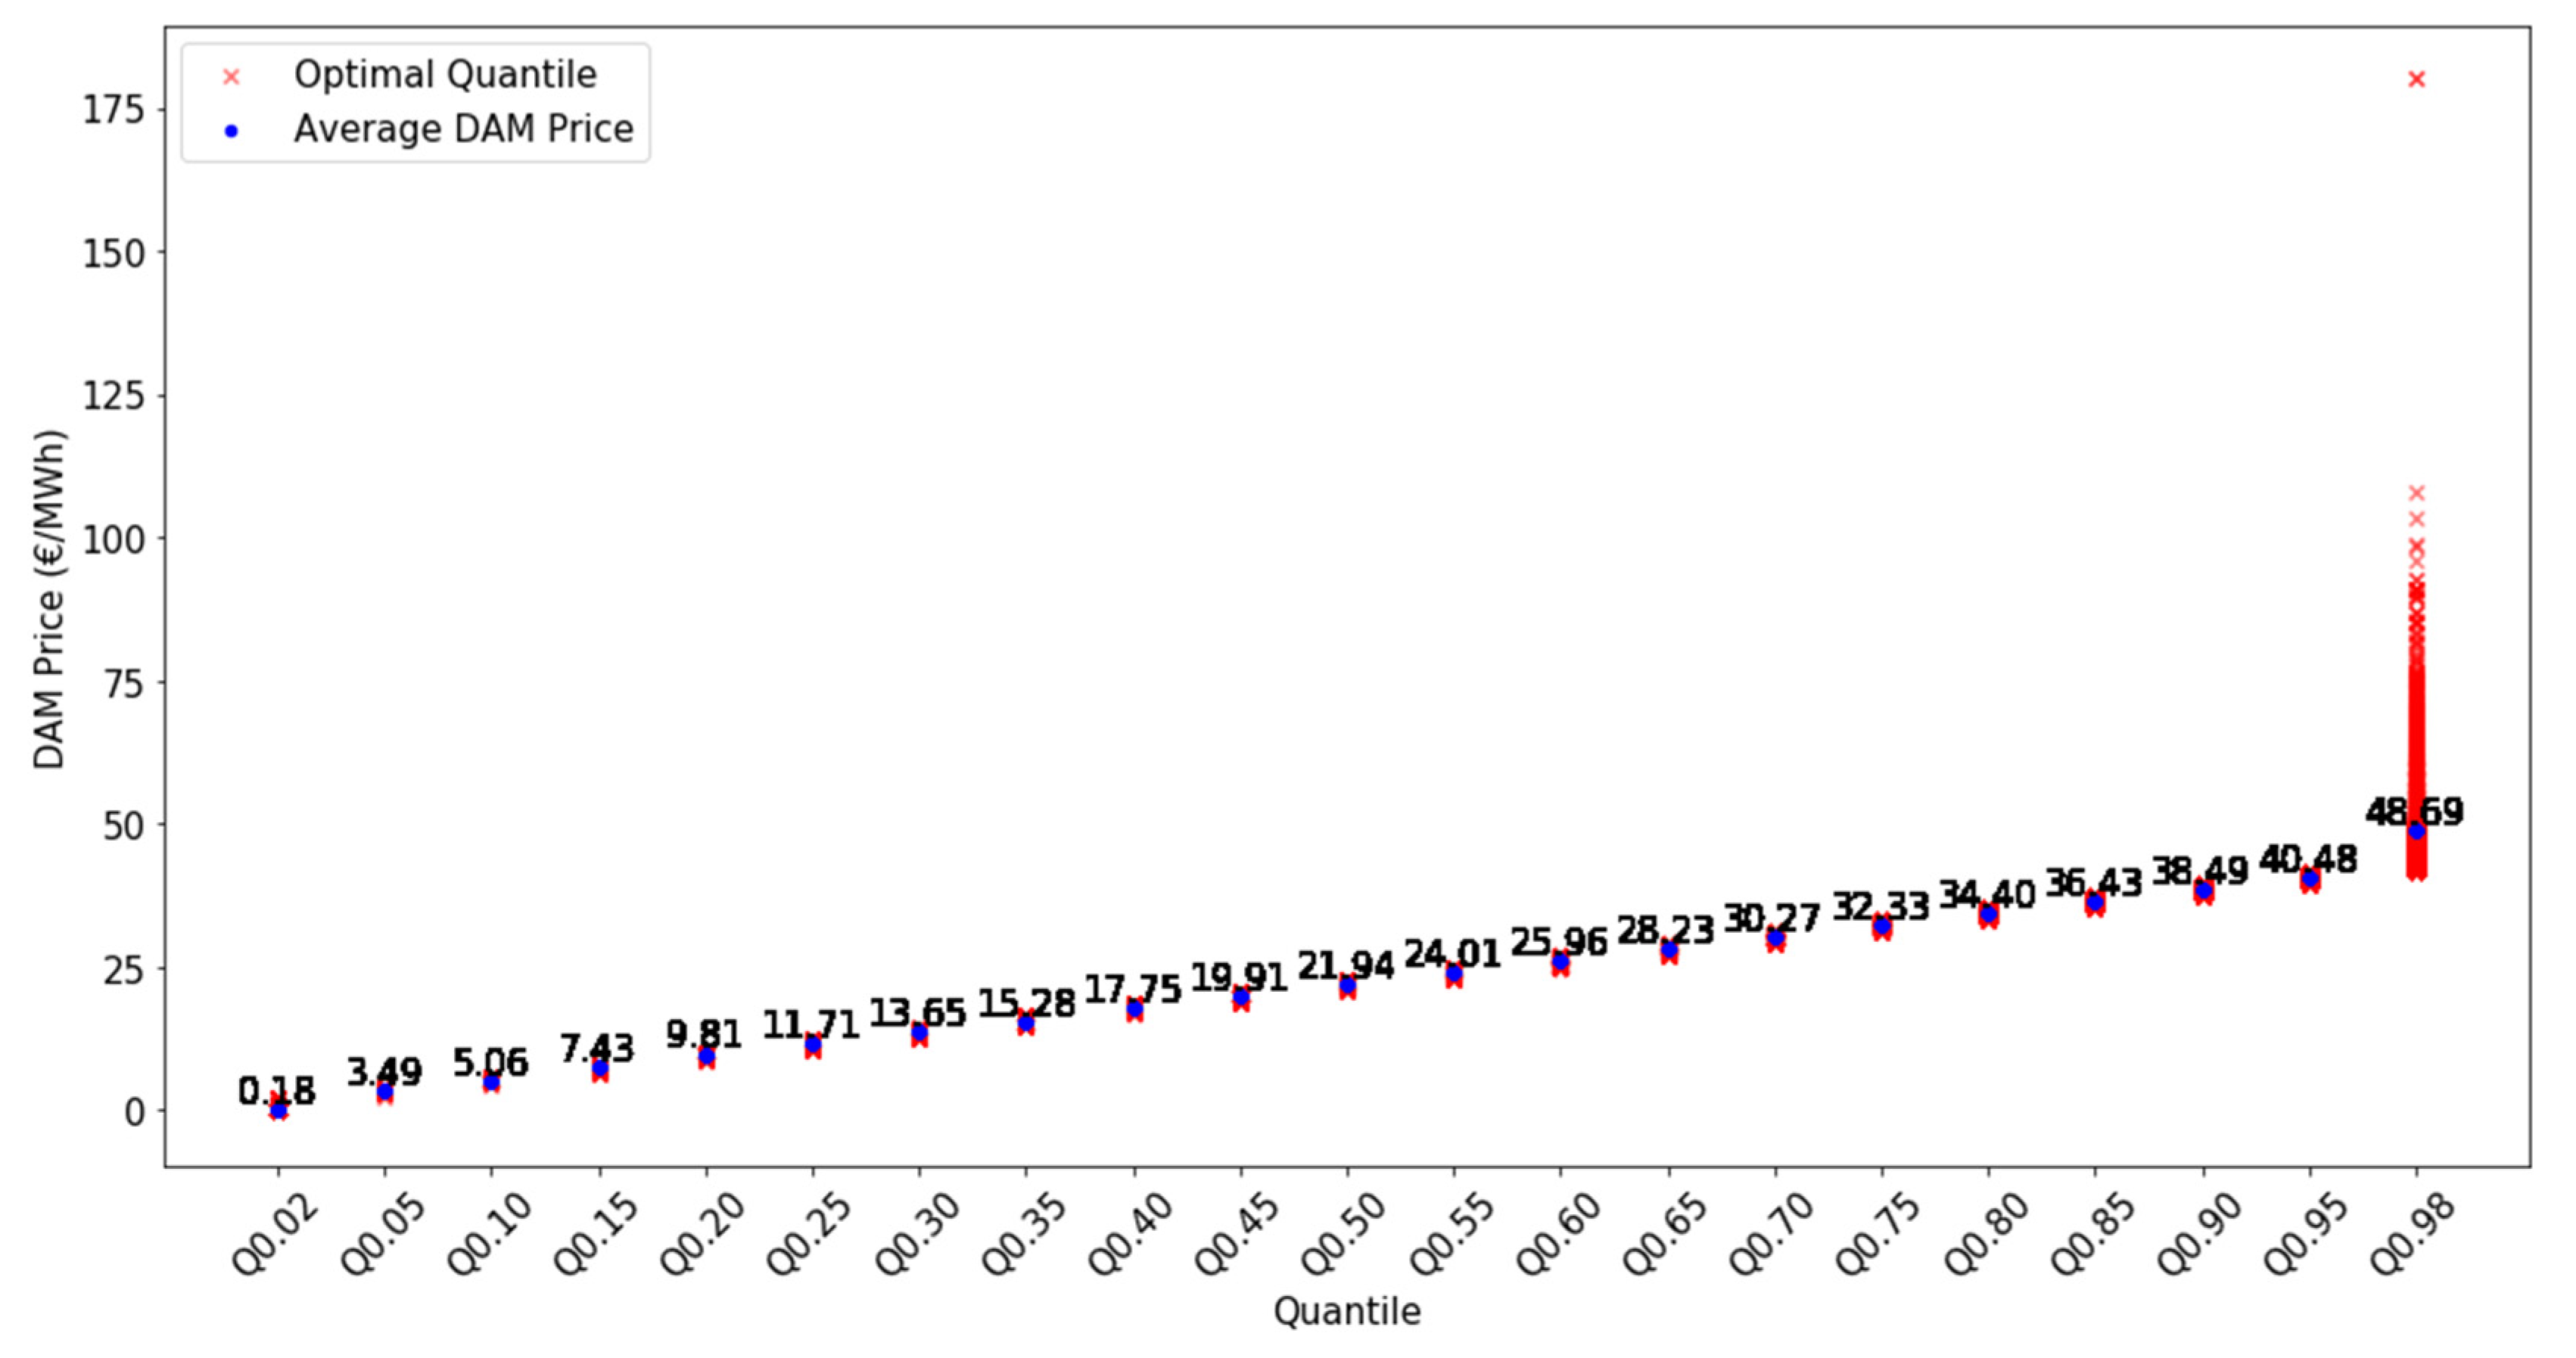
- is the quantile j, with j representing the index ranging from 1 to 21.
- is the DAM price.
- is the price paid to the producers with excess generation.
- is the price paid by producers with a deficit.
- is the upward secondary balancing energy provided by the vRES.
- represents the downward secondary balancing energy provided by the vRES, which corresponds to the energy withdrawn from the grid when requested by the TSO. The negative sign indicates the payment made by the BRP to the TSO.
4.2. Operational Case
- The bid for upward balancing capacity cannot exceed the available capacity or the needs of the TSO.
- The bid for downward balancing capacity cannot exceed the scheduled injection or the needs of the TSO.
4.3. Strategies for Participation in aFRR Market
- is the forecasted value 15 min before delivery.
- is the vRES position at the time of the IDC, which can be higher than the bid in the DAM if the producer sold energy in the IDA or lower if the producer was a buyer in the IDA. The average remuneration (€/MWh) for the study period is calculated by dividing the total revenue across all hours by the total production for the same period.
- is the average remuneration (€/MWh).
- is the total revenue at hour t.
- is the observed production for each hour t.
- T is the total number of hours in the dataset.
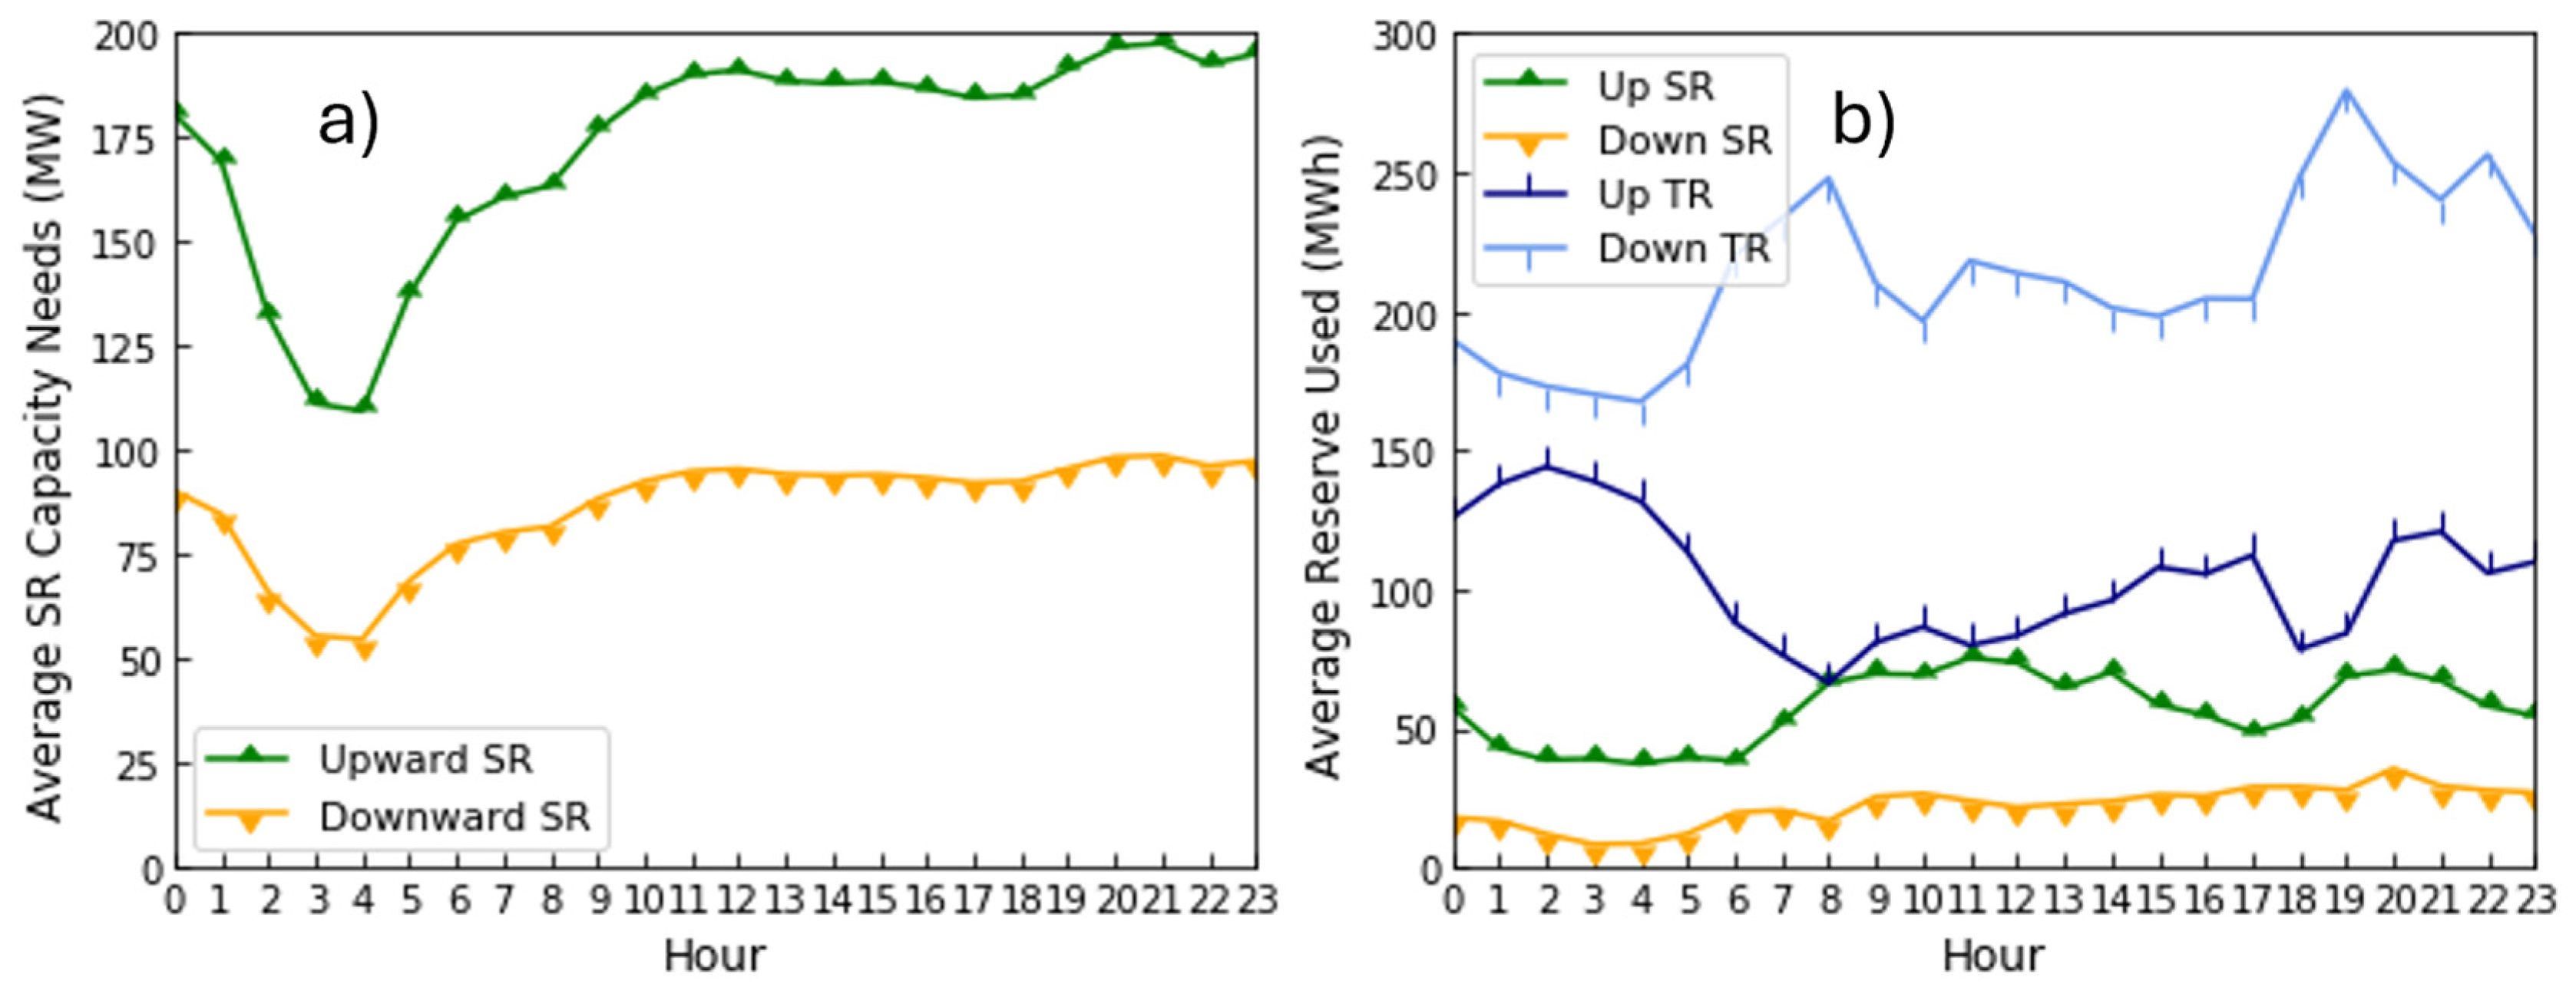
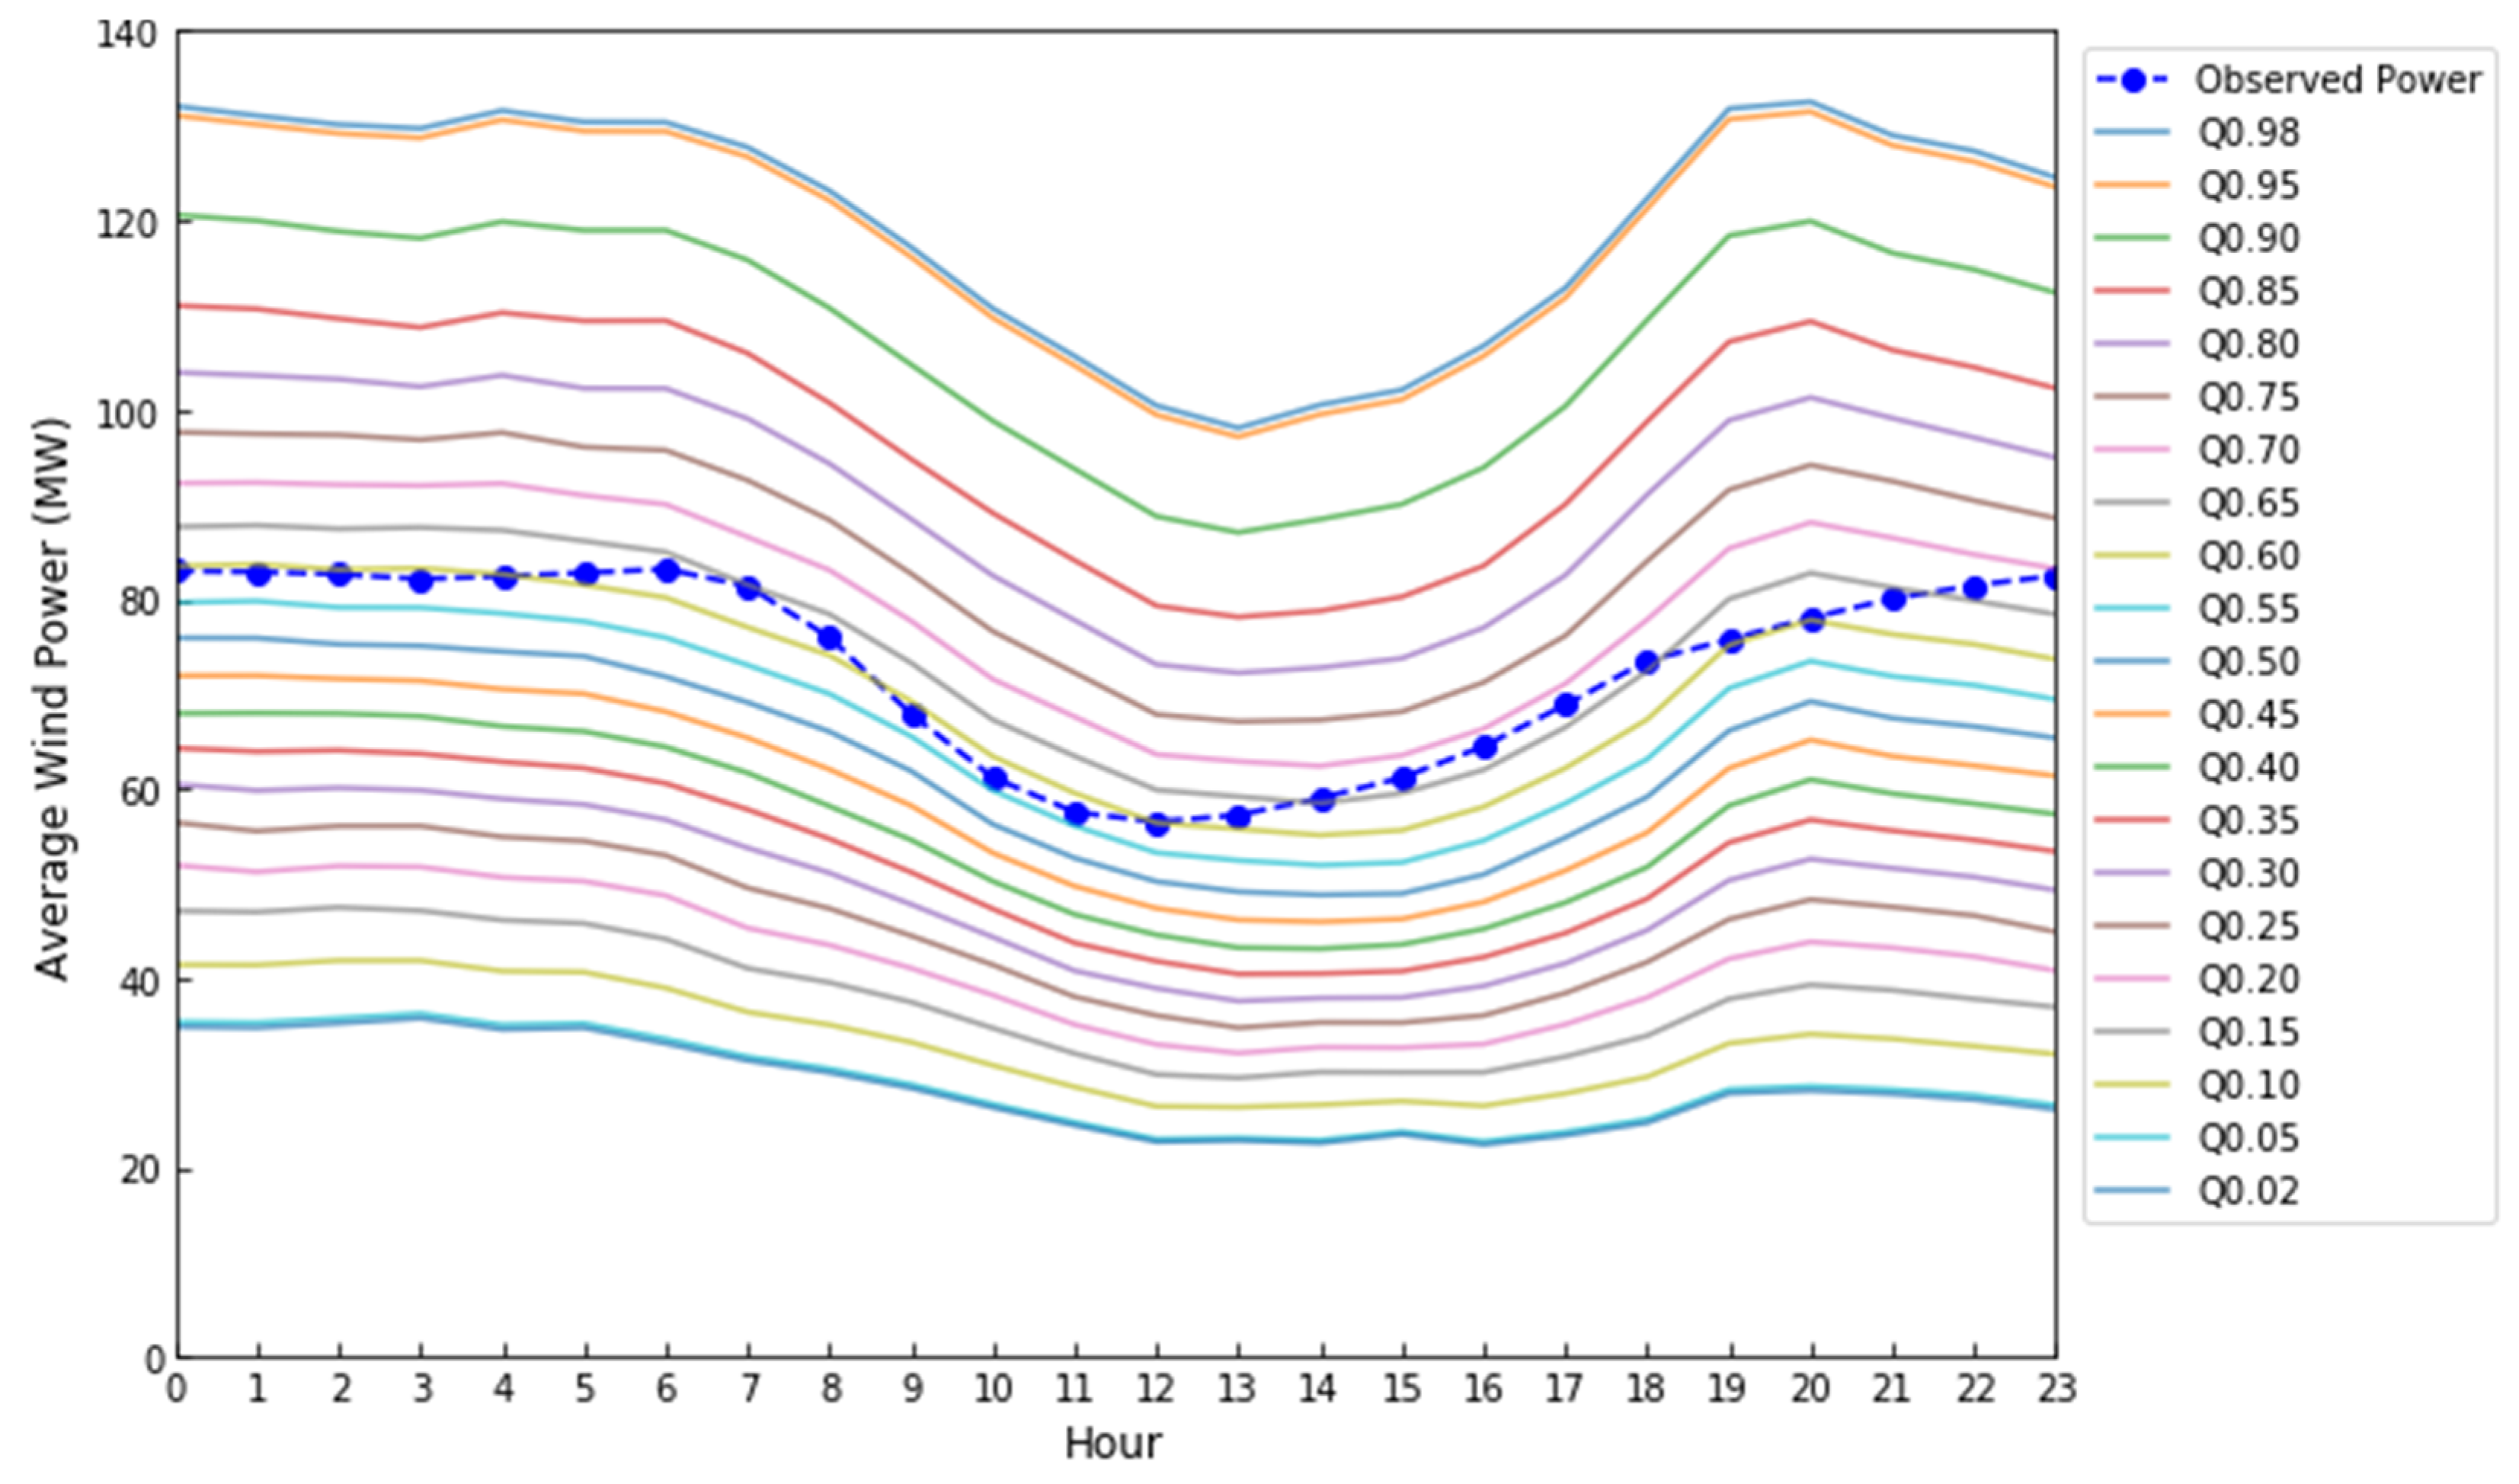
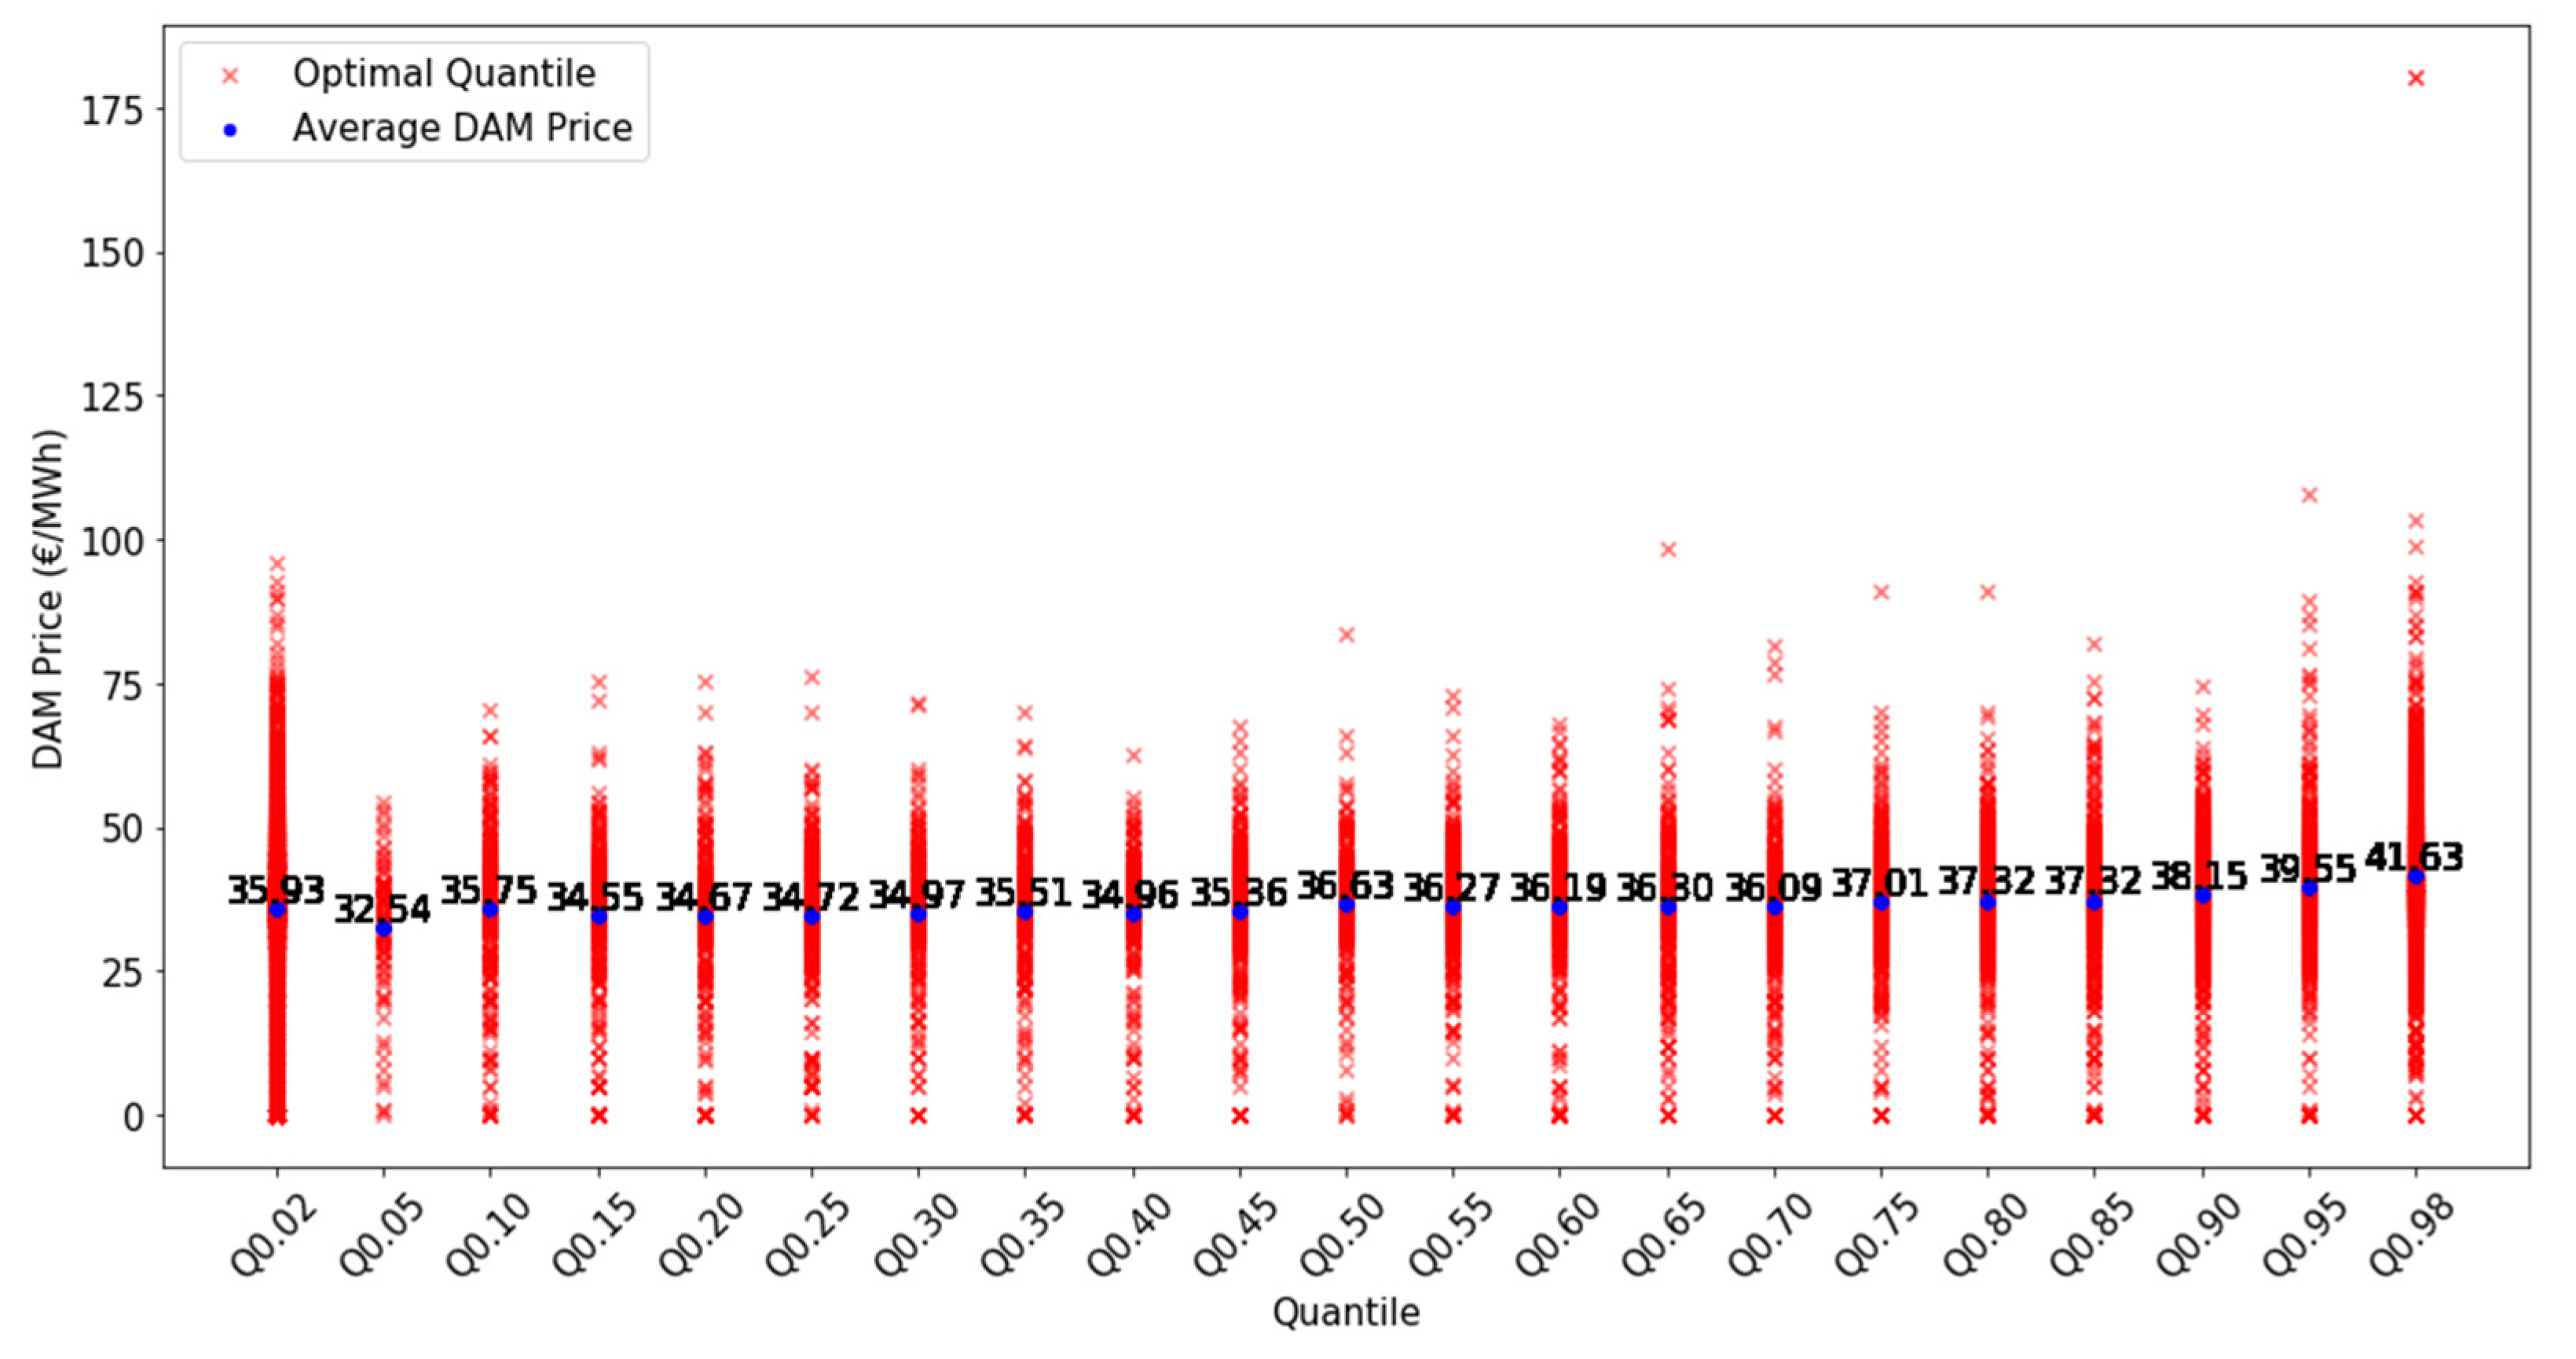
5. Case Study on the Active Participation of a WPP in EMs
5.1. Dataset and Statistics
- A probabilistic quantile-based forecast used by the producer when submitting bids to the DAM.
- Two deterministic single-point forecasts are provided in the IDMs: one with a time horizon between 4 and 9 h depending on the session of IDA, corresponding to the gate closure of the IDA, and another with a 15 min time horizon, corresponding to the gate closure of the IDC.
5.2. Scenarios
- MIBEL first-stage design: This approach illustrates the market conditions prior to the introduction of the continuous intraday market. Under this design, the gate closure for the IDA was set a few hours before delivery. According to Portuguese legislation, bids for downward capacity must be half the amount of upward capacity offered in the aFRR market. With increasing competition from WPPs, the price of the reserve energy market was assumed instead of the regulated price to CCGTs.
- MIBEL second-stage design: This design represents the stage after including the continuous intraday market. Existing legislation continues to impose restrictions on the procurement of downward capacity. In the simulated period, it was assumed that IDC trades have the same price as the DAM trades to overcome the lack of data in the studied period.
5.3. Results
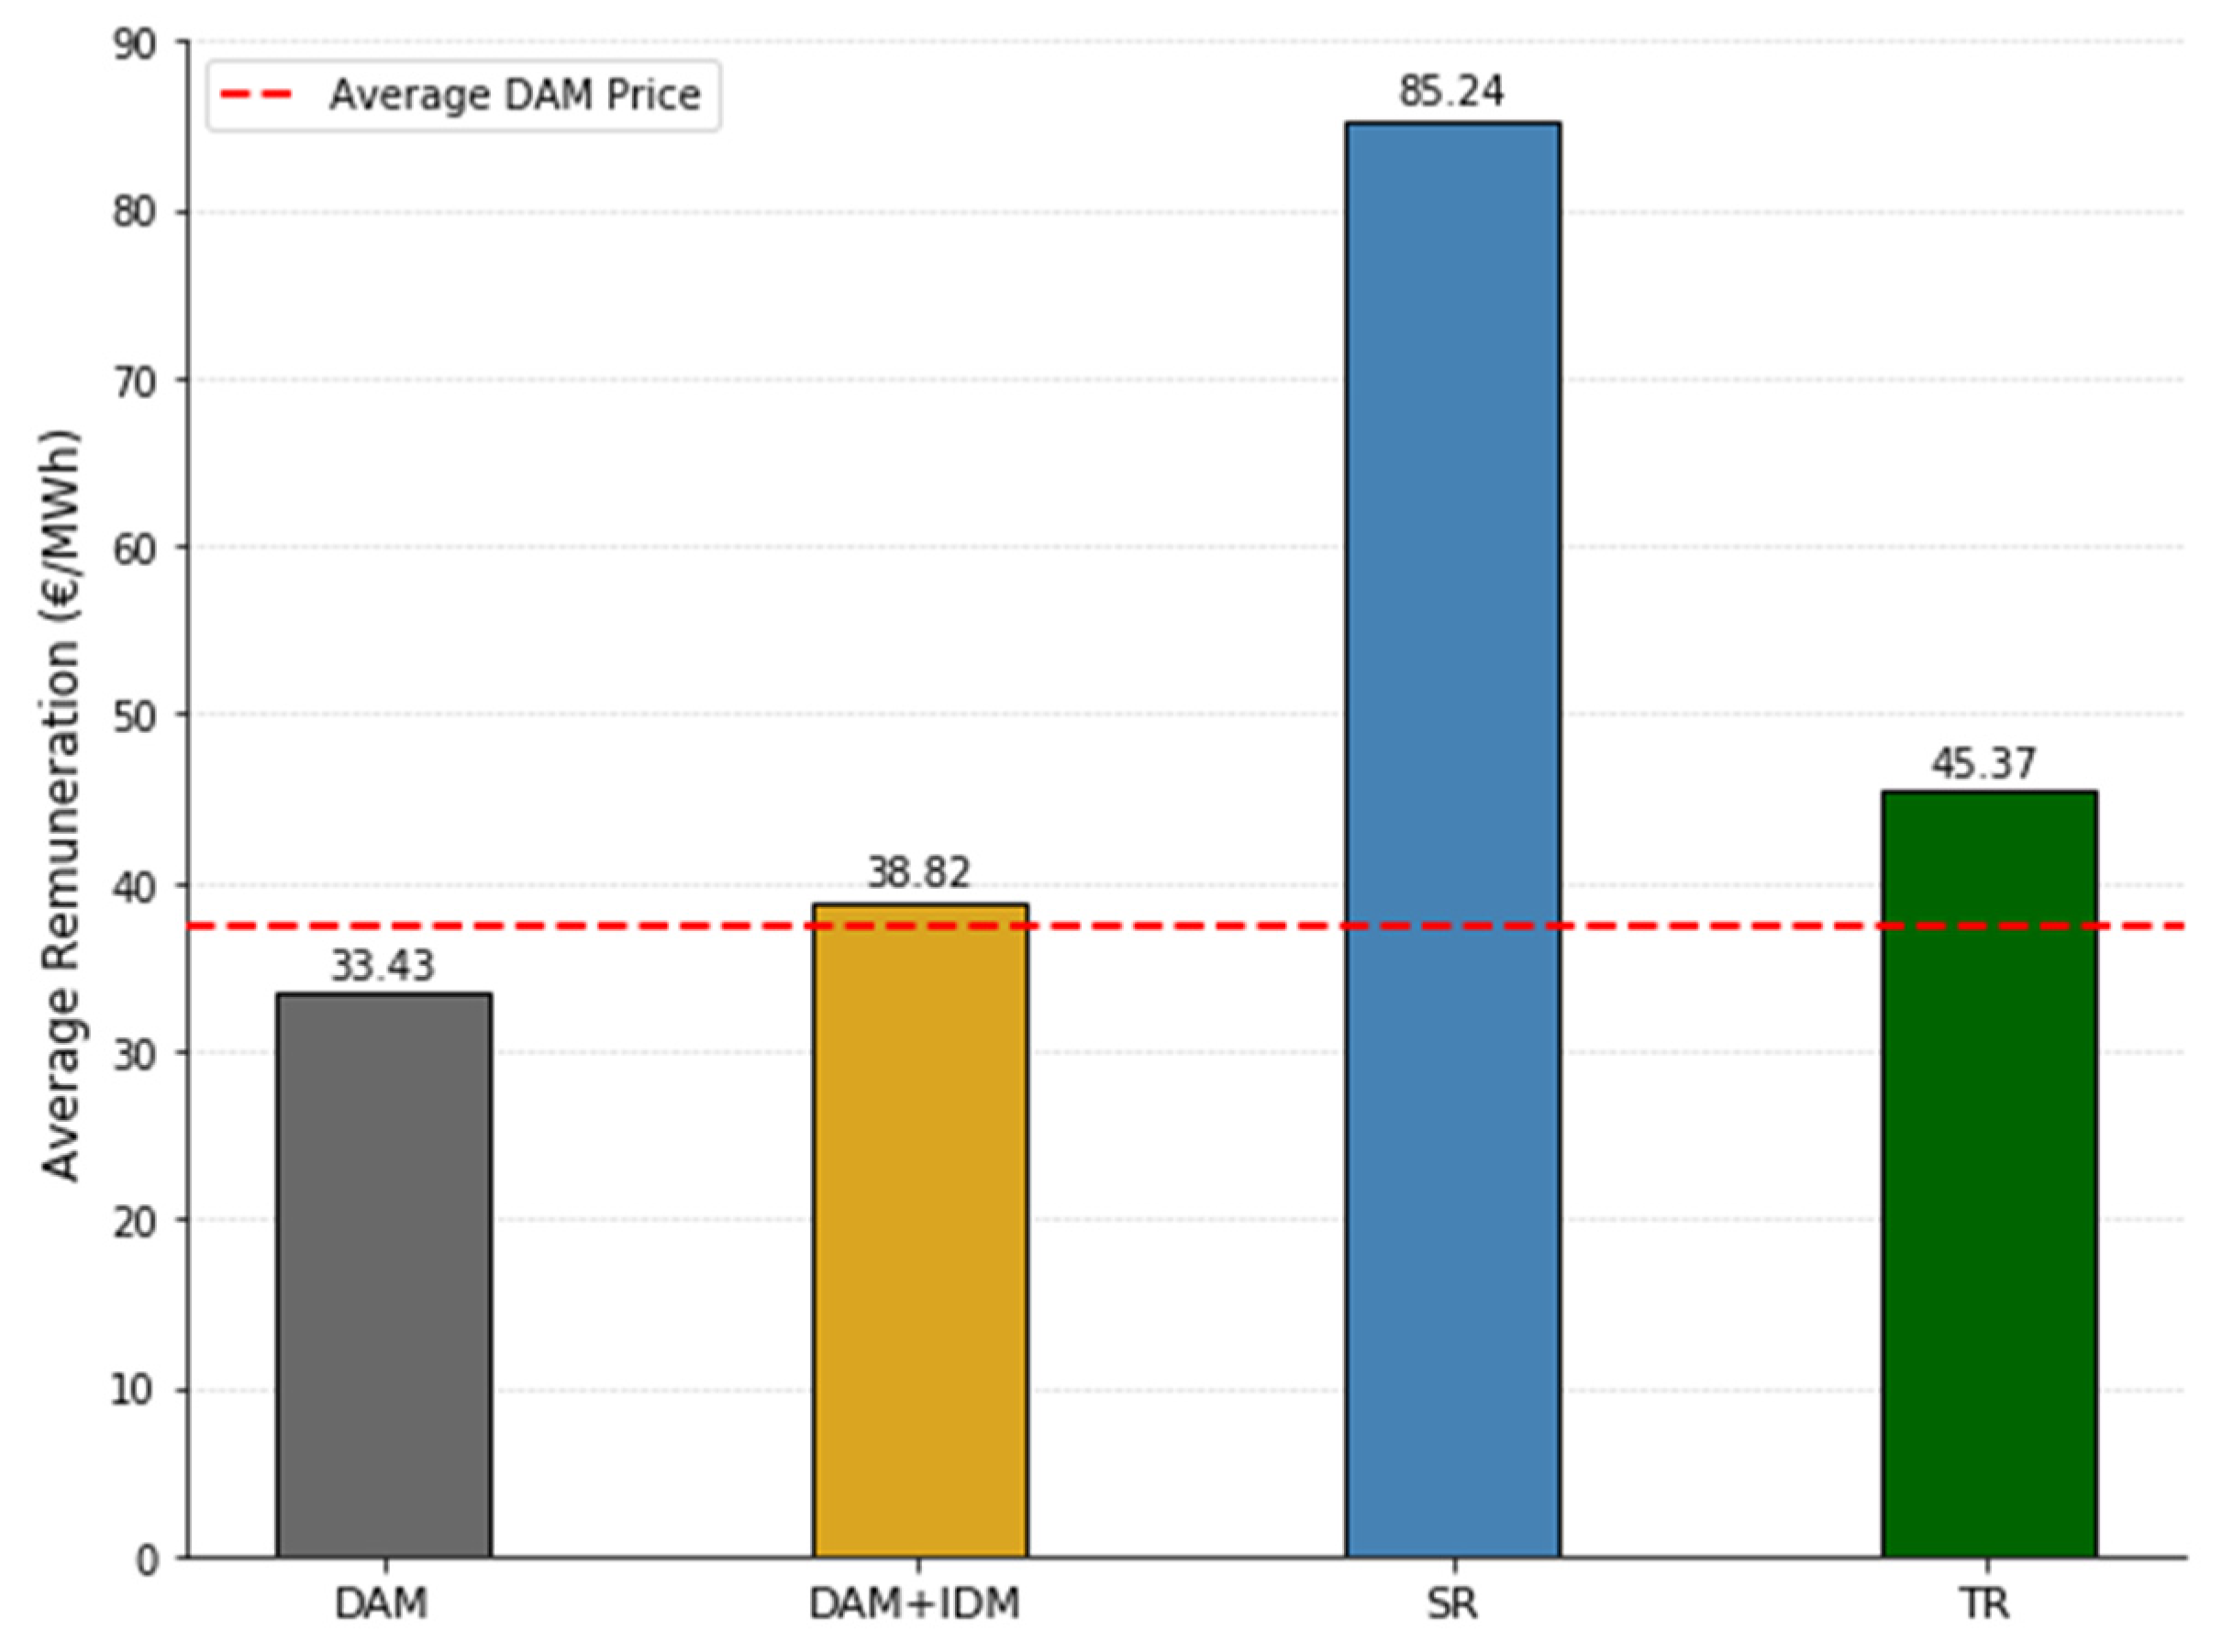
5.3.1. Ideal Case
5.3.2. Operational Case
6. Conclusions
Supplementary Materials
Author Contributions
Funding
Data Availability Statement
Conflicts of Interest
Abbreviations
| aFRR | Automatic-activated frequency restoration reserve |
| BM | Balancing market |
| BRP | Balance Responsible Party |
| CCGTs | Combined cycle gas turbines |
| CET | Central European Time |
| CfDs | Contracts for difference |
| DAM | Day-ahead market |
| EM | Electricity market |
| EU | European Union |
| EUPHEMIA | EU Pan-European Hybrid Electricity Market |
| FCR | Frequency containment reserve |
| FiTs | Feed-in tariffs |
| GFS | Global Forecast System |
| IDA | Auction-based IDM |
| IDC | Continuous IDM |
| IDM | Intraday market |
| IS | Imbalance settlement |
| KNN | K-Nearest Neighbor |
| LCOEs | Levelized costs of energy |
| mFRR | Manually activated frequency restoration reserve |
| MIBEL | Iberian market of electricity |
| NWP | Numerical weather prediction |
| PPA | Power purchase agreement |
| PV | Photovoltaic |
| RR | Replacement reserve |
| SD | Standard deviation |
| SR | Secondary reserve |
| STE | Short-term energy PPA contract |
| TR | Tertiary reserve |
| TSO | Transmission System Operator |
| vRESs | Variable renewable energy sources |
| WPP | Wind power producer |
| Indices | |
| j | Probabilistic forecast quantiles for each hour |
| Quantile | |
| K | Number of quantiles |
| Hours | |
| Parameters | |
| Price received for each unit of balance capacity in aFRR market | |
| DAM price | |
| Price paid by BRP with negative imbalances | |
| Price received by BRP with positive imbalances | |
| IDA price | |
| Price for imbalance for BRP | |
| Price for tertiary and secondary energy | |
| Price for upward tertiary and secondary energy | |
| Deterministic forecast 15 min before delivery in hour t | |
| Deterministic forecast hours before delivery in hour t | |
| Observed energy | |
| TSO needs for downward balance in the aFRR capacity market | |
| TSO needs for upward balance in the aFRR capacity market | |
| Downward secondary energy requested by TSO | |
| Upward secondary energy requested by TSO | |
| Downward tertiary energy requested by TSO | |
| Upward tertiary energy requested by TSO | |
| Probabilistic forecast quantiles | |
| Maximum price | |
| Variables | |
| Energy curtailed | |
| Bid in DAM | |
| Bid in IDA | |
| Bid in IDC | |
| Upward secondary energy activated | |
| Downward secondary energy activated | |
| Upward tertiary energy activated | |
| Downward secondary energy activated | |
| Upward capacity allocated | |
| Downward capacity allocated |
References
- Kirschen, D.; Strbac, G. Fundamentals of Power System Economics; Wiley: Chichester, UK, 2018. [Google Scholar]
- Hunt, S.; Shuttleworth, G. Competition and Choice in Electricity; Wiley: Chichester, UK, 1996. [Google Scholar]
- Algarvio, H. Multi-step optimization of the purchasing options of power retailers to feed their portfolios of consumers. Int. J. Electr. Power Energy Syst. 2022, 142, 108260. [Google Scholar]
- Shahidehpour, M.; Yamin, H.; Li, Z. Market Operations in Electric Power Systems; Wiley: Chichester, UK, 2002. [Google Scholar]
- Algarvio, H.; Lopes, F.; Couto, A.; Santana, J.; Estanqueiro, A. Effects of Regulating the European Internal Market on the integration of Variable Renewable Energy. WIREs Energy Environ. 2019, 8, e346. [Google Scholar]
- Strbac, G.; Papadaskalopoulos, D.; Chrysanthopoulos, N.; Estanqueiro, A.; Algarvio, H.; Lopes, F.; de Vries, L.; Morales-España, G.; Sijm, J.; Hernandez-Serna, R.; et al. Decarbonization of Electricity Systems in Europe: Market Design Challenges. IEEE Power Energy Mag. 2021, 19, 53–63. [Google Scholar]
- Maris, G.; Flouros, F. The Green Deal, National Energy and Climate Plans in Europe: Member States’ Compliance and Strategies. Adm. Sci. 2021, 11, 75. [Google Scholar] [CrossRef]
- Prema, V.; Bhaskar, M.S.; Almakhles, D.; Gowtham, N.; Rao, K.U. Critical Review of Data, Models and Performance Metrics for Wind and Solar Power Forecast. IEEE Access 2022, 10, 667–688. [Google Scholar]
- Miettinen, J.; Holttinen, H. Impacts of wind power forecast errors on the real-time balancing need: A Nordic case study. IET Renew. Power Gener. 2019, 13, 227–233. [Google Scholar]
- Martín-Martínez, S.; Lorenzo-Bonache, A.; Honrubia-Escribano, A.; Cañas-Carretón, M.; Gómez-Lázaro, E. Contribution of wind energy to balancing markets: The case of Spain. WIREs Energy Environ. 2018, 7, e300. [Google Scholar] [CrossRef]
- Algarvio, H.; Lopes, F.; Couto, A.; Estanqueiro, A. Participation of wind power producers in day-ahead and balancing markets: An overview and a simulation-based study. Wiley Interdiscip. Rev. Energy Environ. 2019, 8, e343. [Google Scholar]
- Frade, P.; Pereira, J.; Santana, J.; Catalão, J. Wind balancing costs in a power system with high wind penetration–Evidence from Portugal. Energy Policy 2019, 132, 702–713. [Google Scholar]
- Ramirez, F.J.; Honrubia-Escribano, A.; Gomez-Lazaro, E.; Pham, A.T. Combining feed-in tariffs and net-metering schemes tobalance development in adoption of photovoltaic energy: Comparative economic assessment and policy implications for European countries. Energy Policy 2017, 102, 440–452. [Google Scholar]
- Bohland, M.; Schwenen, S. Renewable support and strategic pricing in electricity markets. Int. J. Ind. Organ. 2022, 80, 102792. [Google Scholar] [CrossRef]
- Brigatto, A.; Fanzeres, B. A soft robust methodology to devise hedging strategies in renewable energy trading based on electricity options. Electr. Power Syst. Res. 2022, 207, 107852. [Google Scholar]
- Algarvio, H. Risk-Sharing Contracts and risk management of bilateral contracting in electricity markets. Int. J. Electr. Power Energy Syst. 2023, 144, 108579. [Google Scholar]
- Schlecht, I.; Maurer, C.; Hirth, L. Financial contracts for differences: The problems with conventional CfDs in electricity markets and how forward contracts can help solve them. Energy Policy 2024, 186, 113981. [Google Scholar]
- Grubb, M.; Drummond, P.; Maximov, S. Separating electricity from gas prices through Green Power Pools: Design options and evolution. Inst. New Econ. Think. Work. Pap. Ser. 2022, 193, 1–34. [Google Scholar]
- Anatolitis, V.; Azanbayev, A.; Fleck, A.K. How to design efficient renewable energy auctions? Empirical insights from Europe. Energy Policy 2022, 166, 112982. [Google Scholar]
- Nash, J. Equilibrium points in n-person games. Proc. Natl. Acad. Sci. USA 1950, 36, 48–49. [Google Scholar] [CrossRef] [PubMed]
- Algarvio, H.; Lopes, F.; Santana, J. Strategic Operation of Hydroelectric Power Plants in Energy Markets: A Model and a Study on the Hydro-Wind Balance. Fluids 2020, 5, 209. [Google Scholar] [CrossRef]
- Rathod, A.A.; Subramanian, B. Scrutiny of Hybrid Renewable Energy System for Control, Power Management, Optimization and Sizing: Challenges and Future Possibilities. Sustainability 2022, 14, 16814. [Google Scholar] [CrossRef]
- Lei, X.; Yu, H.; Zhong, J.; Jia, Y.; Shao, Z.; Jian, L. Exploring electric vehicle’s potential as capacity reservation through V2G operation to compensate load deviation in distribution systems. J. Clean. Prod. 2024, 451, 141997. [Google Scholar]
- Grubb, M.; Newbery, D. UK Electricity Market Reform and the Energy Transition: Emerging Lessons. Energy J. 2018, 39, 1–26. [Google Scholar] [CrossRef]
- Prol, J.; Steininger, K.; Zilberman, D. The cannibalization effect of wind and solar in the California wholesale electricity market. Energy Econ. 2020, 85, 104552. [Google Scholar] [CrossRef]
- Hinderks, W.J.; Wagner, A. Factor models in the German electricity market: Stylized facts, seasonality, and calibration. Energy Econ. 2020, 85, 104351. [Google Scholar] [CrossRef]
- Nordström, H.; Söder, L.; Flynn, D.; Matevosyan, J.; Kiviluoma, J.; Holttinen, H.; Vrana, T.K.; van der Welle, A.; Morales-España, G.; Pudjianto, D.; et al. Strategies for Continuous Balancing in Future Power Systems with High Wind and Solar Shares. Energies 2023, 16, 5249. [Google Scholar] [CrossRef]
- Johanndeiter, S.; Bertsch, V. Bidding zero? An analysis of solar power plants’ price bids in the electricity day-ahead market. Appl. Energy 2024, 371, 123672. [Google Scholar] [CrossRef]
- Fabra, N.; Imelda. Market Power and Price Exposure: Learning from Changes in Renewable Energy Regulation. Am. Econ. J. Econ. Policy 2023, 15, 323–358. [Google Scholar] [CrossRef]
- Skytte, K.; Bobo, L. Increasing the value of wind: From passive to active actors in multiple power markets. WIREs Energy Environ. 2019, 8, e328. [Google Scholar] [CrossRef]
- Hamon, C.; Persson, M. Wind Power Participation in Frequency Regulation: A Profitability Assessment for Sweden. Available online: https://ri.diva-portal.org/smash/get/diva2:1751691/FULLTEXT01.pdf (accessed on 26 February 2025).
- Kraft, E.; Russo, M.; Keles, D.; Bertsch, V. Stochastic optimization of trading strategies in sequential electricity markets. Eur. J. Oper. Res. 2023, 308, 400–421. [Google Scholar] [CrossRef]
- Algarvio, H.; Lopes, F.; Couto, A.; Estanqueiro, A.; Santana, J. Variable Renewable Energy and Market Design: New Products and a Real-World Study. Energies 2019, 12, 4576. [Google Scholar] [CrossRef]
- Sleisz, A.; Sores, P.; Raisz, D. Algorithmic properties of the all-European day-ahead electricity market. In Proceedings of the 11th International Conference on the European Energy Market (EEM-14), Krakow, Poland, 28–30 May 2014; pp. 1–6. [Google Scholar]
- Roumkos, C.; Biskas, P.N.; Marneris, I.G. Integration of European Electricity Balancing Markets. Energies 2022, 15, 2240. [Google Scholar] [CrossRef]
- ENTSO-E. ENTSO-E Network Code on Electricity Balancing. August 2024. Available online: https://eepublicdownloads.entsoe.eu/clean-documents/Network%20codes%20documents/NC%20EB/140806_NCEB_Resubmission_to_ACER_v.03.PDF (accessed on 26 February 2025).
- Matsumoto, T.; Bunn, D.; Yamada, Y. Mitigation of the inefficiency in imbalance settlement designs using day-ahead prices. IEEE Trans. Power Syst. 2022, 37, 3333–3345. [Google Scholar]
- Frade, P.; Osório, G.; Santana, J.; Catalão, J. Cooperation Regional coordination in ancillary services: An innovative study for secondary control in the Iberian electrical system. Int. J. Electr. Power Energy Syst. 2019, 109, 513–525. [Google Scholar]
- Frade, P.; Shafie-khah, M.; Santana, J.; Catalão, J. Cooperation in ancillary services: Portuguese strategic perspective on replacement reserves. Energy Strategy Rev. 2019, 23, 142–151. [Google Scholar]
- Algarvio, H.; Couto, A.; Estanqueiro, A. RES. Trade: An Open-Access Simulator to Assess the Impact of Different Designs on Balancing Electricity Markets. Energies 2024, 17, 6212. [Google Scholar] [CrossRef]
- Zhang, Y.; Wang, J.; Wang, X. Review on probabilistic forecasting of wind power generation. Renew. Sustain. Energy Rev. 2014, 32, 255–270. [Google Scholar] [CrossRef]
- Wang, Y.; Xu, H.; Zou, R.; Zhang, F.; Hu, Q. Dynamic non-constraint ensemble model for probabilistic wind power and wind speed forecasting. Renew. Sustain. Energy Rev. 2024, 204, 114781. [Google Scholar] [CrossRef]
- Dhaka, P.; Sreejeth, M.; Tripathi, M. A survey of artificial intelligence applications in wind energy forecasting. Arch. Comput. Methods Eng. 2024, 31, 4853–4878. [Google Scholar]


| DAM (€/MWh) | IDA (€/MWh) | Secondary Reserve Capacity (€/MW) | Positive Tertiary Energy (€/MWh) | Negative Tertiary Energy (€/MWh) | Positive Imbalance Price (€/MWh) | Negative Imbalance Price (€/MWh) | |
|---|---|---|---|---|---|---|---|
| Min | 0.00 | 0.00 | 0.00 | 0.00 | 0.00 | −289.51 | −160.44 |
| Max | 180.30 | 112.05 | 180.30 | 181.00 | 100.00 | 225.10 | 381.01 |
| Median | 38.18 | 36.52 | 22.57 | 43.20 | 23.00 | 25.86 | 49.23 |
| Mean | 37.30 | 35.09 | 27.12 | 42.40 | 20.15 | 22.74 | 51.82 |
| SD | 12.17 | 12.62 | 14.54 | 18.02 | 15.49 | 19.66 | 20.92 |
| 4–9 h Before | 15 min Before | |
|---|---|---|
| Min | −143.41 | −23.03 |
| Max | 114.08 | 24.08 |
| Median | 0.45 | 0.27 |
| Mean | −2.03 | 0.02 |
| SD | 22.86 | 2.86 |
| Market Revenue (k€) | Market | |||
|---|---|---|---|---|
| DAM | IDM | SR | TR | |
| Day-ahead | 2.54 | 3.04 | 2.23 | 3.26 |
| Intraday | - | −0.19 | 0.18 | 0.01 |
| Capacity | - | - | 4.22 | - |
| Energy | - | - | 0.51 | 0.05 |
| Imbalance Settlement | −0.09 | −0.01 | −0.89 | 0.01 |
| Market Design | Stage 1 | Stage 2 |
|---|---|---|
| Average Remuneration (€/MWh) | 85.24 | 85.77 |
| Variables | Market Design | |
|---|---|---|
| Stage 1 | Stage 2 | |
| Revenue (k€) | 6.26 | 6.29 |
| DAM traded energy (MWh) | 62.13 | 61.13 |
| IDA traded energy (MWh) | 14.23 | 9.40 |
| IDC traded energy (MWh) | - | 5.91 |
| Allocated capacity (MW) | 147.09 | 147.23 |
| Activated reserve (MWh) | 24.05 | 24.10 |
| Imbalances (MWh) | 21.12 | 20.69 |
| Curtailment (MWh) | 3.57 | 3.62 |
| Variables | Strategy | ||
|---|---|---|---|
| S1 | S2 | S3 | |
| DAM traded energy (MWh) | 98.73 | 98.73 | 98.73 |
| IDA traded energy (MWh) | 36.88 | 22.77 | 22.39 |
| IDC traded energy (MWh) | - | 24.23 | 16.59 |
| Capacity allocated (MW) | 9.22 | 9.22 | 17.05 |
| Upward reserve activated (MWh) | 2.56 | 3.33 | 6.15 |
| Downward reserve activated (MWh) | 0.13 | 0.12 | 0.28 |
| Imbalances (MWh) | 14.79 | 2.26 | 2.84 |
| Curtailment (MWh) | 3.54 | 2.32 | 3.94 |
| Total Revenue (M€) | Strategy | ||
|---|---|---|---|
| S1 | S2 | S3 | |
| DAM | 64.22 | 64.22 | 64.22 |
| IDA | −23.69 | −13.50 | −13.66 |
| IDC | - | −6.99 | −10.30 |
| Upward Capacity | 3.63 | 3.63 | 6.10 |
| Downward Capacity | 1.81 | 1.81 | 3.05 |
| Balancing Energy | 1.66 | 2.20 | 4.32 |
| Positive Imbalance Cost | 3.24 | 0.43 | 0.65 |
| Negative Imbalance Cost | -5.88 | -0.88 | -0.90 |
Disclaimer/Publisher’s Note: The statements, opinions and data contained in all publications are solely those of the individual author(s) and contributor(s) and not of MDPI and/or the editor(s). MDPI and/or the editor(s) disclaim responsibility for any injury to people or property resulting from any ideas, methods, instructions or products referred to in the content. |
© 2025 by the authors. Licensee MDPI, Basel, Switzerland. This article is an open access article distributed under the terms and conditions of the Creative Commons Attribution (CC BY) license (https://creativecommons.org/licenses/by/4.0/).
Share and Cite
Sousa, V.; Algarvio, H. Strategic Bidding to Increase the Market Value of Variable Renewable Generators in Electricity Markets. Energies 2025, 18, 1586. https://doi.org/10.3390/en18071586
Sousa V, Algarvio H. Strategic Bidding to Increase the Market Value of Variable Renewable Generators in Electricity Markets. Energies. 2025; 18(7):1586. https://doi.org/10.3390/en18071586
Chicago/Turabian StyleSousa, Vivian, and Hugo Algarvio. 2025. "Strategic Bidding to Increase the Market Value of Variable Renewable Generators in Electricity Markets" Energies 18, no. 7: 1586. https://doi.org/10.3390/en18071586
APA StyleSousa, V., & Algarvio, H. (2025). Strategic Bidding to Increase the Market Value of Variable Renewable Generators in Electricity Markets. Energies, 18(7), 1586. https://doi.org/10.3390/en18071586