Article

Thermoelectric Energy Harvesting with a Stacked Configuration Using Porous Medium for Marine Applications

Department of Mechanical and Automotive Engineering, Seoul National University of Science and Technology, 232 Gongneung-ro, Nowon-gu, Seoul 01811, Republic of Korea
*
Author to whom correspondence should be addressed.
These authors contributed equally to this work.
Energies 2025, 18(6), 1551; https://doi.org/10.3390/en18061551
Submission received: 19 February 2025 / Revised: 12 March 2025 / Accepted: 17 March 2025 / Published: 20 March 2025
(This article belongs to the Section J: Thermal Management)

Abstract

:
This study proposes a vertically stacked thermoelectric generator (TEG) design to enhance output power per unit volume. While the proposed TEG achieved improved conversion efficiency, the high inertia of the exhaust gas leads to significant flow maldistribution across the channels, causing uneven thermal conditions on the TEM surfaces and reducing overall efficiency. To enhance waste heat recovery by improving flow uniformity in the exhaust gas channels, a perforated plate with porosity ranging from 0.15 to 0.75 was inserted. A multi-physics numerical model was developed to simulate the thermoelectric energy conversion phenomena, enabling for the accurate evaluation of both module- and system-wise performance. The insertion of the perforated plate with 0.45 porosity provided the most uniform flow distribution with only a 5% flow rate difference between the exhaust gas channels. This resulted in a system-level output power of 167.1 W, which is ~7% higher than the case without the perforated plate, along with electrical efficiency of 91.1% and conversion efficiency of 3.41%. Moreover, enhanced flow uniformity led to an improved volumetric power density of 20.8 kW/m3. When accounting for pumping losses, the perforated plate with 0.6 porosity maximized net output power, demonstrating how optimized flow distribution significantly enhances energy harvesting performance.

1. Introduction

The global marine industry contributes an estimated 1.1 to 3.7 billion tons of greenhouse gas (GHG) emissions annually, representing approximately 2.89% of total global emissions. To mitigate this, the International Maritime Organization (IMO) has reinforced regulations targeting a 50% reduction in GHG emissions by 2050 compared to 2008 levels [1]. In response to these stringent regulations, waste heat recovery systems are emerging as an effective solution to harness the unused thermal energy produced by the main engine of the ship [2]. Among these technologies, thermoelectric generators (TEGs) offer a promising solution for marine waste heat recovery applications, providing key benefits such as vibration-free operation, high durability, and reliable performance. TEGs also contribute to fuel efficiency improvement and reduced exhaust emissions, directly addressing the need for more sustainable solutions in the maritime industry. Furthermore, TEGs offer scalability, enabling tailored system designs that meet specific application needs, which is particularly beneficial for large-scale applications such as marine engines [3], power plants [4], and metal casting [5], where traditional heat recovery technologies often face spatial constraints.
Non-uniform temperature distribution or localized overheating in certain thermoelectric modules (TEMs) can lead to significant temperature differences, ultimately degrading system-level output power and energy conversion efficiency in a TEG. To mitigate this issue, various layout optimization strategies have been investigated, including fin structure optimization [6], converging channel designs [7], and heat pipe integration [8], to minimize temperature deviations between TEMs. In this regard, recent studies have increasingly focused on the design of the TEG layout for large-scale applications. Xie et al. [9] experimentally investigated a modular TEG system consisting of 32 modular TEG units, each integrating 24 Bi2Te3-based TEMs arranged in a four-layer structure with five heat exchangers in a counter-flow configuration to mitigate temperature deviations. Furthermore, this study introduced a novel manifold configuration that improves temperature uniformity across the TEG modules, thereby optimizing heat distribution for enhanced energy conversion. The optimized configuration achieved a maximum power output power 1043.9 W with a volumetric power density of 10.21 kW/m3. Since the study primarily focuses on system-level performance evaluation, detailed analyses of flow and module-level temperature uniformity were not addressed. Analytical studies have been widely explored, as they enable the evaluation of the system under various boundary conditions, including the TEG domain, thermal resistance, and inlet conditions. Zhu et al. [10] conducted a numerical study on a stepped-configuration TEG consisting of four layers of exhaust gas channel and three layers of coolant channels to achieve a compact system design. This study developed a transient finite volume method numerical model considering a non-uniform temperature distribution to analyze the effects of the high-to-low temperature module area ratio, spatial location, time, input temperature, and mass flow rate on temperature uniformity and performance. The proposed configuration demonstrated a 32.3% increase in power output and a 15.5% improvement in efficiency compared to the conventional TEG configuration. Georgopoulou et al. [11] numerically investigated a modular, dynamic, and spatially distributed TEG model for marine applications aiming to evaluate the potential of low-grade waste heat recovery onboard ships. The model incorporates a detailed thermodynamic and thermoelectric framework, analyzing two marine case studies to identify optimal designs for improving thermal uniformity and conversion efficiency: (1) a scavenge air cooler and (2) an auxiliary engine exhaust gas duct. A parametric analysis was conducted using a process modeling and simulation approach, employing partial differential algebraic equations to predict system behavior under transient and steady-state conditions. The optimized TEG system demonstrated significant performance improvements, achieving up to 52 kW of power output from a scavenge air cooler and approximately 1 kW from an auxiliary engine exhaust duct, emphasizing the role of temperature distribution optimization in enhancing energy harvesting efficiency. Analytical studies based on mathematical models are well suited for parametric analyses; however, they have limitations in capturing internal three-dimensional flow characteristics and complex physical phenomena, such as flow distribution, recirculation, and associated heat transfer behaviors. Therefore, computational fluid dynamics (CFD) analysis is necessary to account for these effects accurately.
To effectively address the non-uniform flow challenges, CFD has emerged as a key tool for evaluating temperature and flow fields in detail. This technique enables precise simulations within TEGs, which are crucial for optimizing system performance. Sheikh et al. [12] numerically analyzed the impact of baffle distribution in the exhaust gas channel on the efficiency of a TEG. The baffle arrangements were optimized to enhance heat transfer performance while maintaining the pressure drop within an acceptable range. They found that a configuration with front-section baffles at a 50° angle and a middle-section baffle height of 8.46 mm achieved the highest power output of 248 W, which was significantly higher than that of other designs. Yang et al. [13] experimentally and numerically investigated the effects of axial gradient metal foam in TEGs to optimize heat transfer and flow characteristics. Their study aimed to enhance TEG performance by adjusting the pore density along the flow direction to balance heat transfer efficiency and pressure drop. The results demonstrated that a positive gradient configuration with a 5-10-20 PPI (number of pores per inch) pore distribution achieved a net power of 118.3 W, representing a 12.5% improvement over the uniform 20 PPI metal foam structure. Jun et al. [14] employed a numerical approach to examine the impact of a porous medium on the velocity and pressure distribution within the flow field of the exhaust gas channel. The study performed an in-depth analysis of the flow field characteristics using CFD, revealing that regions with high velocity or turbulence have a substantial impact on pressure distribution, particularly near porous areas. The results suggested that structural factors, such as the length and position of the porous media, should be optimized to mitigate turbulent flow and excessive velocity fluctuations, which could lead to pressure losses. In addition to these flow field studies, research is also being conducted on the multi-relaxation time lattice Boltzmann method [15] and the local thermal non-equilibrium method [16] to better simulate heat transfer in porous media. On the other hand, experimental studies have demonstrated that porous media are highly effective in optimizing flow distribution. Negash et al. [17] conducted an experimental investigation to determine the optimal placement of a flow straightener in an exhaust gas channel for TEG applications. The results showed that positioning the flow straightener near the exhaust inlet negatively impacted efficiency, whereas placing it further downstream improved both net power output and energy conversion efficiency. These findings highlight the importance of strategic flow straightener placement in optimizing TEG performance. Most of the existing designs for flow distribution in TEGs have been applied to more compact systems, such as those in automotive applications. In this regard, these designs may suffer from significant system performance degradation for large-scale applications due to a higher pressure drop with increased flow rates. Therefore, it is crucial to strategically select the appropriate flow distribution method, considering both flow distribution and flow resistance, to optimize overall system performance.
As described in the literature above, temperature and flow non-uniformity in TEGs significantly affect system performance. However, most studies for a large-scale TEG have been limited to theoretical investigations. To fill this gap, the present study proposes a stacked TEG system integrating 90 TEMs, specifically designed for marine applications. The stacked TEG was configured with three exhaust gas channels and four coolant channels, with the TEMs layers sandwiched between them. To optimize flow distribution and mitigate the concentration of exhaust gas flow at the center channel due to the inertia of gas, a perforated plate was inserted at the inlet of the center exhaust gas channel. Furthermore, to enhance the accuracy of the numerical model in simulating thermoelectric energy conversion, a multi-physics model was developed to reflect the heat pumping and Joule heating phenomena occurring during the energy conversion process. The effectiveness of the proposed system was comprehensively evaluated through system-level and module-level performance analysis based on temperature and flow fields obtained through CFD simulations. The insertion of a perforated plate with a porosity of 0.6 significantly improved the flow uniformity between exhaust gas channels, optimizing the distribution of thermal energy. This improvement in flow distribution mitigated the uneven thermal conditions across the system, thereby enhancing the overall efficiency of the TEG and increasing the net output power.

2. Numerical Method and Procedure

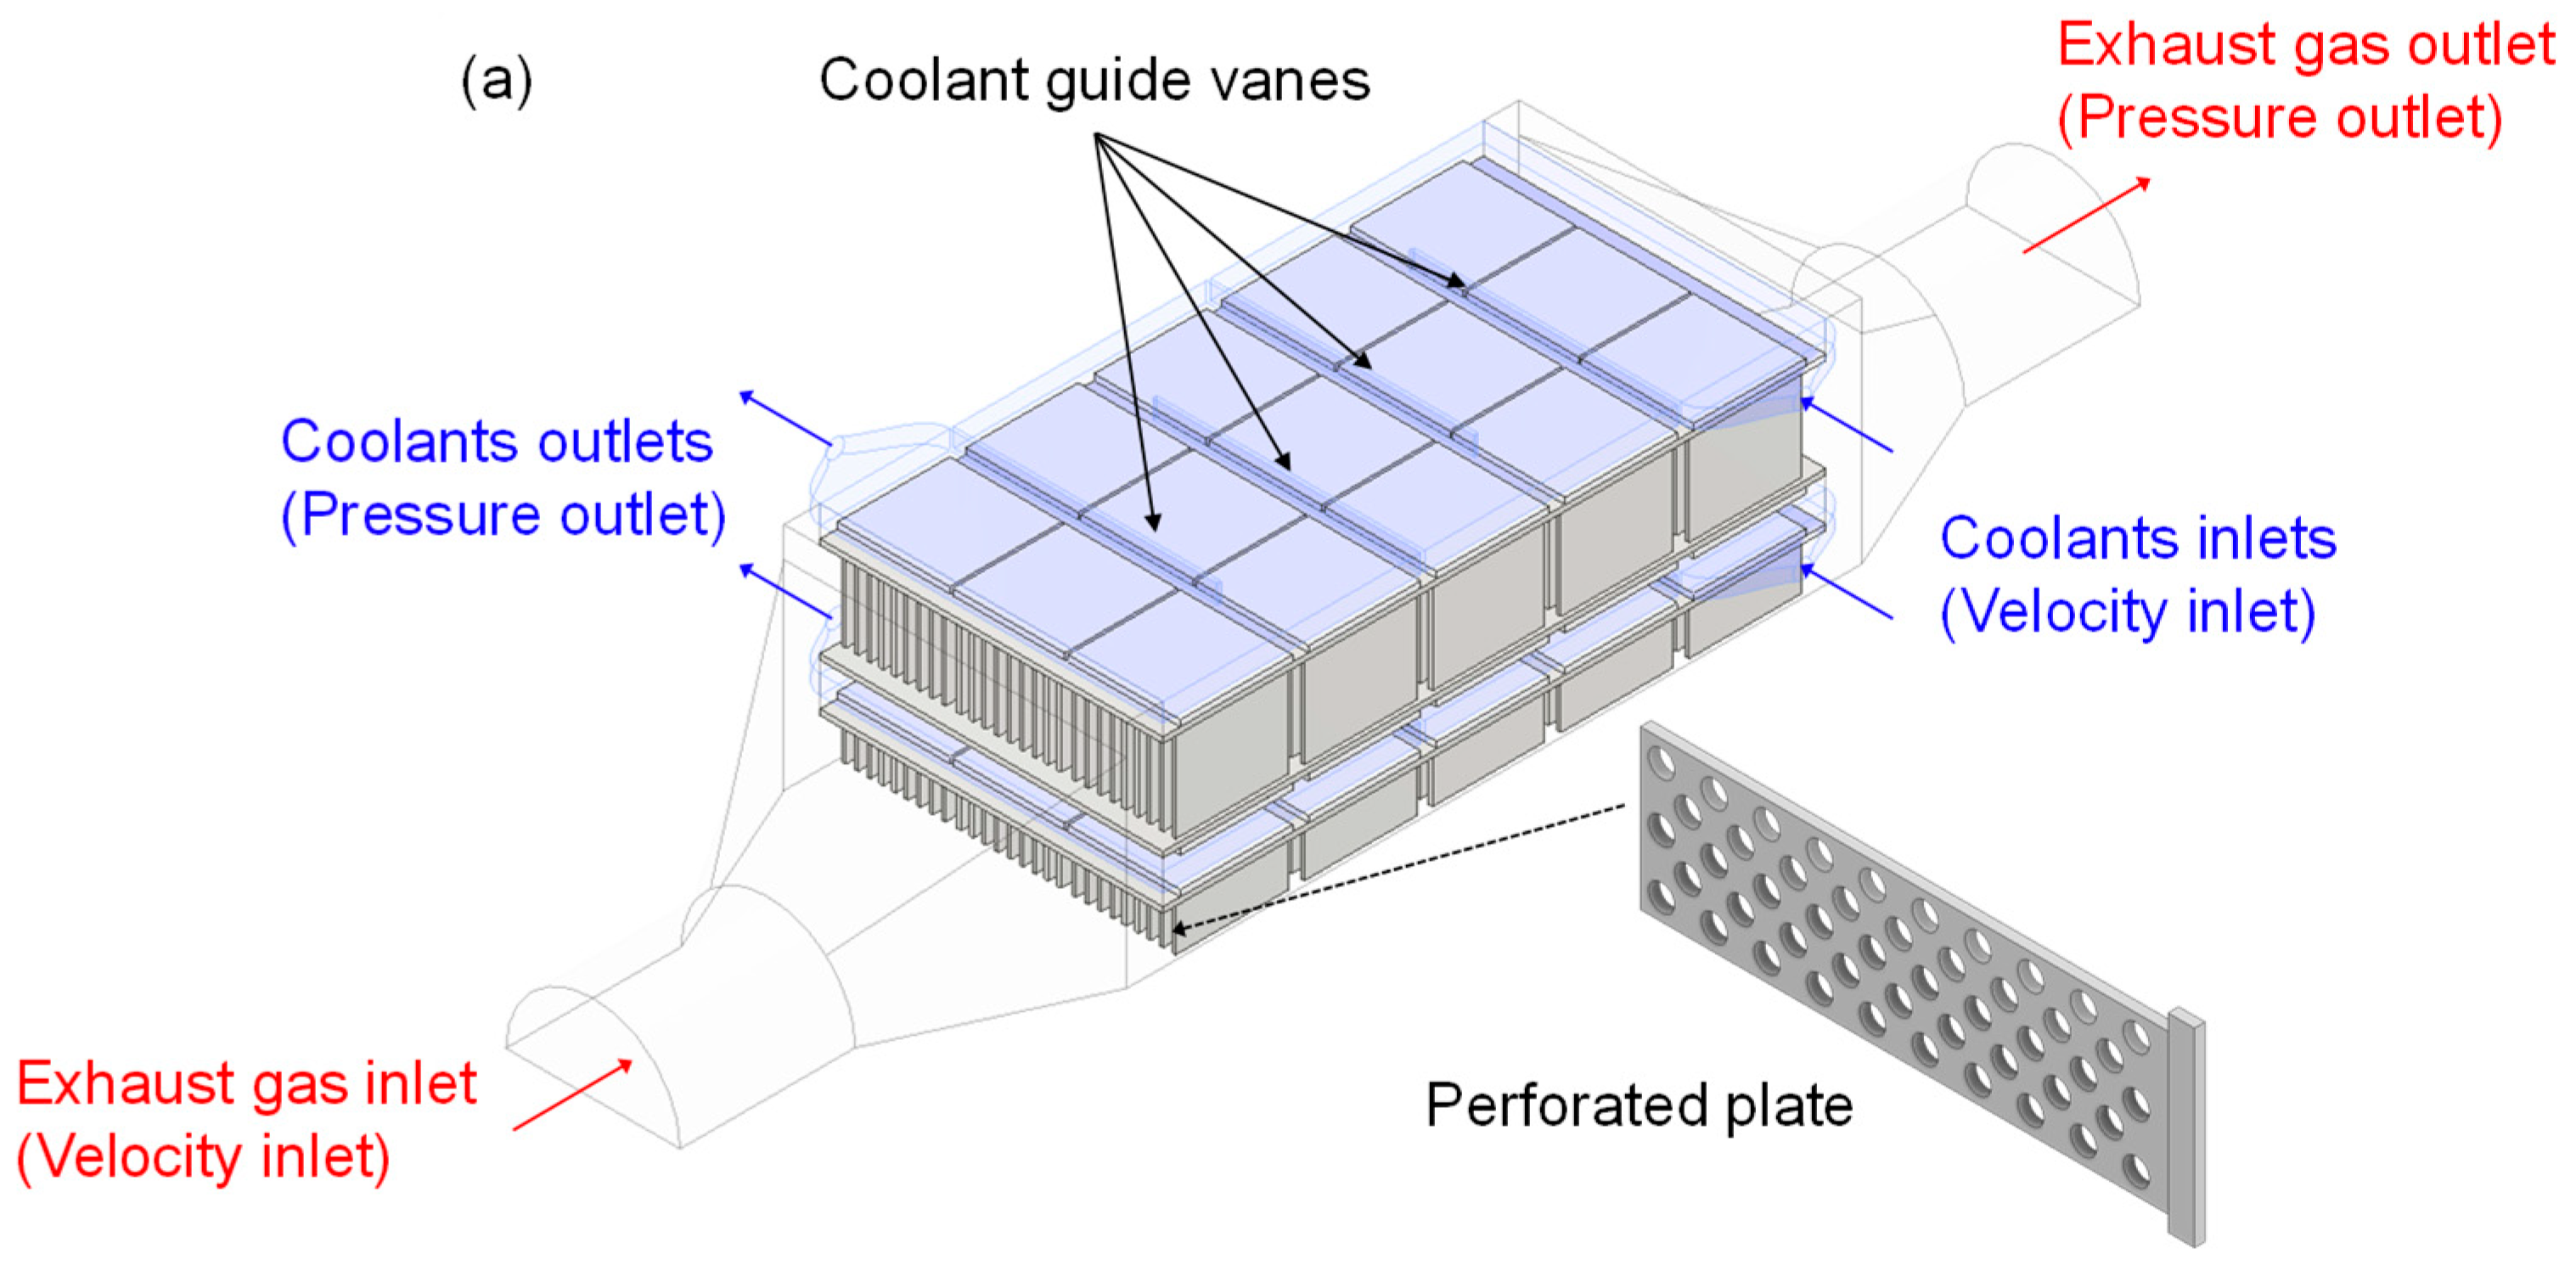
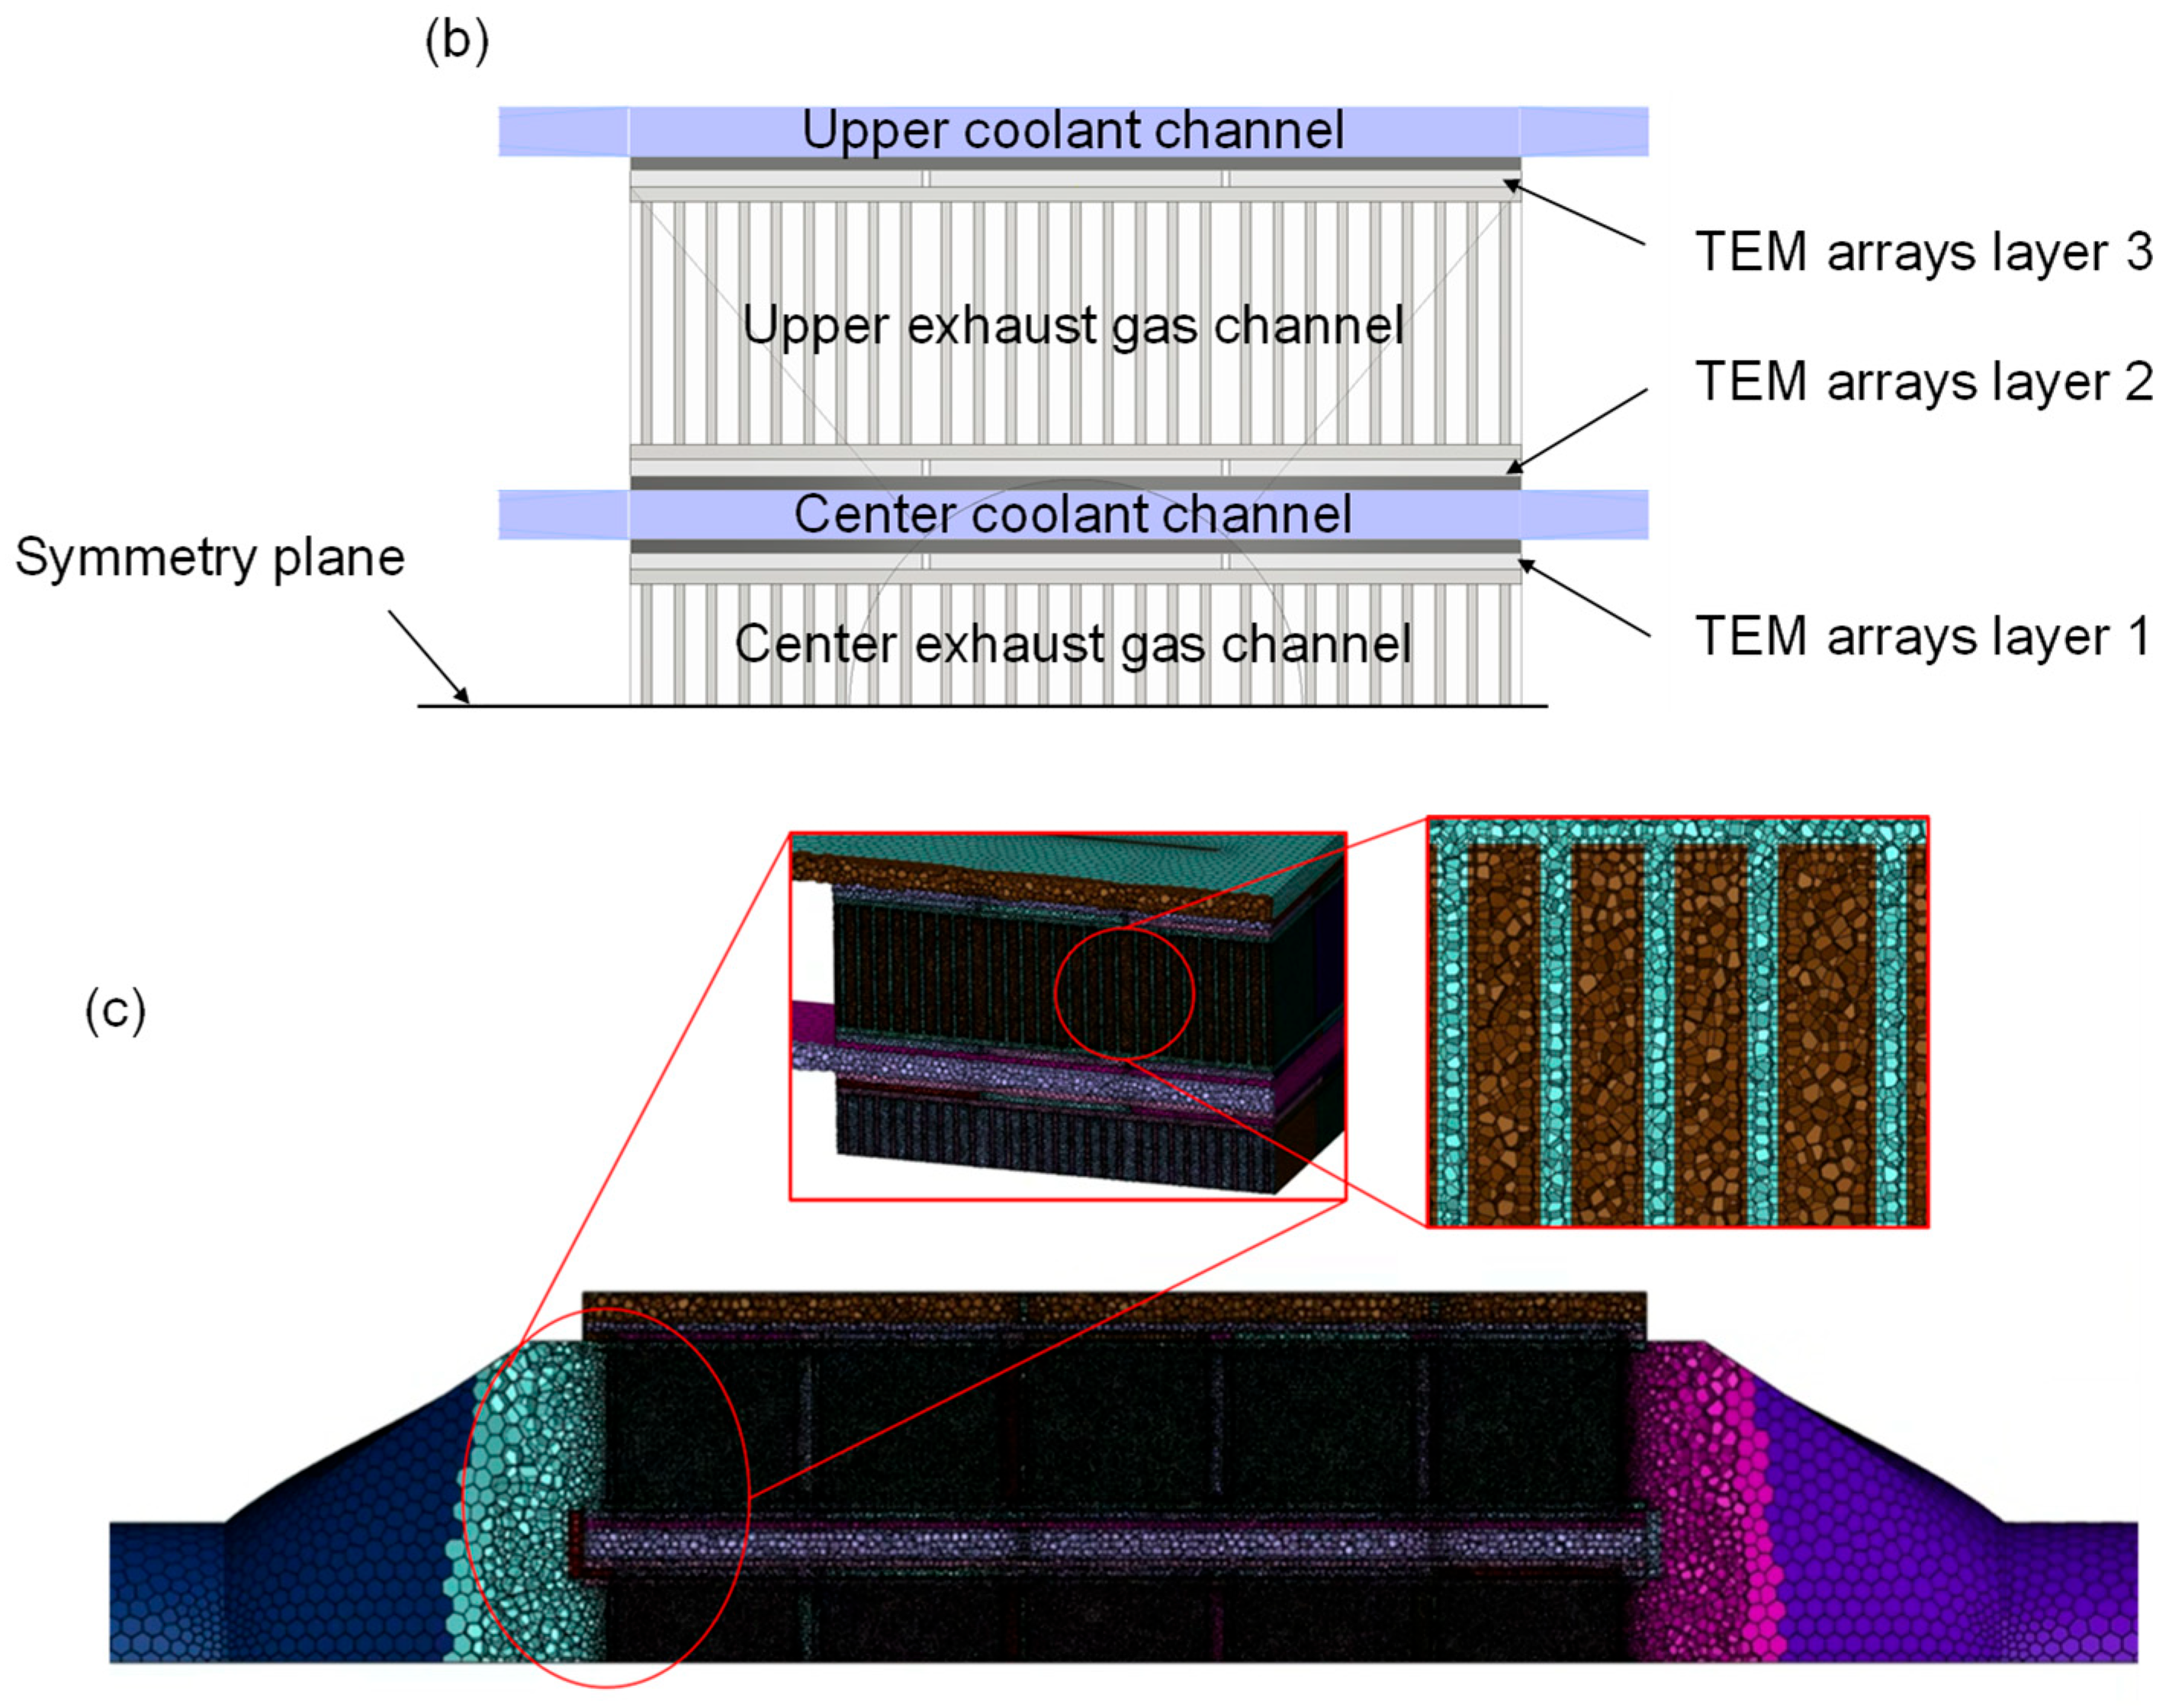
2.1. Numerical Model of the Stacked TEG

Figure 1 shows a numerical model designed for waste heat recovery from a vessel engine. The TEG system features a vertically stacked configuration, with three exhaust gas channels intersecting with four coolant channels. A total of 90 TEMs, arranged in a 5 × 3 array, are sandwiched between the exhaust gas and coolant channels, forming the hot and cold sides of the TEMs. The TEMs were structured as modules containing 391 Bi2Te3 p-n couples connected in series, each with dimensions of 60 mm (W) × 60 mm (L) × 3.3 mm (H). The properties of a p-n couple, including the Seebeck coefficient, electrical resistivity, and thermal conductivity, were experimentally obtained to be 400 μV/K, 1.6 mΩ·cm, and 1.5 W/m·K, respectively. In the exhaust gas channel, plate-fin heat sinks were attached to the hot side of each TEM to enhance heat transfer from exhaust gas. The nine plate fins, each 2 mm thick, were equally spaced at an interval of 4.65 mm, an optimized geometry designed to minimize thermal resistance while meeting the pressure drop criterion for the internal combustion engine. A 2.4 mm thick porous region was modeled in front of the heat sink at the forward end of the center exhaust gas channel to analyze the effect of inserting a perforated plate. To ensure that the cold side of the TEMs remained at low temperature, a serpentine coolant path was implemented within the coolant channels. Given the vertical symmetry along the midplane of the center exhaust gas channel, only the upper half of the TEG was included in the numerical domain for the simulations.
The boundary condition for inlet velocity and pressure outlet were assigned to the exhaust gas and coolant channel’s inlet and outlet (Table 1). The exhaust inlet velocity and temperature were set to 20 m/s and 563 K, respectively, based on the use of 10% of the marine engine exhaust gas. The properties of air were used to approximate the exhaust gas, as the error remained within 2% when air properties were modeled as a function of temperature [18]. The coolant channel at the top of the center exhaust gas channel was set to a flow rate of 1.9 m/s (8 LPM) and 293 K, based on the coolant conditions used in a previous model for automotive application [19]. In contrast, the coolant channel at the top of the upper exhaust gas channel was assigned with a flow rate of 0.095 m/s, and 293 K, which is half of the conventional flow rate, as it cools only a single layer of the TEM arrays. As the simulation domain only included the upper section of the TEG system, symmetric boundary conditions were applied to the midplane of the center exhaust gas channel.

2.2. Porous Media Method

In a stacked TEG system, the exhaust gas discharged from a narrow inlet predominantly flows through the center exhaust gas channel, leading to a non-uniform flow distribution. To improve flow uniformity, a perforated plate was strategically placed in front of the center exhaust gas channel. Due to the small perforations in the perforated plate, a significant pressure drop occurs across the plate. Additionally, since the perforated plate is in contact with the heat sink fins, the porosity between the plate fin and the perforated plate also changes abruptly. These variations can degrade the numerical model’s convergence reliability and predictive accuracy. To address this issue, this study employed the porous media method, which models the perforated plate as a simplified structure with equivalent flow resistance [20]. In ANSYS Fluent 2022 R1, the pressure drop caused by the porous media is incorporated as an additional source term in the momentum equation. For a given superficial velocity U, the source term and the pressure drop across the perforated plate can be expressed as follows:
S = μ α U + β 1 2 ρ U U
Δ p = μ t α U + β t 1 2 ρ U U
where μ, α, β, ρ, and t represent viscosity, permeability, inertial resistance, fluid density, and the thickness of perforated plate, respectively.
Typically, the resistance in porous media consists of viscous resistance and inertial resistance. However, in this study, the exhaust gas in marine applications exhibited high velocity, making the contribution of viscous resistance negligible compared to inertial resistance. Consequently, the pressure drop can be primarily defined by the inertial resistance term, which can be expressed as
Δ p = β t 1 2 ρ U 2
In this study, the perforation size of the perforated plate was fixed at 0.5 mm, while the porosity was varied from 0.15 to 0.75. The inertial resistances for each perforated plate, determined based on its perforation size and porosity, were obtained using correlation equation from our previous study [21]. The calculated inertial resistances are summarized in Table 2.

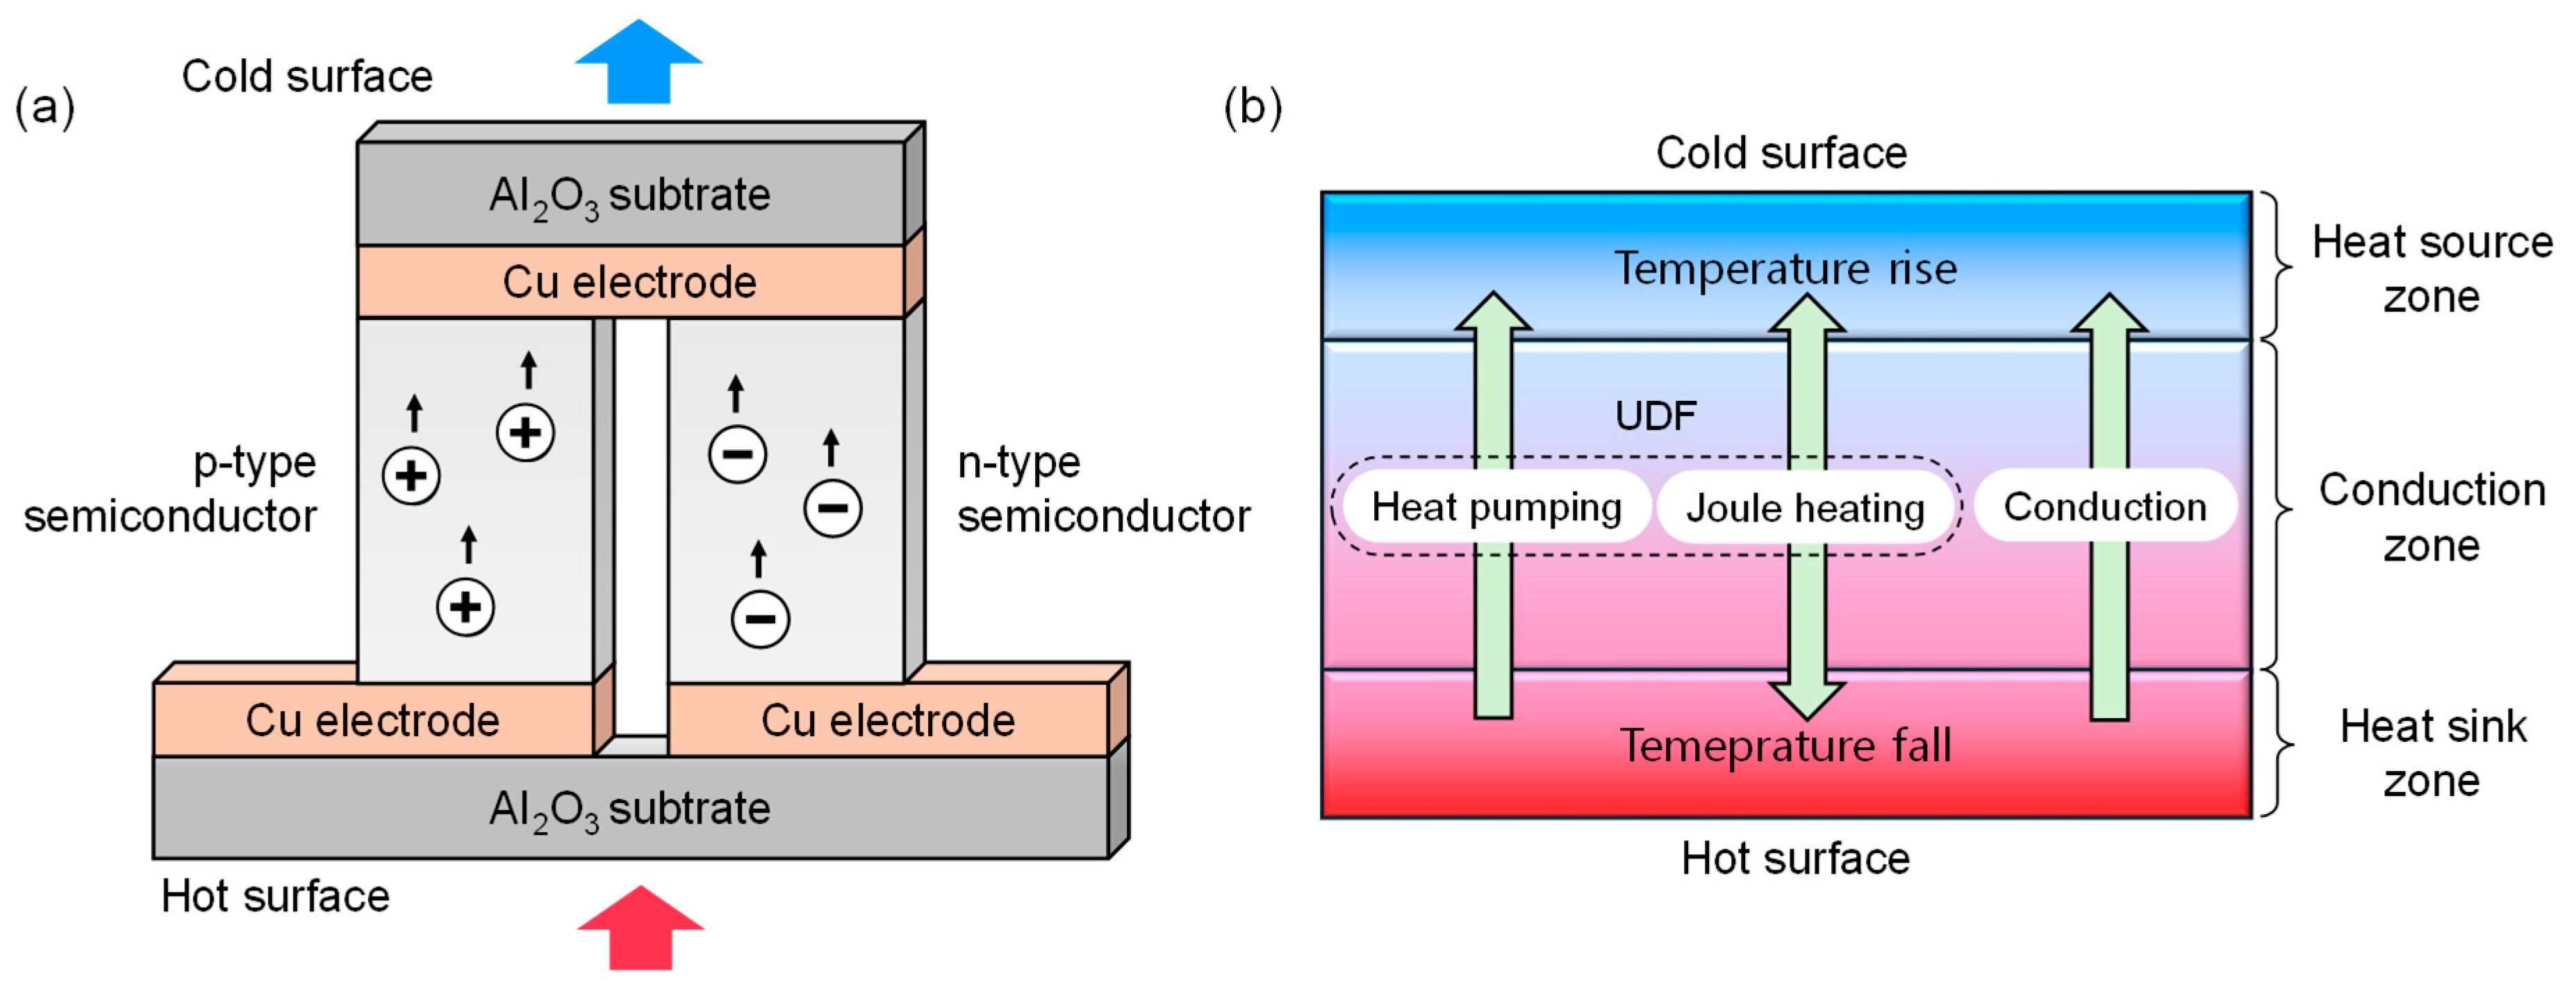
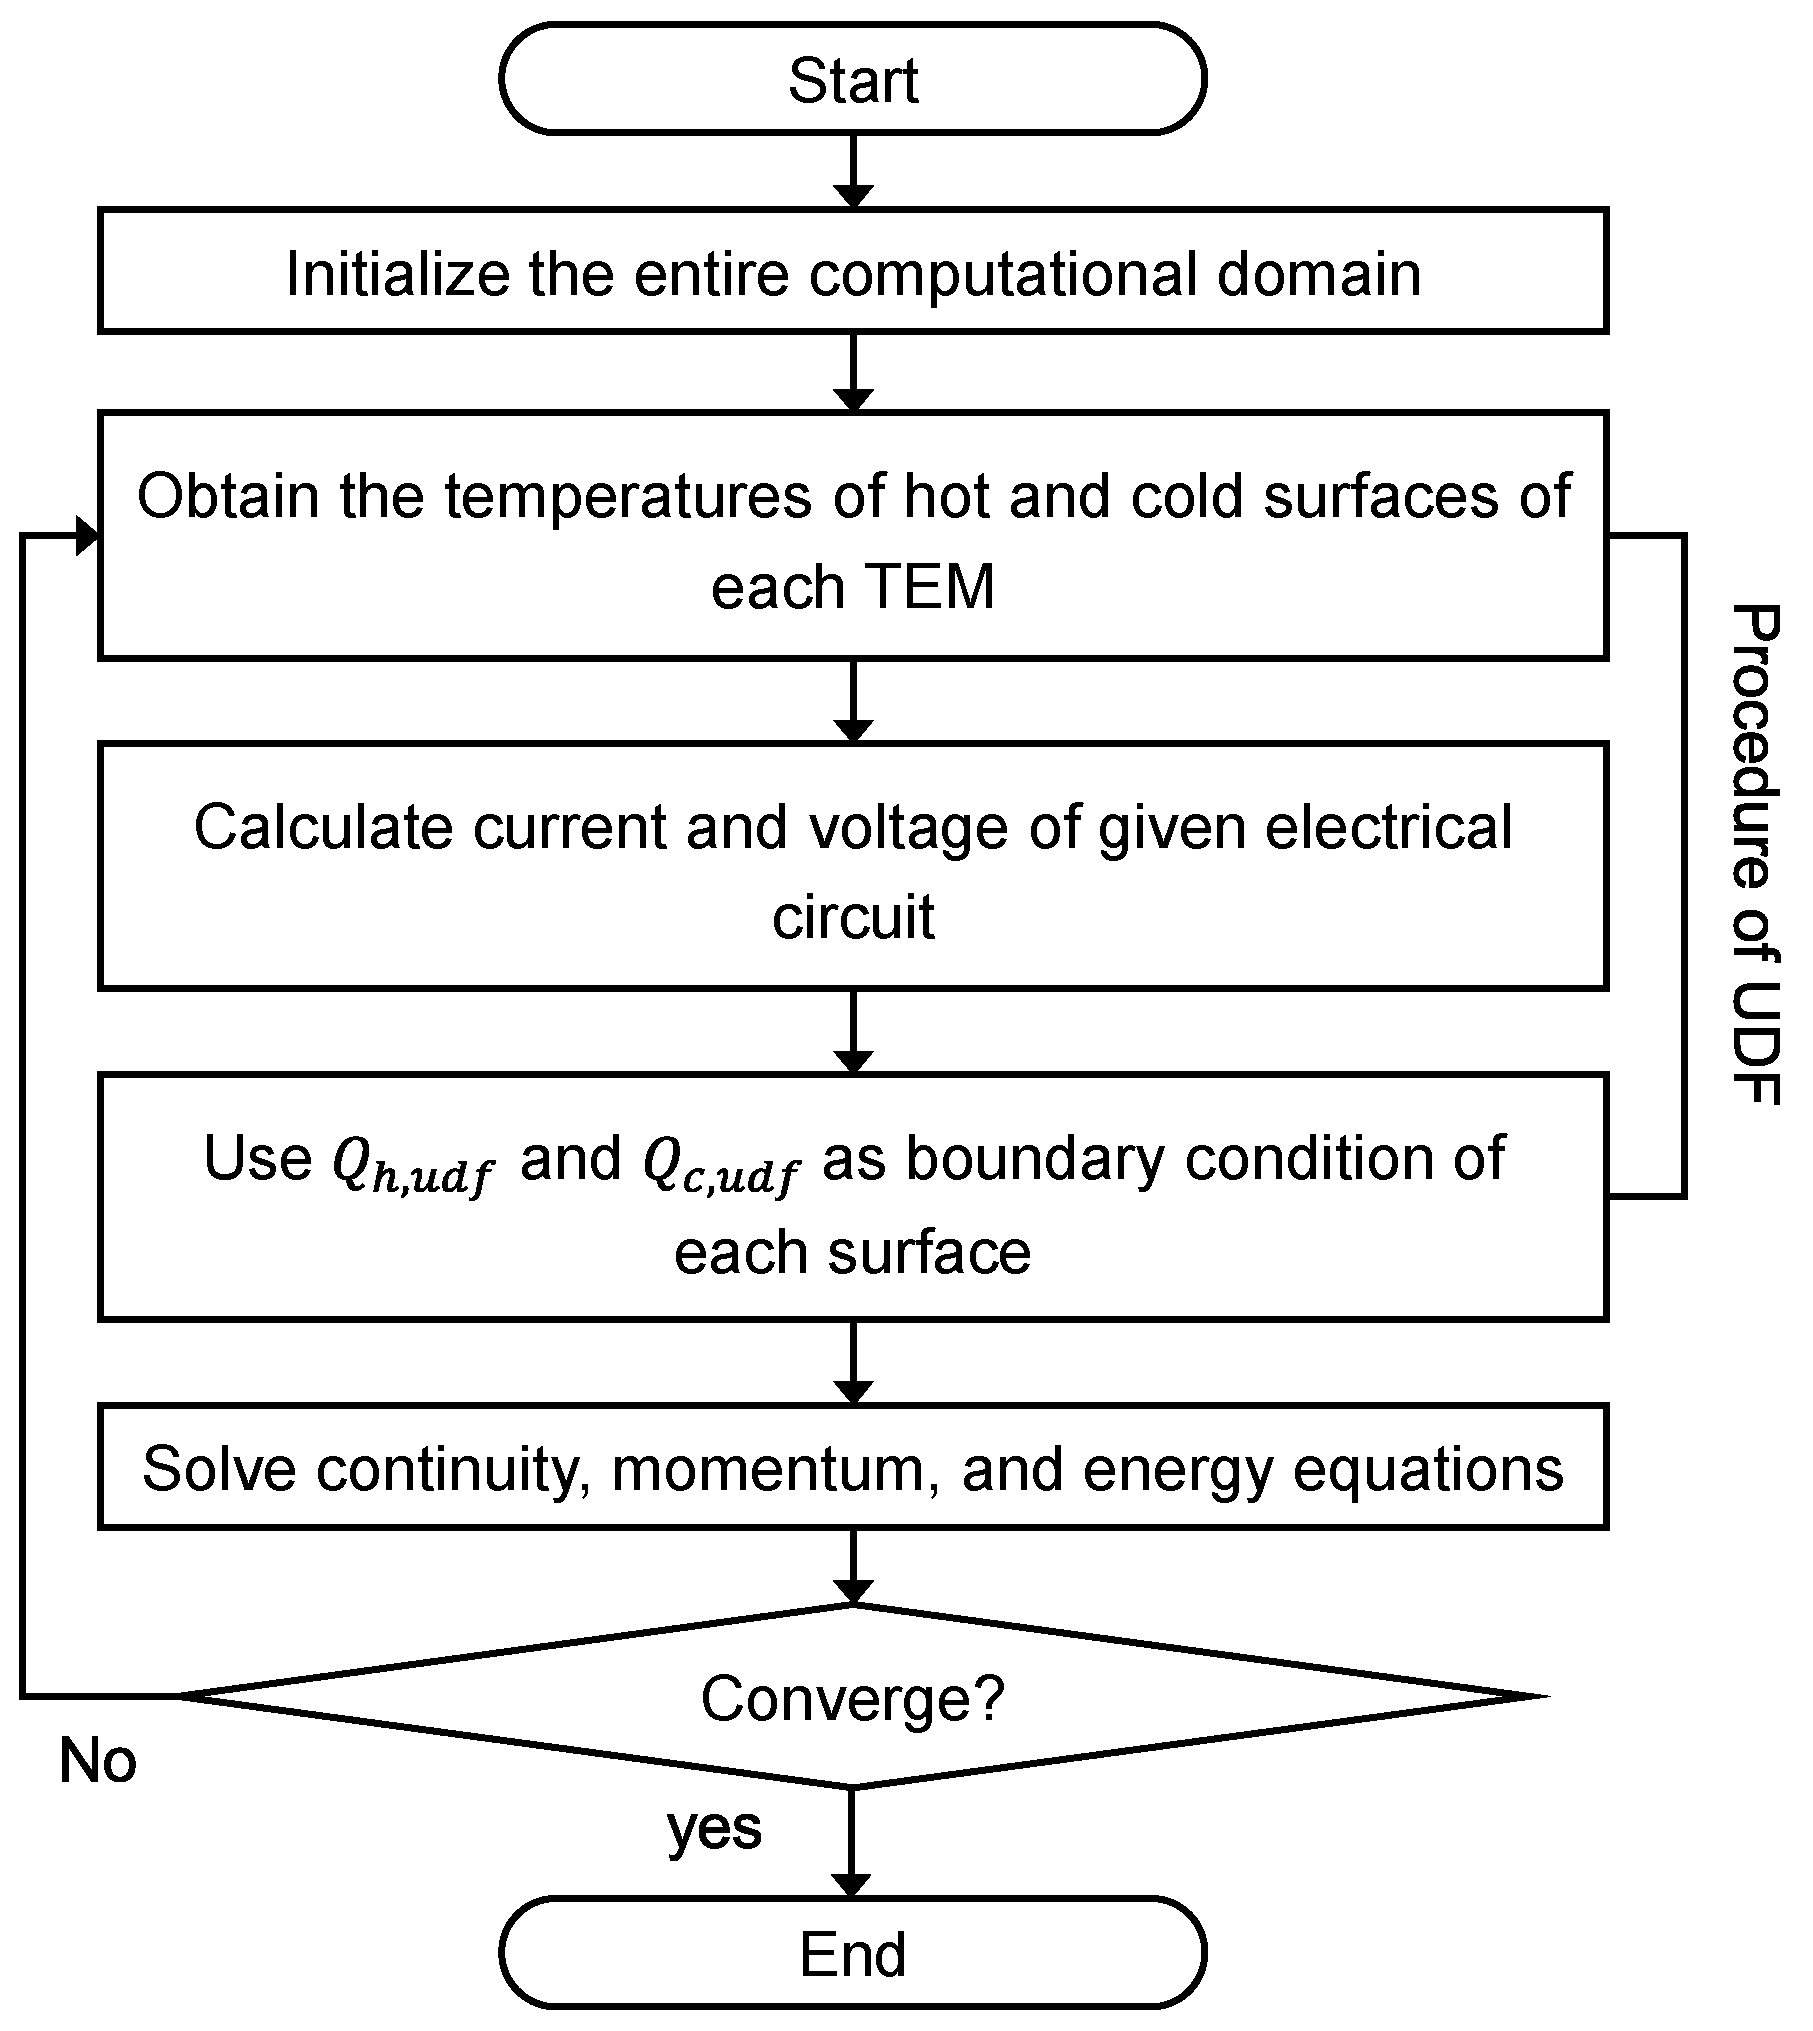
2.3. Numerical Method for Reflecting Multi-Physics Phenomena

When a TEM experiences a temperature difference between its two ends, charge carriers (electrons in n-type semiconductors and holes in p-type semiconductors) migrate accordingly, generating an electric potential difference. The driving force for the formation of this electric potential difference is the Seebeck effect, where the temperature gradient induces the movement of charge carriers. Upon electrically connecting the TEMs, current flows through the electric circuit. In this process, the electrons and holes facilitate heat pumping, where heat is extracted from the hot side and transferred to the cold side as shown in Figure 2a. Furthermore, as the charge carriers move through the material, they cause Joule heating due to the electrical resistance. The heat transfer rates due to heat absorption at the hot side and heat rejection at the cold side are expressed by Equations (4) and (5), respectively.
Q h = α I T h + K Δ T 1 2 I 2 R
Q c = α I T c + K Δ T + 1 2 I 2 R
where α, I, T, K, and R represent the Seebeck coefficient, current, temperature, thermal conductance, and electrical resistance, respectively. Conventional governing equations typically do not account for these thermoelectric phenomena; therefore, the three-zone numerical modeling method, developed in a previous study [22], was incorporated to reflect the multi-physics phenomena in the TEMs. The three-zone modeling method models the heat transfer rates due to heat pumping and Joule heating by excluding the conduction term, specifically the second term on the right-hand side of Equations (4) and (5), which are expressed as Equations (6) and (7), respectively.
Q h , u d f = α I T h 1 2 I 2 R
Q c , u d f = α I T c + 1 2 I 2 R
These phenomena were simulated by imposing boundary conditions on the heat source and heat sink zones through a user-defined function (UDF) in a 1 mm region at both ends of the TEM, as shown in Figure 2b.

2.4. Computational Process and Mesh Independent Test

Figure 3 illustrates the computational process used in this numerical study. First, initial values are provided to the numerical model. Then, the open-circuit voltage for each TEM is calculated based on the given temperature fields and the Seebeck effect. With the use of Kirchhoff’s current and voltage laws, the current flowing through each TEM is calculated in the electric circuit. The heat absorption and heat rejection rates for heat source and heat sink zones are calculated using Equations (6) and (7), incorporating the temperature fields, current, and material properties. Then, the fluid flow and heat transfer phenomena within the TEG were determined by solving the continuity, momentum, and energy equations, which are expressed as
· ρ u = 0
· ρ u u = P + μ 2 u + ρ g
· C p ρ u T = k 2 T
For the turbulence model, the realizable kε model was chosen due to its established reliability and accuracy in representing turbulent flow characteristics across various flow conditions. The convergence criteria were set at 10−4 for the continuity, momentum, turbulent kinetic energy, and turbulent dissipation rate, and 10−8 for the energy, following best practices in thermoelectric CFD simulations [23]. In addition to the residuals, key performance indicators such as output power and pressure drop were monitored to ensure steady-state convergence. Once the calculations converge, the system performance characteristics, including module- and system-level output power, conversion efficiency, pumping power, and net output power, were obtained from the numerical results. The numerical simulations were performed using ANSYS Fluent 2022 R1 on a workstation equipped with an AMD Ryzen Threadripper PRO 5975WX CPU (32 cores, 64 threads), sourced from AMD (Santa Clara, CA, USA). The simulations utilized parallel processing with 16 cores to accelerate convergence.
Due to the large-scale system configuration of the present numerical model, a polyhedral mesh was employed to reduce the number of meshes while maintaining high grid quality for computational accuracy. In this analysis, primary focus was placed on improving the prediction accuracy of heat transfer and pressure drop within the exhaust gas channel. To achieve this, the element sizes between the heat sink fins were adjusted to 0.6, 0.8, 1.0, 1.2, and 1.4 mm. Simultaneously, the global number of meshes were increased by a factor of 1.5 to 2, starting from 2 million cells, to examine the trends in output power and pressure drop, as shown in Figure 4. A grid convergence index (GCI) analysis was conducted to assess the variations in output power and pressure drop, as detailed in the preceding step, with the results summarized in Table 3. The results of the grid independence study demonstrated that the pressure drop for 6 million meshes differs by ~3.2% compared to the case with 9 million meshes. However, when the number of meshes increased from 9 million to 18 million, the differences in both pressure drop and output power were only 0.2%; thus, 9 million meshes were selected for the present study.
In building on our previously validated numerical study [21], the discrepancies between the numerical and experimental results for output power and pressure drop were within 3.7% and 4.9%, respectively. With these findings, the uncertainty in the net output power was calculated to be 6.1% using error propagation analysis.

3. Results and Discussion

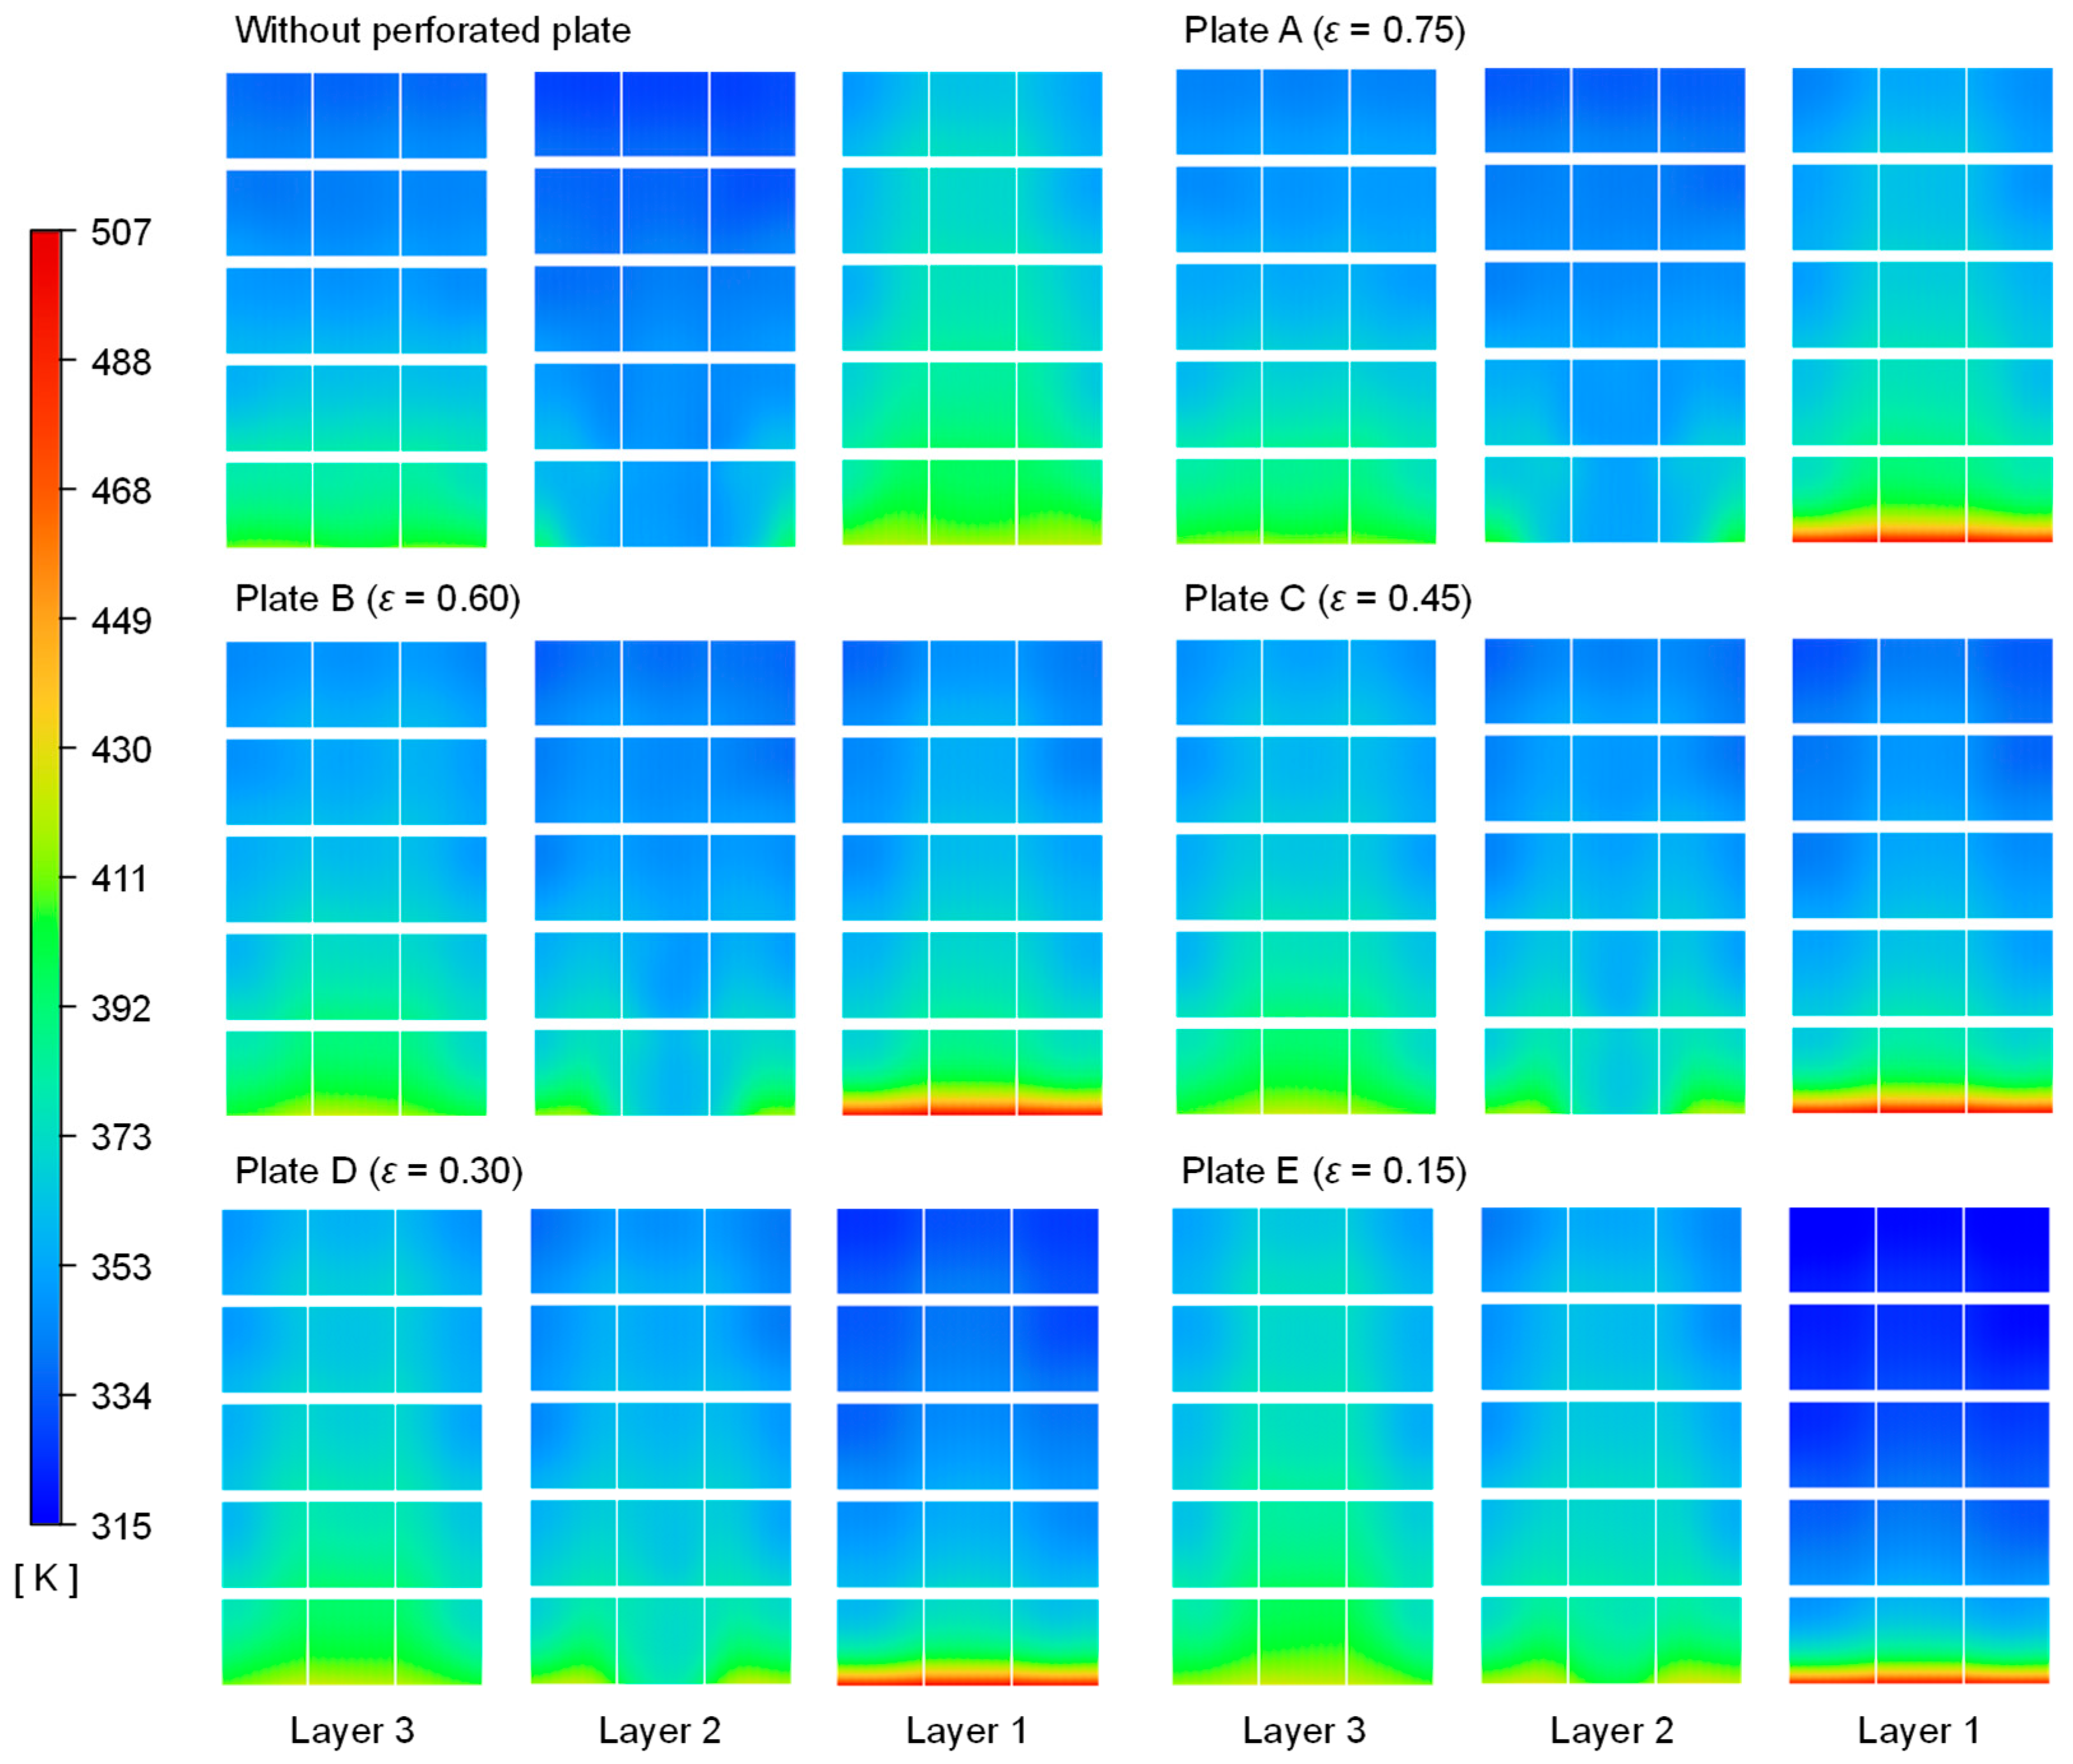
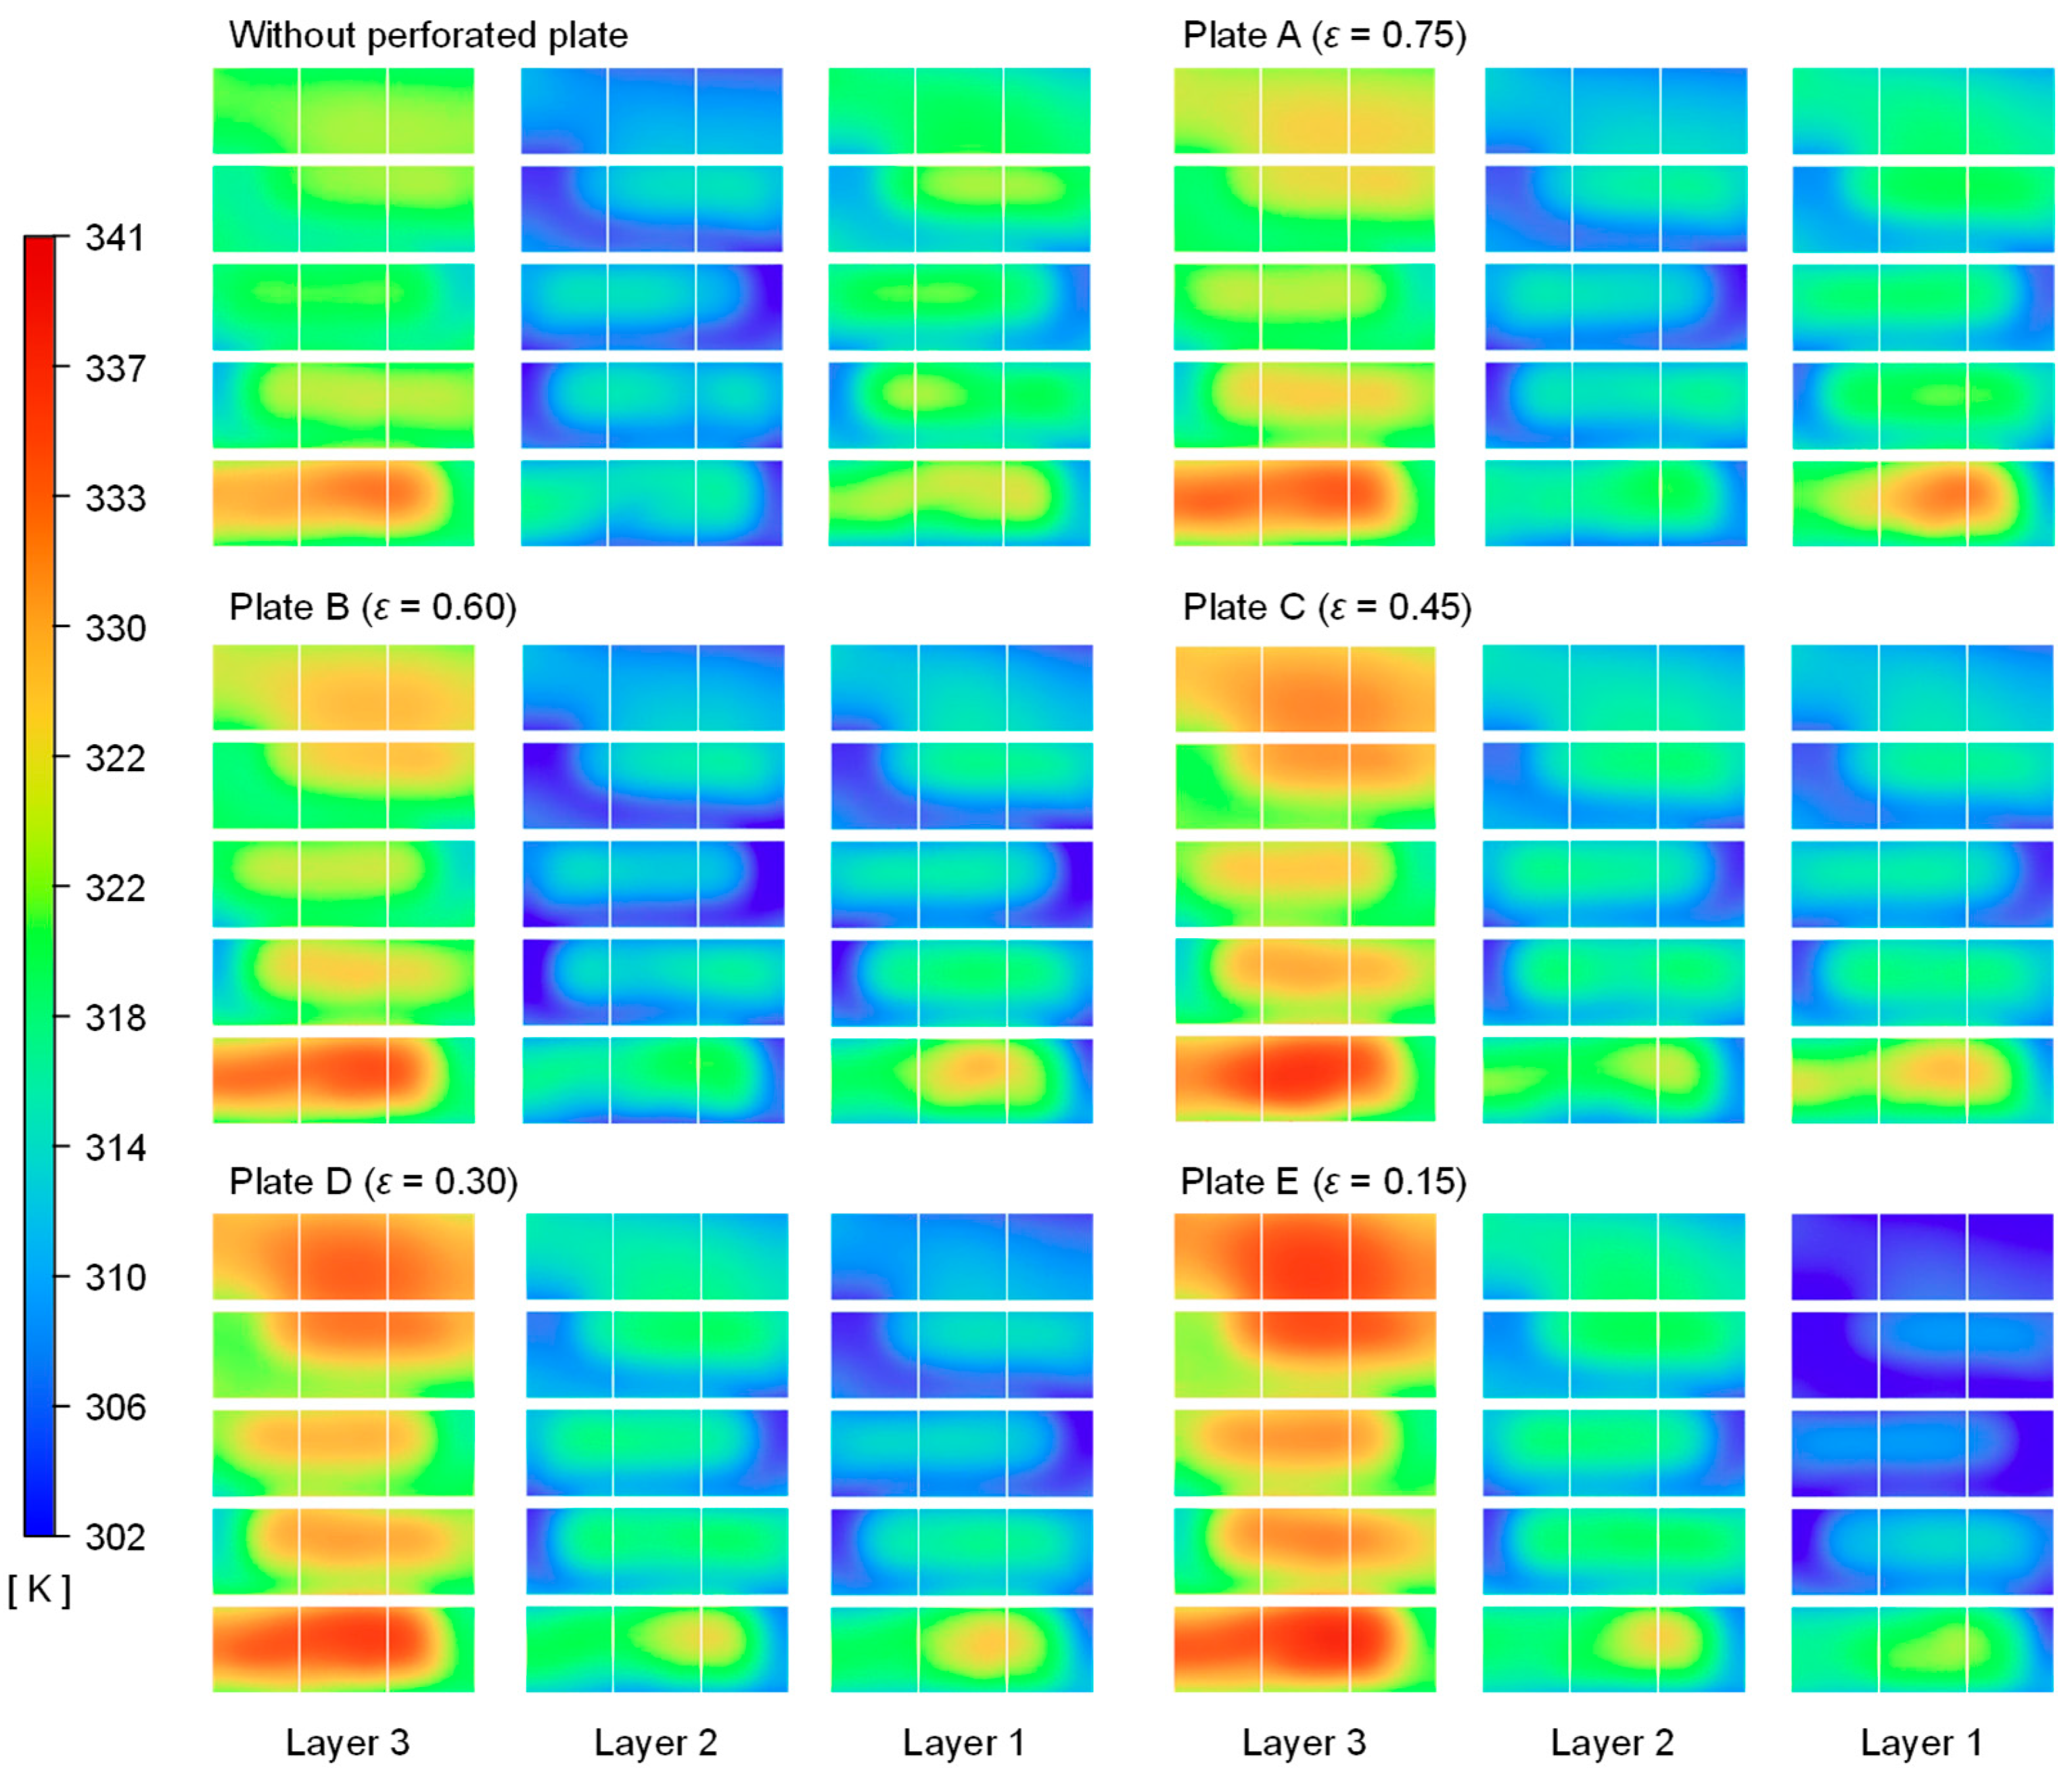
3.1. Velocity and Temperature Field Analysis

Figure 5 shows the x-velocity contour maps and pathlines of the exhaust gas channel according to the porosity of the perforated plate. As shown in Figure 5a, in the absence of a perforated plate, the exhaust gas exhibits a velocity field concentrated at the center exhaust gas channel. This phenomenon occurs due to the high inertia of the exhaust gas and the abrupt expansion as it flows from the exhaust tailpipe into the TEG exhaust gas channel. Consequently, a significantly larger portion of the exhaust gas flows through the center exhaust gas channel compared to the upper exhaust gas channel, resulting in a highly non-uniform flow distribution. Notably, in the lower region of the upper exhaust gas channel at the first and second row positions of the TEMs, reverse flow occurs, as indicated by the negative x-velocity values. The pathlines in Figure 5b further demonstrate that while the majority of the high-velocity fluid flows through the center exhaust gas channel, some of the fluid collides with the centrally located cooling channel and impinges on the upper region of the upper exhaust gas channel before continuing downstream. This impingement effect induces recirculation in the lower region of the first and second rows of the upper exhaust gas channel.
The insertion of a perforated plate into the exhaust gas channel induced significant changes in the velocity field. As the porosity of the perforated plate decreased, the pressure drop across the plate increased, gradually redistributing the flow from the center exhaust gas channel to the upper exhaust gas channel. Consequently, the region exhibiting reverse flow in the lower section of the upper exhaust gas channel progressively diminished. As shown in Figure 5b, the most uniform flow distribution was observed when the porosity of the perforated plate ranged from approximately 0.45 to 0.6. However, when the porosity was further reduced to 0.3, recirculation in the cone region increased, accompanied by a significant reduction in flow through the center exhaust gas channel. Therefore, to achieve optimal flow uniformity within the exhaust gas channel, a perforated plate with a porosity between 0.45 and 0.6 is considered the most suitable.
An additional characteristic is the lateral flow distribution in the center exhaust gas channel depending on the porosity of the perforated plate. In a conventional single-TEG system [17,18], the primary role of the perforated plate is to enhance the lateral flow distribution. However, as shown in Figure 5a, the lateral flow uniformity in the center exhaust gas channel decreases with increasing porosity but begins to improve again when porosity exceeds 0.45. When the porosity is greater than 0.45, the pressure in the cone region is lower than that in the side regions of the center exhaust gas channel, preventing sufficient lateral distribution. In contrast, when the porosity is less than 0.45, the pressure drop across the perforated plate increases significantly, leading to strong recirculation in the cone region. This recirculation enhances the lateral distribution of the flow, promoting a more uniform flow profile. This characteristic directly influences the output power results for each module, which will be discussed in Section 3.3.
Figure 6 shows the temperature profiles on the hot side of the TEMs according to the porosity of the perforated plate. The results for the case without a perforated plate are provided as a reference case. In the reference case, the temperature of the TEMs in Layer 1 is higher due to the flow concentrated in the center exhaust gas channel, while the TEMs in Layer 2 and Layer 3 have relatively lower temperatures. Notably, the temperature in Layer 3 is higher than that in Layer 2, with the TEMs closer to the exhaust gas inlet showing a temperature distribution similar to Layer 1. As explained in Section 3.2, this is due to the rapid flow at the exhaust gas inlet, which collides with the central cooling water channel, causing the flow to impinge on Layer 1 in the upper exhaust gas channel and improving heat transfer performance. Additionally, the recirculation of the exhaust gas at the first and second row positions was observed, resulting in higher temperature distributions on the sides of Layer 2 compared to its center.
With the insertion of the perforated plate into the center exhaust gas channel, the flow distribution changed, and the temperature profiles exhibited different behaviors. As the porosity of the perforated plate decreased, the amount of exhaust gas flowing into the upper exhaust gas channel increased, leading to higher temperatures in Layer 2 and Layer 3, while the temperature in Layer 3 decreased. In particular, as the porosity dropped below 0.3, a noticeable increase in the blue region in Layer 1 was observed. The most uniform high-temperature distribution was achieved when a perforated plate with a porosity of 0.45 was inserted, with the average temperature difference between Layer 1 and Layer 2 being less than 2 K, resulting in a highly uniform temperature profile. In comparison, the average temperature difference between Layer 1 and Layer 2 in the reference case was 32 K, highlighting the significant impact of the flow distribution effect of the perforated plate on temperature uniformity. Additionally, when the perforated plate was inserted, the temperature of the TEMs in the first row of Layer 1 rose sharply. This can be attributed to the improved heat transfer performance as the fluid impinged on the perforated plate, with the heat being conducted through the perforated plate to the heat sink fins.
Figure 7 shows the temperature distribution on the cold side of the TEMs according to the porosity of the perforated plate. In the reference case, Layer 3 exhibits a relatively higher temperature compared to Layers 1 and 2. This is because the coolant flowing over the upper exhaust gas channel has only half the flow rate of the coolant below. Additionally, when comparing Layers 1 and 2, Layer 1 exhibits a higher temperature distribution due to the influence of the hot side of the TEMs. Furthermore, the first-row TEMs of Layer 3 exhibit relatively higher temperatures due to the impinging effect of the exhaust gas. In all layers, the coolant tends to flow along the walls due to inertia, resulting in a relatively lower temperature distribution along the main flow direction. With the insertion of perforated plates, the exhaust gas in the center exhaust gas channel is redistributed to the upper exhaust gas channel, leading to a gradual decrease in the cold-side temperature of Layer 1. Consequently, the temperature behavior of the cold side of the TEMs is determined using coolant flow characteristics, but the absolute temperature values are significantly influenced by the exhaust gas flow.

3.2. Module-Wise Output Power Analysis

As previously discussed, the insertion of the perforated plate alters the flow structure within the exhaust gas channel, which in turn affects the temperature difference between the hot and cold sides of the TEMs. In these aspects, an analysis of the output power characteristics of the TEMs at each location was conducted to evaluate the impact of perforated plate insertion. The power generation of each module was calculated based on the difference between Equations (4) and (5). Figure 8a shows the output power of each module in each layer for the base case (without a perforated plate). Due to the high inertia of the exhaust gas, the flow is concentrated in the center exhaust gas channel, where the TEMs in Layer 1 experience a high temperature difference, leading to higher output power performance compared to other layers. As the exhaust gas flows from the inlet to the outlet, it undergoes heat exchange with the coolant, resulting in a decrease in the enthalpy of the exhaust gas. As a result, TEMs located closer to the outlet of the exhaust gas channel experience a reduction in the temperature difference, leading to a decrease in power generation. As previously discussed, TEMs near the inlet of Layer 3 experience high temperature differences due to the jet impingement flow structure, which significantly enhances their output power compared to the other TEMs in the upper exhaust gas channel. In contrast, the TEMs near the inlet of Layer 2 exhibit lower output power due to recirculation within the channel, which hampers heat transfer performance. In addition, in Layer 3, power generation is noticeably lower in the downstream region compared to Layer 2, with three TEMs even showing negative output power. This occurs because the flow rates in the cooling channels in contact with Layer 2 and Layer 3 are twice as different, preventing a sufficient temperature difference for power generation in the downstream TEMs. TEMs with negative power generation consume power due to Joule heating, which reduces the overall system output performance. As shown in Figure 8b, when the perforated plate with a porosity of 0.45 is inserted, the flow is more evenly distributed into the exhaust gas channels. This reduces the overall output power in Layer 1, while power generation increases in Layers 2 and 3. The two rows of TEMs near the inlet of Layer 2 show a 1.8-fold increase on average in output power due to reduced recirculation compared to the case without the perforated plate. Moreover, the sufficient temperature difference is ensured in the downstream TEMs due to the well-distributed flow, resulting in positive power generation across all TEMs in the system. However, when a perforated plate with a 0.15 porosity is inserted, as shown in Figure 8c, the significant flow resistance of the perforated plate reduces the flow in the center exhaust gas channel, leading to a decrease in output power in Layer 1. This also results in TEMs with negative output power near the downstream, ranging from −0.02 W to −0.60 W.

3.3. Module-Wise Electrical Loss Analysis

The output power of the TEMs decreases as the current deviates from the value that yields maximum output power. Due to the series configuration employed in this study, all TEMs conducted an identical current. This results in power losses in the TEMs that have temperature differences deviating from the average. The flow uniformity achieved with the perforated plate helps mitigate such temperature deviations, thereby reducing electrical losses in the TEMs. Thus, this section aims to analyze the impact of flow distribution on the reduction in electrical losses at the module level. Electrical loss is defined as shown in Equation (11).
δ = P o u t P i d e a l P i d e a l × 100
Figure 9a shows the electrical loss per module for the case without the perforated plate. The electrical loss increases as the deviation from the average TEM output power increases. Specifically, a TEM located near the entrance of Layer 1, where a large temperature gradient is induced, exhibits an electrical loss of ~20%. In contrast, a TEM located near the exit of Layer 3, where the temperature gradient is relatively small, shows an electrical loss exceeding 130%. However, the insertion of a perforated plate with a 0.45 porosity ensures a more uniform flow distribution, reducing the electrical loss range from 0.0% to a maximum of 47.7%, as shown in Figure 9b. Furthermore, it is noteworthy that the flow distribution between the exhaust gas channels improves, resulting in similar electrical loss trends across the TEM layers compared to the case without a perforated plate. When a perforated plate with 0.15 porosity is inserted, the flow is concentrated in the upper exhaust gas channel, leading to reduced electrical loss in Layers 2 and 3 compared to the other two conditions, as depicted in Figure 9c. However, the temperature difference in the downstream TEMs was not large enough to generate power due to the relatively low flowrate into the center exhaust gas channel, resulting in electrical losses of up to 441.3%.

3.4. System-Level Output Power and Pressure Drop Analysis

Figure 10 shows the system-level output power, pressure drop, and flow uniformity as a function of the perforated plate porosity. Here, uniformity is defined as the ratio of the mass flow rate of exhaust gas flowing through the upper exhaust gas channel to that flowing through the center exhaust gas channel. A uniformity value closer to 1 indicates a more uniform flow distribution. In the case without the perforated plate, the uniformity value is 0.46, meaning that the mass flow rate through the center exhaust gas channel is more than twice as high as that through the upper exhaust gas channel. With the insertion of perforated plates, both the uniformity and the output power improved in all cases. As the porosity decreases, the effect of the perforated plate increases, resulting in a higher flow rate through the upper exhaust gas channel. In the case where the porosity is 0.15, the flow rate to the upper exhaust gas channel is twice as high. The output power tends to increase as the uniformity approaches 1, and the maximum output power of 167.1 W is achieved when the porosity is 0.45, where uniformity is closest to 1. This value represents a 7.03% increase compared to the case without the perforated plate, confirming that the flow distribution achieved with the perforated plate significantly impacts the power generation performance.
The system-level pressure drop characteristics of the stacked TEGs were analyzed according to the porosity of the perforated plate. Compared with a case without the perforated plate, the pressure drop increased depending on the porosity of the perforated plate. When the porosity of the perforated plate decreased from 0.75 to 0.45, the pressure drop showed a relatively gradual increase. However, for a porosity of 0.3, the pressure drop tended to increase sharply, and when the perforated plate with the lowest porosity of 0.15 was inserted, the pressure drop increased by 44.5% compared to the case without a perforated plate. This significant increase is attributed to the sharp rise in inertial resistance as the porosity decreased. Additionally, as the uniformity exceeded 1, the recirculating flow in the cone region increased dramatically, leading to an increase in secondary losses. Considering the increase in pressure drop, it is concluded that perforated plates with a porosity greater than 0.45 are more suitable for the current system. TEGs operating at inlet temperature conditions below 600 K, as summarized in ref. [9], typically exhibit volumetric power densities of less than 18 kW/m3. In contrast, the TEG system proposed in this study achieves an exceptional volumetric power density of 20.8 kW/m3, demonstrating a significant improvement in performance. This comparison highlights the effectiveness of the design to improve volumetric power density in large-scale applications.

3.5. System-Level Net Output Power and Energy Conversion Efficiency Analysis

In this section, the performance of the stacked TEG with perforated plate insertion was evaluated from a practical perspective by examining the net output power, energy conversion efficiency, and electrical efficiency, which are defined as shown in Equations (12)–(14):
P n e t = P o u t , s y s t e m P p u m p
η c o n v = P o u t , s y s t e m Q e x t × 100
η e l = P o u t , s y s t e m P i d e a l , s y s t e m × 100
The stacked TEGs exhibit significantly higher conversion efficiency and electrical efficiencies, as shown in Figure 11, compared to the ~2% conversion efficiency and ~80% electrical efficiency observed in our previous study on TEGs for an automotive diesel engine [18]. In the case with a perforated plate of 0.15 porosity and the case without the perforated plate, the flow non-uniformity leads to significant temperature variations between the TEMs, resulting in electrical efficiencies of 86.9% and 88.0%, respectively. Similarly, the conversion efficiency in both cases is the lowest (3.33%). However, when a perforated plate with 0.45 porosity is inserted, the system achieves the highest electrical efficiency and conversion efficiency, reaching 91.1% and 3.41%, respectively, due to the enhanced flow uniformity. In contrast, the net output power follows a different trend compared to the electrical and conversion efficiency due to the nonlinear increase in pressure drop with varying porosity. The perforated plate with 0.15 porosity results in significant pumping loss, leading to an 8.3% reduction in net output power compared to the case without a perforated plate. However, due to this pressure loss trend, the perforated plate with 0.6 porosity produces a 6.2% increase in net output power, achieving a maximum of 136.6 W, compared to the case without a perforated plate.

4. Conclusions

This study focused on evaluating the performance enhancement of a stacked TEG system for marine applications, incorporating a perforated plate to improve flow and temperature uniformity. To distribute the flow concentrated in the center exhaust gas channel due to the high inertia of the exhaust gas, perforated plates with porosities ranging from 0.15 to 0.75 were inserted at the inlet of the center exhaust gas channel, with the porosity varied in increments of 0.15. To simulate the flow resistance of the perforated plates, a porous media method was employed. Furthermore, a multi-physics numerical model was developed that integrates the thermoelectric phenomena of heat pumping and Joule heating within the TEMs, enabling the accurate simulation of thermoelectric energy conversion. Through this study, a rational design for a marine TEG system was established based on numerical analysis. Building upon this design, a prototype TEG is planned for fabrication, and subsequent experimental validation will be conducted to further verify the numerical results. The key findings of this study are summarized as follows:
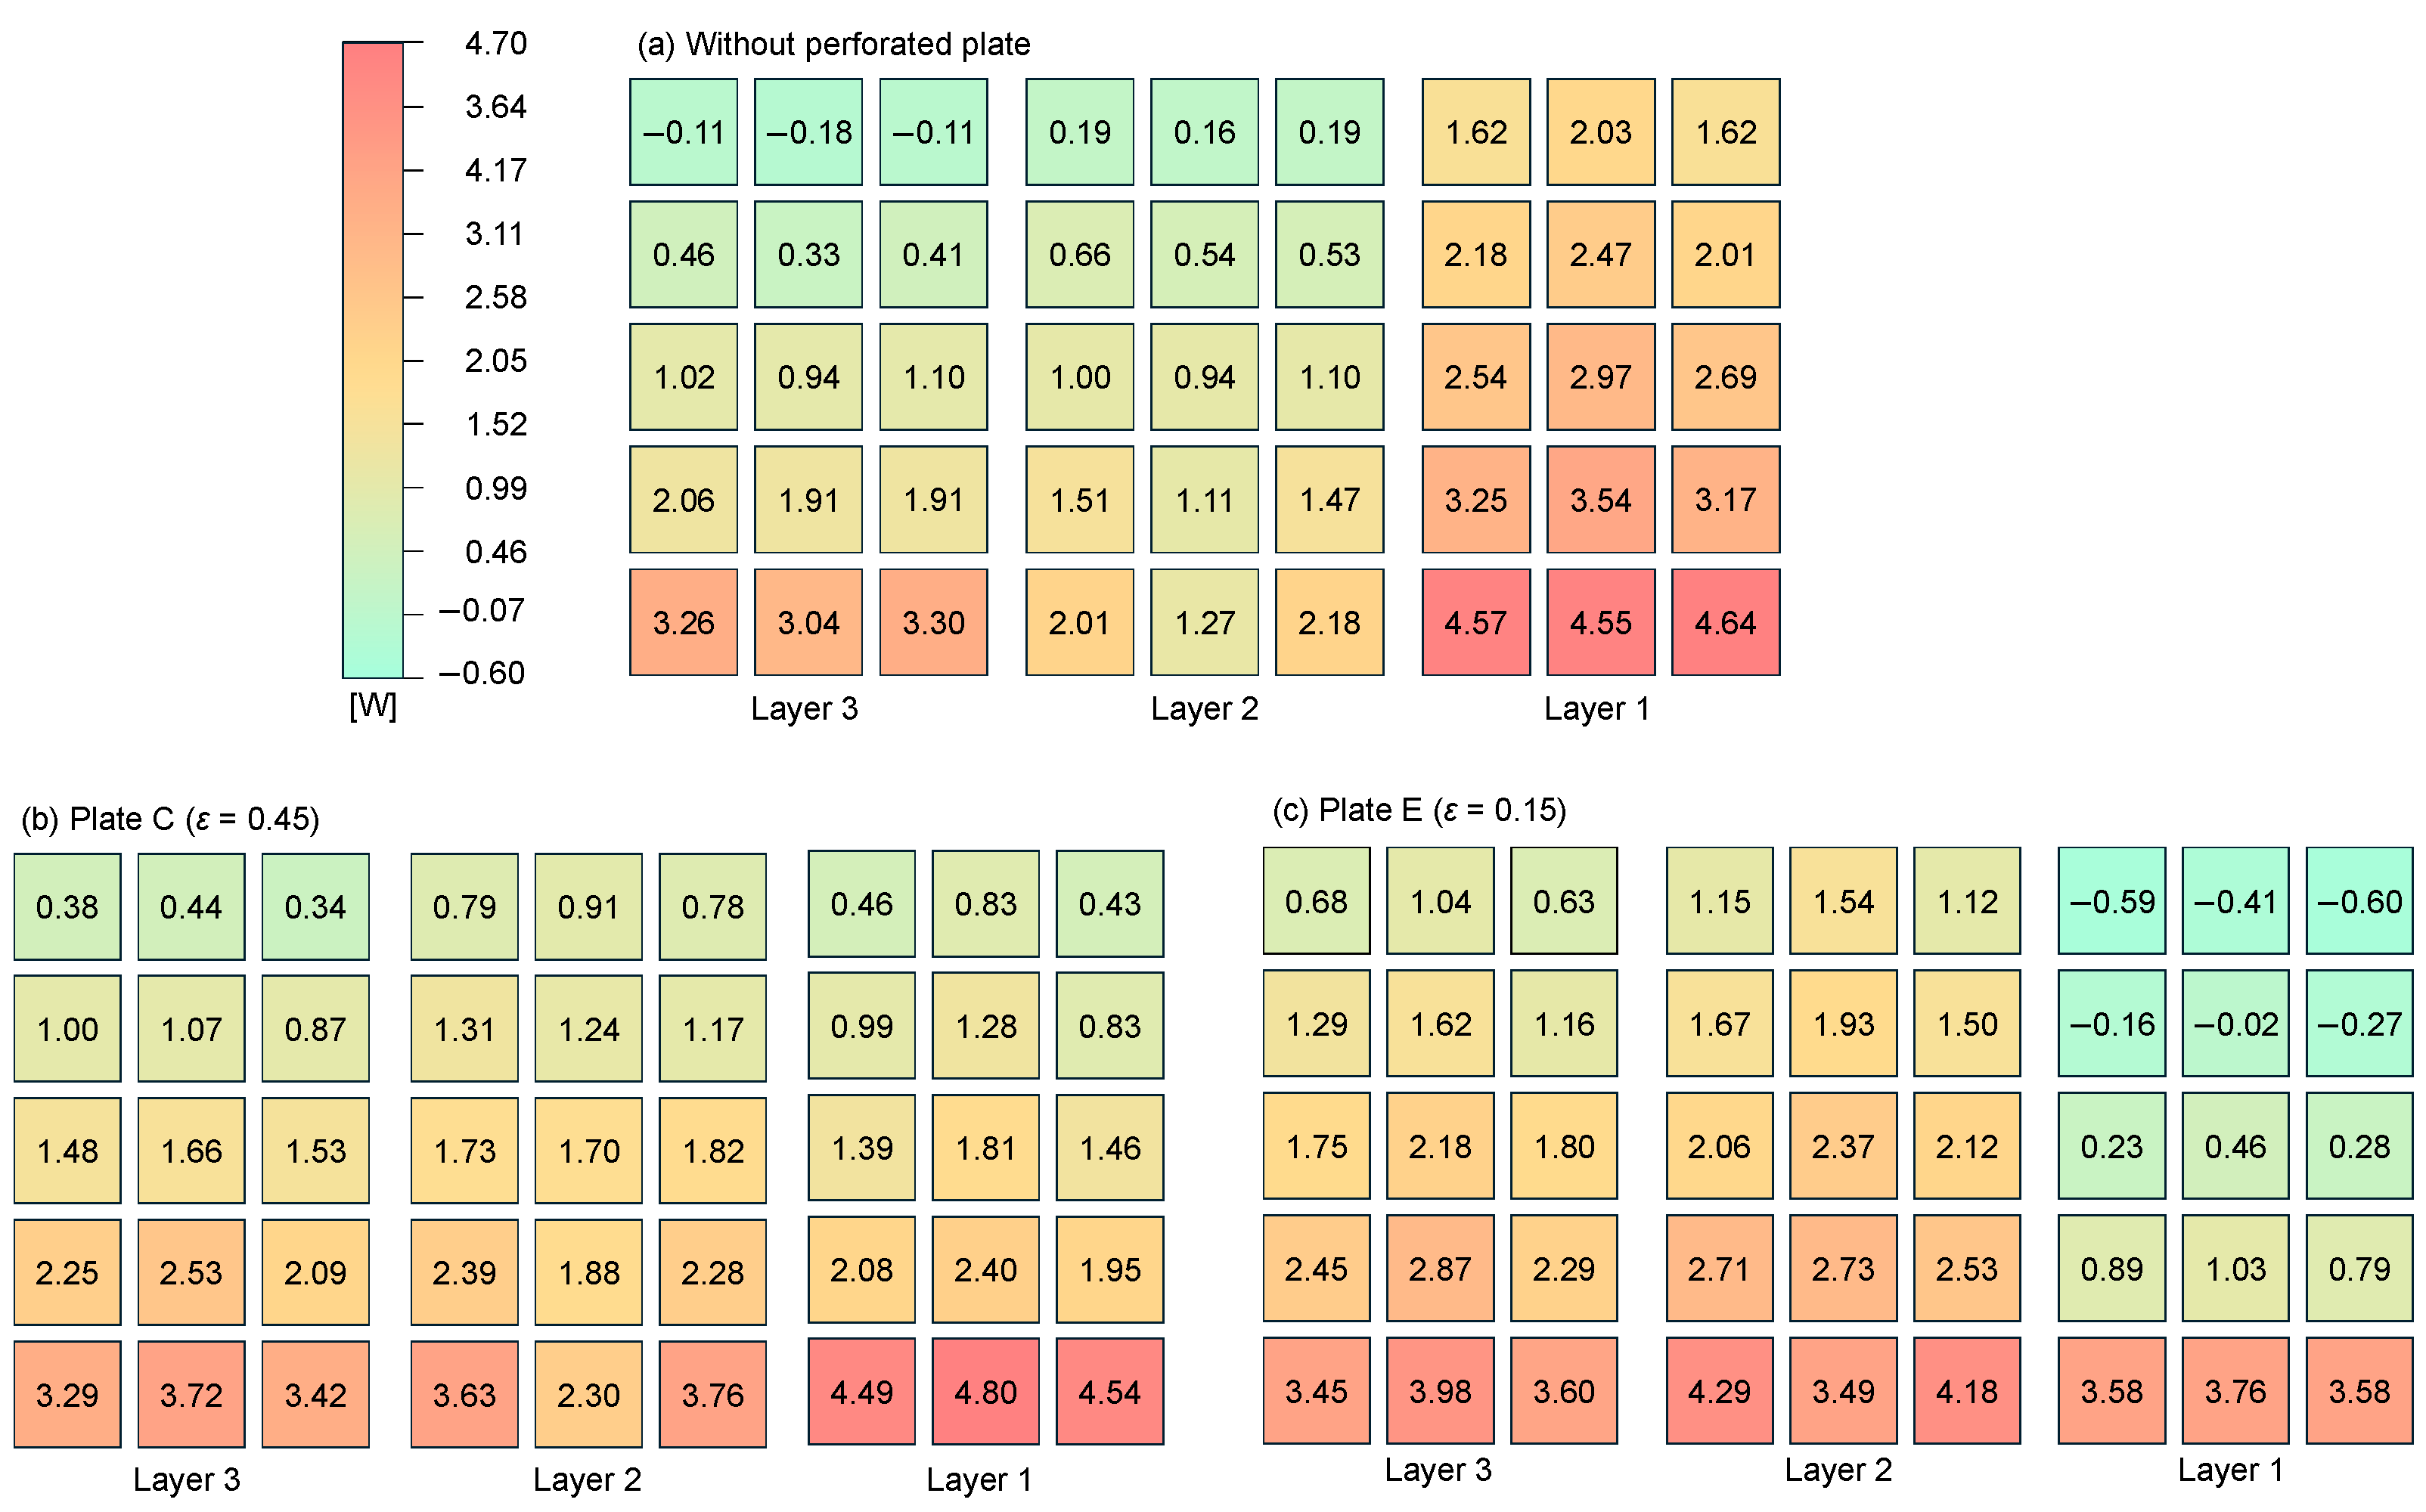
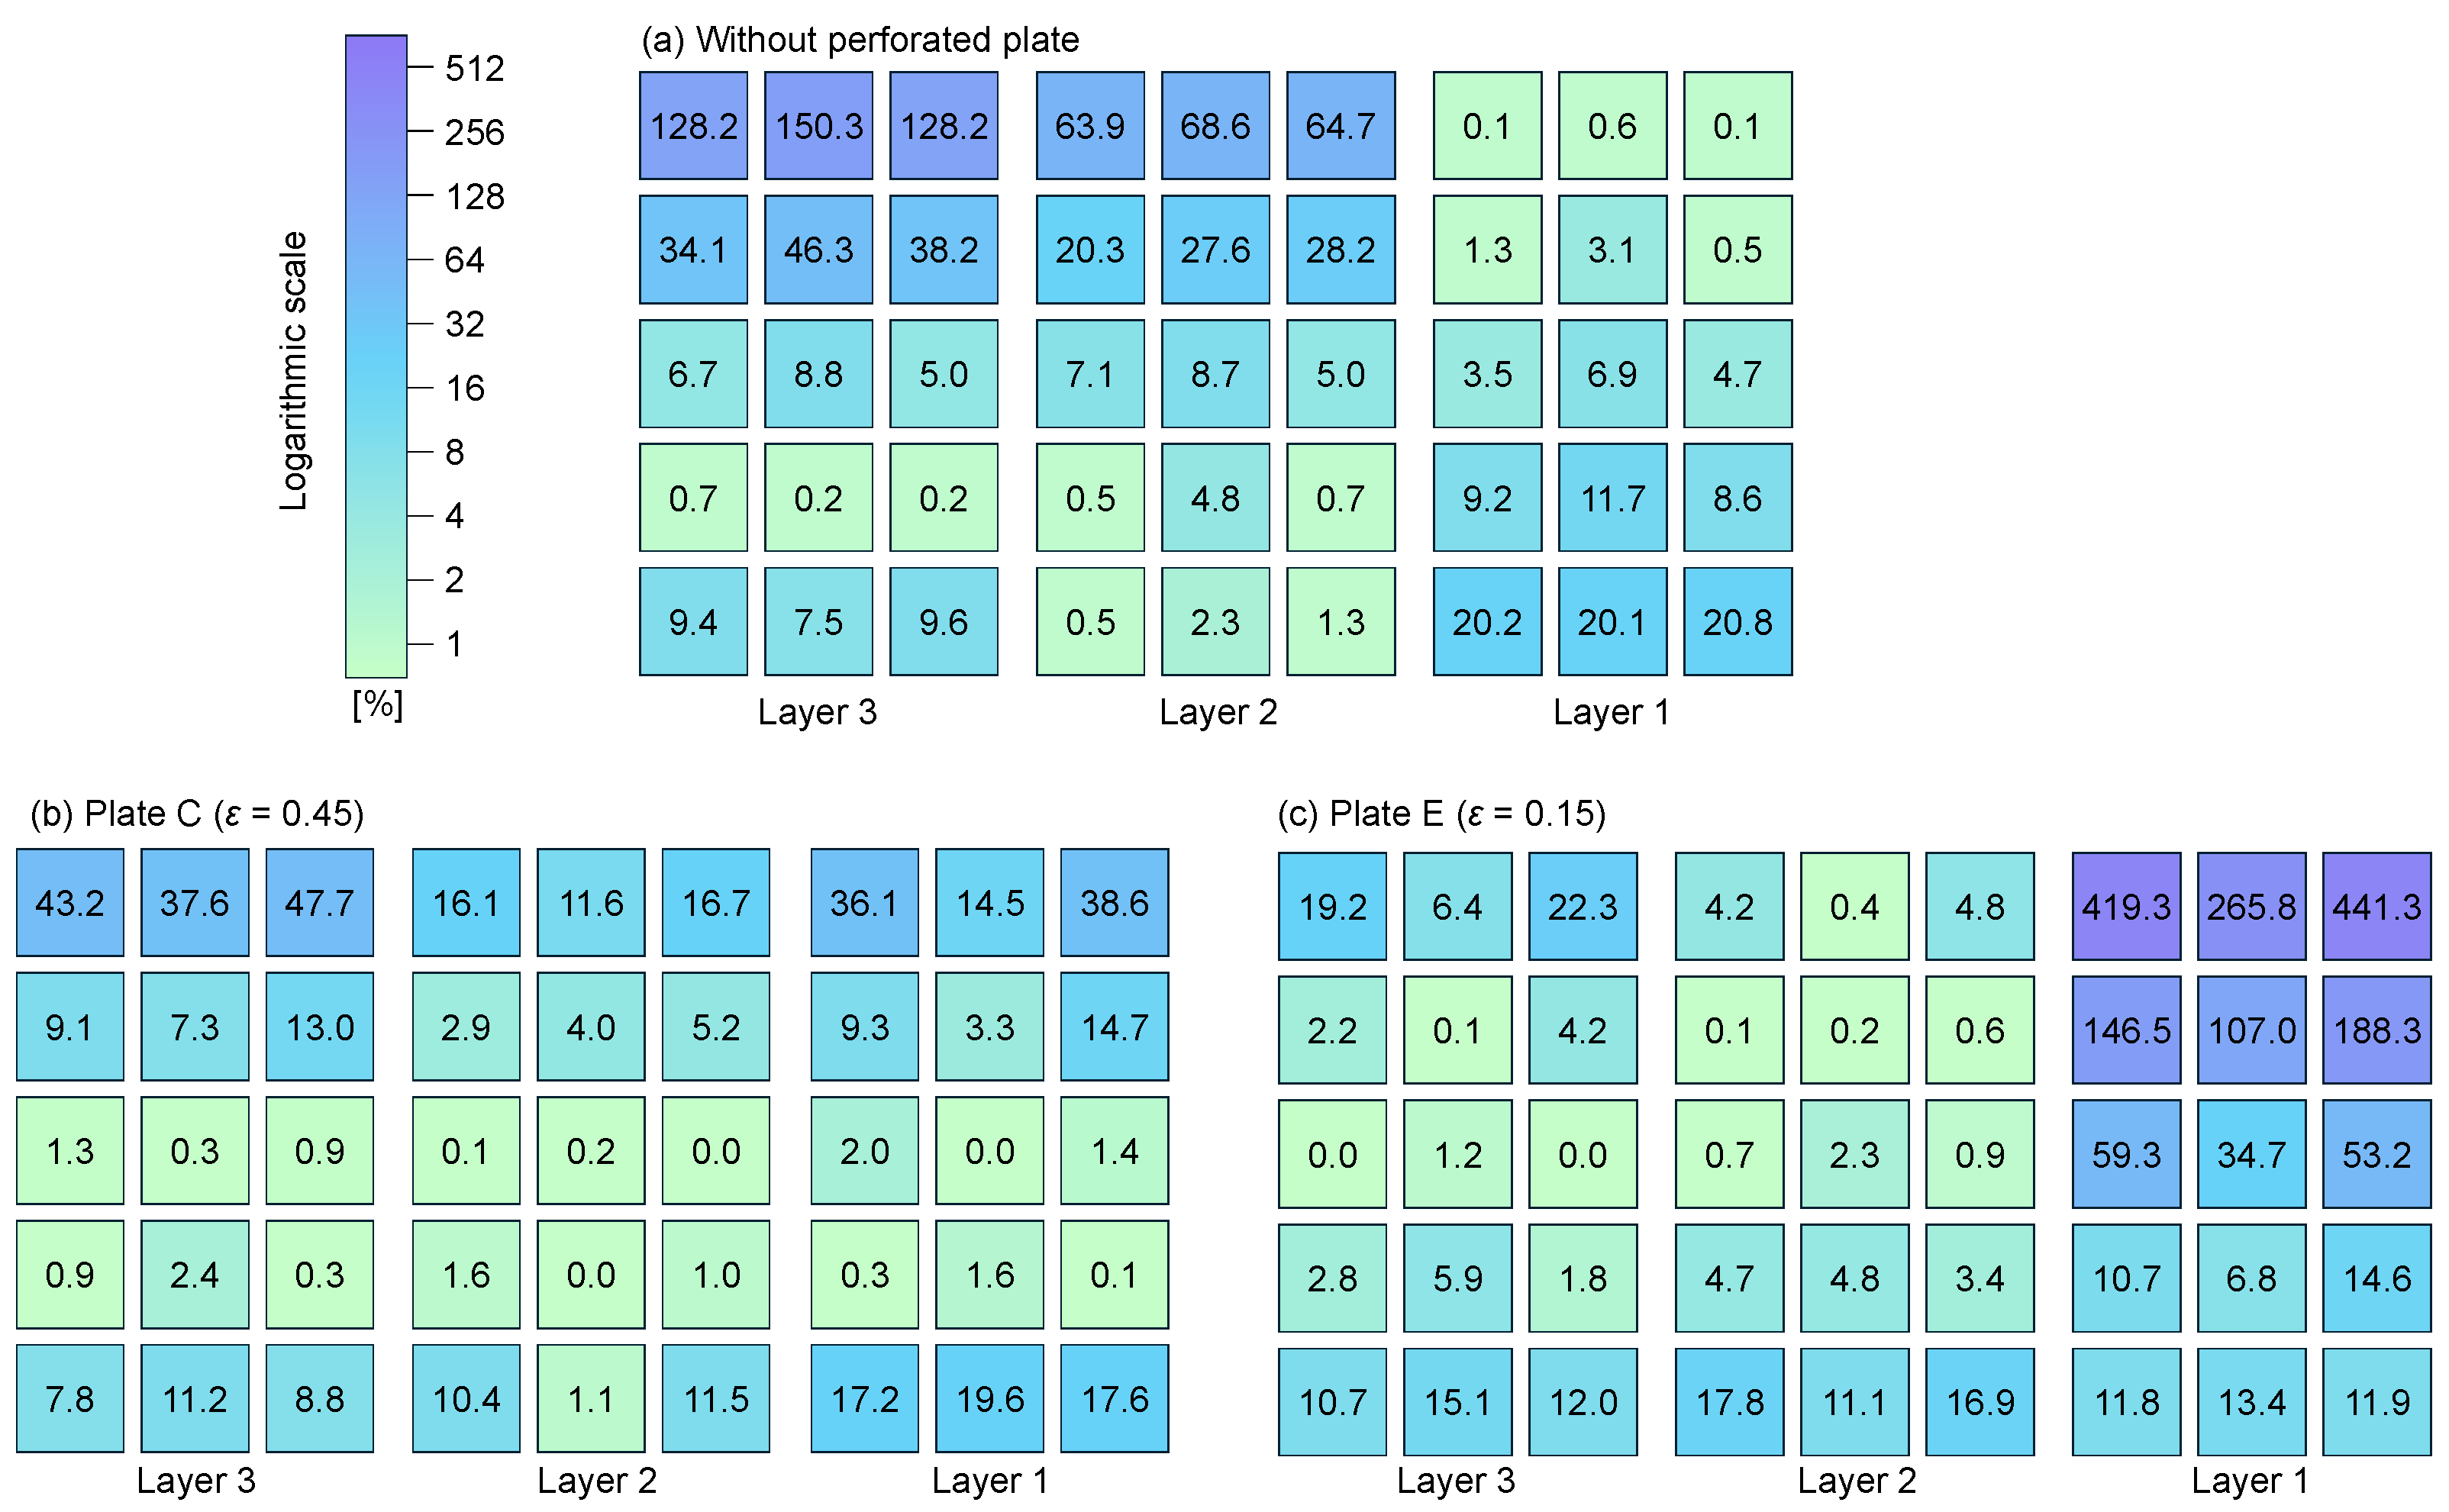
  • The effect of the flow distribution due to the perforated plate insertion on the module-wise output power and power loss was investigated. The insertion of a perforated plate of 0.15 porosity with a flow uniformity of 2.29 led to negative power generation of up to −0.6 W and 441.3% power loss in a TEM due to the non-uniform temperature across the TEMs. In contrast, a perforated plate of 0.45 porosity with a flow uniformity of 1.05 resulted in positive power generation across all TEMs, with a maximum power loss of 47.7%.
  • The influence of the porosity of the perforated plate on the system-level output power and flow uniformity was systematically evaluated. The insertion of a perforated plate with 0.45 porosity significantly improved flow uniformity and output power, with a maximum of 167.1 W achieved, highlighting a 7.03% increase compared to the case without the perforated plate.
  • The insertion of a perforated plate with 0.45 porosity resulted in a significant increase in electrical efficiency (91.1%) and conversion efficiency (3.41%), compared to the case without the perforated plate, where electrical efficiency (88.0%) and conversion efficiency (3.33%) were obtained. However, the perforated plate with 0.6 porosity increased the net output power by 6.2% compared to the case without the perforated plate, reaching a maximum of 136.6 W.

Author Contributions

Conceptualization, T.Y.K.; methodology, T.Y.K.; validation, T.C., J.L. (Junghwan Lee) and J.L. (Junsu Lee); formal analysis, T.C., J.L. (Junghwan Lee) and J.L. (Junsu Lee); data curation, T.C., J.L. (Junghwan Lee) and J.L. (Junsu Lee); writing—original draft preparation, T.C. and J.L. (Junghwan Lee); writing—review and editing, T.Y.K.; supervision, T.Y.K.; funding acquisition, T.Y.K. All authors have read and agreed to the published version of the manuscript.

Funding

This study was financially supported by Seoul National University of Science and Technology (2022-0663).

Data Availability Statement

Data will be made available on request.

Conflicts of Interest

The authors declare no conflicts of interest.

Glossary

The following abbreviations and nomenclatures are used in this manuscript:
Abbreviations
TEGThermoelectric generator
TEMThermoelectric module
UDFUser-defined function
Nomenclature
D p Pore diameter (m)
HHeight (m)
ICurrent (A)
KThermal conductance (W/K)
LLength (m)
PPower (W)
Q e x t Extracted thermal energy transfer rate (W)
RElectrical resistance (Ω)
SSource term (kg/m2·s2)
TTemperature (K)
tThickness (m)
USuperficial velocity (m/s)
WWidth (m)
woWithout
Greek symbols
αSeebeck coefficient (V/K); permeability (m2)
βInertial resistance (1/m)
δElectrical loss
ΔpPressure drop (Pa)
ΔTTemperature difference (K)
εPorosity
ηEfficiency
μViscosity (kg/m·s)
ρDensity (kg/m3)
Subscripts
cCold side
convConversion
elElectrical
hHot side
outOutput
pumpPumping
netNet
systemSystem
udfUser-defined function

References

  1. Islam Rony, Z.; Mofijur, M.; Hasan, M.M.; Rasul, M.G.; Jahirul, M.I.; Forruque Ahmed, S.; Kalam, M.A.; Anjum Badruddin, I.; Yunus Khan, T.M.; Show, P.-L. Alternative Fuels to Reduce Greenhouse Gas Emissions from Marine Transport and Promote UN Sustainable Development Goals. Fuel 2023, 338, 127220. [Google Scholar] [CrossRef]
  2. Nour Eddine, A.; Chalet, D.; Faure, X.; Aixala, L.; Chessé, P. Optimization and Characterization of a Thermoelectric Generator Prototype for Marine Engine Application. Energy 2018, 143, 682–695. [Google Scholar] [CrossRef]
  3. Saha, M.; Tregenza, O.; Twelftree, J.; Hulston, C. A Review of Thermoelectric Generators for Waste Heat Recovery in Marine Applications. Sustain. Energy Technol. Assess. 2023, 59, 103394. [Google Scholar] [CrossRef]
  4. Li, K.; Garrison, G.; Zhu, Y.; Moore, M.; Liu, C.; Hepper, J.; Bandt, L.; Horne, R.; Petty, S. Thermoelectric Power Generator: Field Test at Bottle Rock Geothermal Power Plant. J. Power Sources 2021, 485, 229266. [Google Scholar] [CrossRef]
  5. Børset, M.T.; Wilhelmsen, Ø.; Kjelstrup, S.; Burheim, O.S. Exploring the Potential for Waste Heat Recovery during Metal Casting with Thermoelectric Generators: On-Site Experiments and Mathematical Modeling. Energy 2017, 118, 865–875. [Google Scholar] [CrossRef]
  6. Konstantinou, G.; Kyratsi, T.; Louca, L.S. Design of a Thermoelectric Device for Power Generation through Waste Heat Recovery from Marine Internal Combustion Engines. Energies 2022, 15, 4075. [Google Scholar] [CrossRef]
  7. Luo, D.; Wang, R.; Yu, W.; Zhou, W. A Numerical Study on the Performance of a Converging Thermoelectric Generator System Used for Waste Heat Recovery. Appl. Energy 2020, 270, 115181. [Google Scholar] [CrossRef]
  8. Luo, D.; Yang, S.; Yan, Y.; Cao, J.; Yang, X.; Cao, B. Performance Improvement of the Automotive Thermoelectric Generator System with a Novel Heat Pipe Configuration. Energy 2024, 306, 132376. [Google Scholar] [CrossRef]
  9. Xie, H.; Gao, T.; Long, X.; Sun, L.; Wang, J.; Xia, E.; Li, S.; Li, B.; Li, C.; Gao, M.; et al. Design and Performance of a Modular 1 Kilowatt-Level Thermoelectric Generator for Geothermal Application at Medium-Low Temperature. Energy Convers. Manag. 2023, 298, 117782. [Google Scholar] [CrossRef]
  10. Zhu, X.; Zuo, Z.; Wang, W.; Zhang, M.; Yin, Q.; Liu, R.; Jia, B. Transient Modeling and Analysis of a Stepped-Configuration Thermoelectric Generator Considering Non-Uniform Temperature Distribution. Appl. Energy 2025, 383, 125360. [Google Scholar] [CrossRef]
  11. Georgopoulou, C.A.; Dimopoulos, G.G.; Kakalis, N.M.P. A Modular Dynamic Mathematical Model of Thermoelectric Elements for Marine Applications. Energy 2016, 94, 13–28. [Google Scholar] [CrossRef]
  12. Sheikh, R.; Gholampour, S.; Fallahsohi, H.; Goodarzi, M.; Mohammad Taheri, M.; Bagheri, M. Improving the Efficiency of an Exhaust Thermoelectric Generator Based on Changes in the Baffle Distribution of the Heat Exchanger. J. Therm. Anal. Calorim. 2021, 143, 523–533. [Google Scholar] [CrossRef]
  13. Yang, W.; Xie, C.; Jin, C.; Zhu, W.; Li, Y.; Tang, X. Simulation and Experimental Study of Thermoelectric Generators with an Axial Gradient Metal Foam Heat Exchanger. Renew. Energy 2024, 232, 121061. [Google Scholar] [CrossRef]
  14. Jun, F.; Zhang, Z.; Chen, W.; Mao, H.; Li, J. Computational fluid dynamics simulations of the flow field characteristics in a novel exhaust purification muffler of diesel engine. J. Low Freq. Noise Vib. Act. Control. 2018, 37, 816–833. [Google Scholar] [CrossRef]
  15. Sajjadi, H.; Mansouri, N.; Nabavi, S.N.; Amiri Delouei, A.; Atashafrooz, M. Sensitivity analysis of natural convection in a porous cavity filled with nanofluid and equipped with horizontal fins using various optimization methods and MRT-LB. Sci. Rep. 2024, 14, 9847. [Google Scholar] [CrossRef]
  16. Izadi, M.; Mohebbi, R.; Sajjadi, H.; Amiri Delouei, A. LTNE modeling of magneto-ferro natural convection inside a porous enclosure exposed to nonuniform magnetic field. Physica A Stat. Mech. Its Appl. 2019, 535, 122394. [Google Scholar] [CrossRef]
  17. Negash, A.A.; Choi, Y.; Kim, T.Y. Experimental Investigation of Optimal Location of Flow Straightener from the Aspects of Power Output and Pressure Drop Characteristics of a Thermoelectric Generator. Energy 2021, 219, 119565. [Google Scholar] [CrossRef]
  18. Niu, Z.; Liu, Q.; Zhang, L.; Chen, Z. Investigation and design optimization of exhaust-based thermoelectric generator system for internal combustion engine. Energy Convers. Manag. 2014, 85, 85–101. [Google Scholar] [CrossRef]
  19. Choi, Y.; Negash, A.; Kim, T.Y. Waste Heat Recovery of Diesel Engine Using Porous Medium-Assisted Thermoelectric Generator Equipped with Customized Thermoelectric Modules. Energy Convers. Manag. 2019, 197, 111902. [Google Scholar] [CrossRef]
  20. Guo, B.Y.; Zhang, Q.; Chen, Z.; Liu, L. Numerical modelling of the gas flow through perforated plates. Chem. Eng. Res. Des. 2013, 91, 403–408. [Google Scholar] [CrossRef]
  21. Lee, J.H.; Kim, T.Y. Development of a Multi-Physics Numerical Model for a Multi-Component Thermoelectric Generator with Discontinuous Porosity in the Exhaust Gas Channel. Appl. Therm. Eng. 2025, 260, 125043. [Google Scholar] [CrossRef]
  22. Choi, T.; Kim, T.Y. Three-Zone Numerical Modeling Method for Predicting System-Level Waste Heat Recovery Performance of Thermoelectric Generator with Various Electrical Array Configurations. Energy Convers. Manag. 2021, 240, 114270. [Google Scholar] [CrossRef]
  23. Choi, T.; Kim, T.Y. Layer-deepened current harmonized improvement method: An optimal electrical array configuration method for performance optimization of a thermoelectric generator. Appl. Therm. Eng. 2024, 248, 123143. [Google Scholar] [CrossRef]
Figure 1. Schematic of the numerical model: (a) isometric view, (b) front view, and (c) mesh distribution.
Energies 18 01551 g001aEnergies 18 01551 g001b
Figure 2. Schematic of (a) p-n couple of thermoelectric elements and (b) numerical model of a TEM.
Energies 18 01551 g002
Figure 3. Calculation process of numerical study.
Energies 18 01551 g003
Figure 4. Mesh test of the numerical model.
Energies 18 01551 g004
Figure 5. (a) X-velocity contour maps and (b) pathlines of the exhaust gas channel according to the porosity of the perforated plate.
Energies 18 01551 g005
Figure 6. Temperature profiles on the hot side of the TEMs according to the porosity of the perforated plate.
Energies 18 01551 g006
Figure 7. Temperature profiles on the cold side of the TEMs according to the porosity of the perforated plate.
Energies 18 01551 g007
Figure 8. Module-wise output power performance characteristics with different porosities of perforated plate: (a) without perforated plate, (b) 0.45 porosity, and (c) 0.15 porosity.
Energies 18 01551 g008
Figure 9. Module-wise electrical loss performance characteristics with the different porosities of the perforated plate: (a) without perforated plate, (b) 0.45 porosity, and (c) 0.15 porosity.
Energies 18 01551 g009
Figure 10. System-level output power, pressure drop, and flow uniformity according to the porosity of the perforated plate.
Energies 18 01551 g010
Figure 11. System-level net power, energy conversion efficiency, and electrical efficiency according to the porosity of the perforated plate.
Energies 18 01551 g011
Table 1. Boundary conditions for the numerical model indicated in Figure 1.
Boundary ConditionValue
Exhaust gas inletTemperature563 K
Velocity20 m/s
Exhaust gas outletPressure0 Pa (Gauge)
Coolant inletTemperature293 K
Velocity1.9 m/s (center), 0.95 m/s (upper)
Coolant outletPressure0 Pa (Gauge)
Table 2. Types of perforated plates used for numerical simulations.
Perforated PlatewoABCDE
ε10.750.600.450.300.15
Dp (mm)N/A55555
β (m−1)N/A68214292816612220,309
Table 3. Grid convergence index in terms of output power and pressure drop.
Number of Meshes (Million)GCI (Output Power)GCI (Pressure Drop)
1.5N/AN/A *
3.56.95%5.22%
62.21%4.22%
90.21%3.27%
180.21%0.22%
* N/A: not available.
Disclaimer/Publisher’s Note: The statements, opinions and data contained in all publications are solely those of the individual author(s) and contributor(s) and not of MDPI and/or the editor(s). MDPI and/or the editor(s) disclaim responsibility for any injury to people or property resulting from any ideas, methods, instructions or products referred to in the content.

