Article

Investigation on Energy Enhancement of Shale Oil Imbibition Under Different Fracture Fluid Injection Methods—A Case Investigation of Jimsar Lucaogou Formation

by
Jian Zhu
1,2,
Fei Wang
1,2,*,
Junchao Wang
3,
Zhanjie Li
3 and
Shicheng Zhang
1,2
1
Petroleum Engineering, China University of Petroleum (Beijing), Beijing 102249, China
2
State Key Laboratory of Petroleum Resources and Prospecting, China University of Petroleum (Beijing), Beijing 102249, China
3
Oil Production Technology Research Institute, PetroChina Xinjiang Oilfield Company, Karamay 834000, China
*
Author to whom correspondence should be addressed.
Energies 2025, 18(6), 1412; https://doi.org/10.3390/en18061412
Submission received: 13 February 2025 / Revised: 3 March 2025 / Accepted: 10 March 2025 / Published: 13 March 2025
(This article belongs to the Section D: Energy Storage and Application)

Abstract

:
This paper describes an innovatively designed experimental method for fracturing fluid energy storage to explore the energy storage mechanism during the well shut-in process of fractured shale reservoirs. By improving the existing core clamp and adding fracturing fluid cavities and large volume intermediate containers to simulate artificial fractures and remote shale reservoirs, the pressure changes in the core during the well shut-in process were monitored under the conditions of a real oil–water ratio and real pressure distribution to explore the energy storage law of the shut-in fluid in fractured shale reservoirs. Compared to the 0.62 MPa energy storage obtained from traditional energy storage experiments (without artificial fractures or remote shale reservoirs), the experimental scheme proposed in this paper achieved a 2.45 MPa energy storage, consistent with the field’s monitoring results. The energy storage effects of four fracturing fluids were compared, namely pure CO2, CO2 pre-fracturing fluid, slickwater pre-fracturing fluid, and pure slickwater fracturing fluid. Due to the characteristics of a high expansion coefficient and low interfacial tension of pure CO2, the energy storage effect was the best, and the pressure equilibrium time was the shortest. Considering factors such as comprehensive economy and energy storage efficiency, the optimal range for CO2 pre-injection is between 20% and 30%. Based on the optimization criterion of energy storage pressure balance, it is recommended that the optimal CO2 shut-in time be 5 h and the slickwater be 12.8 h. Considering the economic, sand carrying, and energy storage effects, and other factors, CO2 pre-storage has the best imbibition effect, and the optimal CO2 pre-storage range is 20~30%. The research results provide theoretical support for energy storage fracturing construction in other shale oil reservoirs of the same type.

1. Introduction

With the increasing degree and difficulty of extraction, conventional oil fields have reached the end of development, and their production cannot meet the growing energy demand. Shale oil, a new unconventional oil and gas resource with enormous potential, has become an essential component of global oil and gas resources [1,2,3,4,5]. As a representative of the Permian Lucaogou Formation in the Jimsar Depression of Xinjiang, the source and outlet integrated oil reservoir with mudstone and sandstone as the main reservoirs has broad exploration and development prospects [6,7,8,9,10,11]. In the early stage of shale oil development in Jimsar, new fracturing modes, such as horizontal well extensive section multi-cluster dense cutting volume fracturing, ultimate flow restriction, and delayed drilling plug, were used, and good results were achieved [12,13]. The formation of shale oil reservoirs in the Lucaogou Formation is complex, with strong vertical heterogeneity of the reservoir and intermediate wettability. Crude oil is mainly stored in micro-nano scale pores, making it a typical terrestrial sedimentary ultra-low permeability shale oil reservoir. In addition, the viscosity of Jimsar shale oil can reach over 50 mPa·s at 50 °C, with high viscosity and poor fluidity of crude oil in complex pore throats [14,15]. According to on-site data, opening the Jimsar oil well after shutdown can achieve higher productivity under higher formation pressure. However, with the production of oil wells, the energy of the formation is rapidly consumed, the pressure of the oil well drops quickly, and the production decreases rapidly. The stable production time of natural energy development is short, and the final recovery rate is not high [16].
CO2 can play a significant role in the fracturing process and post-fracturing production. Using CO2 dry fracturing and CO2 pre-fracturing techniques can effectively reduce the damage caused by hydration expansion and other issues to the reservoir. Supercritical CO2 has the characteristics of low viscosity, low surface tension, high compressibility to supplement formation energy, mixing with crude oil to reduce flow resistance, and dissolving reservoir minerals to increase porosity and permeability. It is widely used in low-pressure and unconventional reservoir transformation [17,18,19,20,21]. Simultaneously applying CO2 to hydraulic fracturing reservoir transformation can achieve a win–win situation of increasing oil well production and CCUS, which is conducive to promoting China’s carbon neutrality policy and peak carbon emissions. CO2 displacement, CO2 injection, and CO2 fracturing have been widely applied in the development of major oil and gas fields worldwide, making outstanding contributions to increasing oil and gas field production and improving recovery rates [22,23,24].
CO2 pre-fracturing corrodes the fracture wall, improves fracture conductivity, effectively replenishes stored formation energy, reduces crude oil flow resistance, and increases the oil recovery rate in oil wells [25,26]. The existing energy storage evaluation experimental methods lack simulation of artificial fracture storage fracturing fluid and remote shale storage crude oil, which cannot reflect the unidirectional pressurized energy storage process under reservoir conditions. The energy storage pressure obtained from the existing experimental conditions is seriously inconsistent with the actual field conditions. Therefore, this article describes the innovative design of an experimental fracturing fluid energy storage process. By improving the existing core holder and adding fracturing fluid cavities and large volume intermediate containers to simulate fracturing artificial fractures and remote shale reservoirs under the conditions of a real oil–water ratio and real pressure distribution (fracturing fluid inside the fracture (16 mL, 40 MPa)—near fracture reservoir liquid (4 mL, 30 MPa)—remote reservoir liquid (244 mL, 30 MPa)), the pressure changes in the core during the well shut-in process are monitored to explore the energy storage law of the fracturing shale reservoir shut-in liquid and to clarify the energy storage effect, optimal CO2 pre-injection, and optimal shut-in time of different fracturing fluids.

2. Experiment and Methods

2.1. Experimental Equipment

The experimental instruments mainly include the TC-60 gas pressurization device (Tuochuang, Jiangsu, China), TC-300D dual cylinder constant (Tuochuang, Jiangsu, China) speed and pressure pump, TC-V vacuum pressurization saturation device (Tuochuang, Jiangsu, China), HBQT-70 high temperature (Tuochuang, Jiangsu, China) and high-pressure multifunctional core displacement device, ZR-III high temperature and high-pressure intermediate vessel (Tuochuang, Jiangsu, China), MacroMR12-150H-I nuclear magnetic resonance instrument (Niumag, Suzhou, China), high temperature and high-pressure core gripper, D07-CM067 gas mass flowmeter (Tuochuang, Jiangsu, China), etc. The experimental device for the fracturing fluid’s energy storage and efficiency enhancement effect is assembled as shown in Figure 1. The experimental equipment is set up to study the near fracture matrix, with the rock core inlet in contact with the improved fracturing fluid cavity, simulating the contact between the fracture wall and the fracturing fluid. The core outlet end is connected to a 50 mL long thin tube and a 500 mL intermediate container to simulate crude oil in a remote shale reservoir. The long pipeline and intermediate container are filled with formation crude oil to maintain the original formation pressure. The purpose of the long pipeline is to prevent liquid from the core from flowing into the intermediate container, which simulates the contact between the pore fluid and near fracture matrix in shale formations within half-cluster spacing. The experiment was based on a single cluster fracturing section at the field scale, and the liquid ratio in the reservoir state was truly restored. The specific parameters for calculating the ratio of fracturing fluid to crude oil at the field scale and the ratio of fracturing fluid to crude oil at the experimental scale are shown in Table 1. The injection fracture fluid volume at the experimental scale simulates the single-stage fracturing fluid injection volume. The crude oil volume in the holder-embedded experimental core simulates the fluid volume within a 6 cm near-fracture matrix. The crude oil in intermediate containers simulates the far-fracture matrix fluid volume within half-cluster spacing. This experiment reproduces the contact process between the fracturing fluid and near fracture matrix during the well shut-in by using the net pressure inside the fracture as the initial pressure difference (10 MPa), simulating the pressure accumulation process after pump shutdown, and exploring the pressure transmission effect of different fracturing fluids near the fracture matrix.

2.2. Materials

The rock cores and crude oil used in the experiment were taken from Block A of the Jimsar Depression. To study the effect of different injection methods and injection fracturing fluid conditions on shut-in energy storage, seven standard core columns were drilled from the same full-diameter core of the crude oil reservoir for the energy storage experiments. The physical properties of the core foundation are detailed in Table 2. The crude oil was extracted from the JH1 wellhead in Block A of the Jimsar Depression and subjected to dehydration and impurity removal treatment on the ground. The viscosity of the crude oil at 50 °C was 40 mPa·s, and the density of the crude oil was 0.886 g/cm3. The experimental configuration of the shut-in energy storage liquid fracturing fluid uses low-viscosity slickwater on site. The experimental saturated core-bound water uses formation water, which is NaHCO3 type and has a total mineralization of 14,053 mg/L.

2.3. Experimental Methods

The experimental steps are the following. 1. Use a desktop drilling rig to drill six full-diameter cores from a 50 cm high core block. An automatic oil washing machine is used to wash the experimental cores with a 1:3 volume ratio ethanol–dichloromethane mixture. The washing oil is at 105 °C for about 14–16 days. When a small amount of reagent is taken from the sampling valve according to the pollution level of the reagent, the cores are taken out and air-dried in a ventilated place for 48 h. 2. Measure basic physical parameters, such as core height, diameter, mass, permeability, porosity, capillary curve, etc., and calculate the pore size distribution of the core. 3. Vacuum the core for more than 24 h to saturate the formation water. Assemble the instrument according to the experimental device shown in Figure 2, place the core into the gripper, maintain the formation temperature and pressure conditions (formation temperature of 90 °C, formation pressure of 30 MPa), inject crude oil into the core at a constant speed until no formation water flows out at the outlet end, calculate the bound water saturation and oil saturation of the core, place it in the gripper to maintain temperature and pressure conditions, and continue aging for 300 h. Measure the nuclear magnetic resonance T2 spectrum of the core to obtain the T2 spectrum of the initial state of the saturated crude oil in the core. 4. Closed-well energy storage experiment. After the aging of the rock core, according to the experimental plan in Table 3, different fracturing fluids and different pre-fluid volumes are injected into the inlet end of the rock core under constant pressure and contact with the rock core. A total of 16 mL liquids are injected. When the inlet pressure reaches the preset pressure and the pressure difference between the inlet and outlet reaches 10 MPa, the injection valve is closed. Use high-precision pressure testing instruments to detect pressure changes at the inlet and outlet ends of the rock cores. 5. Measure the porosity and permeability of the rock core after the experiment and obtain the nuclear magnetic resonance T2 spectrum to analyze the utilization of crude oil in the pores of the rock core after the end of the wellbore imbibition.

3. Energy Storage Effect of Fracturing Fluid

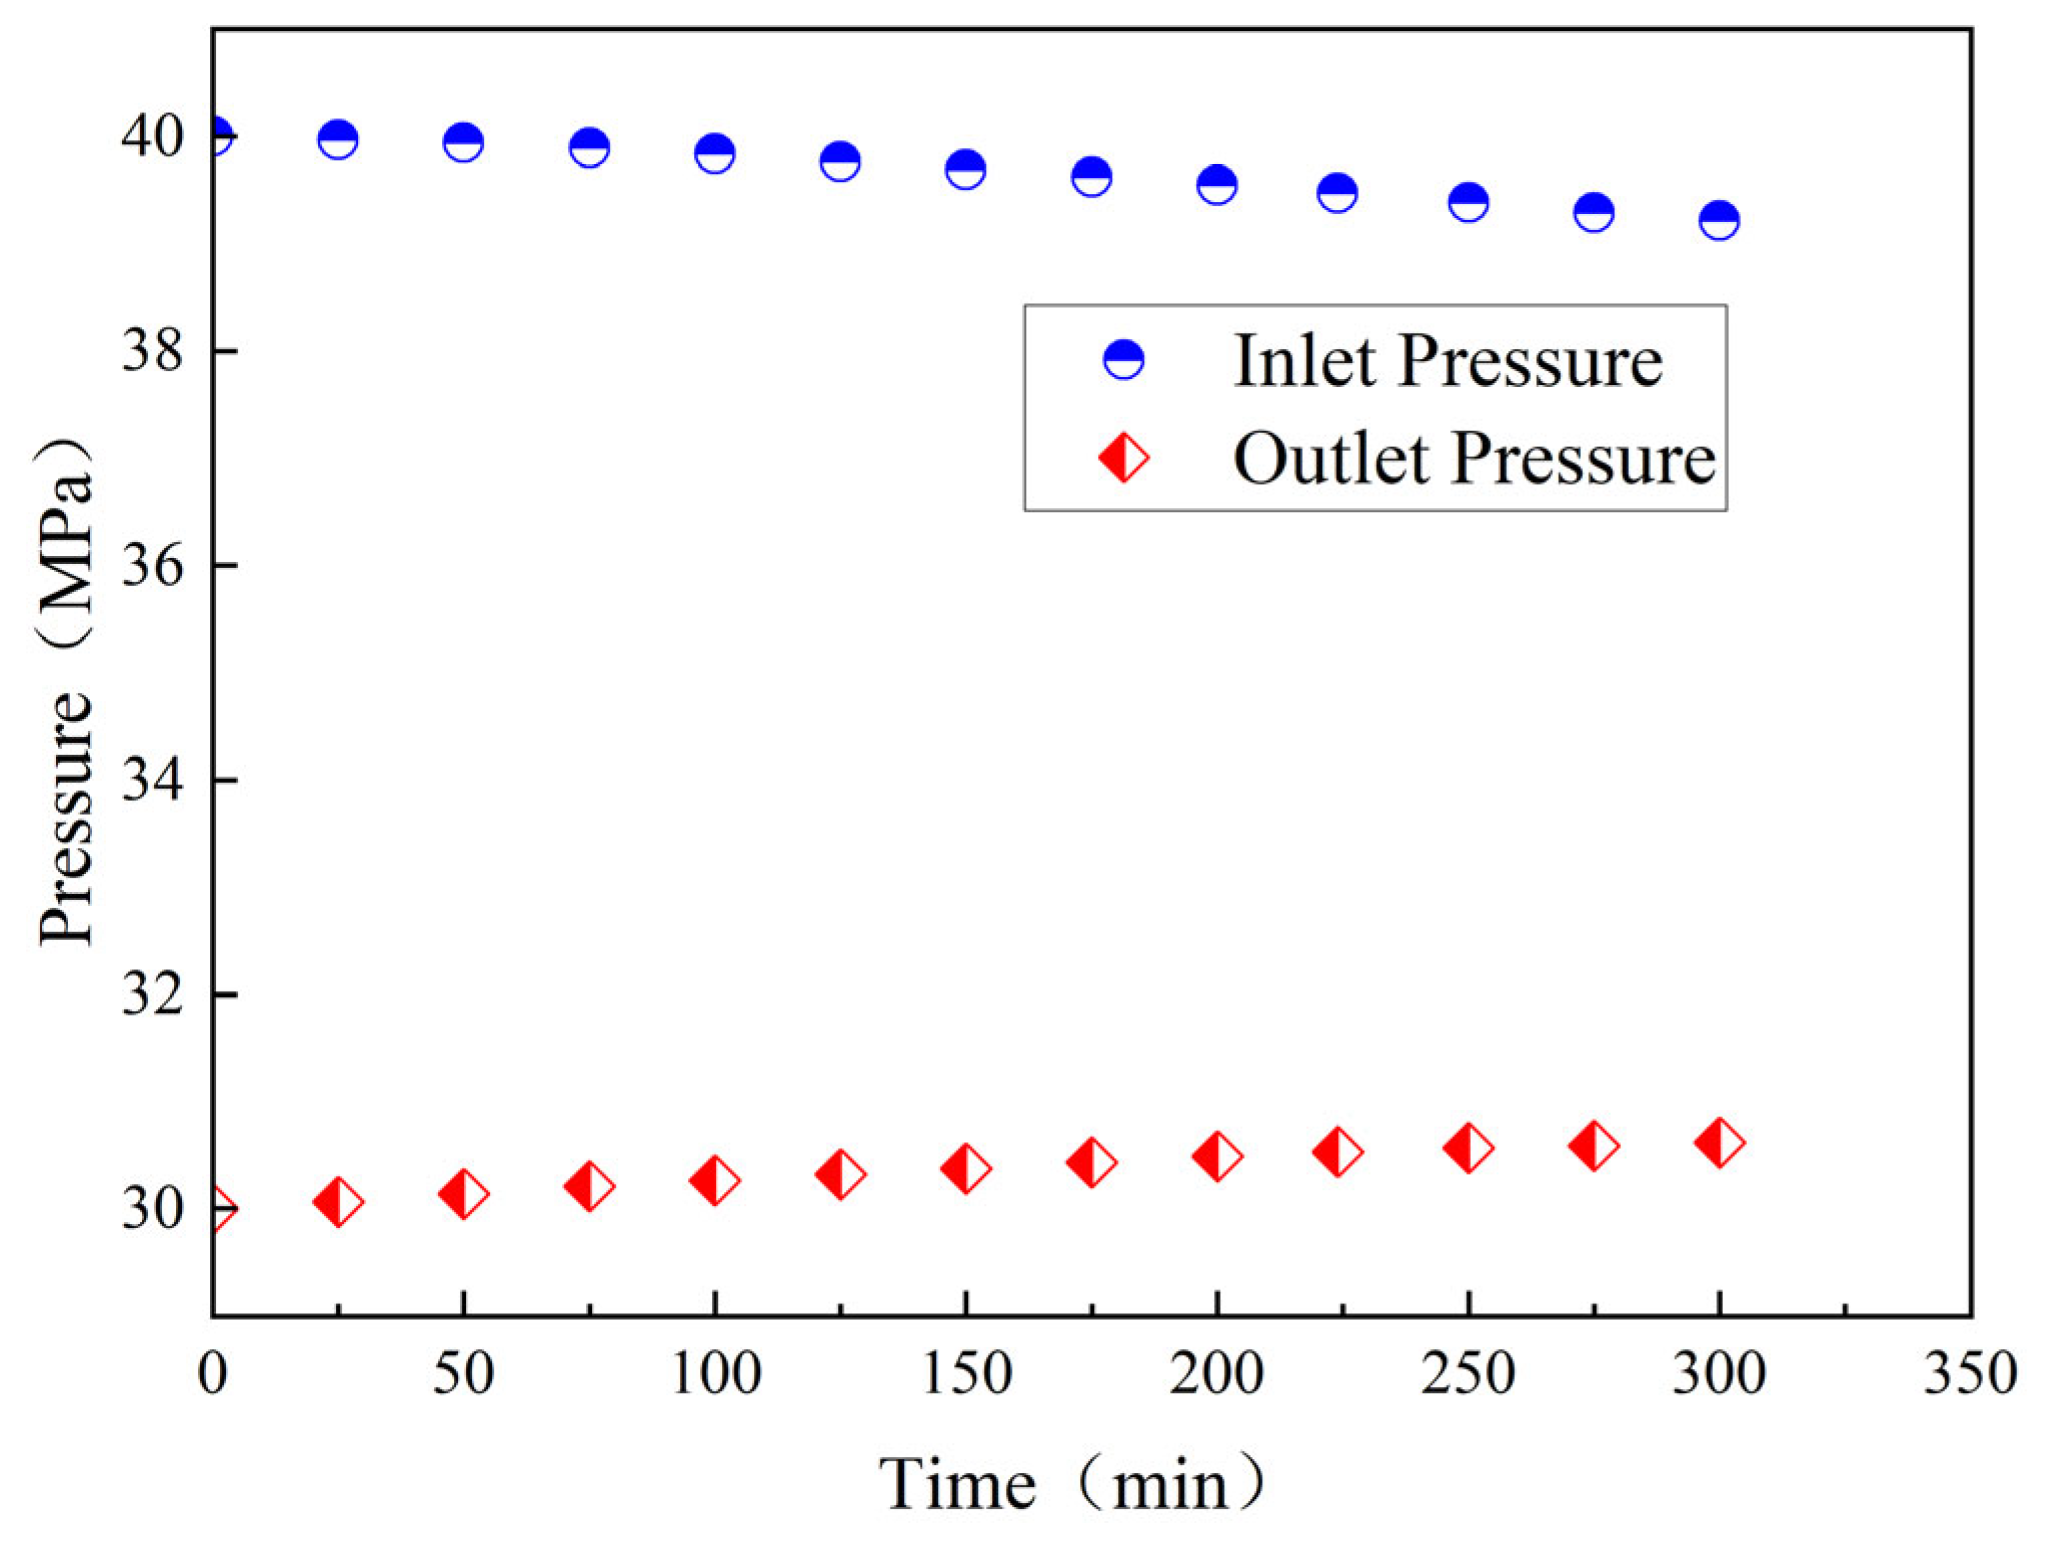
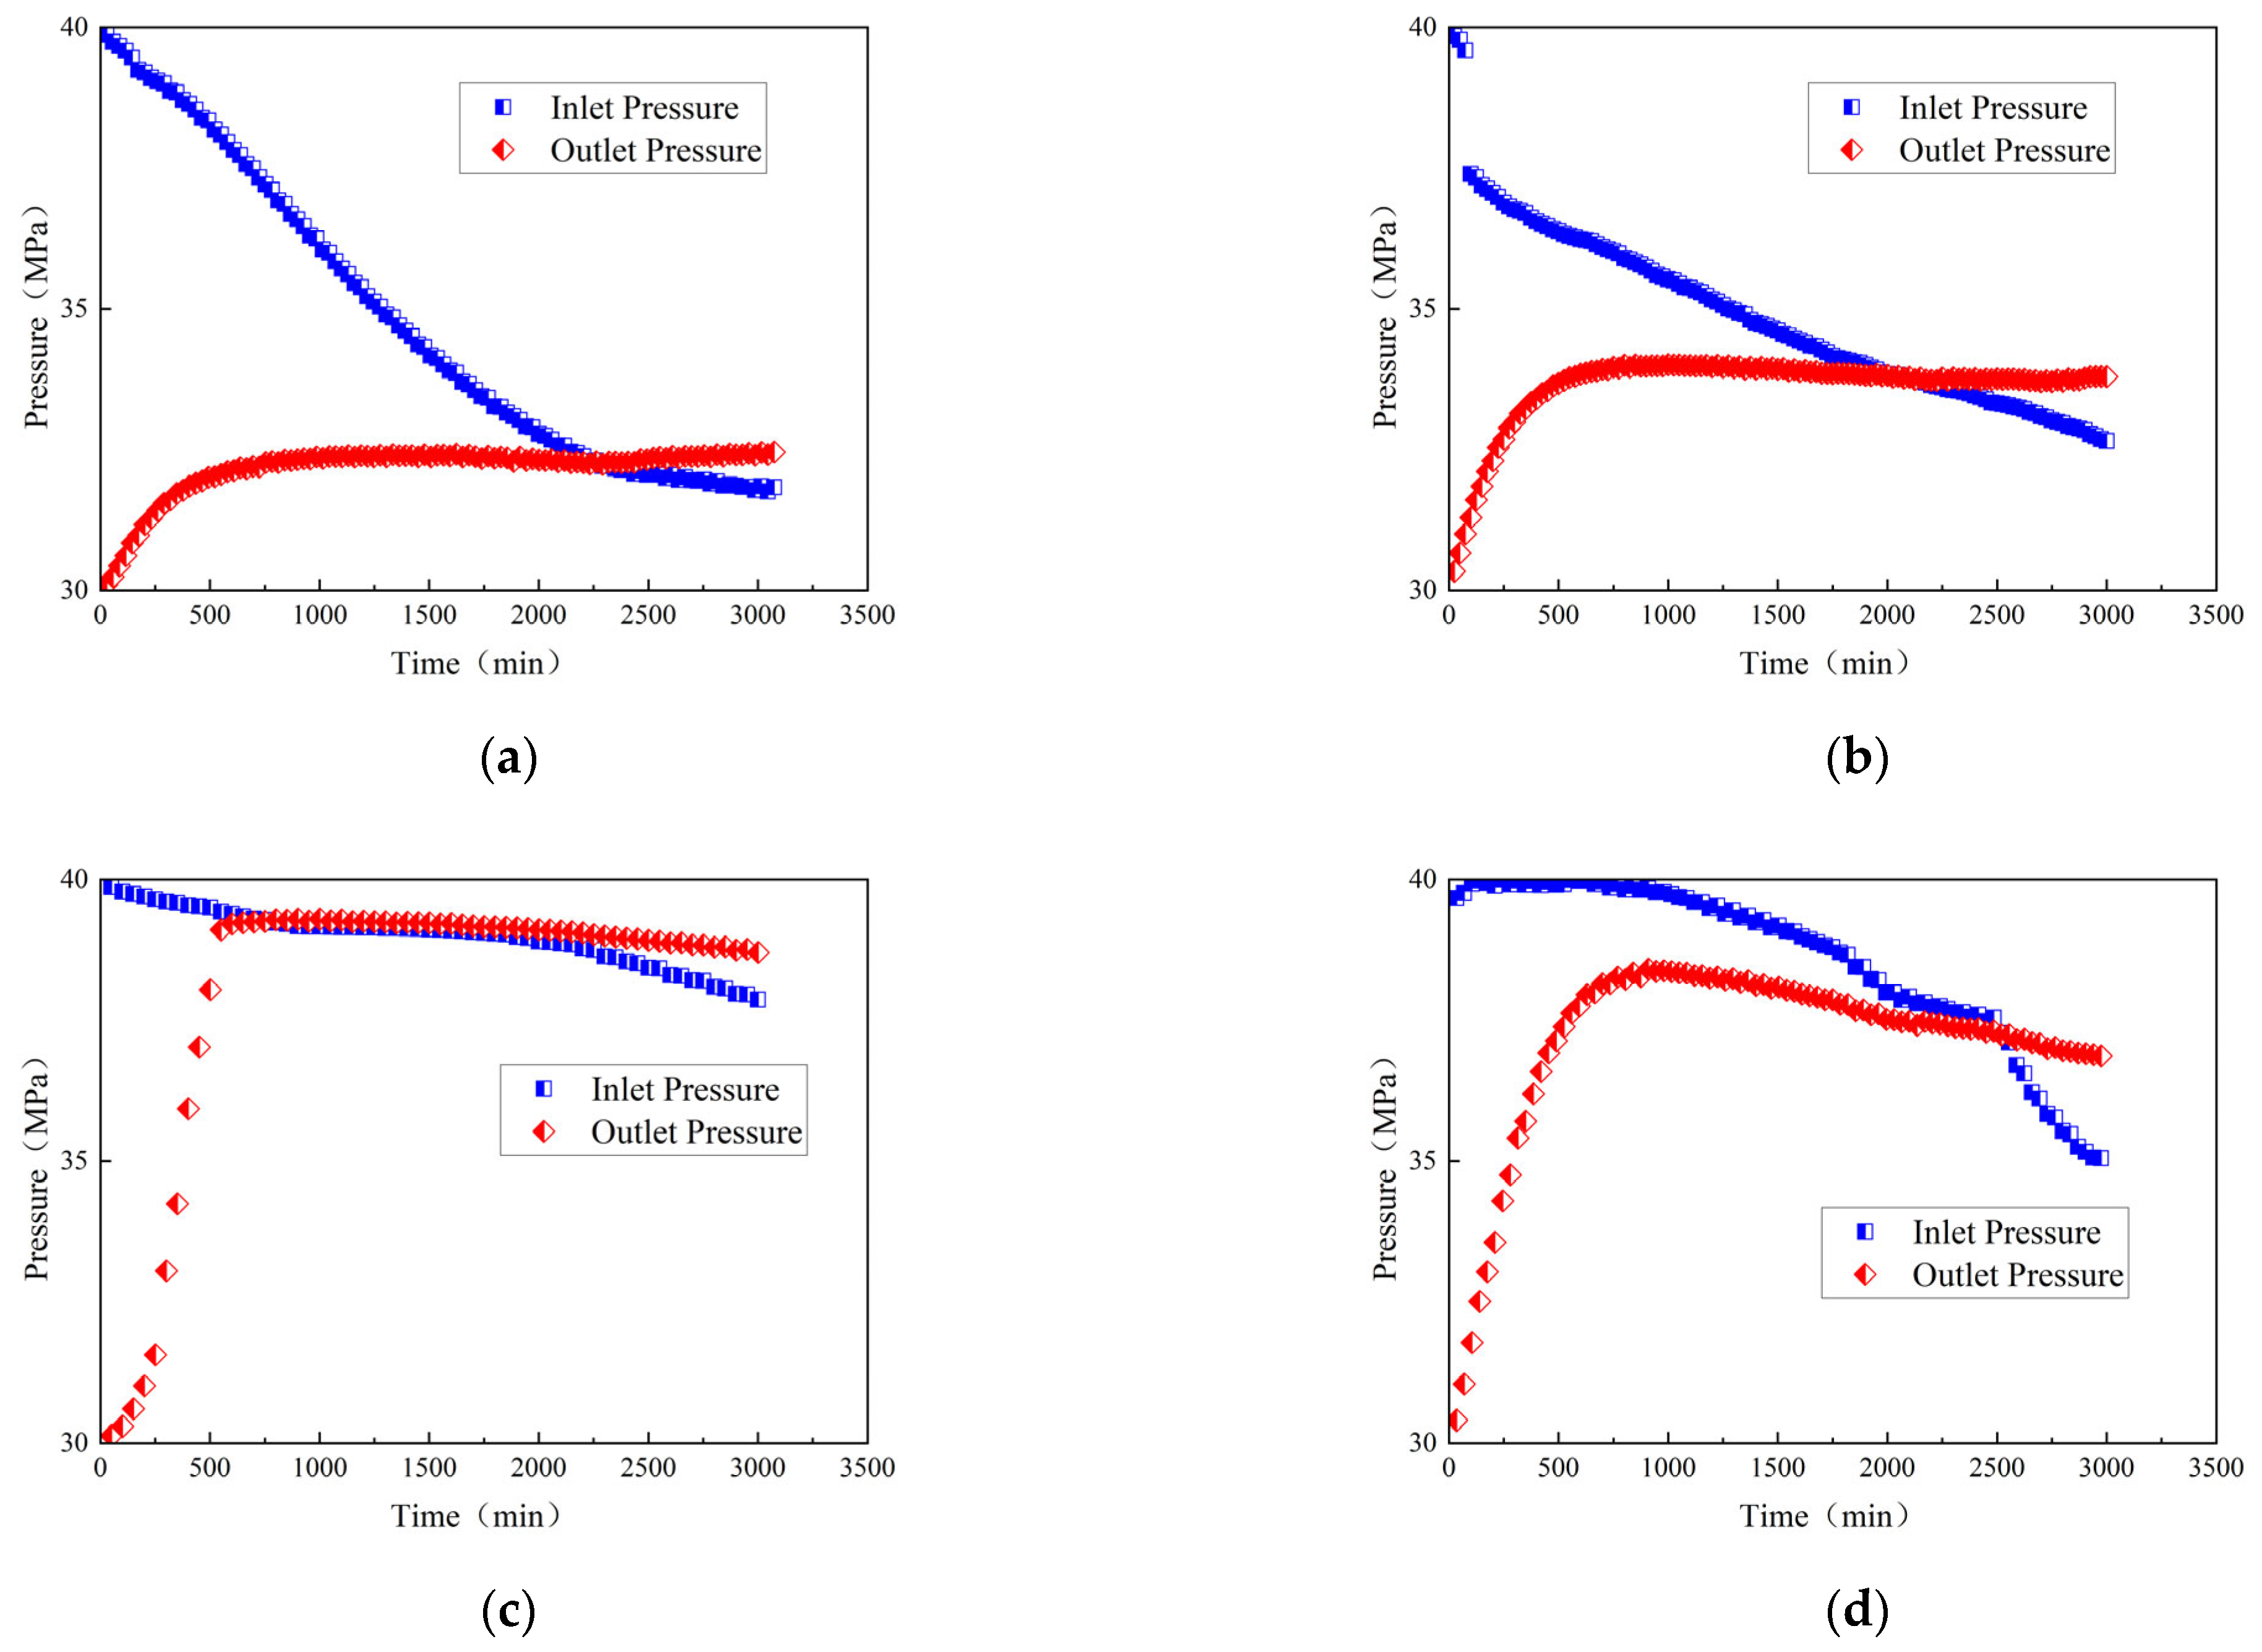
3.1. Energy Storage Effect Law

The pressure variation in the traditional energy storage experiment core is shown in Figure 3. There is no cavity inside the core holder to simulate artificial hydraulic fractures for storing fracturing fluid, and there is no large volume of crude oil at the outlet end of the core to simulate energy storage in a remote shale reservoir. The energy storage experiment results are shown in Figure 3. There is a pressure drop of 0.79 MPa at the inlet end of the J0 core, and only 0.62 MPa of energy is stored at the outlet end. The pressure equilibrium is reached in about 300 min, and the energy storage result is seriously inconsistent with the actual situation in the mine. Due to the closed outlet end, there is no liquid flow, and only a tiny portion of pressure is transmitted to the outlet end. Therefore, it is not possible to obtain an accurate energy storage effect.
The pressure changes at the inlet and outlet ends of the rock cores under different injection methods are statistically analyzed, indicating the pressure consumption of artificial fractures in contact with the near fracture matrix and the pressure energy storage changes in the remote shale reservoir during the well closure process, as shown in Figure 4. Different injection methods show a decreasing trend at the inlet end of the rock core, while the outlet end first rises and then stabilizes.
Among them, the J3 core pure CO2 injection method has the most significant increase in energy storage pressure, with an energy storage pressure of up to 7.847 MPa. The injected fracturing fluid can increase the initial formation pressure by 26%. Due to the formation temperature and pressure conditions, CO2 can mix with crude oil and dissolve in the crude oil and bound water in the rock core, and the energy consumption when dissolved in the core fluid at the moment of contact is about 0.75 MPa. Supercritical CO2 has a significant expansion coefficient and can store more energy in the reservoir. After passing through the fluid inside the core, the pressure can be transmitted to the intermediate container storage tank at the outlet end, and the pressure at the inlet end drops to 37.19 MPa.
The injection method of pure slippery water into the J1 core has the smallest increase in pressure, and the maximum increase in energy storage pressure is 2.45 MPa. It is recorded in the literature that the analysis of the pressure drop test of the horizontal well in the same well area resulted in an average increase of 2.28 MPa in the formation after fracturing transformation, which is highly consistent with the experiment [27,28,29,30]. The injected fracturing fluid can increase the initial formation pressure by 8.2%. The inlet pressure dropped to 31.18 MPa because the sliding water continued to contact the core interface, and under the action of capillary force, continuous infiltration and displacement of sliding water and crude oil occurred, consuming the inlet pressure and resulting in a storage pressure lower than the outlet end of 1.27 MPa.
The J2 core sliding water pre-injection method has a pressure drop of about 1.5 MPa within 30 min in the initial energy storage stage. Then, the inlet pressure decreases until it stabilizes at 32.65 MPa. The export pressure continues to rise, reaching a maximum of 3.92 MPa. The injected fracturing fluid can increase the initial formation pressure by 13.1%. This phenomenon is because, during the initial energy storage stage, a large amount of CO2 dissolves in the sliding water, consuming energy and causing a significant pressure drop. Then, the pressure is stored at the outlet end. The energy storage pressure is slightly higher than that of sliding water storage. Still, the sliding waterfront cannot fully utilize the characteristic of a high CO2 expansion coefficient, and the energy storage effect is limited.
The CO2 pre-injection method for the J4 core slowly decreases at the initial inlet pressure of energy storage, and there is a significant pressure drop of about 2.6 MPa in the later stage. This is because most CO2 dissolves into the core crude oil, and then, the sliding water contacts the core to transfer pressure. After contacting the rock core, energy is transferred, and the pressure drop mode is similar to that of pure slickwater, with a maximum energy storage capacity of 5.51 MPa. The injected fracturing fluid can increase the initial formation pressure by 18.4%.
The following is a comparison of the energy storage effects of four different injection methods: Pure CO2 injection has the most significant energy storage effect and the shortest time to reach energy storage equilibrium; pure slickwater has the lowest energy enhancement effect and the longest time to reach energy storage equilibrium; the energy storage effect of CO2 pre-injection is significantly better than that of sliding water pre-injection, but sliding water pre-injection can effectively improve the permeability of core pores.

3.2. The Influence of Energy Storage on Porosity and Permeability

The changes in porosity and permeability of the rock core before and after the hydraulic fracturing energy storage experiment are shown in Table 4. After the sliding water energy storage experiment, the pore permeability of the rock core remained unchanged, with fluctuations of 1% to 3%. Pure CO2 or CO2 pre-injection can increase permeability by 12% to 20% and porosity by 1% to 2%. After the experiment of a pre-injection method for slickwater, the permeability increased by 126.6%, and the porosity increased by 11.4%. Under geological conditions, injected CO2 can dissolve in slickwater to generate carbonic acid, which has a dissolution effect on some carbonate minerals in the rock core, changes the pore throat structure of the core, and improves the injection capacity of the injected liquid. The pre-injection method for sliding water allows for CO2 to dissolve more into the sliding water, resulting in a significant increase in pore permeability after the core experiments. The CO2 pre-injection method involves CO2 first coming into contact with the rock core and dissolving more in the crude oil. Slickwater cannot come into contact with the rock core, resulting in only a tiny increase in pore permeability.

4. Optimization of CO2 Injection Volume and Well Shut-In Time

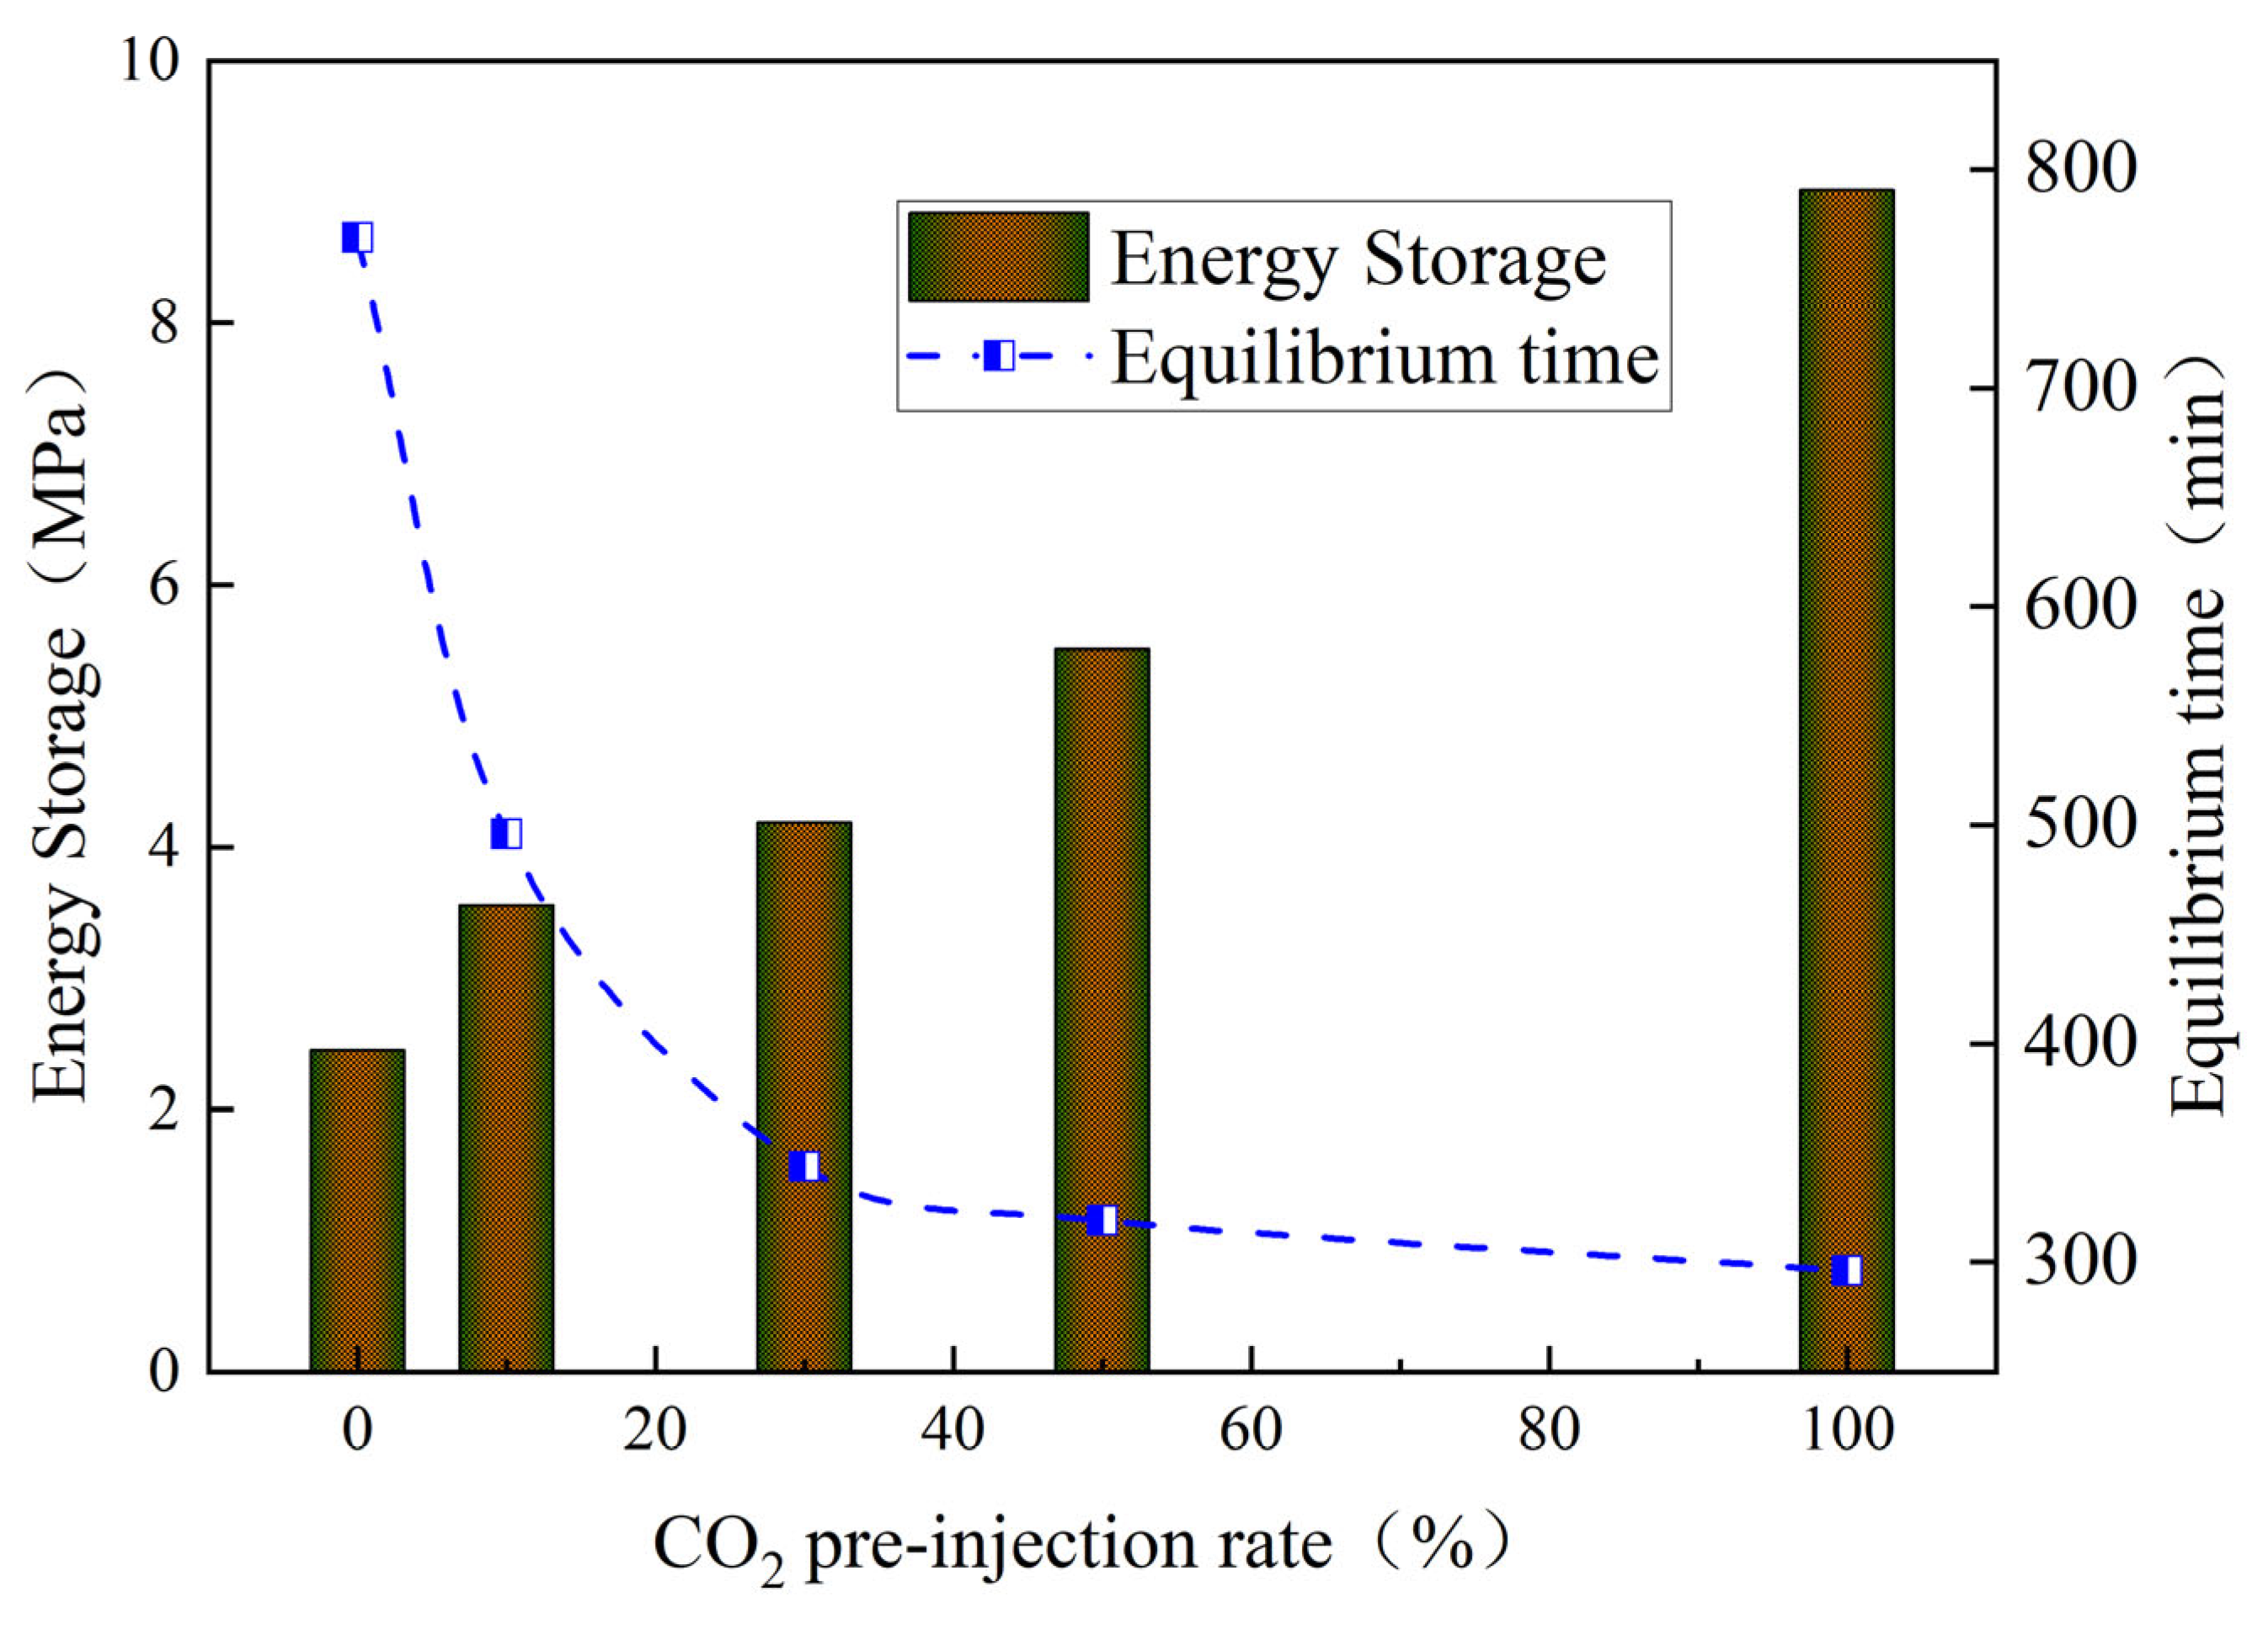
4.1. CO2 Pre-Injection Optimization

According to Section 2.2, the amount of CO2 used is the most direct factor affecting energy storage. The effectiveness of CO2 increases with its usage but is affected by factors such as CO2 source, transportation, storage, and cost. Additionally, CO2 has poor sand-carrying capacity [31] and cannot carry sand over long distances. Therefore, it is necessary to study the impact of CO2 pre-injection on energy storage and optimize it to achieve optimal results. Based on CO2 pre-injection, the pre-liquid volume optimization was carried out, and the energy storage effect of the different CO2 pre-injection cores J3, J4, J5, and J6 after adding statistical data is shown in the bar chart in Figure 4. As the CO2 pre-injection ratio increases, the energy storage pressure of the core also increases, but as the pre-injection amount increases, the increase in energy storage gradually slows down. The reason is that the injected CO2 can dissolve in the fluid inside the core to transfer energy. Still, when the CO2 pre-charge is too large, the gas is prone to premature breakthrough, forming a continuous gas phase in the core’s hollow core, causing pressure to be directly transmitted to the deep part without effectively storing energy in the core. The energy storage growth rate for different CO2 pre-injection ratios can be calculated using Equation (1):
G = ( P C 1 P C 2 ) ( R 1 R 2 )
where G is the energy storage growth rate; PC1 and PC2 are the energy storage pressure under different CO2 pre-injection ratios, MPa; and R1 and R2 are different CO2 pre-injection ratios, %.
The blue curve in Figure 5 represents the calculated energy storage growth rate under different pre-CO2 ratios. The curve shows that the energy storage growth rate reaches its maximum value when the CO2 pre-charge ratio is between 20% and 30%. The red curve in Figure 5 represents the CO2 usage cost under different CO2 usage conditions. From the curve, it can be concluded that, as the CO2 usage increases, the usage cost increases exponentially. Therefore, considering the energy storage pressure, CO2 consumption, CO2 usage coast, and energy storage growth rate, there is an optimal pre-load for CO2, and the experiment’s optimal pre-load range is 20% to 30%. The amount of fracturing fluid used in a single section of the Jimsar shale oil field well is about 2000 m3, and due to factors such as gas sources and transportation costs, the amount of CO2 used is 180 t. Using the volume fraction of 20~30% in this section as the optimal pre-interval for CO2, the optimal usage volume for a single CO2 segment is calculated to be 400 m3~600 m3. Based on a CO2 density of 770 kg/m3 (20 °C), it is recommended to have a single-stage CO2 pre-load of 308 t–462 t on site. The on-site CO2 consumption of the oil well is far beyond the optimal range recommended in this article.

4.2. Optimization of Well Shut-In Time

Based on the energy storage effects of different fracturing fluids in Section 2.2, optimize the shut-in time of different fracturing fluids using the energy storage pressure balance as the evaluation criterion. When the energy storage pressure is less than 0.0001 MPa/min, it is defined that the energy storage reaches equilibrium. Calculate the energy storage balance time for different types of injection methods, as shown in Figure 6. Among them, pure CO2 injection has the shortest energy storage equilibrium time, reaching pressure equilibrium in only 296 min; pure slickwater has the longest energy storage equilibrium time, reaching equilibrium in 769 min. Different CO2 pre-storage pressures and energy storage equilibrium times are between pure CO2 and pure slickwater. As the amount of CO2 precursor increases, more CO2 dissolves in the crude oil. Due to its low interfacial tension and high mass transfer rate, it is conducive to the energy storage effect of subsequent sliding water and quickly reaches energy storage equilibrium. More CO2 plays a swelling role in crude oil, further increasing the pressure for energy storage. Using energy storage balance as the optimization criterion, it is recommended that the optimal shut-in time for CO2 be 5 h and for slickwater be 12.8 h.

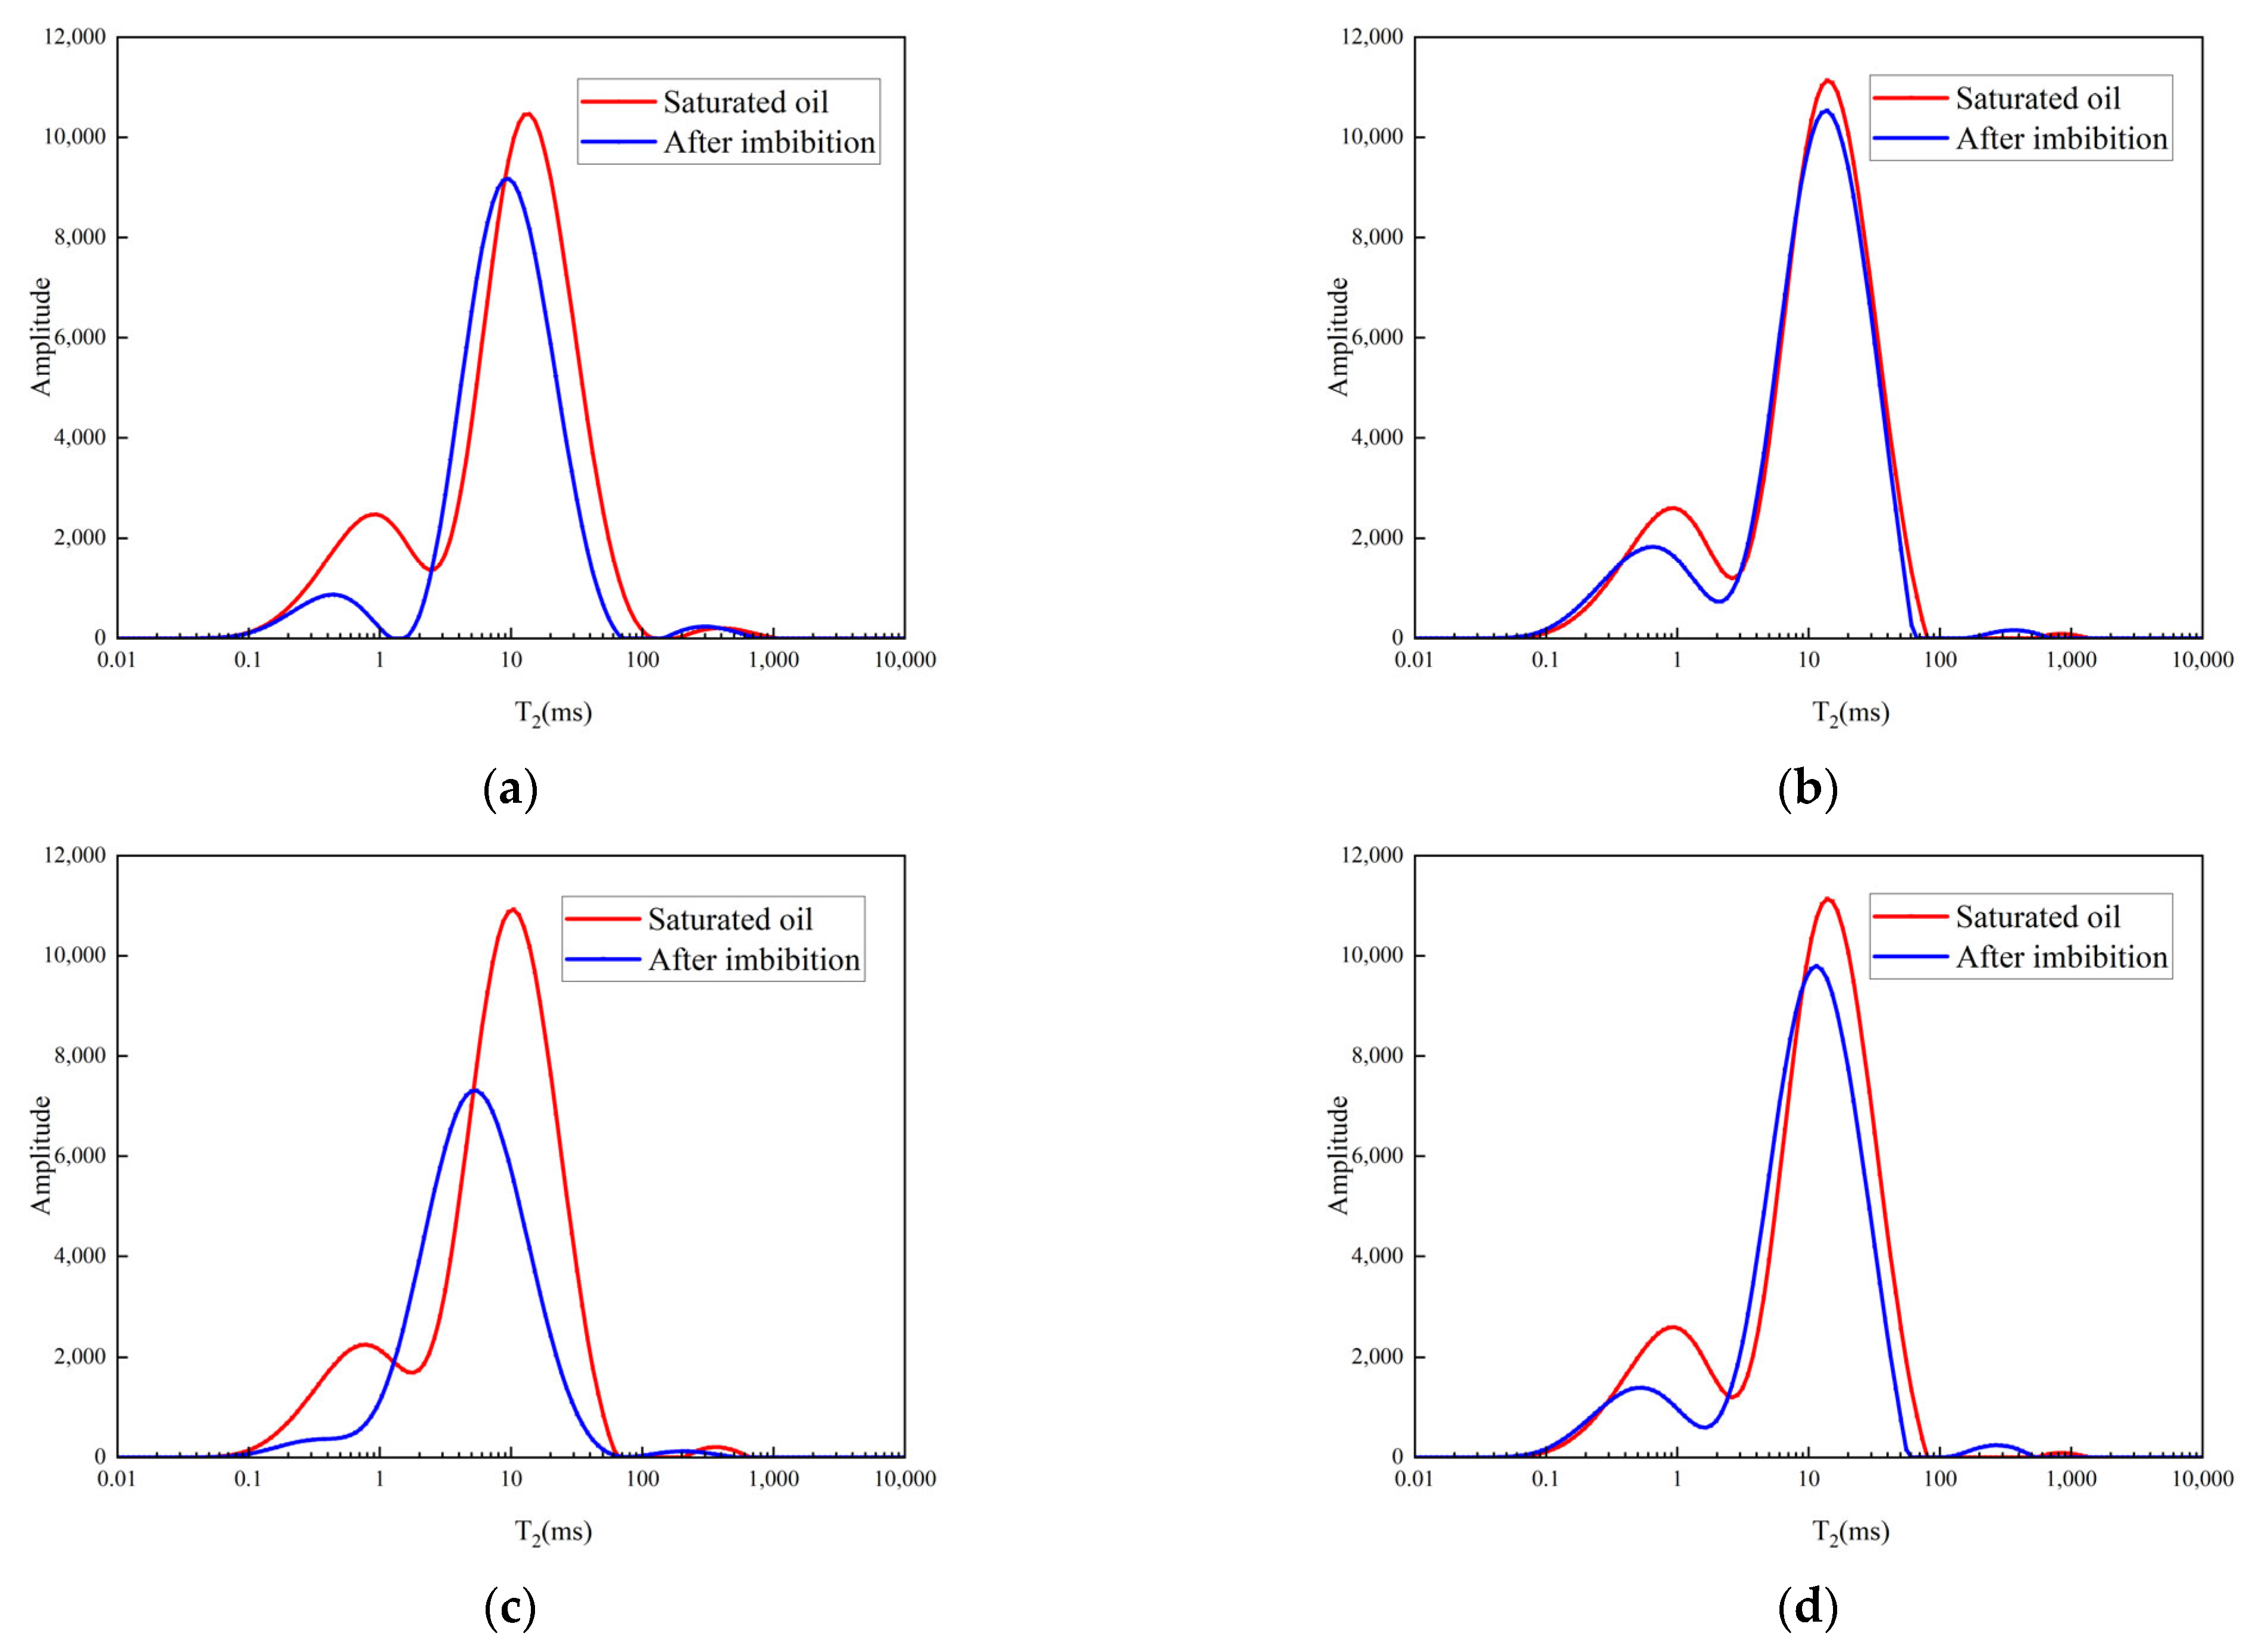
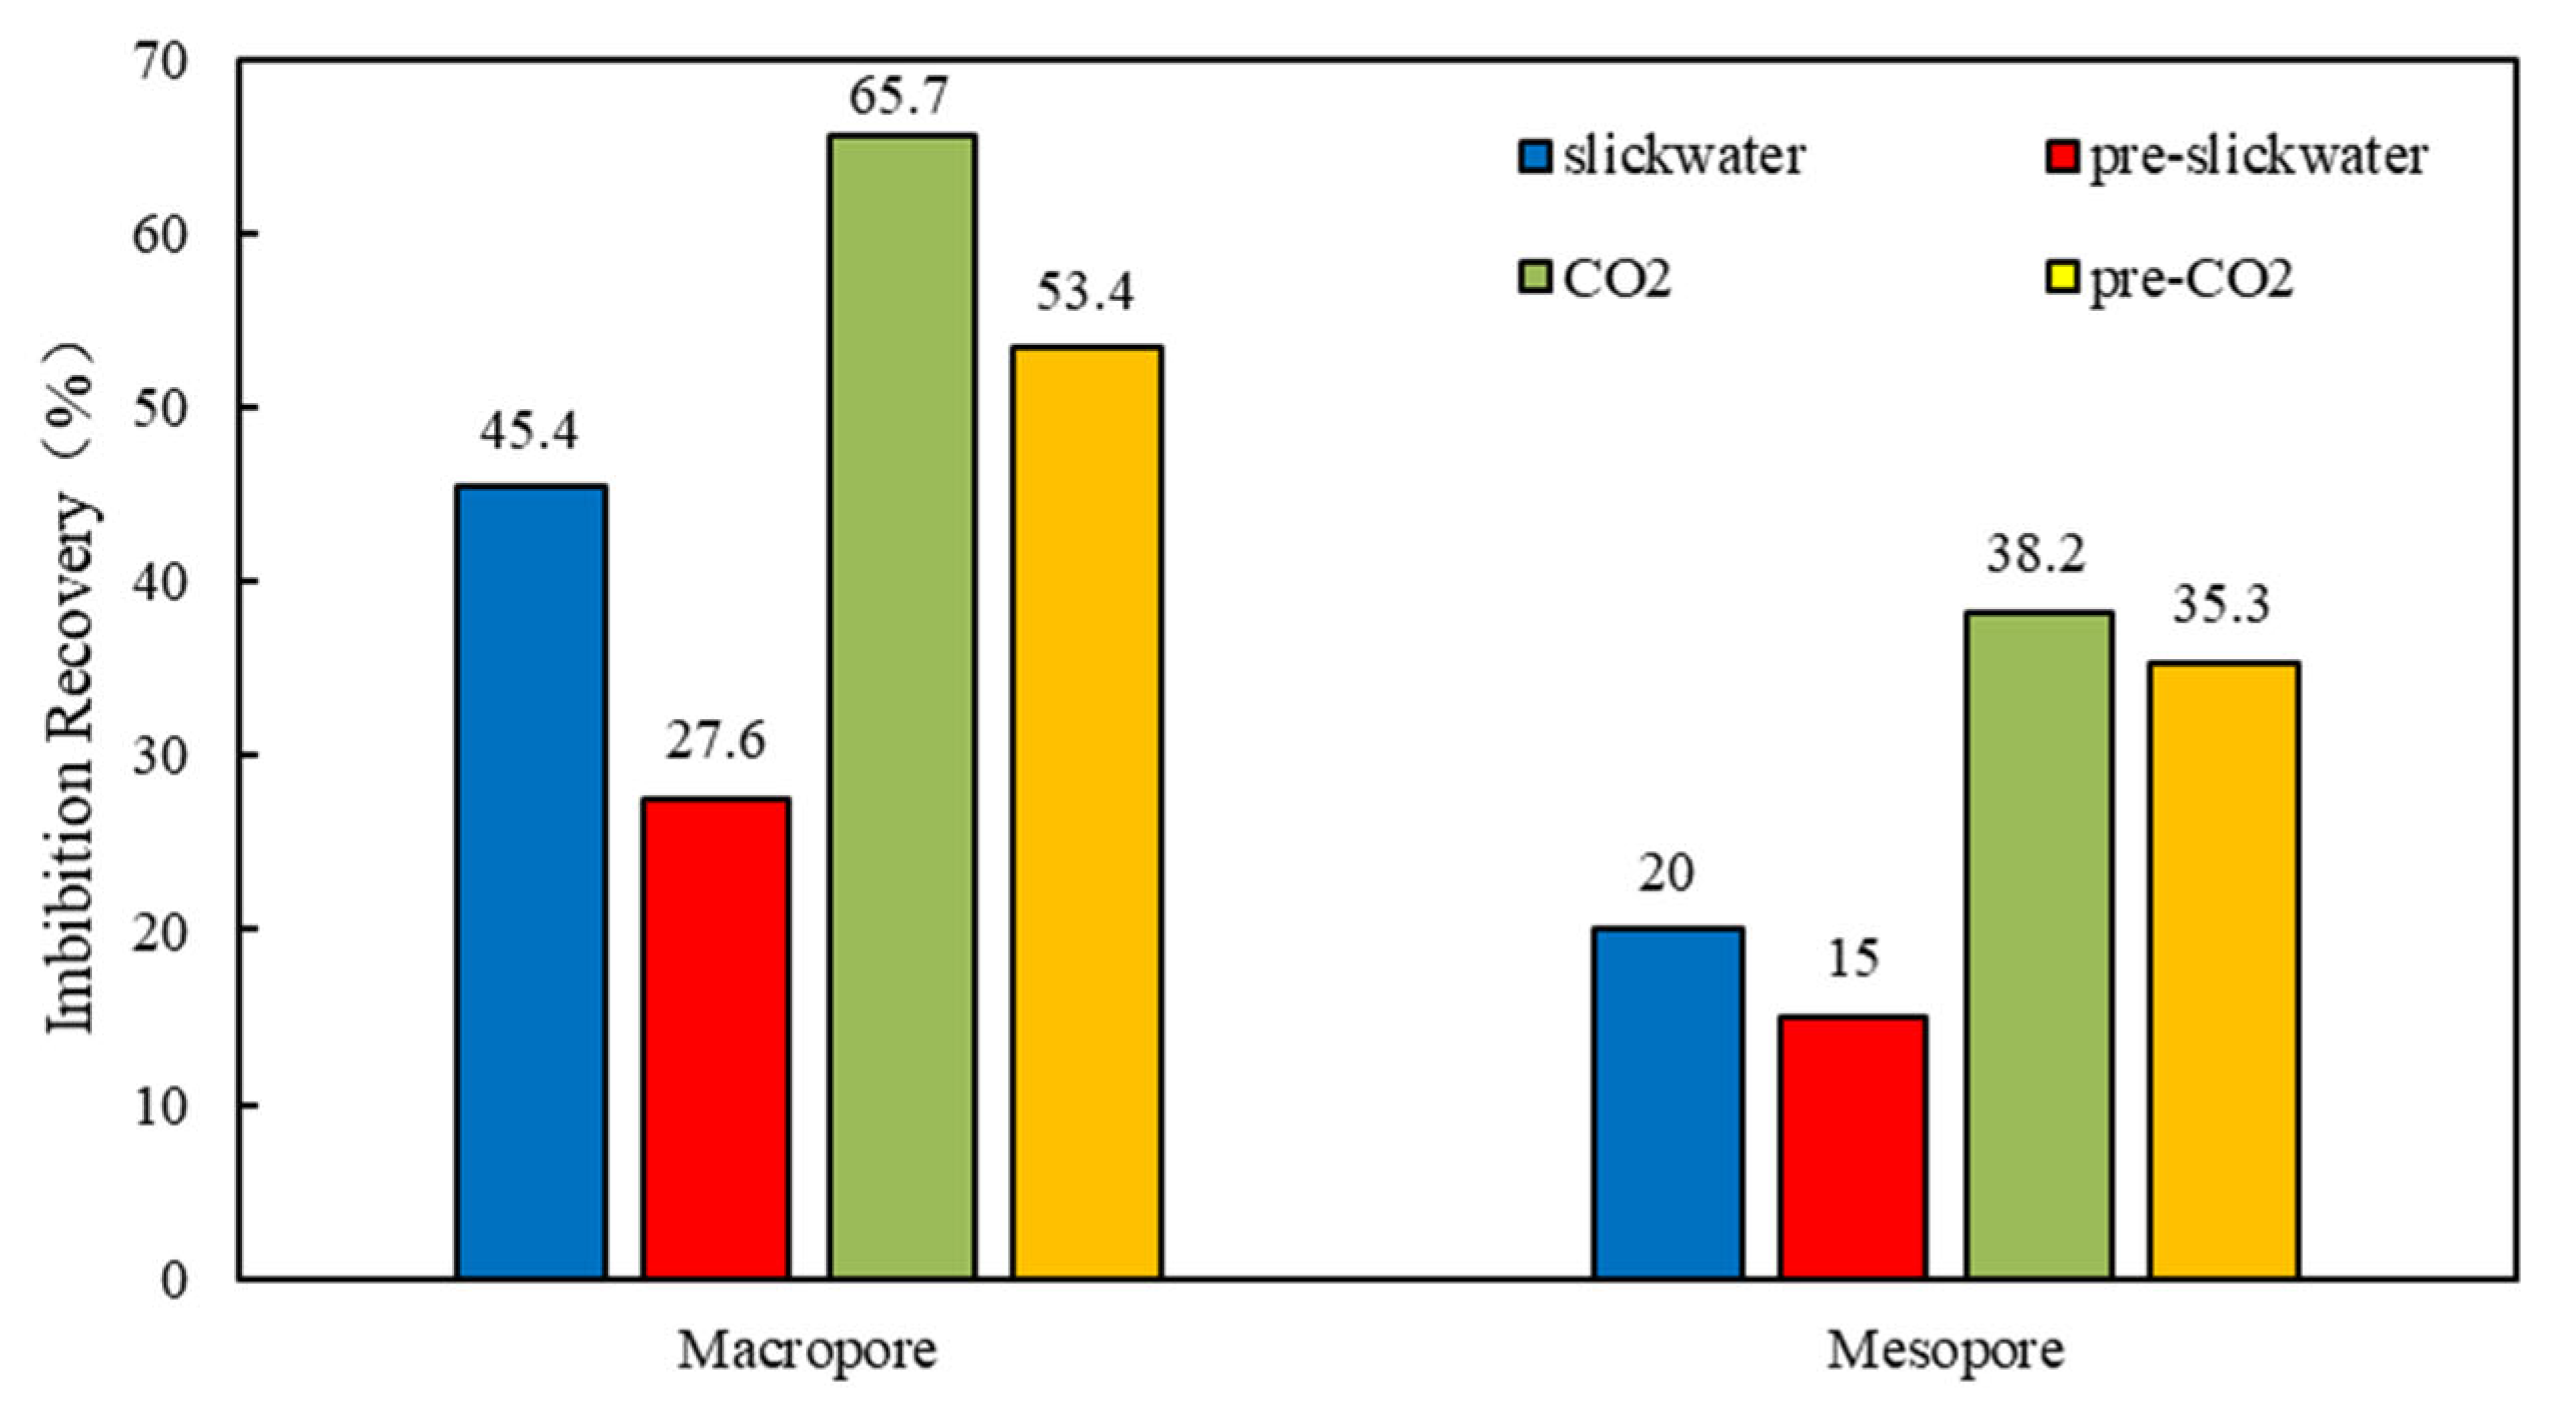
5. Characteristics of Imbibition During the Energy Storage Period

Shale oil core is a porous medium with widely distributed micro- and nano-scale pores and complex pore structures. In order to study the micro-mechanism of shale oil matrix imbibition, including the distribution of crude oil in pores and the range and characteristics of imbibition, the nuclear magnetic resonance testing method was used to measure the oil–water distribution in the rock cores and the permeability and imbibition recovery under different pore conditions. In porous media, the pore radius is directly proportional to the relaxation time. We used heavy water as a fracturing fluid solvent. Heavy water does not have a nuclear magnetic resonance effect, and the fracturing fluid infiltrates into the rock core. When the crude oil is displaced from the rock core, the overall nuclear magnetic resonance signal of the rock core decreases, reflecting the relative content of crude oil in the rock core.
Firstly, we tested the nuclear magnetic resonance T2 spectra of six sets of rock cores saturated with crude oil in the experiment. From Figure 7a, it can be seen that six sets of standard core columns taken from the same full-diameter core have the same nuclear magnetic resonance T2 spectrum, and the pore structure of crude oil is similar, which can be used as a control group for comparative experiments. For this nuclear magnetic resonance experiment, the transverse relaxation time distribution of nuclear magnetic resonance was compared with the pore throat radius distribution obtained by the mercury intrusion method by changing different pore transformation relationships. The transverse relaxation time was 0.03 ms~977 ms, corresponding to the tested core pore throat radius of 0.004 μm~0.4 μm. The optimal transformation relationship was obtained as Equation (2).
R = 0.00606 T 2 + 0.0244
where R is the poro radius, μm; and T2 is transverse relaxation time, ms.
According to the pore size distribution map, the oil-bearing pore size of the sweet spot core in Jimsar is mainly distributed between 0.02 μm and 0.51 μm. The core exhibits typical bimodal characteristics, with bimodal as the boundary between mesopores and macropores. The pore size distribution of macropores on the left peak is between 0.02 μm and 0.042 μm, while the pore size distribution of mesopores on the right peak is between 0.042 μm and 0.51 μm. The right peak is significantly higher than the left peak, and the area of the left peak accounts for 82.4% of the total area, which means that oil containing mesopores account for 82.4% of the total oil containing pores. Large pore crude oil occupies the dominant position in core crude oil storage.
Figure 8 shows the nuclear magnetic resonance T2 spectra of the different rock cores J1–J4 before and after the energy storage and efficiency enhancement experiment. After the core energy storage experiment, a bimodal decrease phenomenon was observed, with no decrease in dimensional amplitude, indicating that the crude oil with signals in the core was displaced. Combined with the weak hydrophilic characteristics of the sweet spot on Jimsar, under the action of capillary force, the slippery water and CO2 at the inlet were absorbed into the core and replaced with crude oil. The degree of decrease in the left peak is greater than that in the right peak, and the recovery rate of macropore infiltration is 14% to 27.5% higher than that of mesopore infiltration. This is because capillary force serves as the driving force for imbibition, and it is inversely proportional to the pore size. The smaller the pore size, the greater the capillary force, and the greater the degree of utilization of macropores. After the completion of the energy storage of the sliding water and the pre-drilled rock core, there was no change in the position of the right spectral peak, only a decrease in amplitude; compared to CO2 and CO2 pre-storage cores, the right peak shifts to the left after the energy storage is completed. Under the pressure increase of CO2 storage, the crude oil in the larger pores is infiltrated and displaced out of the core, and the dissolved CO2 in the crude oil causes the crude oil in the core pores to redistribute, resulting in a left shift of the spectral peak.
According to Equation (2), we calculate the lower limit of oil containing pore utilization for different rock cores, and the statistical results are shown in Table 5. The core permeability and recovery rate of CO2 series fracturing fluid is about 10% higher than that of the slickwater series, and the lower limit of oil containing pore utilization is lower than that of slickwater. CO2 can enter and utilize smaller oil containing pores. According to Figure 9, the permeability and imbibition recovery of different rock cores with large and macropores are higher than those of the fracturing fluid in the sliding water system. During the energy storage period, CO2 can dissolve into the crude oil to reduce its viscosity, interfacial tension between oil and water, and thus lower the resistance of oil phase seepage. The recovery rate of macropores is significantly higher than that of slickwater. During the energy storage period, CO2 dissolves into the crude oil in the core, reducing the viscosity of the crude oil while increasing fluid pressure. During pressure relief measurement using nuclear magnetic resonance, more large pore crude oil can be utilized, and CO2 energy storage can effectively increase energy and improve core recovery.
The shale reservoir of the Permian Lucaogou Formation in Jimusar has a certain ability to absorb and replace slippery water and CO2 during well shut-in. CO2 can be used to extract crude oil from smaller pores and effectively utilize crude oil from larger pores. Combined with the CO2 energy storage effect, CO2 can be pre-injected, and the shut-in time can be extended to maximize the energy storage and infiltration displacement during the shut-in period, thereby improving the initial production capacity of the Jimsar shale oil reservoir.

6. Conclusions

This article describes the innovative design of an experimental process for fracturing fluid energy storage for shale oil reservoirs. By improving existing experimental equipment and simulating the triple zone of artificial fractures, near fracture reservoirs, and remote reservoirs, this study explores the energy storage effect of hydraulic fracturing fluid in shale reservoirs under real oil–water ratio and pressure distribution conditions. The main insights gained are as follows:
  • By measuring and comparing the pore permeability characteristics of the Jimsar core before and after energy storage, it was found that different fracturing fluids showed varying degrees of improvement in porosity and permeability after energy storage. Among them, CO2 pre-dissolved in the sliding water can be more dissolved in the sliding water, increasing the permeability of the rock core by about 1.26 times and the porosity by 11.4%. The pre-shut-in time of the sliding water can be appropriately extended to achieve the dissolution effect.
  • The energy storage effects of four fracturing fluids were compared, namely pure CO2, CO2 pre-fracturing fluid, sliding water pre-fracturing fluid, and pure sliding water fracturing fluid. The results showed that, due to the high expansion coefficient and low interfacial tension of pure CO2, the energy storage effect of pure CO2 was the best, with an energy storage pressure of up to 7.85 MPa. The energy storage effect of pure sliding water fracturing fluid was the opposite, with an energy storage pressure of only 2.45 MPa.
  • Considering factors such as comprehensive economy and energy storage efficiency, the optimal range for CO2 pre-load is between 20% and 30%. Based on a CO2 density of 770 kg/m3 (20 °C) and a single-stage fracturing fluid consumption of 2000 m3, it is recommended to use 308 t–462 t of on-site single-stage CO2 pretreatment.
  • Based on the optimization criterion of energy storage pressure balance, the optimal shut-in time for CO2 should be 5 h and for slickwater 12.8 h.
  • Compared with different types of fracturing fluids, CO2 can effectively utilize small pore crude oil in rock cores, while more mesopore crude oil is utilized on the basis of energy storage. The recovery of imbibition is about 29%, which is about 10% higher than that of slickwater.
  • This research can provide assistance in determining the CO2 pre-injection and well shut-in time of the Jimsar Lucaogou Formation well area. The results provide theoretical support for energy storage fracturing construction in other shale oil reservoirs of the same type.
  • This article has not yet given detailed consideration to the simulation of crack complexity setting and backflow stage after well shut-in. Subsequently, integrated experimental analysis of fracturing, shut-in, and backflow can be conducted on the full diameter scale physical model to obtain full life cycle analysis data of rock cores containing artificial fractures.

Author Contributions

Methodology, S.Z.; Software, J.W.; Validation, J.W.; Formal analysis, F.W.; Data curation, Z.L.; Writing—review & editing, J.Z.; Supervision, F.W.; Project administration, J.W.; Funding acquisition, F.W. All authors have read and agreed to the published version of the manuscript.

Funding

This work is supported by the National Natural Science Foundation of China (No. 51974332).

Data Availability Statement

Data are contained within the article.

Conflicts of Interest

Authors Junchao Wang and Zhanjie Li were employed by PetroChina Xinjiang Oilfield Company. The remaining authors declare that the research was conducted in the absence of any commercial or financial relationships that could be construed as a potential conflict of interest.

References

  1. Li, Q.; Li, Q.; Wu, J.; Li, X.; Li, H.; Cheng, Y. Wellhead Stability During Development Process of Hydrate Reservoir in the Northern South China Sea: Evolution and Mechanism. Processes 2025, 13, 40. [Google Scholar] [CrossRef]
  2. Li, Q.; Li, Q.; Cao, H.; Wu, J.; Wang, F.; Wang, Y. The Crack Propagation Behaviour of CO2 Fracturing Fluid in Unconventional Low Permeability Reservoirs: Factor Analysis and Mechanism Revelation. Processes 2025, 13, 159. [Google Scholar] [CrossRef]
  3. Caineng, Z.; Zhi, Y.; Rukai, Z.; Guosheng, Z.; Lianhua, H.; Songtao, W.; Shizhen, T.; Xuanjun, Y.; Dazhong, D.; Yuman, W.; et al. Progress in unconventional oil and gas exploration and development and theoretical technology in China. J. Geol. 2015, 89, 979–1007. [Google Scholar]
  4. Wang, R.; Hu, Z.; Dong, L.; Gao, B.; Sun, C.; Yang, T.; Wang, G.; Yin, S. Progress and Reflection on Shale Gas Reservoir Characterization and Evaluation Technology. Geol. Oil Gas 2021, 42, 54–65. [Google Scholar]
  5. Wang, Y.; Lu, Y.; Li, Y.; Wang, X.; Yan, X.; Zang, Z. Progress and Application of Unconventional Reservoir Fracturing Technology. J. Pet. 2012, 33, 149–158. [Google Scholar]
  6. Jin, Z.; Zhang, Q.; Zhu, R.; Dong, L.; Fu, J.; Liu, H.; Yun, L.; Liu, G.; Li, M.; Zhao, X.; et al. Classification and significance of continental shale oil in China. Geol. Oil Gas 2023, 44, 801–819. [Google Scholar]
  7. Wang, Q.; Tao, S.; Guan, P. Research and Exploration and Development Progress of Shale Oil in Continental Basin of China. Nat. Gas Geosci. 2020, 31, 417–427. [Google Scholar]
  8. Xiong, X.; Hao, M. The damage mechanism and protection technology of low porosity and low permeability reservoirs. Liaoning Chem. 2013, 42, 1223–1225. [Google Scholar]
  9. You, L.; Xie, B.; Yang, J.; Kang, Y.; Han, H.; Wang, L.; Yang, B. The damage mechanism of a shale gas well fracturing fluid backflow on reservoir fractures. Nat. Gas Ind. 2018, 38, 61–69. [Google Scholar]
  10. Liang, T.; Zhou, F.; Lu, J.; DiCarlo, D.; Nguyen, Q. Evaluation of Wettability Alteration and IFT Reduction on Mitigating Water Blocking for Low-Permeability Oil-Wet Rocks after Hydraulic Fracturing. Fuel 2017, 209, 650–660. [Google Scholar] [CrossRef]
  11. Hu, J.; Zhao, H.; Du, X.; Zhang, Y. An analytical model for shut-in time optimization after hydraulic fracturing in shale oil reservoirs with imbibition experiments. J. Pet. Sci. Eng. 2022, 210, 110055. [Google Scholar] [CrossRef]
  12. Song, Y.; Zhou, L.; Guo, X.; Guo, X.; Chang, Q.; Wang, X. Characteristics and distribution of lacustrine cloud tight oil reservoirs in Lucaogou Formation of Jimusar Sag, the Junggar Basin. J. Rock Sci. 2017, 33, 1159–1170. [Google Scholar]
  13. Wang, J.; Zhou, L.; Liu, J.; Zhang, X.; Zhang, F.; Zhang, B. Characteristics of acid alkali alternative diagenesis of the Permian Lucaogou Formation in Jimusar Sag, the Junggar Basin and its impact on shale reservoirs. Pet. Explor. Dev. 2020, 47, 898–912. [Google Scholar] [CrossRef]
  14. Zheng, M.; Li, J.; Wang, W.; Li, P.; Yang, H.; Wu, X.; Yu, J. Analysis of tight reservoir oil filling and accumulation process: Take the Permian Lucaogou Formation in Jimusar Sag of the Junggar Basin as an example. Earth Sci. 2018, 43, 3719–3732. [Google Scholar]
  15. Wei, C.; Wei, D.; Huang, L.; Li, Z. Geochemical characteristics and genesis of Permian heavy oil in Jimusaer Depression, Xinjiang. Nat. Gas Geosci. 2012, 23, 135–140. [Google Scholar]
  16. Ma, S.; Yang, S.; Lv, D.; Kou, G.; Yang, L.; Lei, H. A Study on the Elastic Recovery Law and Influencing Factors of Tight Reservoirs: Taking the Lucaogou Formation in the Jimusaer Basin of Xinjiang as an Example. Sci. Technol. Eng. 2016, 16, 147–151+156. [Google Scholar]
  17. Zhang, H. Practice and understanding of improving oil recovery by CO2 mixed phase flooding. Daqing Pet. Geol. Dev. 2020, 39, 114–119. [Google Scholar]
  18. Kamari, A.; Arabloo, M.; Shokrollahi, A.; Gharagheizi, F.; Mohammadi, A.H. Rapid method to estimate the minimum miscibility pressure (MMP) in live reservoir oil systems during CO2 flooding. Fuel 2015, 153, 310–319. [Google Scholar] [CrossRef]
  19. Sugai, Y.; Babadagli, T.; Sasaki, K. Consideration of an effect of interfacial area between oil and CO2 on oil swelling. J. Pet. Explor. Prod. Technol. 2014, 4, 105–112. [Google Scholar] [CrossRef]
  20. Bikkina, P.; Wan, J.; Kim, Y.; Kneafsey, T.J.; Tokunaga, T.K. Influence of wettability and permeability heterogeneity on miscible CO2 flooding efficiency. Fuel 2016, 166, 219–226. [Google Scholar] [CrossRef]
  21. Sang, S.; Yuan, L.; Liu, A.; Sang, S.; Yuan, L.; Liu, A.; Han, S.; Zheng, S.; Liu, T.; Zhou, X.; et al. Carbon Neutrality Geological Technology and Its Prospective Application in Low Carbonization of Coal. J. Coal Sci. 2022, 47, 1430–1451. [Google Scholar]
  22. Torabi, F.; Asghari, K. Effect of operating pressure, matrix permeability and connate water saturation on performance of CO2 huff-and-puff process in matrix-fracture experimental model. Fuel 2010, 89, 2985–2990. [Google Scholar] [CrossRef]
  23. Alfarge, D.; Wei, M.; Bai, B. Factors affecting CO2-EOR in shale-oil reservoirs: Numerical simulation study and pilot test s. Energy Fuels 2017, 31, 8462–8480. [Google Scholar] [CrossRef]
  24. Hu, Y.; Hao, M.; Chen, G.; Sun, R.; Li, S. Technologies and practice of CO2 flooding and sequestration in China. Pet. Explor. Dev. 2019, 46, 753–766. [Google Scholar] [CrossRef]
  25. Zou, Y.; Li, Y.; Li, S. The effect of CO2 pre injection on the morphology of shale fracturing fractures and rock properties. Nat. Gas Ind. 2021, 41, 83–94. [Google Scholar]
  26. Ding, Y.; Ma, X.; Ye, L.; Xiao, Y.; Zhang, Y.; Gu, Y.; Ma, C. Research on CO2 rock breaking mechanism and fracturing technology. Lithol. Oil Gas Reserv. 2018, 30, 151–159. [Google Scholar]
  27. Wang, F.; Wu, B.; Liao, K.; Shi, S.; Zhang, S.; Li, J.; Suo, J. Inversion of Fracture Parameters and Formation Pressure for Fractured Horizontal Wells in Shale Oil Reservoir Based on Soaking Pressure. Xinjiang Pet. Geol. 2022, 43, 624–629. [Google Scholar]
  28. Xu, J.; Wang, M.; Wang, J.; Sun, H.; Wang, L. Practice and understanding of volume fracturing technology for horizontal wells in Jimsar shale oil reservoir. Xinjiang Oil Gas 2024, 20, 23–29. [Google Scholar]
  29. Li, B. Investigation into Stimulation Mechanism of CO2 Pre-pad Energized Fracturing in Jimusar Shale Oil Reservoir. Ph.D. Thesis, China University of Petroleum, Beijing, China, 2023. [Google Scholar] [CrossRef]
  30. Xu, T.; Wu, C.; Chen, Y.; Zhang, J.; Luo, H.; Zhao, J.; Wang, L. Numerical simulation study on CO2 pre fracturing of Jimsar shale oil. In Proceedings of the 2022 International Conference on Oil and Gas Field Exploration and Development II Jiqing Oilfield Operation Area of Xinjiang Oilfield Branch, Xi’an, China, 16–18 November 2022; Volume 13. [Google Scholar]
  31. Sun, X.; Wang, H.; Li, Y.; Zheng, Y.; Lu, Q. Experimental study on sand carrying in supercritical CO2 horizontal annulus. Pet. Drill. Technol. 2022, 50, 17–23. [Google Scholar]
Figure 1. Experimental device for shut-in energy storage.
Energies 18 01412 g001
Figure 2. Schematic diagram of shut-in energy storage experiment.
Energies 18 01412 g002
Figure 3. Pressure variation in J0 traditional energy storage experiment.
Energies 18 01412 g003
Figure 4. Changes in inlet and outlet pressures under different injection methods: (a) Pressure changes in J1 rock core in slickwater; (b) Pressure changes in J2 rock core in pre-slickwater; (c) Pressure changes in J3 rock core in CO2; (d) Pressure changes in J4 rock core in pre-CO2.
Energies 18 01412 g004
Figure 5. Storage pressure and storage growth rate of different CO2 pre-injection ratios.
Energies 18 01412 g005
Figure 6. Energy storage pressure and equilibrium time with different CO2 pre-injection ratios.
Energies 18 01412 g006
Figure 7. Initial NMR T2 spectra and pore size conversion of experimental rock cores: (a) NMR spectra of saturated crude oil from different rock cores; (b) Pore throat distribution and pore size conversion.
Energies 18 01412 g007
Figure 8. T2 NMR spectra of rock cores before and after imbibition under different energy storage methods: (a) T2 spectra changes in J1 rock core in slickwater; (b) T2 spectra changes in J2 rock core in pre-slickwater; (c) T2 spectra changes in J3 rock core in CO2; (d) T2 spectra changes in J4 rock core in pre-CO2.
Energies 18 01412 g008
Figure 9. Different rock cores with different pore permeability and imbibition recovery.
Energies 18 01412 g009
Table 1. Consumption of fracturing fluid and crude oil at different scales.
Field-Scale (Single Stage)Experimental Scale
ParametersNear FractureFar FractureParametersCore sample
Fracture length (Lf)/m260260Core length (L)/cm6
Fracture height (hf)/m2424Core radius (r)/cm1.25
Clusters (n)55Porosity (φ)/%13
Half-cluster spacing (Cf)/m0.063.94Calculation formulaL × π × r2 × φ
Porosity (φ)/%1313Crude oil volume/cm33.82
Calculation formulaLf × hf × n × Cf × φ × 2Fracturing fluid/cm316
Crude oil volume/m3486.7231,961.28Remote crude oil volume/cm3256
Fracturing fluid: Near fracture crude oil: Remote crude oil2000:486.72:31,961.28
≈4:1:64
Fracturing fluid: Near fracture crude oil: Remote crude oil15.5:3.82:244
≈4:1:64
Table 2. Basic parameters of core samples.
CoreMass/gDiameter/cmLength/cmLithologyPermeability/mDPorosity/%
J054.252.475Grey mudstone sandstone0.1514.45
J153.352.535Grey mudstone sandstone0.1616.49
J253.272.505Grey mudstone sandstone0.14115.58
J353.642.515Grey mudstone sandstone0.15815.79
J453.382.525Grey mudstone sandstone0.13211.85
J553.222.505Grey mudstone sandstone0.09616.41
J653.152.505Grey mudstone sandstone0.07313.22
Table 3. Experimental scheme for energy storage in well shut-in time.
Core NumberExperimental SchemeEnergy Storage Method
J0Tradition10 MPa slickwater
J1Pure Slickwater10 MPa slickwater
J2Pre-Slickwater5 MPa slickwater + 5 MPa CO2
J3Pure CO210 MPa CO2
J4Pre-CO25 MPa CO2 + 5 MPa slickwater
J53 MPa CO2 + 7 MPa slickwater
J61 MPa CO2 + 9 MPa slickwater
Table 4. Changes in core porosity and permeability before and after the experiment.
Core NumberExperimental SchemeInitial Permeability/mDPost-Experiment Permeability/mDGrowth Rate/%Initial Porosity/%Post-Experiment Porosity/%Growth Rate/%
J1Pure Slickwater0.160.1663.816.4916.711.35
J2Pre-Slickwater0.1410.320126.615.5817.3611.4
J3Pure CO20.1580.18013.915.7916.081.83
J45 MPa CO2 + 5 MPa slickwater0.1320.1481211.8511.991.15
Table 5. Different core infiltration recovery rates and lower limit of pore utilization.
Core NumberExperimental SchemeImbibition Recovery, %Lower Limit of Pore Utilization, μm
J1slickwater20.40.02525
J2pre-slickwater18.50.02579
J3CO230.50.02501
J4pre-CO228.50.02509
Disclaimer/Publisher’s Note: The statements, opinions and data contained in all publications are solely those of the individual author(s) and contributor(s) and not of MDPI and/or the editor(s). MDPI and/or the editor(s) disclaim responsibility for any injury to people or property resulting from any ideas, methods, instructions or products referred to in the content.

