Article

Simulation and Experimental Research on a Fluidic Oscillator with a Deflector Structure

1
College of Construction Engineering, Jilin University, Changchun 130026, China
2
Key Laboratory of Drilling and Exploitation Technology in Complex Conditions, Ministry of Natural and Resources, Jilin University, Changchun 130026, China
*
Author to whom correspondence should be addressed.
Energies 2025, 18(6), 1336; https://doi.org/10.3390/en18061336
Submission received: 28 February 2024 / Revised: 20 October 2024 / Accepted: 20 February 2025 / Published: 8 March 2025

Abstract

In the exploitation of deep geothermal energy from hot dry rock (HDR) reservoirs, traditional drilling methodologies exhibit a retarded penetration rate, posing a significant impediment to efficient energy extraction. The fluidic DTH hammer is recognized as a drilling method with potential in hard formations. However, a low energy utilization was observed due to the substantial fluid loss in the fluidic oscillator (the control component of a fluidic hammer). In order to reduce the energy loss and improve the performance of fluidic hammers, a fluidic oscillator with a deflector structure is proposed in this paper. Utilizing Computational Fluid Dynamics (CFD) simulations, the optimal structural parameters for the deflector structure have been delineated, with dimensions specified as follows: a = 13.5 mm; b = 2.0 mm; and c = 2.2 mm. Subsequently, the flow field and the performance were observed. The maximum flow recovery of the output channel of the deflector structure increased by 9.1% in the backward stroke and 3.6% in the forward stroke. Moreover, the locking vortex range is expanded upward, which improves the wall attachment stability of the main jet. Finally, to substantiate the numerical findings and evaluate the practical efficacy of the deflector structure, a series of bench tests were conducted. According to the results, compared with the original structure, the average impact frequency can be increased by 5.8%, the single average impact energy increased by 7.5%, and the output power increased by 13.8%.

1. Introduction

Geothermal energy, as a kind of renewable clean energy [1], is known for its abundant reserves, high efficiency, and stability. Compared with other new energy sources such as wind and solar energy, it is not affected by climate or the alternation of day and night. Drilling is an indispensable technology in most energy exploration and development, and this is also true for the exploitation of hot dry rock. Hot dry rock is a kind of deep geothermal energy, mainly stored in granite rock bodies with a temperature higher than 150 °C and a depth between 3 and 10 km [2]. Due to the high pressure and temperature, this rock is characterized by poor drillability [3,4]. In such formations, conventional drilling methods suffer from a slow penetration rate, low drilling efficiency, and high drilling tool consumption, resulting in extremely high costs [5].
Fluidic oscillators for oil and gas drilling tools were first proposed by Yin et al. In his study, a bistable fluidic oscillator for a DTH (down-the-hole) hammer was proposed [6] in which the mass block moves up and down, providing an efficient drilling method for hard rock drilling [7,8]. The DTH fluidic hammer is a kind of valve-less liquid-operated DTH hammer, the structure of which is shown in Figure 1. The fluidic hammer employs the fluidic oscillator as the fluid control component. Therefore, the fluid hammer has the advantages of simple structure, high temperature resistance, and adaptability to drilling fluids [9]. As a hydraulic percussion drilling tool, it can also keep wellbore pressure higher than formation fluid pressure when drilling in high-pressure reservoirs [10,11]. As a result, the fluidic hammer has the potential to be used in hot dry rock drilling.
During operation of the fluidic hammer, the drilling fluid ejects from the supply nozzle of the fluidic oscillator to form the main jet (see Figure 2). Then, the main jet will randomly attach to the two walls of the fluidic oscillator due to the Coanda [13] effect. If the jet is attached to the wall of backward stroke side (connected to the front chamber of the cylinder), the main jet will flow into the output channel of backward stroke side (BO). Consequently, the pressure of the front chamber increases, which pushes the piston upward, and the backward stroke begins. At the top dead center (TDC), the piston stops moving and the pressure in the front chamber increases dramatically, creating a pressure pulse. The pressure pulses are transmitted along the flow path, eventually pushing the main jet to the wall on the opposite side. The diverted main jet enters the output channel of the forward stroke side (FO) and pushes the piston down until the mass block hits the bit and completes an impact.
In previous studies of fluidic hammers, we have found that when the piston moves at low speeds, the pressure inside the cylinder is higher than the pressure in the discharge channels of both the forward (FD) and backward (BD) stroke sides (see Figure 2). As a result, most of the fluid tends to flow out along the discharge channel, which leads to significant energy loss. A locking vortex and separation vortex are also generated within the fluidic oscillator, and a stable vortex can also significantly affect the effective discharge of fluid [14,15]. Locking vortices can stem fluid loss along the other side to some extent, but the effectiveness is limited. This indicates that the rock-breaking efficiency can still be improved by optimizing the structure. As a result, we propose a new structural form, the deflector (see Figure 3), to further hinder fluid loss and improve fluid hammer performance. The structure of the deflector is determined by three parameters, which are the distance between the tip of the deflector and the supply nozzle (a), hereinafter referred to as deflector distance, the deflector width (b), and the reflow channel width (c).
Considering the intricate geometry of the internal flow channel within a fluidic oscillator, along with the associated high manufacturing costs and prolonged machining lead times, a direct experimental approach to determining the optimal geometric parameters of the deflector would entail substantial temporal and economic expenditures. As a result, in this paper, for the newly proposed fluidic oscillator with a deflector, the structural parameters are optimized through numerical simulation. Furthermore, it is analyzed and compared with the original fluidic oscillator. And finally, bench tests are conducted for a finer tuning.

2. Numerical Simulation Method

In this research, the coupled dynamics of fluid flow and the motion of an impactor within a fluidic hammer system were simulated utilizing Computational Fluid Dynamics (CFD). CFD is a robust computational method that is widely recognized for its efficacy in elucidating fluid flow behavior. It provides a detailed analysis of the spatial distribution of velocities and pressures, as well as the intricate interplay of flow phenomena within regions that exhibit complex geometrical configurations [16]. The user-defined functions (UDFs) were also compiled in ANSYS-Fluent 2020 R1 to simulate the fluid flow and the motion of the impact body coupling inside the fluidic hammer. These UDFs were instrumental in accurately modeling the fluid–structure interaction (FSI) between the fluid and the impact body, thereby enabling a high-fidelity simulation of the fluidic hammer’s operational dynamics.

2.1. Governing Equations

The computational domain includes the fluidic oscillator flow field, the cylinder flow field, the impact body flow field, and the transmission channels, as shown in Figure 4. In the present simulation, a three-dimensional (3D) volumetric grid configuration along with surface elements has been utilized. Specifically, the original structure (OS) model comprises a total of 139,231 three-dimensional grid cells, which include 316 pentahedral cells and 138,915 hexahedral cells. For the deflector structure (DS) mesh model, the aggregate count of grid cells stands at 139,245, with 316 of these being pentahedral and 138,929 being hexahedral in nature. The dimensions of the cells are delineated by a maximum size of 8.00 mm and a minimum size of 0.29 mm. The quality of the mesh plays a significant role in influencing the accuracy of subsequent computational results [17]. In this context, the mesh quality, as determined by the grid coordination, has been verified to ensure that the numerical simulations accurately reflect the physical phenomena being modeled. The fluid is subjected to the basic governing equations of the fluid during the numerical simulation. In addition to the equations of conservation of mass, momentum, and energy, the flow containing turbulence is subjected to additional equations concerning turbulence [18,19]. The mass conservation equation is expressed as
ρ t + ρ u x + ρ v y + ρ w z = 0
where ρ is the fluid density and u, v, and w are the components of the velocity vector.
The momentum conservation equation is the Navier–Stokes equations with the following expression:
ρ u t + d i v ρ u ν = p x + τ x x x + τ y x y + τ z x z + F x
ρ v t + d i v ρ v ν = p y + τ x y x + τ y y y + τ z y z + F y
ρ w t + d i v ρ w ν = p z + τ x z x + τ y z y + τ z z z + F z
where p is the pressure; τxx, τxy, τxz, etc., are the components of the viscous stress; and Fx, Fy and Fz are the body forces.
The law of conservation of energy, which is also the first law of heat, is expressed as
ρ T t + d i v ρ ν T = d i v k c p g r a d T + S T
where cp is the specific heat capacity, k is the heat transfer coefficient, and ST is the internal energy of the fluid [20].
In addition, the flow containing turbulence should satisfy the turbulent transient control equations:
d i v u = 0
u t + d i v u ν = 1 p p x + γ d i v g r a d u
v t + d i v v ν = 1 p p y + γ d i v g r a d v
w t + d i v w ν = 1 p p z + γ d i v g r a d w
In this analysis, we consider incompressible flow, characterized by a fluid whose density remains essentially unchanged in response to variations in pressure or temperature. Additionally, turbulent motion is regarded as a superposition of two distinct flow components: a time-averaged flow and an instantaneous pulsating flow.

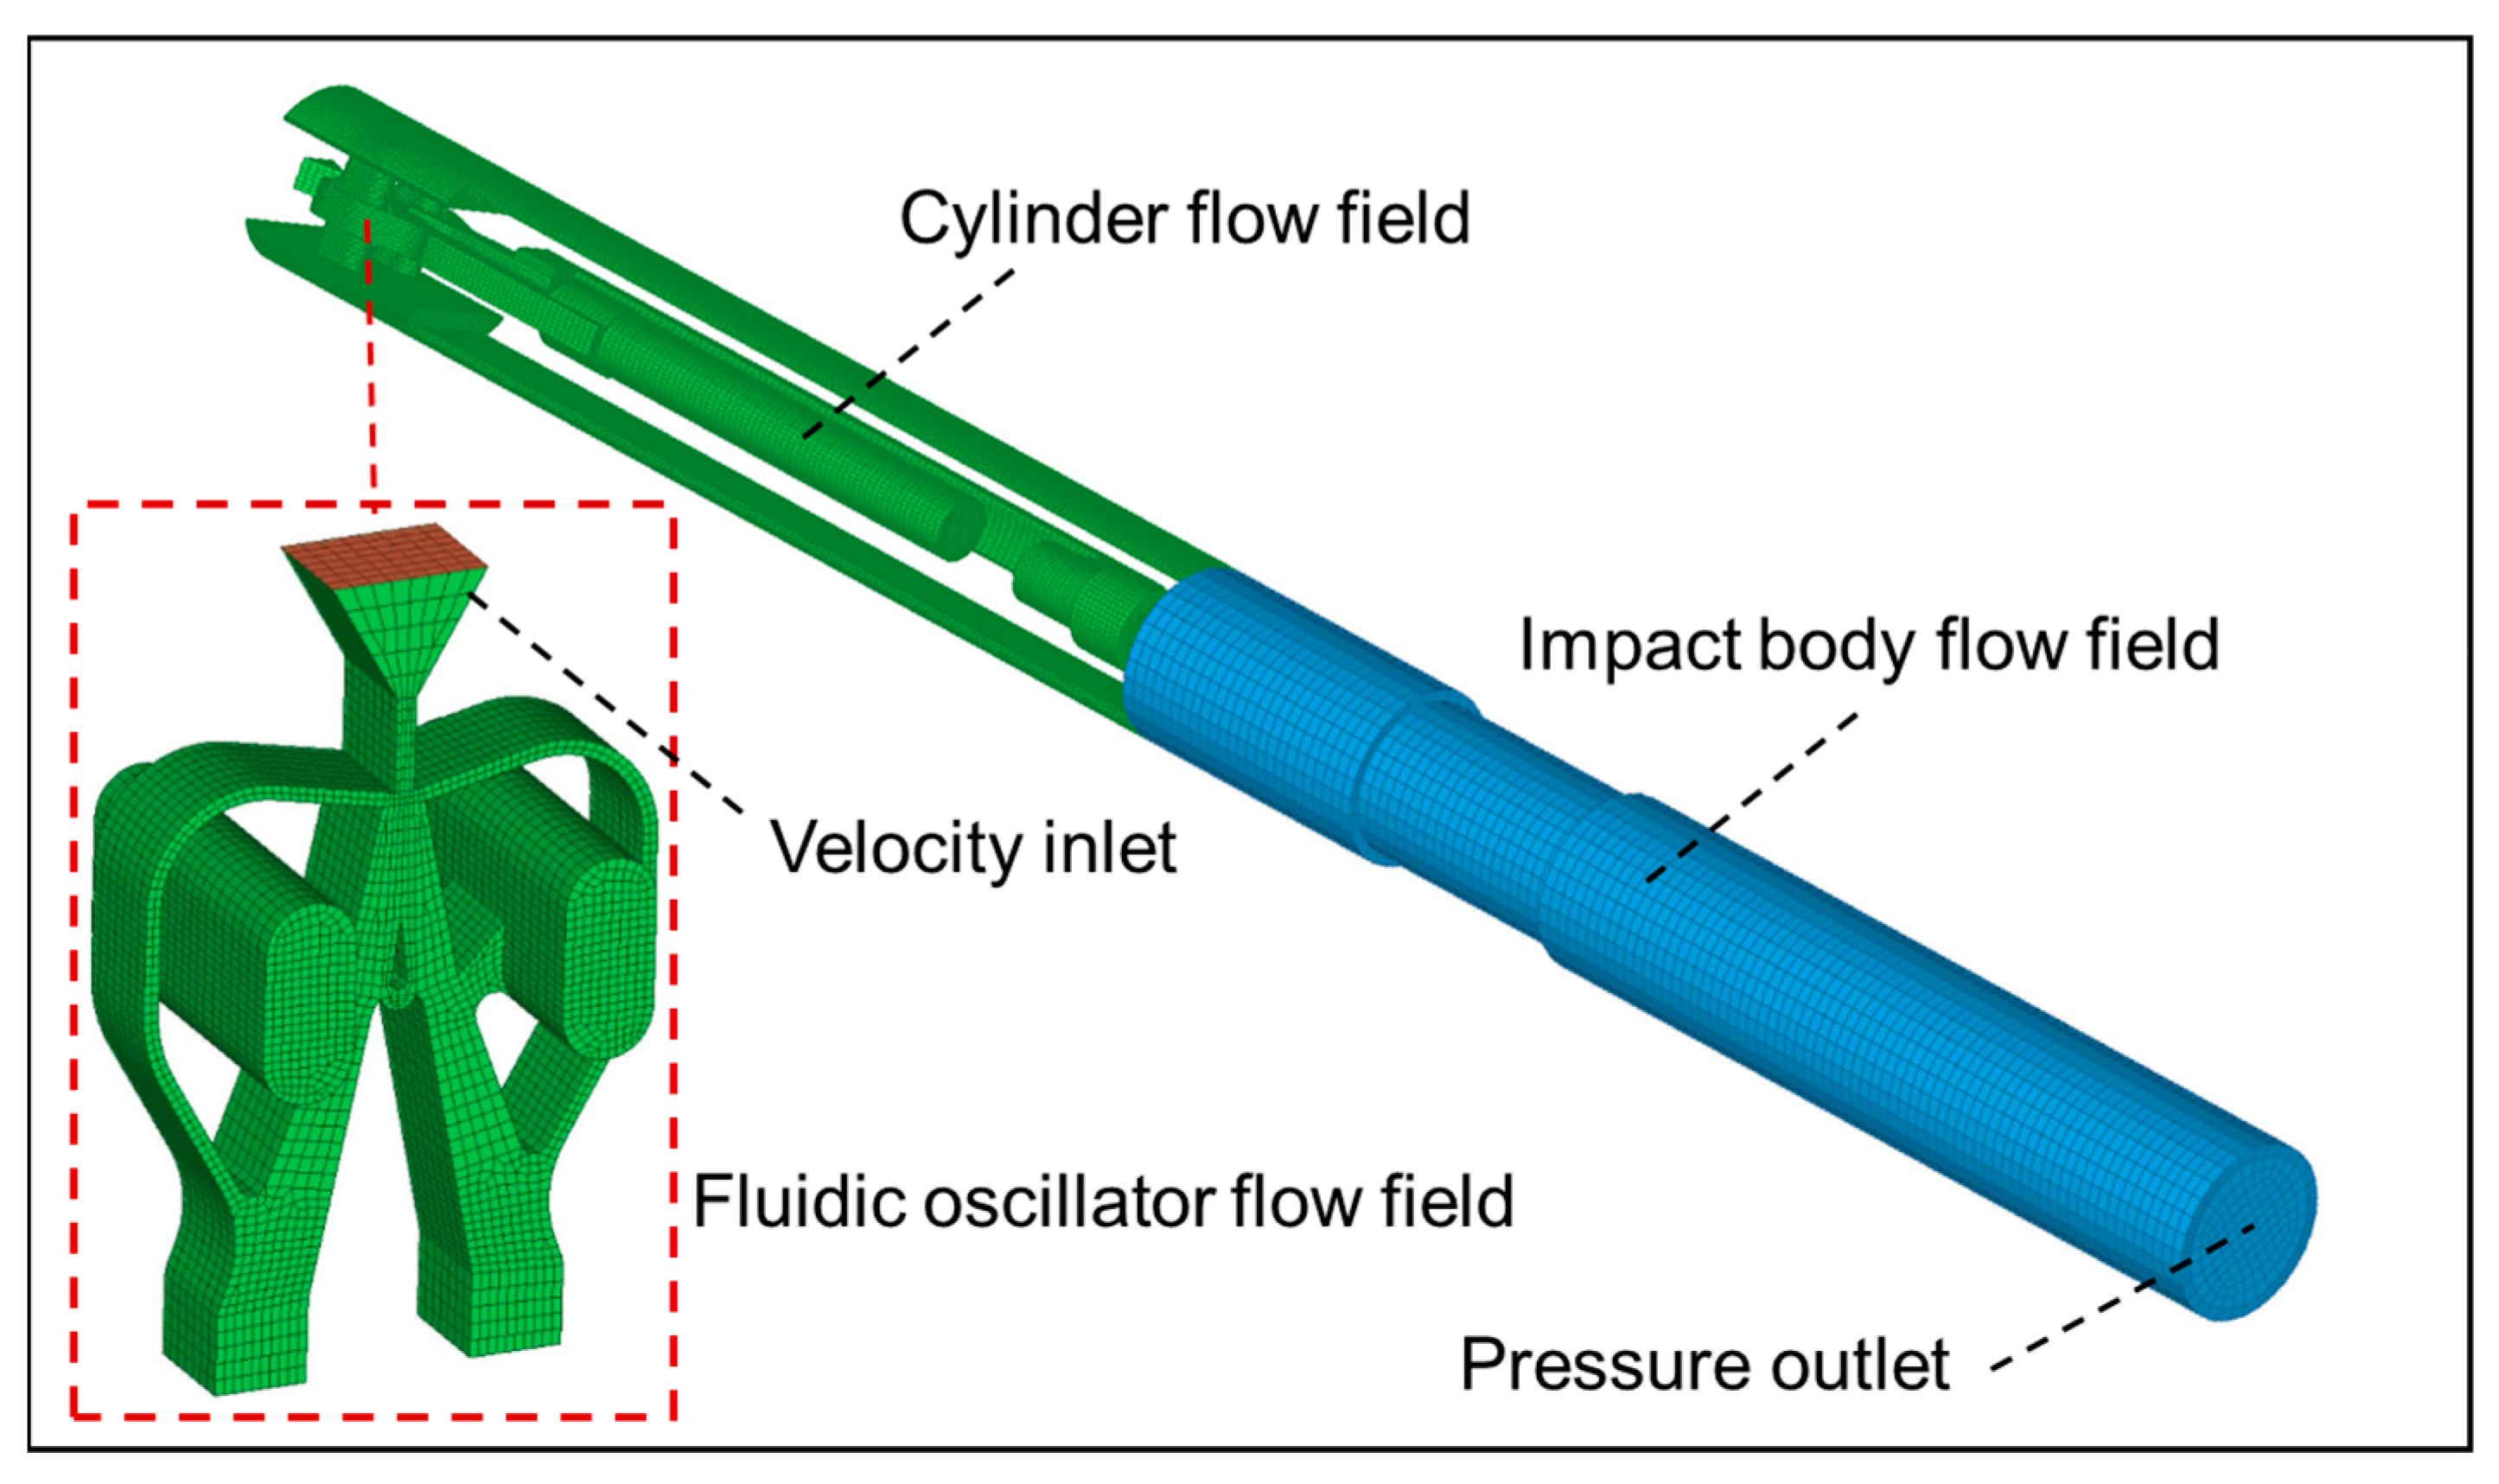
2.2. Boundary Conditions and Solver Setting

Considering the turbulence pattern of high Re inside the fluidic oscillator and the current computer operation capability, this paper uses the standard k-ε turbulence model. The transmission medium is clear water (ρ = 998.2 kg/m3, μ = 0.001003 kg/m-s). In the determination of the boundary conditions, the inlet of the fluidic oscillator is set as the velocity inlet, and the inlet velocity is 16.05 m/s obtained from the pump flow rate (200 L/min), as shown in Figure 4. The inlet turbulence intensity is calculated to be 3.3% based on the cross-section size, and the inlet hydraulic diameter is 3.58 mm. The fluid outlet is set as the pressure outlet, and the size is 1atm; the outlet turbulence intensity is 4.3%; and the outlet hydraulic diameter is 71 mm. The rest are wall surfaces, and the wall surfaces of the piston and mass block are set as deformed wall surfaces. The first-order windward format discretization method is chosen to calculate the turbulence kinetic energy and dissipation rate for the calculation of dynamic mesh, and the dynamic layup method is chosen for the mesh updating; the separation factor is set to 0.4, and the contraction factor is set to 0.3. The data of the observation surface are tracked and captured by monitors, and the data of the observation surface are compiled at the same time. Monitors are utilized to track and capture the observation surface data, and the UDF function is compiled to collect the parameters such as displacement, velocity, acceleration, and front and back pressure of the impact body in real time during the calculation process.
Additionally, in the pursuit of model validation, a rigorous comparative analysis was conducted to assess the congruence between the computational simulation outcomes and the empirical data pertaining to the original structural configuration. The frequency of the impact event as ascertained through simulation was observed to be approximately 7.81 Hz, a figure that closely aligns with the experimentally determined frequency of 7.76 Hz. This concordance between the simulated and experimental frequencies substantiates the fidelity of the model under scrutiny. The experimental data showed a slight decrease in impact frequency compared to the simulation predictions. This difference can be explained by the real-world conditions where the contact between the piston and cylinder is not perfect. Factors like surface roughness and material deformation at the interface create resistance, causing energy loss and a minor reduction in the observed impact frequency.

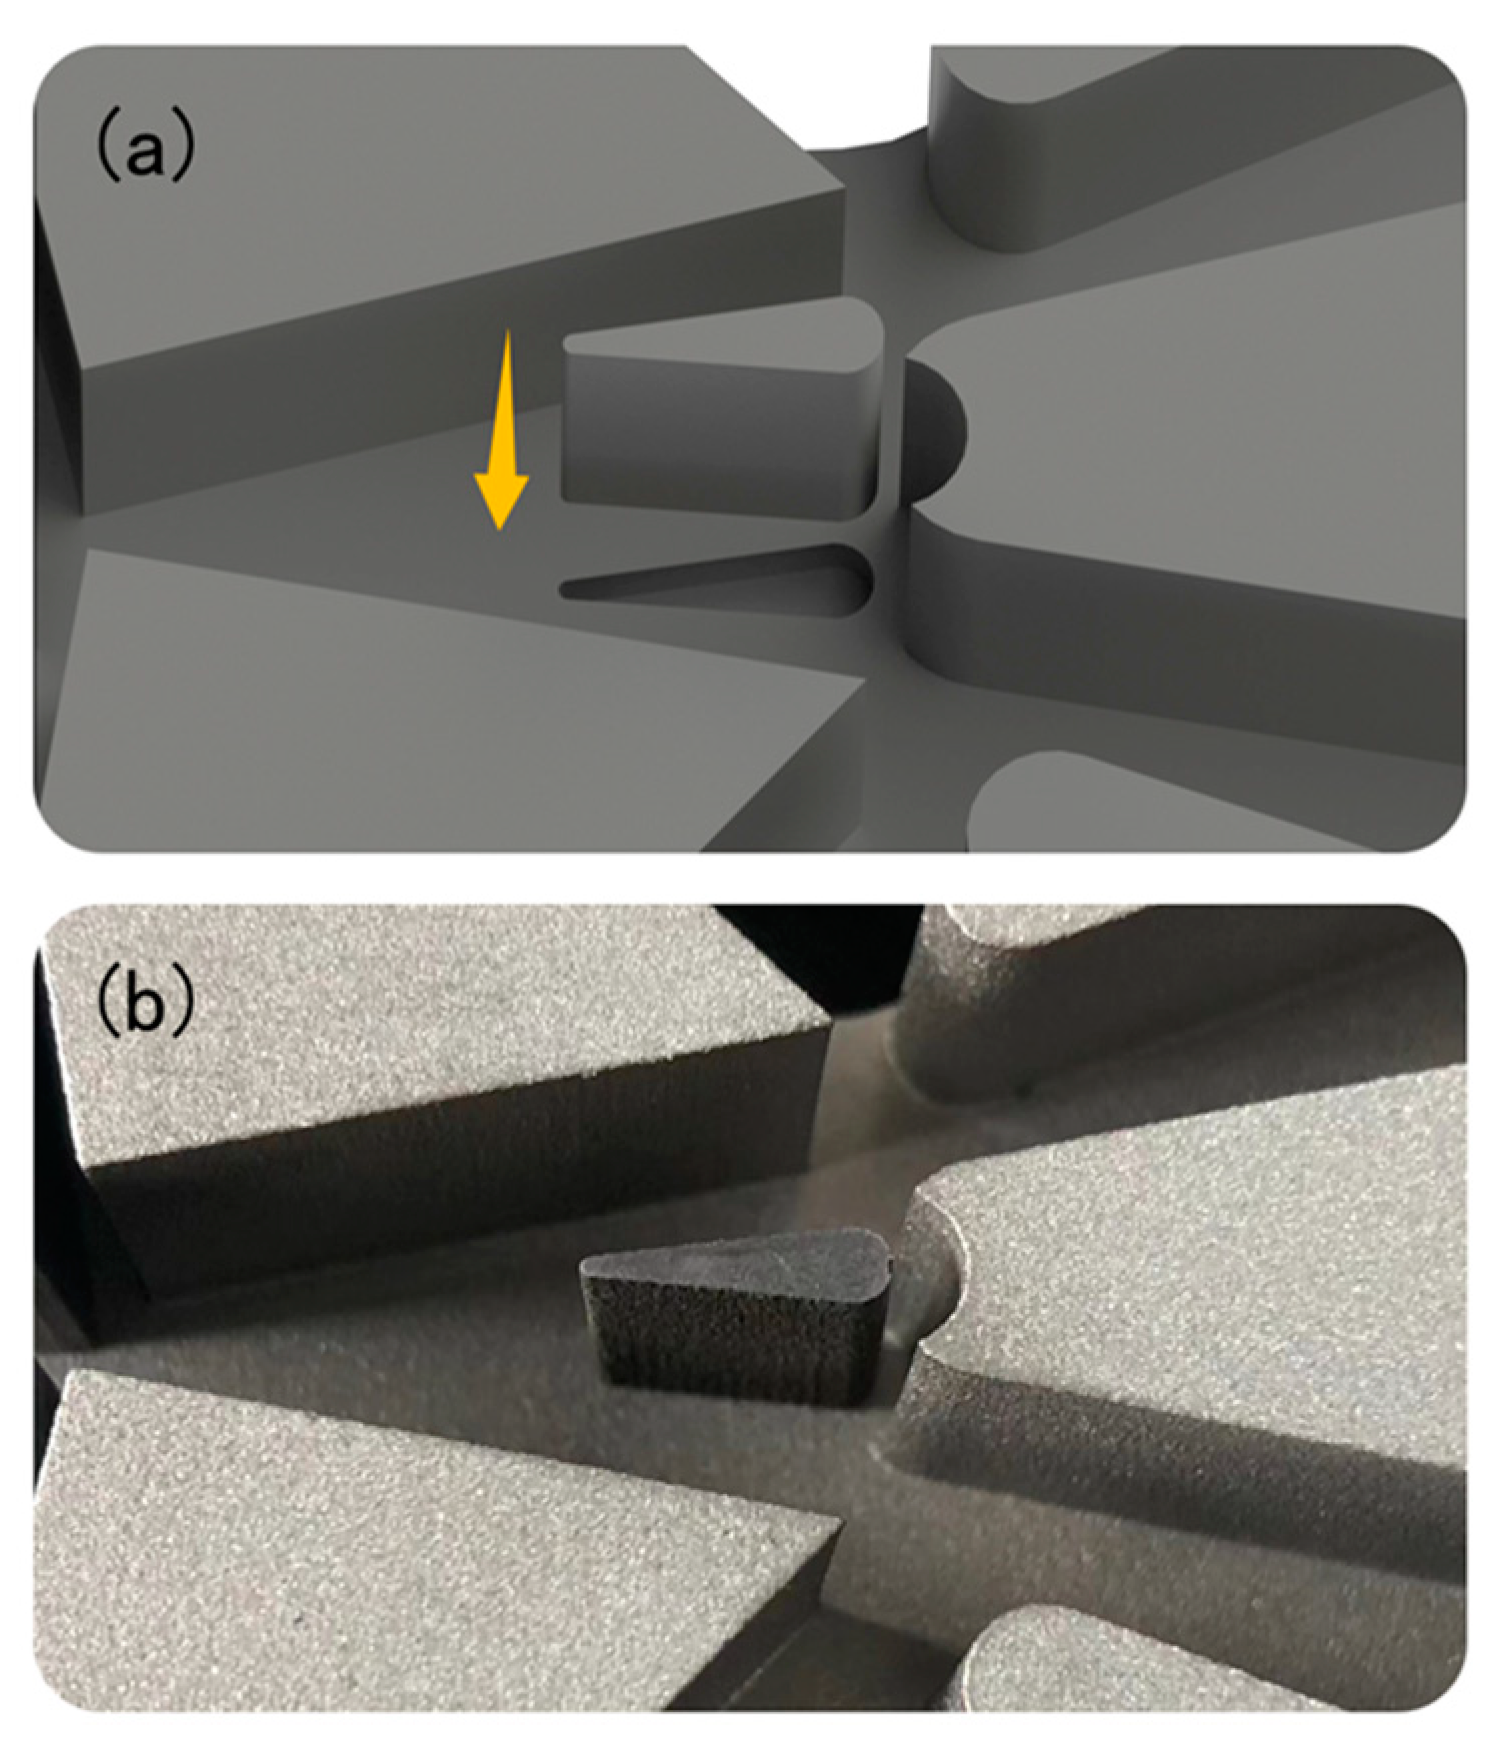
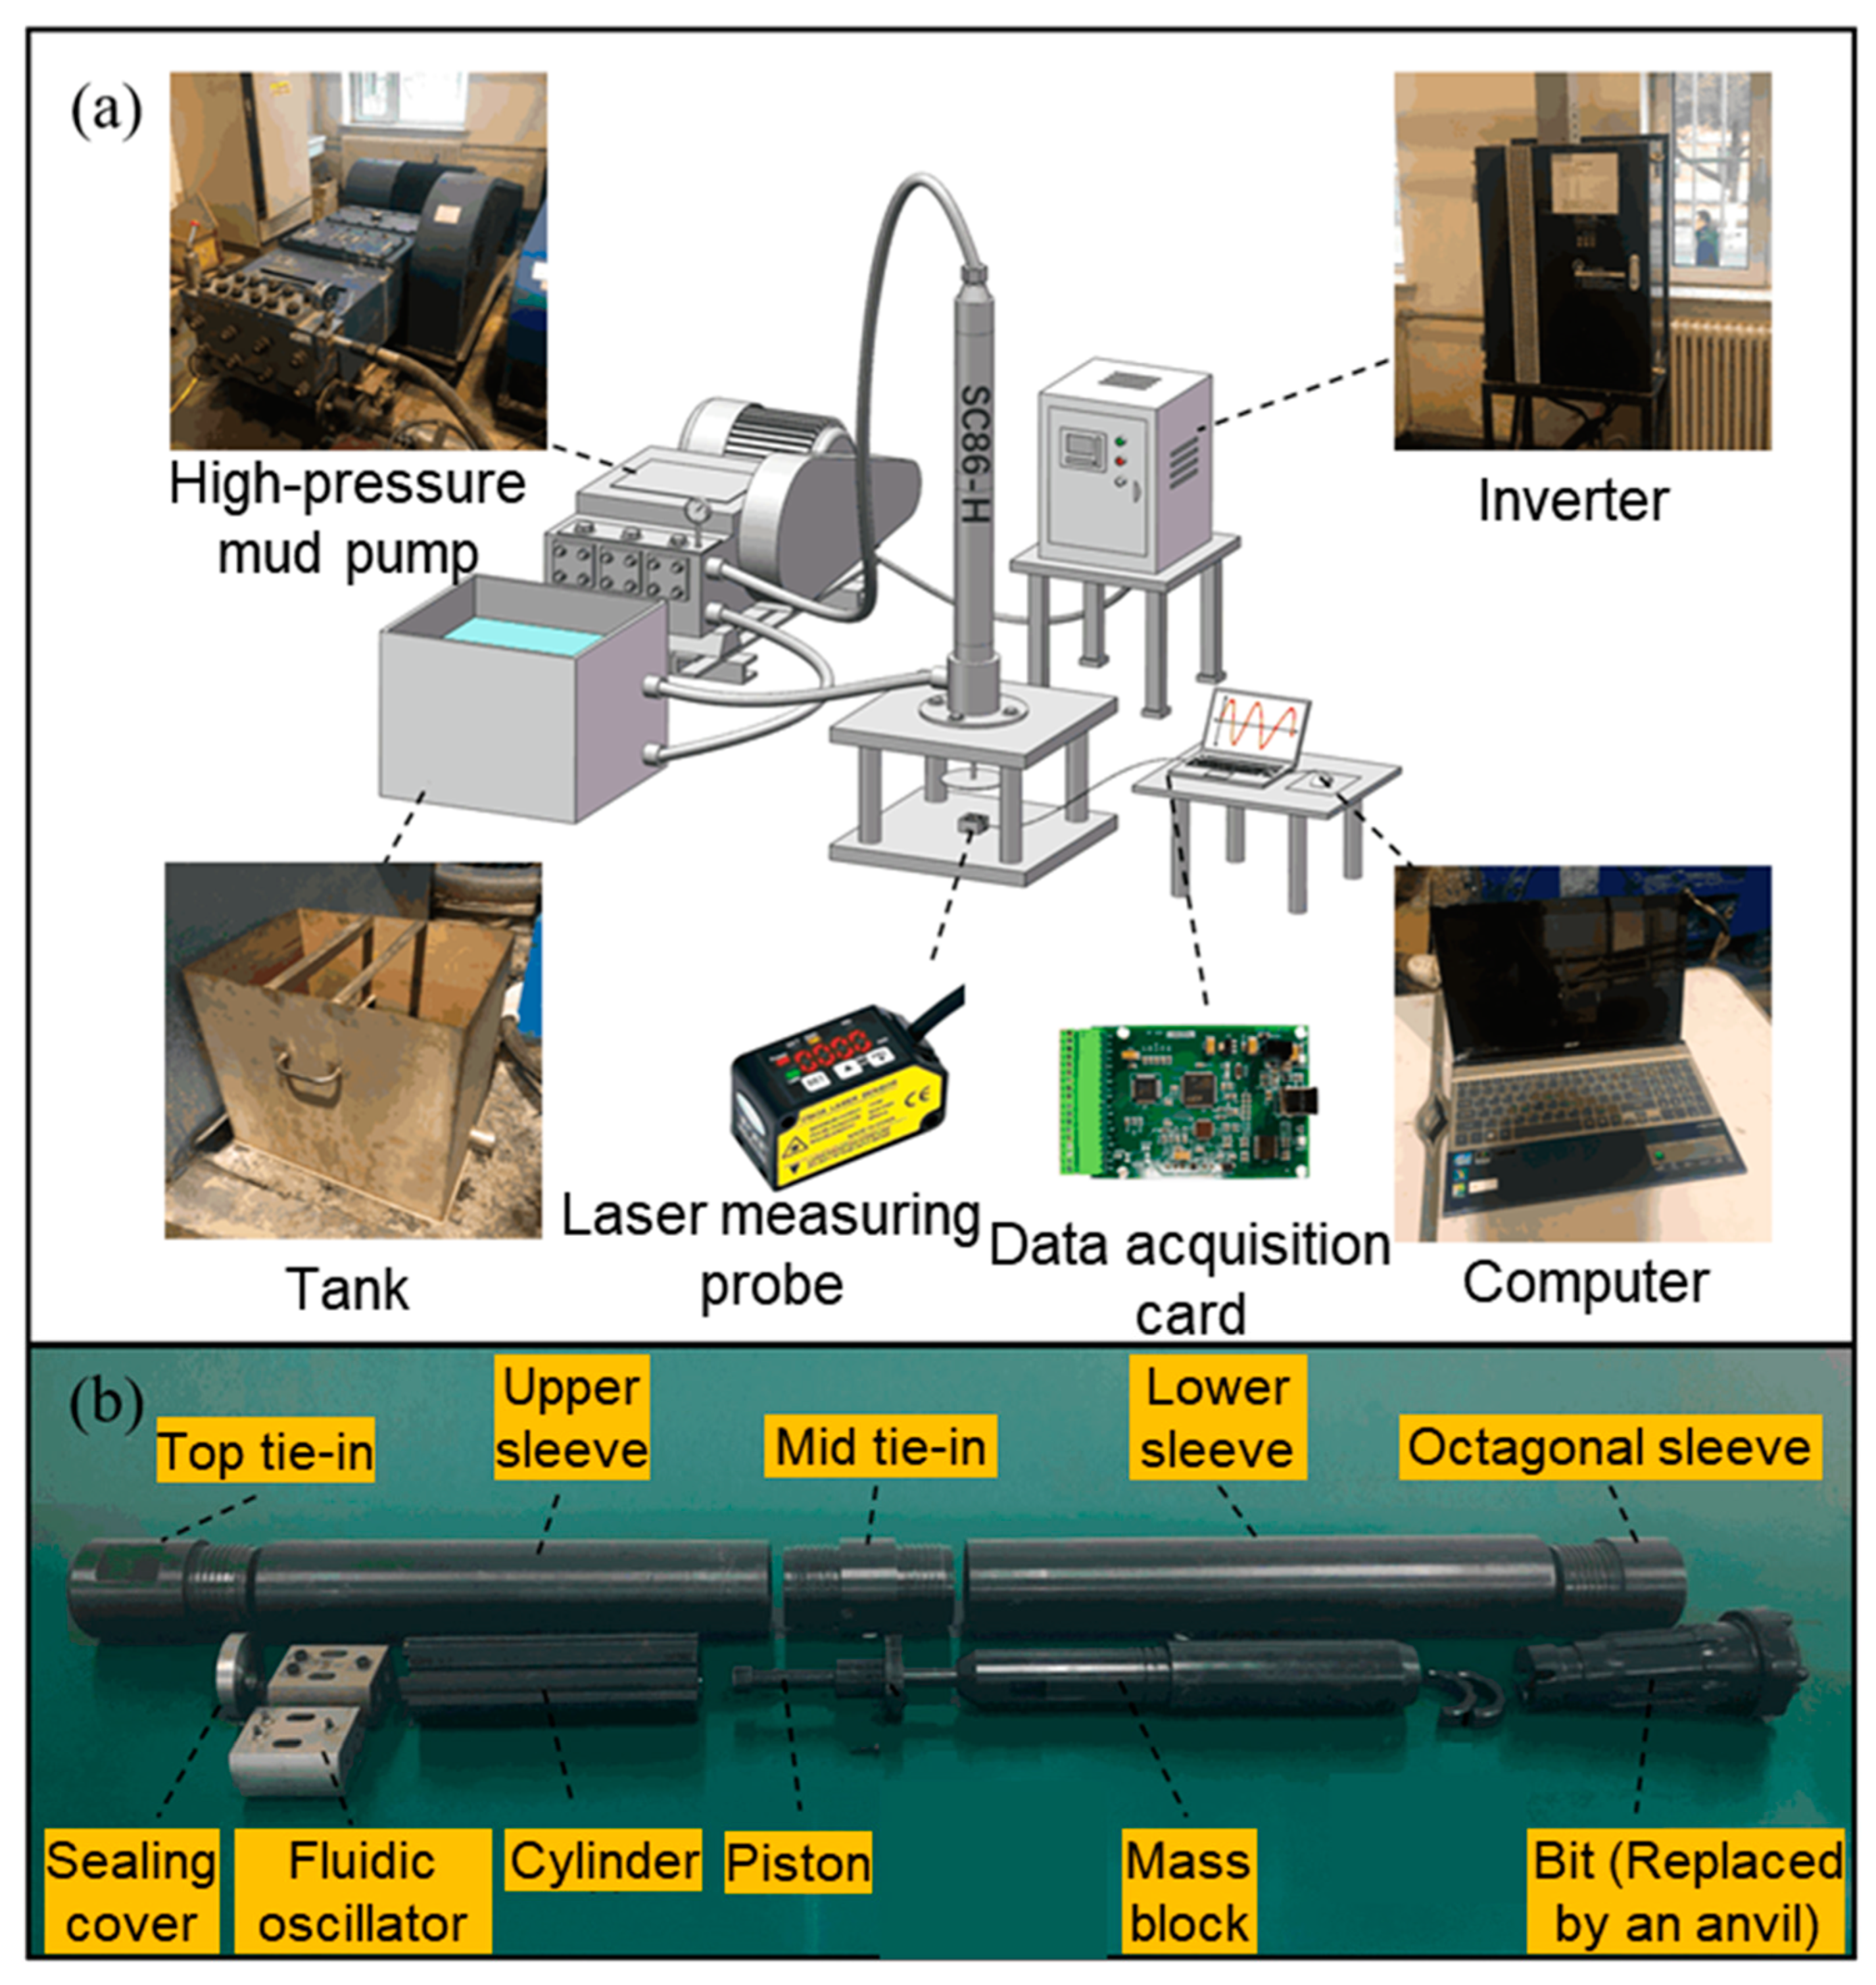
3. Experimental Method

To experimentally verify the effectiveness of the deflector, we processed the fluidic oscillator with a deflector according to the calculation results of numerical simulation. In consideration of the erosion effect of the main jet and the machining method, the position of the upper tip of the deflector was changed to a rounded corner of 0.25 mm and a depth of 14.2 mm while keeping the deflector distance unchanged. All other parameters remained constant. The deflector plate is made of #45 steel and is machined by wire-cutting. As shown in Figure 5, a groove matching the deflector was machined on the bottom plate of the fluidic oscillator cavity with a depth of 2 mm. After that, we set the deflector in the groove and confirmed that the height of the deflector was consistent with the other parts of the fluidic oscillator. Finally, the cover was assembled and we carried out the tests. In this research, each test group was operated for a duration of 10 min, and the average value obtained was taken as the final data point.
The experimental system used for tests is shown in Figure 6. The SC86-H-type fluidic hammer experimental device mainly consists of a bench, mud pump, frequency conversion electric control cabinet, water tank, laser displacement sensor, data acquisition card, computer, and so on [21]. The driving medium is clear water, and the mud pump model is a 3P30 high-pressure triplex mud pump. The supply flow of the mud pump can be precisely controlled by the induction frequency conversion cabinet. A pressure sensor was installed at the outlet of the slurry pump to monitor the system pressure drop in real time. The reflector was fixed under the mass block with screws so that it was completely synchronized with the reciprocating motion of the mass block. The connection between the anvil and the screws was sealed with rubber to minimize water leakage. An anvil was used in place of a drill bit to take the impact of the mass block. The laser triangulation displacement probe was installed under the hydraulic hammer, 200 mm away from the reflector. At this point, the data acquisition card can capture the displacement of the point and in turn obtain the real-time position of the mass block and output the displacement–time data. After a number of system tests, the accuracy of this set of displacement sensors can be controlled within 0.1 mm, which satisfied the experimental requirements.

4. Results and Discussions

4.1. Optimal Parameters for Deflector

The orthogonal experimental design is the common method applied in the multi-factor influence analysis. In order to investigate the effect of each parameter on the performance of the fluidic oscillator, the orthogonal test method was employed for evaluation.
Based on several numerical simulations, we initially controlled the parameters within a range. The parameter combinations designed accordingly are shown in Table 1. If the deflector distance (a) is too short, the deflecting effect is not obvious, and, conversely, too long a distance is harmful for the main jet to attach to the wall. Finally, the selected parameters were 12.5 mm, 13.5 mm, 14.5 mm. The deflector width (b) determines the level of splitting at the tip of the splitter, and the parameters were selected as 1.6 mm, 2.0 mm, and 2.4 mm. The reflow channel width (c) determines the size of the reflux flow rate, which has a strong influence on the shape and strength of the vortex, and the parameters are set to 1.8 mm, 2.2 mm, and 2.6 mm. The other parameters are kept the consistent, and the numerical simulation boundary conditions and solution methods remain unchanged. Nine different parameter combinations are simulated in this paper.
The results of the influence of each structural parameter of the deflector on the cycle time of the piston and the impact velocity are shown in Table 2. From the range (R), it can be seen that for a single cycle time, the deflector width has the greatest influence, the deflector distance is the second largest, and the reflow channel width has the least influence. This suggests that the relative positional relationship between the deflector width and the tip of the splitter is important; the return flow depends mainly on the amount of the main jet diverted by the splitter; the cycle time of piston is closely related to the flow recovery; and the width of the reflow channel is also critical to the enhancement of flow recovery. In summary, the best parameter combination is a2b2c2. As for the impact velocity of the piston, the influence of the deflector distance is the largest, followed by the reflow channel width, and the least influential is the deflector width, and the best parameter combination is also a2b2c2.
Analysis of variance can be used to more accurately quantify the significance of the influence of each factor. As shown in Table 3 and Table 4, the width of deflector has the most significant effect on the single cycle time of the piston, with Pb < Pa < Pc, indicating the significant effect b > a > c. Meanwhile, the size of the deflector spacing has the most significant effect on the impact velocity of the piston, with Pa < Pc < Pb, i.e., a > c > b, and Pc and Pb were similar, which was consistent with the results of the analysis of range.

4.2. Performance Analysis of Fluidic Oscillator with Deflector

According to the optimal parameter combination of the deflector obtained from the orthogonal test, the deflector distance is set at 13.5 mm, the deflector width is 2.0 mm, and the reflow channel width is 2.2 mm. Numerical simulations were performed for new parameter combinations of the deflector, and the original structure of the fluidic oscillator was used as the control group.

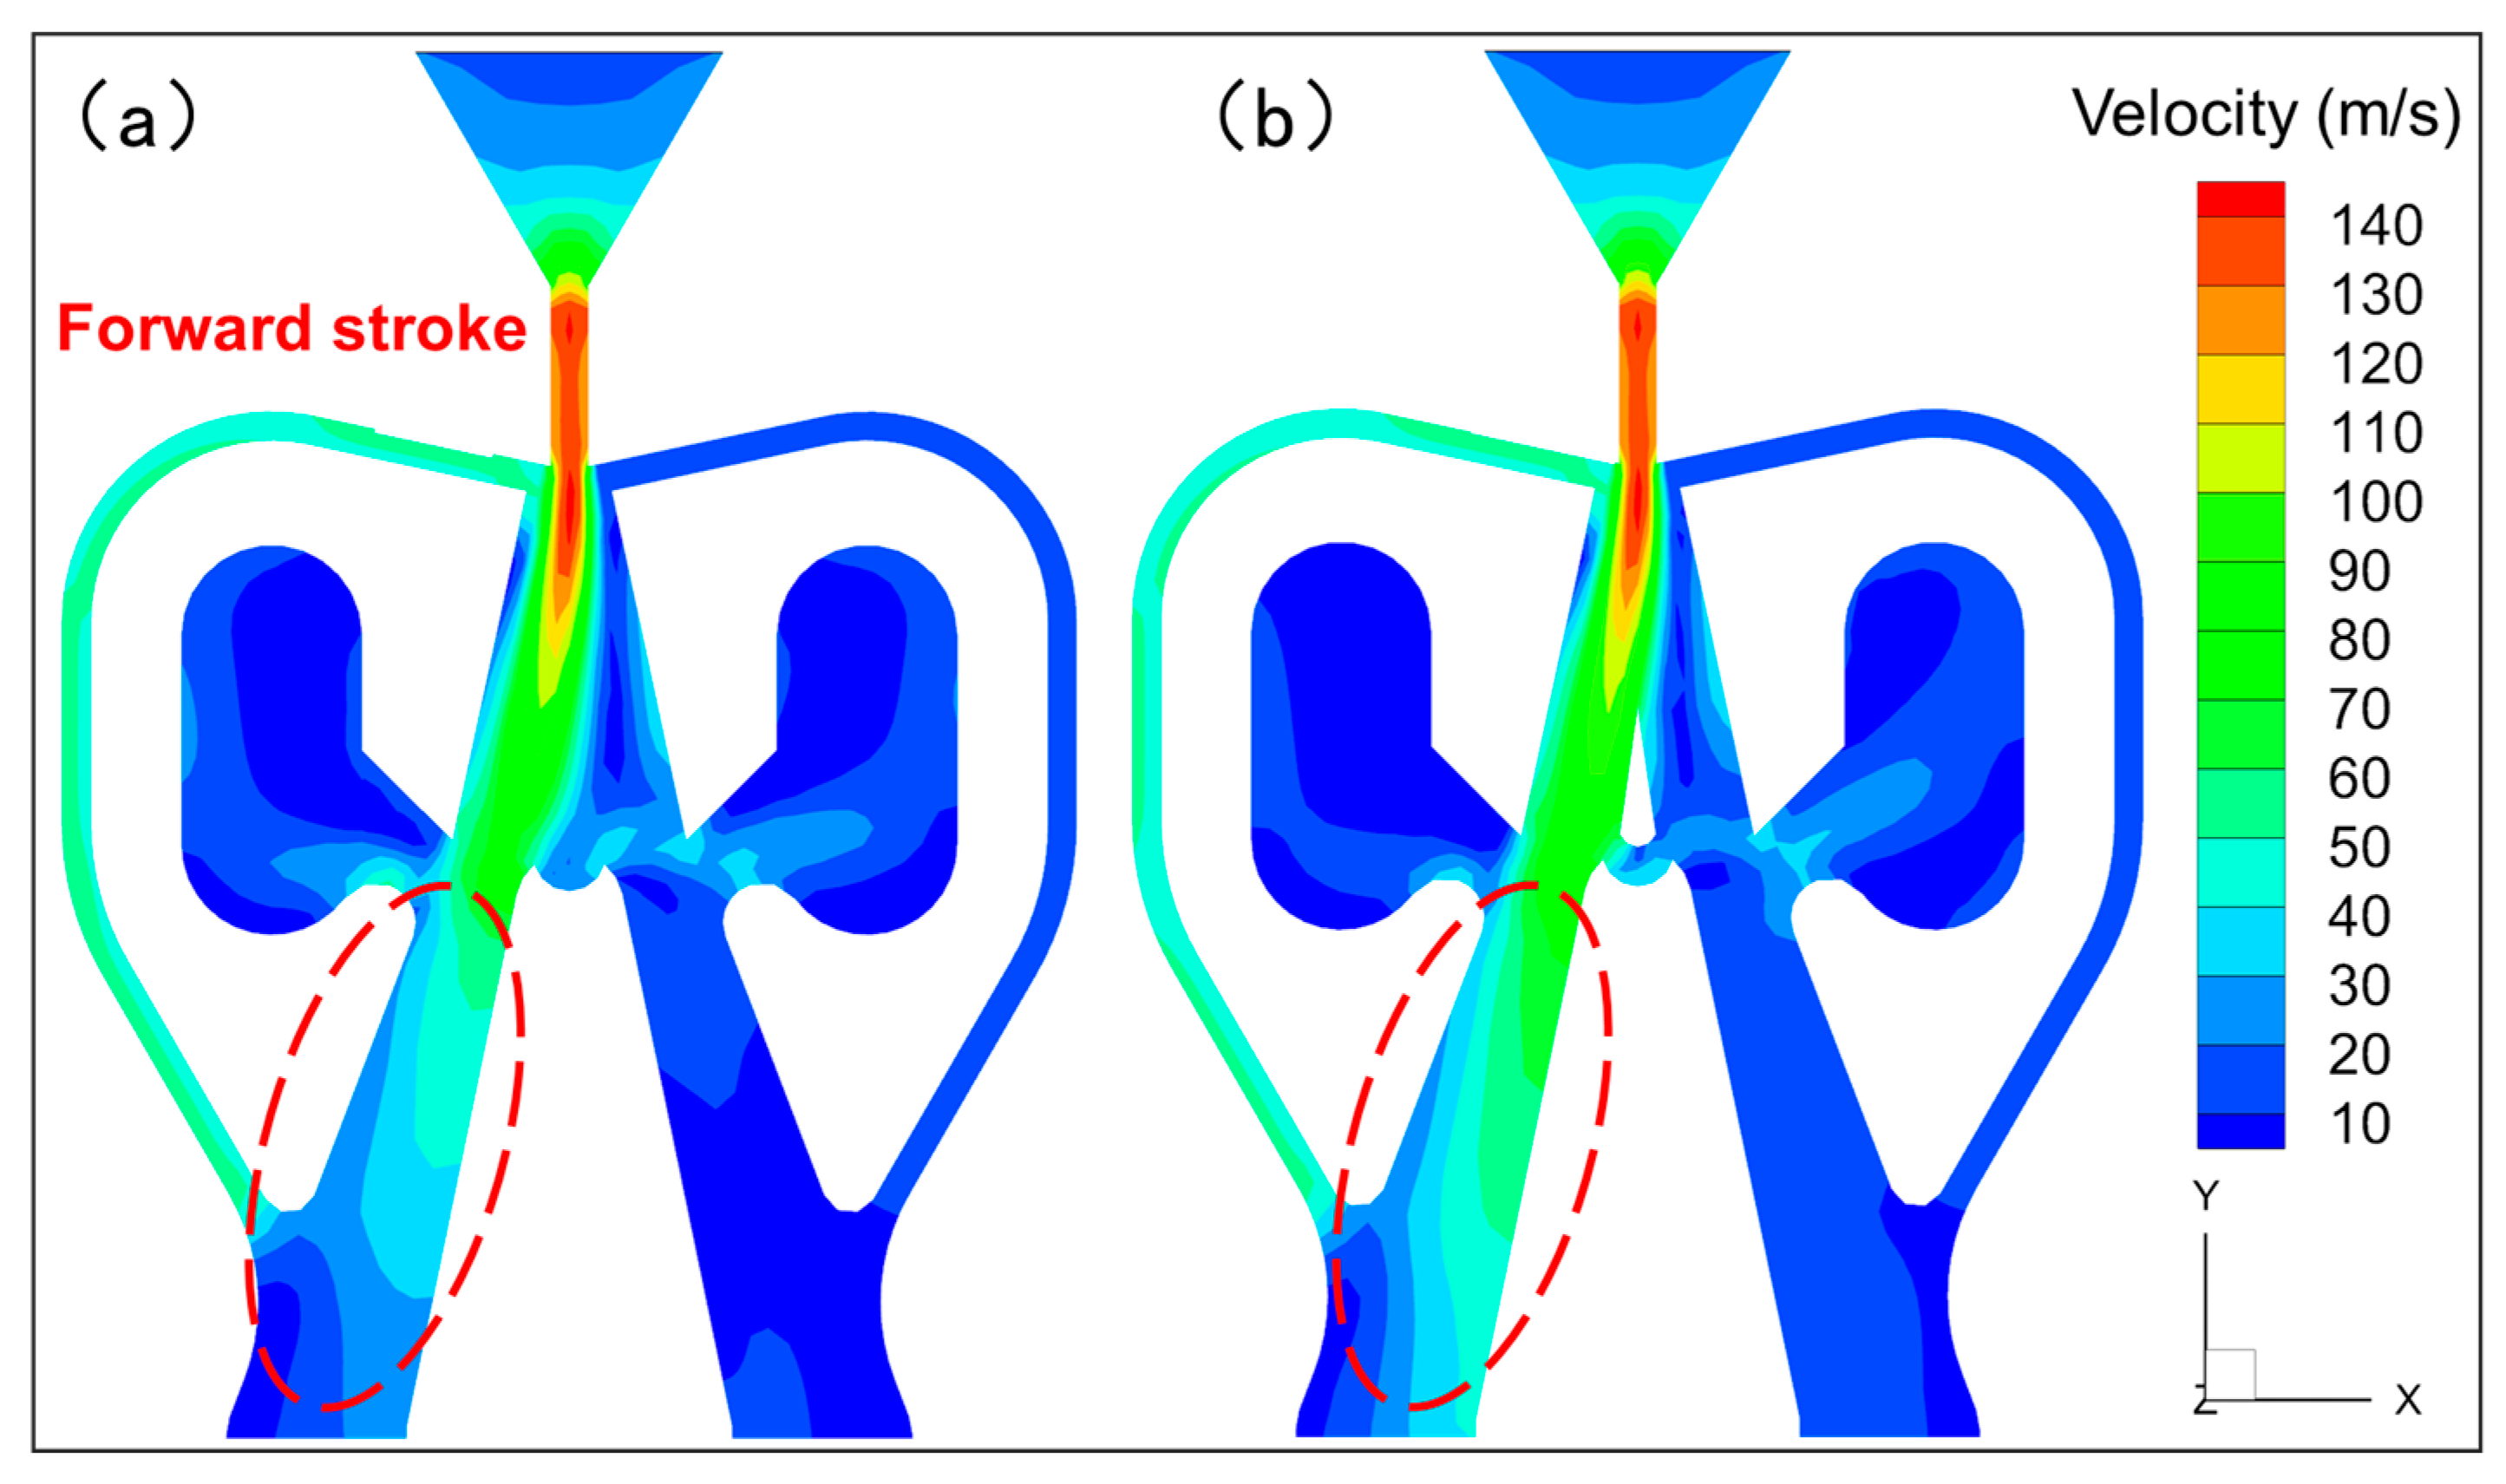
4.2.1. Flow Field Characteristics

Figure 7 and Figure 8 show the velocity clouds of the two structures in the forward and backward stroke, respectively. In the backward stroke, with the addition of the deflector, the flow rate of the main jet going into the BO (red-circled portion of Figure 7) is significantly increased, while in the forward stroke, due to the higher speed of the piston movement, the flow rate into the FO increases. The wall attachment stability is better than the forward stroke. And it can be seen in Figure 8 that the volume of the separation vortex formed by the fluidic oscillator with the deflector is smaller than that of the one without the deflector. This indicates that the fluidic oscillator with the deflector has better main jet wall attachment stability.
Quantitative analysis of the flow recovery of the fluidic oscillator and the level of discharge in the discharge channel after the addition of the deflector is essential. Cross-sections of both sides of the discharge channel as well as the two output channels were intercepted for real-time data extraction, as shown in the black-circled portion of Figure 7.
In Figure 9a, the flow rate in the FD decreases rapidly at the beginning of the backward stroke as the main jet is switched. Afterwards, the flow rate of the stroke side discharge channel rises slowly. This is due to the piston moving backward and the fluid in the back chamber being discharged out of the fluidic oscillator along the FD. The flow rate in this stage stabilizes in the range of 1.5~2 L/s. Subsequently, the piston enters the buffer section; the main jet deflects gradually; and the flow rate rises rapidly. When the piston reaches the top dead center, the main jet completes the switching and the flow rate reaches the maximum value at the same time. Then, the flow rate at the FD gradually decreases to about 0.5 L/s. When the piston reaches the lower stop, the flow rate surges. For the BD (see Figure 9b), the flow rate rises rapidly with the switching of the main jet. The flow rate decreases during the buffer section, which is basically stabilized at 2.25 L/min before. Finally, the flow rate changes less during the forward stroke. It can be noted that the flow rate of the non-attached wall-side discharge channels are reduced by the addition of the deflector. The flow reduction on the non-attached wall side was calculated to be 9.2% and 5.3% for the backward and forward stroke, respectively.
The flow rate of the output channel is the flow rate into the front and back chambers, which is also the effective flow rate. As shown in Figure 10, the flow rate change pattern of the BO is similar to that of the FO, but it is lower in value. In addition, the flow rate in the output channel of the deflector structure is always higher than that of the original structure over the whole cycle. The solid points in Figure 10 are the points of maximum piston speed and also the maximum flow recovery in the backward and forward stroke. Compared to the original structure, the maximum flow recovery in the backward and forward stroke in the deflector structure increases by 9.1% and 3.6%, respectively.

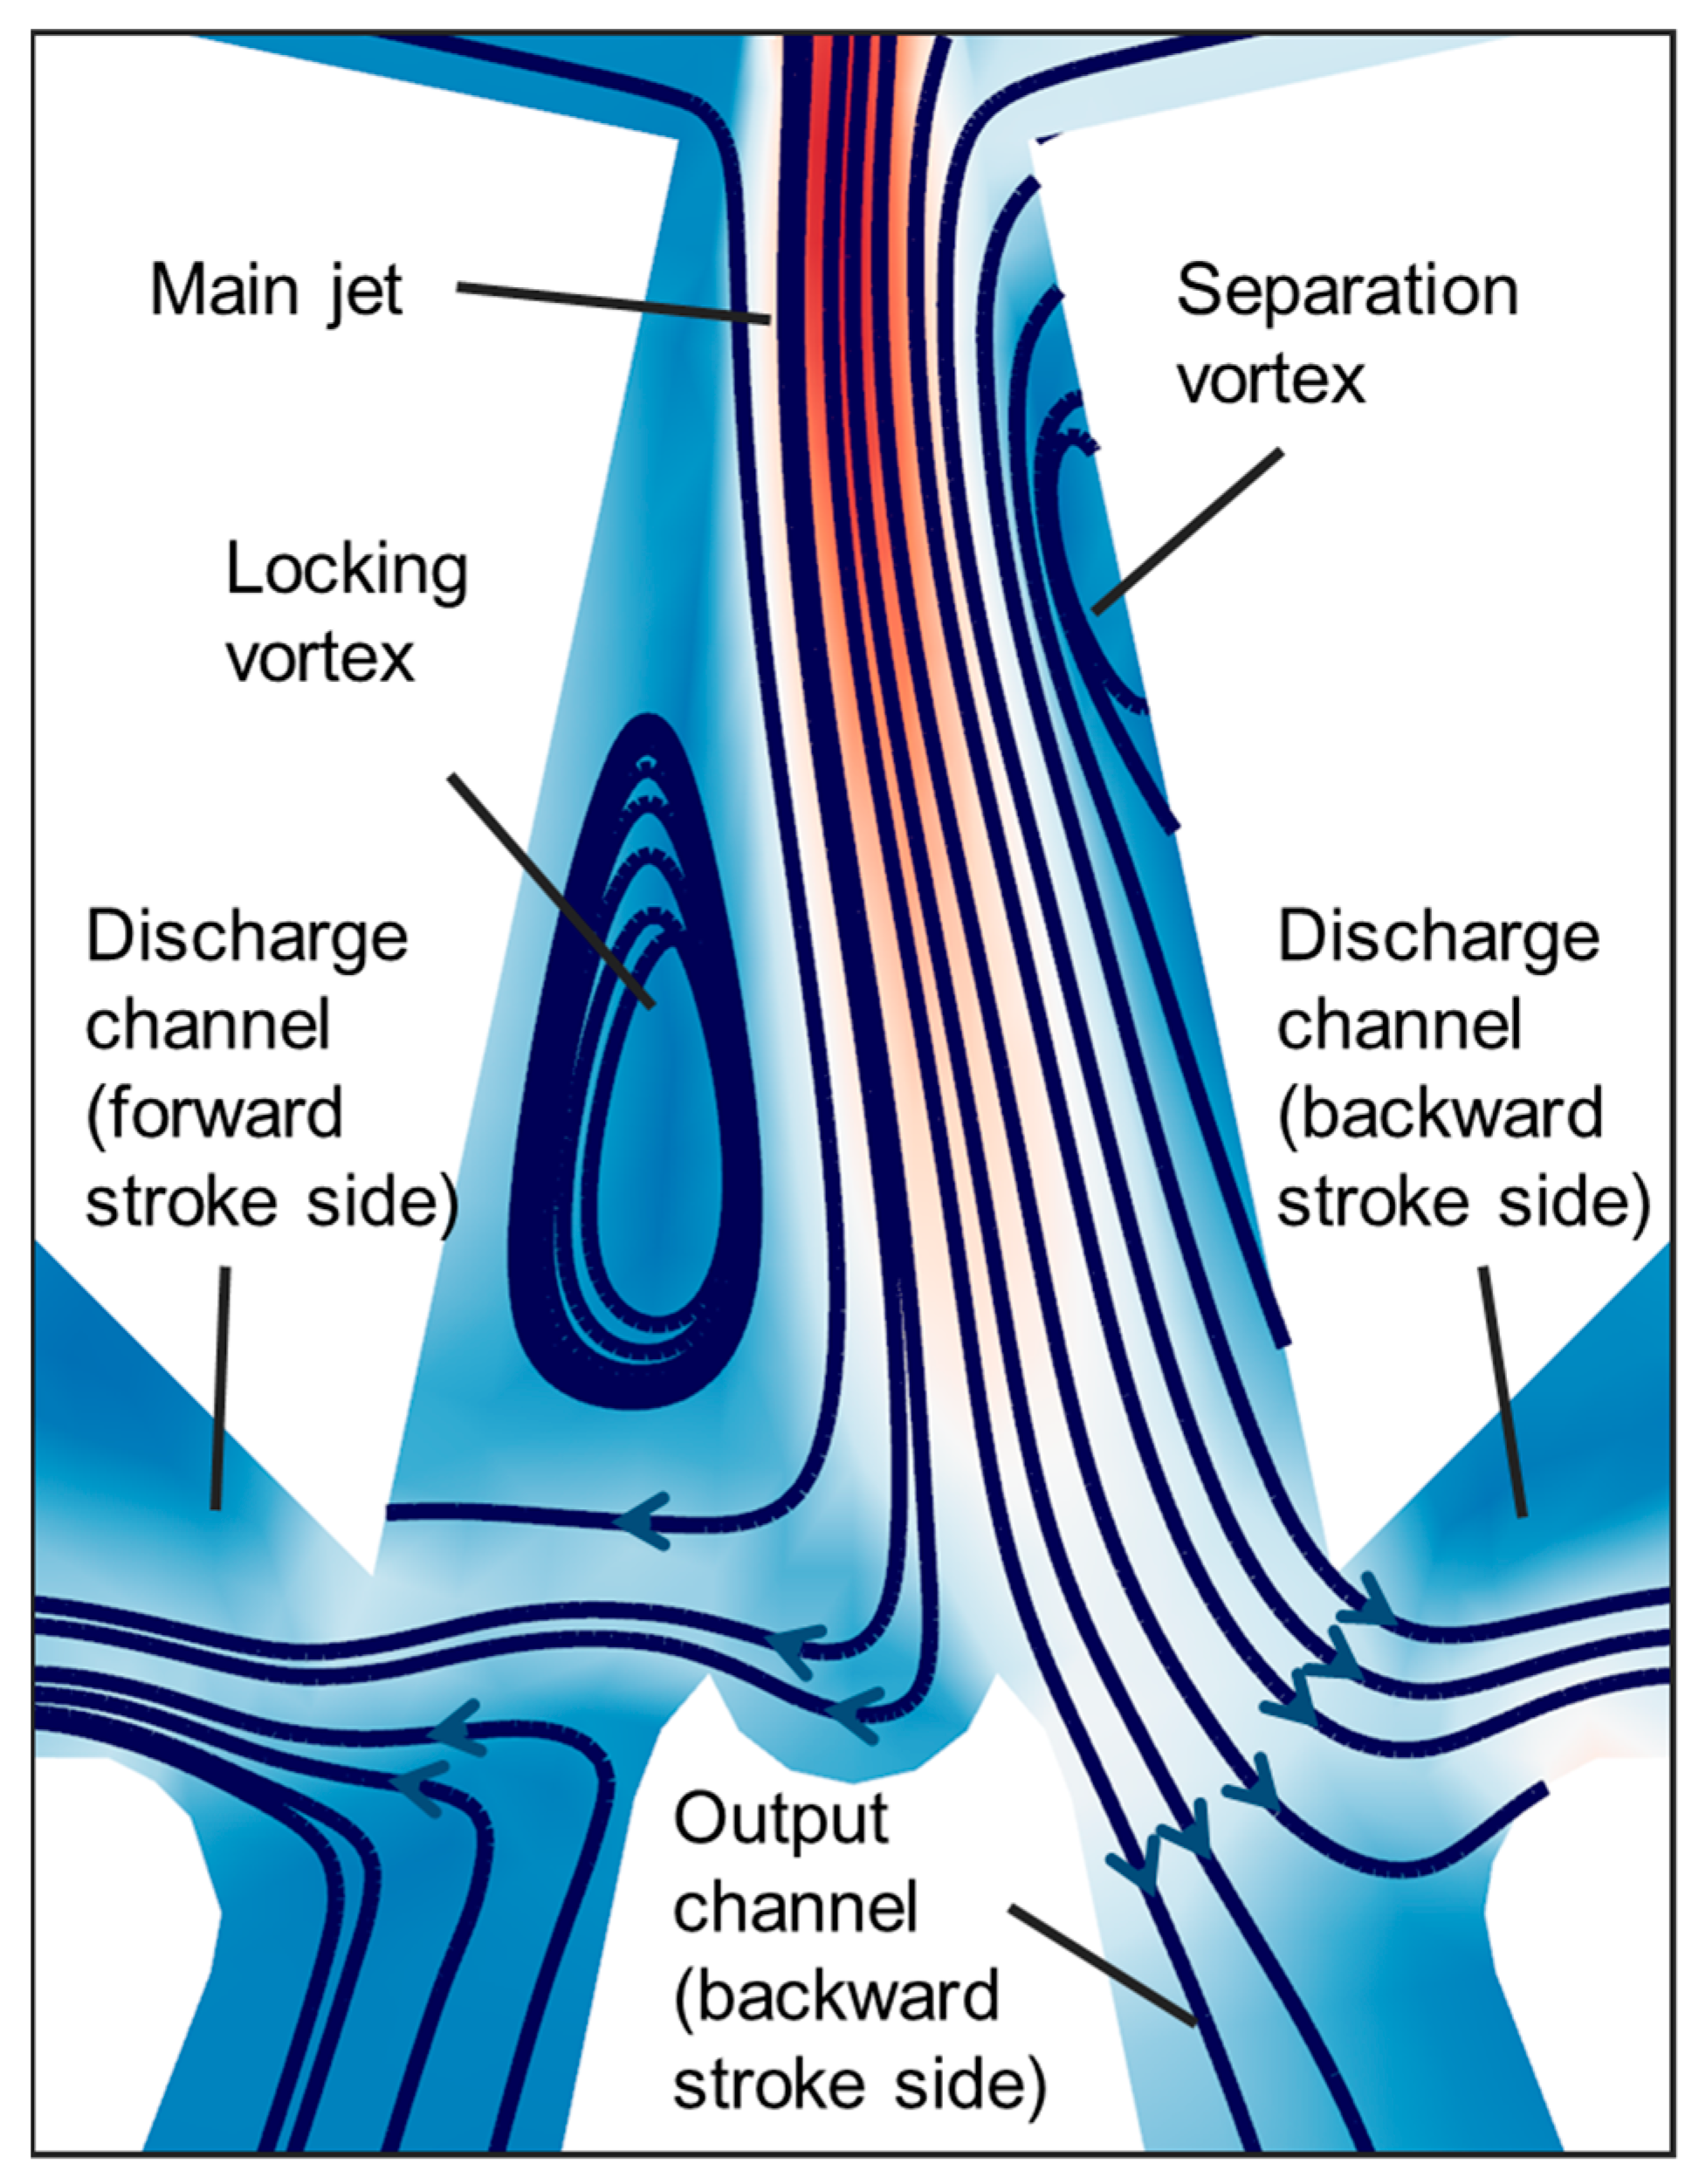
4.2.2. Vortex Characteristics

The morphology and strength of vortices inside the chamber of a fluidic oscillator are always an important part of the flow field stability evaluation [22]. In order to visually confirm the influence of the deflector structure on the vortices inside the chamber, a more accurate identification of the vortex morphology and intensity is necessary.
Currently, the most commonly used vortex identification methods are the Q-norm identification method and the Ω-identification method [23,24]. Compared to the Q method, the Ω method has only a unique morphological structure; no threshold adjustment is needed, and both strong and weak vortices can be captured, which makes the structure more complete and accurate. Ω = 0.52 is generally chosen as the equivalent surface for displaying the vortex, and the calculation formula is as follows:
Ω = B F 2 A F 2 + B F 2 + ε
where ‖‖F denotes the paradigm of the matrix, B is the asymmetric tensor of the velocity gradient, and A is the symmetric tensor, i.e.,
A = 1 2 Δ V + Δ V T
B = 1 2 Δ V Δ V T
where T represents the transpose of the matrix with the velocity tensor:
Δ V = U X U Y U Z V X V Y V Z W X W Y W Z
A small positive number ε is added to the denominator to prevent division by zero:
ε = 1 1000 × M a x B F 2 A F 2 = 1 500 × Q M a x
The Q method is given by the following formula:
Q = 1 2 B F 2 A F 2
It can be noticed that the value of ε in the Ω method can be replaced by the maximum value in the Q criterion, which makes it easier to compute the results of the Ω method. The Qmax can be calculated directly in Tecplot 360 EX 2020 R2 software using the Q Criterion function that comes with Calculate Variables. Then, the Ω criterion is calculated by embedding the formula separately.
The locking vortex and separating vortex are captured by the Ω method (see Figure 11). It can be seen that the locking vortex of the original structure is mainly concentrated in the lower part of the chamber, which mainly acts in the tail of the main jet. After the addition of the deflector, the locking vortex is concentrated on one side of the deflector. The radial range of the locking vortex almost fills the space of the side. And the axial range widens upwards, which benefits the attached wall stability of the main jet. In addition, more space is available on the attached wall side of the deflector for the flow of the main jet. This locking vortex of the deflector structure could provide a higher flow recovery than the original structure.

4.3. Result of the Bench Test

From the experimental results, the results of numerical simulation are verified. The piston operation efficiency is significantly improved by the deflector structure compared with the original structure. As can be seen from Figure 12, the stability of the return and stroke is improved, and the fluctuation of piston acceleration is weakened. However, the switching time of the main jet increased at the top and bottom dead center (BDC). This is because the first half of the deflection process of the main jet mainly relies on the lateral action of the pressure pulse, while the second half of the deflection depends on the growth of the locking vortex. And the main source of the flow required for the growth of the locking vortex is the return flow from the splitter. However, the position of the deflector is exactly where the main jet tail is, which hinders the return flow, thereby leading to prolongation of locking vortex formation and slow deflection of the main jet.
As shown in Figure 13, the fluidic oscillator with the deflector consistently outperformed the original structure over the piston operating interval. The fluidic oscillator with the deflector is more effective at low flow rate. As the supply flow rate increases, the advantage of the deflector will be gradually weakened. When the flow rate is stabilized at 200 L/min, the average impact frequency of the deflector structure can be increased by 5.8%; the average impact work of a single time is increased by 7.5%, and the impact power is increased by 13.8%, which makes the optimization effect very considerable.

5. Conclusions

In the present study, we introduce an innovative internal structure within the fluidic oscillator, specifically the deflector structure, which is designed to regulate the distribution pattern of the main jet and the lock vortex using a solid block. This design enhancement aims to improve the wall attachment capability of the main jet and the stability of the flow field. To optimize the deflector’s structural parameters, a comprehensive numerical simulation was conducted employing an orthogonal test methodology. Subsequent bench tests, based on these optimized parameters, were executed to validate the simulation outcomes. These results underscore the deflector structure’s potential to significantly improve the performance of the fluidic oscillator, leading to more efficient drilling operations in hard rock formations. The main conclusions are as follows:
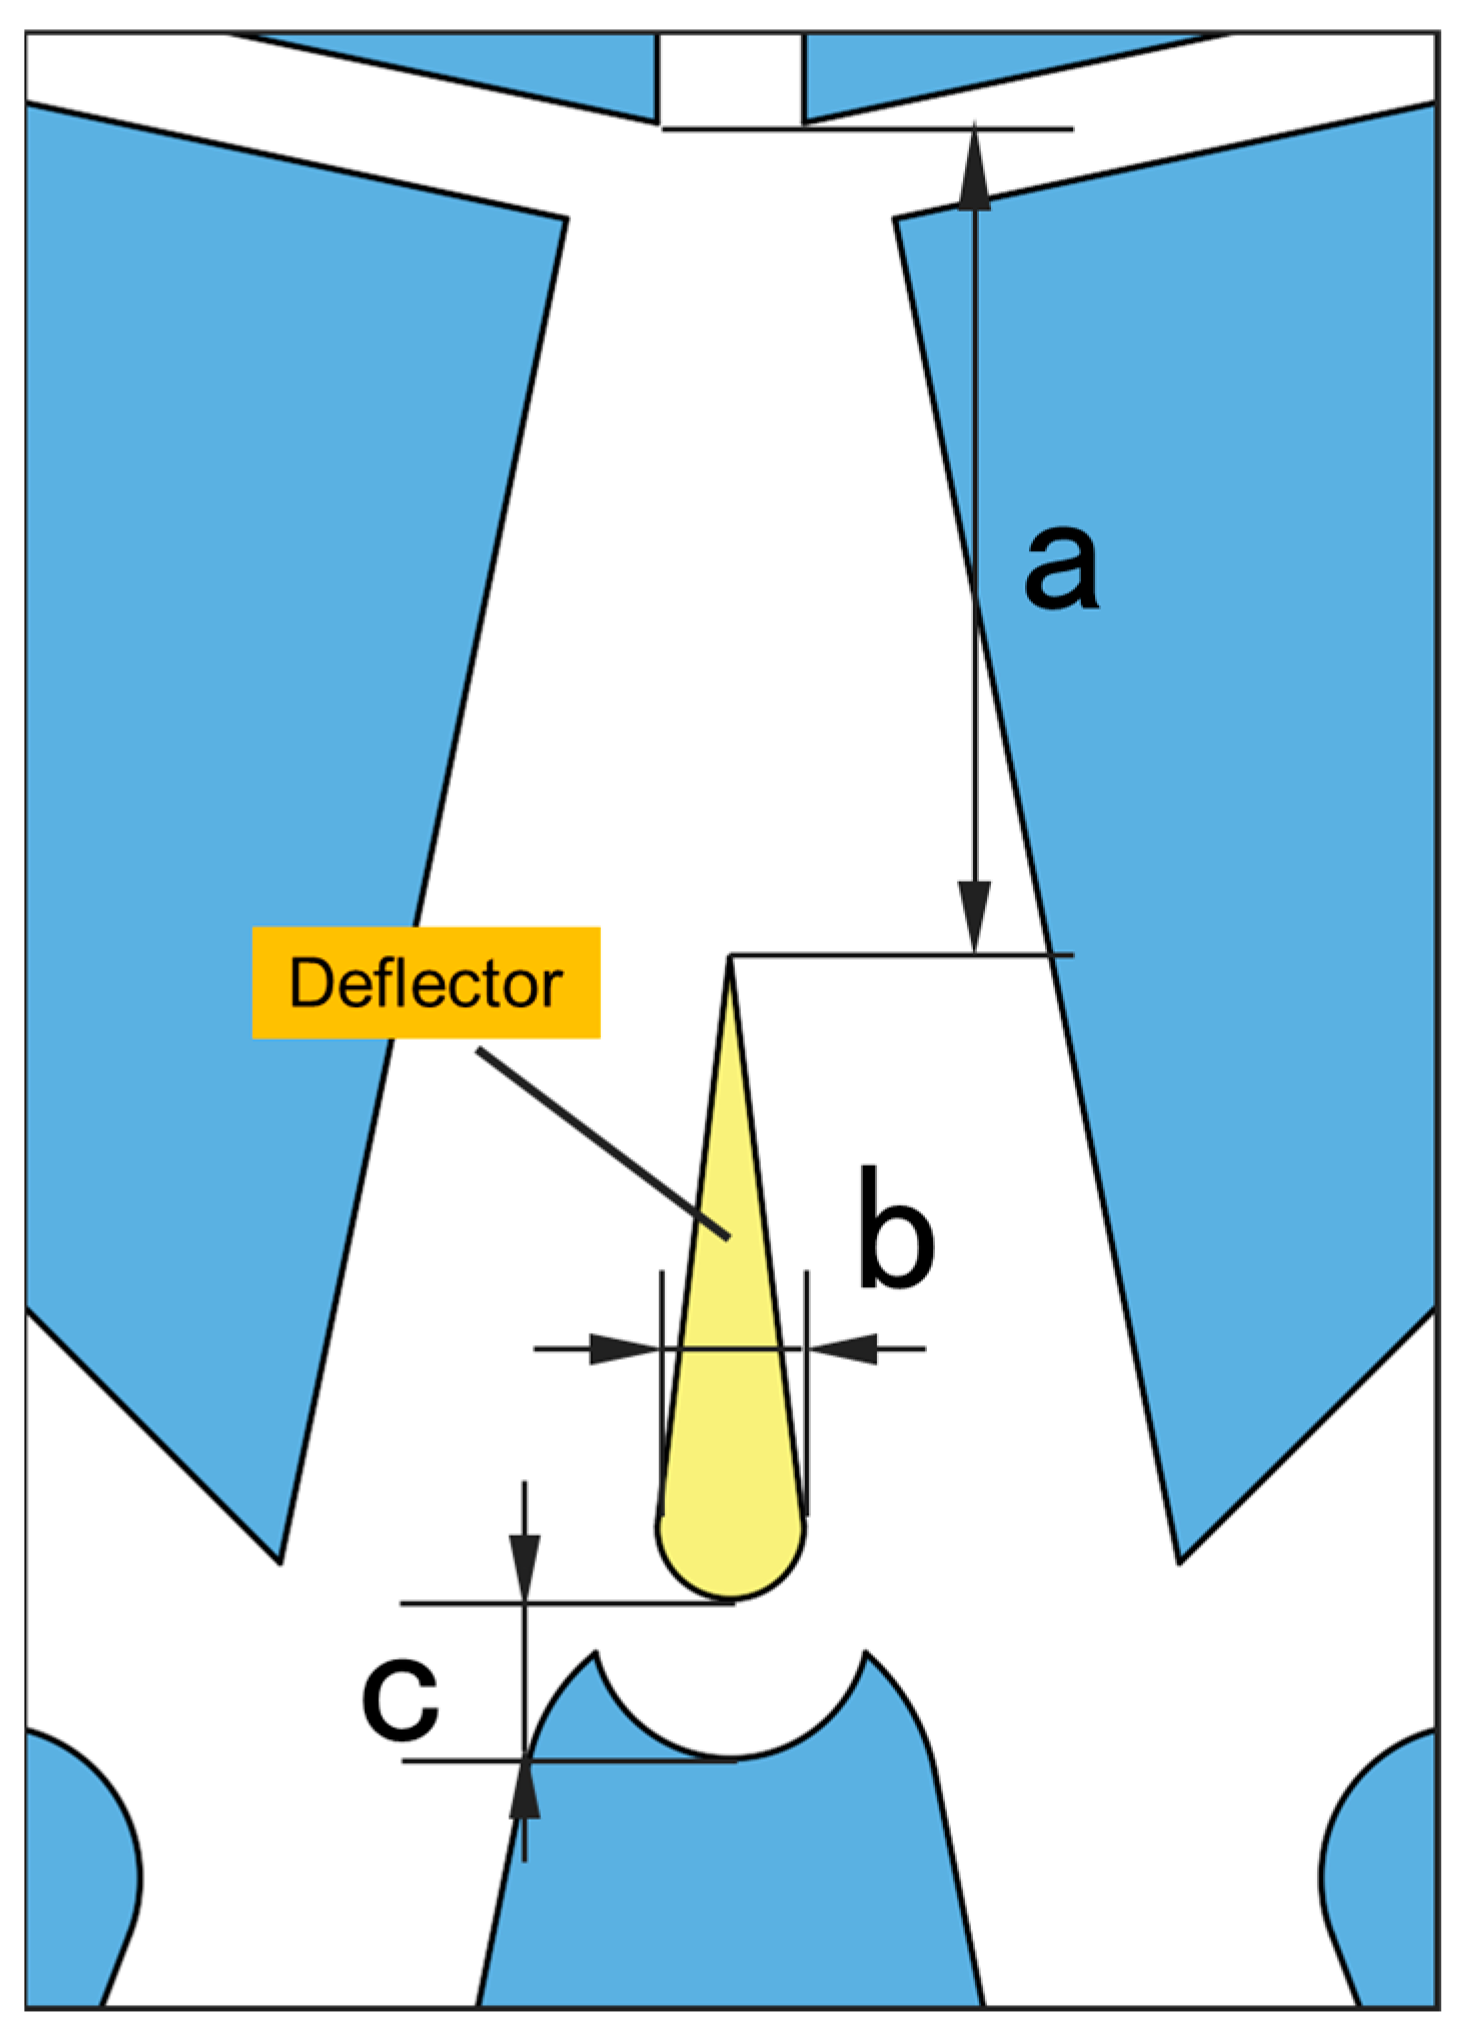
  • According to the orthogonal test results, the optimal parameter combination for the deflector structure is set at 13.5 mm for the deflector distance, 2.0 mm for the deflector width, and 2.2 mm for the return channel width.
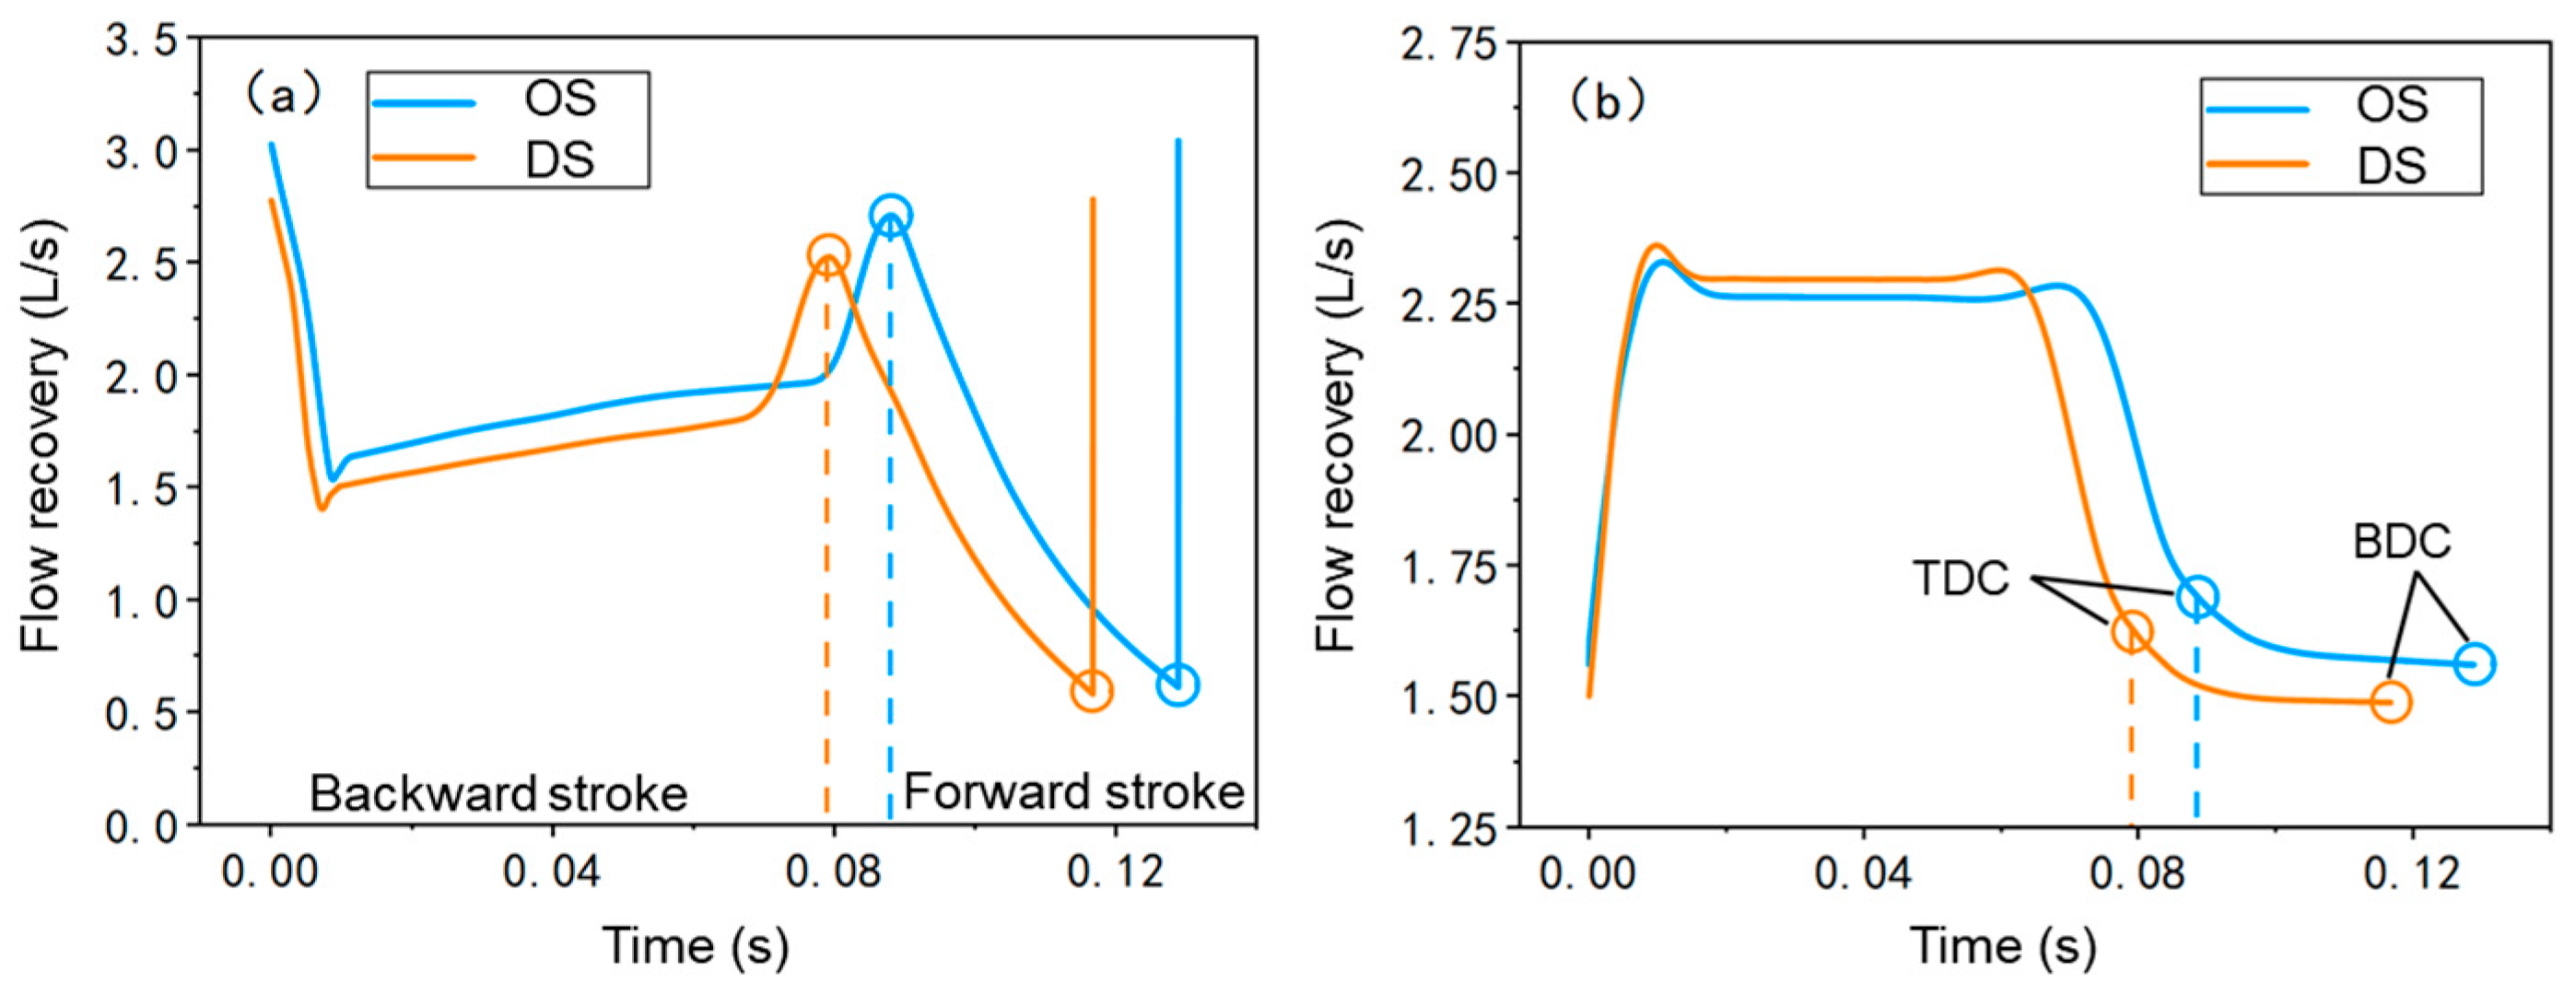
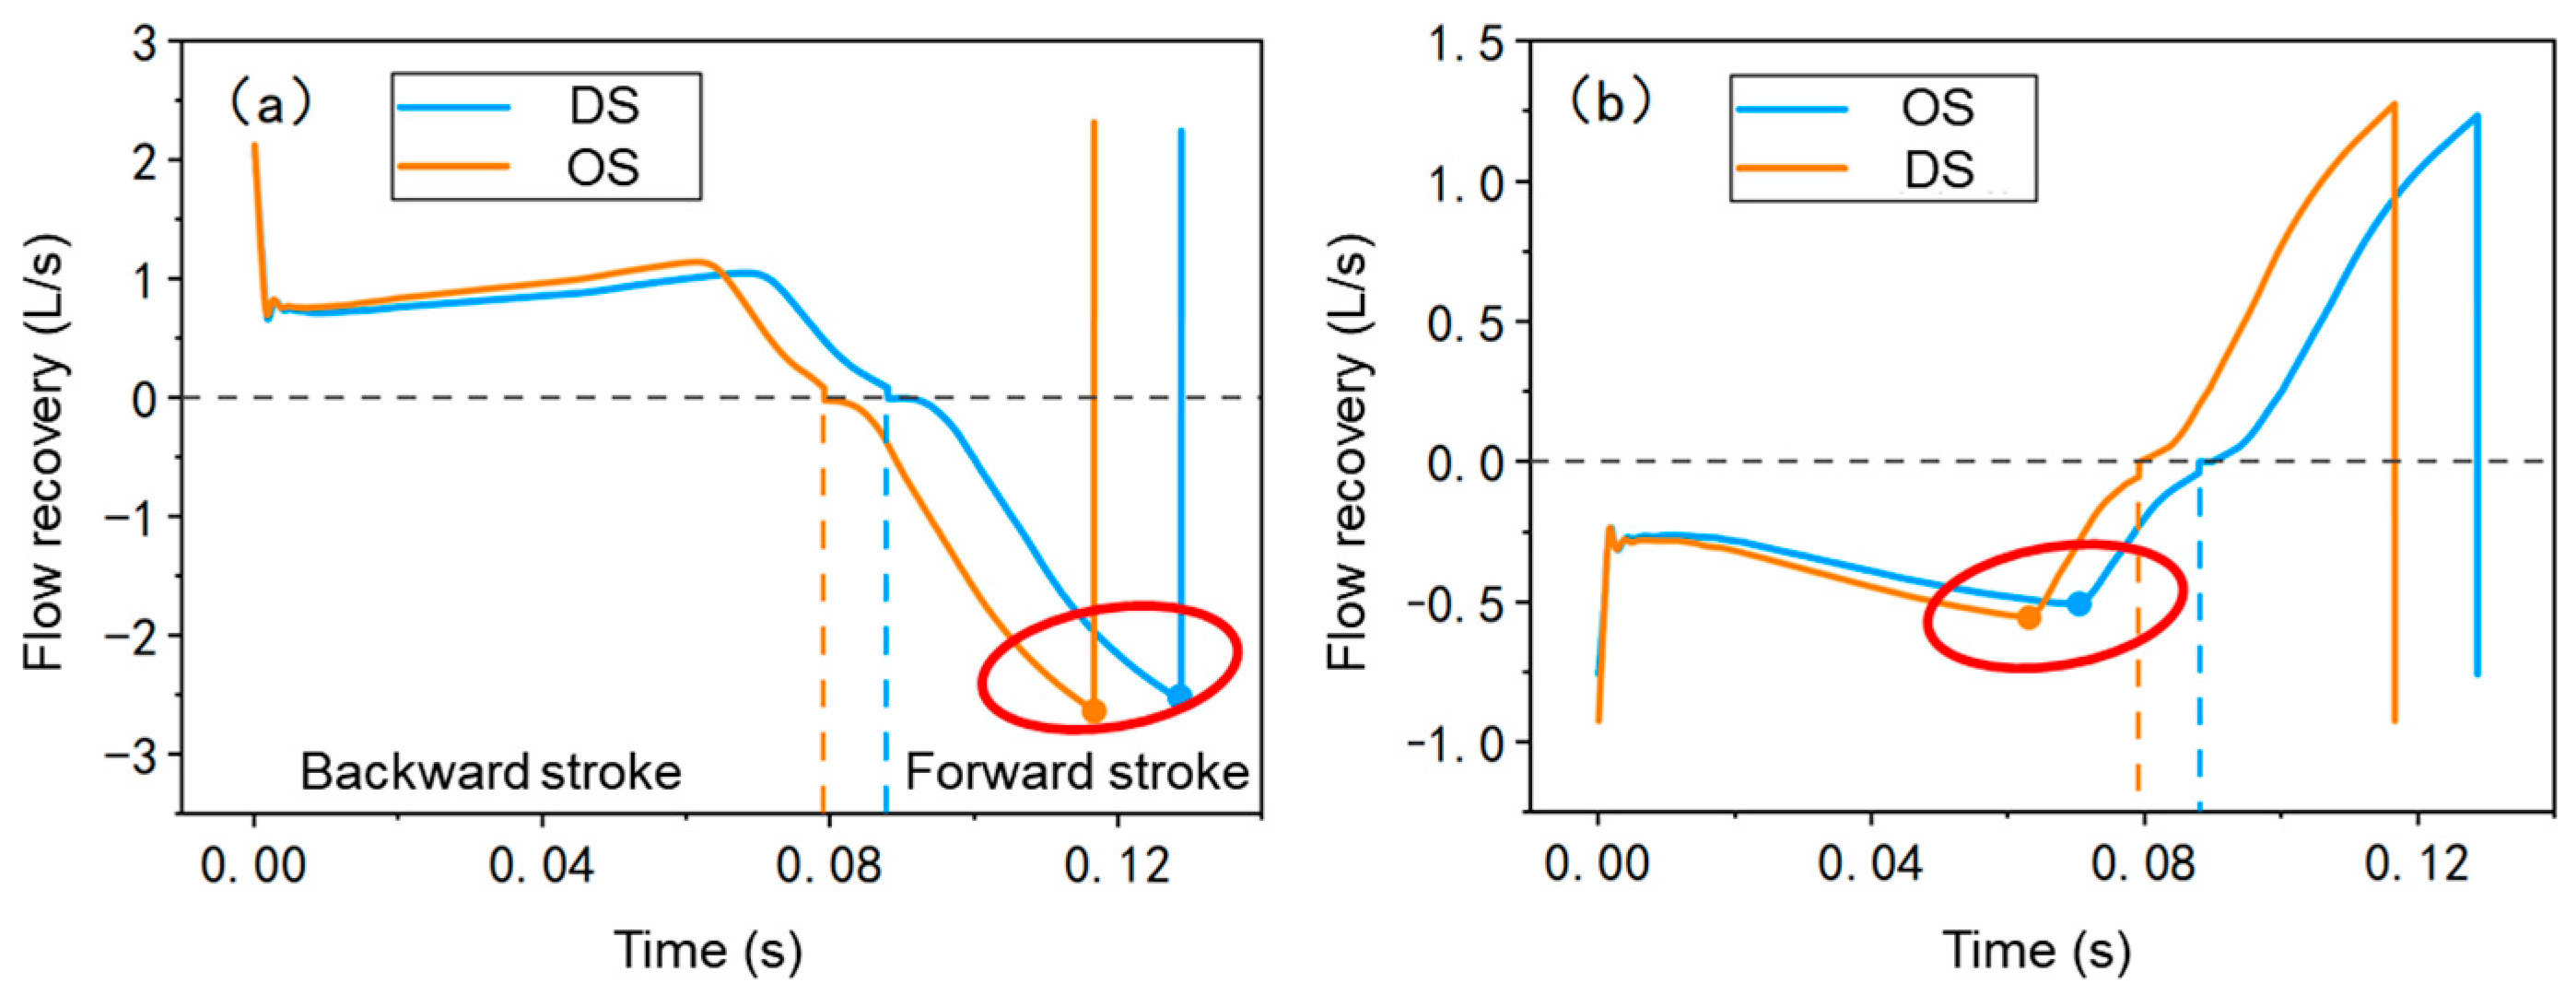
  • With the addition of the deflector, the flow rate of the non-attached wall-side evacuation channel in the return and stroke decreased by 9.2% and 5.3%, respectively, indicating that the deflector acts as an obstacle for the main jet to be discharged to the non-attached wall side in both processes, which allows more of the main jet to enter the output channel on the attached wall side.
  • The maximum flow recovery of the output channel of the deflector structure in the return and stroke increased by 9.1% and 3.6%, respectively, compared with the original structure, indicating that the deflector structure has higher energy utilization.
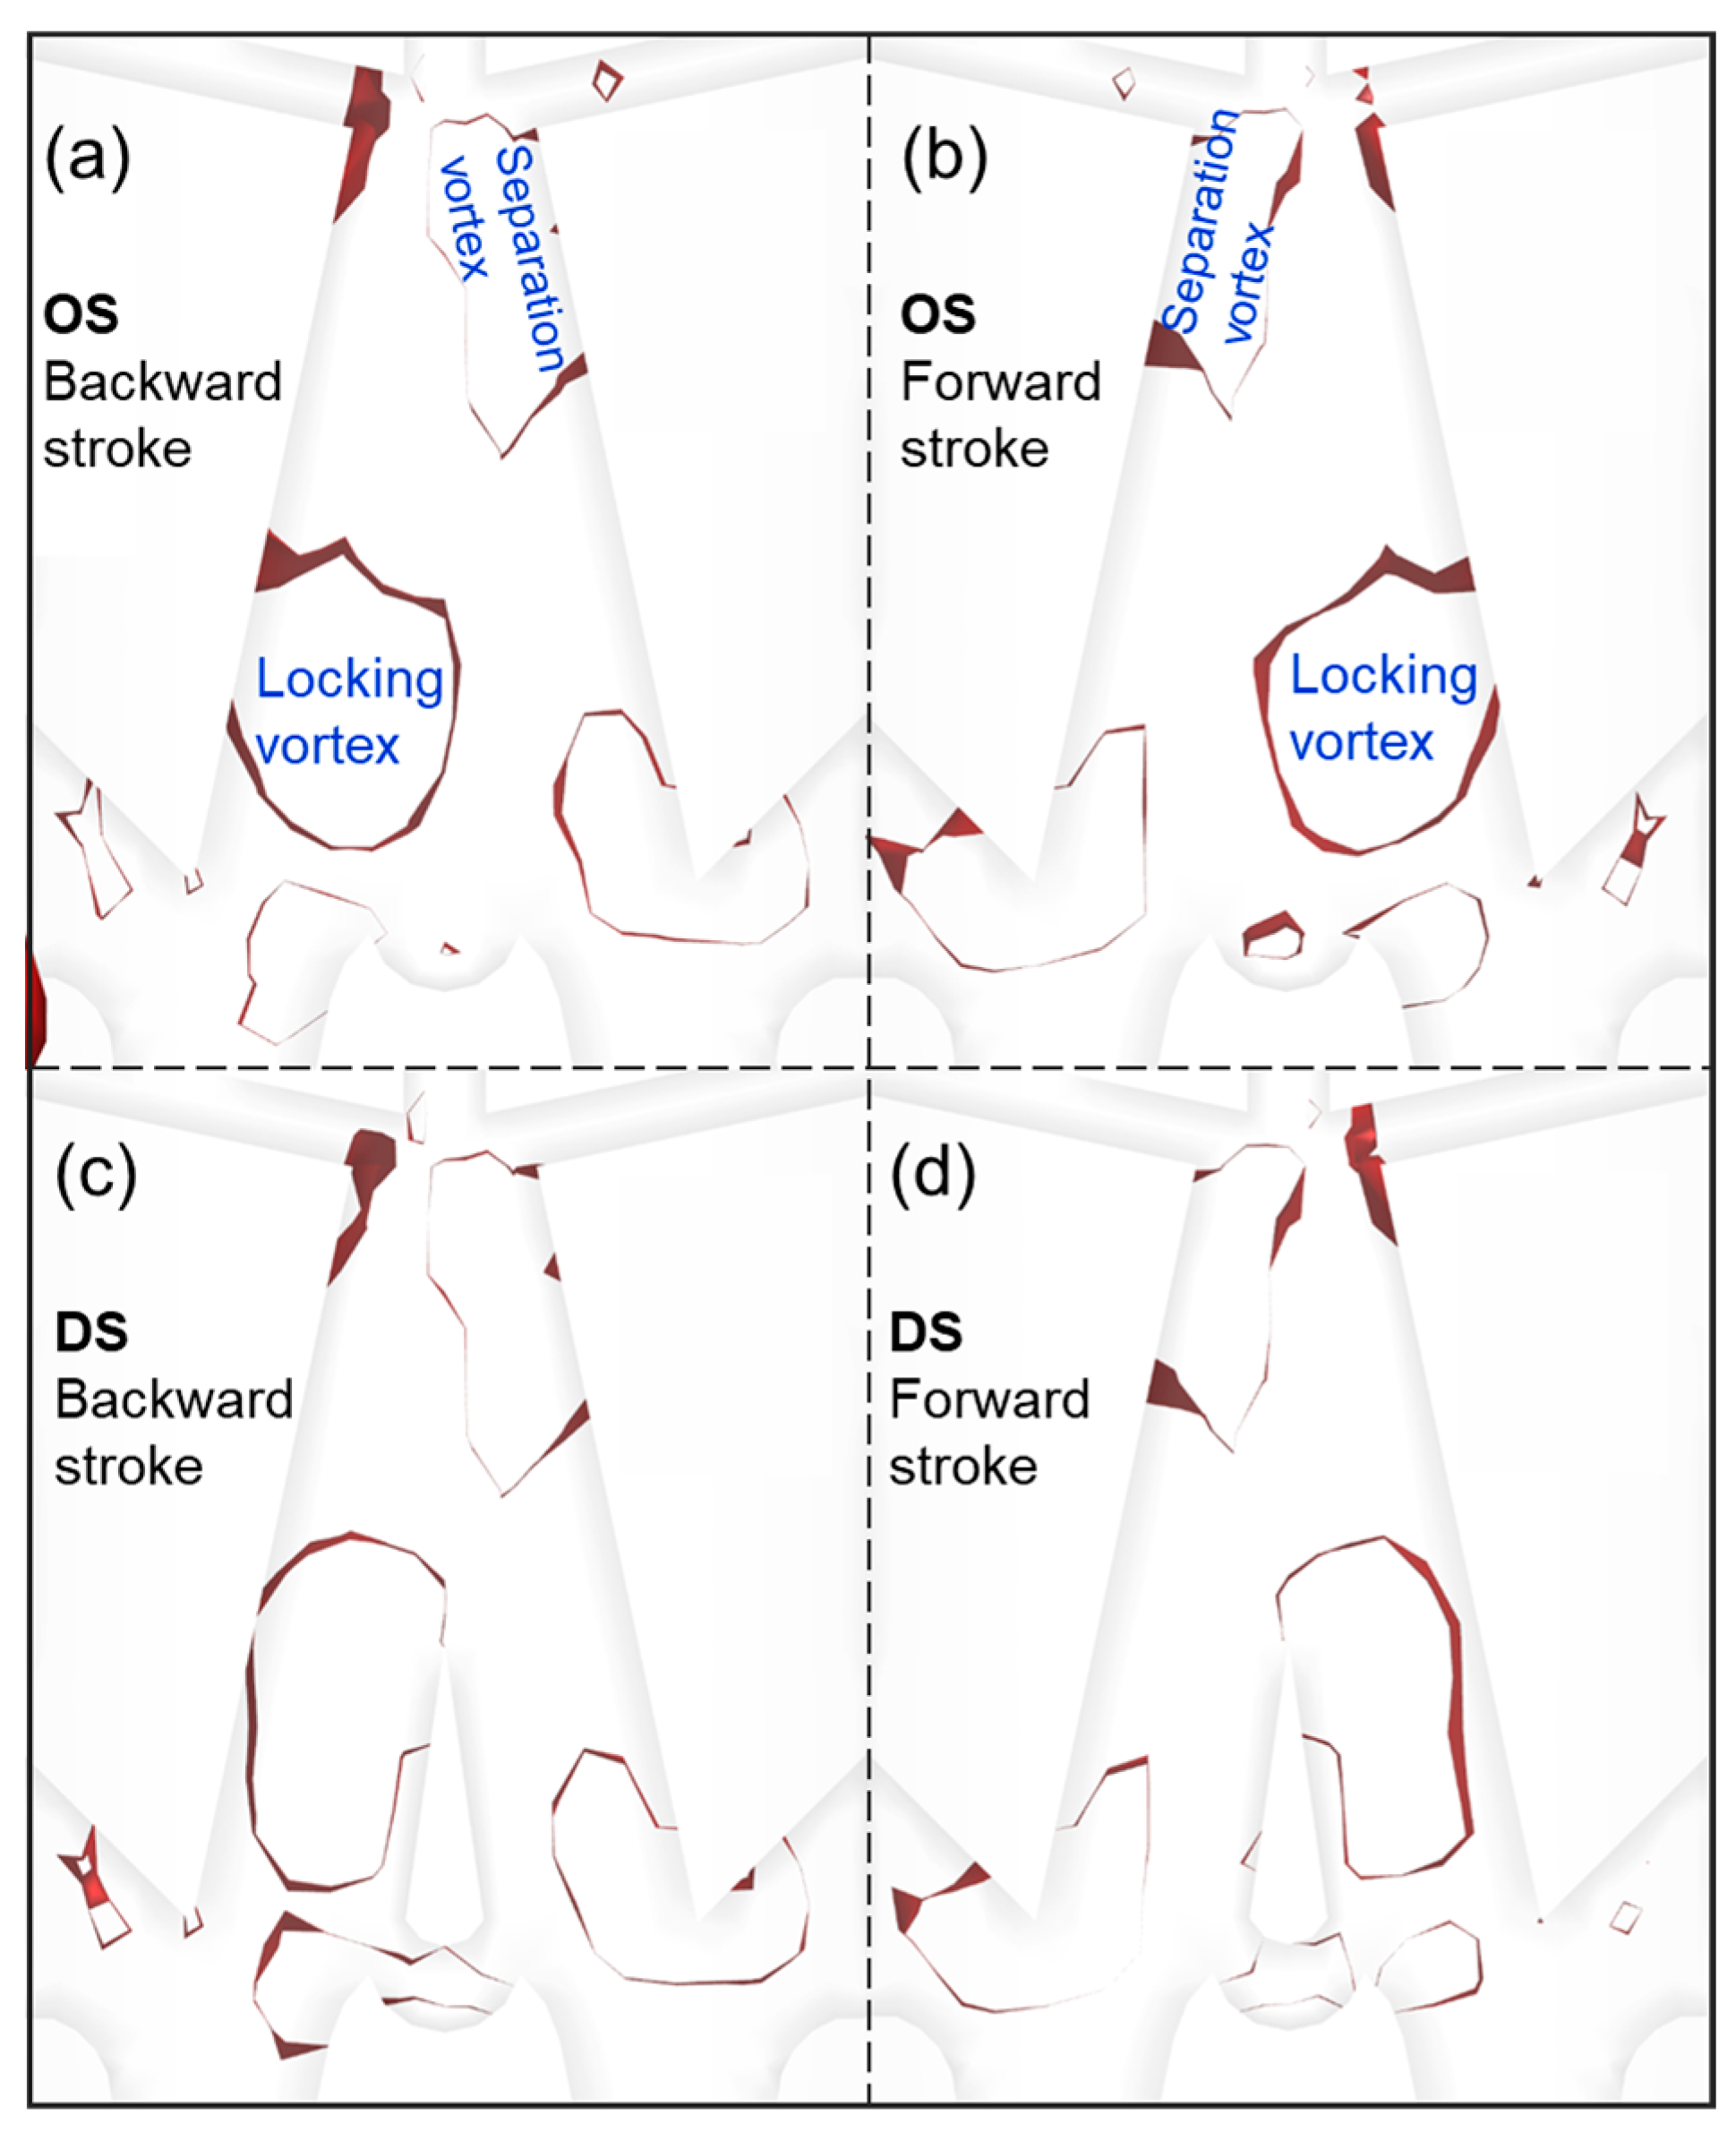
  • The Ω-identification method was used to investigate the effect of the deflector plate structure on the vortices in the cavity. With the addition of the deflector plate structure, the morphology of the separating vortices remains almost unchanged, while the locking vortices were observed to congregate predominantly on a single side of the deflector plate, with an augmented axial reach extending in the upward direction. This redistribution of the locking vortices is instrumental in enhancing the deflection of the primary jet, thereby optimizing the flow field’s stability and efficiency.
  • The results of the bench test show that compared with the original structure without the deflector, the average impact frequency of the deflector structure increased by 5.8%, the single average impact energy increased by 7.5%, and the output power increased by 13.75%.

Author Contributions

Conceptualization, G.Z.; methodology, G.Z.; software, G.Z. and D.G.; investigation, G.Z. and J.P.; resources, J.P.; formal analysis, G.Z. and J.L.; data curation, G.Z. and J.L.; writing—original draft preparation, J.L.; writing—review and editing, D.G.; visualization, G.Z. and J.L.; supervision, D.G. All authors have read and agreed to the published version of the manuscript.

Funding

This research received no external funding.

Data Availability Statement

The data presented in this study are available on request from the corresponding author. The data are not publicly available due to privacy.

Conflicts of Interest

The authors declare that they have no competing interests in this work.

Abbreviations

The following abbreviations are used in this manuscript:
BOOutput channel of backward stroke side
FOOutput channel of forward stroke side
BDDischarge channel of backward stroke side
FDDischarge channel of forward stroke side
TDCTop dead center
BDCBottom dead center
aDeflector distance
bDeflector width
cReflow channel width
ρFluid density
u,v,wComponents of the velocity vector
pPressure
τViscous stress
FBody force
cpSpecific heat capacity
kHeat transfer coefficient
STInternal energy of the fluid
RRange
OSOriginal structure
DSDeflector structure
ASymmetric tensor
BAsymmetric tensor

References

  1. Sharmin, T.; Khan, N.R.; Akram, M.S.; Ehsan, M.M. A State-of-the-art Review on for Geothermal Energy Extraction, Utilization, and Improvement Strategies: Conventional, Hybridized, and Enhanced Geothermal Systems. Int. J. Thermofluids 2023, 18, 100323. [Google Scholar] [CrossRef]
  2. Zhang, E.Y.; Wen, D.G.; Wang, G.L.; Yan, W.D.; Wang, W.S.; Ye, C.M.; Li, X.F.; Wang, H.; Tang, X.C.; Weng, W.; et al. The first power generation test of hot dry rock resources exploration and production demonstration project in the Gonghe Basin, Qinghai Province, China. China Geol. 2022, 5, 372–382. [Google Scholar] [CrossRef]
  3. Li, Y.; Peng, J.; Li, J.; Ge, D. Theoretical and Experimental Study on Single Spherical Button Penetration into Granite Rock Under Dynamic Impact Loading. Rock Mech. Rock Eng. 2022, 55, 213–233. [Google Scholar] [CrossRef]
  4. Liu, W.; Gao, K. Drilling technical difficulties and solutions in development of Hot dry Rock geothermal energy. Adv. Pet. Explor. Dev. 2017, 13, 63–69. [Google Scholar]
  5. Lukawski, M.Z.; Anderson, B.J.; Augustine, C.; Capuano, L.E.; Beckers, K.F.; Livesay, B.; Tester, J.W. Cost analysis of oil, gas, and geothermal well drilling. J. Pet. Sci. Eng. 2014, 118, 1–14. [Google Scholar] [CrossRef]
  6. Yin, K.; Jian, Z.J.; Jiang, R.Q. Research on large impact energy hydro-hammer and its application. Explor. Eng. 1996, 4, 8–10. [Google Scholar]
  7. Li, Y.; Peng, J.; Zhang, P.; Huang, C. Hard rock fragmentation in percussion drilling considering confining pressure: Insights from an experimental study. Int. J. Rock Mech. Min. Sci. 2021, 148, 104961. [Google Scholar] [CrossRef]
  8. Li, Y.; Peng, J.; Zhang, Y.; Yin, Q. Rock Indentation Characteristics Induced by Spherical Button Subjected to Dynamic and quasi-static Loads. Rock Mech. Rock Eng. 2023, 56, 5253–5273. [Google Scholar] [CrossRef]
  9. Peng, J.; Ge, D.; Zhang, X.; Wang, M.; Wu, D. Fluidic DTH hammer with backward-impact-damping design for hard rock drilling. J. Pet. Sci. Eng. 2018, 171, 1077–1083. [Google Scholar] [CrossRef]
  10. Lourenço, A.M.F.; Miska, S.Z.; Reed, T.D.; Pickell, M.B.; Takach, N.E. Characterization of foam rheology at HPHT for hydraulics optimization whilst drilling underbalanced. Annu. Trans.-Nord. Rheol. Soc. 2003, 11, 39–48. [Google Scholar]
  11. Zhang, X.; Zhang, S.; Luo, Y.; Wu, D. Experimental study and analysis on a fluidic hammer—An innovative rotary-percussion drilling tool. J. Pet. Sci. Eng. 2019, 173, 362–370. [Google Scholar] [CrossRef]
  12. Li, K.; Peng, J.; Li, Y.; Ge, D.; Li, J. Performance prediction of solid particle erosion in fluidic oscillators for fluidic hammers based on CFD-DPM. Powder Technol. 2023, 428, 118819. [Google Scholar] [CrossRef]
  13. Coanda, H. Device for Deflecting a Stream of Elastic Fluid Projected into an Elastic Fluid. U.S. Patent US2052869A, 1 September 1936. [Google Scholar]
  14. Li, L.; Li, Q.; Ni, Y.; Wang, C.; Tan, Y.; Tan, D. Critical penetrating vibration evo-lution behaviors of the gas-liquid coupled vortex flow. Energy 2024, 292, 130236. [Google Scholar] [CrossRef]
  15. Li, L.; Xu, W.; Tan, Y.; Yang, Y.; Yang, J.; Tan, D. Fluid-induced vibration evolution mechanism of multiphase free sink vortex and the multi-source vibration sensing method. Mech. Syst. Signal Process. 2023, 189, 110058. [Google Scholar] [CrossRef]
  16. Karpenko, M.; Stosiak, M.; Šukevičius, Š.; Skačkauskas, P.; Urbanowicz, K.; Deptuła, A. Hydrodynamic Processes in Angular Fitting Connections of a Transport Machine’s Hydraulic Drive. Machines 2023, 11, 355. [Google Scholar] [CrossRef]
  17. Karpenko, M.; Bogdevičius, M. Investigation of hydrodynamic processes in the system–“pipeline-fittings”. In TRANSBALTICA XI: Transportation Science and Technology, Proceedings of the International Conference TRANSBALTICA, Vilnius, Lithuania, 2–3 May 2019; Springer International Publishing: Cham, Switzerland, 2020; pp. 331–340. [Google Scholar]
  18. Chen, J.W. Research on Simulation and Experiment of the Liquid Jet Hammer; Jilin University: Changchun, China, 2007. [Google Scholar]
  19. Pramanik, S.; Das, M.K. Numerical characterization of a planar turbulent offset jet over an oblique wall. Comput. Fluids 2013, 77, 36–55. [Google Scholar] [CrossRef]
  20. Zhang, T.; Qin, Y.; Han, D. A Canyon Street Optimization Design Method Based on Pollutant Concentration Control. C.N. Patent CN113378494A, 10 September 2021. [Google Scholar]
  21. Ge, D.; Peng, J.; Li, K.; Huang, C.; Lian, M.; Yang, Z. Influence of water-based drilling fluids on the performance of the fluidic down-the-hole hammer. J. Pet. Sci. Eng. 2020, 195, 107817. [Google Scholar] [CrossRef]
  22. Zhang, G.; Peng, J.; Ge, D.; Li, J.; Li, B.; Xie, Y. Effect of control flow on main jet switching for single and double feedback channels fluidic oscillator. J. Pet. Sci. Eng. 2022, 216, 110810. [Google Scholar] [CrossRef]
  23. Hunt, J.C.; Wray, A.A.; Moin, P. Eddies, streams, and convergence zones in turbulent flows. In Center for Turbulence Rersearch Proceeding8 of the Summer Program; NASA: Washington, DC, USA, 1988; pp. 193–208. [Google Scholar]
  24. Liu, C. Liutex-third generation of vortex definition and identification methods. Acta Aerodyn. Sin. 2020, 38, 413–431. [Google Scholar]
Figure 1. Illustration of the fluidic hammer (a) and fluidic oscillator (b), reprinted with permission from ref. [12].
Energies 18 01336 g001
Figure 2. Illustration of the flow field of the fluidic oscillator.
Energies 18 01336 g002
Figure 3. Main structural parameters of the deflector.
Energies 18 01336 g003
Figure 4. Mesh of calculation domain of fluidic hammer driven.
Energies 18 01336 g004
Figure 5. (a) Deflector assembly schematic and (b) real photo.
Energies 18 01336 g005
Figure 6. (a) Schematic diagram of the SC86-H-type fluidic hammer experimental device. (b) Manufactured fluidic oscillators and other parts, modified with permission from [22].
Energies 18 01336 g006
Figure 7. Schematic diagram of flow field of the backward stroke. (a) Fluidic oscillator with deflector (OS); (b) fluidic oscillator without deflector (DS).
Energies 18 01336 g007
Figure 8. Schematic diagram of flow field of the forward stroke. (a) OS; (b) DS.
Energies 18 01336 g008
Figure 9. Changes in flow rate of discharge channel: (a) backward stroke side; (b) forward stroke side.
Energies 18 01336 g009
Figure 10. Changes in flow rate of output channel: (a) backward stroke side; (b) forward stroke side.
Energies 18 01336 g010
Figure 11. Distribution pattern of vortex under the Ω method. (a) Backward stroke of OS; (b) Forward stroke of OS; (c) Backward stroke of DS; (d) Forward stroke of DS.
Energies 18 01336 g011
Figure 12. The displacement–time curve of the DS and OS (200 L/min).
Energies 18 01336 g012
Figure 13. Output performance of the deflector structure and the original structure fluidic oscillator. (a) Average impact frequency; (b) Average single impact energy; (c) Average output power.
Energies 18 01336 g013
Table 1. Influencing factors and the values of levels.
LevelsFactors
a (mm)b (mm)c (mm)
112.51.61.8
213.52.02.2
314.52.42.6
Table 2. L9(34) orthogonal experimental design table.
Experiment No.InputOutput
a (mm)b (mm)c (mm)ErrorCycle Time (s)Impact Velocity (m/s)
111110.11985.33
212220.11885.36
313330.12785.32
421230.11785.38
522310.11285.38
623120.12585.34
731320.11985.32
832130.11965.31
933210.12765.32
Cycle time
K10.12210.11910.12170.1219
K20.12060.11890.12140.1215
K30.12230.12710.12190.1217
R0.00170.00820.00050.0004
Factors ordered by significanceb > a > c
Best combinationa2b2c2
Impact velocity
K15.33675.34335.32675.3433
K25.36675.35005.35335.3400
K35.31675.32675.34005.3367
R0.05000.02330.02670.0033
Factors ordered by significancea > c > b
Best combinationa2b2c2
Table 3. Analysis of variance for the cycle time.
FactorsSum of the Squares
of Deviations
Degrees of
Freedom
Mean SquareF RatioP RatioSignificance
a5.40 × 10−622.70 × 10−621.70.044**
b1.30 × 10−426.51 × 10−55230.002***
c4.36 × 10−722.18 × 10−71.750.3636
Total error2.49 × 10−721.24 × 10⁻⁷
The number of * indicates the level of significance.
Table 4. Analysis of variance for the impact velocity.
FactorsSum of the Squares of DeviationsDegrees of
Freedom
Mean SquareF RatioP RatioSignificance
a3.8 × 10−321.90 × 10−3570.017**
b8.67 × 10−424.33 × 10−4130.071*
c1.07 × 10−325.33 × 10−4160.059*
Total error6.67 × 10−523.33 × 10⁻⁵
The number of * indicates the level of significance.
Disclaimer/Publisher’s Note: The statements, opinions and data contained in all publications are solely those of the individual author(s) and contributor(s) and not of MDPI and/or the editor(s). MDPI and/or the editor(s) disclaim responsibility for any injury to people or property resulting from any ideas, methods, instructions or products referred to in the content.

