Article

Influence of Conductor Temperature on the Voltage–Current Characteristic of Corona Discharge in a Coaxial Arrangement—Experiments and Simulation

by
Kayumba Grace Ilunga
1,*,
Andrew Graham Swanson
1,2,
Nelson Ijumba
3 and
Robert Stephen
1
1
Discipline of Electrical, Electronic and Computer Engineering, University of KwaZulu-Natal, Durban 4041, South Africa
2
Department of Electrical and Electronic Engineering, Stellenbosch University, Stellenbosch 7600, South Africa
3
African Centre of Excellence in Energy for Sustainable Development, University of Rwanda, Kigali 3900, Rwanda
*
Author to whom correspondence should be addressed.
Energies 2025, 18(5), 1303; https://doi.org/10.3390/en18051303
Submission received: 6 February 2025 / Revised: 26 February 2025 / Accepted: 3 March 2025 / Published: 6 March 2025
(This article belongs to the Section F3: Power Electronics)

Abstract

:
High-current-carrying capability with minimum thermal elongation is one of the key reasons for using high-temperature low-sag (HTLS) conductors in modern power systems. However, their higher operational temperature can significantly affect corona discharge characteristics. Corona is one of the key factors in transmission line design considerations. Corona discharge is the leading cause of audible noise, radio interference, and corona loss in power transmission systems. The influence of conductor temperature on corona discharge characteristics is investigated in this paper using experimental methods and computational simulations. A simulation framework has been developed in COMSOL Multiphysics using the physics of plasmas and electrostatics to simulate corona plasma dynamic behavior and electric field distribution. The results show that the conductor temperature enhances the ionization by electron impact, enhances the production of positive and negative ions, changes the electric field distribution, and increases the electron temperature. This analysis emphasizes that temperature-dependent conditions affect the inception and intensity of corona discharge. Additionally, an experimental model was developed to evaluate corona voltage–current characteristics under varying temperature conditions. The study presents both simulation results and a newly developed model for predicting corona current at high conductor temperatures.

1. Introduction

The aluminum conductor steel-reinforced (ACSR) cable is commonly used for transmission lines. However, research indicates that issues related to the behavior of ACSR conductors in overhead lines, particularly under tension and stress, remain a recurring challenge [1,2,3]. In the face of increasing energy demand and the need for efficient power transmission, high-temperature low-sag (HTLS) conductors have emerged as a transformative solution for modern power systems [4,5]. These advanced conductors are specifically designed to handle higher current loads while maintaining minimal thermal expansion, making them ideal for enhancing the capacity and reliability of transmission lines compared to conventional aluminum conductor steel-reinforced (ACSR) cables [6]. However, special operational characteristics of HTLS conductors, especially the high operational temperatures, introduce complex challenges regarding the behavior of corona discharge [7].
Corona discharge is a phenomenon that occurs due to the ionization of air when a high voltage (HV) is applied between electrodes with significantly different radii of curvature. The intense electric field near the corona electrode initiates charge generation and transport in air medium, which is a fundamental aspect of corona discharge. Consequently, ions drift from the HV electrode to the grounded electrode, creating a space charge and allowing an electric current to flow between the electrodes [8]. Corona discharge can adversely affect transmission line performance, generating audible noise, radio interference, and corona power losses.
Several investigations on corona discharge were conducted using various inter-electrode distances and different radii of high-voltage electrode points to evaluate the electric field strength. Among them, the coaxial cylinders (corona cage) are an effective means of designing ultra-high voltage transmission lines. corona cages are used instead of single-phase overhead test lines because they are less expensive, easier to set up, and have a quicker testing cycle. Corona cages offer a controlled environment for studying the corona effect with variable test conditions and low voltage requirements, making them suitable for studying high-voltage transmission systems. Corona cages are generally useful and can simulate AC or DC transmission lines. Most universities and power companies constantly use them to study corona discharge and the electromagnetic effect on transmission lines [9]. This configuration is considered in this work.
It has been found from previous research on the corona effect that microparticles are accelerated by intense electric fields, especially in regions with small radii of curvature, causing the electrode to experience force-induced vibration and torsion, reducing the dynamic stability of electrical equipment. Consequently, understanding the characteristics of corona discharge is of considerable importance [10,11,12].
Many particles, such as ions, free radicals, and excited species, are produced during the microscopic corona discharge process, which can further lead to complex physical and chemical reactions. Early attempts at research tried to simulate the gas discharge process using circuit models [13]. However, the measurement techniques were lacking in plasma discharge processes. Later, numerical simulation methods became a strong tool to investigate in detail the microscopic dynamics of the corona discharge process [14,15]. Numerical simulations can analyze temporal evolutions of local electric-field distributions and variations in space and surface charge due to corona discharges. These simulations provide a quantitative understanding of interactions between charge distribution and discharge processes. Besides, numerical methods complement the shortcomings of various direct measurement methods, especially on the microphysical mechanisms of a discharge phenomenon [12].
The detailed physicochemical description of corona discharge is highly complex, influenced by gas composition, temperature, and the physical characteristics of the generated ions. Despite this complexity, numerous simplified models have been effectively validated through comparison with experimental measurements [16,17,18].
However, a transmission line must be evaluated under various weather conditions before its design is finalized. Several researchers have studied the effect of parameters such as pressure, humidity, and temperature on corona discharge. The study conducted on the corona effect as a function of temperature is important since it provides useful independent variables when voltage–current characteristics and the breakdown process are investigated [18,19,20,21].
Most studies on how temperature affects corona discharge have concentrated on ambient temperature, with only a limited number examining the role of conductor temperature [7,22,23,24,25,26,27,28]. To the authors’ knowledge, no previous research has simulated the influence of conductor temperature on corona discharge dynamics.
This work builds upon our prior research in [21], where we introduced an experimental method for measuring conductor temperature under corona conditions, developed a model to compute temperature within the ionization region of a heated conductor, and proposed a modified Peek formula that accounts for conductor temperature. In contrast, the present study focuses on modeling the corona current under the influence of conductor temperature. We propose a revised Townsend formula for voltage–current (VI) characteristics, integrating the temperature model from [21] with experimental results. Additionally, the paper presents one-dimensional simulations of corona discharge to investigate the effects of conductor temperature on corona key parameters, including electron temperature, positive and negative ion distributions, and reduced electric field strength. These simulations leverage the temperature model from [21] to analyze how conductor thermal variations impact corona dynamics.
The extensive simulation model developed with COMSOL Multiphysics integrates concepts of plasma physics and electrostatics to represent the dynamic behavior of corona plasma and its electric field distribution. Several important contributions have been presented in this work: it reveals a new model for predicting voltage–current (VI) characteristics of the corona effect at high conductor temperatures, proposes a new technique for understanding conductor temperature impact in terms of corona discharge characteristics, and presents useful information regarding temperature-dependent factors such as ionization radius, density of air, and conductor surface factors. In addition, it presents useful tips for optimizing transmission line design with HTLS conductors. Conclusions drawn in this work bridge theoretical and experimental observations, providing an important tool for enhancing high-voltage transmission line design performance. Section 1 is introductory, Section 2 deals with theoretical analysis of temperature and corona discharge, Section 3 describes model and simulation techniques for corona and its output, Section 4 describes experimental arrangement and observations, and Section 5 presents concluding observations of the work.

2. Corona Discharges and Temperature Effects

The electric field distribution around conductors and prevailing atmospheric conditions significantly influence corona inception on transmission line conductors. Computational models incorporating the ionization processes driving corona discharge allow a more accurate evaluation of corona inception characteristics. As demonstrated in [29], a model was developed to account for the asymmetric radial distribution of electric field intensity around single or bundled line conductors. This approach first involves calculating the electric field distribution at each line phase using electrostatic simulations, which consider the line geometry, tower structure, and conducting and insulating components. Subsequently, the corona onset voltage for all phase conductors is determined based on these electric field distributions and the atmospheric conditions at the installation site [29]. Corona discharge characteristics under different atmospheric conditions of humidity, pressure, and temperature have been studied by various investigators [30,31,32]. Previous investigations on the temperature influence on the corona effect have identified relative air density and the Townsend coefficient as pivotal to understanding the temperature effect on corona discharge [19,33]. The influence of relative air density on corona discharge can be evaluated using Peek’s formulation (1), as outlined below.
E i n c = 21 × m × δ × 1 + K δ r c
where E i n c is the surface inception electric field strength in (kV/cm), r c is the radius of the conductor in cm, with the subscript c denoting the conductor this notation will be used consistently throughout this work, m is the surface roughness of the conductor, K is constant derived experimentally, and δ is the relative air density given by (2):
δ = p p o × T o T
where T o is the standard temperature (K), T is the ambient air temperature (K), p o is the standard pressure (hPa), and p is the ambient pressure (hPa). The empirical expression for electric field strength, as presented in Peek’s Equation (1), links temperature and corona inception voltage while accounting for the influence of relative air density. According to Townsend, in a non-uniform electric field gap, ionization of the gas occurs only in proximity to the electrode of a small radius, called the ionization radius, where the external field is strong enough; hence, the plasma channel crosses the gap by propagation of an ionizing wave arising in this high-field region. The high conductivity of the plasma channel allows the initial potential to attach to the ionizing front and amplify the local electric field. This allows the ionizing wave to propagate through areas of weaker external fields within the gap [34].
Several electrode configurations can produce corona discharge. However, the coaxial cylindrical system is the most practical choice from theoretical and experimental perspectives. Therefore, we will focus on this arrangement, where the inner cylinder (or wire) has a smaller radius than the outer cylinder. In that configuration, the discharge is separated into two main regions: the ionization region, often called the glow discharge region, and the drift region, also known as the space-charge region. The ionization region is characterized by a radius r i around the conductor of radius r c and the conduction region of length R r i , as shown in Figure 1. In this context, the radial coordinate r ranges from the conductor surface to the inner surface of the cage. The limit between these two regions is determined by the point where the ionization coefficient equals the attachment coefficient. The ionization coefficient α is larger than the attachment coefficient η in the ionization zone.
All the physical processes that govern the progression of corona discharge modes, corona loss, audible noise, and radio interference occur within the ionization region. This region is also where all gas-phase plasma chemical reactions take place. Several researchers have concentrated on studying the ionization region of corona discharges under atmospheric conditions using coaxial cylindrical electrodes. Experimental studies have demonstrated that the ionization radius r i of corona discharges depends only on the radius of the discharge wire r c and is unaffected by the corona current. However, other studies combining both experimental and theoretical methods suggest that r i is influenced by both the wire radius r c and the corona current [35,36,37,38]. As a result, there is uncertainty regarding determining the ionization radius for corona discharges in atmospheric air, which is commonly encountered in most equipment. However, regardless of uncertainties and assumptions used in its derivation, this study adopts Equation (3) proposed by Combine for calculating the ionization radius, r i . This equation, which defines the radius where the electric field falls below the 30 kV/cm ionization threshold, aligns well with Peek’s empirical formula [37].
r i = r c + 0.3 r c
where r i is the ionization radius and r c is the conductor radius.
This paper presents a simulation of the conductor temperature’s influence on corona discharge using the experimental model introduced in our earlier work [21]. Only a few studies have involved the effect of the conductor temperature on the analysis of corona discharges [7,22,23,24,25,26,27,28,39]. To bridge this gap, we implemented the temperature-dependent model proposed by the authors, which incorporates conductor temperature as a critical parameter within the ionization region. This inclusion significantly influences the corona intensity and inception voltage. By considering this temperature-sensitive parameter, our study aims to provide deeper insights into the behavior of corona discharge under varying conductor thermal conditions.

2.1. Corona Voltage–Current Characteristics

The voltage–current (VI) characteristics of corona discharges, for both positive and negative polarities, have been extensively studied under various operating conditions and electrode geometries [40]. The voltage–current (VI) characteristics of corona discharges have been represented using several empirical formulas. Despite the complexity of the corona discharge phenomenon, the steady-state VI relationship in a wire-cylinder electrode system can be effectively described by the Townsend relationship [41], expressed as:
I = A v i U ( U U i n c )
where I is the corona current, U is the applied voltage, U i n c is the corona inception voltage, and A v i is the proportionality constant depending on the electrode configuration and atmospheric condition and is defined as in (5). The subscript v i indicates that the constant is associated with the voltage–current (VI) characteristics. In the case of a coaxial cylinder, A v i is given by
A v i = 8 π ε 0 μ R 2 ln R r c
where ε 0 is the permittivity of free space, μ is the mobility of ions, and R and r c are the radius of the cage and the radius of the conductor within the cage. Most studies of VI characteristics are based mainly on measurements. Meng et al. suggested a different relationship for a point-to-plane electrode system, given as:
I = K v i ( U U i n c ) n
where K v i is the geometrical constant.
The exponent n falls typically within the range of 1.5–2.0. This formula has been widely adopted in many proposal studies describing corona VI characteristics because it addresses some limitations of other models and accurately represents corona behavior. The voltage–current characteristics of corona discharge can thus be described using Equations (4) and (6), with the key parameters A v i , K v i , U i n c , and n depending on the electrode geometry, charge carrier mobility, and physical properties of the gas, including pressure, temperature, and humidity [40]. Since corona discharge frequently occurs in environmental conditions with a significant variation in temperature and pressure, understanding how these thermodynamic parameters influence A v i , K v i , U i n c , and n is important. Understanding how gas pressure and temperature affect the parameters A v i , K v i , U i n c , and n requires statistical estimation. This paper explores conductor temperature effects on VI characteristics of AC corona discharge in a coaxial-cylinder electrode. The main goal is to use a temperature model presented in [21] together with the Townsend ionization coefficient and Formulas (4) and (6) to develop a reliable model for understanding and predicting corona behavior under various conductor temperatures.

2.2. Influence of Conductor Temperature on Corona

The impact of temperature on corona discharge is well known; temperature affects inception voltage and corona intensity through the relative air density and Townsend coefficient. However, selecting an appropriate temperature for calculating these parameters is somewhat tricky, especially in the case of conductor temperature. Award et al. suggested that the relative air density may be calculated by the ratio of the gas’s absolute temperature to the average temperature between the electrodes [23]. While evaluating the conductor temperature effect on corona through experimental studies, Morgan developed a temperature equation for calculating relative air density in Peek’s formula [28]. In our earlier work [21], we have suggested a model for the temperature of the ionization region, which will be used in this work. The model provides a way to calculate the temperature in the ionization region considering the conductor temperature. Equation (7) of [21] states this relationship in terms of conductor temperature T c , ionization radius r i , and experimentally derived parameters A = 0.7154 and λ = 0.6809 . The calculated ionization region temperature T r i is then used to calculate the relative air density, which is very important in the description of corona discharge onset.
T r i = T c × ( 1 A × e λ r i )
where T r i is the temperature within the ionization radius, T c the conductor temperature, and A and λ are the experimentally derived parameters as stated earlier. Traditional models, such as Peek’s formula, consider main factors like relative air density and electric field strength, but they do not explicitly address the influence of conductor temperature. To address recent developments, the authors in [21] have brought in changes to the Peek formula by including the developed temperature model T r i as one of the variables in the calculation of the relative air density, considering its interaction with the ionization process and the electric field distribution close to the conductor. To account for the effect of conductor temperature on corona discharge, the inception voltage formula has been modified to include temperature-dependent parameters, as shown in (8):
E i n c mod = 21 × m × δ × 1 + K δ r c + B δ r c
where E i n c mod is the modified inception gradient, B is constant determined experimentally is equal to −0.2733, and temperature T r i (7) was used to calculate the relative air density.
Some researchers have shown that temperature affects corona current intensity more through the ionization and attachment coefficients. However, the influence of temperature on the ionization coefficient is higher than that of attachment. The ionization coefficient α represents the number of electrons generated per unit length along the electric field. It depends on the electric field, pressure p, and temperature T collisional cross-section σ [38,42].
σ = π × r 2
where σ is the collisional cross-section and r is the effective radius for the interaction.
The Townsend model that describes the relationship between the electric field E and the ionization coefficient α is given by [38]:
α = A α e B α / E
where A α and B α are ionization constants with subscript α denoting for the Townsend first ionization coefficient.
The corona discharge current increases sharply with the Townsend first ionization coefficient α increases.
The attachment coefficient η represents the number of electrons attached to gas molecules per unit length. There is no explicit theoretical formula for the attachment coefficient unless determined experimentally. This work will not consider the attachment coefficient, as its temperature influence is negligible.

3. Simulation Model and Results

Understanding the microscopic mechanism of corona discharge requires formulating a system of partial differential equations by transforming several fundamental equations, including the electron conservation equation, the electron energy conservation equation, the multicomponent diffusion transport equations for heavy species, the governing equations for heavy particles, and Poisson’s equation. Once these equations are established, they are further normalized and solved using discrete numerical difference methods.

3.1. Governing Equation

The following equation is used to obtain the electron density [43]:
n e t + · Γ e = R e
The term Γ e is the electron flux and is expressed as:
Γ e = μ e · E n e D e · n e
where R e accounts for electron source or loss due to reactions such as ionization or recombination, photoionization processes, and secondary emissions.
R e = α n e w e η n e w e R e r n e n p + v d e t n n + S 0
where μ e denotes the electron mobility, E is the electric field vector, D e represents the electron diffusion coefficient, n e is the electron concentration, n p is the positive ion concentration, n n is the negative ion concentration, α stands for the ionization coefficient, w e is the electron drift coefficient, η represents the attachment coefficient, R e r denotes the recombination coefficient between electrons and ions, v d e t is the electron dissociation coefficient, and S 0 refers to the initial electron concentration.
The continuity equations for ions are obtained from the multicomponent diffusion transport equation, a simplified form of the Maxwell–Stefan equation.
ρ t w k + ρ ( u · ) w k = · j k + R k
where the subscript k denote the species, w k is mass fraction, ρ is density of air, u is the average velocity vector of the fluid, R k is the source term caused by chemical reactions, and j k is the diffusion flux vector, which is expressed by the following equation:
j k = D k n k Z k μ k n k φ S k
The electron temperature, however, is determined using the electron energy conservation equation, expressed as follows:
n ϵ t + · Γ ϵ + E · Γ e = S e n ( u · ) n ϵ + Q + Q g e n / q
Γ ϵ = μ ϵ · E n ϵ D ϵ · n ϵ
where n ϵ is the electron energy density and S e n represents the energy loss due to inelastic collisions. At the same time, Q and Q g e n denote the external and generalized heat sources, respectively, μ ϵ is the mobility of electron energy, and D ϵ is the diffusion coefficient of electrons and q is the quantity of charge. The electric potential and electric field can be simulated using Poisson’s equation.
· ε 0 φ = e n p n e n n E = φ ,
where φ denotes the electric potential and ϵ 0 is the permittivity of the free space.

3.1.1. Boundary Conditions and Initial Conditions

A correct boundary condition is essential for the numerical solution of the governing partial differential equations in the 1D model of the AC corona discharge presented here. In an AC voltage, the discharge switches between the positive and negative half-cycles of voltage. The boundary conditions should comprise ionization and recombination. The boundary conditions of flux are imposed on species densities: electron and ion fluxes are specified at the conductor and surroundings boundaries, respectively, for the model to capture the behavior of the corona discharge throughout the AC cycle. In this study, a one-dimensional (1D) model was developed and simulated under an alternating current (AC) applied voltage in COMSOL. The ionization region is significantly smaller than the entire space, so the model incorporates a temperature profile focused on the boundary near the ionization radius. The boundary conditions for the voltage are the following [44].
U = V a p p × sin ( 2 × π × f )
where V a p p is the applied voltage, and f is the AC frequency of 50 Hz. The equation for electron flux at the wall boundary condition is as follows:
n · Γ e = 1 γ e 1 + γ e 1 2 ν t h n e γ i Γ i · n + Γ t · n
where n is the unit normal vector to the wall, γ e is the reflection coefficient set to be 0, γ i is the secondary emission coefficient from ion species, Γ i is the ion flux of species, and ν t h is the thermal velocity defined as:
v t h = 8 k b T e π m e
where T e is the electron temperature, k b the Boltzmann constant, and m e is the mass of electron. The term Γ t in (20) represents the thermal emission flux, which accounts for the gain of electrons due to thermionic emission. However, this model does not consider thermionic emission as the maximum temperature was less than 1273 K. Therefore, the equation can be written as:
n · Γ e = 1 γ e 1 + γ e 1 2 ν e , th n e γ i Γ i · n
The boundary conditions for the electron energy on the electrodes are as follows.
n · Γ ϵ = 1 γ e 1 + γ e 5 6 ν e , t h n ε γ i ϵ i Γ i · n
where ϵ i is the average energy of secondary electrons.

3.1.2. Plasma Air Chemistry

Under normal temperature and pressure conditions, several physical and chemical phenomena occur during corona discharge in air. These include collision ionization (high-energy electrons collide with neutral molecules to produce ions) and electron excitation (electrons transfer energy to the molecule to drive it to a higher energy state). These processes initiate a series of complex chemical reactions. Sakiyama et al. [44] identified 624 distinct chemical reactions linked to corona discharge [45]. In this study, the air is modeled as a mixture of 79% nitrogen N 2 and 21% oxygen O 2 , as the contributions of other components are negligible due to their small mass fractions. For the chemical model of reactions, 12 particles species are considered in the present work (e, N 4 + , N 2 + , N 2 , N , O 4 + , O 2 + , O 2 , N 2 , O, O + , O , N 2 O 2 ). The reaction processes were selected based on the model proposed in [13,43,45].

3.2. Simulation Results

To investigate the microscopic physical processes involved in corona discharge under varying conductor temperatures, a time-dependent study of numerical simulation model based on plasma chemical reactions and fluid dynamics Equations (11)–(23) was developed using COMSOL Multiphysics 6.1. The model uses a simplified one-dimensional model of corona discharge in a plasma module representing an air gap between two coaxial cylinders. This setup simulates a corona cage with a 75 cm radius and a conductor of 0.5 cm radius. The conductor is subjected to AC high voltage of 80 kV amplitude to simulate the electric field conditions leading to corona discharge. The study uses the local energy approximation. This approach is justified as it allows for a more accurate calculation of the electron temperature and the temperature distribution within the air gap. Since this work primarily aims to uncover the general discharge mechanism rather than determine precise values, this model was analyzed regarding the spatial distribution of important charged particles and the electric field intensity distribution under various conductor temperature scenarios at constant atmospheric pressure. A temperature range from 293 K to 552.35 K was applied in the simulation to analyze its influence on key plasma parameters, including electron temperature, electron density, reduced electric field, and the density of positive and negative ions. Figure 2 depicts the electron density variation as a function of radial position in corona discharge at different conductor temperatures within the ionization region while maintaining a constant background gas density.
As electrons are accelerated from the conductor, their density increases through a narrow region where they gain enough energy to reach a peak value, after which it declines to a saturation level in the drift region. Ionization in this region generates new electron–ion pairs. This demonstrates that higher temperatures lead to a more significant upward trend in electron density. The electron temperature changes with radial distance at various conductor temperatures, in Figure 3, offer important insights into corona discharge behavior. As the conductor rises, the peak electron temperature moves outward and spreads out more, suggesting that the ionization zone extends further from the conductor. The gradual decrease in electron temperature as you move away from the conductor also shows how energy disperses within the plasma. This trend highlights a meaningful connection between conductor temperature and ionization processes. Higher conductor temperatures likely increase thermal agitation, enhancing ionization rates and impacting recombination. These observations emphasize how conductor temperatures can affect the characteristics of corona discharges.
Figure 4 shows positive ion density distribution with distance from the conductor surface at various temperatures (293 K, 421.59 K, 461.39 K, 498.8 K, and 552.35 K).
The positive ion density is highest near the conductor and decreases rapidly with increasing distance, eventually stabilizing at lower values. With a rise in conductor temperature, ion density near the conductor can be seen to increase, with a larger region of corona ionization extending outwards. This can be taken to mean that rising temperatures enhance ionization in air, possibly through increased thermal activity and increased intensity of the electric field near the conductor. Higher temperatures cause a fall in the density of air and an improvement in ion mobility and can, therefore, affect the mechanism of corona discharge and its behavior in space. Figure 5 demonstrates how the density of negative ions varies with distance from the conductor at different temperatures. The density of negative ions is typically higher near the conductor due to the strong electric field and high ionization rates. At the lowest temperature of 293 K, the number density of negative ions remains relatively low and increases gradually with the radial coordinate. However, as the temperature rises to 421.59 K, 461.39 K, 498.8 K, and eventually 552.35 K, the ionization process strengthens, leading to a sharp increase in the peak number density. As the temperature rises, the number density of negative ions exhibits a more pronounced peak, with the highest peak observed at 552.35 K. This peak occurs around the radial coordinate of 0.54 cm for all temperatures, but its magnitude increases with temperature. This peak corresponds to the ionization region, where the strongest generation of negative ions occurs before they diffuse outward. Peak intensity increases with temperature and indicates the temperature sensitivity of the corona discharge. Increased temperatures of the conductors enhance ionization, influence the behavior of the corona discharge, and affirm the influence of temperature in ionization at elevated voltage.
In contrast, at higher temperatures, the increased energy allows more electrons to gain enough energy for ionization due to thermal agitation, resulting in a faster ionization process and a greater quantity of negative ions. The strong electric field and thermal energy cause these ions to spread over a larger area, forming a wider ionization zone. While the peak density near the conductor may be slightly lower, negative ions extend further outward. Figure 6 illustrates the variation of the reduced electric field in ( T d ) as a function of the radial distance from the conductor at different temperatures. The reduced electric field is the electric field strength ratio to the number density of neutral particles, it decreases sharply near the conductor and gradually stabilizes at lower values as the radial distance increases. The curves show a slight upward shift at higher temperatures, indicating that the reduced electric field increases as temperature rises. This behavior may be attributed to the thermal expansion of gas, which decreases the particle density and alters the field properties. The plot highlights the temperature-dependent nature of electric field distributions, which is essential for understanding corona discharge phenomena and ionization effects in high-temperature environments.
Figure 7, Figure 8, Figure 9 and Figure 10 display the electron density distribution at different conductor temperatures, positive and negative ions, and the reduced electric field.
Figure 7a–c present the electron density distribution around the conductor for different conductor temperatures and suggest how thermal effects can lead to the modification of the characteristics of corona discharge. The electron density increases near the conductor, reaching its peak value of about 3.98 × 10 17 electrons/m3 at 293 K, 7.56 × 10 17 electrons/m3 at 461.35, and 9.41 × 10 17 at 552.35 K. With the increase in temperature, the electron density distribution broadened due to a rise in thermal agitation and reduced air density with a view to increased electron dispersion. Therefore, expanding high-density regions at elevated temperatures implies improved electron mobility and a more expansive ionization zone. Figure 8a–c display the positive ions distribution. The results reveal a temperature dependence of positive ions and the ionization zone. At lower temperatures, the ion density is highly concentrated near the conductor surface, indicating a confined ionization region. As the temperature increases, the positive ion distribution becomes more diffused, with a broader ionization zone extending farther from the conductor. This diffusion can be attributed to the enhanced mobility of ions and reduced air density at elevated temperatures.
The spatial distribution of negative ions around the conductor at different temperatures is illustrated in Figure 9. At 293 K, the ion density is much more concentrated around the conductor, showing a more limited ionization zone. At the increased temperatures, from 293 K to 552.35 K, ion density distribution becomes broader and more diffuse, indicating increased ion mobility and a wider ionization region. This can be understood by considering that the air density is smaller at higher temperatures, and the air molecules’ kinetic energy is more significant, increasing the dispersal of negative ions.
Figure 10 shows the distribution of the reduced electric field around the conductor at different temperatures, which reflects the thermal effect on the dynamics of corona discharges. The reduced electric field has a maximum value of about 120 Td close to the conductor surface at 293 K, indicating strong ionization potential in this region. By raising the conductor temperature to 461.35 and 552.35 K, the values of the reduced electric field slightly rise to about 150 Td. The reason is that stronger electric fields are required to get similar ionization effects because of a reduction in the neutral particle density at higher conductor temperatures. Such an extended high-field region at an elevated temperature further confirms the increased energy loss in the gas, influencing the inception voltage and discharge characteristics. These observations point out the importance of reduced electric field parameters in corona discharge characteristics with thermal variations.
The results demonstrate the significant influence of conductor temperature on the ionization zone around conductors in corona discharge phenomena. As the temperature increases from 293 K to 552.35 K, the ionization region expands, with positive and negative ion densities becoming more diffuse. The reduced electric field shows a rise in peak values at higher temperatures, while the electric field gradient becomes less confined near the conductor due to reduced air density. Similarly, electron density distributions broaden with increasing conductor temperature, indicating enhanced electron mobility and wider ionization zones despite a consistent peak density. These findings highlight that elevated conductor temperatures promote greater particle mobility and broader ionization regions, impacting the intensity and inception of corona discharge.

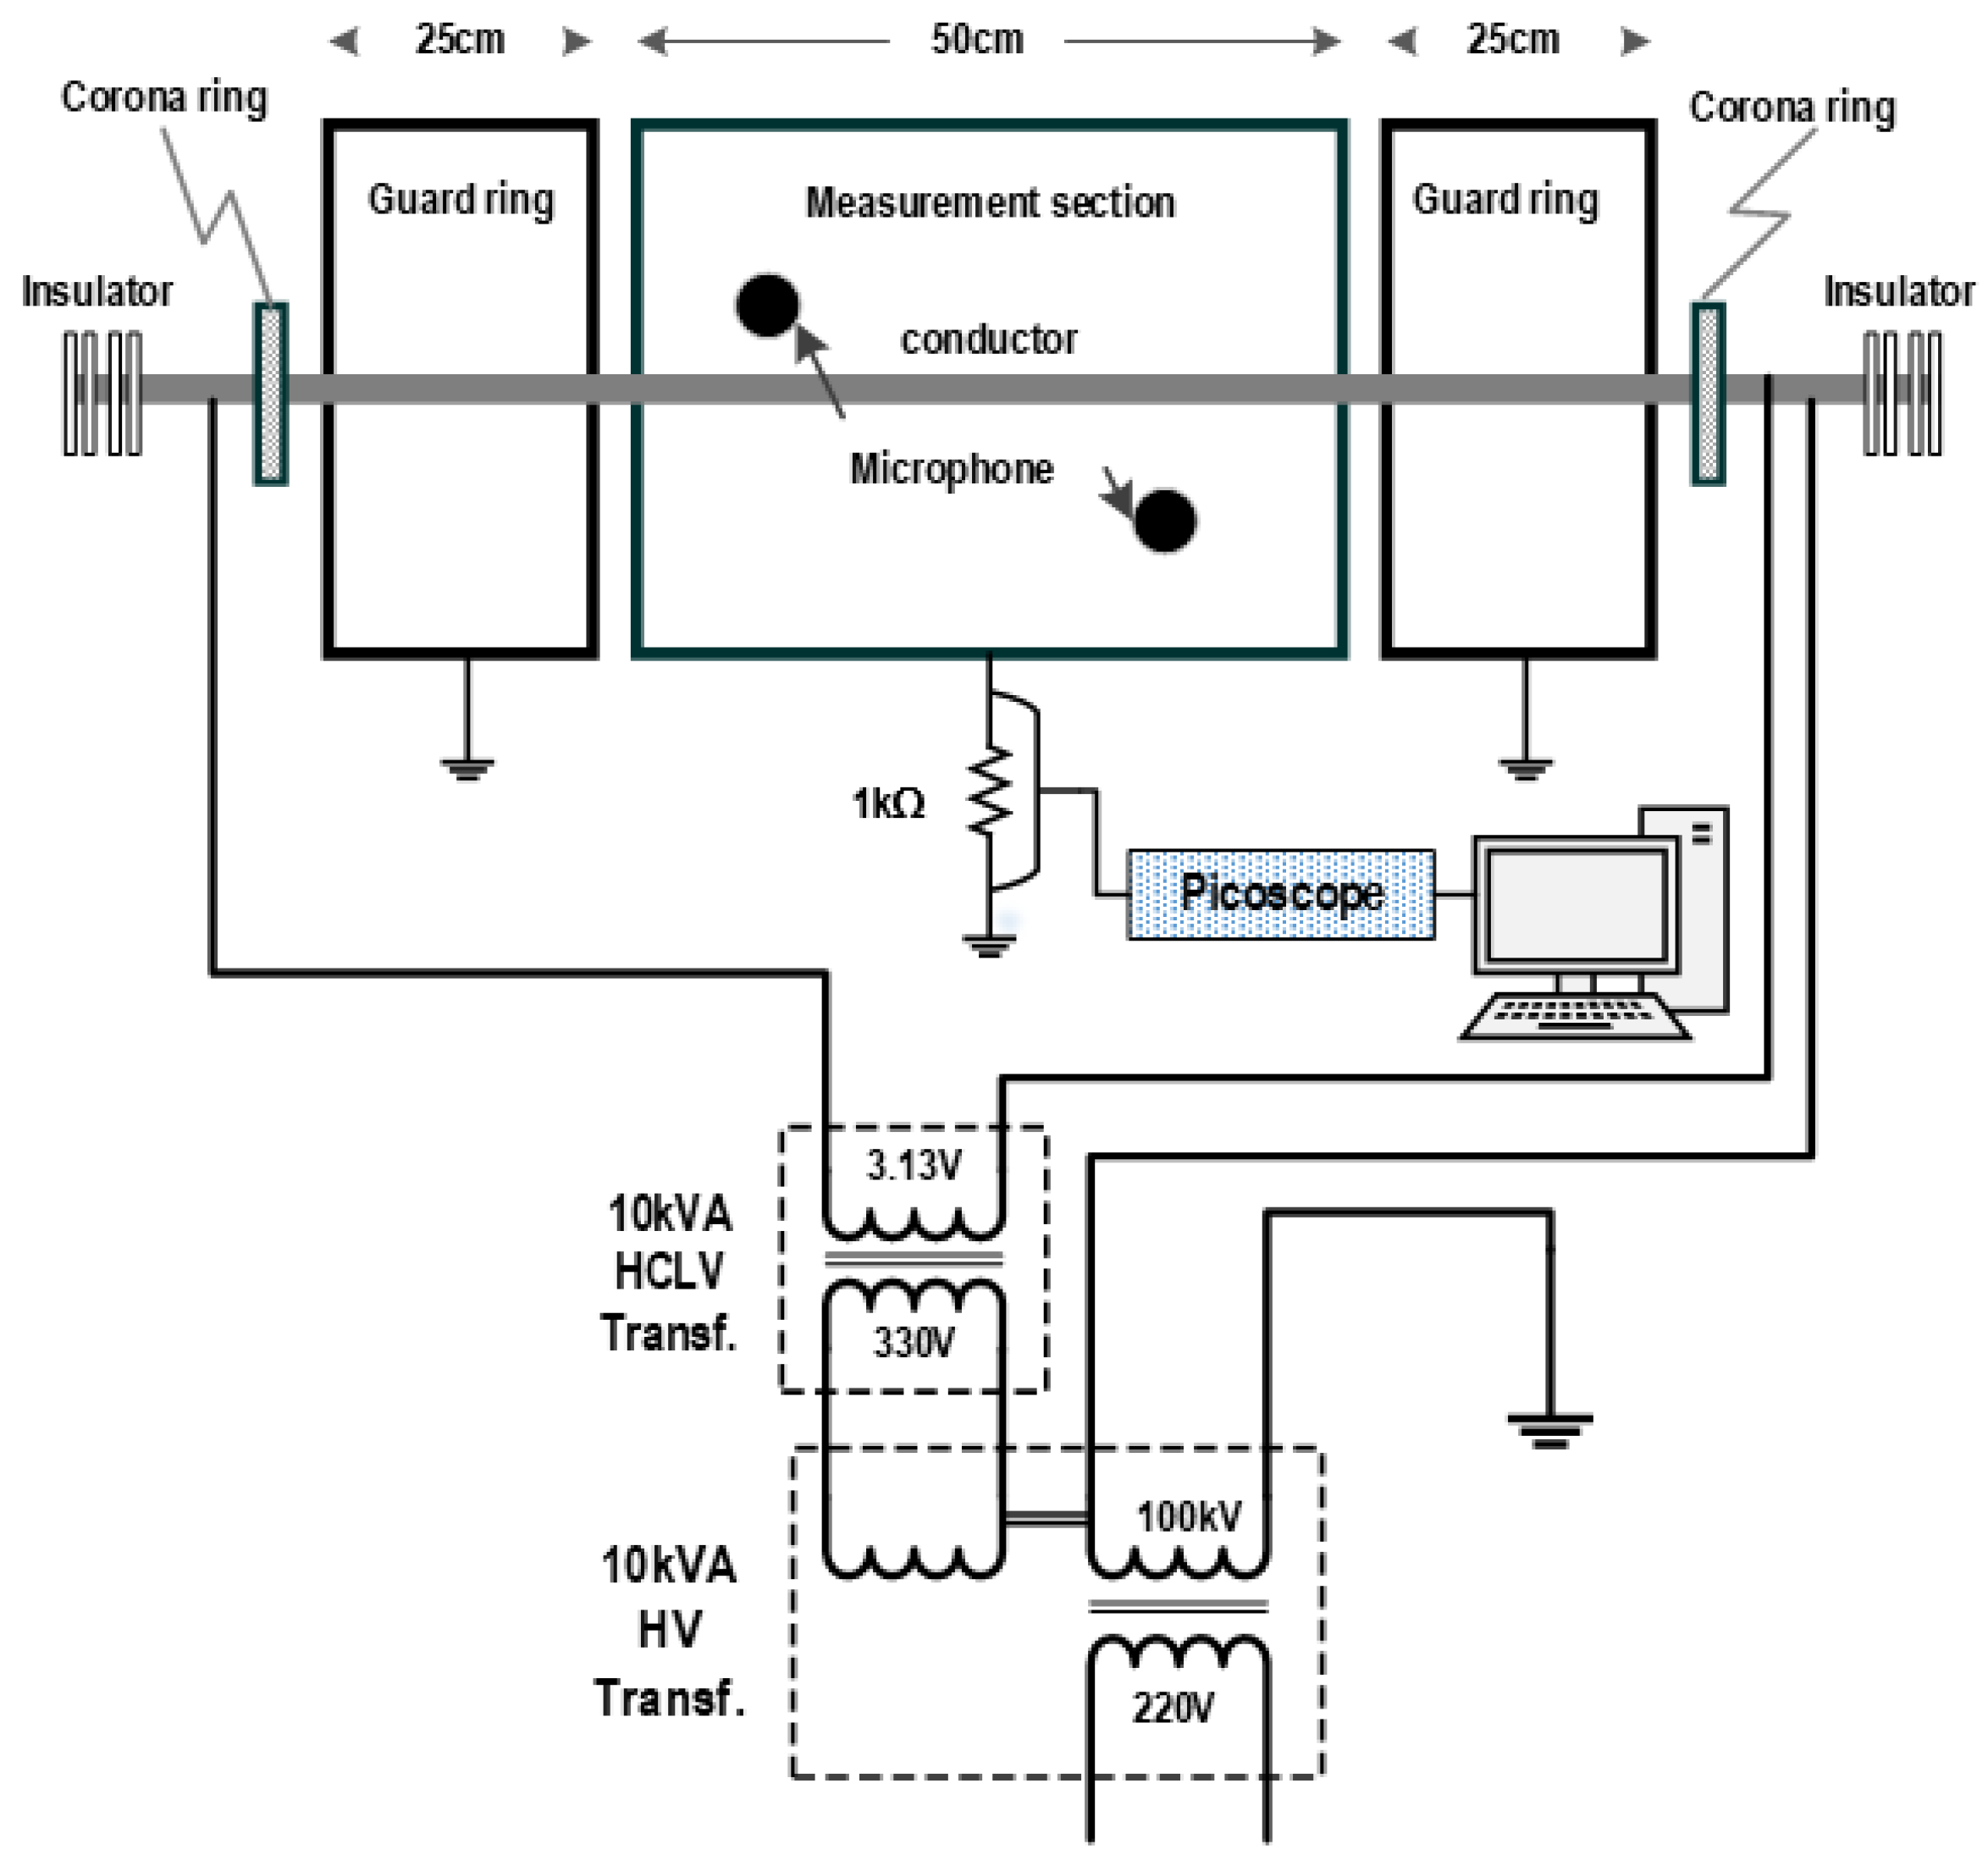
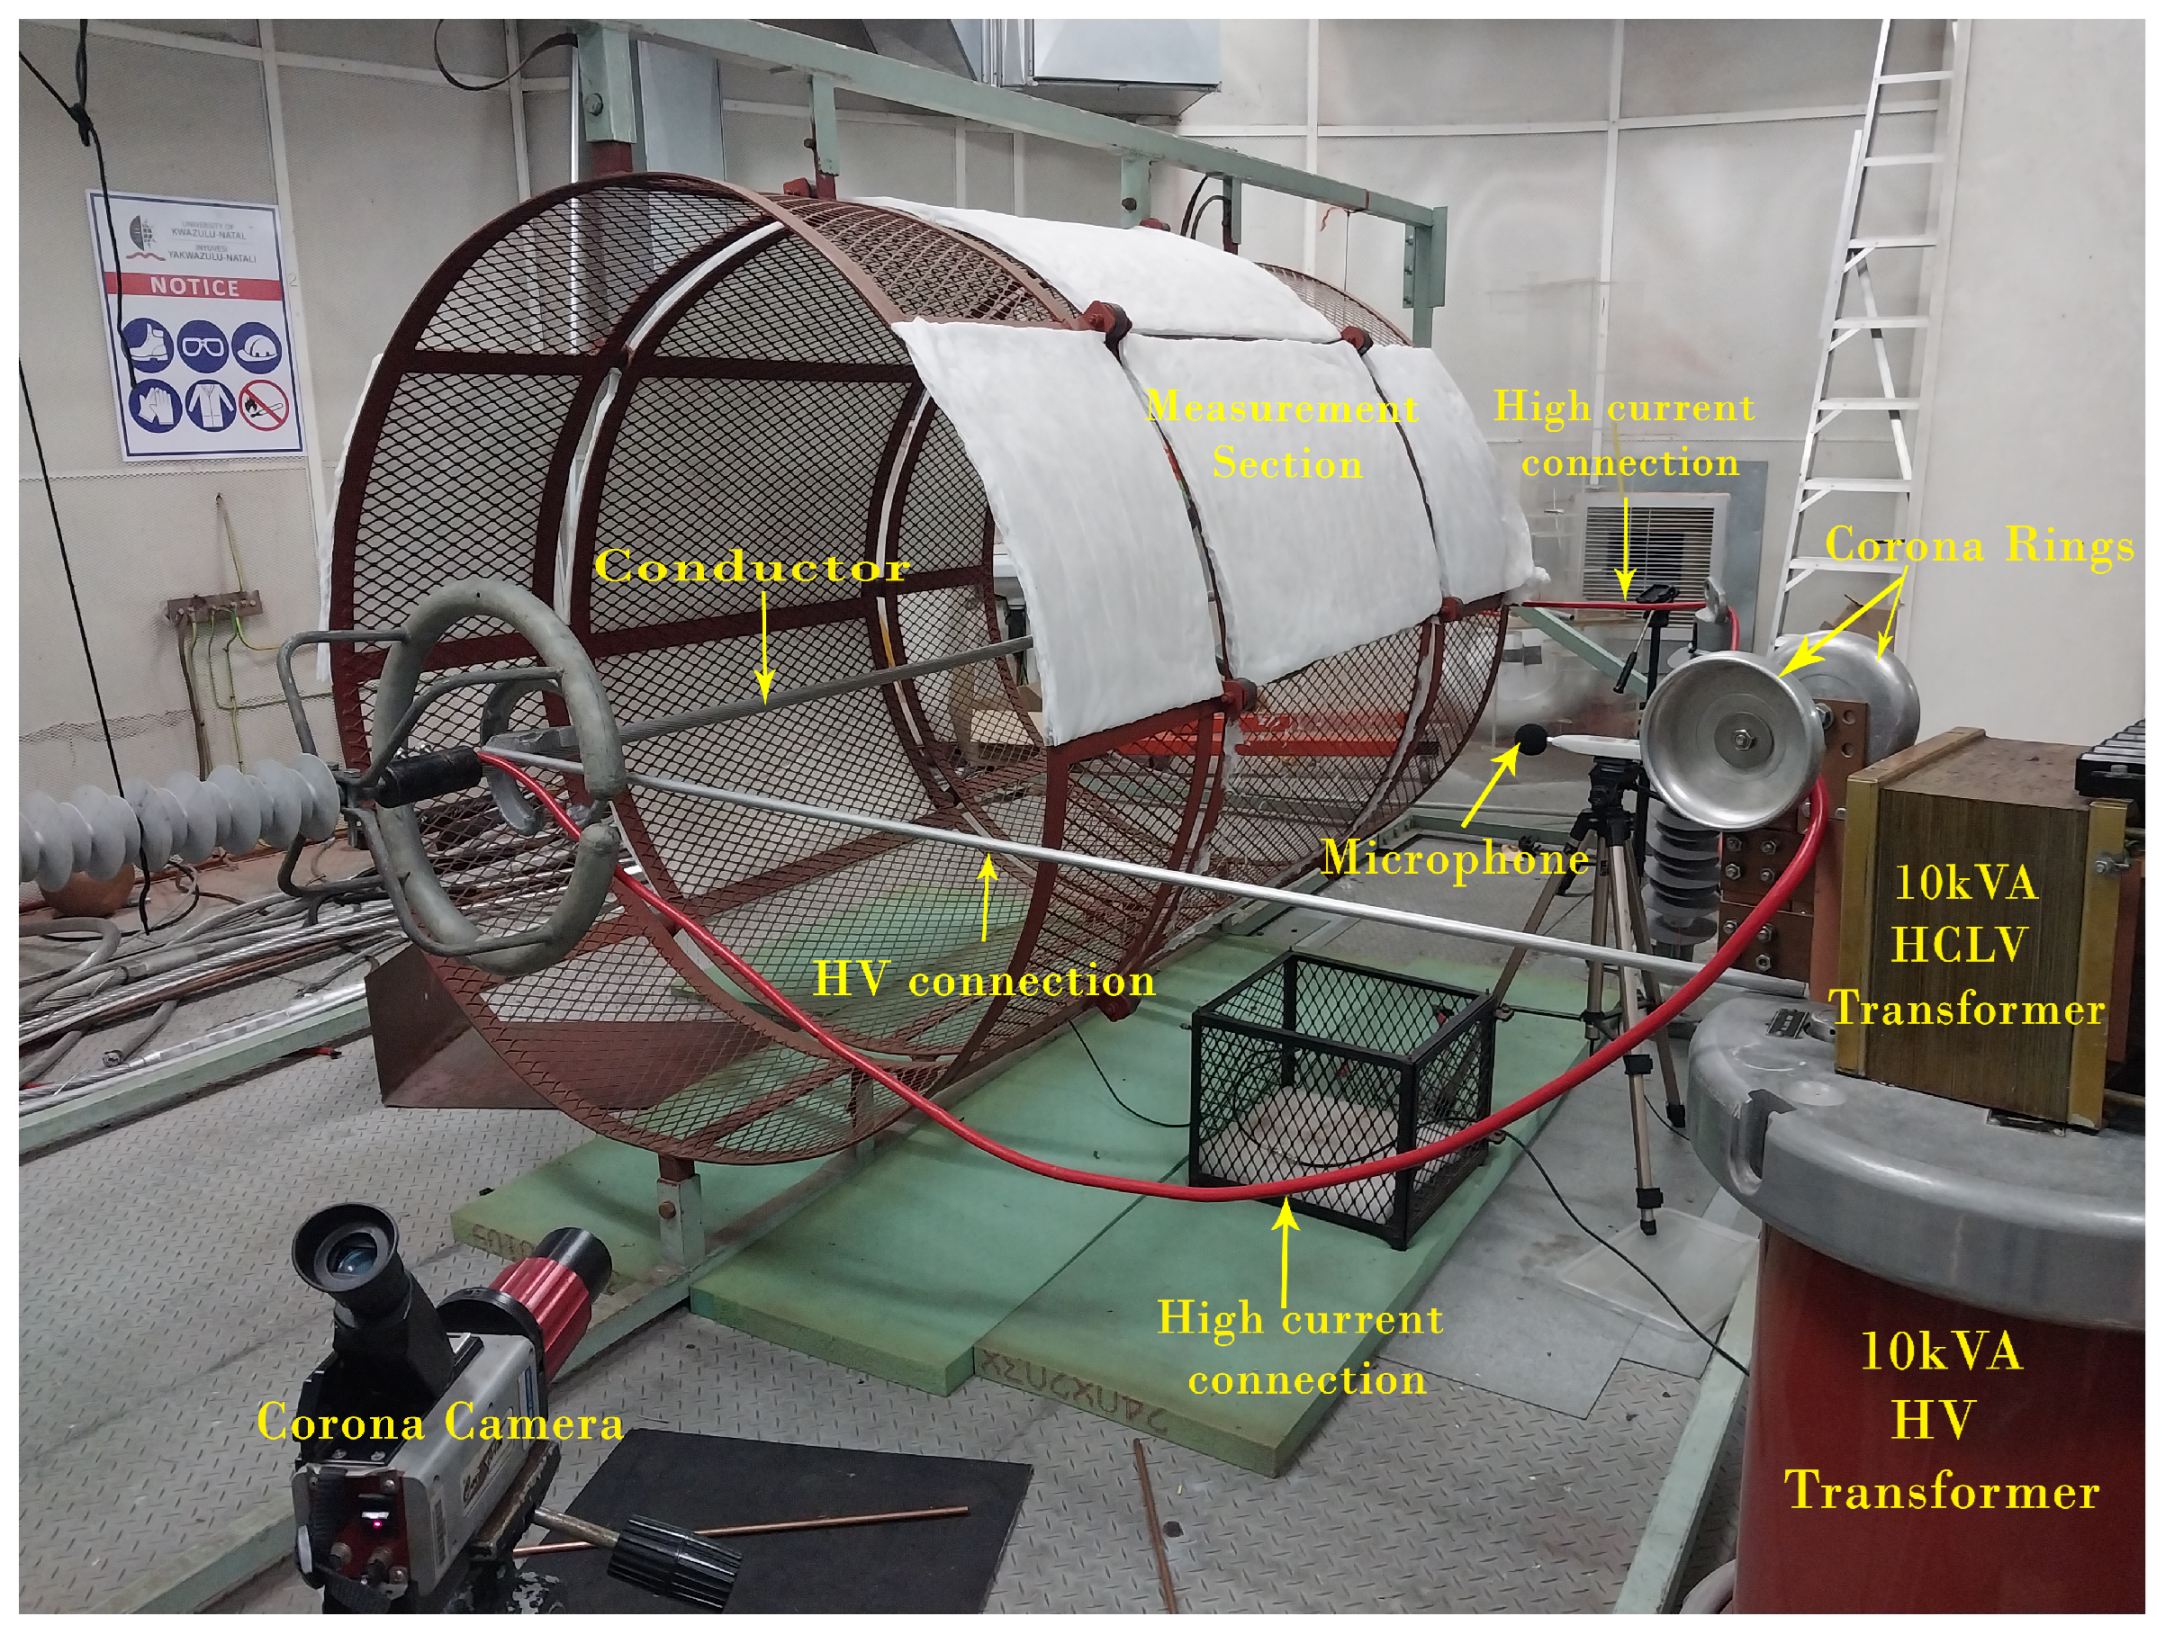
4. Experimental Measurement and Results

The experimental measurements were conducted in the High Voltage Direct Current (HVDC) Laboratory at the University of KwaZulu-Natal’s Westville Campus, located 160 m above sea level. The lab features an air conditioning system to maintain stable atmospheric conditions, with temperature kept between 23 °C and 25 °C, relative humidity at 55%, and air pressure at 1030 hPa. The primary equipment used included a high-voltage test transformer, a high-current low-voltage transformer, and a corona cage.
The experimental setup in this study was similar to that described in [21] regarding connections and procedure; however, this work utilized a corona cage of a different size. Figure 11 and Figure 12 show the schematic diagram and the photographic of the experimental arrangement. An indoor corona cage with a cylindrical outer surface of a diameter of 150 cm, with three sections comprising two guard sections, each 50 cm long, and a central section of 100 cm long. The two guard sections were solidly grounded to reduce electromagnetic interference from outside and connections.
The central section of the cage was connected through a 1 kΩ to a data acquisition system (DAQ) with a Picoscope (Pico Technology Ltd., St Neots, Cambridgeshire, UK) and high-speed computers for signal measurement. An aluminium alloy tube (250 cm long, 1 cm diameter, 0.1 cm wall thickness) was selected to optimize heat conduction under high current. A Corocam corona camera (UViRCO Technologies (Pty) Ltd., Pretoria, South Africa) was used to observe corona discharge.
Two electrical configurations were tested: one with only a high-voltage source connected to the conductor and another integrating both a high-voltage transformer and a high-current, low-voltage (HCLV) transformer. The HCLV transformer was linked to the secondary low-voltage winding of the high-voltage transformer, allowing simultaneous control of conductor temperature and applied voltage. The transformers were connected in cascade to ensure high-current isolation.
A 10 kVA high-voltage transformer (220 V primary, 200 kV secondary) and a 10 kVA HCLV transformer (primary: 220 V/330 V, secondary: 3.13 V, 3195 A) were used. The HCLV transformer was mounted on the high-voltage transformer and maintained at the same potential, with its primary winding energized through the HV transformer’s excitation winding in series with its high-voltage winding.
The procedure consisted of gradually increasing the primary voltage of the high-voltage transformer, starting at 45 V, equivalent to 20 kV. This value was chosen because a temperature change was observed at this voltage. The voltage was increased in steps of 10 V to ensure precise control throughout the process. The primary voltage of the high-voltage transformer was selected for its ease of control and because it matched the exact voltage applied to the primary side of the high current, low voltage transformer. In the second configuration, the conductor was connected to the HV transformer and the HCLV transformer for conductor heating purposes. The HCLV transformer offered two input voltage options: 220 V (connection 1) and 330 V (connection 2). These configurations were incorporated into the work to assess the conductor’s heating pattern. Through the input of a 220 V connection (Connection 1), a higher current was achieved at the same voltage as 330 V, resulting in rapid conductor heating at Connection 1. Our earlier study [21] explored how conductor temperature impacts inception voltage, presenting an experimental model. This paper focuses on examining how conductor temperature affects the corona VI characteristics. We defined corona inception voltage as the point where the Corocam first detected corona activity. To obtain more accurate measurements of corona currents, RMS values and corona pulse data were recorded with a Picoscope. Each experiment was repeated multiple times to enhance the accuracy of the results.
Table 1 presents the inception voltage, corresponding corona current, and audible noise values for various connection configurations. The experimental results indicate that the inception voltage is lowest at the highest temperature, observed in connection 1. However, the corresponding corona current is also the smallest, which can be attributed to the fact that corona current depends not only on temperature but is more significantly influenced by the applied voltage. Additionally, audible noise was unaffected by the corona onset voltage but was instead determined by the intensity of the corona discharge, as demonstrated in [21].

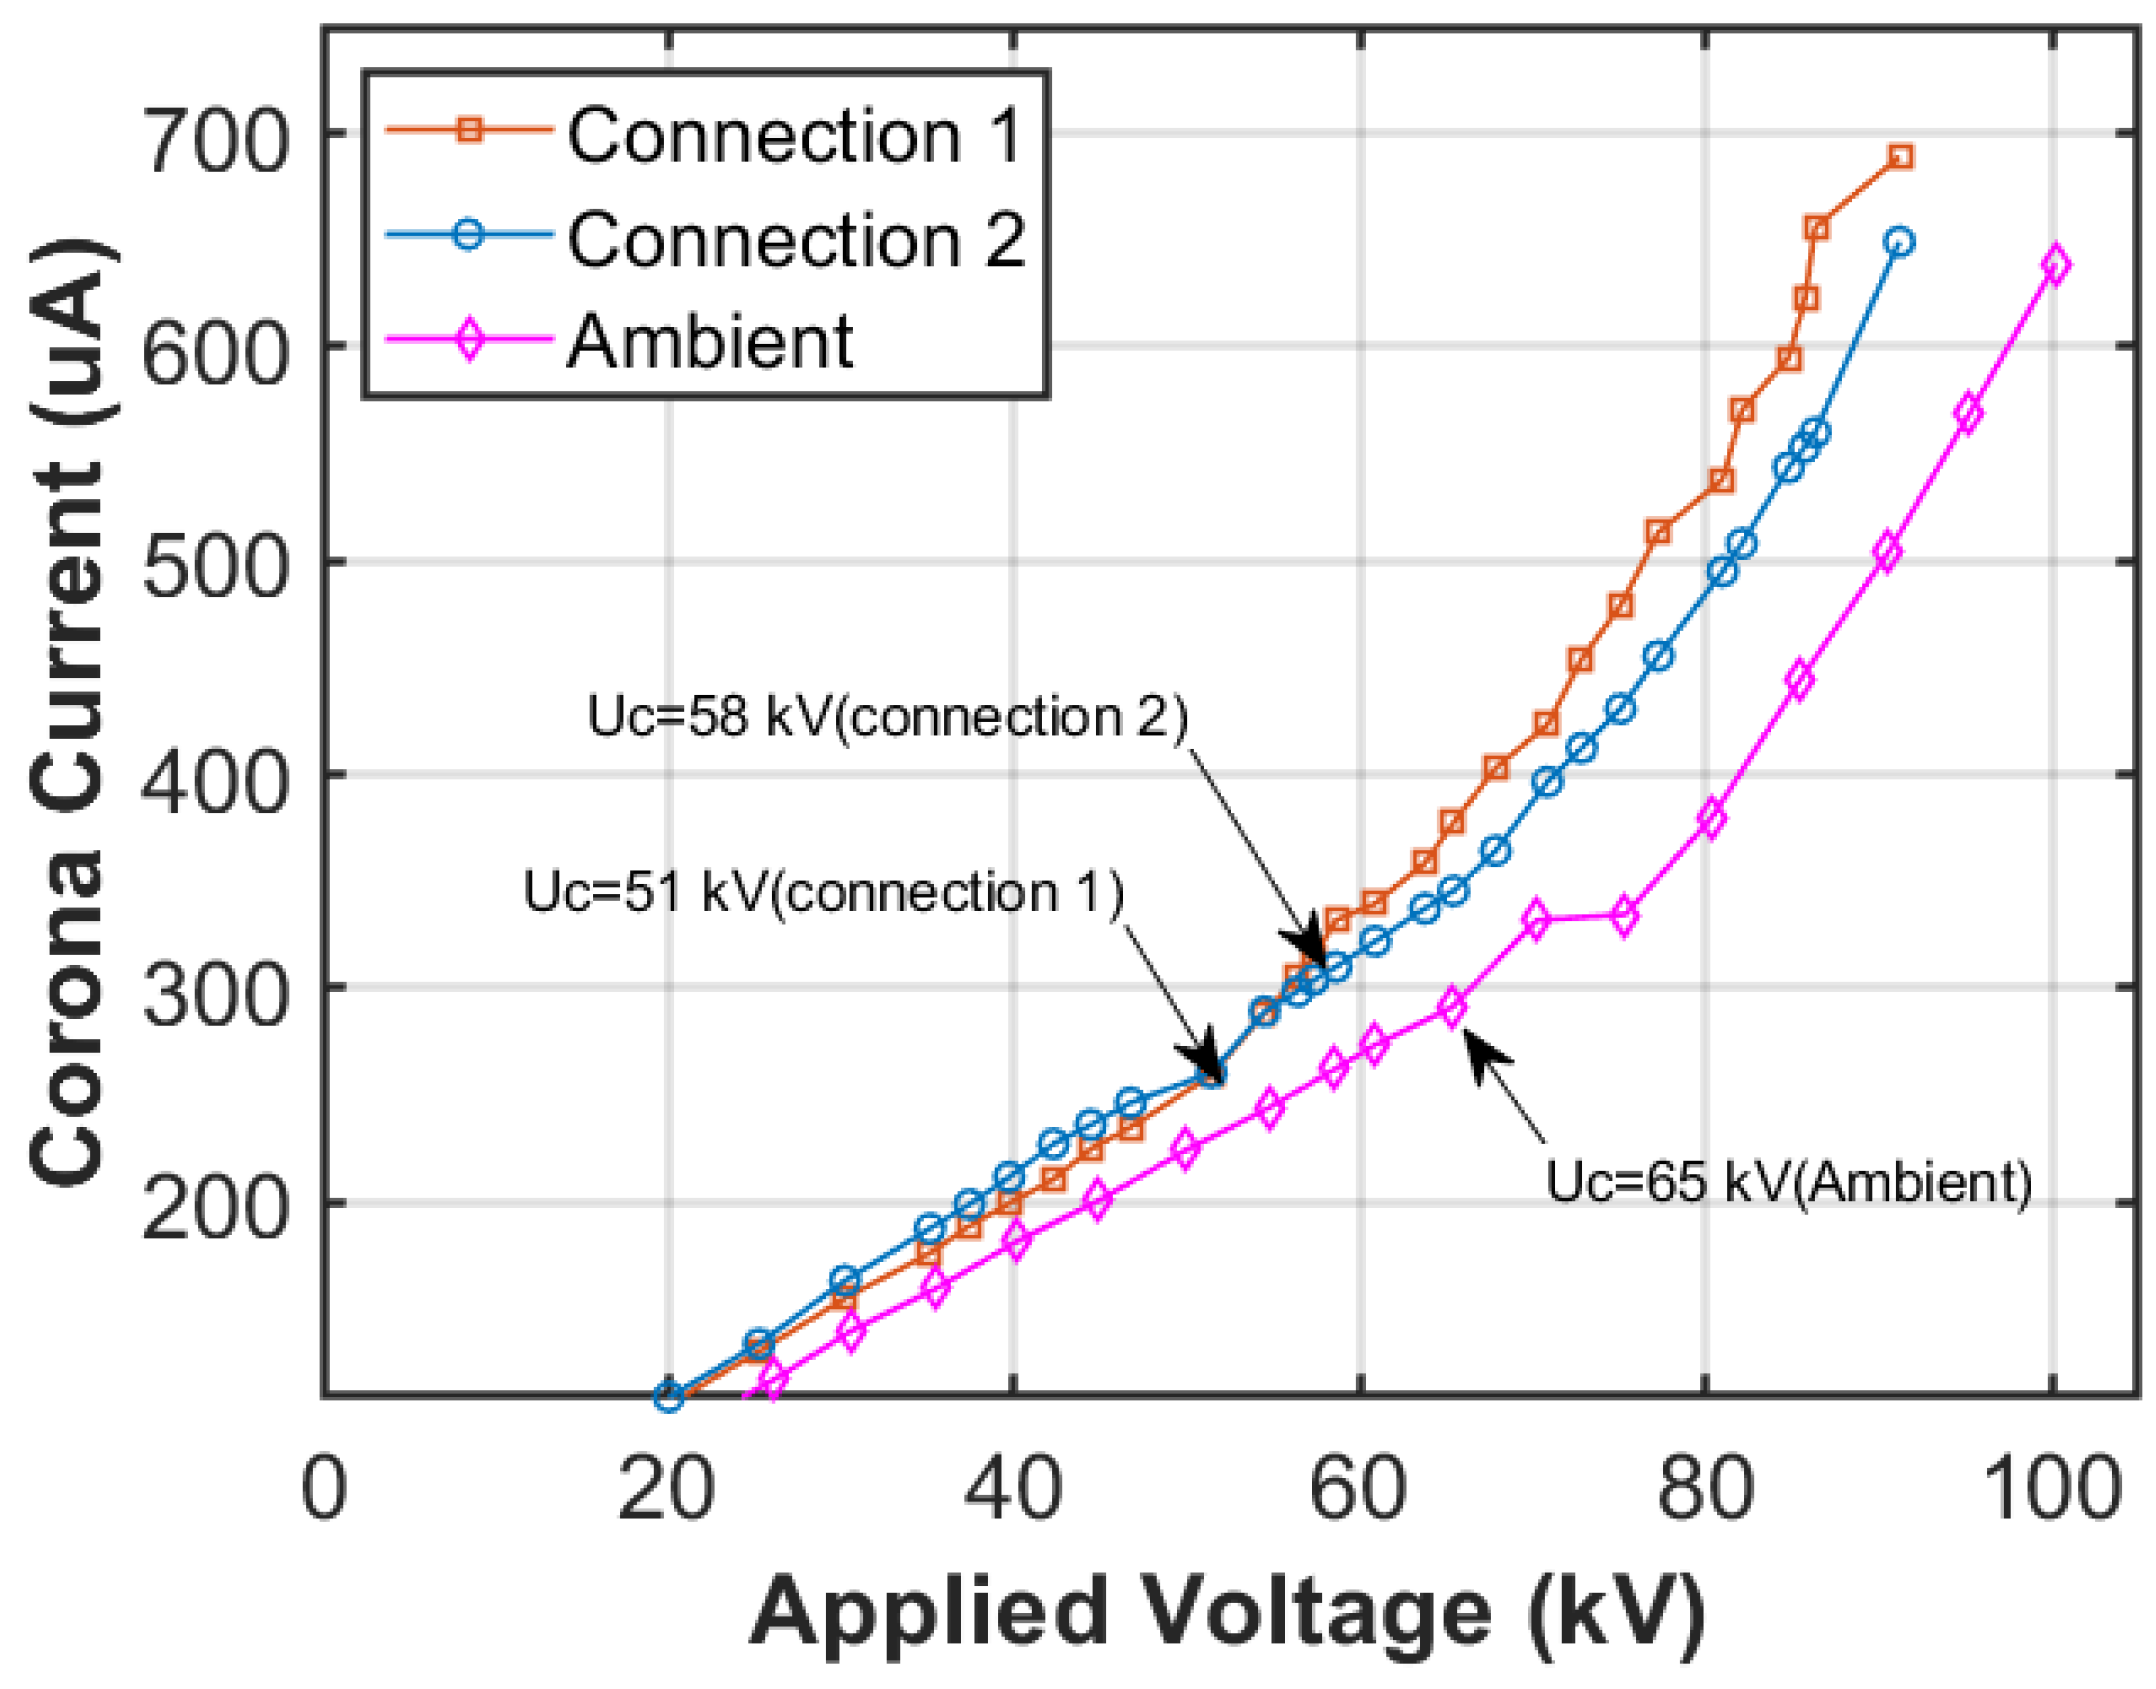
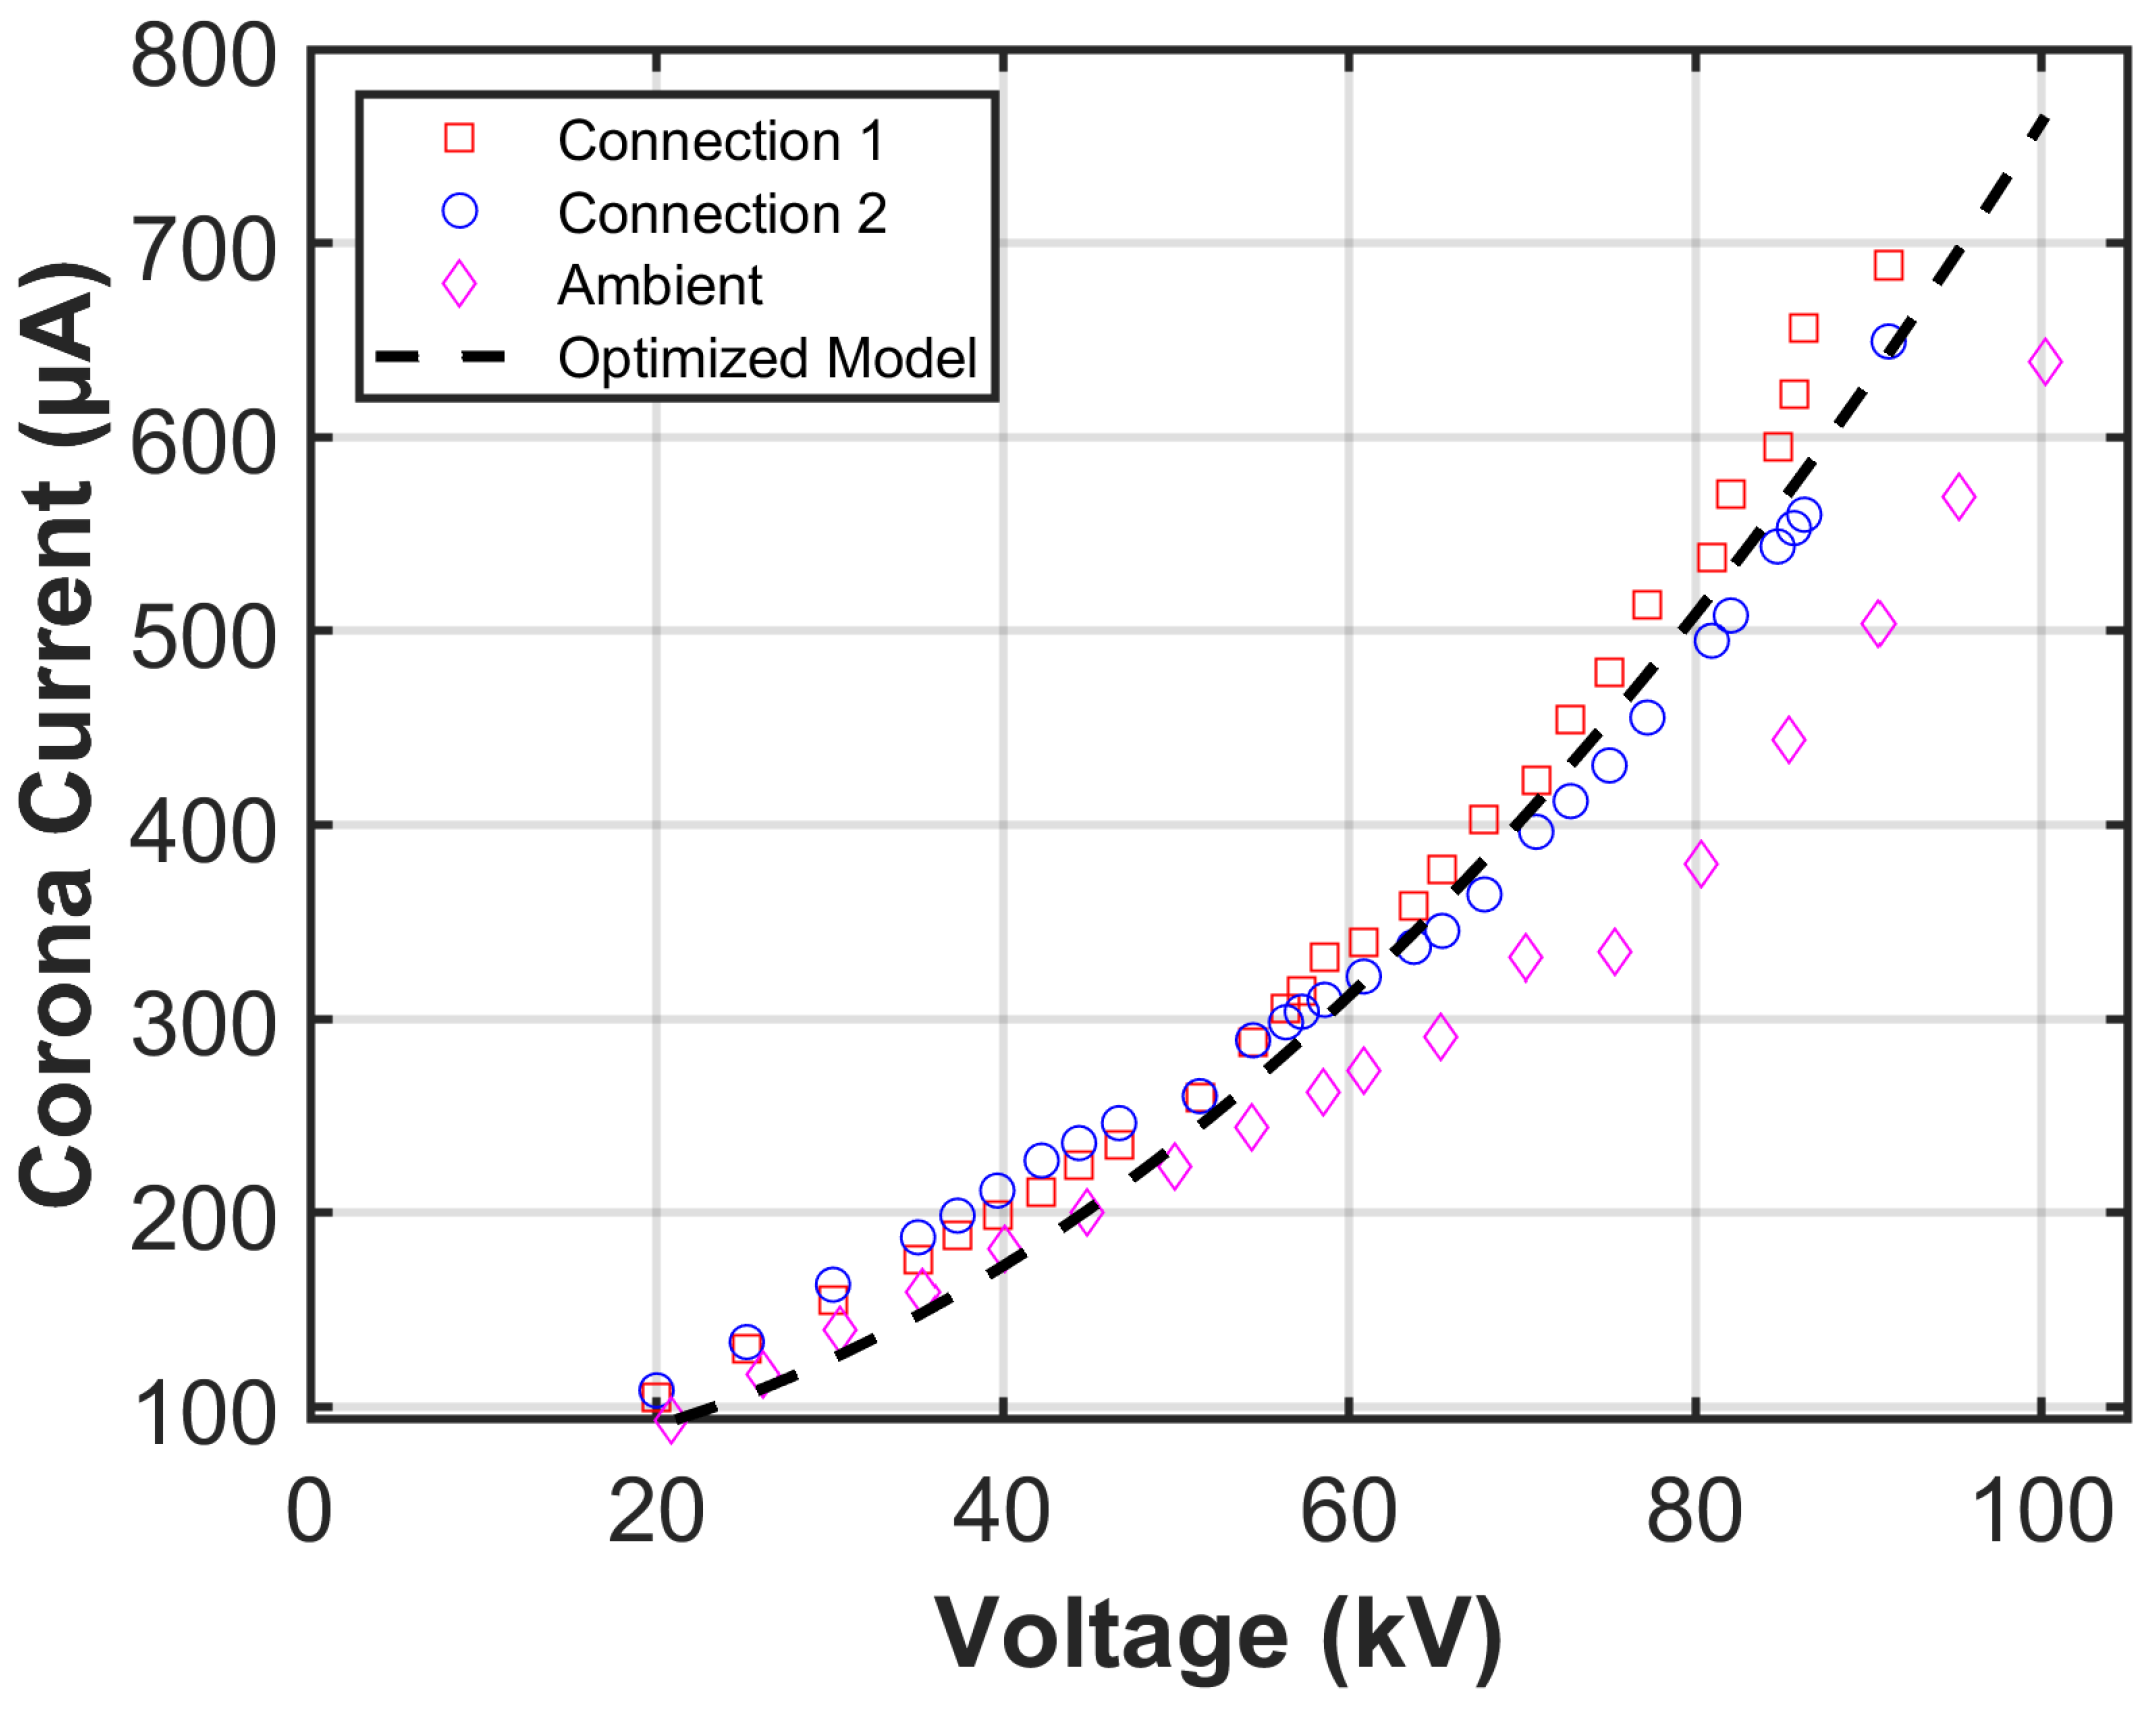
4.1. Experimental Results and Discussion

Figure 13 presents the experimental results showcasing the voltage–current characteristics under different conditions. The graph clearly illustrates the data from Connection 2, corresponding to measurements taken at the highest temperature values, exhibits a significantly increasing trend. This reveals a significant increase in current with voltage as the temperature rises.
This study uses experimental data to develop and validate a model that accurately describes the corona VI characteristics of conductors operating at elevated temperatures and the relationships of corona parameters, including the dimensional constant and the corona inception voltage U c , at different temperatures. The analysis incorporates fitting methods in conjunction with the general relationships of Townsend, including Equations (4) and (6), and others related to the Townsend ionization coefficient.
Prior research has demonstrated that parameters such as A v i or K v i , from (4) and (6), can be effectively determined through statistical estimation techniques to address the challenges of fitting VI characteristic curves [40,41], while the parameter U i n c is calculated using Peek’s formula as follows (24):
U i n c = E i n c × r c × ln R r c
The modified Peek formula in (8) was used to compute the inception field used in (24) for connections 1 and 2 as conductor temperature is involved. In contrast, Equation (1) was applied for ambient conditions. In our approach, instead of relying on parameters such as A v i or K v i , the first Townsend coefficient has been introduced to incorporate the effect of ionization as affected by conductor temperature. The Townsend equation from (10) was refined to explicitly incorporate the influence of temperature and conductor surface conditions to extend the model further. At constant pressure, the Townsend ionization coefficient was adjusted as follows:
α ( T , m ) = A α × e B α ( T , m ) / E
where:
A α ( T , m ) = A 0 1 + m T r i T 0 B α ( T , m ) = B 0 1 + m T r i T 0
where A 0 and B 0 are Townsend’s original constants for air with the value of 1 × 10 6 and 3 × 10 6 , respectively, T 0 is a reference temperature equal to 293 K, and T r i is the temperature defined in (7).
The Townsend model is a key framework for understanding corona discharges, detailing the ionization process in gases subjected to an electric field. However, its basic formulation may fall short in addressing the complexities of real-world situations, especially when considering factors such as conductor temperature and conductor surface conditions. To improve the model’s accuracy, we propose combining the Townsend model with a polynomial fit model, as shown in Equation (28). The model was implemented by fitting a polynomial to the experimental voltage–current data. This combined model aims to better represent the voltage–current relationship seen in experimental data.
I ( U ) = e α × U U i n c + P ( U )
where P ( U ) is the is the second-order polynomial given as follows:
P ( U ) = U ( c 2 U + c 1 ) + c 0
A least square optimization method was used to calculate the polynomial coefficients c 2 , c 1 , and c 0 . The polynomial coefficients were averaged across the datasets to derive a generalized model incorporating conductor temperature effects.
Figure 14 compares the optimized model and the experimental data. The model, derived from regression analysis, accurately captures the experimental results, indicating that Equation (28) effectively represents corona discharge’s voltage–current characteristics under high conductor temperature conditions.
This strong alignment between the model and the experimental data confirms the validity of Equation (28) in describing the corona behavior under these conditions. However, a slight discrepancy exists between the fit and experimental data obtained under ambient conditions. This difference shows that the model is particularly designed to show the behavior of the corona discharge for high conductor temperatures rather than for ambient conditions. This indicates that the model correlates well with high-temperature data but less with ambient temperature results, demonstrating its relevance to high conductor temperature scenarios. This observation additionally supports the accurate modeling of VI corona discharge characteristics.
The model was evaluated using standard statistical metrics like the root mean square error (RMSE) and the coefficient of determination R 2 . The statistical metrics and fitted polynomial coefficients are presented in Table 2.
The low value of the RMSE and the R 2 close to 1 show the model’s performance across the overall datasets, including the ambient condition. Together, these metrics confirm that the model fits the data well.
Additional experiments were conducted using different conductors inside the same corona cage to validate the proposed model. A second cage, with a smaller diameter of 25 cm, was used to test copper tubes of varying radii under the same experimental setup. The selection of copper was justified by its superior heating capacity compared to aluminum. The corona current was measured in both cages, and the experimental results were analyzed. The model proposed in (27) was then applied to all the data collected and compared with the experimental observations for validation.

4.1.1. Results of Copper Tubes in the 75 cm Corona Cage

For the experiments, we used three solid copper tubes with radii measuring 0.635 cm, 0.475, and 0.317 cm, respectively. The experimental results against the optimized model are displayed in Figure 15, Figure 16 and Figure 17.
The results from the additional experiment with copper demonstrate a strong correlation with the previous findings, confirming the model’s validity for other datasets. However, consistent with earlier observations, discrepancies remain between the ambient measurements and the predictions of the developed model.

4.1.2. Results of Copper Tubes in the 25 cm Corona Cage

Figure 18, Figure 19 and Figure 20 illustrate the experimental results obtained from tests conducted in a 25 cm corona cage using conductors with different diameters. These results highlight the performance and behavior of the conductors under elevated temperature conditions. Importantly, the data confirm that the developed model maintains its validity across varying geometric configurations, even when the conductor temperature is significantly increased. This demonstrates the robustness and adaptability of the model in predicting outcomes under diverse experimental setups.
The developed temperature model and the validated VI characteristic model provide valuable tools for predicting corona discharge behavior under different conductor temperatures. This can aid in optimizing conductor selection when corona discharge is due, particularly in modern grid demands and the increasing adoption of high-temperature low-sag (HTLS) conductors. By establishing a clear relationship between conductor temperature and corona discharge characteristics, this research provides important insights for optimizing transmission line performance in environments with prominent thermal effects.

5. Conclusions

This paper provides a comprehensive analysis of the influence of conductor temperature on corona discharge using a combination of experimental investigations and simulation modeling with COMSOL Multiphysics. The authors developed a temperature model to evaluate conductor temperature along the radial coordinate of the corona cage. Simulation results demonstrated a significant impact of temperature on electron density, positive and negative ion density, and electron temperature. As the temperature increased from 293 K to 552.35 K, the electron number density and positive ion density rose from 4 × 10 17 to 9 × 10 17 , representing an increase of approximately 136%. However, negative ion density showed a different trend, increasing near the conductor before saturating as the radial distance increased. Additionally, the reduced electric field and electron temperature exhibited 88.2% and 33% increases, respectively, over the same temperature range.
Laboratory experiments were conducted to investigate the relationship between voltage–current (VI) characteristics and conductor temperature. The results revealed that conductor temperature significantly influences corona discharge behavior, with the corona current increasing as conductor temperature rises. A new mathematical model was successfully developed to compute VI characteristics under varying conductor temperatures. This model combines the Townsend equation for VI characteristics, a modified Townsend ionization coefficient, and a polynomial fitting approach.
The model was validated using experimental data from different test scenarios and demonstrated strong accuracy and reliability. The simulation results, experimental findings, and the developed model collectively enhance our understanding of the microprocesses involved in corona discharge and the impact of conductor temperature on VI characteristics.
These insights are particularly valuable for improving the design and operation of high-voltage transmission lines, especially in systems using high-temperature low-sag (HTLS) conductors.
Future research should investigate the corona performance of various HTLS conductors (e.g., ACCC, ACSS, etc.):
  • To identify the most suitable materials for high-temperature operation with minimal corona-induced power losses.
  • To introduce new considerations in bundle configuration optimization of HTLS conductors as they are designed to operate at elevated temperatures. Since corona discharge depends highly on conductor surface conditions and temperature, studying how different bundle arrangements influence corona activity at high temperatures is critical for efficient transmission line design.
  • To develop temperature-dependent transmission line design guidelines for corona discharge effects and electromagnetic interference (EMI).
  • To investigate and develop computational models on the impact of elevated temperatures on radio interference (RI) and Audible Noise (NA).

Author Contributions

Methodology, K.G.I.; Validation, A.G.S. and R.S.; Formal analysis, K.G.I.; Writing—original draft, K.G.I.; Writing—review & editing, A.G.S., N.I. and R.S.; Supervision, A.G.S. and N.I. All authors have read and agreed to the published version of the manuscript.

Funding

This research received no external funding.

Data Availability Statement

The data of the current research can be provided on request to the corresponding author. The data are not presently in the public domain, as they are part of ongoing doctoral research work. In our efforts to maintain the research work intact and institution requirements met, the data can be provided only upon successful completion of the PhD work.

Acknowledgments

The authors wish to extend heartfelt appreciation to the Centre for Power and Energy Systems for their unwavering support and resources, which significantly influenced the completion of this research article.

Conflicts of Interest

The authors declare no conflicts of interest.

References

  1. Nawi, Z.M.; Ab Kadir, M.; Azis, N.; Ahmad, W.W.; Rawi, I.M.; Amirulddin, U.U.; Nordin, F. Comparative analysis of ACSR and ACCC conductors on corona effect for lightning surge studies. In Proceedings of the 2019 11th Asia-Pacific International Conference on Lightning (APL), Hong Kong, China, 12–14 June 2019; pp. 1–5. [Google Scholar]
  2. Baumann, R.; Novak, P. Efficient computation and experimental validation of ACSR overhead line conductors under tension and bending. CIGRE Sci. Eng. 2017, 9, 5–16. [Google Scholar]
  3. Kubelwa, Y.; Loubser, R.; Moodley, P. Experimental investigations of bending stresses of ACSR conductors due to aeolian vibrations. CIGRE Sci. Eng. 2017, 9, 17–26. [Google Scholar]
  4. Riba, J.R.; Bogarra, S.; Gómez-Pau, Á.; Moreno-Eguilaz, M. Uprating of transmission lines by means of HTLS conductors for a sustainable growth: Challenges, opportunities, and research needs. Renew. Sustain. Energy Rev. 2020, 134, 110334. [Google Scholar] [CrossRef]
  5. Mitra, G. Investigations on high temperature low sag (HTLS) conductors. IEEE Trans. Power Deliv. 2019, 35, 1716–1724. [Google Scholar]
  6. Stengel, D.; Bardl, R.; Kühnel, C.; Großmannn, S.; Kiewitt, W. Accelerated electrical and mechanical ageing tests of high temperature low sag (HTLS) conductors. In Proceedings of the 2017 12th International Conference on Live Maintenance (ICOLIM), Strasbourg, France, 26–28 April 2017; pp. 1–6. [Google Scholar]
  7. Vermeulen, G.R.H.; Reid, G. Effects of conductor temperature on corona inception. In Proceedings of the 2014 49th International Universities Power Engineering Conference, Cluj-Napoca, Romania, 2–5 September 2014. [Google Scholar]
  8. Bologa, A.; Paur, H.; Seifert, H.; Woletz, K. Influence of gas composition, temperature and pressure on corona discharge characteristics. Int. J. Plasma Environ. Sci. Technol. 2011, 5, 110–116. [Google Scholar]
  9. Xue, W.; Huang, S.; Mao, J.; Yan, X.; Song, C.; Liu, Y. Experimental and theoretical study on the influence of bundle number on corona loss characteristics of ultra high voltage corona cage positive/negative DC conductors at high altitude. Electr. Power Syst. Res. 2024, 232, 110370. [Google Scholar] [CrossRef]
  10. Javadi, H.; Farzaneh, M. Measuring of corona discharge inception voltage to determine electric field over the non-homogenous electrodes in the air insulation. In Proceedings of the 19th International Power System Conference, Tehran, Iran, 22 November 2004. [Google Scholar]
  11. Xu, P.; Zhang, B.; He, J.; Chen, S. Influence of humidity on the characteristics of negative corona discharge in air. Phys. Plasmas 2015, 22, 093514. [Google Scholar] [CrossRef]
  12. Xu, P.; Zhang, B.; Chen, S.; He, J. Influence of humidity on the characteristics of positive corona discharge in air. Phys. Plasmas 2016, 23, 063511. [Google Scholar] [CrossRef]
  13. Feng, N.; Ma, T.; Chen, C.; Yao, B.; Gao, W. Simulation and study of DC corona discharge characteristics of bar-plate gap. Energies 2022, 15, 6431. [Google Scholar] [CrossRef]
  14. Liang, H.; Du, B.; Li, J.; Du, Q. Numerical simulation on the surface charge accumulation process of epoxy insulator under needle-plane corona discharge in air. IET Sci. Meas. Technol. 2018, 12, 9–16. [Google Scholar] [CrossRef]
  15. Liu, K.L.; Liao, R.J.; Zhao, X.T. Numerical simulation of the characteristics of electrons in bar-plate DC negative corona discharge based on a plasma chemical model. J. Electr. Eng. Technol. 2015, 10, 1804–1814. [Google Scholar] [CrossRef]
  16. Durbin, P.; Turyn, L. Analysis of the positive DC corona between coaxial cylinders. J. Phys. D Appl. Phys. 1987, 20, 1490. [Google Scholar] [CrossRef]
  17. Stearns, R.G. The positive corona in air: A simplified analytic approach. J. Appl. Phys. 1989, 66, 2899–2913. [Google Scholar] [CrossRef]
  18. Monrolin, N.; Praud, O.; Plouraboué, F. Revisiting the positive DC corona discharge theory: Beyond Peek’s and Townsend’s law. Phys. Plasmas 2018, 25, 063503. [Google Scholar] [CrossRef]
  19. Allen, N.; Abdel-Salam, M.; Cotton, I. Effects of temperature and pressure change on positive corona and sparkover under direct voltage in short airgaps. IET Sci. Meas. Technol. 2007, 1, 210–215. [Google Scholar] [CrossRef]
  20. Allen, N.; Kong, J. Positive corona inception in air at elevated temperatures. IEE Proc. Sci. Meas. Technol. 2006, 153, 31–38. [Google Scholar] [CrossRef]
  21. Ilunga, K.G.; Swanson, A.G.; Ijumba, N.; Stephen, R. Experimental Investigation of the Effect of Conductor Temperature on Corona Performance in Overhead Transmission Lines. IEEE Access 2024, 12, 122114–122125. [Google Scholar] [CrossRef]
  22. Kulumbaev, E.; Lelevkin, V.; Niyazaliev, I.; Tokarev, A. Characteristics of a corona discharge with a hot corona electrode. Plasma Phys. Rep. 2011, 37, 707–714. [Google Scholar] [CrossRef]
  23. Awad, M.; Castle, G. Ozone generation in an electrostatic precipitator with a heated corona wire. J. Air Pollut. Control. Assoc. 1975, 25, 369–374. [Google Scholar] [CrossRef]
  24. Holtzhausen, J.; Pieterse, P.; Vermeulen, H. Investigation of the effect of conductor temperature on AC power line corona. In Proceedings of the 2010 International Conference on High Voltage Engineering and Application, New Orleans, LA, USA, 11–14 October 2010; pp. 96–99. [Google Scholar]
  25. Pieterse, P. Corona measurement in an inverted coaxial geometry to evaluate the effect of conductor temperature. In Proceedings of the 23rd Southern African Universities Power Engineering Conference, Johannesburg, South Africa, 28–30 January 2015. [Google Scholar]
  26. Awad, M.; Castle, G. Breakdown streamers in coronas with heated discharge electrode. In Proceedings of the 1976 IEEE International Conference on Electrical Insulation, Montreal, QC, Canada, 14–16 June 1977; pp. 234–236. [Google Scholar]
  27. Chartier, V.; Stearns, R. Examination of Grizzly Mountain database to determine effects of relative air density and conductor temperature on HVDC corona phenomena. IEEE Trans. Power Deliv. 1990, 5, 1575–1582. [Google Scholar] [CrossRef]
  28. Bousiou, E.I.; Mikropoulos, P.N.; Zagkanas, V.N. Corona Activity on Single-circuit Overhead Transmission Lines under Variable Altitude. In Proceedings of the 2023 IEEE International Conference on Environment and Electrical Engineering and 2023 IEEE Industrial and Commercial Power Systems Europe (EEEIC/I&CPS Europe), Madrid, Spain, 6–9 June 2023; pp. 1–5. [Google Scholar]
  29. Chartier, V.; Stearns, R.; Burns, A. Electrical environment of the uprated pacific NW/SW HVDC intertie. IEEE Trans. Power Deliv. 1989, 4, 1305–1317. [Google Scholar] [CrossRef]
  30. Maskell, B. The Effect of Humidity on a Corona Discharge in Air; Technical Report; Royal Aircraft Establishment: Farnborough, UK, 1970. [Google Scholar]
  31. Hu, Q.; Shu, L.; Jiang, X.; Sun, C.; Zhang, S.; Shang, Y. Effects of air pressure and humidity on the corona onset voltage of bundle conductors. IET Gener. Transm. Distrib. 2011, 5, 621–629. [Google Scholar] [CrossRef]
  32. Chen, S.; Li, K.; Wang, F.; Sun, Q.; Zhong, L. Effect of humidity and air pressure on the discharge modes transition characteristics of negative DC corona. IET Sci. Meas. Technol. 2019, 13, 1212–1218. [Google Scholar] [CrossRef]
  33. Chen, Q.; Fang, M.; Cen, J.; Liu, J. Characteristics of negative DC discharge in a wire–cylinder configuration under coal pyrolysis gas components at high temperatures. RSC Adv. 2018, 8, 22737–22747. [Google Scholar] [CrossRef]
  34. Aleksandrov, N.; Bazelyan, E. Ionization processes in spark discharge plasmas. Plasma Sources Sci. Technol. 1999, 8, 285. [Google Scholar] [CrossRef]
  35. Ashraf, Y. Assessment of the Ionization Region in the Positive DC Coronas. Int. J. Plasma Environ. Sci. Technol. 2008, 2, 82–88. [Google Scholar]
  36. Yehia, A.; Mizuno, A.; Takashima, K. On the characteristics of the corona discharge in a wire-duct reactor. J. Phys. D Appl. Phys. 2000, 33, 2807. [Google Scholar] [CrossRef]
  37. Urban, R.G.; Reader, H.C.; Holtzhausen, J.P. Small corona cage for wideband HVac radio noise studies: Rationale and critical design. IEEE Trans. Power Deliv. 2008, 23, 1150–1157. [Google Scholar] [CrossRef]
  38. Kuffel, J.; Kuffel, P. High Voltage Engineering Fundamentals; Butterworth-Heinemann: Oxford, UK, 2000. [Google Scholar]
  39. Liu, L.; Guo, J.; Li, J.; Sheng, L. The effect of wire heating and configuration on ozone emission in a negative ion generator. J. Electrost. 2000, 48, 81–91. [Google Scholar] [CrossRef]
  40. Wais, S.I.; Mohammed, P.A. Influence of Magnetic Field on Characteristics of Corona Discharge in Wire-Cylinder Electrodes Configuration. Plasma 2021, 4, 764–779. [Google Scholar] [CrossRef]
  41. Grosu, F.; Bologa, A.M.; Bologa, M.; Motorin, O. On temperature dependence of the parameters of corona discharge current-voltage characteristics. Surf. Eng. Appl. Electrochem. 2016, 52, 85–91. [Google Scholar] [CrossRef]
  42. Zhang, L.; Sheng, G.; Hou, H.; Zhou, N.; Song, H.; Jiang, X. Effect of temperature on current pulse characteristics of negative corona discharge based on numerical model. IEEE Trans. Plasma Sci. 2022, 51, 15–25. [Google Scholar] [CrossRef]
  43. Cobine, J.D. Gaseous Conductors: Theory and Engineering Applications; Dove Publication: Macclesfield, UK, 1958; pp. 205–289. [Google Scholar]
  44. Chen, X.; Lan, L.; Lu, H.; Wang, Y.; Wen, X.; Du, X.; He, W. Numerical simulation of Trichel pulses of negative DC corona discharge based on a plasma chemical model. J. Phys. D Appl. Phys. 2017, 50, 395202. [Google Scholar] [CrossRef]
  45. Wang, X.; Qu, L.; Yang, Y.; Liao, M.; Liao, Y.; Chen, H. The effect of Atmospheric Pressure and Temperature on corona discharge process at lightning rod tip. In Proceedings of the 2023 IEEE Sustainable Power and Energy Conference (iSPEC), Chongqing, China, 29–30 November 2023; pp. 1–8. [Google Scholar]
Figure 1. Cross-sectional diagram of a corona cage.
Energies 18 01303 g001
Figure 2. Electron density under different conductor temperatures.
Energies 18 01303 g002
Figure 3. Electron temperature under different conductor temperatures.
Energies 18 01303 g003
Figure 4. Positive ions under different conductor temperatures.
Energies 18 01303 g004
Figure 5. Negative ions under different conductor temperatures.
Energies 18 01303 g005
Figure 6. Reduced electric field under different temperatures.
Energies 18 01303 g006
Figure 7. Distribution of electron density: (a) 293 K, (b) 461.35 K, and (c) 552.35 K.
Energies 18 01303 g007
Figure 8. Distribution of positive ions: (a) 293 K, (b) 461.35 K, and (c) 552.35 K.
Energies 18 01303 g008
Figure 9. Distribution of negative ions: (a) 293 K, (b) 461.35 K, and (c) 552.35 K.
Energies 18 01303 g009
Figure 10. Distribution of reduced electric field: (a) 293 K, (b) 461.35 K, and (c) 552.35 K.
Energies 18 01303 g010
Figure 11. Experimental setup.
Energies 18 01303 g011
Figure 12. Picture of the experimental setup.
Energies 18 01303 g012
Figure 13. Experimental VI characteristics.
Energies 18 01303 g013
Figure 14. Measured and optimized VI characteristics.
Energies 18 01303 g014
Figure 15. VI characteristics for copper tubes with a radius of 0.635 cm: (a) ambient, (b) Connection 1, and (c) Connection 2.
Energies 18 01303 g015
Figure 16. VI characteristics for copper tubes with a radius of 0.475 cm: (a) ambient, (b) Connection 1, and (c) Connection 2.
Energies 18 01303 g016
Figure 17. VI characteristics for copper tubes with a radius of 0.317 cm: (a) ambient, (b) Connection 1, and (c) Connection 2.
Energies 18 01303 g017
Figure 18. VI characteristics for copper tubes with a radius of 0.457 cm: (a) ambient, (b) Connection 1, and (c) Connection 2.
Energies 18 01303 g018
Figure 19. VI characteristics for copper tubes with a radius of 0.359 cm: (a) ambient, (b) Connection 1, and (c) Connection 2.
Energies 18 01303 g019
Figure 20. VI characteristics for copper tubes with a radius of 0.317 cm: (a) ambient, (b) Connection 1, and (c) Connection 2.
Energies 18 01303 g020
Table 1. Corona inception voltage, corona current, and audible noise for different connections.
ConnectionInception Voltage (kV)Corona Current (mA)Audible Noise (dbA)Low Voltage (V)
Ambient65.25290.739.6140
Connection 151.36259.239.6110
Connection 256.35298.639120
Table 2. Polynomial coefficient and statistical metrics.
c 2 c 1 c 0 R 2 RMSE
0.071458−1.1716118.56940.96825.136
Disclaimer/Publisher’s Note: The statements, opinions and data contained in all publications are solely those of the individual author(s) and contributor(s) and not of MDPI and/or the editor(s). MDPI and/or the editor(s) disclaim responsibility for any injury to people or property resulting from any ideas, methods, instructions or products referred to in the content.

