Article

China’s Energy Stock Price Index Prediction Based on VECM–BiLSTM Model

1
School of Management, Tianjin University of Technology, Tianjin 300382, China
2
Xinhua Electric Power Development Investment Co., Ltd., CNNC, Tianjin 300382, China
3
China Energy Engineering Group Tianjin Electric Power Design Institute Co., Ltd., Tianjin 300382, China
4
Office of State-Owned Assets and Campus Economic Management, Tianjin University of Technology, Tianjin 300382, China
*
Author to whom correspondence should be addressed.
Energies 2025, 18(5), 1242; https://doi.org/10.3390/en18051242
Submission received: 23 January 2025 / Revised: 18 February 2025 / Accepted: 19 February 2025 / Published: 3 March 2025
(This article belongs to the Section C: Energy Economics and Policy)

Abstract

:
The energy stock price index maps the development trends in China’s energy market to a certain extent, and accurate forecasting of China’s energy market index can effectively guide the government to regulate energy policies to cope with external risks. The vector error correction model (VECM) analyzes the relationship between each indicator and the output, provides an external explanation for the way the indicator influences the output indicator, and uses this to filter the input indicators. The forecast results of the China energy stock price index for 2022–2024 showed an upward trend, and the model evaluation parameters MAE, MAPE, and RMSE were 0.2422, 3.5704% and 0.3529, respectively, with higher forecasting efficiency than other comparative models. Finally, the impact of different indicators on the Chinese energy market was analyzed through scenario setting. The results show that oscillations in the real commodity price factor (RCPF) and the global economic conditions index (GECON) cause fluctuations in the price indices of the Chinese energy market and that the Chinese energy market evolves in the same manner as the changes in two international stock indices: the MSCI World Index and FTSE 100 Index.

1. Introduction

In the development of the world economy, energy plays an important role, not only as a basic support for national development but also as an important indicator of the strength of a country. Therefore, many scholars have studied the energy market, hoping to identify its development trends in advance by forecasting developments so as to ensure the country’s energy security. Moreover, the prediction of energy market trends can also provide suggestions for national economic regulation. For example, Lin, Lu [1] studied the prediction methods of natural gas prices and carbon futures prices to provide a basis for economic market regulation. Atems, Mette [2], and others studied the impact of non-renewable energy prices on energy consumption in the United States so as to provide suggestions for energy price regulation, etc. As a major energy importer, China’s domestic and international situation is closely related to the Chinese energy market, and the unstable international situation has forced China to pay more attention to energy security and energy development. The overall layout of the energy structure in the 14th Five-Year Plan emphasizes that China’s energy industry will enter a critical period of comprehensive and deepening reform, that the energy market is still facing huge challenges, and that there is a need to promote the healthy and stable development of the energy sector. Therefore, there needs to be ongoing in-depth energy research. Energy is an important factor affecting the country’s macroeconomy, and China, a socialist country that relies on the government to regulate its economy, should pay more attention to controlling the energy market. Therefore, forecasting and analyzing the future development trend of the energy market is a very important task in the energy field. In addition, the growing emphasis on renewable energy sources has significantly influenced global energy markets. Renewable energy trends, such as solar and wind investments, impact traditional energy stock indices. For instance, Aktham Maghyereh [3] discussed how supply chain efficiencies in renewable sectors can stabilize energy markets. Xu used neural networks to predict the price of a new energy index in the Chinese mainland [4]. Additionally, methodologies from Xia, D. [5] underscore the importance of systematic approaches in forecasting energy trends. This study integrates these insights by analyzing how global economic indicators, including renewable energy dynamics, affect China’s energy stock index (CESI).
In order to forecast and study the energy market for quantitative or qualitative analysis, scholars often map the current state of the energy market from two indicators: energy prices and energy stock prices. Energy prices can reflect the development of the energy market, guide changes in energy supply and demand, promote energy competition and development, play an important role in the rational use of energy and related policy formulation, and have important utility for the development of the national energy market. The development of energy has a profound impact on the Chinese economy, and has been extensively studied by scholars [6,7,8]. Economic fluctuations in energy markets are often associated with the world economic environment and non-economic events [9,10,11], so it is necessary to take into account the spillover effects of the international situation and the state of global economic activity on energy prices when conducting studies on energy or energy price forecasting. Similarly, the international situation also affects energy stock prices, and studies have verified this conclusion [12,13,14]. Therefore, after comprehensive consideration, this study forecasts and analyzes the stock price index of the Chinese energy market with the international economic environment as the main influencing factor.
Among the currently popular prediction methods, traditional machine learning relies heavily on manual feature extraction, so the learning process is severely limited and can show good learning ability only on some simple tasks. Deep learning can automatically extract data features, has more learning power than traditional machine learning, and performs better in prediction despite reduced interpretability. Many scholars in the energy field prefer to use deep learning methods for prediction, and long short-term memory (LSTM) is one of the most popular methods [15,16,17]. Based on the advantages of deep learning models in forecasting, this study uses the BiLSTM deep learning model to forecast the Chinese energy stock price index. However, the main purpose of forecasting energy stock prices is to control the energy market so that relevant policies can be adjusted in a timely manner, so it is particularly important to understand how and to what extent different factors affect energy stock prices, and the interpretability of the deep learning model becomes a pressing issue. To this end, this study proposes a combination of spillover analysis and deep learning to improve the interpretability of energy stock price indices [18].
A spillover effect means that the activity of one object will have an impact on another object, even if the two events are not necessarily related to each other. The spillover effect assessment model can quantify and calculate the direction and degree of interaction between different objects, thus reflecting the relationship between different indicators. After the spillover effect analysis, this study analyzes the way and degree of influence between each input indicator and China energy stock price index, and screens out some indicators with less influence, thus improving the prediction efficiency. Moreover, according to the characteristics of the indicators, different scenarios are set according to the stability and development trend of the international economic environment, and the impact of the international economic environment on the Chinese energy market is analyzed.
Combined with the above, the contributions of this study are divided into three main aspects. The first is to carry out spillover effect analysis on energy stock price indexes and related forecasting indicators to compensate for the poor interpretability of deep learning models. The second is to screen indicators based on the analysis results of spillover effects to improve the accuracy of forecasting. The third is to fully consider the changes in the international economic environment for scenario setting, analyze the impact of international economic shocks and international economic development trends on China’s energy market, and use it to provide suggestions on energy. The third is to fully consider the changes in the international economic environment to set up scenarios, analyze the impact of international economic shocks and international economic development trends on China’s energy market, and use them to provide suggestions for controlling the energy market.
The rest of this study is organized as follows. Section 2 presents the literature review. Section 3 presents the rationale and data description of the model used. Section 4 performs spillover analysis, indicator screening, and model screening, followed by forecasting and scenario discussion of the future stock price index of the Chinese energy market using the VECM-BiLSTM model. Section 5 discusses some shortcomings of the research process and provides future research objectives. Section 6 draws conclusions.

2. Literature Review

Among the methods used in energy and energy stock price forecasting methods are traditional econometric techniques and machine learning models, including autoregressive integrated moving average (ARIMA) [19,20,21], vector autoregressive (VAR) models [22], random wandering (RW) models [23], generalized autoregressive conditional heterogeneity (GARCH) models [24], support vector machine (SVM) models [25] and deep learning methods [26,27,28], among others. As the research is not considered deep, the optimization of old models and various combination models has also become the mainstream means to improve energy price forecasting. For example, Guo, Zhao [29] proposed a new decomposition–integration framework for a multi-view crude oil price forecasting model to improve the accuracy of oil price forecasting. Wang, Zhang [30] transformed the traditional GM(1, 1) model with gray effect into a quadratic equation and introduced four different parameters to improve the accuracy of the model. Wu, Wang [31] developed a novel hybrid crude oil price forecasting model with fully optimized data processing and forecasting capabilities. Busari and Lim [32] proposed a combined AdaBoost-GRU model with higher forecasting accuracy through model comparison. Wang, Wu [33] validated the feasibility of the MS-GARCH-MIDAS combination model for forecasting renewable energy stock prices.
Among them, deep learning methods are widely used in the energy field because of their good prediction results, but they are also often called “black box models” because of their poor interpretability and difficulty in analyzing the relationship between input and output indicators [34]. In order to solve the problem of poor interpretability of deep learning models, scholars have opened up research fields such as Explainable Artificial Intelligence (XAI) and adopted different methods to optimize deep learning models so as to remedy their shortcomings to some extent. Among them, in the study of Barredo Arrieta, Díaz-Rodríguez [35], some methods are used to improve the interpretability of deep learning models by combining methods, such as using HMM (Hidden Markov Model) to interpret the prediction process of RNN (Recurrent Neural Network), using LIME (Local Interpretable Model-Agnostic Explanations) to interpret CNN (Convolutional Neural Network) models and CBR (Case-Based Reasoning) systems and DNN (Deep Nearest Neighbors) pairings, etc. Bin Zhong [36] propose a deep learning framework that combines artificial neural networks (ANNs), long short-term memory (LSTM), and transformer models, and further enhance the performance of the model by introducing transformer technology and leveraging its self-attention mechanism to capture long-distance dependencies in the data [37,38,39]. These studies also demonstrate that the hybrid model outperforms other comparative models in terms of prediction accuracy, stability, and statistical hypothesis testing. While the use of these combined models improves the interpretability of deep learning methods, it affects the efficiency of prediction. In addition, there are methods (such as gray correlation, impulse response analysis, and spillover analysis) that can analyze the relationship between input and output metrics outside of the prediction, giving explanations to deep learning, but will not participate in the prediction process.
Spillover analysis, on the other hand, is one of the most effective methods to explain the relationship between indicators. Currently, in the energy field, the commonly used spillover analysis methods include the GARCH model, Copula model [40] and VAR model [41]. Conventional spillover effect analysis models have strict requirements for data stability, so the data often have to be manipulated when conducting the analysis, resulting in the data losing its original economic significance. In this study, the VECM model, which is a VAR model combined with vector error correction model, is selected for the spillover analysis, which can retain its economic significance and obtain the duration and optimal lag of the spillover effect. Based on the results of the spillover effect analysis, the impact of different international economic environment factors on China’s energy market can be compared, so that indicators with stronger and more far-reaching impact can be selected for forecasting and forecasting accuracy can be improved. This can provide an explanation for the indicator selection and impact effect of international economic environment indicators in predicting energy stock price indexes, and to a certain extent compensate for the shortcomings of the deep learning model.

3. Method and Data

3.1. VECM Model

VAR models are currently one of the most popular methods for assessing spillover effects in economics and can visually represent the interactions between different objects using methods such as impulse response analysis and variance decomposition [42]. Deep learning models tend to be poorly interpretable, and the analysis of indicators using VAR models can quantify the link between input and output indicators, thus refining the indicators that have a stronger impact on the output indicators. Traditional VAR models require that the data involved in spillover analysis be smooth, and for data with unstable terms, although the results can be obtained through data processing or differencing, it is difficult to reflect the relationship between the original data, and the original economic meaning is lost. To ensure that the model output reflects the real economic relationship between the research objects, it is necessary to add a vector error correction model to construct the VECM model, whose general expression can be written as
Δ Y t = α E C M t 1 + i = 1 p 1 β i Δ Y t 1 + ε t
where Y t represents the vector of endogenous variable columns. Y t 1 , Y t 2 , are the vectors of endogenous variables with one and two lags, respectively. α is the adjustment parameter. β is the covariance vector. E C M t 1 is the error correction variable vector. ε t is the error vector.
This study will use the VECM model to analyze the spillover effects of three sets of international economic indicators, Global Economic Activity, Global Energy Actuality, and Global Stock Index, on Chinese energy stock price index (CESI), respectively.

3.2. Standardization with Z-Score
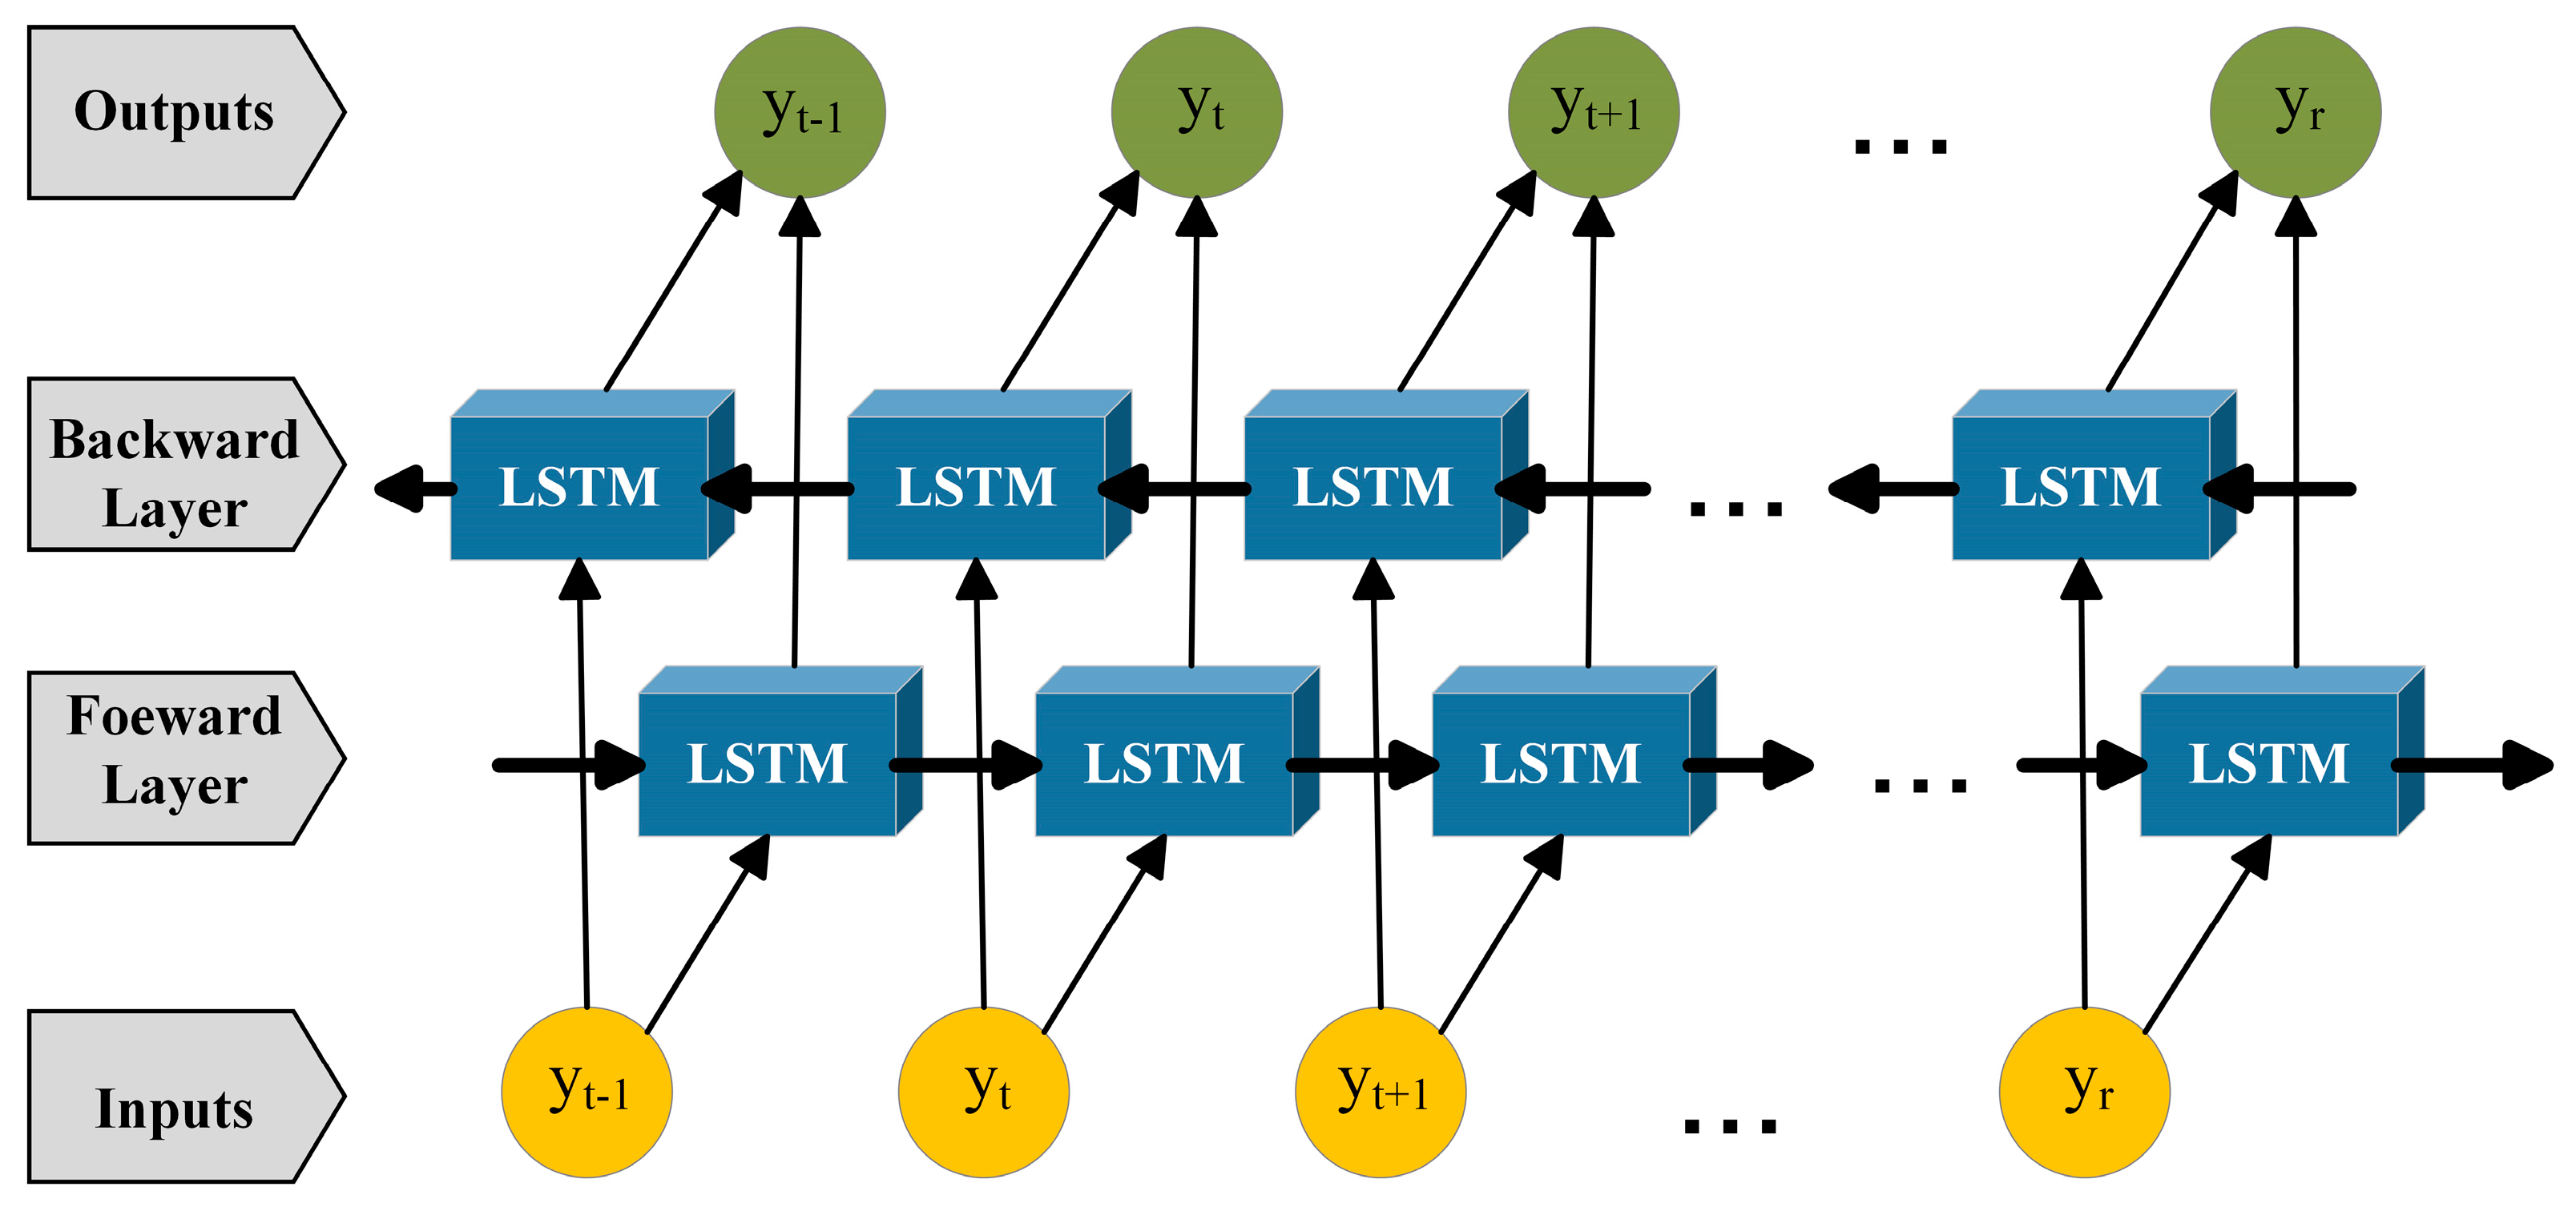
Data standardization can transform raw data into dimensionless metric measurements, avoiding large differences in order of magnitude among metrics, making data smoother and improving data prediction efficiency. There are various standardization methods, such as “min-max standardization,” logistic standardization and fuzzy quantification. In this study, the Z-score standardization method, also known as standard deviation standardization, is used to standardize the data based on the mean and standard deviation of the original data. The processed data conform to a standard normal distribution, i.e., with a mean value of 0 and a standard deviation of 1. This normalization is not susceptible to the influence of extreme values. Before running the BiLSTM model, the use of the Z-score normalization method allows the data to reduce the time complexity and improve the performance of energy price forecasting [43].

3.3. BiLSTM Model

LSTM is a special structure of recurrent neural network (RNN) that introduces a gating cell mechanism to selectively store information and reduce the sequence length and the number of grid layers [44]. The LSTM version of the BRNN structure is called bi-directional LSTM (BiLSTM). This version can improve the performance of LSTM models during classification [45]. Unlike the standard LSTM structure, two different LSTM networks are trained against sequential inputs in the BiLSTM architecture. Figure 1 depicts the basic BiLSTM structure operating on sequential inputs, with the lower LSTM network representing forward features and the upper network representing backward features.
To evaluate and analyze the prediction performance of BiLSTM models, this study uses two deep learning models (Long Short-Term Memory Network (LSTM)) and two machine learning models (Gated R Current Unit (GRU), Support Vector Regression (SVR)) as comparative models based on the same input time series. In order to show the significance of spillover analysis in improving the prediction of stock price indices of Chinese energy companies, two experiments will be conducted for each experiment, with one of the predictions retaining only the screened indicators. Forecast accuracy will be assessed by three error analysis methods, root mean square error (RMSE), mean absolute error (MAE), and mean absolute percentage error (MAPE), as shown in the formulas in (2)–(4). Zeng, Zeng [46] provide the listed MAPE model evaluation criteria for previous studies, as shown in Table 1.
M A E = 1 n i 1 n y ^ i y i
R M S E = 1 n i 1 n y ^ i y i 2
M A P E = 100 % n i 1 n y ^ i y i y i

3.4. Data and Descriptions

This study uses monthly stock price data of the top ten Chinese energy companies from January 2012 to December 2021 and constructs the China Energy Market Stock Price Index (CESI) to reflect the state of the Chinese energy market by averaging the data from an investing website. In addition, this study reflects the international situation and economic conditions in three dimensions: international economic activities, international energy status and international stock market. Three different sets of indicators are established to represent the impact of different international factors on the Chinese energy market. Guo, Ma [47] used AR autoregression and principal component analysis (PCA) models to screen five indicators that reflect global economic activity with high-intensity forecasting ability for crude oil price indicators for the same period, namely the World Industrial Production Index (WIP), Real Commodity Price Factor (RCPF) and The Global Economic Conditions Index (GECON). International stock market data [48], international crude oil prices [49] and international oil shocks [50] have also been shown to be useful for energy price forecasting, thus establishing international metrics. The international stock market data are selected from the S&P 500 Index, MSCI World Index, FTSE 100 Index and AXP Index. The data of the international stock market are selected from S&P 500 Index, MSCI World Index, FTSE 100 Index and AXP Index. In addition, three datasets of Chinese Diesel Output, Crude Output, and Gasoline Output were obtained from the National Bureau of Statistics [51] to reflect the state of China’s domestic energy market. Table 2 shows the descriptive statistics for all data.
Obviously, according to Table 2, there is a large difference in numerical magnitude among the indicators and some indicators have large extreme differences, so standardization of the raw data is necessary. CESI is not a smooth dataset, so the analysis of the spillover effects of international factors on the Chinese energy market requires the construction of a VECM model that includes a vector correction model. Further spillover analysis is required to select the input indicators that have a greater impact on the output indicators in order to filter out the indicators that are more suitable for predicting the Chinese stock price index. In this study, spillover effect analysis and indicator screening will be performed in groups according to indicator categories.

3.5. Parameter Tuning

In this empirical study, we assess the methodology for the automatic determination of parameters for the Vector Error Correction Model with Bidirectional Long Short-Term Memory (VECM-BiLSTM). The experimental data are segmented into multiple groups based on batch size, with parameters being updated accordingly. Each dataset defined by a specific batch size influences the direction of gradient descent, thereby mitigating randomness and computational demands during the optimization process. An increase in batch size may lead to the occurrence of a local optimum, while a decrease introduces greater randomness, complicating the convergence process. Additionally, an increase in batch size correlates with a rise in the number of required epochs, whereas a decrease results in a reduction in epochs needed. Consequently, it is essential to fine-tune both batch size and epochs to enhance the evaluation metrics for forecasting; however, existing methodologies lack established guidelines for parameter adjustment. To address this gap, we employ the Grid Search (GS) method to iteratively train the model in order to identify optimal parameter combinations.
In this study, the optimization of batch size and epochs is conducted using the GS method, with batch size defined as the range (0, 32, 2) and epochs as the range (0, 500, 50). The parameters for the grid search are initialized through the GridSearchCV function, and the GS model is generated via grid.fit(). The best score reflects the highest performance observed during the optimization, while the best parameters indicate the combinations that yielded the most favorable results. The output reveals that the optimal parameter combination for achieving the best result is a batch size of 24 and 400 epochs, as indicated by the best score of 0.106227. These findings are subsequently illustrated in Table 3.

4. Empirical Evidence

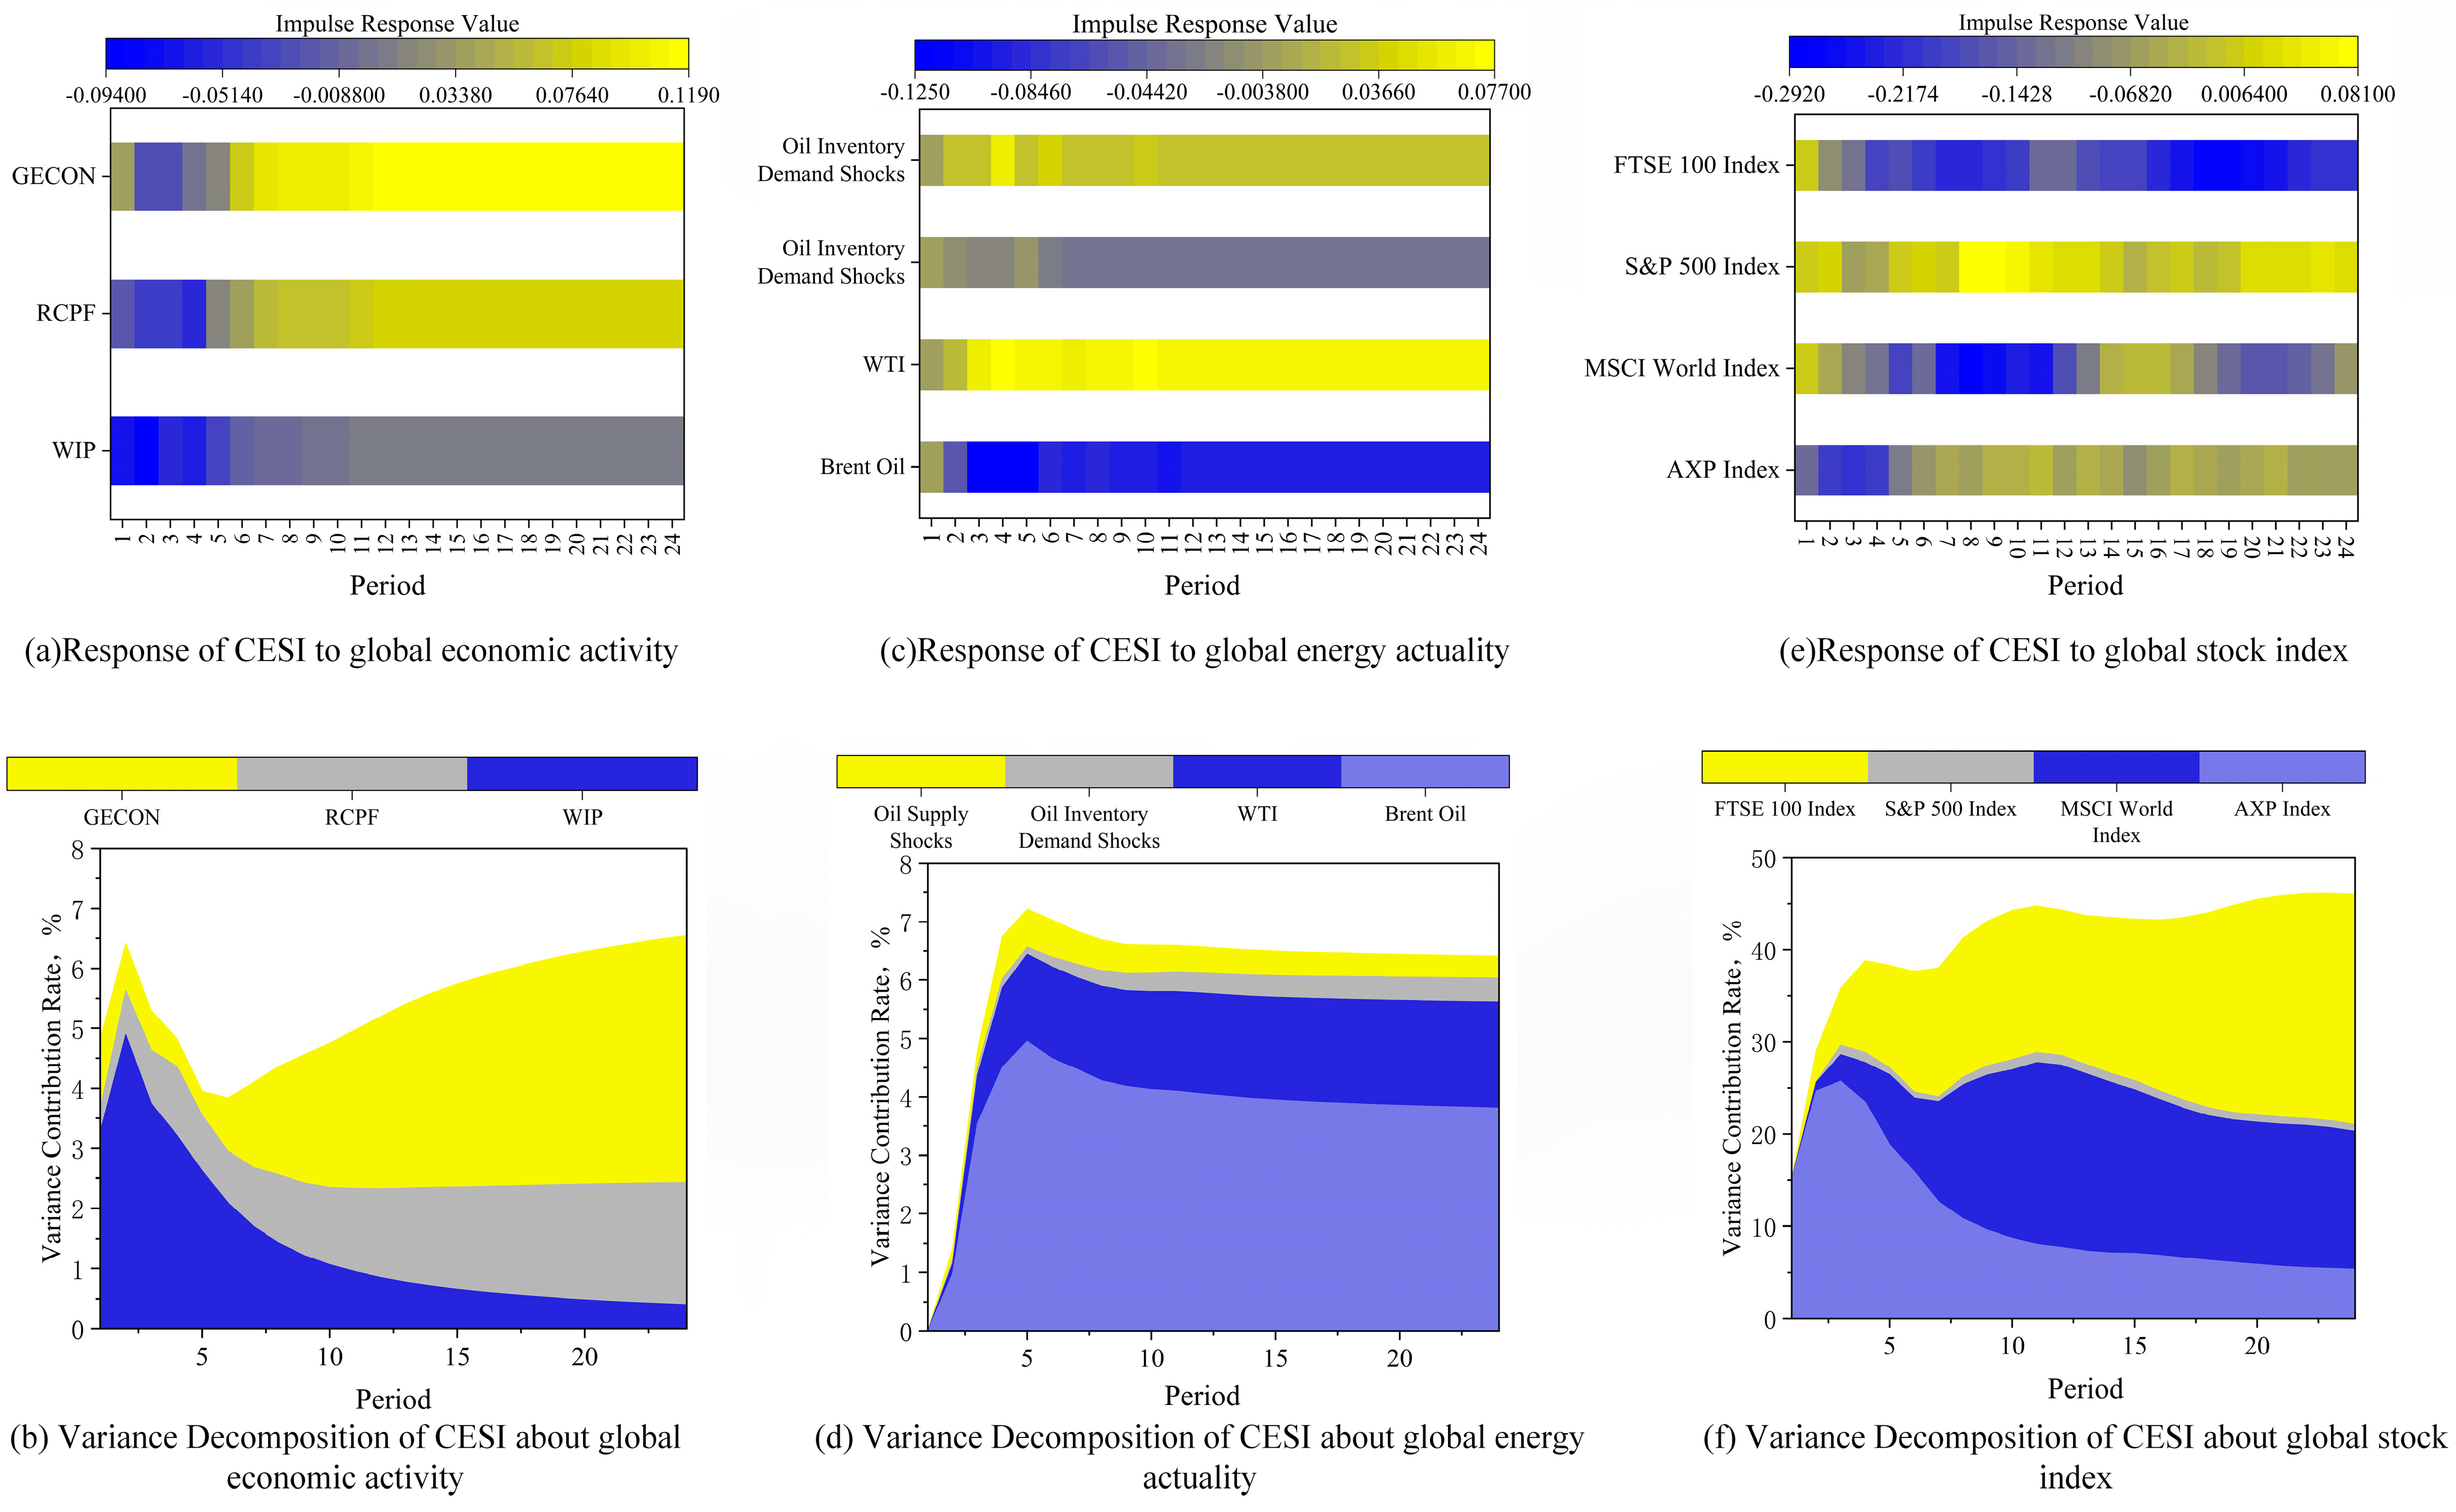
4.1. Spillover Analysis

4.1.1. Global Economic Activity

In the analysis of global economic activity indicator, the VECM model is constructed according to a lag order of 3 (the optimal lag order is determined by likelihood ratio test, final prediction error, Akaike information criterion, Hannan Quinn information, and Schwartz information criterion). The results of the Johansen Cointegration Test for CESI, GECON, RCPF, and WIP are shown in Table 4. The trace test indicates one cointegrating equation at the 0.05 level, and the max-eigenvalue test indicates one cointegrating equation at the 0.05 level. The data pass the Johansen Cointegration Test and prove the existence of long-run equilibrium among the four datasets. The established VECM model is tested by the AR root test, and the characteristic roots are all within the unit circle, which shows that the model is relatively stable in general and ensures that the subsequent analysis is reasonable.
According to the results of impulse response analysis (Figure 2a), it can be seen that CESI responds almost immediately to shocks from WIP, GECON and RCPF, and the impulse responses of all three indicators show no signs of convergence within 24 periods, which shows that the impact of Global Economic Activity on CESI is continuous. The response of CESI to the shock of WIP is the most dramatic in the first five periods, but this response decreases rapidly afterwards, while the response to RCPF and GECON continues to increase and gradually becomes stable. It can be seen that although all three indicators have a continuous effect on CESI and all respond positively to CESI after period 8, RCPF and GECON clearly maintain a higher level.
The variance decomposition results (Figure 2b) depict that RCPF and GECON maintain an overall increasing trend on the change of CESI, while the contribution of WIP to the change of CESI gradually decays. A total of 93.46% of the change of CESI from period 1 to period 24 is determined by its own influence, while the contributions of WIP, GECON and RCPF are 0.40%, 2.03% and 4.12%, respectively, which shows that GECON and RCPF have a relatively higher degree of influence on CESI.
Combining the impulse response and variance decomposition results, it can be concluded that GECON and RCPF can provide useful information for forecasting stock price indices in the Chinese energy market.

4.1.2. Global Energy Actuality

In the analysis of the global energy actuality indicator, the VECM model is constructed according to a lag order of 3. The results of the Johansen Cointegration Test for Oil Supply Shocks, Oil Inventory Demand Shocks, WTI and Brent Oil are shown in Table 5. The trace test indicates three cointegrating equations at the 0.05 level, and the max-eigenvalue test indicates two cointegrating equations at the 0.05 level. The data pass the Johansen Cointegration Test and prove the existence of long-run equilibrium among the four datasets. The established VECM model was tested with the AR root test, and the characteristic roots were all within the unit circle, which shows that the model is relatively stable overall.
According to the results of impulse response analysis (Figure 2c), it can be seen that the impulse responses to shocks from Oil Supply Shocks, Oil Inventory Demand Shocks, WTI and Brent Oil start from period 2, and there is no sign of convergence in the impulse responses of all four indicators within 24 periods. The impact of global energy actuality on CESI is persistent. Among them, WTI and Oil Inventory Demand Shocks produce continuous positive shocks to CESI, while Oil Supply Shocks and Brent Oil produce continuous negative shocks, and the response of CESI to the shocks of WTI and Brent Oil is significantly more drastic.
According to the results of variance decomposition (Figure 2d), the influence of global energy actuality index on the change of CESI maintains an increasing trend in the first four periods, and then gradually remains stable. A total of 93.58% of the change of CESI from period 1 to period 24 is determined by its own influence, while the contribution of Oil Supply Shocks, Oil Inventory Demand Shocks, WTI and Brent Oil to the change of CESI is 0.37%, 0.41%, 1.81% and 3.81%, respectively. Inventory Demand Shocks, WTI and Brent Oil contribute 0.37%, 0.41%, 1.81% and 3.81%, respectively, which shows that WTI and Brent Oil have a relatively higher degree of influence on CESI.
Combining the impulse response and variance decomposition results, it can be concluded that WTI and Brent Oil can help improve the forecasting accuracy of the Chinese energy market stock price index.

4.1.3. Global Stock Index

In the analysis of the global stock index indicator, the VECM model is constructed according to a lag order of 7. The results of the Johansen Cointegration Test on S&P 500 Index, MSCI World Index, FTSE 100 Index and AXP Index are shown in Table 6. The trace test indicates one cointegrating equation at the 0.05 level and the max-eigenvalue test indicates one cointegrating equation at the 0.05 level. The data pass the Johansen Cointegration Test and prove the existence of long-run equilibrium among the four datasets. The established VECM model was tested with the AR root test, and the characteristic roots were found to be within the unit circle, which shows that the model is relatively stable overall.
According to the impulse response analysis (Figure 2e), CESI responds immediately to the shocks from the AXP Index and from period 2 onwards to the shocks from the MSCI World Index, S&P 500 Index and FTSE 100 Index. The peaks of the S&P 500 Index are decreasing, showing signs of convergence, and the shocks to the CESI will gradually disappear. The impulse responses of the other three indicators show no signs of convergence. The impulse responses of the MSCI World Index and FTSE 100 Index have a continuous and strong negative impact on the CESI, while the impulse responses of the CESI to the AXP Index stabilize and remain low after the seventh period.
According to the variance decomposition results (Figure 2f), the impact of S&P 500 Index on CESI remains low, the impact of APX Index on the change of CESI increases sharply in the first three periods and then decreases until it is stable, the MSCI World Index changes from increasing to decreasing in the 12th period, and the FTSE 100 index maintains 53.98% of the change in CESI from period 1 to period 24, determined by its own influence, while the contribution of the APX Index, MSCI World Index, S&P 500 Index and FTSE 100 Index is 5.36%, 14.89%, 0.76% and 25.00%, respectively. Index, MSCI World Index, and FTSE 100 Index are relatively more influential.
Combining the impulse response and variance decomposition results, the MSCI World Index and FTSE 100 Index can be used to forecast the Chinese energy market stock price index.

4.2. Chinese Energy Stock Price Index Predication

The study applied a three-layer BiLSTM with input, hidden and output layers, and the parameters and basic structure of the model were determined by debugging. Of the monthly samples between January 2012 and December 2021, 80% were used as the training set and the rest as the test set. The parameters affecting the prediction accuracy of the model were debugged separately, and the number of batch_size was finally set to 8, the time step to 14, the learning rate to 2.5%, the decay rate to 5%, the hidden_layer to 150, and the epochs to 1000 by observing the loss variation. The comparison of the prediction results of different models is shown in Figure 3. The final computed results of the evaluation indexes of each model are shown in Table 7.
According to Table 7, it can be found that the evaluation indicators of the deep learning models are lower than the mechanical learning models, which reflects, to some extent, that the deep learning models are better than the traditional mechanical learning in energy stock price index prediction, which is consistent with the previous scholars’ conclusions. Moreover, among all models, the BiLSTM model predicts lower evaluation indicators than other models, which indicates the superiority of the BiLSTM structure in predicting energy stock prices. In addition, the prediction efficiency of each model is improved after screening indicators with the VECM model. In particular, the combined VECM-BiLSTM model has the lowest evaluation metric values among all experiments, with its MAE, MAPE and RMSE values of 0.2069, 3.1262% and 0.3147, respectively.
Furthermore, to enhance the validation of the VECM-BiLSTM model’s performance, a comparative analysis of the 95% confidence intervals for the actual values and the predicted values generated by the VECM-BiLSTM model is presented in Figure 4. It is evident that the methodology employed in VECM-BiLSTM, which examines the interrelationships among various indicators and the output to refine the input indicators, yields superior predictive performance and achieves greater accuracy in comparison to the BiLSTM model. Additionally, VECM-BiLSTM demonstrates a more effective fitting of the actual energy stock prices than the BiLSTM model.

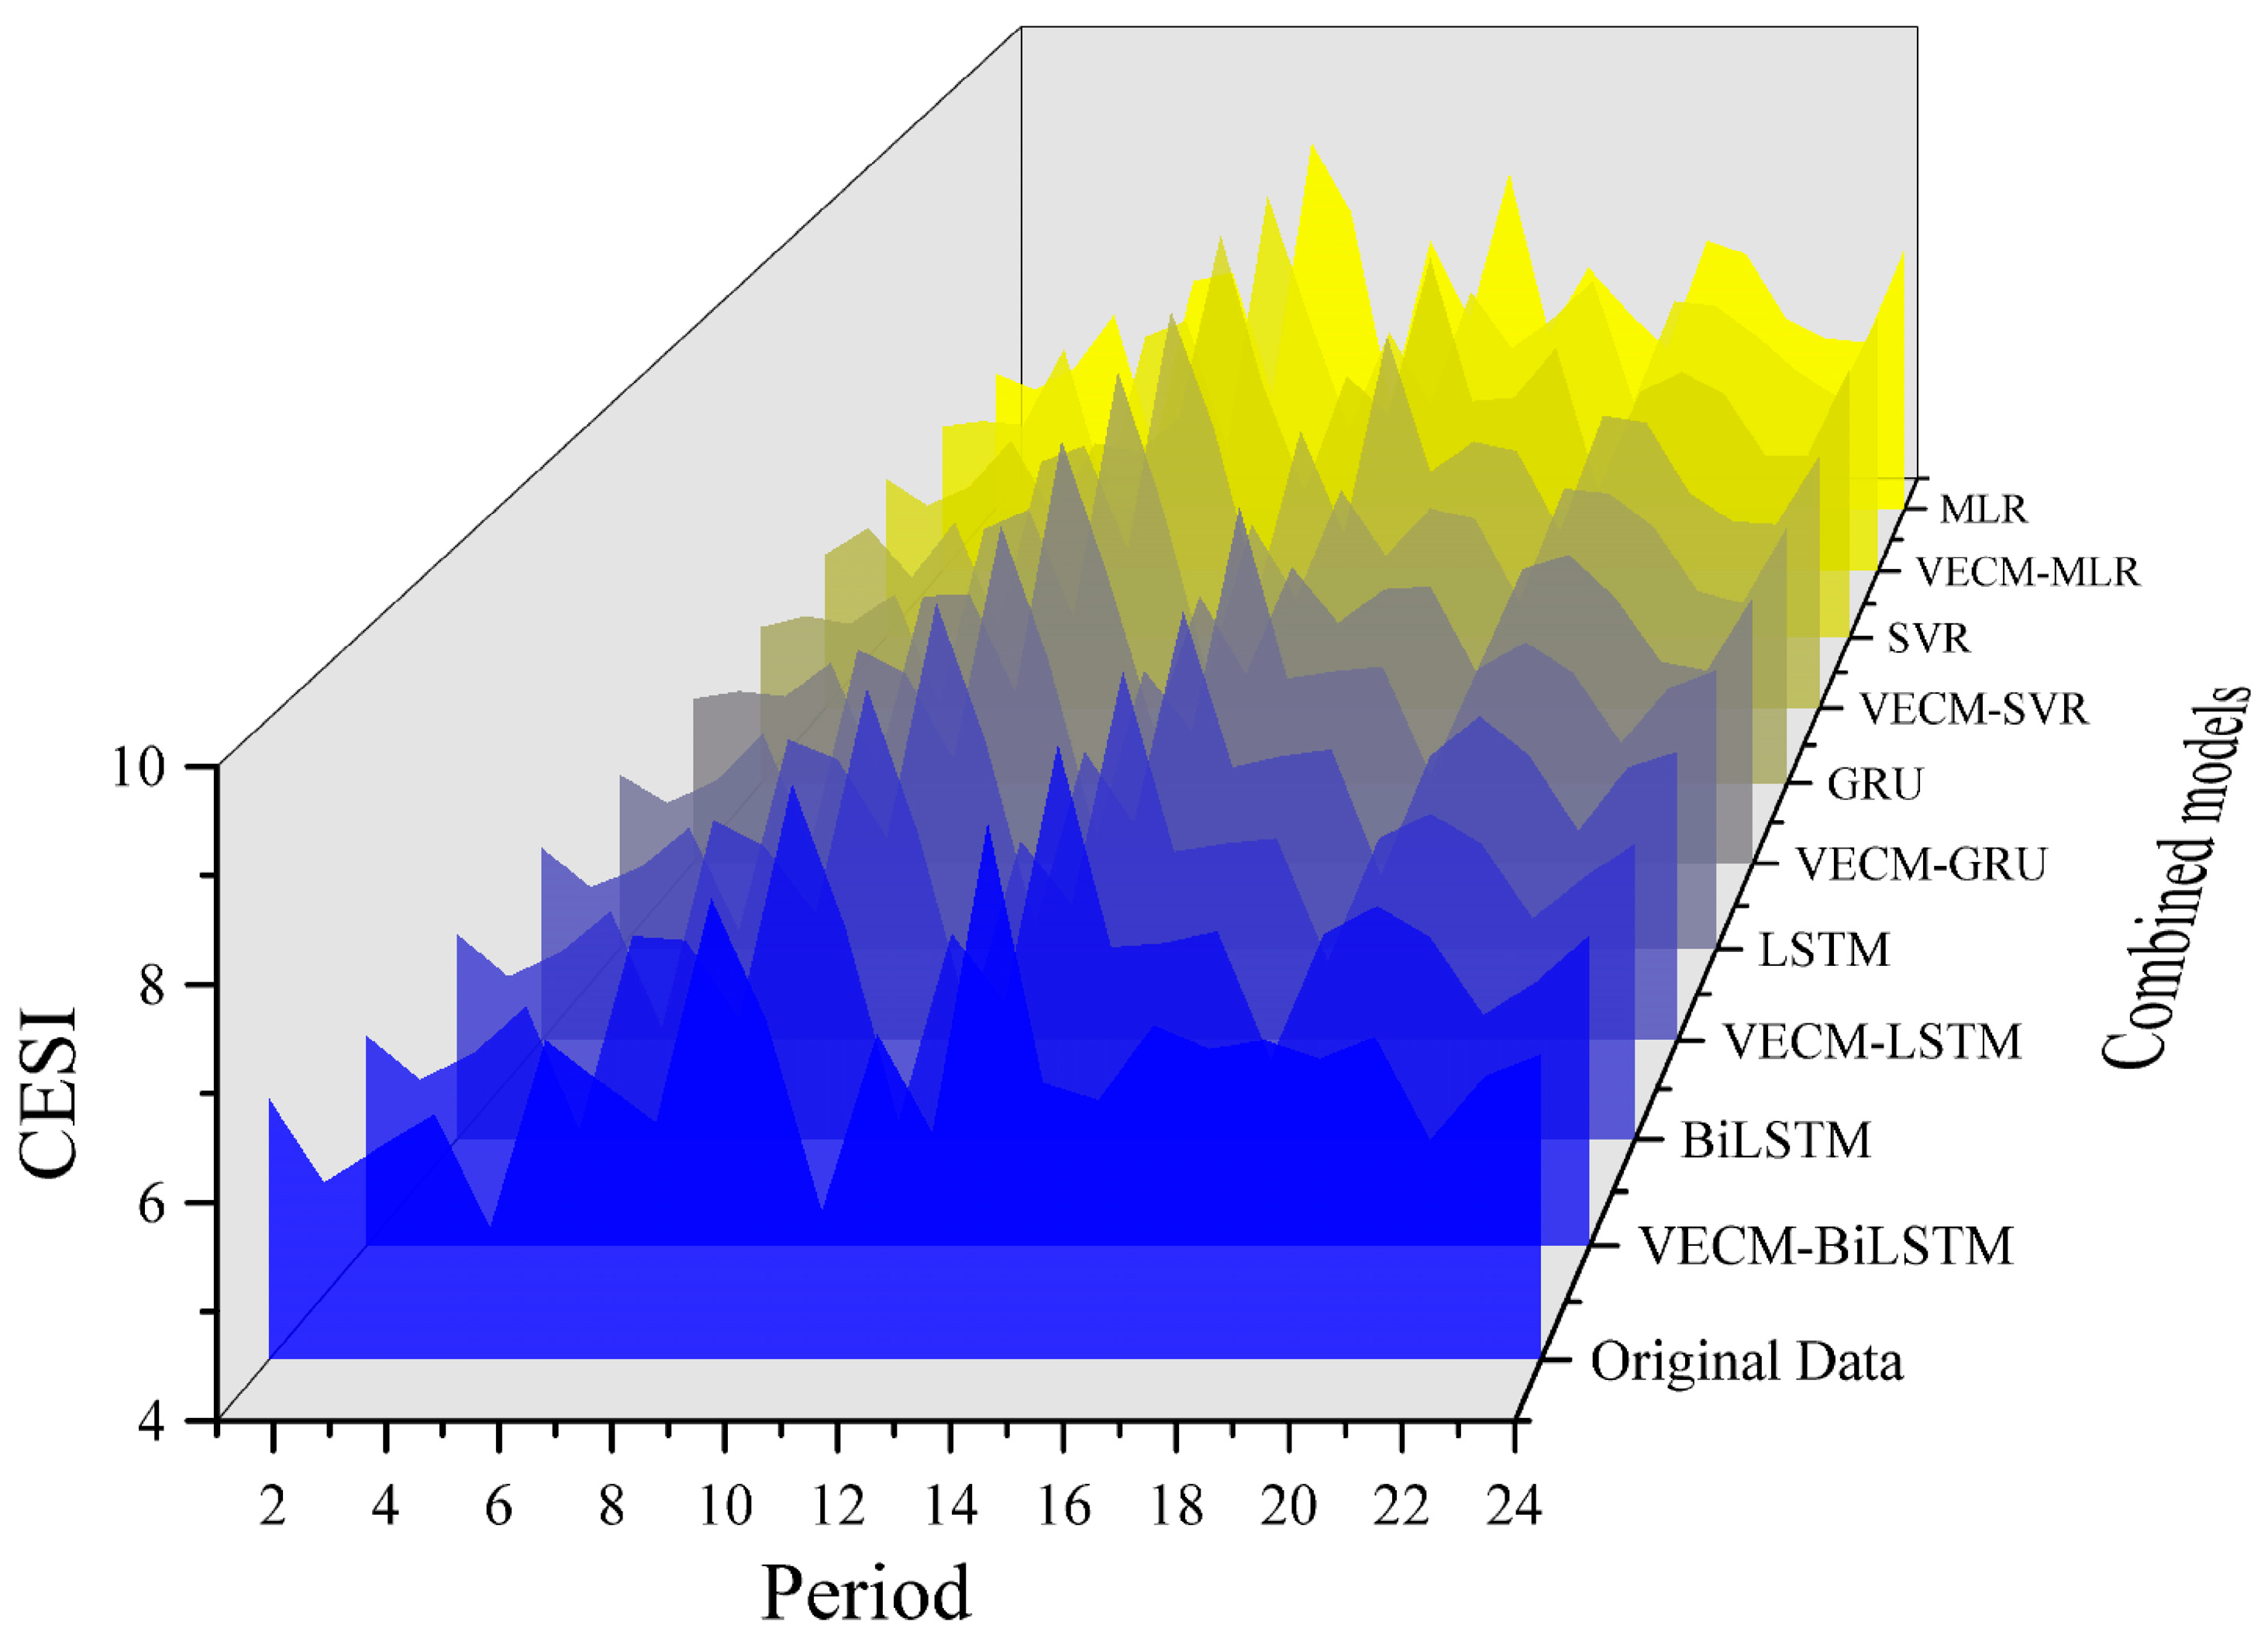
4.2.1. Stock Price Index Prediction Results

In order to forecast the future stock market, the input indicators are first forecasted by using the exponential smoothing method considering seasonal fluctuations, and then the future stock price index of the Chinese energy market is calculated based on the future input indicator data, taking into account the lag of the impact of each indicator on the CESI obtained from the spillover effect analysis, and the final stock index for the next three years is shown in Figure 5. This is then used as a benchmark for stock market scenario analysis. In the next three years, which is the next 36 periods, China’s energy stock price index will remain between 7.0 and 8.6, showing a slight downward trend. There will be troughs in the coming 10th and 34th periods, where the Chinese energy market may be hit by international economic events, and this needs to be prepared for.
To investigate the impact of the international economic environment on the stability of the Chinese energy market, this study proposes three scenarios, oscillatory, benchmark and stable, for the selected international economic environment indicators, namely RCPF and GECON, setting three types of energy stock markets.
Oscillatory markets assume an unstable international economic environment in the future, such as large fluctuations in the exchange rate between the RMB and foreign currencies, widespread wars, large epidemics or pandemics, etc. In this scenario, trade in some commodities is severely restricted or facilitated, and the unbalanced development of industry and agriculture in each country, such as war, can lead to rapid development of military industry, medical industry, and food trade, while the development of commerce and tourism stagnates, and the natural environment becomes harsh, leading to large fluctuations in RCPF and GECON. For the input, given that both RCPF and GECON are values that fluctuate around 0, the baseline data are multiplied by 1.2 to expand the fluctuation of the input data to simulate an unstable international economic environment. A stable energy stock market assumes that there are no large fluctuations in the international economic environment in the future, and that the development of China’s energy market is relatively stable, e.g., fewer wars, smooth trade between countries, and mostly benign competition in the international trade market can provide a good environment for the development of China’s energy sector. In this case, the development of all fields is more stable, and the RCPF and GECON will remain stable and volatile as the international community pays more attention to the natural environment and climate. On the input, the baseline data are multiplied by 0.8 to reduce the volatility of the input data to simulate a stable international economic environment. The final forecast yields the Chinese energy market stock price index for the next three years (Figure 5).
As shown by Figure 6, all three volatile markets have the highest and smooth markets the lowest in all assessment indicators. The stability of the stock price index is clearly subject to shocks from RCPF and GECON, which shows that the Chinese energy market is subject to fluctuations in the international economic environment.

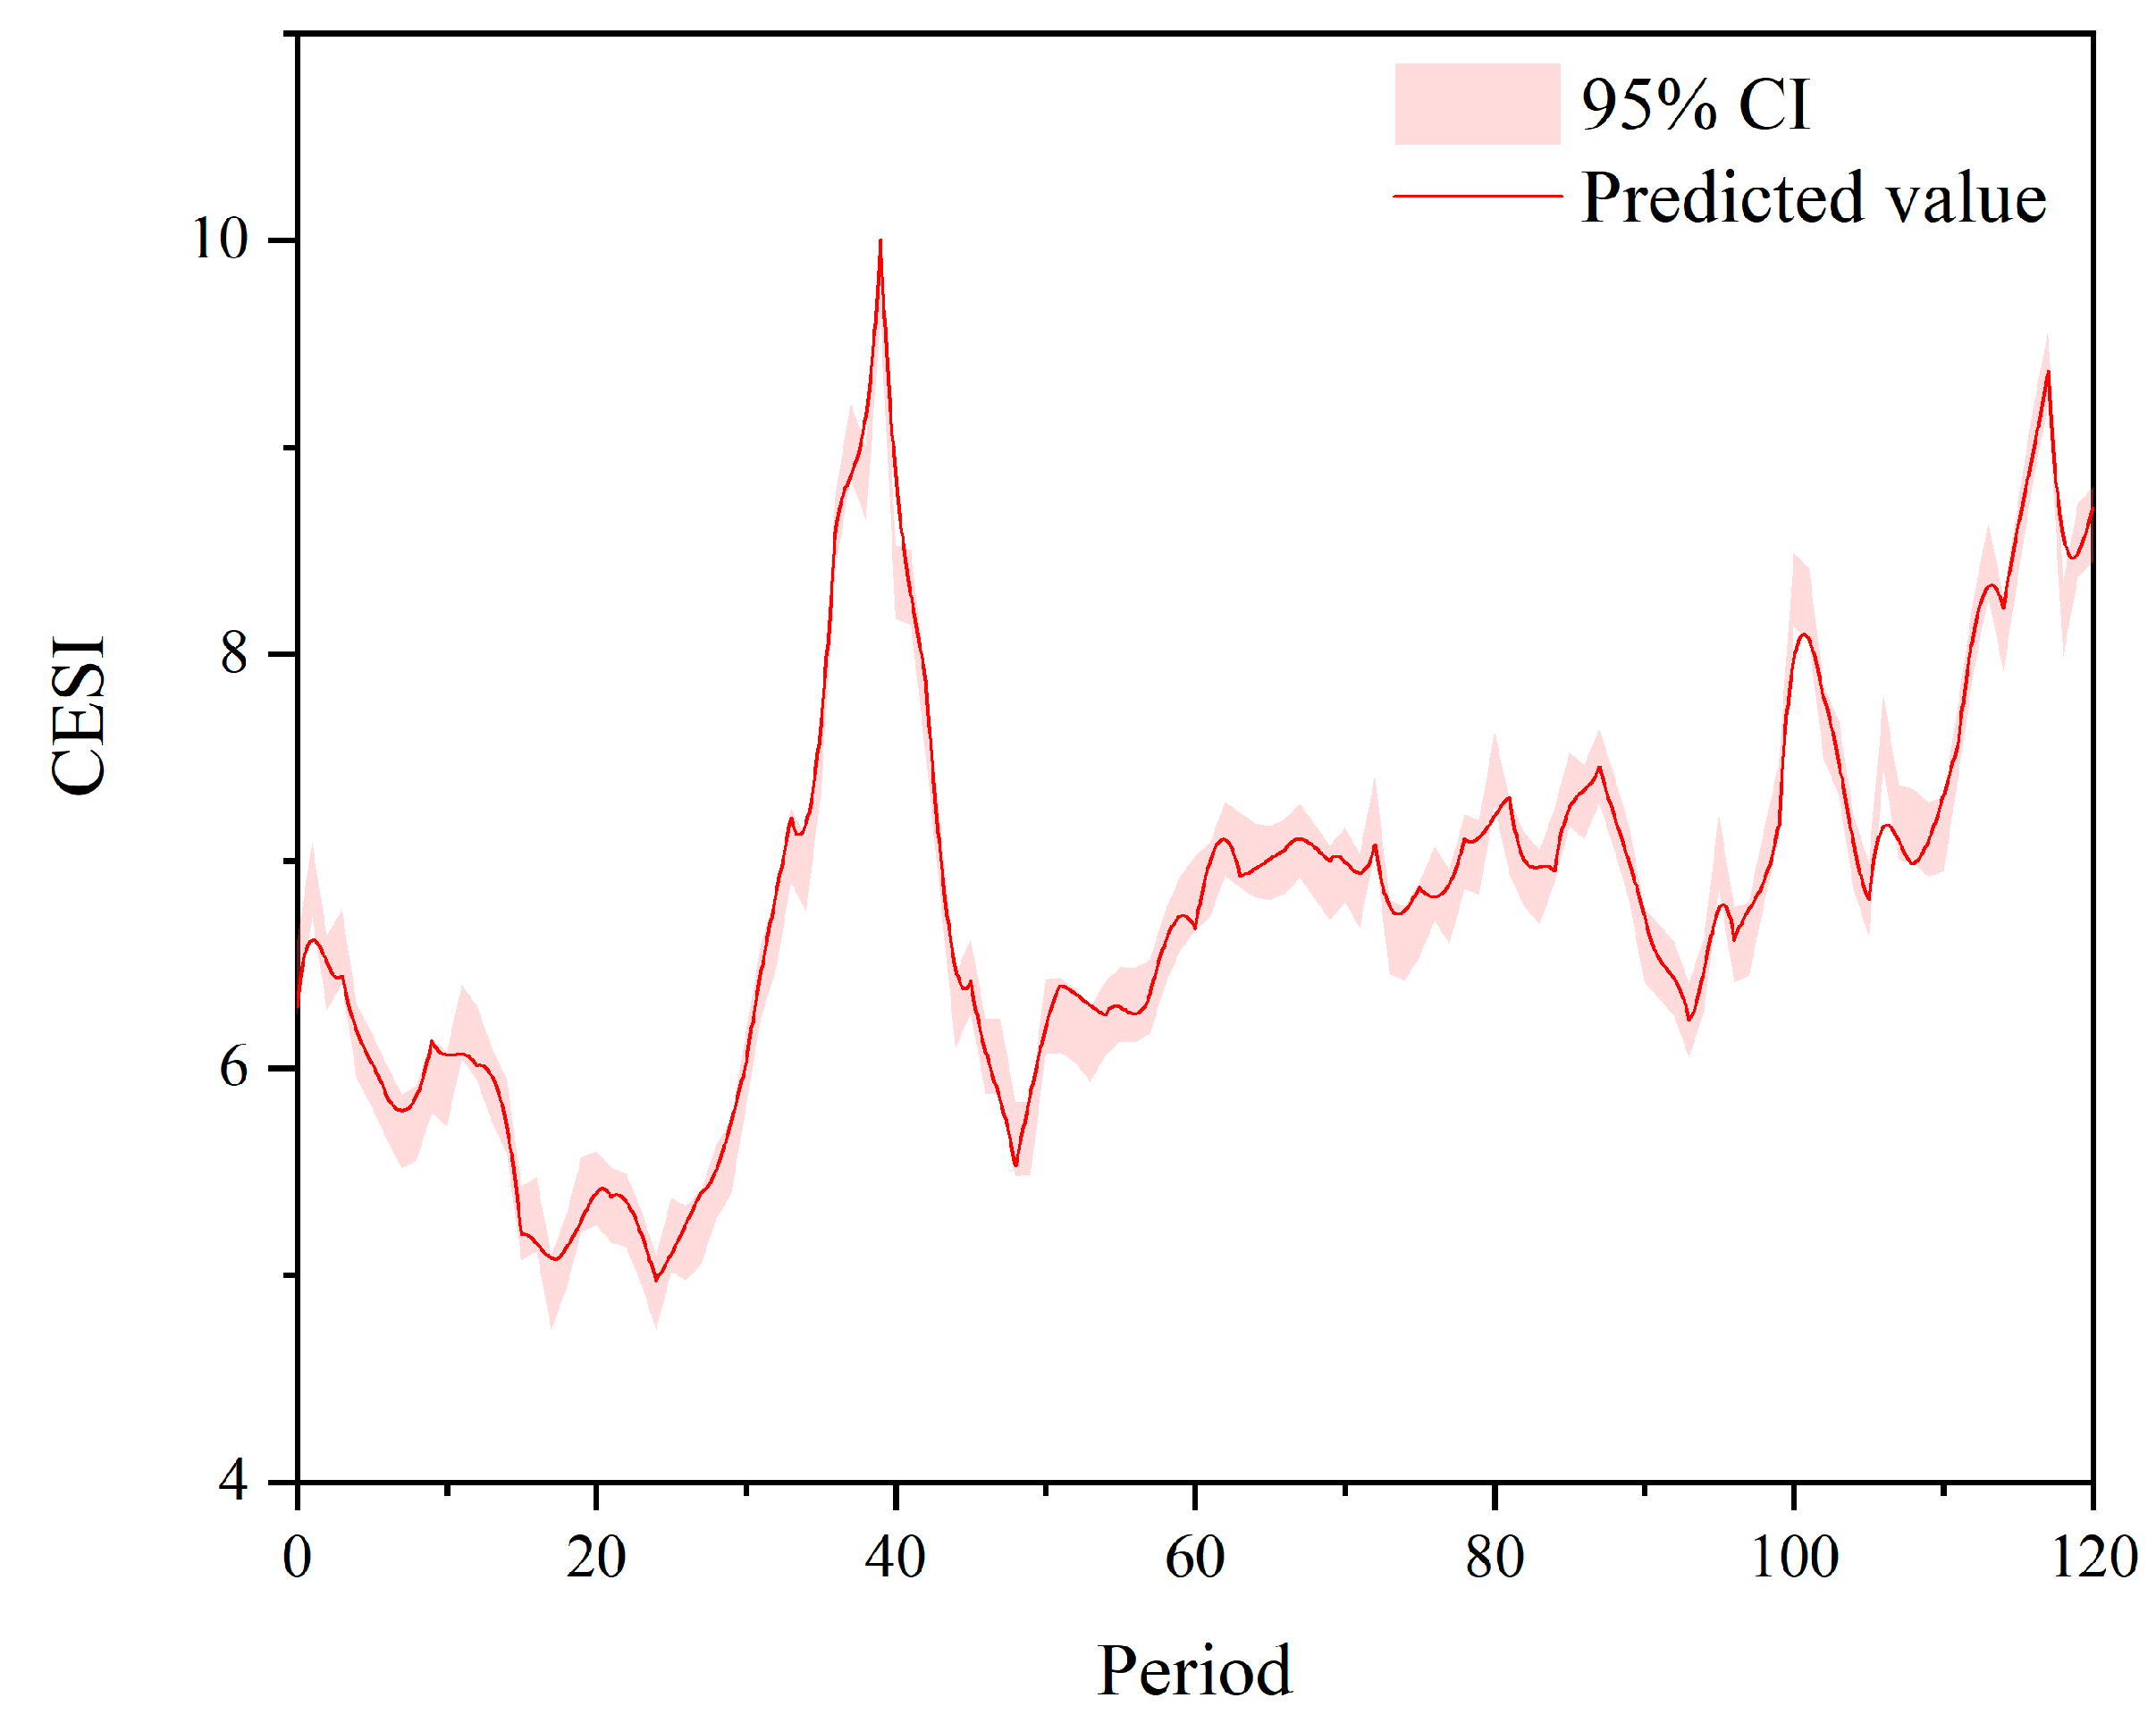
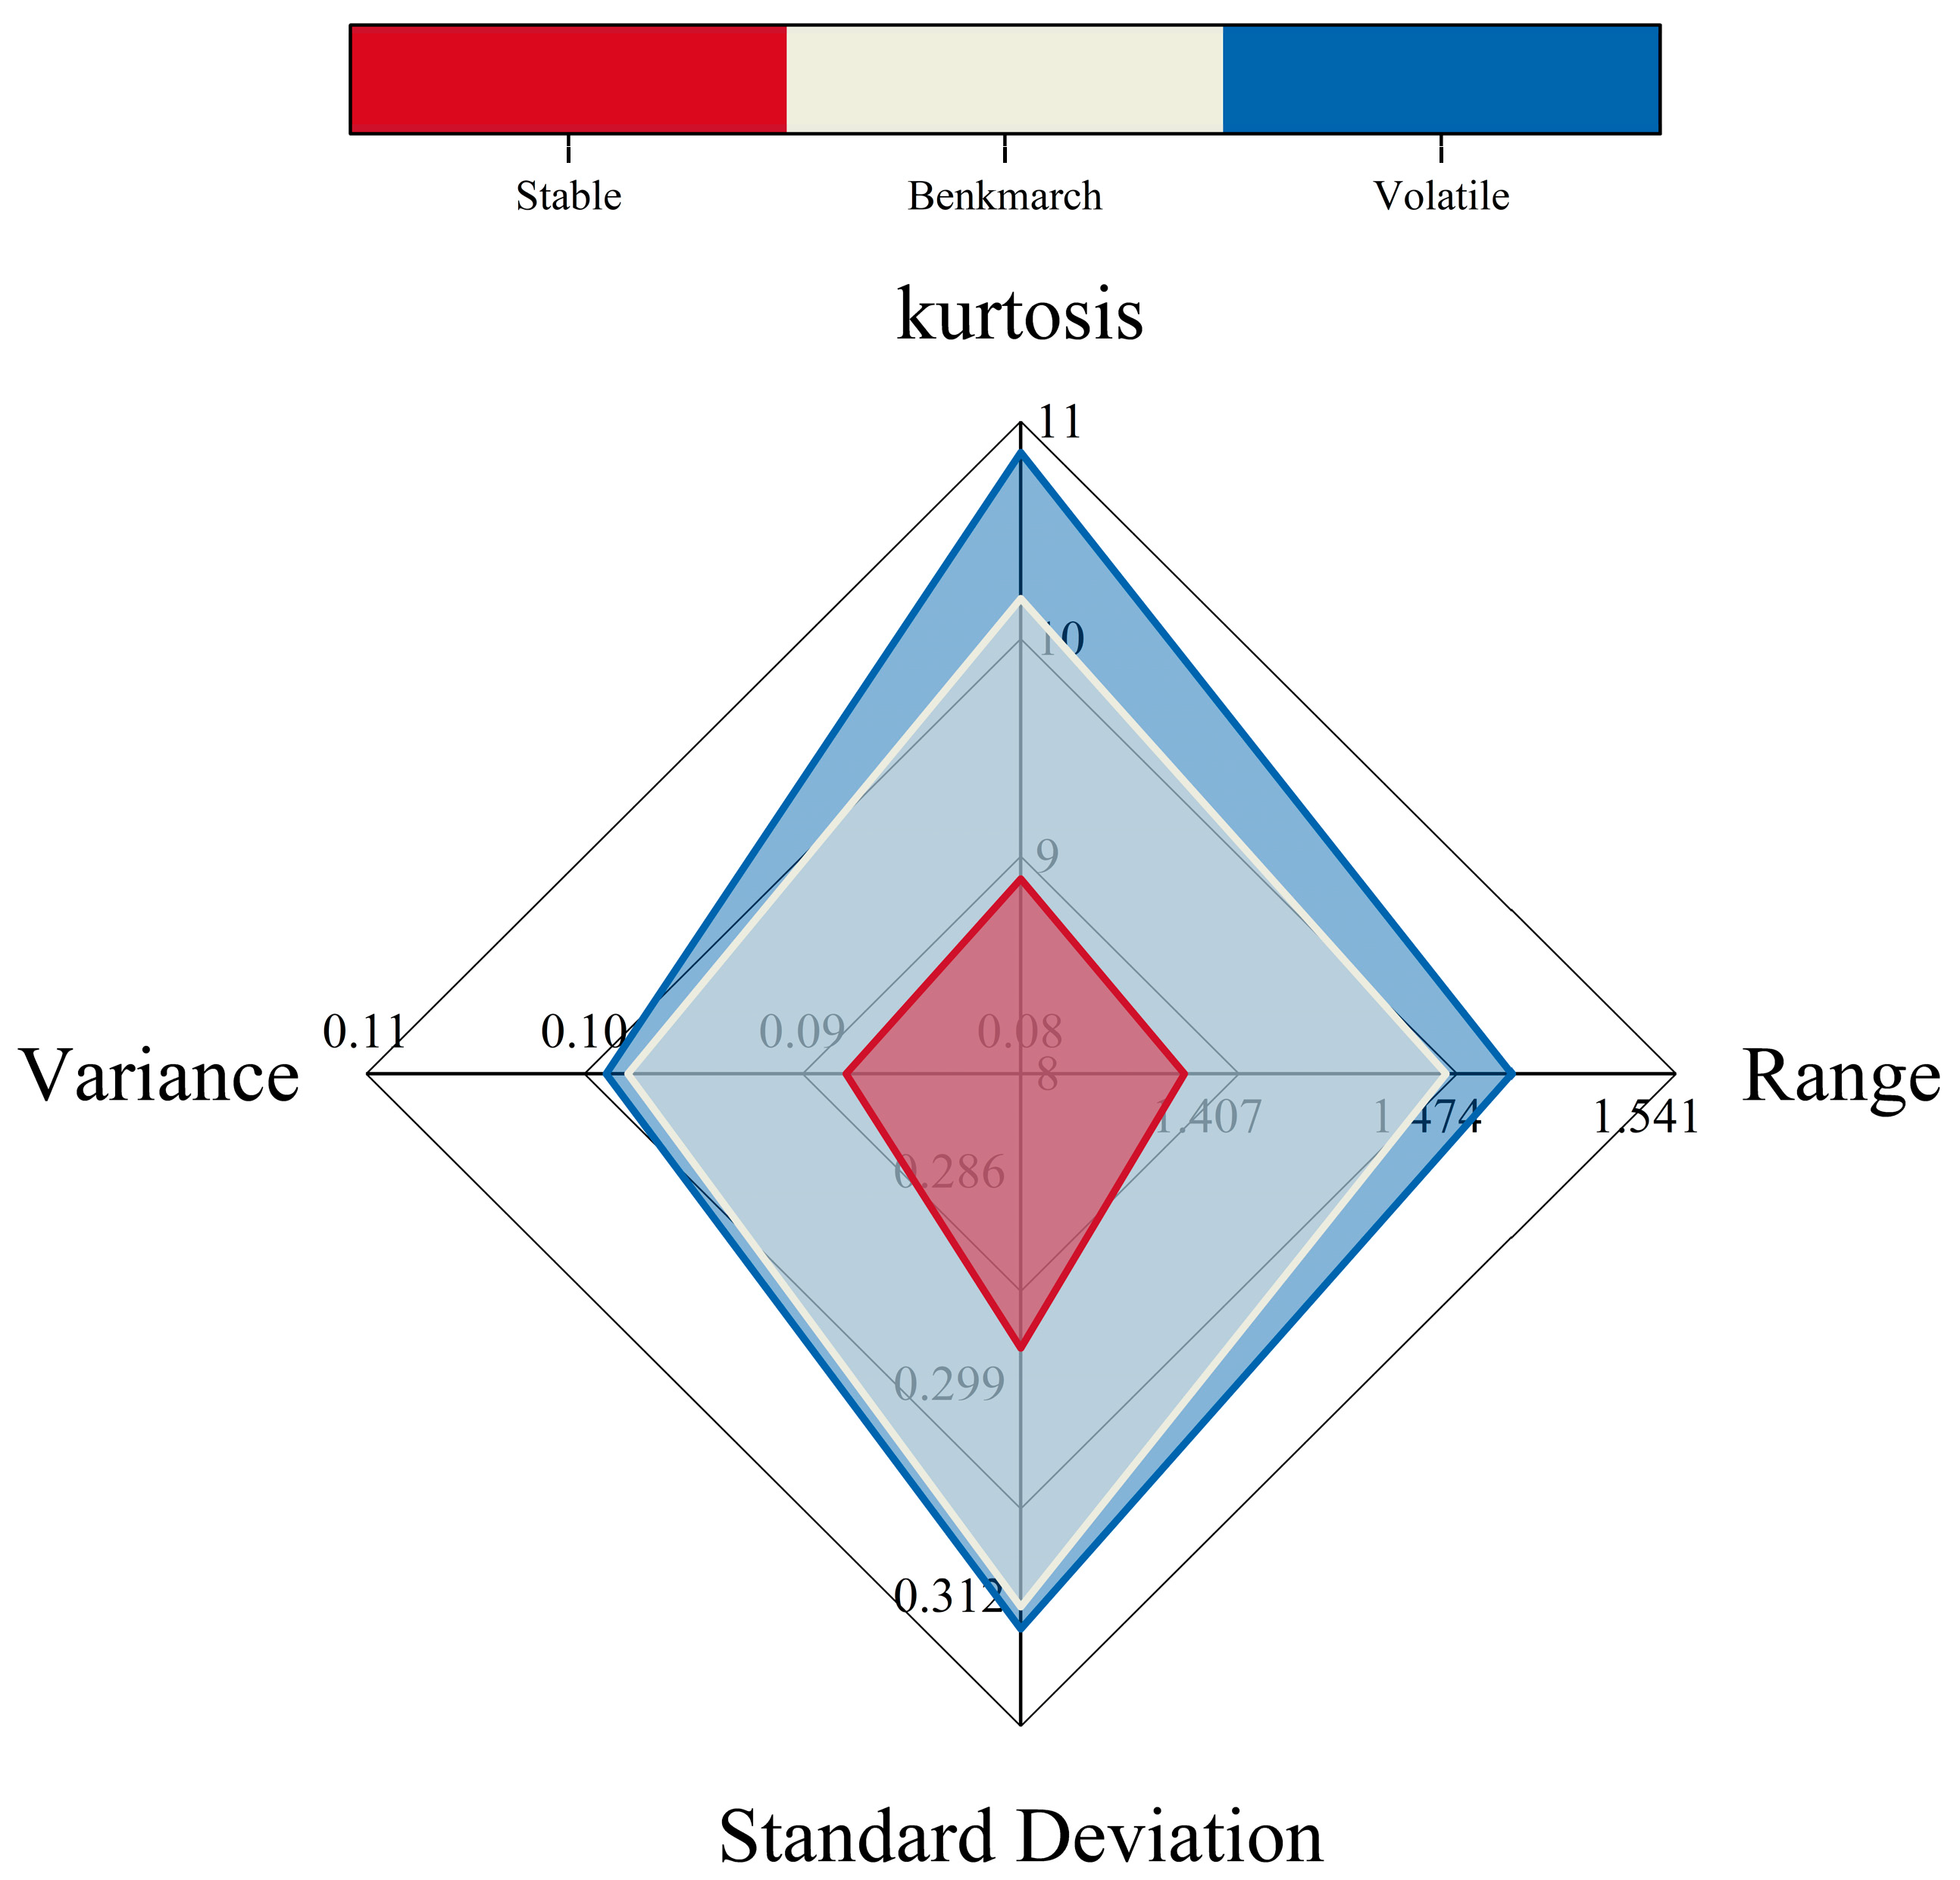
4.2.2. Market Stability Scenario Discussion

In order to study the impact of the international economic development environment on the future development of China’s energy market, this study sets up three stock markets for the Global Stock Index, namely the MSCI World Index and the FTSE 100 Index, namely the trending growth market, the stable market and the trending down market. The benchmark stock market is the stable stock market, and the growth trends of the MSCI World Index and FTSE 100 Index are used to characterize the international economic trends, and the scenarios are set up in this way. The trend growth market assumes a positive international economic trend, rapid economic development, smooth trade flows between countries and a relatively stable market, while the trend decline market assumes a poor international economic environment that limits economic development. In the forecast, the 95% upper confidence limit is taken as the input of the MSCI World Index and FTSE 100 Index in the trending growth market, and the lower confidence limit is the input of the indicator in the trending declining market, resulting in the forecast of the China Energy Stock Price Index for the next three years (Figure 7).
In an upward trending market, China’s energy stock price index shows a certain growth trend, but the growth is not obvious and is more volatile. If the international economic environment shows an upward trend, China’s energy market will also be influenced by it to develop for the better, but this growth will be accompanied by violent fluctuations, and China should pay attention to the regulation of the energy market to avoid the losses caused by such fluctuations. In the downward trending market, the CESI remains at a low level and shows a downward trend. Among them, there will be a sudden drop in the index in the eighth period, after which it will be maintained at this level. Therefore, in the long term, China’s energy market has a strong self-regulation ability, and even if the level of international economic development continues to decline, China’s energy market will not continue to go down. In summary, the trend of the CESI in the next three years is basically consistent with the international economic development trend, but the development of China’s energy market is more stable and will only be impacted in the short term, while there is some stability in the long-term trend.

5. Discussion

5.1. Predictive Efficiency of the Model

The prediction accuracy of BiLSTM models has been verified, but the drawbacks of this approach are also obvious. First, the uninterpretability of the deep learning model still exists. After the VECM model analyzes the indicators, the direction of the impact of each input indicator on the output has been analyzed, and the prediction results also verify that the general trend is consistent with the analysis. However, according to the prediction results of the scenario, the changes in output and input do not show a completely linear relationship, and it is difficult to accurately predict the changes in output from the changes in input, although it is possible to anticipate the future development. Secondly, it was found in the prediction process that the deep learning model training time is long and the training process is unstable, and the luck component is too large to obtain an efficient model architecture. Only by controlling the input metrics in advance can we rationally improve the training efficiency. Finally, due to the uninterpretability of BiLSTM, it is difficult to interfere with the prediction process according to the realistic situation. Although scenario assumptions on the input indicators also reflect part of the problem, such results are not always ideal, and thus it is difficult to use them to make a more comprehensive analysis of the energy market trends. In summary, the prediction performance of BiLSTM models still needs further research, and in the future, we will start from improving the prediction differences of BiLSTM in different scenarios to improve the application value of BiLSTM in realistic scenarios.

5.2. Evaluation of Key Impact Indicators

According to the analysis results of this study, it is clear that the impact of RCPF and GECON on CESI is significant, and CESI is affected by the fluctuation of the two indicators with a lag. Therefore, when forecasting the development trend of China’s energy market, one should pay attention to the value of the indicator, and if the value of this indicator fluctuates significantly, the Chinese government should prepare a response strategy in advance, or even intervene in the energy market, in order to reduce the losses caused by possible energy market shocks. The trend of China’s energy market is consistent with the trend of the MSCI World Index and FTSE 100 Index. The Chinese government can predict the movement of China’s energy stock market based on the international stock market data, so that it can adopt some financial regulation policies to intervene in the development of the energy stock market. Due to the uninterpretability of the deep learning model, this prediction can only be used as a trend prediction and cannot quantify the impact of different indicators on energy indicators in each period.

5.3. Limitations

While this study offers valuable insights, it is important to recognize several limitations. First of all, the analysis is limited by the utilization of monthly data from 2012 to 2021. Although the aggregation of data on a monthly basis facilitates computational efficiency and aligns with macroeconomic reporting cycles, it inherently neglects intra-month volatility resulting from short-term market disturbances, such as unexpected geopolitical events or policy announcements. For example, sudden changes in oil prices or renewable energy subsidies within a given month may have a substantial effect on energy stock indices, yet these fluctuations remain undetected in monthly aggregates. This lack of temporal granularity may diminish the model’s responsiveness to real-time market dynamics, potentially resulting in delayed or muted reactions in forecasts. Then, the VECM framework presumes linear relationships among variables, which may inadequately represent the nonlinear interactions that are often observed in actual energy markets. Geopolitical shocks, such as trade conflicts or sanctions, as well as abrupt changes in the adoption of renewable energy, frequently exhibit threshold effects or asymmetric impacts that linear models are ill-equipped to capture. For instance, a sudden rise in global tensions could disproportionately disrupt energy supply chains, leading to nonlinear spillovers that the current model cannot effectively disentangle.
To mitigate these limitations, future research should focus on two key avenues. First, the integration of renewable energy indices—such as stock prices for solar or wind energy—into the forecasting framework could enhance the model’s relevance in light of the global shift towards sustainable energy. The increasing influence of renewable energy markets on traditional energy sectors, driven by competitive dynamics and policy-related investments, is supported by recent studies on solar-stock volatility spillovers. Incorporating these indices would yield a more comprehensive understanding of the interdependencies within energy markets. Second, applying the model to high-frequency datasets (e.g., daily or hourly data) could enhance its capacity to capture intra-month fluctuations and refine policy responses to short-term risks. However, this approach would necessitate advanced computational resources and effective noise reduction techniques to manage the increased complexity of the data. By addressing these gaps, future research could reconcile theoretical robustness with practical applicability, ultimately facilitating more agile and informed energy policy decisions.

6. Conclusions and Policy Implications

In this study, we propose a new indicator system and a combined model to forecast the Chinese energy market to verify the conjecture that international economic development has an impact on the Chinese energy market and to analyze the way it is influenced. First, using spillover analysis to increase the interpretability of the deep learning model, the VECM model is used to analyze the impact of different indicators on CESI, so as to filter out nine indicators with a greater degree of impact. This approach allows for a figurative analysis of the phenomenon of input indicators affecting output indicators, making it not limited to abstract economic relationships. The degree of impact and lag of each indicator on CESI is also analyzed and applied in the subsequent forecasting, which eliminates the effect of time lag to a certain extent and improves the efficiency of forecasting.
Then, the BiLSTM model was used to forecast CESI, and it was found that the development of energy stock prices in the next three years was more stable, but with a slight downward trend. In order to ensure the reasonableness and scientificity of the prediction results, mechanical learning and deep learning models were also selected for comparison, and by comparing the evaluation indexes of each model, it was concluded that the VECM-BiLSTM model has higher prediction accuracy.
Finally, by simulating different international economic conditions with disturbances in the input indicators, the impact of international economic environment shocks and international economic development on the Chinese stock market is analyzed based on the forecast results of different scenarios, thus proving that the international economic environment can disturb the development of the Chinese stock market. The international economic environment shocks the Chinese energy market and the degree of volatility remains largely consistent with GECON and RCPF. International economic developments will have an impact on China’s energy market. The MSCI World Index and FTSE 100 Index can be used to forecast trends in China’s energy market and use the lag of its impact to avoid possible economic and energy problems resulting from a depressed or rapidly growing energy market.
In conclusion, this study concludes that the international economic environment has an impact on the Chinese energy market and that some international economic indicators can be used to forecast the development of the Chinese energy market, while spillover analysis can be used to provide some explanations for the deep learning model and to improve the efficiency of forecasting. This is valuable for the state to control the energy market and formulate relevant policies.
As the previous analysis has shown, government support will have a strong impact on the Energy Stock Price Index. In order to realize the dynamic optimization of the energy governance system and the improvement of risk prevention and control ability, at the short-term operation level, it is suggested to build a multi-dimensional visualization platform of RCPF (regional carbon peak prediction) and GECON (Energy consumption Network) based on a real-time data monitoring system. By integrating machine learning algorithms and outlier detection technology, key signals such as energy supply and demand fluctuations and carbon emission trajectory offset can be captured in time, so as to establish a dynamic adjustment mechanism for the policy toolbox, effectively responding to regional energy imbalance and market transaction risks. At the level of long-term institutional design, it advocates the strategic coupling of China’s energy policy system with the environmental and social governance (ESG) standards of MSCI and FTSE Global Capital market indexes, focusing on the establishment of policy benchmarking systems in such areas as carbon pricing mechanisms, green financial product innovation, and renewable energy investment evaluation. This dual-track and parallel governance model can not only resolve short-term market fluctuations through real-time response mechanisms, but also form an institutional buffer belt through the integration of international standards, and ultimately achieve the triple goals of improving the resilience of energy policies, enhancing the voice of international energy, and coordinated development of global climate governance.

Author Contributions

Conceptualization, X.W.; Methodology, B.L.; Software, Y.G.; Validation, M.X.; Formal analysis, X.Z.; Resources, Y.G. and X.W.; Writing—original draft, X.Z.; Writing—review & editing, X.Z. and M.X.; Visualization, X.Z.; Supervision, B.L.; Project administration, X.W. All authors have read and agreed to the published version of the manuscript.

Funding

This research received no external funding.

Data Availability Statement

The data underlying this article are available on the National Bureau of Statistics and Investing websites https://data.stats.gov.cn/index.htm and https://cn.investing.com, accessed on 11 May 2023, respectively.

Conflicts of Interest

Author Yuan Gao was employed by the company Xinhua Electric Power Development Investment Co., Ltd. Author Minghui Xu was employed by the company China Energy Engineering Group Tianjin Electric Power Design Institute Co., Ltd. The remaining authors declare that the research was conducted in the absence of any commercial or financial relationships that could be construed as a potential conflict of interest.

References

  1. Lin, Y.; Lu, Q.; Tan, B.; Yu, Y. Forecasting energy prices using a novel hybrid model with variational mode decomposition. Energy 2022, 246, 123366. [Google Scholar] [CrossRef]
  2. Atems, B.; Mette, J.; Lin, G.; Madraki, G. Estimating and forecasting the impact of nonrenewable energy prices on US renewable energy consumption. Energy Policy 2023, 173, 113374. [Google Scholar] [CrossRef]
  3. Maghyereh, A.; Boulanouar, Z.; Essid, L. The dynamics of green innovation and environmental policy stringency in energy transition investments. J. Clean Prod. 2025, 487, 144649. [Google Scholar] [CrossRef]
  4. Xu, X.; Zhang, Y. China mainland new energy index price forecasting with the neural network. Energy Nexus. 2023, 10, 100210. [Google Scholar] [CrossRef]
  5. Xia, D.; Yang, N.; Jian, S.; Hu, Y.; Li, H. SW-BiLSTM: A Spark-based weighted BiLSTM model for traffic flow forecasting. Multimed. Tools Appl. 2022, 81, 23589–23614. [Google Scholar] [CrossRef]
  6. Ju, K.; Su, B.; Zhou, D.; Wu, J. Does energy-price regulation benefit China's economy and environment? Evidence from energy-price distortions. Energy Policy 2017, 105, 108–119. [Google Scholar] [CrossRef]
  7. Chen, Z.-M.; Chen, P.-L.; Ma, Z.; Xu, S.; Hayat, T.; Alsaedi, A. Inflationary and distributional effects of fossil energy price fluctuation on the Chinese economy. Energy 2019, 187, 115974. [Google Scholar] [CrossRef]
  8. Zhang, X.; Zhou, J.; Du, X. Impact of oil price uncertainty shocks on China’s macro-economy. Resour. Policy 2022, 79, 103080. [Google Scholar] [CrossRef]
  9. Nonejad, N. Forecasting crude oil price volatility out-of-sample using news-based geopolitical risk index: What forms of nonlinearity help improve forecast accuracy the most? Financ. Res. Lett. 2022, 46, 102310. [Google Scholar] [CrossRef]
  10. Ashfaq, S.; Tang, Y.; Maqbool, R. Volatility spillover impact of world oil prices on leading Asian energy exporting and importing economies’ stock returns. Energy 2019, 188, 116002. [Google Scholar] [CrossRef]
  11. Jia, Z.; Wen, S.; Lin, B. The effects and reacts of COVID-19 pandemic and international oil price on energy, economy, and environment in China. Appl. Energy 2021, 302, 117612. [Google Scholar] [CrossRef]
  12. Sadorsky, P. Forecasting solar stock prices using tree-based machine learning classification: How important are silver prices? N. Am. J. Econ. Financ. 2022, 61, 101705. [Google Scholar] [CrossRef]
  13. Zhang, L.; Wang, L.; Peng, L.; Luo, K. Measuring the response of clean energy stock price volatility to extreme shocks. Renew. Energy 2023, 206, 1289–1300. [Google Scholar] [CrossRef]
  14. Li, J.; Umar, M.; Huo, J. The spillover effect between Chinese crude oil futures market and Chinese green energy stock market. Energy Econ. 2023, 119, 106568. [Google Scholar] [CrossRef]
  15. Meng, A.; Wang, P.; Zhai, G.; Zeng, C.; Chen, S.; Yang, X.; Yin, H. Electricity price forecasting with high penetration of renewable energy using attention-based LSTM network trained by crisscross optimization. Energy 2022, 254, 124212. [Google Scholar] [CrossRef]
  16. Wang, K.; Yu, M.; Niu, D.; Liang, Y.; Peng, S.; Xu, X. Short-term electricity price forecasting based on similarity day screening, two-layer decomposition technique and Bi-LSTM neural network. Appl. Soft Comput. 2023, 136, 110018. [Google Scholar] [CrossRef]
  17. Iwabuchi, K.; Kato, K.; Watari, D.; Taniguchi, I.; Catthoor, F.; Shirazi, E.; Onoye, T. Flexible electricity price forecasting by switching mother wavelets based on wavelet transform and Long Short-Term Memory. Energy AI 2022, 10, 100192. [Google Scholar] [CrossRef]
  18. Xiong, X.; Qing, G. A hybrid day-ahead electricity price forecasting framework based on time series. Energy 2023, 264, 126099. [Google Scholar] [CrossRef]
  19. de Oliveira, E.M.; Cyrino Oliveira, F.L. Forecasting mid-long term electric energy consumption through bagging ARIMA and exponential smoothing methods. Energy 2018, 144, 776–788. [Google Scholar] [CrossRef]
  20. Fan, D.; Sun, H.; Yao, J.; Zhang, K.; Yan, X.; Sun, Z. Well production forecasting based on ARIMA-LSTM model considering manual operations. Energy 2021, 220, 119708. [Google Scholar] [CrossRef]
  21. Wang, X. Research on the prediction of per capita coal consumption based on the ARIMA–BP combined model. Energy Rep. 2022, 8, 285–294. [Google Scholar] [CrossRef]
  22. Chiu, F.-P.; Hsu, C.-S.; Ho, A.; Chen, C.-C. Modeling the price relationships between crude oil, energy crops and biofuels. Energy 2016, 109, 845–857. [Google Scholar] [CrossRef]
  23. Yu, L.; Zhang, X.; Wang, S. Assessing Potentiality of Support Vector Machine Method in Crude Oil Price Forecasting. EURASIA J. Math. Sci. Technol. Educ. 2017, 13, 7893–7904. [Google Scholar] [CrossRef] [PubMed]
  24. Liu, J.; Hu, Y.; Yan, L.-Z.; Chang, C.-P. Volatility spillover and hedging strategies between the European carbon emissions and energy markets. Energy Strategy Rev. 2023, 46, 101058. [Google Scholar] [CrossRef]
  25. Singh, S.; Bansal, P.; Hosen, M.; Bansal, S.K. Forecasting annual natural gas consumption in USA: Application of machine learning techniques-ANN and SVM. Resour. Policy 2023, 80, 103159. [Google Scholar] [CrossRef]
  26. Bristone, M.; Prasad, R.; Abubakar, A.A. CPPCNDL: Crude oil price prediction using complex network and deep learning algorithms. Petroleum 2020, 6, 353–361. [Google Scholar] [CrossRef]
  27. Jiang, H.; Hu, W.; Xiao, L.; Dong, Y. A decomposition ensemble based deep learning approach for crude oil price forecasting. Resour. Policy 2022, 78, 102855. [Google Scholar] [CrossRef]
  28. Zargarnezhad, S.; Dashti, R.; Ahmadi, R. Predicting vehicle fuel consumption in energy distribution companies using ANNs. Transp. Res. Part D Transp. Environ. 2019, 74, 174–188. [Google Scholar] [CrossRef]
  29. Guo, J.; Zhao, Z.; Sun, J.; Sun, S. Multi-perspective crude oil price forecasting with a new decomposition-ensemble framework. Resour. Policy 2022, 77, 102737. [Google Scholar] [CrossRef]
  30. Wang, Y.; Zhang, Y.; Nie, R.; Chi, P.; He, X.; Zhang, L. A novel fractional grey forecasting model with variable weighted buffer operator and its application in forecasting China's crude oil consumption. Petroleum 2022, 8, 139–157. [Google Scholar] [CrossRef]
  31. Wu, C.; Wang, J.; Hao, Y. Deterministic and uncertainty crude oil price forecasting based on outlier detection and modified multi-objective optimization algorithm. Resour. Policy 2022, 77, 102780. [Google Scholar] [CrossRef]
  32. Busari, G.A.; Lim, D.H. Crude oil price prediction: A comparison between AdaBoost-LSTM and AdaBoost-GRU for improving forecasting performance. Comput. Chem. Eng. 2021, 155, 107513. [Google Scholar] [CrossRef]
  33. Wang, L.; Wu, J.; Cao, Y.; Hong, Y. Forecasting renewable energy stock volatility using short and long-term Markov switching GARCH-MIDAS models: Either, neither or both? Energy Econ. 2022, 111, 106056. [Google Scholar] [CrossRef]
  34. Ying, C.; Wang, W.; Yu, J.; Li, Q.; Yu, D.; Liu, J. Deep learning for renewable energy forecasting: A taxonomy, and systematic literature review. J. Clean. Prod. 2023, 384, 135414. [Google Scholar] [CrossRef]
  35. Barredo Arrieta, A.; Díaz-Rodríguez, N.; Del Ser, J.; Bennetot, A.; Tabik, S.; Barbado, A.; Garcia, S.; Gil-Lopez, S.; Molina, D.; Benjamins, R.; et al. Explainable Artificial Intelligence (XAI): Concepts, taxonomies, opportunities and challenges toward responsible AI. Inf. Fusion 2020, 58, 82–115. [Google Scholar] [CrossRef]
  36. Zhong, B. Deep learning integration optimization of electric energy load forecasting and market price based on the ANN–LSTM–transformer method. Front. Energy Res. 2023, 11, 1292204. [Google Scholar] [CrossRef]
  37. Zhang, X.; Zong, Y.; Du, P.; Wang, S.; Wang, J. Framework for multivariate carbon price forecasting: A novel hybrid model. J. Environ. Manag. 2024, 369, 122275. [Google Scholar] [CrossRef]
  38. Ghallabi, F.; Souissi, B.; Du, A.M.; Ali, S. ESG stock markets and clean energy prices prediction: Insights from advanced machine learning. Int. Rev. Financ. Anal. 2025, 97, 103889. [Google Scholar] [CrossRef]
  39. Wang, J.; Hou, R.; Wang, C.; Shen, L. Improved v-Support vector regression model based on variable selection and brain storm optimization for stock price forecasting. Appl. Soft Comput. 2016, 49, 164–178. [Google Scholar] [CrossRef]
  40. Zhou, W.; Chen, Y.; Chen, J. Risk spread in multiple energy markets: Extreme volatility spillover network analysis before and during the COVID-19 pandemic. Energy 2022, 256, 124580. [Google Scholar] [CrossRef]
  41. Gong, X.; Shi, R.; Xu, J.; Lin, B. Analyzing spillover effects between carbon and fossil energy markets from a time-varying perspective. Appl. Energy 2021, 285, 116384. [Google Scholar] [CrossRef]
  42. Inoue, A.; Kilian, L. Joint Bayesian inference about impulse responses in VAR models. J. Econom. 2022, 231, 457–476. [Google Scholar] [CrossRef]
  43. Urolagin, S.; Sharma, N.; Datta, T.K. A combined architecture of multivariate LSTM with Mahalanobis and Z-Score transformations for oil price forecasting. Energy 2021, 231, 120963. [Google Scholar] [CrossRef]
  44. Min, Y.; Shuzhen, Z.; Wuwei, L. Carbon price prediction based on multi-factor MEEMD-LSTM model. Heliyon 2022, 8, e12562. [Google Scholar] [CrossRef] [PubMed]
  45. Yildirim, O. A novel wavelet sequence based on deep bidirectional LSTM network model for ECG signal classification. Comput. Biol. Med. 2018, 96, 189–202. [Google Scholar] [CrossRef]
  46. Zeng, Y.-R.; Zeng, Y.; Choi, B.; Wang, L. Multifactor-influenced energy consumption forecasting using enhanced back-propagation neural network. Energy 2017, 127, 381–396. [Google Scholar] [CrossRef]
  47. Guo, Y.; Ma, F.; Li, H.; Lai, X. Oil price volatility predictability based on global economic conditions. Int. Rev. Financ. Anal. 2022, 82, 102195. [Google Scholar] [CrossRef]
  48. Zhang, Y.-J.; Wang, J.-L. Do high-frequency stock market data help forecast crude oil prices? Evidence from the MIDAS models. Energy Econ. 2019, 78, 192–201. [Google Scholar] [CrossRef]
  49. Li, J.; Liu, R.; Yao, Y.; Xie, Q. Time-frequency volatility spillovers across the international crude oil market and Chinese major energy futures markets: Evidence from COVID-19. Resour. Policy 2022, 77, 102646. [Google Scholar] [CrossRef]
  50. Sadeghi, A.; Roudari, S. Heterogeneous effects of oil structure and oil shocks on stock prices in different regimes: Evidence from oil-exporting and oil-importing countries. Resour. Policy 2022, 76, 102596. [Google Scholar] [CrossRef]
  51. Pan, X.-Z.; Ma, X.-R.; Wang, L.-N.; Lu, Y.-C.; Dai, J.-Q.; Li, X. Spillover of international crude oil prices on China’s refined oil wholesale prices and price forecasting: Daily-frequency data of private enterprises and local refineries. Pet. Sci. 2022, 19, 1433–1442. [Google Scholar] [CrossRef]
Figure 1. Basic structure of the BiLSTM network.
Energies 18 01242 g001
Figure 2. Results of spillover effect analysis.
Energies 18 01242 g002
Figure 3. Prediction performance of VECM-BiLSTM model and other models.
Energies 18 01242 g003
Figure 4. Comparison of the true value with the 95% confidence interval of the predicted value.
Energies 18 01242 g004
Figure 5. CESI predication of next three years.
Energies 18 01242 g005
Figure 6. CESI volatility evaluation index.
Energies 18 01242 g006
Figure 7. CESI predication of next three years under Three Scenarios.
Energies 18 01242 g007
Table 1. Typical MAPE values for accuracy evaluation.
MAPE (%)Prediction Classes
10%High accuracy
10% < MAPE < 20%Good
20% < MAPE < 50%Reasonable
>50%Inaccurate
Table 2. Descriptive statistics.
Indicator CategoryIndicatorMinimumMaximumMeanStandard ErrorSkewnessKurtosisADF
Global Economic ActivityWIP83.4000107.30100.91253.8220−1.1343.4060.0932 *
RCPF−0.80720.92710.00430.35900.0920−0.39300.0000 *
GECON−4.23571.36160.01080.5767−4.628031.70300.0000 *
Global Energy ActualityOil Supply Shocks−10.62613.1544−0.10991.5027−2.829019.42200.0000 *
Oil Inventory Demand Shocks−2.00912.69310.34621.10890.0550−0.53700.0000 *
WTI8.6200107.770064.935723.44120.1400−0.67500.2236 *
Brent Oil22.7400122.880072.296625.61520.4290−0.99600.5893 *
Global Stock IndexS&P 500 Index1310.33004766.18002477.8241829.13140.88500.31900.1373 *
MSCI World Index26.9400664.8800163.0448161.13201.53901.59000.9822 *
FTSE 100 Index5320.86007748.76006715.2183582.4066−0.3030−0.79500.3371 *
AXP Index50.1400173.780092.221828.73301.02800.80700.0721 *
China‘s Energy ActualityDiesel Output1179.30001686.20001436.134294.4273−0.32400.40800.0010 *
Crude Output1517.60001832.30001670.263380.82070.2100−0.95700.9304 *
Gasoline Output692.00001374.20001038.9183169.1628−0.3240−0.73100.1850 *
CESI4.917509.802506.79461.00650.4770.2090.4493 *
Notes: * indicates the p-value of standard unit root tests. ADF (augmented Dickey–Fuller) is a standard unit root test.
Table 3. The parameter combinations of batch size and epochs (%).
050100150200250300350400450
20.07330.36630.21980.07330.07330.21980.07330.07330.07330.2930
40.14650.00000.07330.14650.21980.14650.14650.14650.14650.0733
60.51280.07330.51280.51280.43960.51280.29300.07330.51280.5128
80.07330.07330.07330.07330.07330.07330.07330.21980.07330.0733
100.29300.14650.29300.29300.29300.29300.29300.29300.29300.2930
120.07330.07330.00000.14650.07330.00000.07330.00000.07330.0000
140.07330.07330.07330.07330.00000.07330.07330.07330.07330.0733
160.07330.07330.07330.07330.07330.07330.07330.07330.07330.0733
180.07336.00730.07330.07330.07330.07331.17220.07330.07330.0733
200.659310.54951.09890.07331.02566.30045.93410.07331.17220.0733
2210.47626.73996.15381.17226.88641.17226.73991.75820.073310.1832
2410.32979.67031.025610.25649.96349.81689.963410.549510.62279.5238
269.963410.622710.622710.549510.036610.622710.622710.622710.622710.6227
2810.549510.622710.622710.622710.622710.622710.622710.622710.622710.6227
3010.622710.622710.622710.622710.622710.622710.622710.622710.622710.6227
Table 4. Unrestricted cointegration rank test.
Hypothesized No. of CE(s)EigenvalueTraceMaximum Eigenvalue
Trace Statistic0.05 Critical ValueProb. **Max-Eigen Statistic0.05 Critical ValueProb. **
None *0.31340773.5623047.856130.000043.993527.58430.0002
At most 10.12078229.5687529.797070.053115.060421.13160.2847
At most 20.10679114.5082615.494710.070013.213314.26460.0728
At most 30.0110061.2948813.8414650.25511.29483.84140.2551
Notes: * denotes rejection of the hypothesis at the 0.05 level. ** MacKinnon–Haug–Michelis (1999) p-values.
Table 5. Unrestricted cointegration rank test.
Hypothesized No. of CE(s)EigenvalueTraceMaximum Eigenvalue
Trace Statistic0.05 Critical ValueProb. **Max-Eigen Statistic0.05 Critical ValueProb. **
None *0.400745121.933369.818890.000059.9119333.876870.0000
At most 1 *0.25620362.0213547.856130.001434.6304727.584340.0053
At most 20.14378727.3908829.797070.092418.1625821.131620.1239
At most 30.0554269.22829315.494710.34476.67145114.264600.5287
At most 40.0216162.5568423.8414650.10982.5568423.8414650.1098
Notes: * denotes rejection of the hypothesis at the 0.05 level. ** MacKinnon–Haug–Michelis (1999) p-values.
Table 6. Unrestricted cointegration rank test.
Hypothesized No. of CE(s)EigenvalueTraceMaximum Eigenvalue
Trace Statistic0.05
Critical Value
Prob. **Max-Eigen Statistic0.05
Critical Value
Prob. **
None *0.30474286.9907269.818890.001240.7088733.876870.0066
At most 10.15824946.2818547.856130.069819.2943627.584340.3921
At most 20.13491626.9874929.797070.101916.2320221.131620.2116
At most 30.06498410.7554715.494710.22707.52545914.264600.4290
At most 40.0284273.2300113.8414650.07233.2300113.8414650.0723
Notes: * denotes rejection of the hypothesis at the 0.05 level. ** MacKinnon-Haug-Michelis (1999) p-values.
Table 7. Comparison of prediction performances using deep learning models.
ModelMAEMAPERMSE
BiLSTM0.22043.28640.3238
LSTM0.24513.68760.3342
GRU0.34424.96680.4995
SVR0.36255.44210.4372
MLR0.44416.56980.4995
VECM-BiLSTM0.20693.12650.3147
VECM-LSTM0.24223.57040.3529
VECM-GRU0.32184.60040.4882
VECM-SVR0.35375.27830.4209
VECM-MLR0.41886.15780.5289
Disclaimer/Publisher’s Note: The statements, opinions and data contained in all publications are solely those of the individual author(s) and contributor(s) and not of MDPI and/or the editor(s). MDPI and/or the editor(s) disclaim responsibility for any injury to people or property resulting from any ideas, methods, instructions or products referred to in the content.

