Article

Combined Scheduling and Configuration Optimization of Power-to-Methanol System Considering Feedback Control of Thermal Power

1
Beijing Key Laboratory of Demand Side Multi-Energy Carriers Optimization and Interaction Technique, Beijing 100192, China
2
National Engineering Research Center of Power Generation Control and Safety, School of Energy and Environment, Liyang Research Institute of Southeast University, Liyang 213300, China
*
Author to whom correspondence should be addressed.
Energies 2025, 18(5), 1210; https://doi.org/10.3390/en18051210
Submission received: 26 December 2024 / Revised: 12 February 2025 / Accepted: 19 February 2025 / Published: 1 March 2025
(This article belongs to the Topic Multi-Energy Systems, 2nd Edition)

Abstract

:
A power-to-methanol (P2M) system is a promising energy storage approach in transforming surplus renewable energy into a chemical product while utilizing the captured CO2 from conventional thermal power units. Most of the traditional methods for the optimal configuration of IES use the steady-state model of the equipment, while ignoring the dynamic deviation of the thermal power unit under variable operating conditions. This study enhances the steady-state model of the P2M system by incorporating feedback-based dynamic control for the thermal power generation (TPG) unit. A closed-loop state-space model of the TPG unit is introduced as an additional constraint within the optimization framework. Furthermore, a dynamic deviation index for the TPG unit is formulated and integrated into a mixed-integer linear programming (MILP) model. Together with the system’s annual operating cost over its life cycle, this index constitutes an objective function, aiming to minimize both the dynamic deviations and operating costs, thereby optimizing the capacity configuration of the P2M system’s components. The optimal results indicate that in the dynamic configuration, the hydrogen storage tank capacity increases by 94.73% and the electrolyzer capacity remains almost consistent, which shows the energy storage potential of the P2M. The optimized scheduling results show that the electrolyzer can effectively absorb the intermittency of renewable energy. This method of dynamic configuration planning can effectively suppress the thermal power unit output fluctuation, smooth the schedule curve, and realize the effect of peak shaving and valley filling.

1. Introduction

In the past decades, energy demand has shown a growing trend due to increased urbanization and industrialization. In this process, thermal power generation constitutes an important part of the world’s energy structure and maintains a high level of installed capacity [1]. However, the challenge of carbon dioxide emissions from traditional thermal power generation (TPG) has become a critical issue. At the same time, the varying effectiveness of renewable energy sources compels society to seek cleaner and more efficient ways of using energy [2]. The power-to-methanol (P2M) system integrates renewable energy generation, wherein carbon capture systems synthesize high-value chemical products (methane, methanol, ammonia, etc.) by utilizing CO2 emissions from thermal power generation units and electrolyzing water with hydrogen produce through water electrolysis by renewable energy [3].
Power-to-chemical (P2X) technology involves energy conversion as well as spatial and temporal translation [4] and can be applied as a new form of energy storage in an integrated energy system (IES). A study by Turk et al. [5] has shown that the IES, after employing the power-to-chemical technology and a thermal storage device, can balance the multiple uncertainties in the operation of the system. As for the selection of a configuration optimization scheme for an IES, Yang et al. [6] developed a reasonable configuration scheme to achieve the regional carbon neutrality goal by deploying a direct air carbon capture (DAC) system into an IES. Guo et al. [7] introduced photovoltaic and wind power generation in a regional IES consisting of adjacent near-zero-energy buildings, adopting a two-layer synergistic optimization approach to effectively reduce the operational energy consumption of the RIES. In order to effectively reduce the total operating cost of the IES, most of the IES configuration schemes introduce renewable energy generation with a lower kWh cost [8] in combination with multiple energy storage devices. Therefore, in the study in this paper, the P2M system is constructed by integrating wind power generation, power-to-chemical technology, and post-combustion carbon capture (PCC). However, due to the stochasticity and uncertainty of the renewable energy output [9], the thermal unit in the P2M system needs to continuously adjust the output of the unit as a way of meeting the energy supply–demand balance in the P2M system.
In terms of the research on optimization and configuration methods, Qiao et al. [10] proposed a multi-objective optimization model that simultaneously considered economic, energy, and environmental benefits, based on the energy hub model, by considering the effects of energy equipment types and combination configurations. Gao et al. [11] constructed a multi-timescale capacity allocation model for the volatility of renewable energy sources and the load demand of users in the regional integrated energy system (RIES), and proposed a capacity allocation method for a multi-unit hybrid energy storage system, which reduced the investment cost of energy storage applications in the RIES. Yang et al. [12] focused on the aspect of heat in the P2G process that has been neglected by other researchers, proposed an improved IES, and considered the gradient penalty of carbon emissions in the establishment of the optimization objective. The improved honey badger algorithm (IHBA) was used to solve the configuration problem, and the optimization resulted in a 26.43% reduction in the total annual operating cost compared to a separate methane production system. Zhang et al. [13] argued that a large number of IES accesses will make the peak–valley difference of the grid larger, and proposed an optimal configuration method considering the peak–valley difference of the tie line between the IES and power grid, taking the annual operating cost of the grid and the annual operating cost of the IES as the objective function. The sum of the annual operating cost of the grid and the IES was used as the objective function, and the effectiveness of the method was verified using the improved IEEE30 node system.
In the above studies of IES optimal configuration, the effects of various factors on the optimal configuration results were analyzed from different perspectives. However, fewer of them considered the dynamic deviation caused by the transition process under the variable operating conditions of TPG. For the electrification equipment, the dynamic characteristics of the equipment can be neglected, but the TPG is a kind of equipment with thermal inertia that highly integrates the heat transfer process and the flow process, and the coupling between the actual output of the equipment and its characteristic parameters is extremely complex [14] and the dynamic deviation cannot be neglected. Li et al. [15], in the scheduling optimization of an IES, divide the equipment into fast-response equipment and slow-response equipment, ignore the dynamic process of fast-response equipment, mainly focus on the dynamic process of slow-response equipment, propose the dynamic deviation index, and convert it to the objective function to optimize the scheduling instructions for the IES. Similarly, the literature [16] takes the slower dynamic response device as the main device, introduces the closed-loop state-space model as a constraint, and constructs a mixed-integer linear programming problem to optimize the day-ahead scheduling of the micro gas turbine-based integrated energy system (MGT-IES). The studies on the dynamic characteristics of an IES in the above literature provide theoretical references for solving the dynamic deviation of the thermal power unit in a P2M system.
This paper develops a dynamic model of the thermal power generation unit to construct an integrated system combining power-to-chemical technology and post-combustion carbon capture technology. This study formulates a mixed-integer linear programming model to optimize the capacity configuration of each device in the P2M system. The objective is to minimize the system’s annual operating costs over its lifecycle while reducing the dynamic fluctuations of the thermal power generation unit. The main contributions of this paper are as follows:
(1)
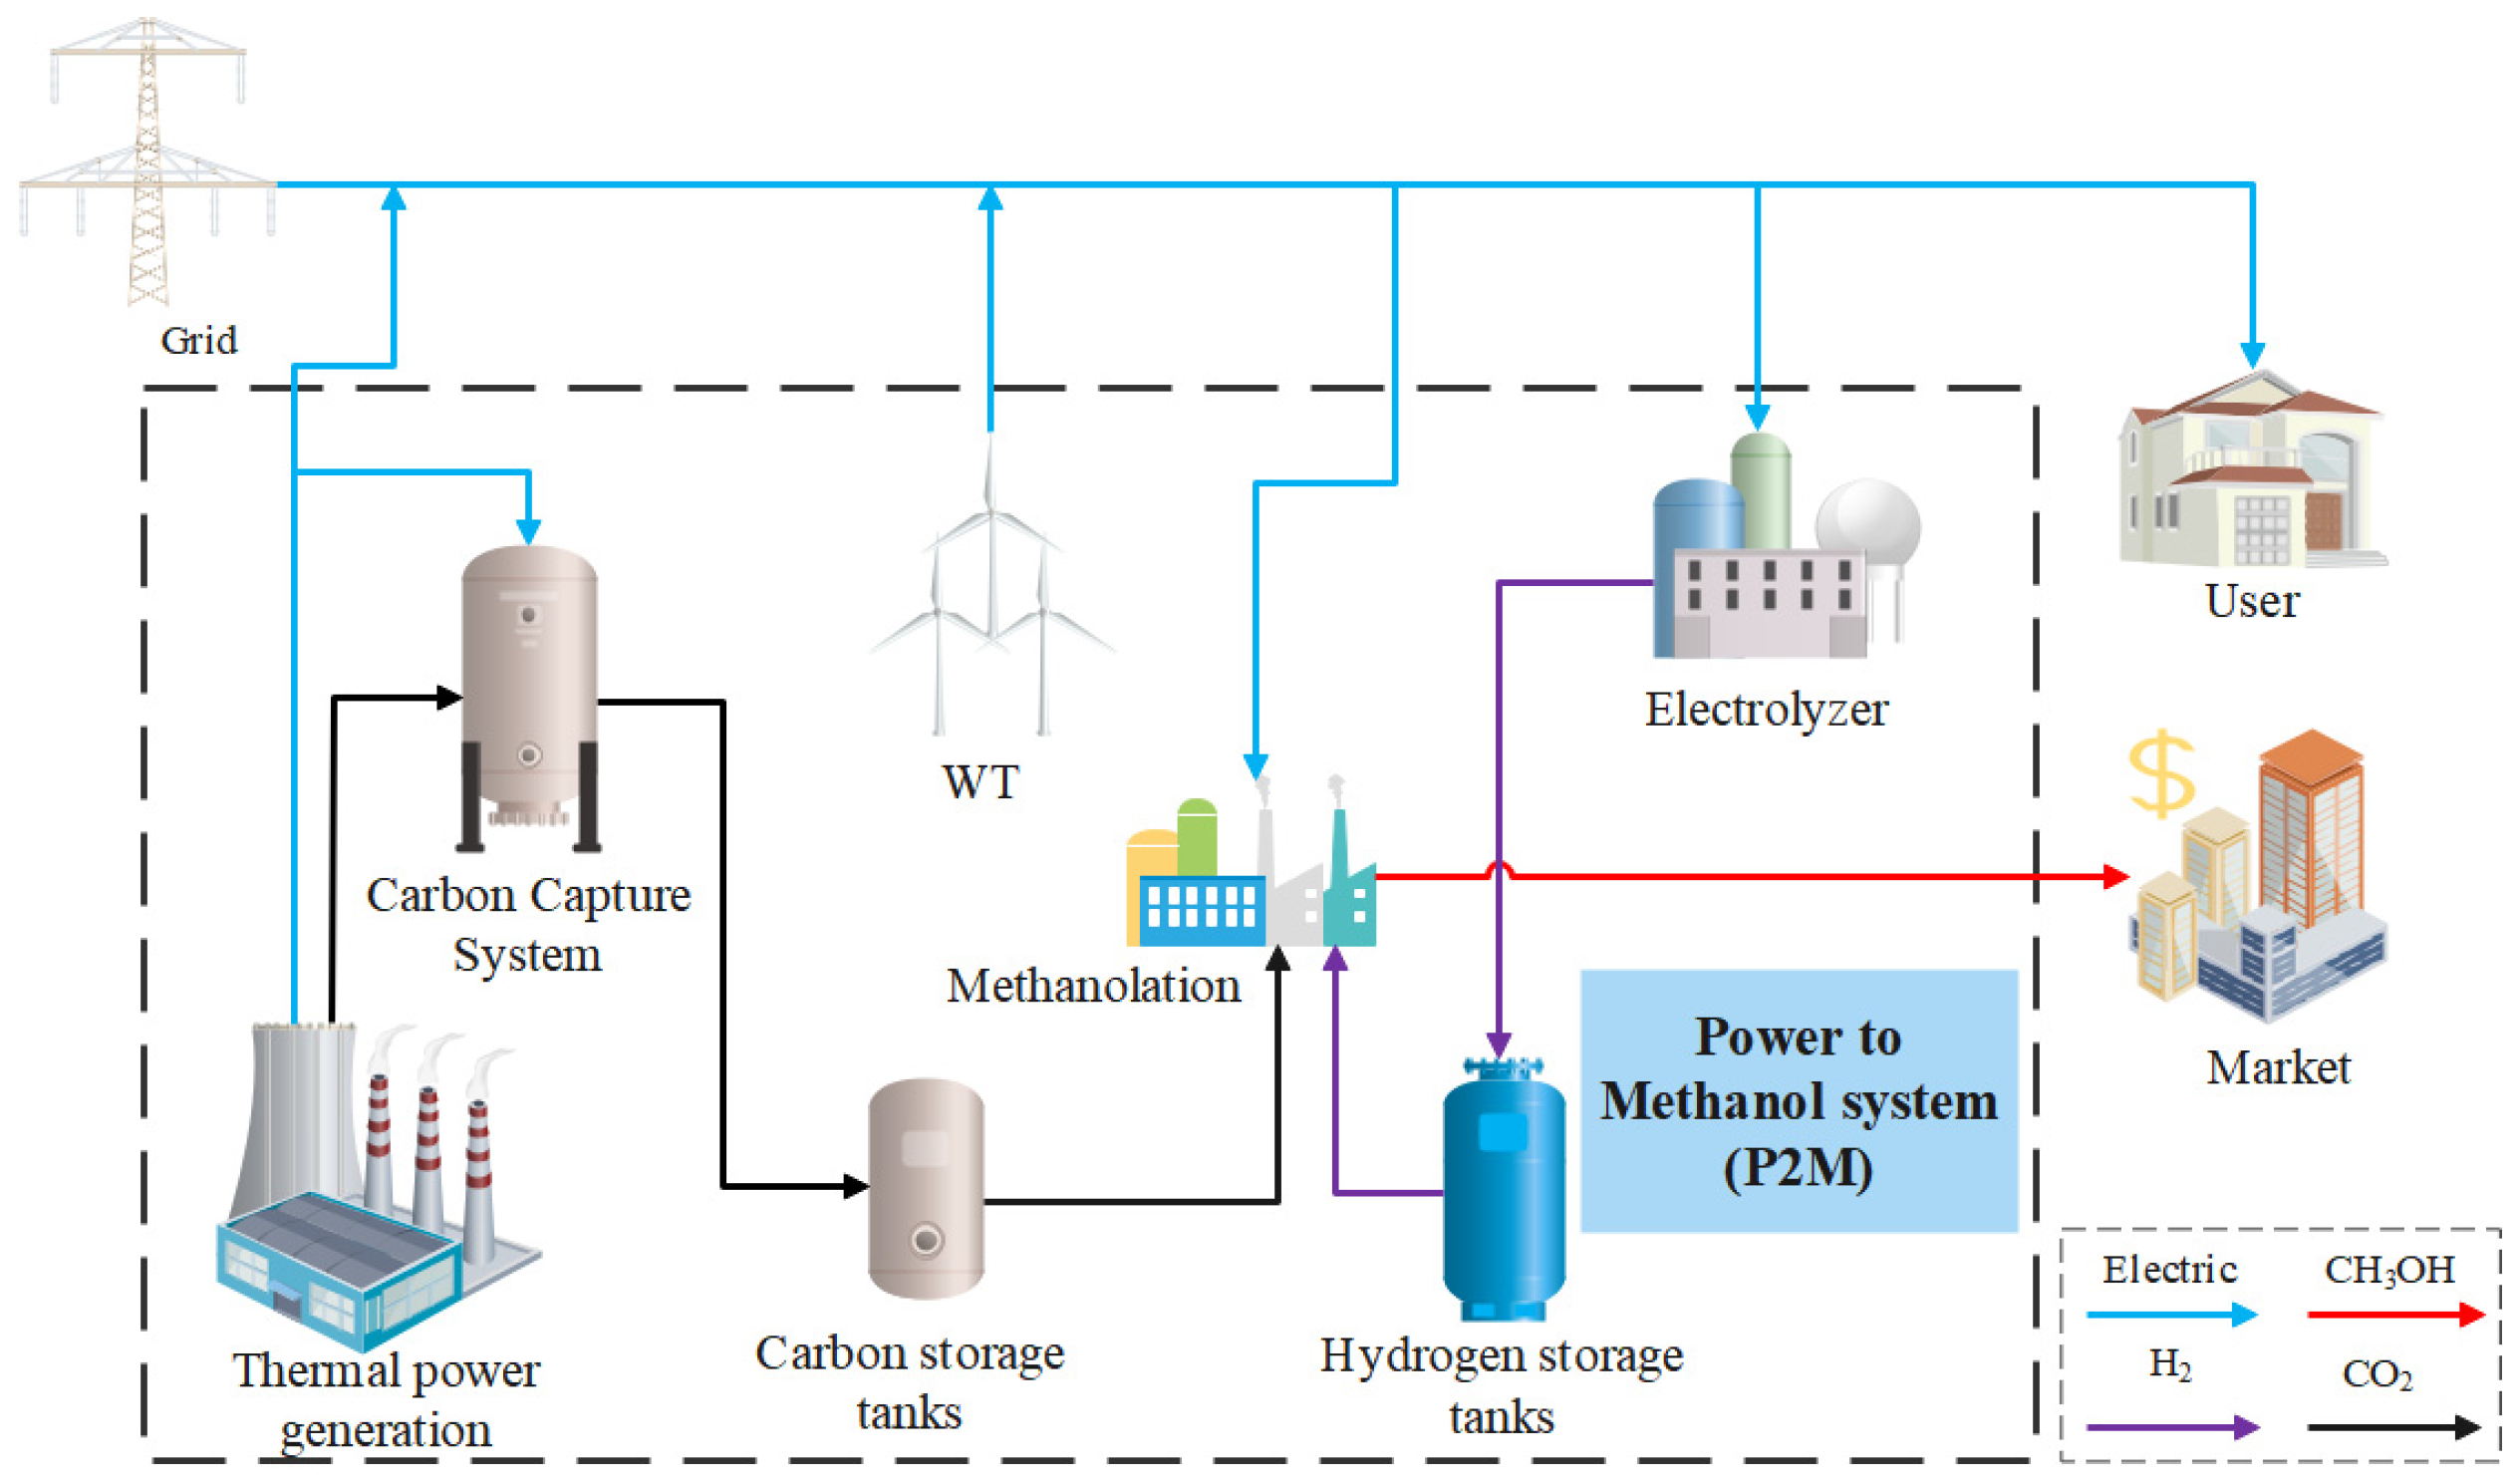
Based on the IES, the system framework of P2M is constructed by integrating P2X technology and PCC technology. A mathematical model applicable to MILP is established for the production process of key equipment in the P2M system.
(2)
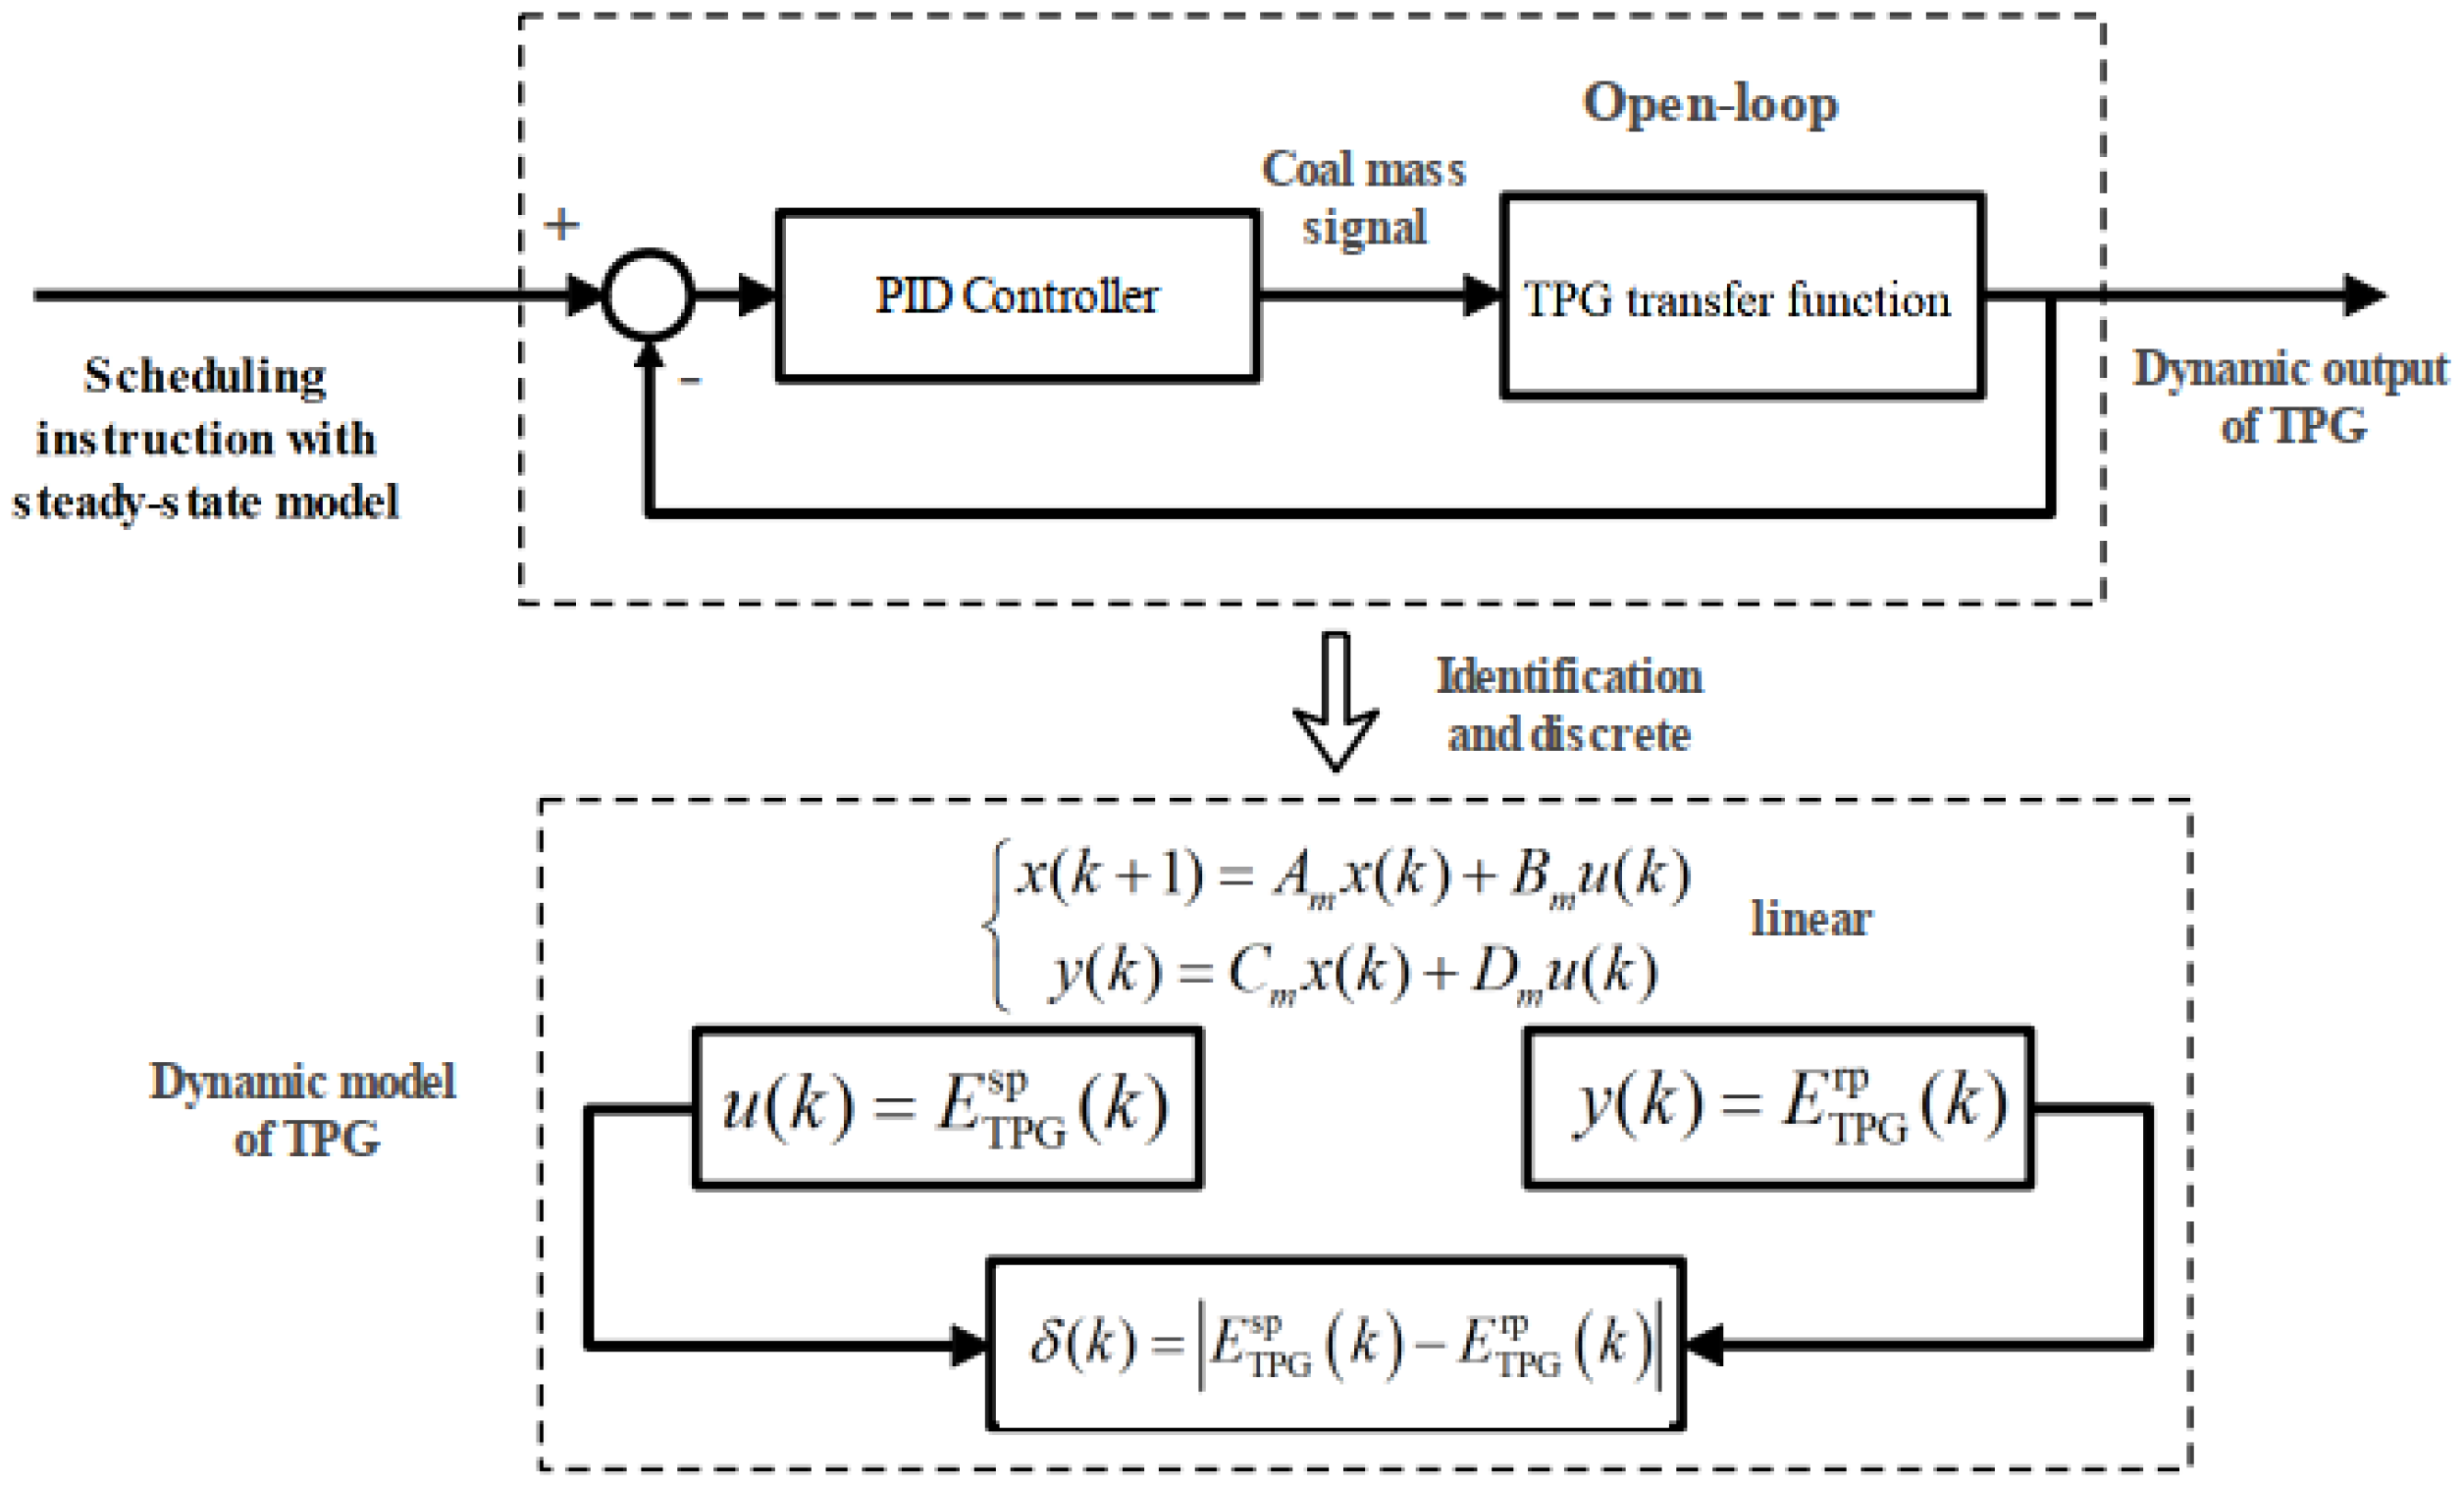
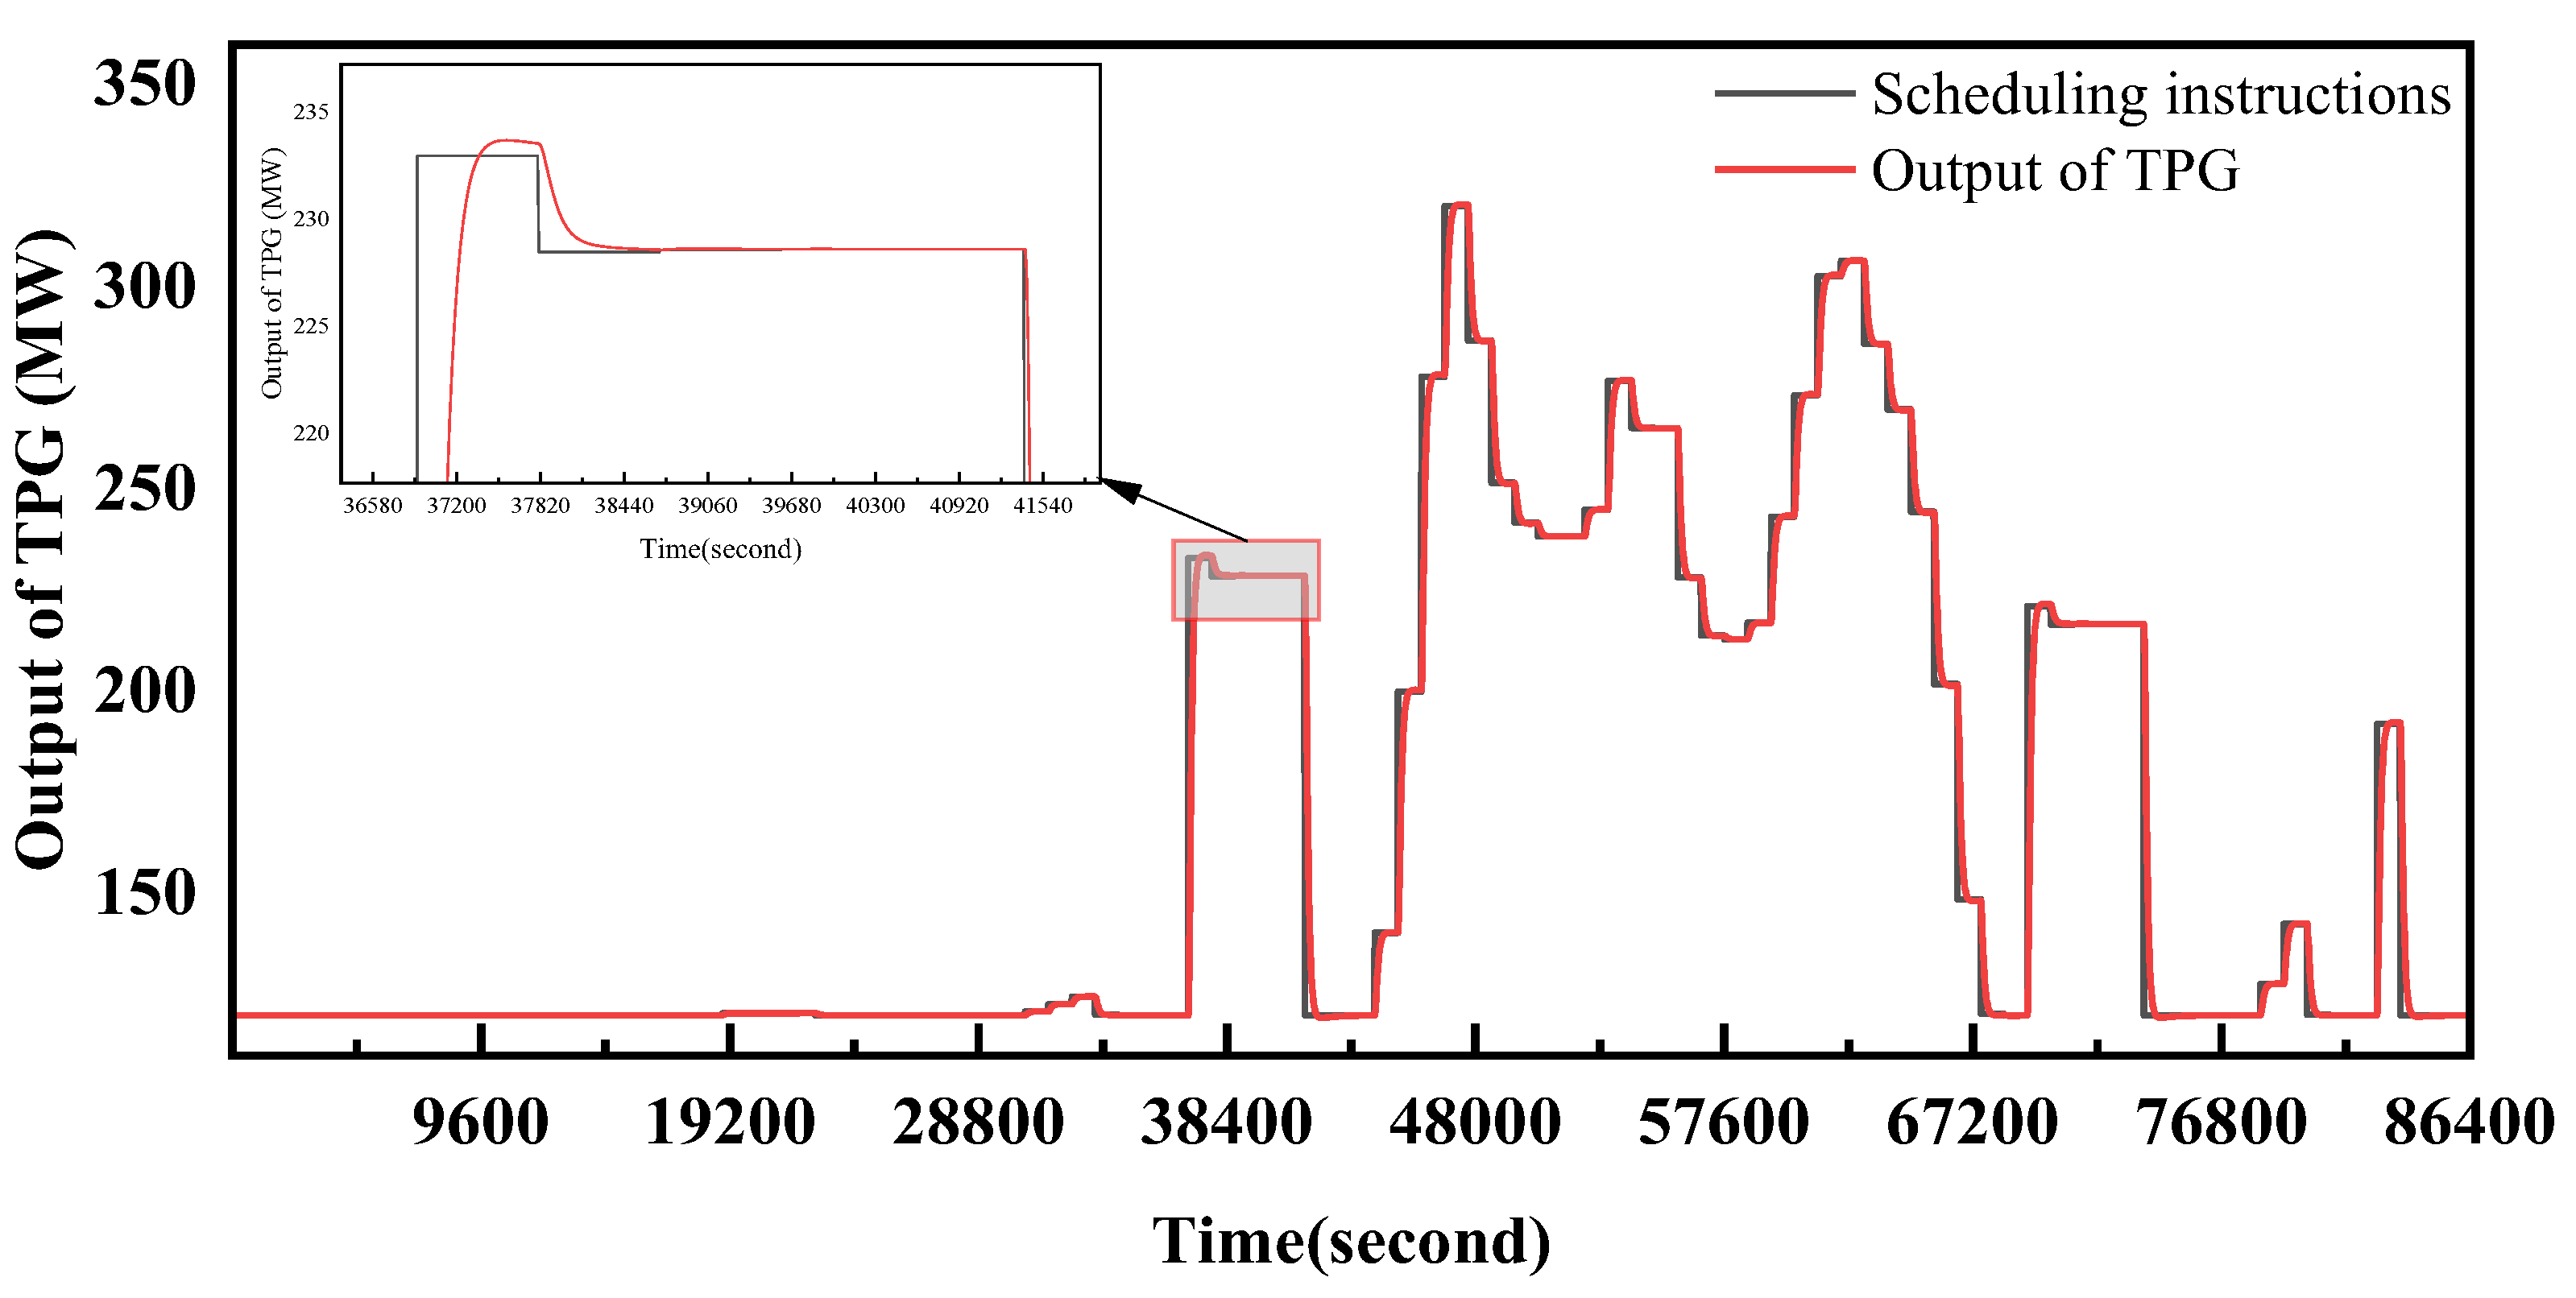
Based on the transfer function model from coal feeding to load output of the thermal power unit, the dynamic characteristics of the thermal power unit are portrayed, the controller for the coal feeding of thermal power unit is designed, and the closed-loop state-space model of the thermal power unit is identified.
(3)
The identified closed-loop state-space model of the thermal power unit is introduced into the MILP problem as an additional constraint to compare whether to consider the impact of the dynamic characteristics of the equipment on the capacity configuration of the P2M system.

2. System Description and Modeling

2.1. Structure of the P2M System

The P2M system mainly includes renewable energy generation subsystems, carbon capture subsystems, and electrochemical subsystems [3]. The structure of the P2M system studied in this paper is shown in Figure 1, in which the renewable energy generation subsystem is mainly from wind power, the carbon capture subsystem selects the post-combustion capture system, and the methanol synthesis subsystem adopts the technology of CO2 hydrogenation to synthesize methanol.
The electricity generated by wind power depends on the local wind speed situation at that time; no matter whether it is day or night, as long as the wind speed reaches a certain level, wind energy will be generated. Compared to photovoltaic power generation, which has significant diurnal spatial and temporal characteristics, the fluctuation of wind speed is stronger than the fluctuation of solar radiation [17]. Therefore, wind power generation is more demanding than PV power generation in terms of renewable energy consumption. Moreover, in order to make the system continuously and stably supply energy, the frequent changes in wind power generation also put forward higher requirements on the tracking characteristics of the thermal power unit. Post-combustion carbon capture technology separates carbon dioxide from post-combustion exhaust gases by using liquid solvents or other separation methods. A high-purity carbon dioxide stream is then obtained by purification techniques [18]. Carbon dioxide emissions from the thermal power sector are much higher compared to other industries, and the application of carbon capture technology to the power generation sector has the greatest ability to reduce CO2 emissions [19]. The hydrogenation of carbon dioxide to synthesize methanol is an important carbon recycling technology that can effectively utilize carbon dioxide and convert it into useful methanol fuel. The methanol produced has a wide range of uses, such as synthetic chemicals, lubricants, etc., and is also able to be used as a direct fuel in fuel cells and internal combustion engines, playing an important role in the future in energy transition and environmental protection.

2.2. Steady-State Model of P2M System

2.2.1. Wind Turbine (WT) Generation Subsystem

The electricity generated by wind power is [20]
E WT , t ( v t ) = 0 ( v t v c i , v t v c o ) v t v c i v r v c i E r ( v c i v t v r ) E r ( v r v t v c o )
where E WT represents WT power generation; E r represents the rated power of the WT; v t represents the real-time predicted wind speed at the local site; v c i represents the cut-in wind velocity of the turbine; v c o represents the cut-out wind velocity of the turbine; and v r represents the rated wind velocity of the turbine.
Due to the fact that the supply of renewable energy is usually mismatched with the demand for electricity [21], some of the electricity generated by wind power will not be utilized, and this wind abandonment phenomenon can be expressed as follows:
E WT , t = E wt , t + E wt , t cur
where E wt , t and E wt , t cur represent the wind turbine generation utilized and abandoned by the system at time t , respectively.

2.2.2. Carbon Capture Subsystem (CCS)

In the study in this paper, the carbon capture subsystem adopts post-combustion carbon capture technology. CO2 is derived from the post-combustion tail gas of the TPG, and the model of the CCS can be expressed as [22] follows:
E TPG , t = μ m coal , t
V CO 2 , t TPG = e TPG E TPG , t
V CO 2 . t CCS = η CCS V CO 2 , t TPG
V CO 2 . t CCS = V CO 2 . t act + V CO 2 . t cur
E CCS , t = λ CO 2 V CO 2 . t act
where E TPG , t represents the power generation of the thermal power plant at time t; μ represents the coal consumption rate at the current load state; m coal , t represents the coal consumption at time t ; V CO 2 , t TPG represents the total amount of carbon dioxide generated by the thermal power plant at time t; and e TPG represents the carbon dioxide emission intensity of the thermal power plant, which is affected by the current operating power of the plant. Under different operating power conditions, the emission intensity of the thermal power plant will be different; V CO 2 . t CCS represents the maximum amount of carbon dioxide that can be captured from the thermal power plant emissions at time t, and η CCS represents the maximum CO2 capture efficiency. Of the carbon dioxide that can be captured, only part of it is captured in the tank and the other parts are not used and are emitted into the atmosphere; the amounts of these two parts of carbon dioxide are denoted V CO 2 , t act and V CO 2 , t cur , respectively; E CCS , t represents the amount of electricity required for the actual capture of carbon dioxide, and λ CO 2 represents the electricity consumption coefficient for the actual capture of carbon dioxide.

2.2.3. Power-to-Chemical (P2X) Subsystem

The P2X technology used in this paper is power-to-methanol (P2M) technology, and its process flowchart is shown in Figure 2. Its chemical reaction equation is [23] as follows:
CO 2 + 3 H 2 CH 3 OH + H 2 O       Δ H 0 = - 49.51   kJ / mol
The process of methanol synthesis requires hydrogen from electrolyzer electrolysis, which can be modeled as:
E EL , t = λ H 2 V H 2 , t EL
where E EL , t represents the electricity consumed by the electrolyzer (EL); λ H 2 represents the consumption factor of the electrolyzer; and V H 2 , t EL represents the amount of hydrogen obtained by electrolysis at time t .
Considering the safety issues associated with frequent starts and stops and low-power operation of the electrolyzer equipment, the following constraints should also be placed on the rate of climb and power of the equipment [23]:
E EL , min E EL , t E EL , max
Δ E EL , min E EL , t E EL , t 1 Δ E EL , max
The methanol synthesis process requires a portion of the energy input to keep the equipment running, and assuming that all of this energy is supplied by electricity, the model for methanol synthesis can be expressed as follows [24]:
m CH 3 OH , t = ω CH 3 OH V CO 2 . t P 2 M
E CH 3 OH , t = λ CH 3 OH m CH 3 OH . t
where m CH 3 OH , t represents the amount of synthesized methanol at time t; ω CH 3 OH represents the volume conversion factor for the methanol synthesis reactions; V CO 2 . t P 2 M represents the volume of CO2 needed to synthesize methanol; E CH 3 OH , t represents the electricity input for methanol synthesis; and λ CH 3 OH represents the electricity consumption rate of methanol synthesis.

2.2.4. Balance of Energy and Mass

There is an energy balance at all moments of the system’s steady-state operation:
E TPG + E WT = E load + E CCS + E EL + E CH 3 OH
where E TPG and E WT are the thermal and wind power generation on the supply side, respectively; E load , E CCS , E EL , and E CH 3 OH are the basic electricity load, CCS consumption, electrolyzer consumption, and synthetic methanol consumption on the consumption side, respectively.
The material balance model for the carbon and hydrogen storage tanks in the synthetic methanol process route can be expressed as follows [25]:
V j , t st = V j , t 1 st + V j , t 1 in V j , t 1 out
where V j st represents the volume of gas in the tanks at time t or at the previous moment; V j , t in represents the volume of gas inlet in the storage tank at the previous moment; V j , t 1 out represents the volume of gas outlet in the storage tank at the previous moment; and j represents the kind of gas.

2.3. Model Including the Feedback Control of TPG

The equipment model discussed in the previous section is based on the steady-state operation of the system. It reflects the steady-state relationship of the system in the operational process. When the scheduling instruction of the equipment changes, the transient increase or decrease in the output size of the equipment will lead to the destruction of the system’s steady-state operating conditions. The degree of destruction is determined by the speed of the dynamic response process. For electrification equipment like electrolyzers and wind turbines, the dynamic response speed is relatively rapid and can be considered negligible in comparison to the scheduling time scale. As a result, the dynamic processes of such equipment can be disregarded. However, for energy supply equipment such as the thermal power unit, there is a phase change of the mass during the flow process, the heat transfer process is coupled with the flow process, the dynamic response is slow, and the dynamic process of the equipment is not negligible.
In order to quantify the impact of the dynamic process of the thermal power unit on the operation of the system, it is first necessary to establish a dynamic model of the thermal power unit to describe its dynamic process. In this study, the transfer function of the thermal power unit obtained by using the existing mechanism modeling study for the identification [26] of the relevant equipment is as follows:
G TPG ( s ) = G power ( s ) G coal ( s ) = 6 8.744 × 10 6 s 3 + 3.476 × 10 5 s 2 + 1.501 × 10 3 s + 1
where G TPG ( s ) is the transfer function of the TPG from the input coal feed to the output power.
The establishment of indicators for the dynamic deviation of TPG involves the following steps:
Step1: Based on the open-loop transfer function of the equipment, the dynamic model of the system, from coal feed to the power output of the TPG, is constructed in Simulink.
Step2: A PID controller is designed and parameterized to derive a closed-loop transfer function model for the TPG.
Step3: The input and output data of the TPG from the simulation are extracted, and the closed-loop state-space model of the TPG is obtained using the identification tool in MATLAB 2023b.
Step4: To balance computational efficiency and model accuracy in the simulation, an appropriate time step is selected to obtain the discrete-state state-space model of the TPG.
The process of transforming the dynamic model of the device into constraints is shown in Figure 3. After the above steps, the linear TPG dynamic model is obtained, as follows:
x ( k + 1 ) = A m x ( k ) + B m u ( k ) y ( k ) = C m x ( k ) + D m u ( k )
where A m , B m , C m , and D m are state-space matrices describing the dynamic properties of the TPG in discrete states. The closed-loop state-space model in the equation is linearized such that:
u ( k ) = E TPG sp ( k ) y ( k ) = E TPG rp ( k )
Then, the deviation between the scheduling instructions and the actual dynamic output can be expressed as:
δ ( k ) = E TPG sp k E TPG rp k

3. Unified Scheduling and Configuration Optimization

3.1. Constraints

Due to the limited ramping capability of the TPG in a short period of time, the TPG should also be subject to ramping power constraints:
Δ E TPG , min E TPG , t E TPG , t 1 Δ E TPG , max
Each piece of equipment in the P2M system should be subject to the following:
E i , min < E i < E i , max
where i represents the equipment in the P2M system, i W T , M E , E L , H T , C T , C C S ; and E i , min and E i , max represent the minimum output and maximum output of the equipment in the P2M system, respectively.

3.2. Objective Function

The objective function in the study consists of two parts: the economic indicator and the dynamic deviation. The economic indicator is the annual operating cost of the P2M system, and the dynamic deviation indicator is the amount of deviation between the scheduling instruction and the actual dynamic output of the TPG.
min J = ε J 1 + ( 1 ε ) J 2
The economic indicator J 1 can be calculated as follows:
J 1 = C inv + C om + C tax
C inv = k I k D k σ k
where C inv represents the investment cost of the P2M system; k represents the equipment of the P2M system, containing the electrolyzer, PV, WT, hydrogen tank, carbon shortage tank, and methanolation equipment; I k represents the investment cost per unit capacity of the equipment; and D k represents the capacity of the equipment.
The operation and maintenance cost of the system is categorized into the fixed operation cost and variable operation cost the fixed cost comes from the maintenance and overhaul cost during daily operations, and the fixed operation cost is considered to be proportional to the initial investment cost of the equipment in this study. Variable costs are related to the operation of the equipment and in this paper are mainly influenced by the amount of coal m coal , t and the output of methanol products m CH 3 OH , t .
C om = k I k D k ζ k + t P coal , t m coal , t P CH 3 OH , t m CH 3 OH , t
where ζ k represents the ratio of the operating and maintenance costs of different equipment to their present value of investment costs; and P coall , t and P CH 3 OH , t represent the purchase price of coal and the market price of methanol, respectively.
In addition, this study also introduces carbon tax as a method to promote carbon capture policy support.
C tax = t P CO 2 , t V CO 2 , t cur
where P CO 2 , t represents the carbon tax, where the unit is CNY/Nm3.
σ k = i ( 1 + i ) n ( 1 + i ) n 1
σ k represents the capital recovery factor [27]; it is a financial formula used to calculate the amount of money needed to repay a loan or recover the initial capital investment over a specific period of time, taking into account the interest rate and the number of payment periods; n represents the useful life of the equipment; and i represents the interest rate. In this paper we take a value of 10%.
The dynamic deviation indicator J 2 can be calculated as follows:
J 2 = λ k δ ( k ) = λ k E TPG sp k E TPG rp k
where ε represents the weighting of the economic indicators and λ represents the correction factor for dynamic deviation.

3.3. Solution

After establishing the deviation indicators for the dynamic characteristics of the TPG, the variables within the P2M system are represented as linear relationships. Given the inclusion of integer variables in the energy storage device model, the optimization programming is formulated as a mixed-integer linear programming (MILP) problem. It can be expressed as follows:
min J = ε J 1 + ( 1 ε ) J 2 s . t . g ( x ) = 0 h ( x ) 0 x = E i i W T , M E , E L , H T , C T , C C S
where g ( x ) represents the equational constraints in the MILP problem and h ( x ) represents the inequality constraints in the MILP problem. x represents the capacity of the equipment in the P2M system, which is a decision variable in the MILP problem.
The commercial solver can transform the MILP problem into multiple LP problems [28] and quickly solve the optimal solution among a finite number of LP problems as the solution of the MILP. YALMIP is a third-party toolbox that operates entirely within the MATLAB environment. It leverages MATLAB’s programming syntax and functionalities to offer users a more streamlined approach to defining and solving optimization problems. YALMIP does not directly provide solvers; instead, it acts as an interface to call external optimization solvers (such as Gurobi, CPLEX, MOSEK, etc.) for problem resolution. As a robust extension toolbox for MATLAB, YALMIP specializes in the modeling and solving of optimization problems. By delivering concise syntax and flexible interfaces, it significantly simplifies the implementation process of optimization problems, making it an essential tool for MATLAB users in the field of optimization.
The flowchart of the optimized configuration, considering the dynamic characteristics of TPG, is shown in Figure 4.

3.4. Case Study

In this section, the capacity of the equipment in the P2M system is optimally configured with a steady-state model and dynamic model, respectively.
Case1: The dynamic model of TPG is not considered and the dynamic deviation of TPG is ignored for the optimal configuration of the equipment capacity in the P2M system.
Case2: The dynamic deviation of TPG is considered comprehensively and introduced as a penalty term in the objective function of optimization to optimize the configuration of the equipment capacity in the P2M system.
The subject of this study is an industrial park located in Northwest China, with wind speed and load data sourced from historical records provided by the local statistical bureau. The data resolution is set at fifteen-minute intervals. The technical parameters and economic parameters of the equipment needed for the optimized configuration are shown in Table 1 and Table 2, respectively.
Other economic parameters such as electricity price, coal price, methanol market price, and carbon tax are shown in Table 3.

4. Results and Discussion

4.1. Capacity Configuration Optimization Results

Adopting the optimized configuration method mentioned in this paper, the results of the P2M system equipment capacity configuration for the two scenarios are obtained and listed in Table 4.
From the results in Table 4, the configuration capacity of the WTs decreases by 4.24% after considering the dynamic characteristics of the TPG. This is due to the fact that the P2M system relies on WTs and TPG for its energy supply, and even though the TPG causes dynamic deviations when the load is varied, the economic penalty resulting from the dynamic deviations is less than the investment cost of configuring more turbines. It shows that the capacity configuration results obtained using the steady-state model are too conservative, ignoring the ability of TPG to supply energy under frequent load changes.
The capacity of the electrolyzer is almost unchanged, but the configuration of the methanol synthesis equipment is increased by 26.77%. The electrolyzer, hydrogen storage tank, and carbon storage tank serve as auxiliary equipment in the methanol production process. While the capacity configuration of the electrolyzer remains nearly constant, the hydrogen storage tank’s capacity configuration doubles, indicating that the energy storage potential of the P2M system is effectively leveraged through the dynamic model configuration. According to the optimization results of the dynamic configuration of the carbon storage tank, the configuration capacity of the carbon storage tank decreases by 58.71%, and the configuration capacity of the carbon capture system also decreases by 2.97%. However, the configuration capacity of the methanol synthesis equipment increases by 26.77%, indicating that the captured CO2 at this time is more towards the direction of synthesizing methanol, most of the CO2 is directly emitted into the atmosphere, and the carbon tax policy at this time is relatively more liberal.

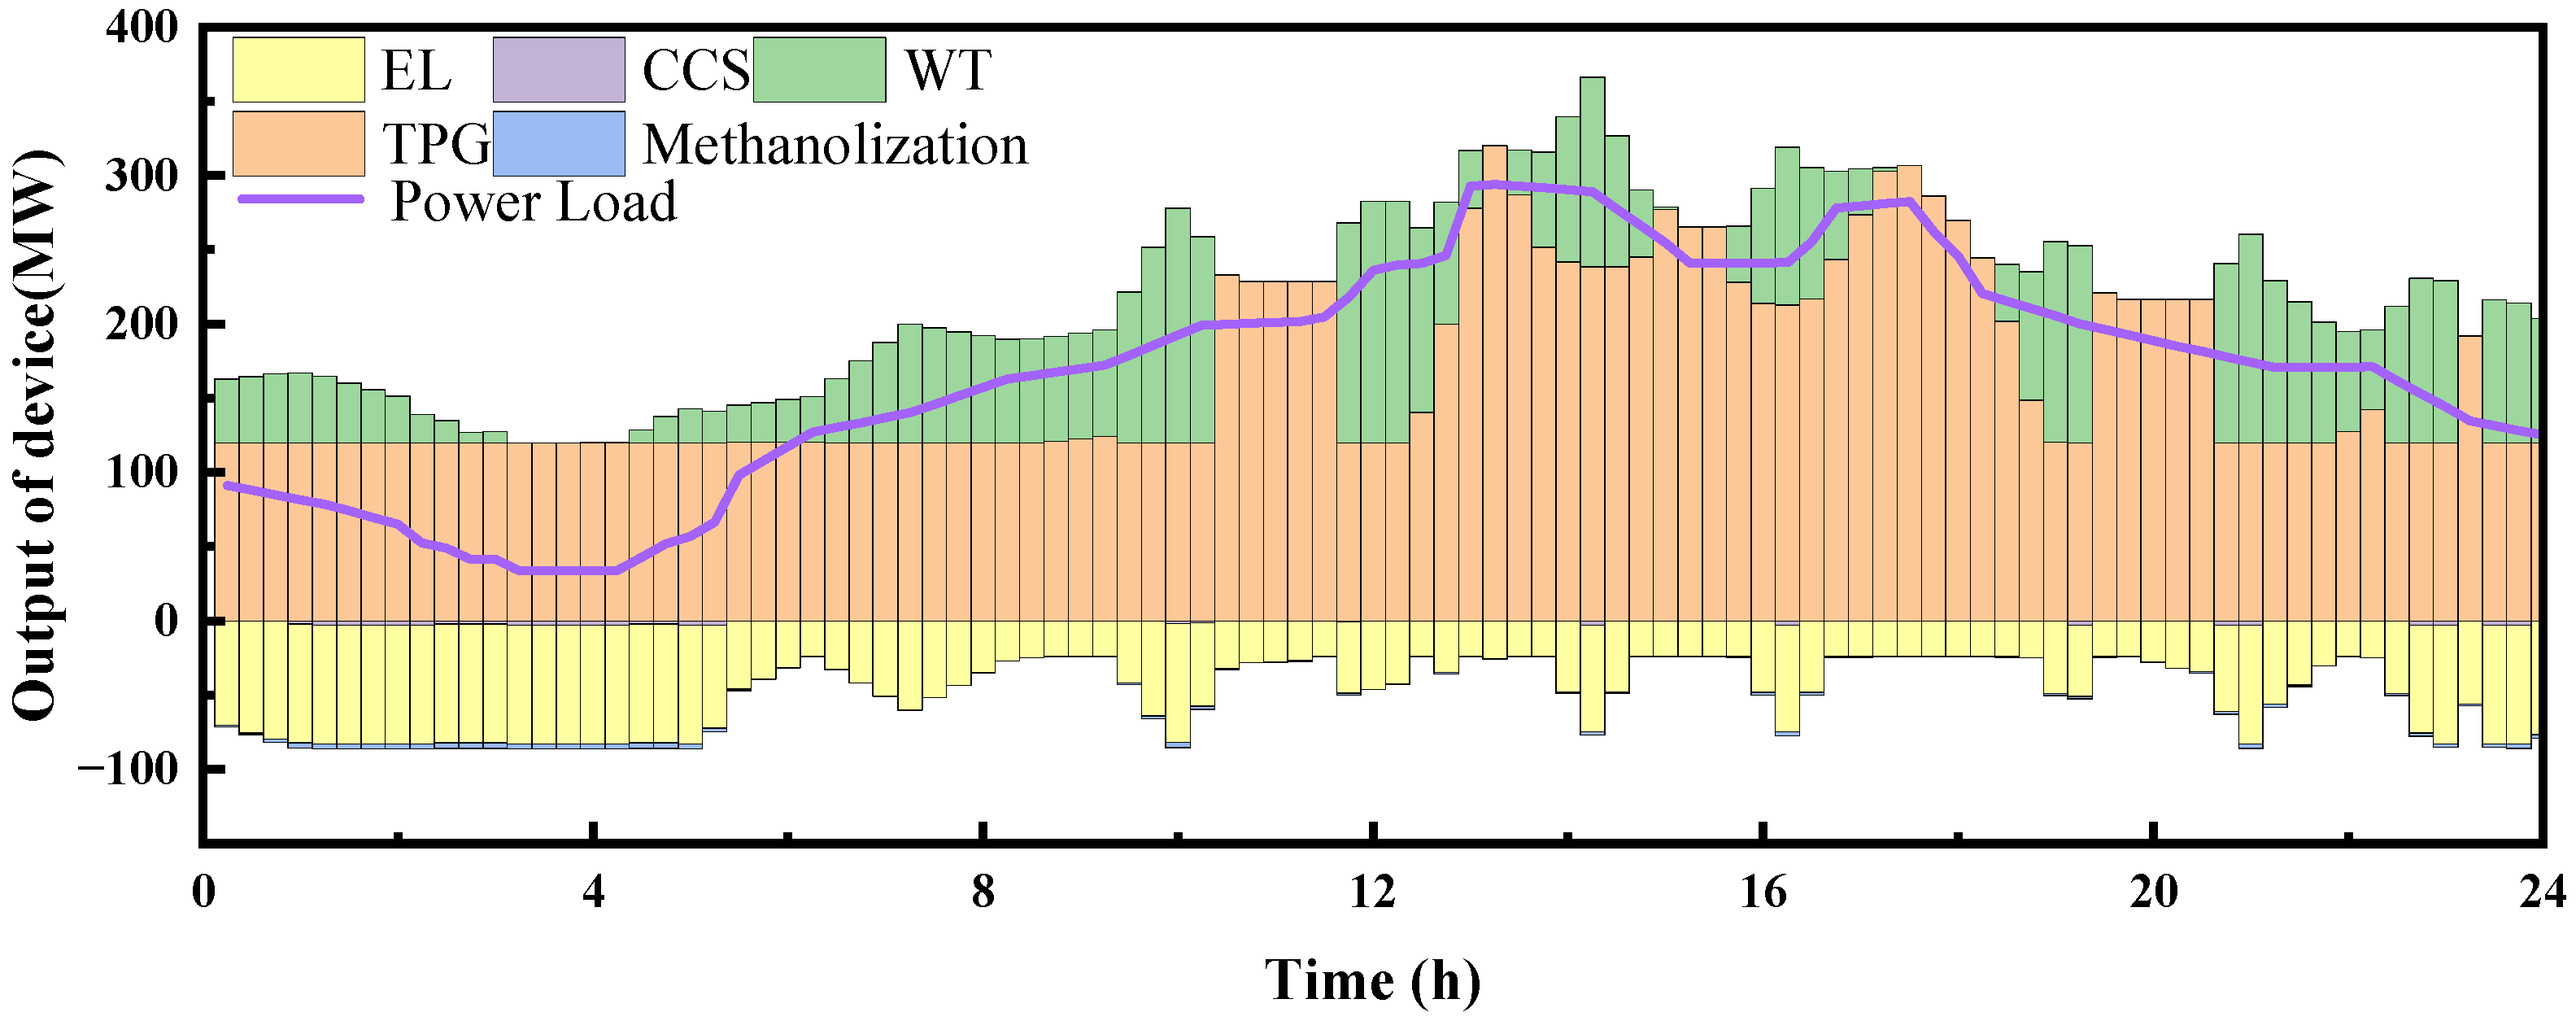
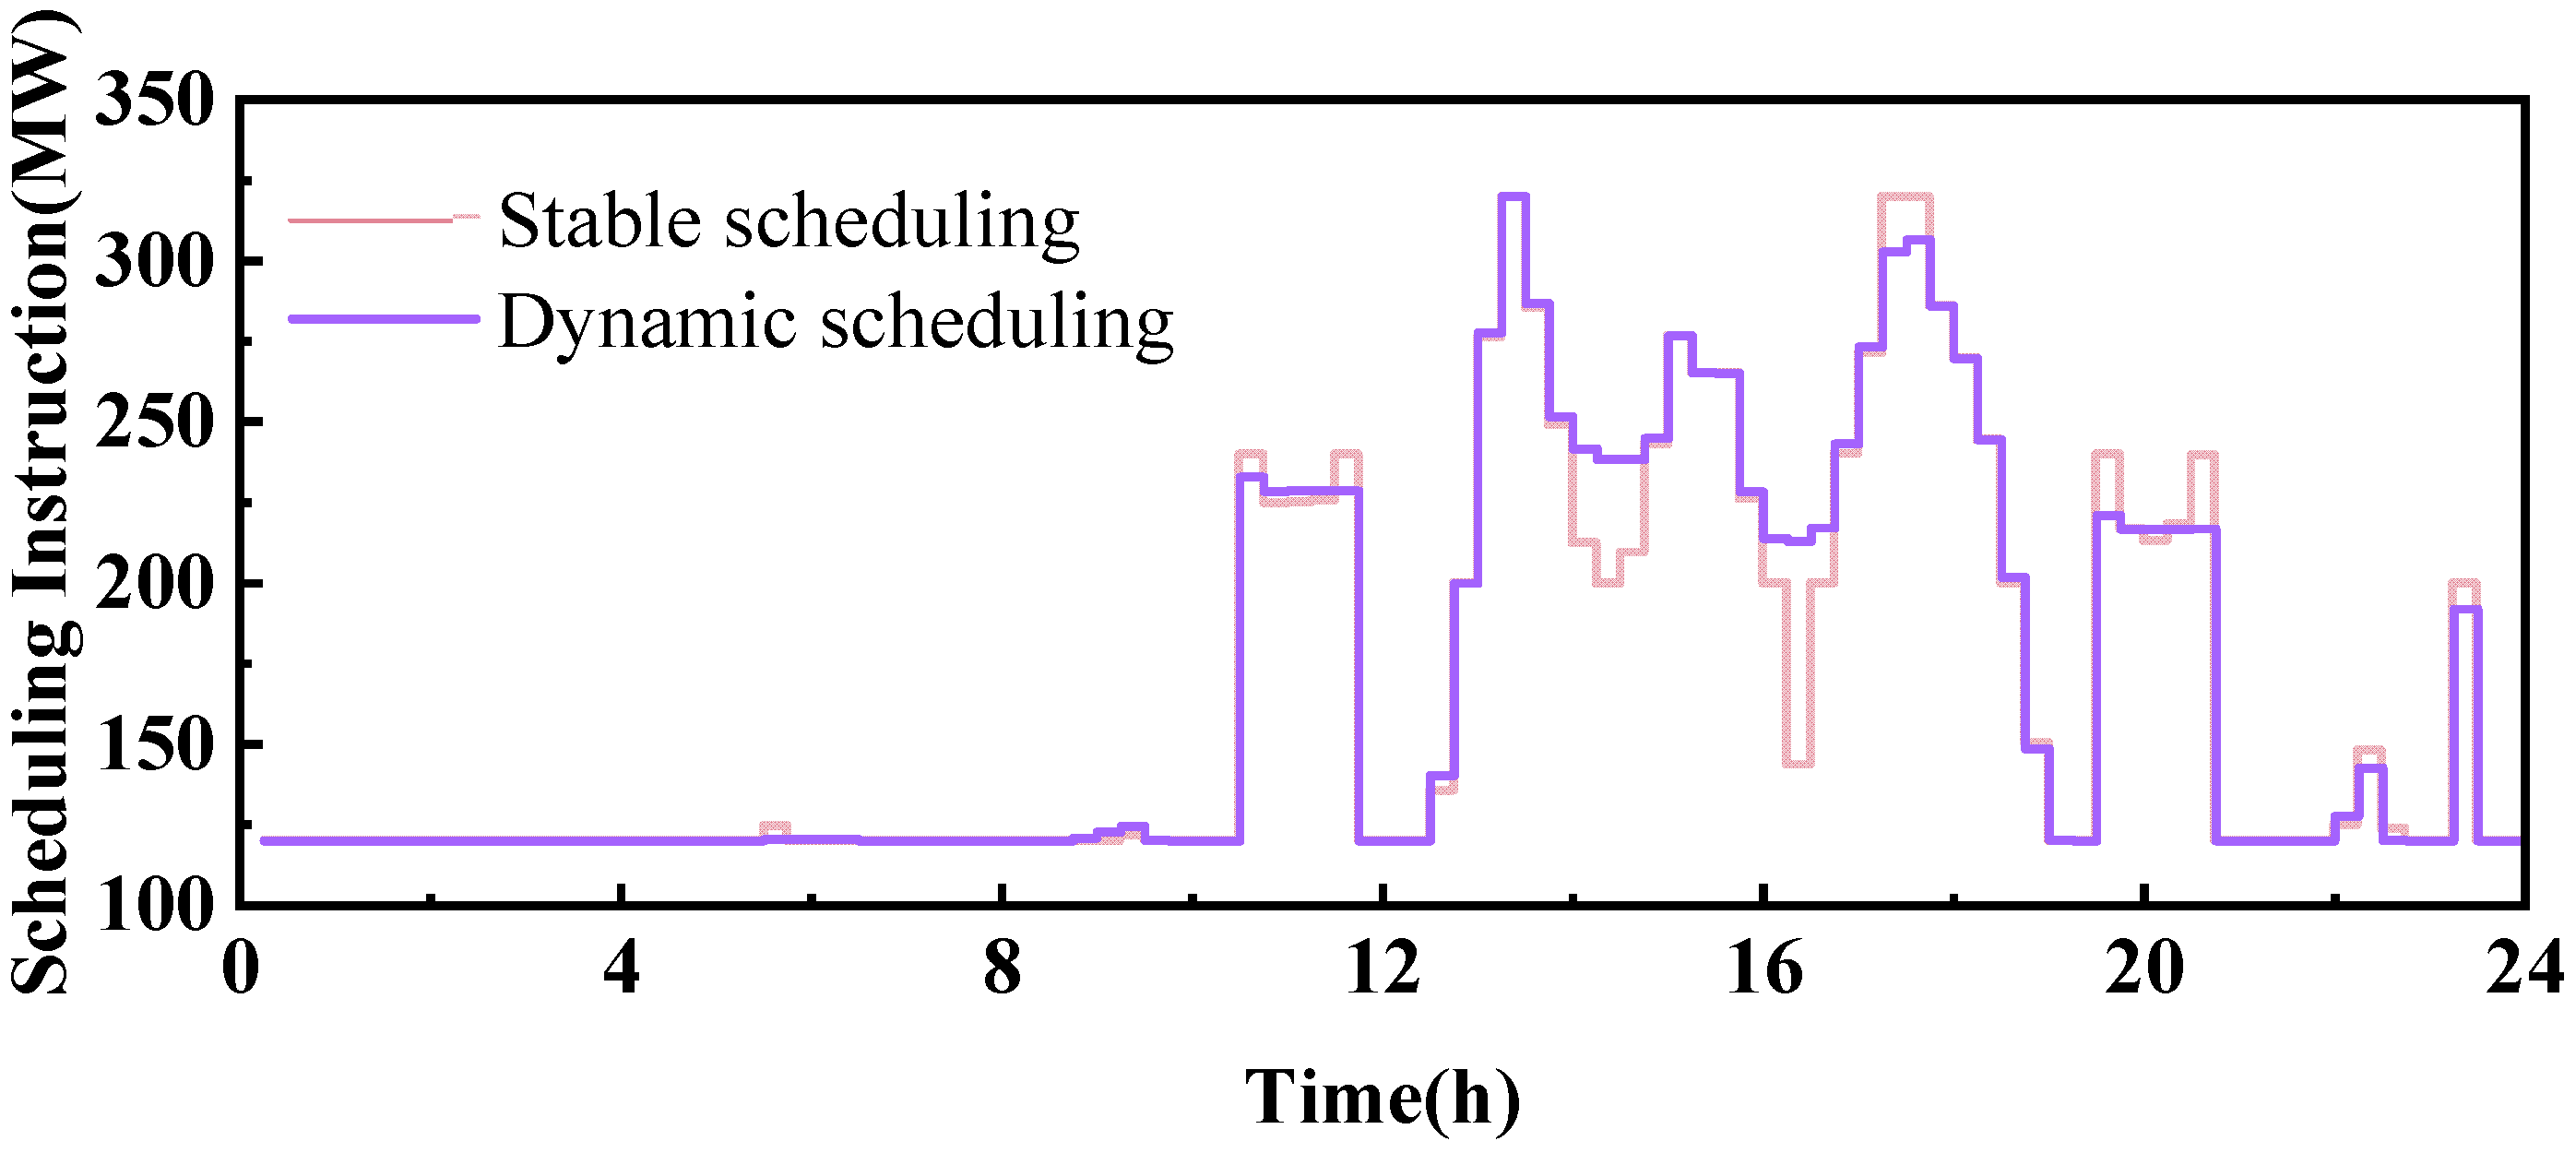
4.2. Scheduling Optimization Results

The scheduling problem can be regarded as a sub-problem of the configuration problem. The primary distinction between the two lies in the fact that, in the scheduling problem, the device capacities are predetermined and incorporated as constraints in the programming process. The optimized scheduling results obtained by using the steady-state and dynamic models are shown in Figure 5 and Figure 6, respectively.
The results of the scheduling optimization indicate that the primary energy supply for the P2M system is derived from the TPG, while the WT serves as a supplementary energy source. On the energy consumption side, after meeting the electrical load requirements, surplus electrical energy is primarily utilized by the electrolyzer, with a small portion allocated to the CCS. The power generation of the WT is influenced by wind speed, exhibiting significant volatility. As a result, it cannot provide continuous and stable energy to the P2M system and serves only as a supplementary energy source. The electrolyzer, as a flexible power-consuming device, operates at higher power levels when the wind turbine output is elevated. Additionally, during nighttime, when the power demand of the electrical load is lower, the electrolyzer assists in maintaining the minimum operational power of the TPG. The combined output of the TPG and WT enhances renewable energy utilization and stabilizes the output of the thermal power unit.
To further investigate the impact of TPG’s dynamic characteristics on the operation of the P2M system, the tracking performance of the scheduling instructions from both the steady-state model and the dynamic model, compared with the actual output of the TPG, is illustrated in Figure 7 and Figure 8, respectively. In the same scheduling period within a locally enlarged view, the dynamic model can reduce the frequency and amplitude of TPG load fluctuations, thereby reducing the dynamic deviation caused by TPG’s dynamic characteristics within the scheduling period. This phenomenon is also observed in other scheduling periods, indicating that the optimized scheduling method using the dynamic model enables the P2M system to achieve a more stable energy supply–demand balance.
To more clearly illustrate the scheduling differences between the dynamic and steady-state models over the course of a typical day, the scheduling instructions for both models are presented in Figure 9.
Compared to the scheduling instruction curve of the steady-state model, the dynamic model’s scheduling curve is smoother. At certain output peaks, the dynamic scheduling instructions decrease, whereas at some output valleys, the instructions increase. This demonstrates that the dynamic model’s scheduling can mitigate fluctuations in TPG, effectively stabilizing its output and achieving the goal of peak shaving and valley filling.

5. Sensitivity Analysis

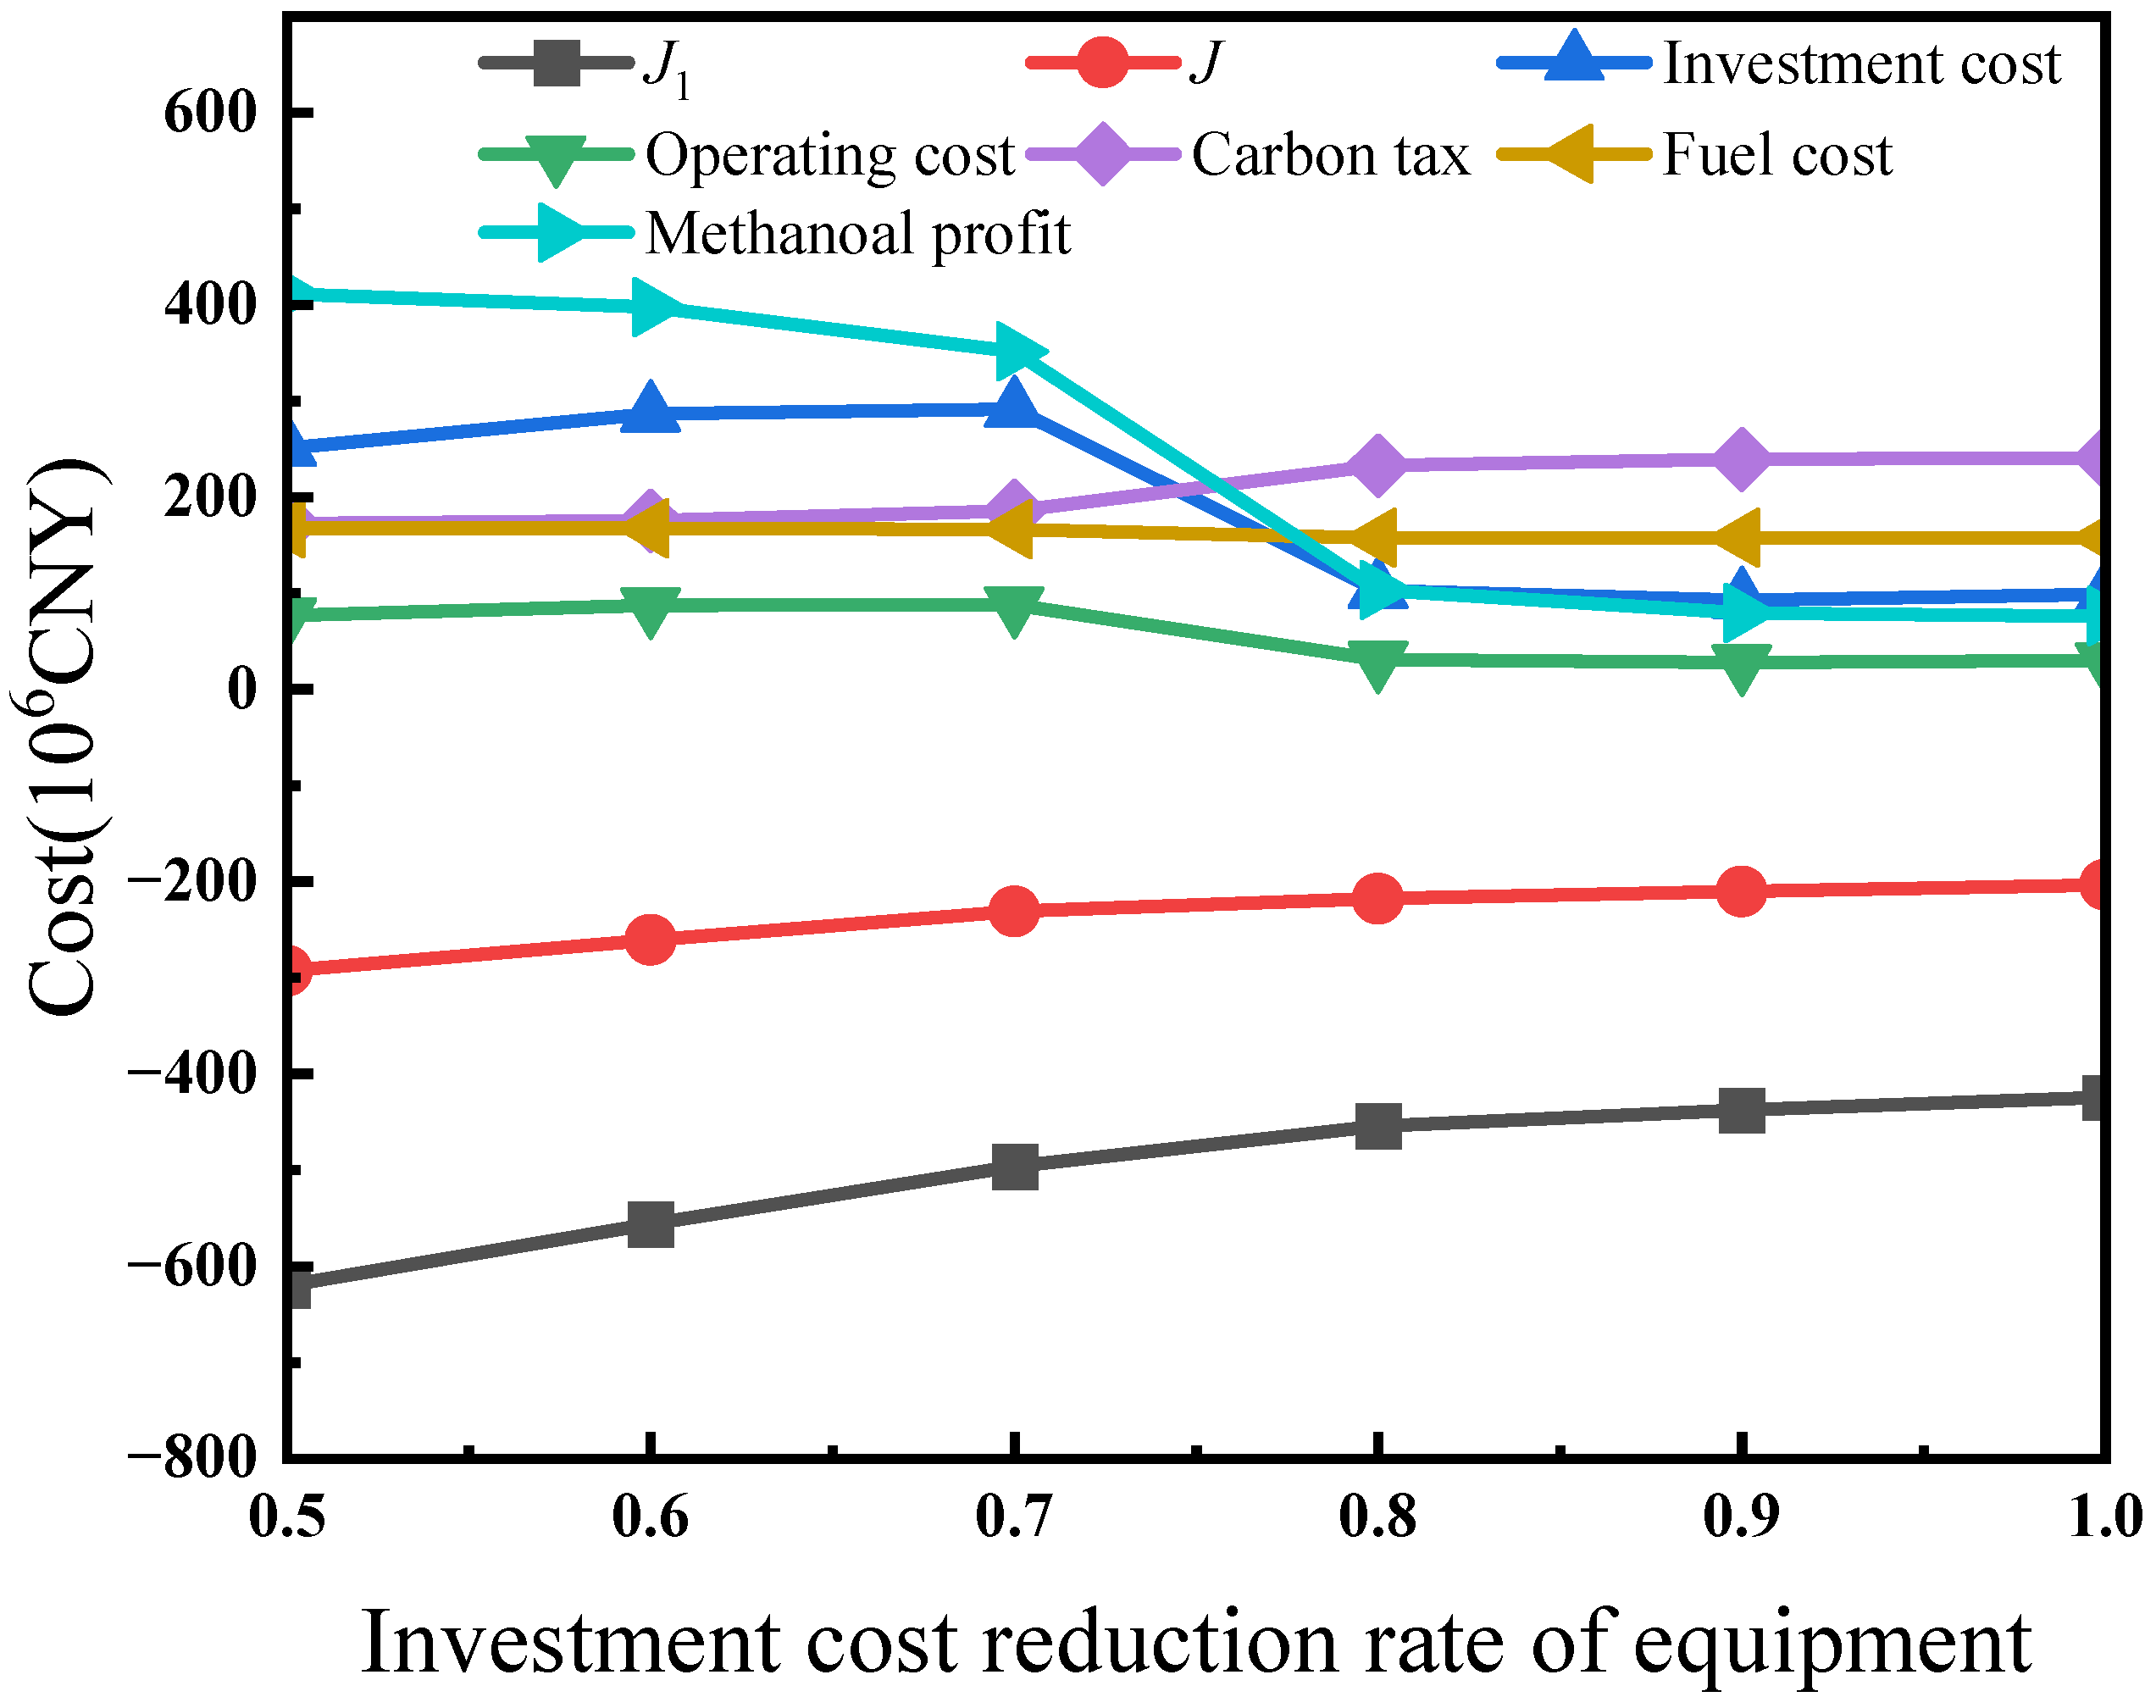
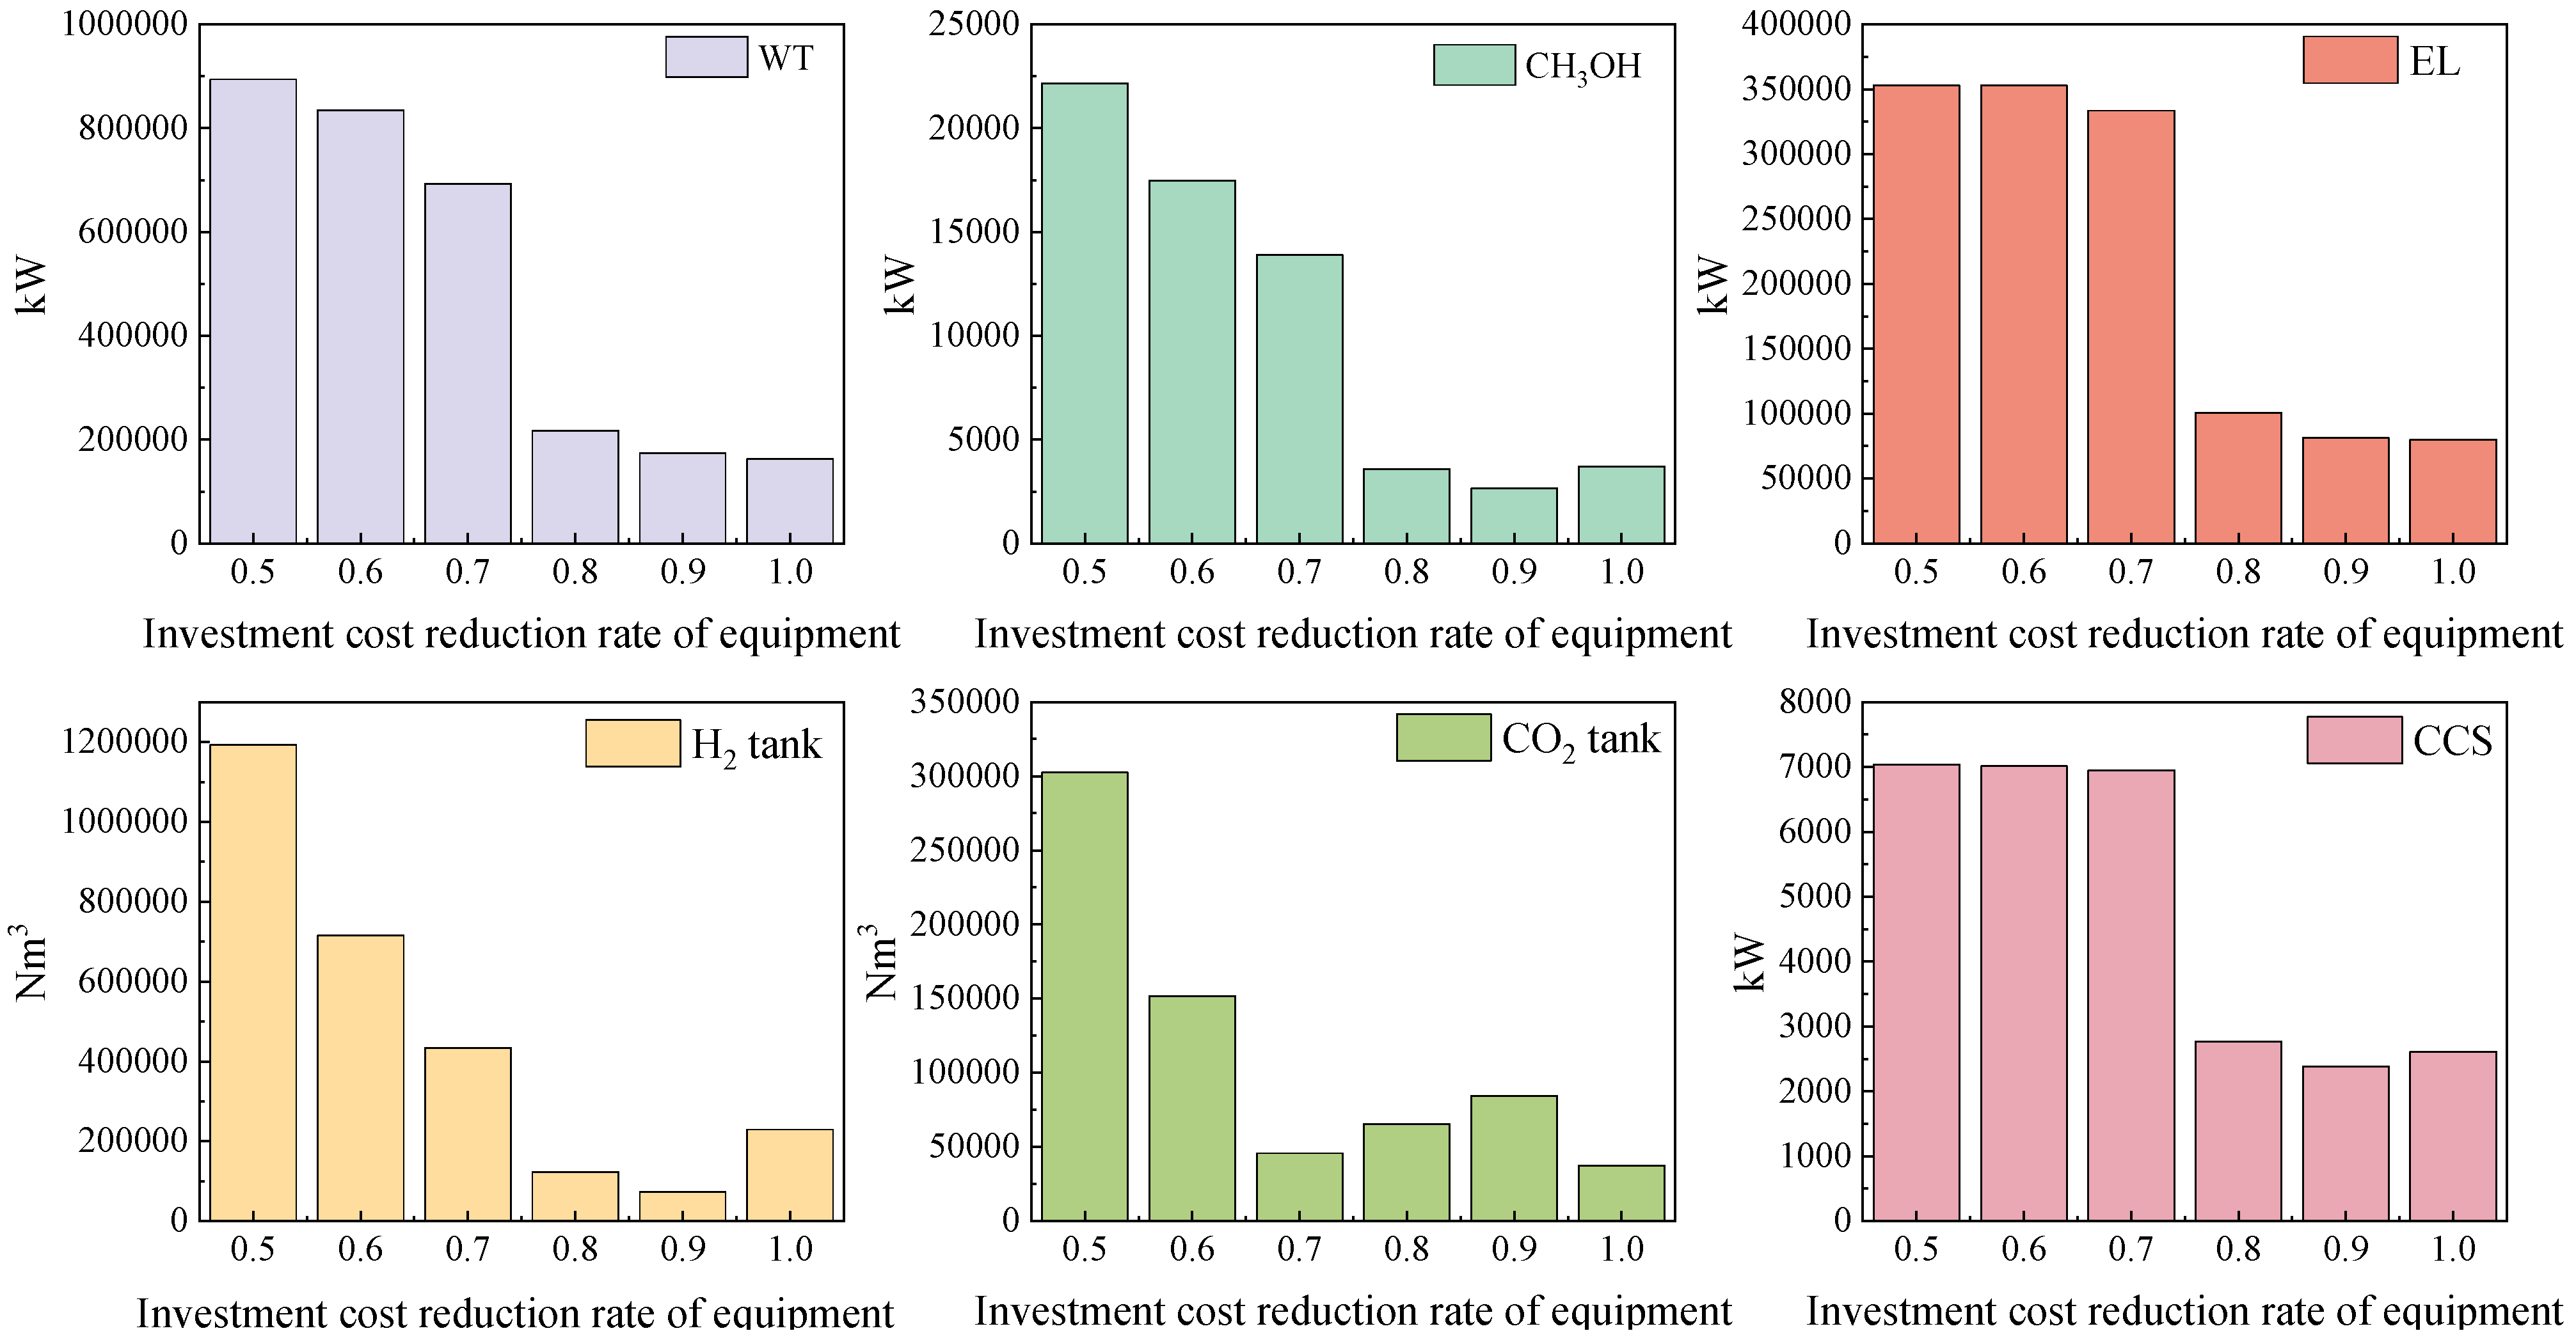
5.1. Sensitivity Analysis of Economic Parameters

A sensitivity analysis is performed via decreasing the investment cost of each individual piece of equipment to reveal its impact on the equipment capacity and P2M system’s economic performance. The investment cost reduction rate of the equipment is the current cost of investment as a percentage of the initial cost of investment. The impacts of equipment investment cost reduction on economic performance and their configuration capacities are shown in Figure 10 and Figure 11, respectively.
Equipment investment cost reduction leads to a decrease in the economic objective function and the total objective function. The separate costs for each of the economic objective functions are graphed in Figure 10. With the reduction in the investment cost of the equipment, the capacity of the WT and the electrolyzer is more obviously enhanced, which leads to a significant increase in the investment cost of the equipment in Figure 10. In contrast, the total objective function of the P2M system as well as the economic objective function show a decreasing trend, which is due to the large amount of synthesis of methanol products leading to the enhancement of the P2M system’s revenue. The fuel cost and carbon tax penalty are also decreasing further, which indicates that the proposed P2M system is able to consume more wind power, reduce CO2 emissions and has good economic and environmental benefits.
Sensitivity analysis is conducted to evaluate the impact of equipment investment costs on the configuration optimization results. This analysis enhances the scientific, economic, and adaptive aspects of system configuration, laying a foundation for achieving the efficient operation of the integrated energy system. By examining the trends in investment cost variations across different devices in the configuration scheme, this approach facilitates a deeper understanding of system behavior and supports informed system design and optimization decisions. As shown in Figure 11, when the investment cost reduction rate for the equipment falls within the range of 0.7 to 0.8, the configuration capacity of the equipment in the system exhibits more pronounced changes, indicating that configuration optimization results are most sensitive to investment costs in this interval. Beyond this range, the equipment capacity changes tend to stabilize. Combined with the sensitivity analysis results in Figure 10, it is evident that within this interval, the carbon tax penalty decreases, and methanol revenue increases. Consequently, the P2M system synthesizes a larger quantity of methanol to enhance its economic performance. This leads to a rise in the cost of ancillary equipment; however, the total annual operating cost decreases due to the methanol revenue. Therefore, the economic benefits of the P2M system are most significant within this investment cost interval compared to the others.

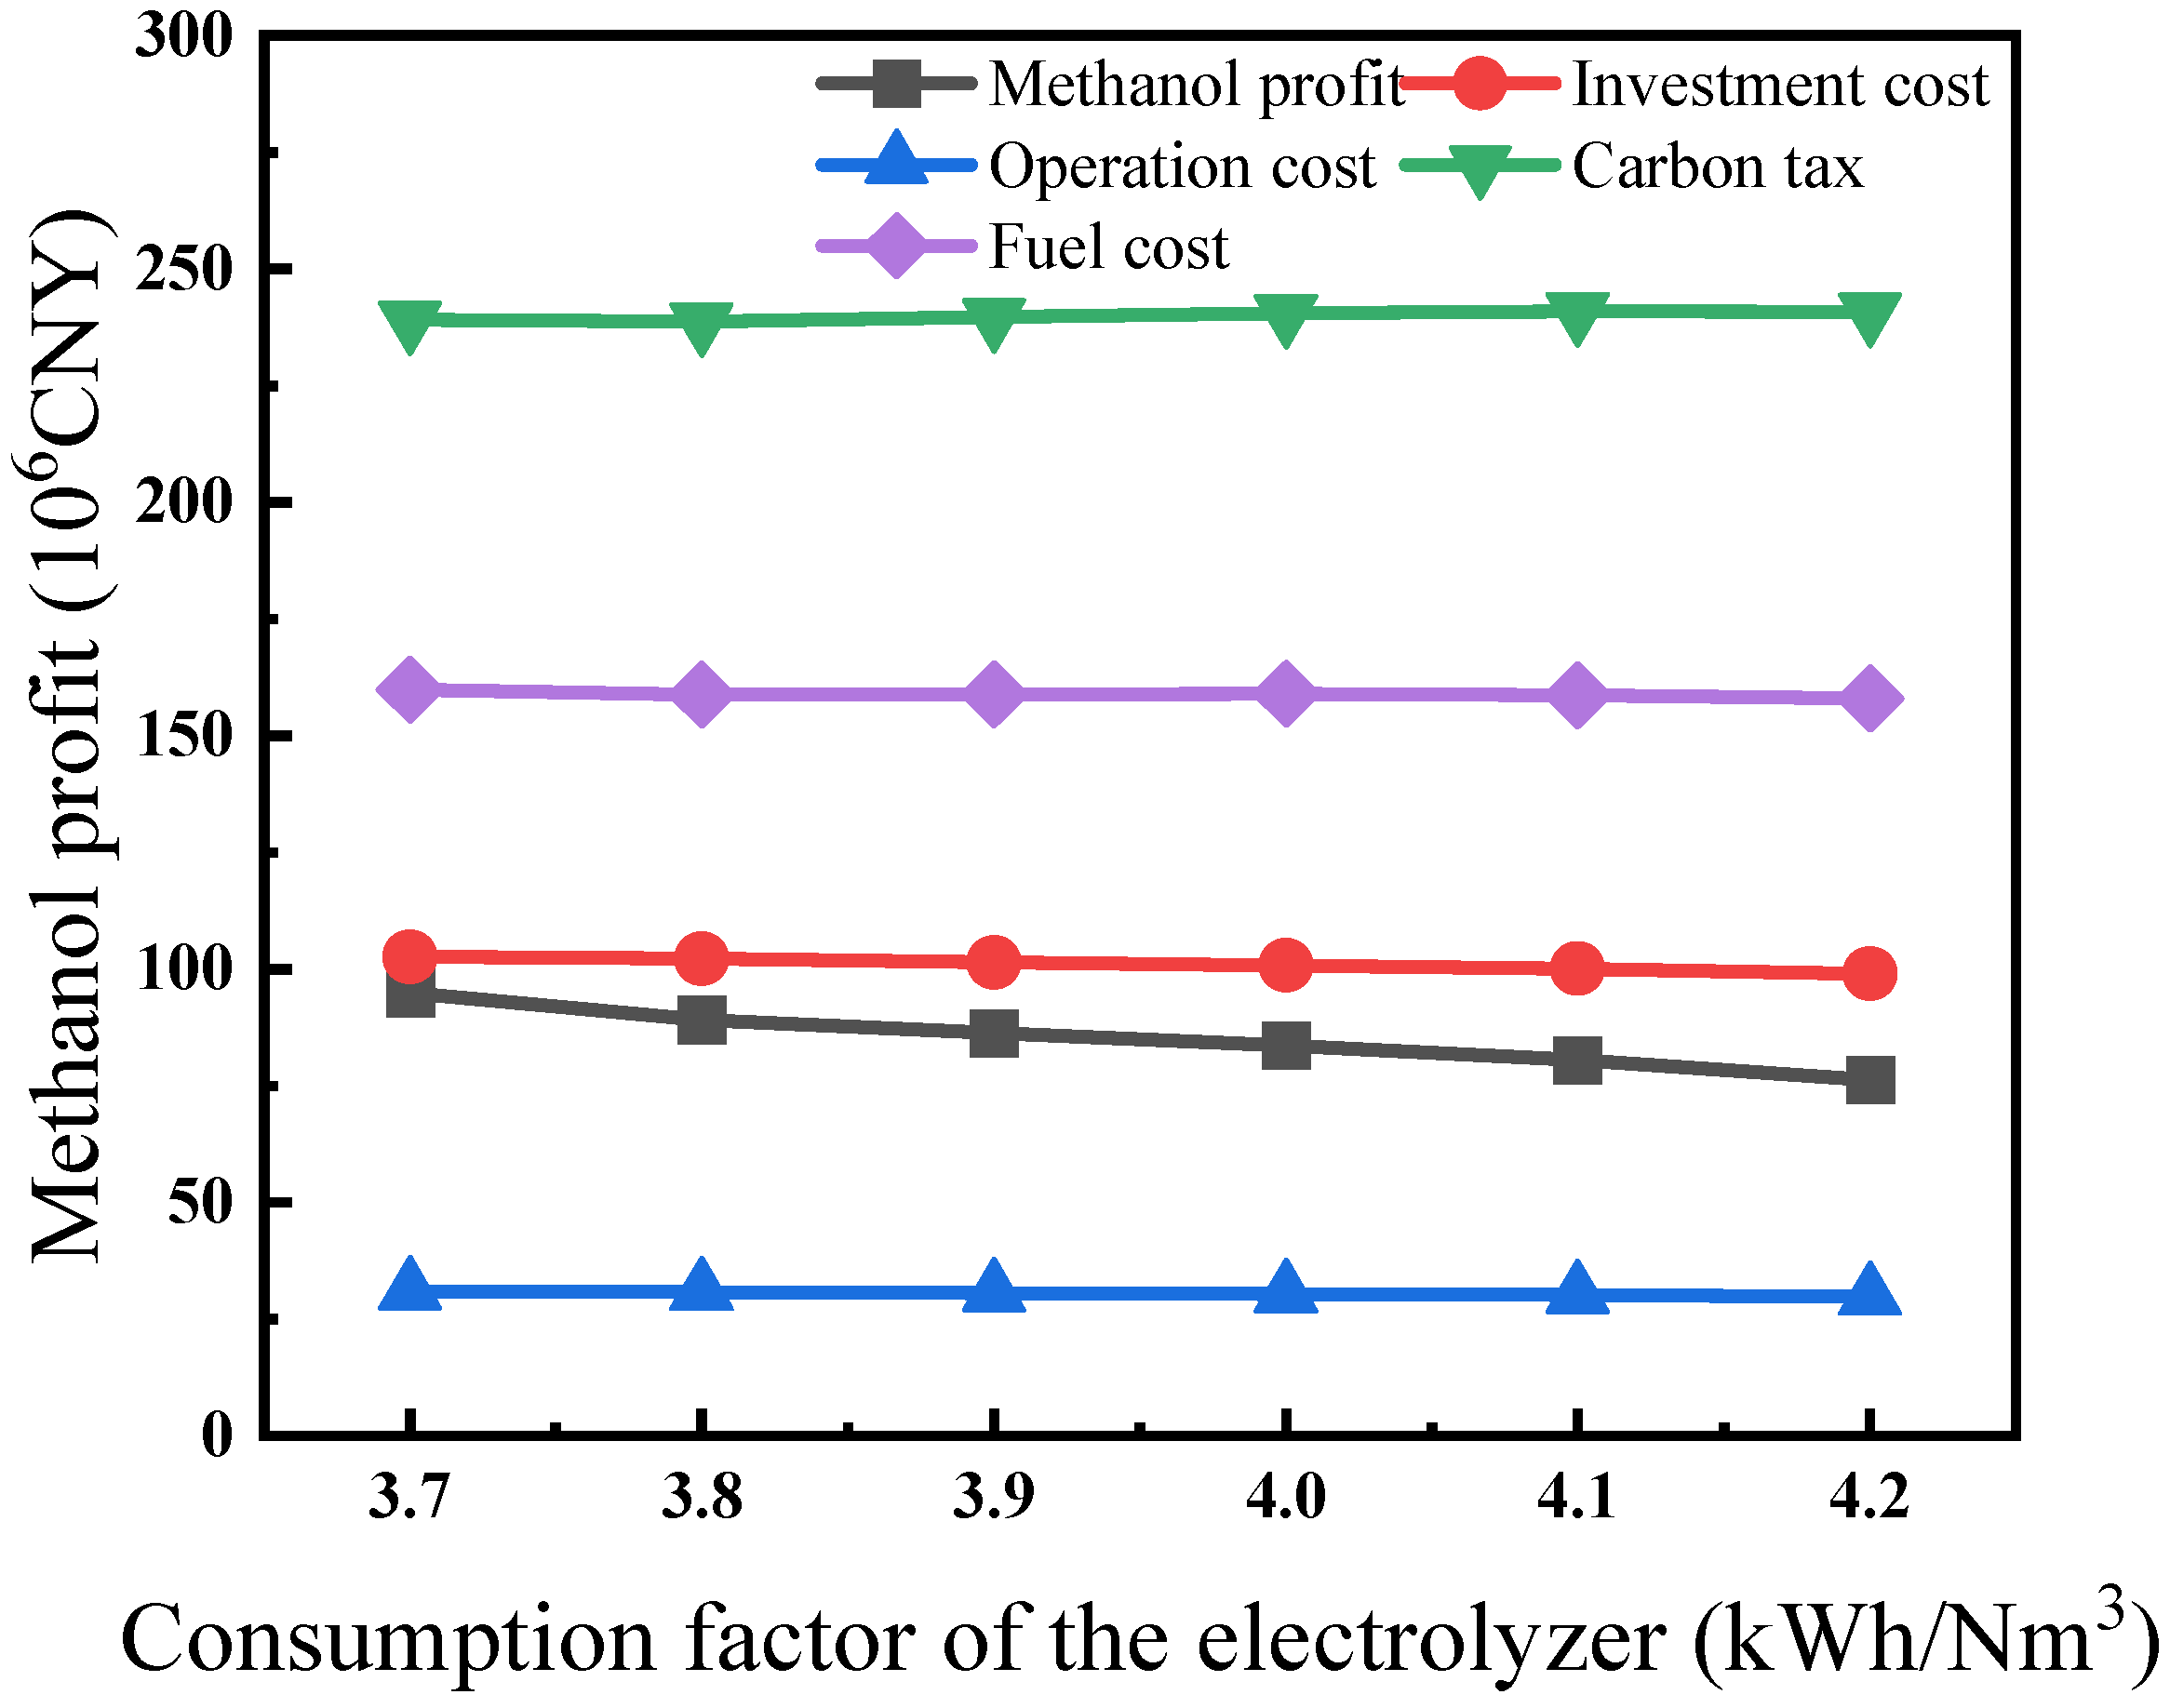
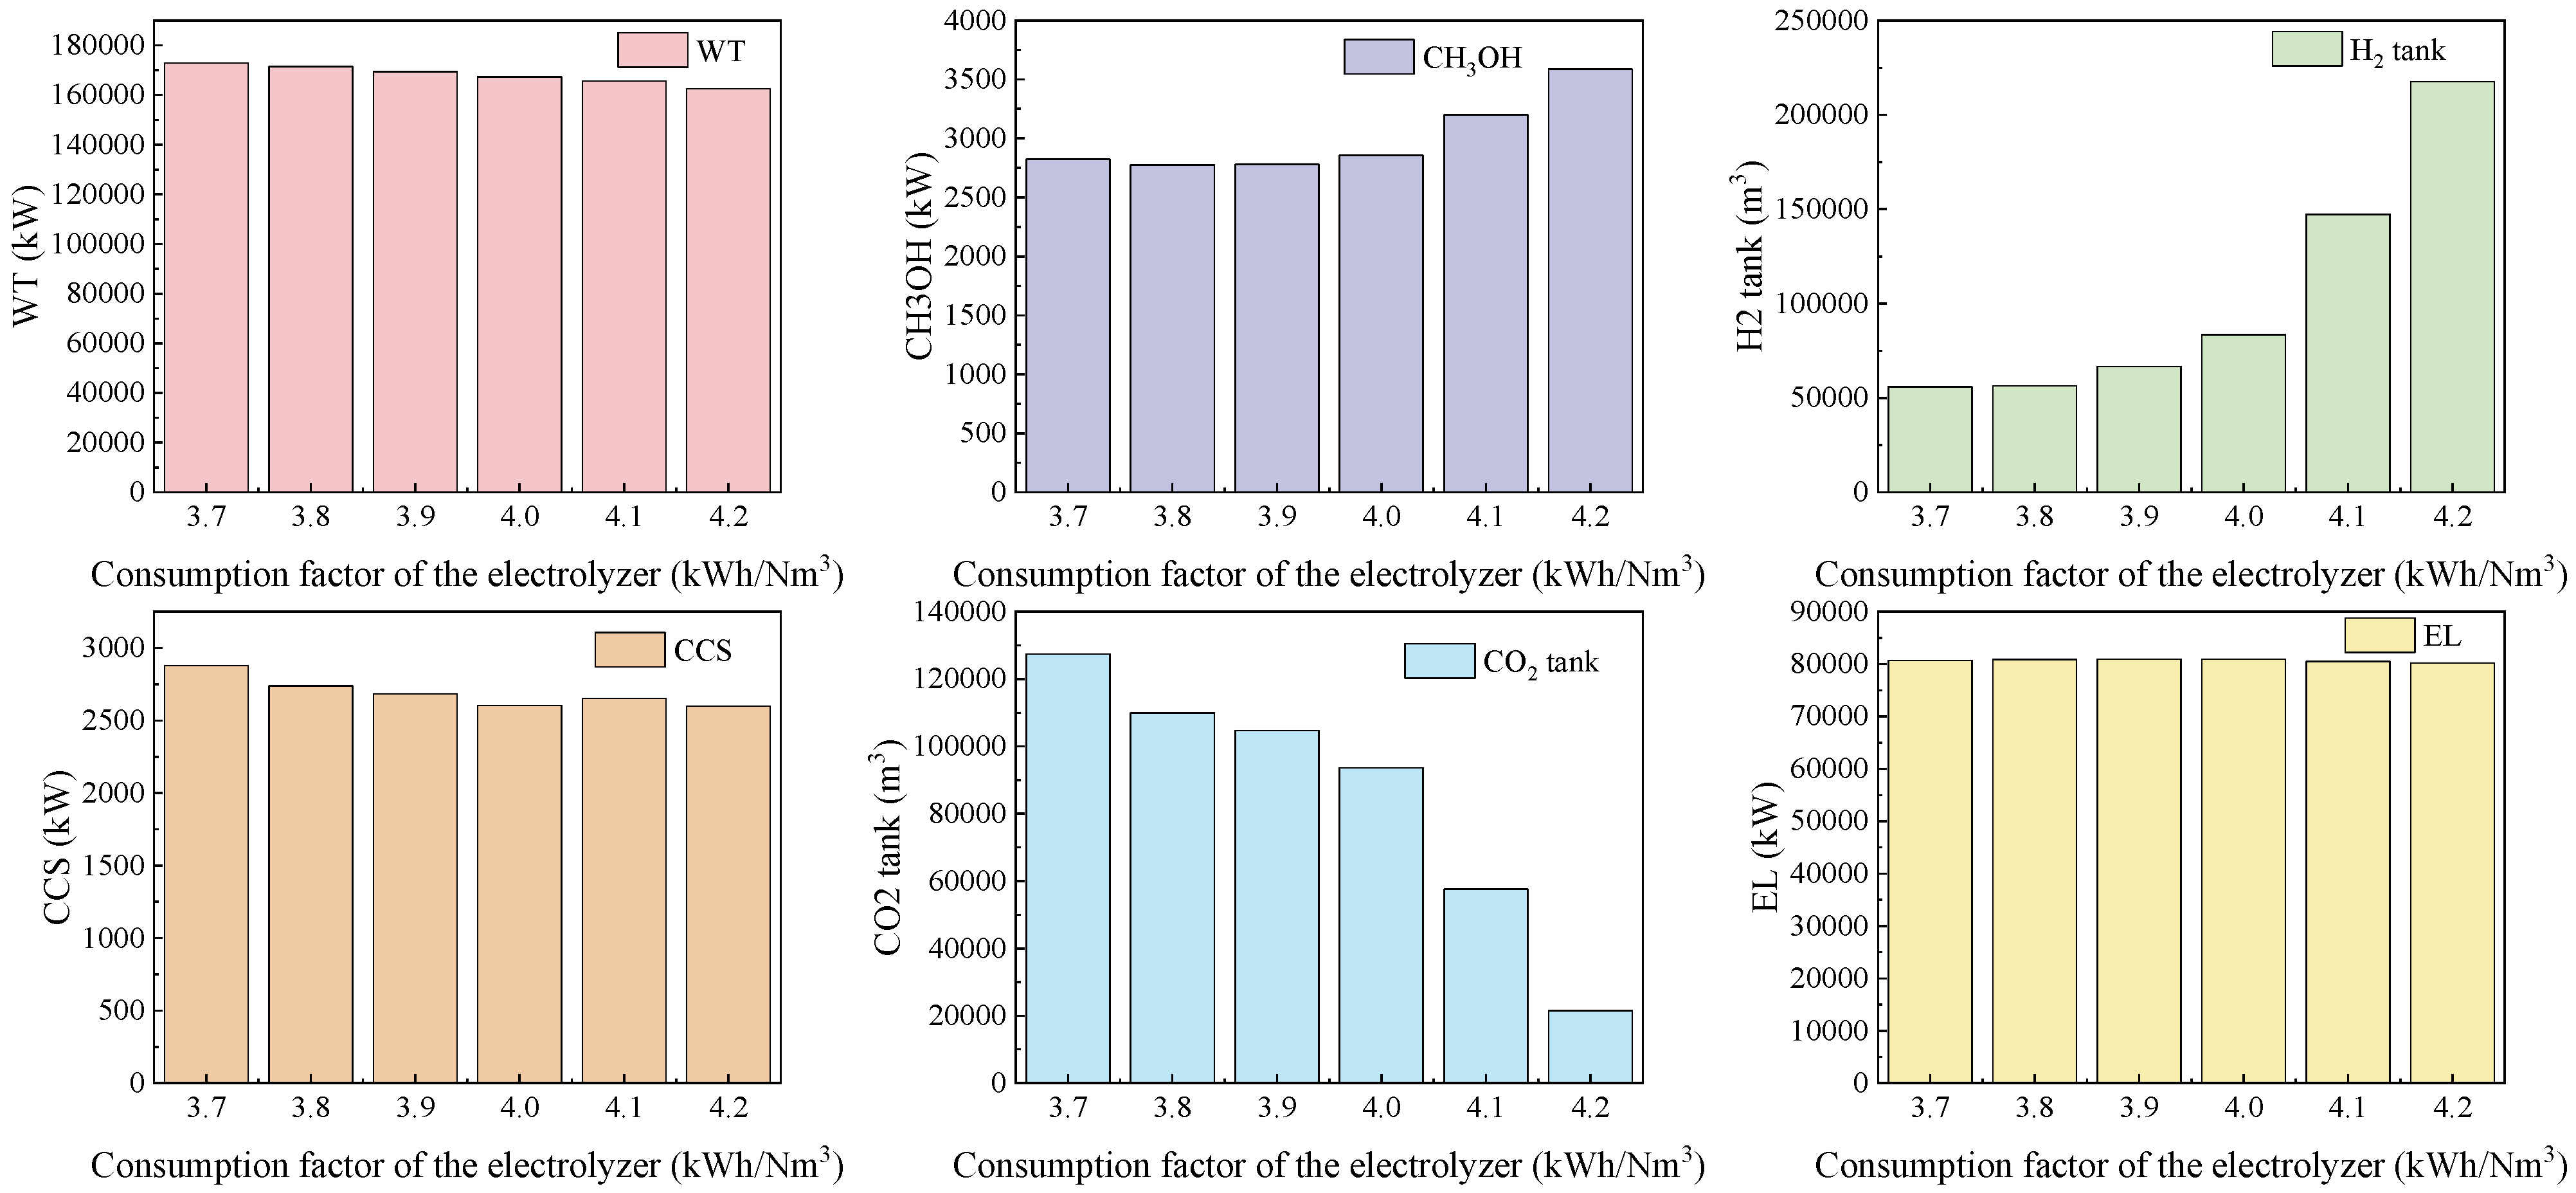
5.2. Sensitivity Analysis of Technical Parameters

The electrolyzer serves as the core component of the P2M system, and its performance significantly influences the operational efficacy of the system. In this section, the electricity consumption factor of the electrolyzer equipment is selected as the independent variable to investigate the variations in various costs and the results of the optimized configurations as the consumption factor of the electrolyzer decreases. The impact of the consumption factor of the electrolyzer on economic performance and its configuration capacity are shown in Figure 12 and Figure 13, respectively.
As illustrated in Figure 12, it is evident that the decline in the consumption factor of the electrolyzer does not significantly alter the various costs on the investment side, which remain relatively stable along a horizontal line. This indicates that the investment costs, operation and maintenance costs, carbon tax penalties, and fuel costs of the P2M system are not highly sensitive to changes in the consumption factor of the electrolyzer. Conversely, methanol profit exhibits a notable increase as the consumption factor of the electrolyzer decreases, suggesting that the total volume of methanol synthesized by the system rises with the reduction in the consumption factor of the electrolyzer. This is attributed to the fact that a lower electricity consumption coefficient directly reduces the energy costs associated with methanol synthesis, thereby enhancing overall methanol production. In addition to the inputs of electrical energy, hydrogen, and carbon dioxide required for methanol synthesis, the process also necessitates investments in the corresponding ancillary equipment. Figure 13 delineates the impact of reducing the consumption factor of the electrolyzer on the optimized configuration results.
Figure 13 illustrates the optimized configuration results of various equipment within the P2M system as the consumption factor of the electrolyzer decreases. It can be observed that with the reduction in the consumption factor of the electrolyzer, the configuration capacities of the WTs, CCS, and EL exhibit minimal changes. In contrast, the capacities of the hydrogen storage tank and methanol synthesis equipment decrease, while the capacity of the carbon storage tank increases. The methanol synthesis equipment, operating at a reduced capacity, produces a greater total volume of methanol, indicating that the methanol synthesis equipment is being utilized more efficiently. The decline in the consumption factor of the electrolyzer enhances the utilization of the electrolyzer within the P2M system.

6. Conclusions

In this paper, a unified configuration and scheduling method that considers the dynamic characteristics of TPG is proposed for the deviation between the scheduling and operation generated by the TPG in the P2M system, which affects the optimization of the capacity configuration of the system. The conclusions drawn from the simulation analysis are as follows:
(1) In comparison to the dynamic model configuration results, the capacity configuration obtained using the steady-state model is overly conservative. The installed capacity of renewable energy is excessively large, failing to account for the energy supply capability of the TPG during dynamic operation.
(2) The capacity configuration of the hydrogen storage tank increases by 94.73%, while the configuration of the electrolyzer remains nearly unchanged. This suggests that the dynamic configuration method effectively taps into the electrochemical energy storage potential of the P2M system.
(3) The configuration capacity of the carbon storage tank is reduced by 58.71%, and a large amount of CO2 is emitted directly into the atmosphere. This suggests that the current carbon tax policy is relatively lenient.
(4) The optimized scheduling results demonstrate that by integrating the electrolyzer as a schedulable energy device into the P2M system, its output peak aligns with the peak of renewable energy generation, effectively supporting renewable energy consumption.

Author Contributions

Conceptualization, J.Y. and L.S.; methodology, J.Y.; software, J.Y.; validation, J.Y. and Y.L.; formal analysis, J.Y.; investigation, K.C.; resources, J.Y.; writing—original draft preparation, J.Y.; writing—review and editing, J.Y.; visualization, Y.L.; supervision, L.S.; project administration, K.C.; funding acquisition, K.C. All authors have read and agreed to the published version of the manuscript.

Funding

This research was funded by Beijing Key Laboratory of Demand Side Multi-Energy Carriers Optimization and Interaction Technique (China Electric Power Research Institute) under grant number YDB51202301443.

Data Availability Statement

The original contributions presented in the study are included in the article, further inquiries can be directed to the corresponding author.

Conflicts of Interest

The authors declare no conflicts of interest.

References

  1. Zuo, F.; Zhang, Y.; Hua, Q.; Sun, L. Unified scheduling and configuration optimization for power to gas system considering thermal dynamics and uncertainties. Sustain. Energy Technol. Assess. 2024, 64, 103711. [Google Scholar] [CrossRef]
  2. Domínguez, R.; Carrión, M.; Oggioni, G. Planning and operating a renewable-dominated European power system under uncertainty. Appl. Energy 2020, 258, 113989. [Google Scholar] [CrossRef]
  3. Zhou, X.; Zhao, Q.; Zhang, Y.; Sun, L. Integrated energy production unit: An innovative concept and design for energy transition toward low-carbon development. CSEE J. Power Energy Syst. 2021, 7, 1133–1139. [Google Scholar]
  4. Mendoza, J.M.F.; Ibarra, D. Technology-enabled circular business models for the hybridisation of wind farms: Integrated wind and solar energy, power-to-gas and power-to-liquid systems. Sustain. Prod. Consump. 2023, 36, 308–327. [Google Scholar] [CrossRef]
  5. Turk, A.; Wu, Q.; Zhang, M. Model predictive control based real-time scheduling for balancing multiple uncertainties in integrated energy system with power-to-x. Int. J. Elec. Power 2021, 130, 107015. [Google Scholar] [CrossRef]
  6. Yang, L.; Wu, X. Net-zero carbon configuration approach for direct air carbon capture based integrated energy system considering dynamic characteristics of CO2 adsorption and desorption. Appl. Energy 2024, 358, 122608. [Google Scholar] [CrossRef]
  7. Guo, J.; Wu, D.; Wang, Y.; Wang, L.; Guo, H. Co-optimization method research and comprehensive benefits analysis of regional integrated energy system. Appl. Energy 2023, 340, 121034. [Google Scholar] [CrossRef]
  8. Huang, W.; Zhang, N.; Yang, J.; Wang, Y.; Kang, C. Optimal Configuration Planning of Multi-Energy Systems Considering Distributed Renewable Energy. IEEE Trans. Smart Grid 2019, 10, 1452–1464. [Google Scholar] [CrossRef]
  9. Giri, B.K.; Roy, S.K. Fuzzy-random robust flexible programming on sustainable closed-loop renewable energy supply chain. Appl. Energy 2024, 363, 123044. [Google Scholar] [CrossRef]
  10. Qiao, Y.; Hu, F.; Xiong, W.; Guo, Z.; Zhou, X.; Li, Y. Multi-objective optimization of integrated energy system considering installation configuration. Energy 2023, 263, 125785. [Google Scholar] [CrossRef]
  11. Gao, M.; Han, Z.; Zhang, C.; Li, P.; Wu, D.; Li, P. Optimal configuration for regional integrated energy systems with multi-element hybrid energy storage. Energy 2023, 277, 127672. [Google Scholar] [CrossRef]
  12. Yang, X.; Zhang, Z.; Mei, L.; Wang, X.; Deng, Y.; Wei, S.; Liu, X. Optimal configuration of improved integrated energy system based on stepped carbon penalty response and improved power to gas. Energy 2023, 263, 125985. [Google Scholar] [CrossRef]
  13. Zhang, X.; Li, J.; Zhang, L.; Wu, B.; Wang, L.; Tang, W.; Guo, Y. IES configuration method considering peak-valley differences of tie lines and operation costs of power grids. IET Energy Syst. Integr. 2020, 2, 92–100. [Google Scholar] [CrossRef]
  14. Elwardany, M.; Nassib, A.M.; Mohamed, H.A. Advancing sustainable thermal power generation: Insights from recent energy and exergy studies. Process Saf. Environ. Prot. 2024, 183, 617–644. [Google Scholar] [CrossRef]
  15. Li, Y.; Zhang, J.; Wu, X.; Shen, J.; Lee, K.Y. Optimal design of combined cooling, heating and power multi-energy system based on load tracking performance evaluation of adjustable equipment. Appl. Therm. Eng. 2022, 211, 118423. [Google Scholar] [CrossRef]
  16. Chang, D.; Shen, J.; Zhang, J. Day-ahead and Intraday Optimal Dispatch Schedule for MGT-IES Considering the Dynamic Characteristics of Main Equipment. In Proceedings of the 2021 6th International Conference on Power and Renewable Energy (ICPRE), Shanghai, China, 17–20 September 2021; pp. 1295–1302. [Google Scholar]
  17. Barros, F.S.; Graça, P.A.; Lima, J.J.G.; Pinto, R.F.; Restivo, A.; Villa, M. Using Recurrent Neural Networks to improve initial conditions for a solar wind forecasting model. Eng. Appl. Artif. Intell. 2024, 133, 108266. [Google Scholar] [CrossRef]
  18. Budinis, S.; Krevor, S.; Dowell, N.M.; Brandon, N.; Hawkes, A. An assessment of CCS costs, barriers and potential. Energy Strat. Rev. 2018, 22, 61–81. [Google Scholar] [CrossRef]
  19. Shao, Y.; He, X.; Yang, C.; Zhu, Y.; Liu, C.; Shao, L.; Gao, X. Techno-economic evaluation of CO2 capture and storage retrofit in decarbonizing different thermal power plants: A case study in China. Appl. Therm. Eng. 2024, 242, 122380. [Google Scholar] [CrossRef]
  20. Bonfiglio, A.; Lodi, M.; Rosini, A.; Oliveri, A.; Procopio, R. Design, realization and testing of a synthetic inertia controller for wind turbine power generators. Sustain. Energy Grids Netw. 2024, 38, 101234. [Google Scholar]
  21. Chang, C.C.W.; Ding, T.J.; Ping, T.J.; Chao, K.C.; Bhuiyan, M.A.S. Getting more from the wind: Recent advancements and challenges in generators development for wind turbines. Sustain. Energy Technol. Assess. 2022, 53, 102731. [Google Scholar]
  22. Zhang, X.; Bai, Y.; Zhang, Y. Collaborative optimization for a multi-energy system considering carbon capture system and power to gas technology. Sustain. Energy Technol. Assess. 2022, 49, 101765. [Google Scholar] [CrossRef]
  23. Khan, M.S.; Lin, Z.; Lin, L.; Abid, M.; Ali, H.M.; Chen, C. Techno-economic analysis of solar-driven co-electrolysis for renewable methanol production using SOEC. Energy Convers. Manag. 2024, 302, 118129. [Google Scholar] [CrossRef]
  24. Ye, J.; Zhang, Y.; Hao, Y.; Lee, K.Y.; Sun, L. Configuration optimization and techno-economic analysis of integrated energy production unit of methane and methanol. Sustain. Energy Technol. Assess. 2024, 69, 103902. [Google Scholar] [CrossRef]
  25. Zhang, X.; Zhang, Y. Environment-friendly and economical scheduling optimization for integrated energy system considering power-to-gas technology and carbon capture power plant. J. Clean. Prod. 2020, 276, 123348. [Google Scholar] [CrossRef]
  26. Zhang, H.; Gao, M.; Fan, H.; Zhang, K.; Zhang, J. A dynamic model for supercritical once-through circulating fluidized bed boiler-turbine units. Energy 2022, 241, 122914. [Google Scholar] [CrossRef]
  27. Haouat, Z.; Essalih, S.; Bennouna, F.; Ramadany, M.; Amegouz, D. Environmental optimization and operational efficiency: Analysing the integration of life cycle assessment (LCA) into ERP systems in Moroccan companies. Results Eng. 2024, 22, 102131. [Google Scholar] [CrossRef]
  28. Fleszar, K. A new MILP model and fast heuristics for the variable-sized bin packing problem with time windows. Comput. Ind. Eng. 2023, 175, 108849. [Google Scholar] [CrossRef]
  29. Zhou, J.; Zhang, W. Coal consumption prediction in thermal power units: A feature construction and selection method. Energy 2023, 273, 126996. [Google Scholar] [CrossRef]
  30. Zuo, F.; Zhang, Y.; Zhao, Q.; Sun, L. Two-stage Stochastic Optimization for Operation Scheduling and Capacity Allocation of Integrated Energy Production Unit Considering Supply and Demand Uncertainty-All Databases. Proc. Chin. Soc. Electr. Eng. 2022, 42, 8205–8214. [Google Scholar]
  31. Jing, R.; Wang, M.; Wang, W.; Brandon, N.; Li, N.; Chen, J.; Zhao, Y. Economic and environmental multi-optimal design and dispatch of solid oxide fuel cell based CCHP system. Energy Convers. Manag. 2017, 154, 365–379. [Google Scholar] [CrossRef]
  32. Fuguo, L.; Xuhui, Z. Determination of load-impacted curve on generation efficiency of coal-fired unit by two-point method. Therm. Power Gener. 2020, 49, 87–92. (In Chinese) [Google Scholar]
  33. Luo, F.; Shao, J.; Jiao, Z.; Zhang, T. Research on optimal allocation strategy of multiple energy storage in regional integrated energy system based on operation benefit increment. Int. J. Electr. Power Energy Syst. 2021, 125, 106376. [Google Scholar] [CrossRef]
Figure 1. Structure of the P2M system hybrid with renewable and conventional power generation.
Energies 18 01210 g001
Figure 2. Flowchart of methanol synthesis process.
Energies 18 01210 g002
Figure 3. Dynamic modeling process of TPG and construction of deviation indicators.
Energies 18 01210 g003
Figure 4. Flowchart of the solution algorithm.
Energies 18 01210 g004
Figure 5. Scheduling results of P2M system with steady-state modeling.
Energies 18 01210 g005
Figure 6. Scheduling results of P2M system with dynamic modeling.
Energies 18 01210 g006
Figure 7. Comparison of TPG tracking effects with steady-state model.
Energies 18 01210 g007
Figure 8. Comparison of TPG tracking effects with dynamic model.
Energies 18 01210 g008
Figure 9. Comparison of steady-state model scheduling instructions and dynamic model scheduling instructions for TPG.
Energies 18 01210 g009
Figure 10. Impacts of equipment investment cost reduction on economic performance.
Energies 18 01210 g010
Figure 11. Impacts of equipment investment cost reduction on optimal capacity configuration.
Energies 18 01210 g011
Figure 12. Impact of the consumption factor of the electrolyzer on economic performance.
Energies 18 01210 g012
Figure 13. Impact of the consumption factor of the electrolyzer on the optimal capacity configuration.
Energies 18 01210 g013
Table 1. Optimization of technical parameters in the configuration.
Technical ParameterUnitQuantity
VelocityCut-in wind velocity v c i m/s2.5
Rated wind velocity v r 5.2
Cut-out wind velocity v c o 5.8
Electricity consumption coefficient of
the electrolyzer λ H 2 [10]
(kWh)/(Nm3H2)4.2
Carbon dioxide emission intensity of the thermal power plant e TPG [29](Nm3CO2)/(kWh)0.46
The maximum CO2 capture efficiency η CCS [29]10.65
Electricity consumption coefficient for the actual
capture of carbon dioxide λ CO 2 [30]
(kWh)/(Nm3CO2)0.3
Coefficient of electricity consumption in the
synthesis of methanol λ CH 3 OH [31]
(kWh)/(Nm3CH3OH)0.15
Conversion factor for methanol ω CH 3 OH 11
Capacity of the thermal power plantMW400
Specific coal consumption for thermal
power generation [32]
kg/(kWh) μ = 0.798 e β / 0.245 + 0.988
Table 2. Economic parameters in the optimized configuration [3].
EquipmentInvestment Cost
(CNY/kW or CNY/Nm3)
Ratio of Operation
Cost to Investment Cost
Wind turbine30000.04
Electrolyzer40000.03
Carbon capture system15000.03
Methanolation equipment30000.05
Hydrogen storage tanks7.760.02
Carbon storage tanks7.760.02
Table 3. Other relevant economic parameters.
CategoryTimePrice
Electricity price [29]01:00–08:000.382 CNY/(kWh)
08:00–12:000.54 CNY/(kWh)
16:00–19:00
22:00–24:000.922 CNY/(kWh)
12:00–16:00
19:00–22:00
Methanol [31]01:00–24:002.0 CNY/kg
Coal price [29]01:00–24:00320 CNY/tce
Carbon tax [33]01:00–24:000.6 CNY/(Nm3)
Table 4. Capacity configuration optimization results.
EquipmentUnitConfiguration ResultRelative Deviation (%)
Steady-State
Model
Dynamic Model
Wind turbineMW169.55162.36−4.24
Methanolation equipmentMW2.913.6926.77
ElectrolyzerMW80.7980.09−0.87
Hydrogen tankkNm3117.96229.7094.72
Carbon dioxide tankkNm390.8137.50−58.71
Carbon capture systemMW2.692.61−2.97
Disclaimer/Publisher’s Note: The statements, opinions and data contained in all publications are solely those of the individual author(s) and contributor(s) and not of MDPI and/or the editor(s). MDPI and/or the editor(s) disclaim responsibility for any injury to people or property resulting from any ideas, methods, instructions or products referred to in the content.

