Abstract
Crises appear to be occurring with increased frequency, whether provoked directly by human actions or through indirect causes such as resource scarcity or natural disasters. Crisis management strategies are frequently implemented with the aim of mitigating the immediate impacts of these crises. Nevertheless, it is critical to also consider the long-term consequences of such strategies. This study investigates both the short- and long-term effects of various crisis management strategies during a financial crisis in relation to the energy transition. An agent-based model of the German electricity sector is developed to analyze the effects of different strategies. The findings suggest that a reduction in electricity demand by 10% achieves the most favorable outcomes, decreasing short-term electricity costs by 11% and long-term carbon dioxide emissions by 9%.
1. Introduction
The COVID-19 crisis has been considered by some as the most severe crisis experienced by Germany since the end of the Second World War [1,2]. Crises across various sectors appear to be occurring with increasing frequency within contemporary society. Economic crises deemed “once in a lifetime”, flood disasters, and gas and energy crises are not unusual occurrences in the 21st century. A burgeoning sense of uncertainty and urgency is further exacerbated by international crises, such as bushfires in Australia and nuclear disasters in Japan, as well as ongoing wars and armed conflicts in Europe and other regions of the world.
Crises seem to manifest not only with greater frequency but also with intensified severity [3]. The ramifications of the COVID-19 pandemic in 2021 (Sars-CoV-2) significantly surpassed those of the 2009 swine flu outbreak (Influenza A [H1N1]) [4]. Similarly, the flood event in Ahr in 2021 [5] in Germany resulted in more severe consequences than the Elbe flood in 2002 [6].
While crisis management strategies were implemented for each of these crises, the trajectories towards recovery demonstrated considerable variation. The pace and efficacy of crisis resolution significantly depend on the specific management strategies adopted. For instance, in 2022, the German government addressed the gas price crisis by instituting a gas price cap, constructing Liquefied Natural Gas (LNG) terminals, and initiating strategic negotiations with international suppliers [7]. Conversely, responses to the 2021 COVID-19 pandemic were primarily characterized by the enforcement of lockdowns and social distancing measures. Evidently, varying types of crises necessitate the adoption of distinct strategies for effective mitigation. Moreover, even though multiple countries may confront the same crisis, their respective responses may differ. During the COVID-19 pandemic, China, Korea, and Singapore pursued a containment strategy, whereas the US, the UK, and France employed a mitigation strategy [8].
In contrast to the aforementioned crises, the climate crisis does not manifest abruptly, like a flood, nor are its effects immediately ascertainable as in the case of a pandemic. This phenomenon occurs gradually and unfolds over several decades or even centuries. Additionally, the climate crisis exerts a global influence, impacting individuals worldwide, unlike localized events such as droughts or armed conflicts. By the time the consequences of the climate crisis become too substantial to overlook, it might be too late to devise and execute a comprehensive long-term strategy to safeguard humanity’s well-being [9].
One crucial measure in tackling the climate crisis involves transitioning from a centralized energy system dependent on fossil fuels to a sustainable energy infrastructure predominantly composed of renewable resources.
To date, crisis management strategies have frequently been formulated with an emphasis on immediate, short-term objectives, addressing only the pressing needs of the present. Nevertheless, it is imperative that these strategies also incorporate an assessment of their potential long-term implications. Predicting the specific long-term outcomes associated with particular strategies remains a challenging endeavor. The repercussions of crises, alongside the respective management strategies, are characterized by their complexity and interconnectedness, rendering them difficult to discern within the intricate dynamics of society. Consequently, there is a requisite need to evaluate which crisis management strategies may be predictive of future outcomes.
In their examination of prospective pathways for energy transition during crisis periods, Gitelman and Kozhevnikov contend that the primary components of transitioning to a renewable energy framework are the reduction of greenhouse gas emissions, alongside ensuring the reliability of energy supply and maintaining acceptable energy cost levels. Drawing upon a synthesis of literature reviews and expert interviews, the authors propose that these goals can be realized through the adoption of advantageous technical policies and instruments that enhance expertise in renewable energy [10].
In an article authored by Steffen, Egli, Pahle, and Schmidt, a conceptual analysis contends that the global pandemic induced by the SARS-CoV-2 virus has exerted a significant influence on energy and climate policies, thereby necessitating a strategic and adaptive response. The authors argue that, in the short term, policymakers are required to protect existing frameworks from potential rollbacks while providing provisional assistance without altering the structure of long-term objectives. As attention shifts toward economic recovery, there exists an opportunity to expedite investments in low-carbon technologies in the midterm by capitalizing on low interest rates and aligning stimulus efforts with climate objectives. In the long term, it is imperative to formulate resilient policies capable of withstanding future shocks, such as adaptive carbon pricing mechanisms, to ensure the ongoing success of the energy transition [11].
In his examination of the 2008 financial crisis, Geels explored the potential ramifications of this crisis on the energy transition. The author employed a combination of conceptual analysis and secondary data analysis to evaluate the primary effects of the crisis, which were determined to be adverse. This negativity was attributed to the crisis causing a reduction in public attention to the climate crisis and renewable energy. While the initial effects on the financial sector were favorable due to the implementation of green stimulus packages, these measures were ultimately discontinued. A possible avenue through which a financial crisis could engender positive outcomes in the energy transition is if it precipitates profound systemic changes in the capitalist system or acts as a catalyst for a “green industrial revolution” [12].
Previous scholarly research on crisis management strategies has primarily relied on literary analysis and expert interviews, largely neglecting the use of computer models for systematic analysis or simulation of these strategies. This oversight has resulted in a considerable gap in comprehending the quantitative evaluation of such strategies, particularly within the framework of long-term energy transition objectives. The present study aims to address this knowledge gap by introducing an innovative approach that utilizes a computer model to systematically investigate crisis mitigation strategies. This contribution aims to establish a solid foundation for future research, offering novel insights into the relationship between the transition to a sustainable energy system and the management of potential future crises.
2. Method
In order to examine the short- and long-term effects of crisis management strategies, a computational model has been developed to represent the German electricity sector. This model is designed to simulate the emergent behaviors of the energy market, with particular emphasis on power-producing entities, owing to their substantial influence on carbon dioxide emissions.
2.1. Model Description
The modeling methodology employed for this analysis is an agent-based approach. Through this approach, each entity within the system is delineated as an agent. Every agent possesses internal states, designated as variables, and a compendium of rules, identified as behaviors within this paper. At each temporal interval, the agents operate in accordance with their variables and behaviors, with regard to their interactions with connected agents. Considering the complexity inherent in the system under investigation, an agent-based model constitutes an apt methodology to acquire deeper insights into the research question [13].
Agent-based modeling constitutes a prevalent methodological approach for the analysis of complex socio-technical systems. The German Aerospace Center (DLR) has adopted this approach to formulate the AMIRIS model, designed to simulate the electricity market. This model is employed to assess the implications of energy policies on the integration of renewable energy sources by simulating the behavior of energy market participants under various conditions, thereby contributing to the formulation of effective policy frameworks for the energy transition [14].
It is anticipated by esteemed researchers that the methodology of agent-based modeling will be of significant value in the future of multidisciplinary research and still possesses considerable potential [15].
The model simulates the developments of the electricity market by projecting annual investments in power generation capacity from 2009 to 2050. The year 2009 serves as the inaugural point for the simulation, utilizing the installed generation capacity data for each power technology sourced from energy-charts.info [16]. The interval spanning 2009 to 2021 functions as a calibration phase to authenticate the simulation’s performance. Subsequent years beyond 2021 are regarded as prospective, as 2022 and 2023 are unsuitable for model calibration. The electricity market’s performance during these two years exhibited irregularities attributed to various occurrences, notably the Russian invasion of Ukraine and the ensuing gas crisis [17]. The year 2050 has been designated as the end of the simulation because it represents the target year for achieving sustainability objectives of numerous different institutions. For instance, the European Union has set a target of achieving carbon neutrality by the year 2050. It is estimated that this timeframe is sufficient to address the research question of this paper. However, it is acknowledged that further research into different crises may necessitate adjustments to this timeframe. Assessment of crisis management strategies is conducted through the analysis of average electricity prices during the crisis and carbon dioxide emissions projected until 2050. The model is entirely implemented in Python to enhance its accessibility and usability. The comprehensive code, together with all requisite data sets and the calibration script, is accessible on GitHub [18].
It is imperative to recognize that the system boundaries were delineated with limited scope. Consequently, critical components and connections are absent from the ultimate model. One such pivotal linkage is the capability of the energy sector to import or export electricity. Considering that Germany engages in relatively minimal energy import and export, it can be reasonably assumed that omitting this feature exerts a negligible influence on the overall model. This issue is further explored in Section 4.
The entities within the system to be modeled are collectively organized to form the agents of the model. Figure 1 provides an overview of these agent groups. Power-producing agents constitute an assemblage of power plants employing identical technologies. For instance, power plants utilizing coal for electricity generation are classified as ‘Coal’ producers. This categorization also applies to other technologies, including gas, nuclear, solar, wind, hydro, and biomass. Gas power plants are further subdivided into agent groups using combustion turbine (CT) and combined cycle (CC) technologies, owing to significant variations in efficiency.
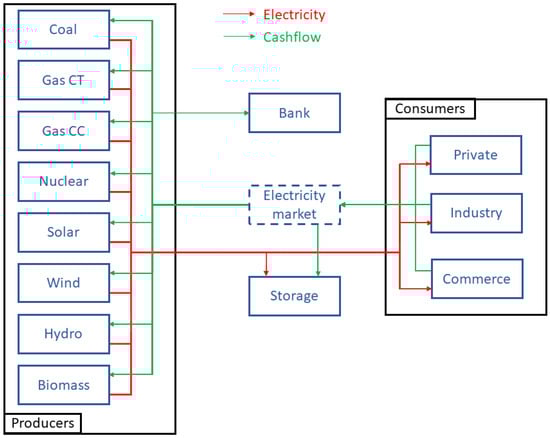
Figure 1.
Overview of the model structure with all agents and connections.
The model exclusively incorporates three categories of power consumers: private consumers, who denote households; industry, which signifies industrial production; and commerce, which symbolizes services and public consumers such as retail, healthcare institutions, and infrastructure demands. The consumption patterns are predetermined and remain unchanged throughout the simulation despite variations in supply, fluctuations in electricity prices, or in the face of the financial crises.
The interconnection between producing and consuming entities is established through the electricity market. At each discrete time step, the electricity market is emulated to ascertain both the power output and the emissions attributable to each agent. This power output, in conjunction with the marginal costs associated with each technology, is utilized to calculate the merit order and thus is used to estimate the wholesale electricity prices for the given simulation period. The simulation of the electricity market is conducted using the Python library PyPSA in the version 0.31.1 [19].
Given the critical role of energy storage in the future advancement of the energy transition, the model incorporates agents to represent pumped hydro, battery, and hydrogen storage. These storage agents are integrated, similar to the producing and consuming agents, through the electricity market. Initially, the simulation includes only pumped hydro storage systems, as this technology is currently dominant in the energy network of Germany. Nevertheless, it is posited that this storage capacity has reached its maximum potential. Battery and hydrogen storage technologies are anticipated to gain prominence in subsequent periods [20]. Consequently, these agents possess the capability to invest in these emerging energy storage technologies throughout the simulation.
The model incorporates a central bank agent to enable loans to producing entities, thereby enabling investment in the expansion of power generation capacity. The interest rates applicable to all producing entities are determined by this central bank, taking into consideration the type of generation technology and the London Interbank Offered Rate (=LIBOR).
The LIBOR serves as a benchmark interest rate, delineating the average rate at which prominent banking institutions are willing to extend credit to one another [21]. Historically, this measure has been extensively employed as a reference rate across a variety of financial instruments and has functioned as a crucial indicator of global financial market dynamics. Despite the recent emergence of alternative indices supplanting the LIBOR within various financial contexts, it is postulated that the LIBOR retains validity for modeling purposes. Within the calibration period, the acquisition of historical LIBOR data is imperative. This dataset is secured from [22]. The index is strategically deployed to integrate the financial crisis scenario into the model. During the specified scenario, a manual escalation of the LIBOR is enacted in 2027, culminating at a peak rate of 13% in 2031, followed by a normalization process by 2037. In the reference scenario as well as both prior to and following the crisis, the LIBOR is maintained at a static level of 0.96%, representing the average LIBOR rate from 2009 to 2021.
2.2. Model Data
The model integrates exogenous data, including developments in resource prices and advancements in technology. Resource prices play a pivotal role in determining marginal costs and, consequently, the wholesale electricity prices, while technological advancements predominantly influence investment costs. These requisite data sets remain constant across all analyzed scenarios. For each data set, historical developments from 2009 to 2021 and projections extending to 2050 are employed. Table 1 presents selected values of all variables that experience changes throughout the simulation, along with their corresponding sources. The table encompasses not only historical and projected resource prices, but also electricity demand and carbon dioxide certificate costs.

Table 1.
Selected values from annually changing parameters.
It is recognized that the projection of the subsequent 29 years is predicated on data spanning merely 12 years. Nevertheless, it is postulated that the analyzed system is unlikely to experience substantial alterations in the forthcoming period. Hence, the utilization of this data is deemed an appropriate basis for the model. It should also be emphasized that the aim is not to proffer a definitive forecast of future events; instead, the intention is to simulate a plausible trajectory grounded on the data available. A more comprehensive exploration of this subject will be elucidated in Section 4.
The model necessitates datasets and parameters that remain constant throughout the simulation. These datasets encompass the LIBOR [22], the generation profile of wind and solar power [30], the consumer load profile [17], the installed power of power plants from 2009 to 2021 [16], the lifespan of various power plant technologies [31], and the operational expenditures (=OPEX) of the different technologies [31,32,33,34]. It should be highlighted that four distinct sources are employed to derive the OPEX. The requirement for multiple sources stems from the considerable variability observed in OPEX values across different references. Therefore, the mean value obtained from these sources is utilized in the model to ensure precision.
2.3. Model Integration
At each time step, the coal, gas, solar, and wind agents assess their desired investment in increasing power generation capacity. As these five agents represent companies, their objective is to maximize the profits generated by selling electricity. In contrast, the nuclear, hydro, and biomass agents do not have the same freedom to invest. As of 2023, all nuclear power plants in Germany have been shut down with no intention of reinstating these facilities [35]. Therefore, nuclear power is only considered during the calibration period from 2009 to 2021. Furthermore, it is assumed that hydro and biomass power plants will not play a major role in the energy-mix as the potential of hydro power is nearly fully utilized [36] and the biomass technology is not suited for a wider usage [37]. Thus, these three agents are unable to increase their installed power during the simulation. The installed power of hydro and biomass remains constant, while nuclear power will phase out until 2023.
For each agent, the investment determination process is grounded in an evaluation of the potential profitability yielded by a newly constructed power plant. Profitability is ascertained through an examination of the requisite investment costs, expenditures, and revenues of the prospective facilities. Investment costs are ascertained by the capital expenditures (CAPEX) for the technology in the simulated year. This parameter is derived from the “2016 Annual Technology Baseline” provided by the NREL [34]. The expenses are quantified based on the operational costs (OPEX) of the technology and the interest incurred on loans needed for the investment costs. The OPEX is derived from a variety of sources, including the NREL [34], Trinomics [31], IEA [32], and Statista [33]. The revenue is calculated based on the electricity costs, marginal cost, and generation profile of the evaluated technology from the previous simulated year. These parameters are subsequently utilized to compute the internal rate of return (IRR), which serves as an indicator of the investment’s profitability.
The increase of capacity is determined by transforming the IRR through an equation. It is essential to acknowledge that the profitability of a technology can fluctuate due to a myriad of factors. To integrate this variability into the model while circumventing an on–off mechanism, a sigmoid function is employed to translate the IRR into the newly installed capacity. In Theorem (1), PI denotes the power increase or investment to be undertaken, MI signifies the maximum augmentation of installed power annually, SL represents the slope of the function, and SH signifies the shift along the x-axis. The IRR serves as the input variable for the function. It should be emphasized that all slope parameters are negative, thereby resulting in a negative exponent.
The sigmoid function yields an output within the range of 0 to 1, which is subsequently multiplied by a predetermined value signifying the maximum power investable within a year. This value has been meticulously established for each agent by evaluating the peak investments made in Germany over a period of 15 years, from 2006 to 2021 [16]. The outcome represents the total increment in power. Each agent’s sigmoid function possesses unique slope and shift parameters, methodically calibrated to correspond with historical investment patterns.
The total installed capacity of the evaluated agent is augmented by the calculated power increment. Complementing this investment mechanism, the model incorporates a feature that simulates the operational lifespan of power plants. Upon reaching the termination of its operational lifespan, a power plant is decommissioned, resulting in the subtraction of its installed capacity from the agent’s total generation capacity.
To evaluate crisis management strategies, the volume-weighted electricity price and the aggregate carbon dioxide emissions are computed at each time step.
The model calibration is conducted using data from 2009 to 2021. An iterative method is applied to refine the slope and shift parameters of the sigmoid functions for each agent, thereby ensuring the most precise representation of the empirical data. During this process, the progression of installed power is systematically observed as these parameters are adjusted. Various parameter configurations are simulated, with the configuration that most accurately corresponds to the empirical data being preserved. The used parameter set is presented in Table 2. For the analysis of the installed power across the five agents and the electricity price, the Normalized Root Mean Square Deviation (NRMSD), as elaborated in Theorem (2), is employed to compute the difference between the model data and the empirical data.
Table 2.
Values of calibrated parameters.
The Normalized Root Mean Square Deviation (NRMSD) is a metric that quantifies the disparity between two data sets while considering the scale of the data. In this context, the data sets in question are the model data (MD) and the empirical data (ED). The computation of the NRMSD entails dividing the Root Mean Square Deviation (RMSD) by the range of the observed data, denoted by the variables ‘N’ and ‘t’ in Equation (2). The RMSD is obtained by calculating the square root of the average of the squared differences between the corresponding values of the data sets.
Figure 2 illustrates the installed capacity of coal, gas, solar, and wind energy agents from 2009 to 2021. In the graph, the model data are represented as dotted lines, while the empirical data are shown as solid lines. The model has been meticulously calibrated to achieve the utmost possible concordance with the empirical data. Although the model does not capture the empirical data with complete precision, it adeptly simulates the overall trajectory of the electricity market’s evolution, which is sufficient for the ensuing analysis. In addition to this, a sensitivity analysis has been conducted, which will be further discussed in Section 4.
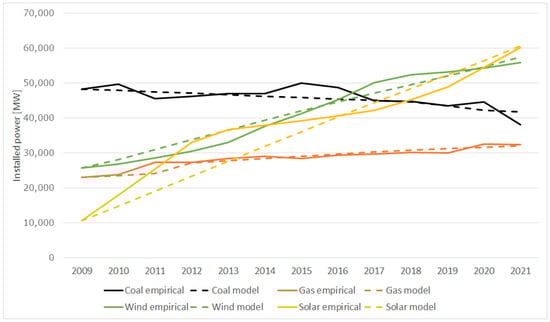
Figure 2.
Graphical comparison of the historical installed power and the model data of coal, gas, solar, and wind power plants.
The model has been developed to examine management strategies during a financial crisis. Such a crisis is precipitated by human actions across various financial markets and typically exerts global repercussions beyond the initial country of origin. The implications of a financial crisis may extend beyond local markets, given the interconnectedness and interdependence of the financial systems of numerous countries. Nonetheless, this research focuses exclusively on the repercussions within the German electricity sector. During a financial crisis, interest rates on loans tend to rise, adversely affecting borrowing costs for both businesses and individuals. Additionally, banks tend to exercise greater caution in loan disbursement, resulting in a reduction of investments during the crisis period. In the short term, effects may include liquidity shortages, which can precipitate bank failures, stock market crashes, business closures, and job losses. In the long term, these consequences can culminate in an economic recession, a downturn in housing markets, increased government debt, and rising unemployment [38].
The financial crisis is simulated within the model by artificially elevating the London Interbank Offered Rate (LIBOR) for the year 2027, thereby increasing the interest rates on loans accessed by power producers. Consequently, there is a reduction in investments towards the establishment of new power plants, leading to a diminished power generation capacity as older power plants are decommissioned from the grid upon reaching their operational lifespan. As a result, meeting the energy demand necessitates the utilization of power plants characterized by higher marginal costs and elevated carbon emissions. Consequently, both electricity prices and carbon dioxide emissions experience an upsurge during the crisis period.
2.4. Model Validation
In the following chapter, a comprehensive exposition of the methodologies utilized for model validation is provided. This procedure is crucial to ascertain that the model operates as intended and accurately represents the system under analysis.
The validation of a computational model may be accomplished through diverse methodologies. Simpler approaches include empirical validation, sampling, and the visualization of model results. In contrast, more sophisticated techniques encompass bootstrapping, causal analysis, inverse generative social science, and role-playing. To prevent an excessive broadening of the article’s scope, the discourse will concentrate solely on the specifically chosen validation method, alongside a short explanation as to why certain methods are not applicable. It is essential to recognize that the most suitable method for the model under consideration has been identified. Moreover, it is recognized that each method has its unique applicability; however, there is no universally optimal validation method for agent-based models. Consequently, the validation methodology for each model may vary [13,39].
It is imperative to acknowledge that the model creation process is characterized by its iterative nature. Consequently, the model creation processes of validation, verification, and calibration exhibit a high degree of overlap.
Various validation methods, such as docking, empirical validation, bootstrapping, and causal analysis, could not be employed. Docking cannot be utilized as the existing investment models, such as FENIA from Fraunhofer IOSB or Invest from Fraunhofer ISE, are too dissimilar to the model in this study for effective validation purposes [40,41].
Bootstrapping is dependent on the availability of large and comprehensive datasets, which are not accessible for the model under consideration. Similarly, empirical validation is unfeasible due to the lack of data on the German electricity market. Employing data from other countries is not viable, as the current form of the model is confined to representing the investment market of Germany. Causal analysis, which aims to identify explicit cause-and-effect relationships between system entities, is not applicable in this context. This is due to the model’s emphasis on emergent behaviors within the energy market, which are derived from aggregate interactions rather than direct causal pathways [39].
Data analytics is a foundational methodology concentrated on the systematic examination and processing of data to derive insights. It serves a pivotal function in model validation by facilitating the organization, cleansing, and analysis of both input and output data. This method is critical for maintaining data transparency and identifying anomalies that may indicate potential errors or opportunities for improvement [39].
Sampling is another foundational validation method defined as the process of systematically selecting input parameter values to explore a model’s behavior under varying conditions. This process enables the identification of how alterations in inputs affect outputs, thereby supporting sensitivity analysis and validation [39].
In the case of the agent-based model of this study, both of these methodologies are used in combination to enhance the validation process. A comprehensive evaluation of the input and output data is conducted to identify anomalies in output data that arise during the modification of various model parameters and inputs. This multifaceted validation process has led to the identification of various erroneous behaviors and results within the simulation, which have been rectified prior to the repetition of this validation process. A visualization of some of the results of this validation can be seen in Figure 3.
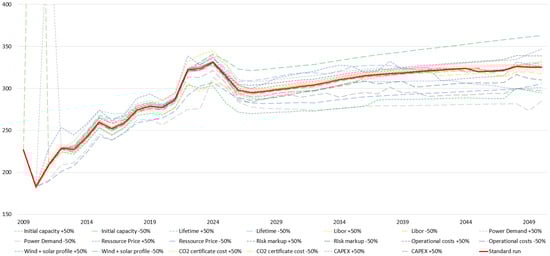
Figure 3.
Validation results, electricity price developments for different input data scenarios.
In Figure 3, the results of the model validation process are presented. This figure depicts the progression of electricity prices across 20 scenarios, with the input data of 10 parameters being varied by 50% in both directions. The majority of scenarios exhibit trajectories that closely correspond to the standard run. Significant deviations from this standard run are observed in the scenarios wherein the input datasets power demand, resource prices, and the generation profiles for solar and wind power undergo modifications. These deviations conform to the anticipated system behavior, thus affirming the robustness of the model. In scenarios where the initial installed capacity is reduced by 50%, and the power demand is increased by an equivalent amount, the electric price in the first simulated year exhibits a substantial increase, which can be ascribed to the imbalance between supply and demand. Following this initial surge, the electricity price reverts to a state of equilibrium, similar to the standard run trajectory. As can be seen, all scenarios manifest consistent trends in the evolution of electricity prices, thereby highlighting the stability, robustness, and reliability of the model’s predictive capabilities.
Another validation method that may be used to ensure the reliability and accuracy of the model involved conducting expert interviews. In this particular validation method, experts in the field of the system to be modeled are interviewed to ensure that the behaviors of the agents and thus the emergent behavior of the model are correct. In the context of the model analyzed in this study, the consultation was directed towards experts in the domain of energy economics, with the objective of ascertaining the accuracy of the model’s representation of agent investment behaviors. The formulation of the rules for the producing agents is predicated on the insights derived from these expert interviews. Since the information from this interview was utilized as the foundation for the model’s creation process, it cannot be used as a validation for the model at hand. For the sake of comprehensiveness, this limitation is acknowledged in this chapter [13].
3. Results
3.1. Scenario Description
The model is utilized to simulate a total of eleven distinct scenarios. The initial two scenarios comprise the ‘reference run’, in which no crisis is introduced, and the ‘crisis only’ run, which involves the occurrence of a crisis without the application of any crisis management strategy. The subsequent nine scenarios entail the implementation of diverse crisis management strategies:
- Governmental securities.
- Governmental securities, renewables only.
- Increased maximum invest.
- Increased maximum invest, renewables only.
- Increased funding, renewables only.
- Increased funding, renewables and gas CC.
- Increased storage.
- Decreased demand.
- Increased lifetime.
The ‘government securities’ strategy provides investment security to energy producers, which can be interpreted as a form of governmental subsidy. This subsidy is modeled as a reduction in interest rates on loans by 3%, lowering the risk markup of coal to 3%, gas to 2%, and solar and wind to 0%. Consequently, this strategy enhances investment in new power plants during financial crises.
The phrase ‘renewables only’ signifies that the strategy is exclusively implemented with respect to renewable agents. For example, in the second scenario, ‘governmental securities, renewables only’, financial instruments are exclusively allocated to agents utilizing solar and wind energy, whereas the initial strategy permits allocation to all agents engaged in power production.
In scenarios three and four, a strategic approach is adopted to augment the maximum annual investment capacity. This may be accomplished by enhancing the production capability of essential power plant components, such as solar panels or wind turbines. To incorporate this enhancement into the model, the variable representing the maximum feasible investment in each time step is doubled, increasing the maximum possible investment in coal power plants to about 12,000 MW, gas to 7000 MW, solar to 32,000 MW, and wind to 20,000 MW. In scenario three, this strategy is implemented universally across all producers. In scenario four it is only applied to the renewable energy producers. These measures also facilitate augmented investment in electricity generation during periods of crisis.
The strategy of ‘increased funding’ entails the allocation or augmentation of compensation for power producers for each megawatt hour of electricity generated. In practice, power plants utilizing renewable technology are already provided with a predetermined remuneration for every unit of electricity they contribute to the grid. In scenarios 5 and 6, this compensation is elevated from 0 to 30 euros per megawatt hour. In scenario six, a remuneration scheme is implemented for gas combined cycle (CC) facilities, as these represent the most efficient fossil fuel power plants. Here, the compensation is augmented from 35 to 65 euros per megawatt hour.
In scenario seven, there is an augmentation of the storage agent’s investment to enhance electricity storage capacity across the entire system. This scenario involves a twofold increase in investments allocated to battery and hydrogen storage technologies. This is done by doubling the maximum possible capacity investments to 20,000 MWh for battery storages and to 500,000 MWh in the case of hydrogen storages.
In scenario eight, the implementation of energy-saving measures results in a 10% reduction in electricity demand during the crisis. Subsequent simulations were performed with reductions of 20% and 5%; however, a reduction of 10% was determined to be the most effective. As demonstrated by the occurrences following the 2011 nuclear crisis in Japan, it is possible to achieve a reduction in electricity consumption of approximately 15% [42]. This topic is analyzed more comprehensively in Section 4.
In the context of scenario nine, power plants approaching the conclusion of their operational lifecycle are accorded an extension of an additional five years to their lifespan.
Where relevant, all strategies are initiated at the inception of the crisis and concluded once the London Interbank Offered Rate (LIBOR) reverts to its levels preceding the crisis.
3.2. Model Results
Figure 4 depicts the outcomes of the reference run, which excludes the financial crisis and any management strategies. The strategies are assessed by examining the trajectory of electricity prices and carbon dioxide emissions. These evaluation metrics are illustrated in the graph spanning from 2009 to 2050. Within this reference scenario, the electricity price experiences a gradual ascent post-2024 peak, culminating in a maximum of approximately 330 euros per megawatt-hour by 2050. Concurrently, carbon dioxide emissions remain relatively stable throughout the duration of the simulation.
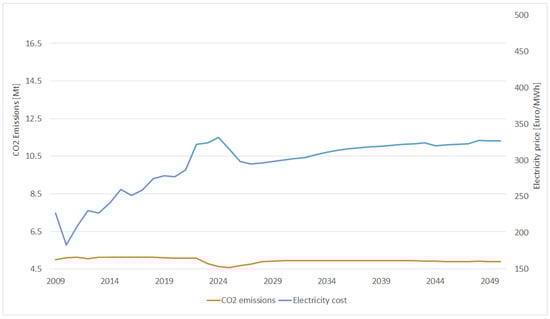
Figure 4.
Carbon dioxide emissions and electricity price of the reference run from 2009 to 2050.
Figure 5 illustrates the outcomes of the crisis-only scenario, which demonstrates a substantial deviation from the reference scenario. The electricity price and CO2 emissions associated with this scenario are juxtaposed with the results of the reference scenario to facilitate direct comparison. In this scenario, the financial crisis is enacted without any management strategy, leading to a pronounced escalation in both control variables. During the crisis, the electricity price escalates to 490 Euros per megawatt-hour, while emissions increase by more than 300%. Subsequent to the crisis, both variables diminish to levels comparable to those noted in the reference scenario.
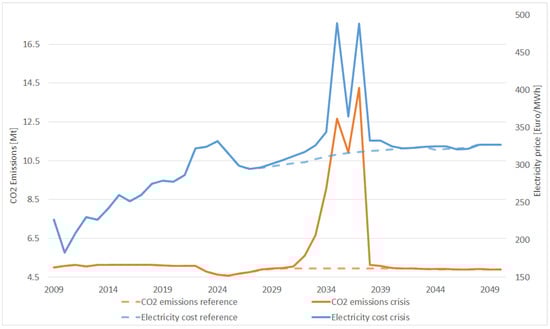
Figure 5.
Carbon dioxide emissions and electricity price of the reference and crisis run from 2009 to 2050.
The eighth scenario yields the most favorable outcomes for the two evaluation variables. In this scenario, electricity demand is reduced by 10% between 2027 and 2037. Historical data suggests that a 10% reduction in power demand is a plausible expectation. For instance, during the summer of 2011, subsequent to the nuclear meltdown at the Fukushima nuclear power plant in Japan, the Tokyo Electric Power Company (TEPCO) reported an 18% reduction in peak consumption compared to the preceding year [43]. Figure 6 presents the two evaluation variables alongside the outcomes of the reference run and the crisis-only scenario. It is evident that electricity prices and emissions continue to rise during the crisis period; however, this escalation occurs later and with diminished intensity. During the crisis, electricity prices reach 360 euros per megawatt-hour. Nonetheless, the acme of electricity prices and CO2 emissions is achieved immediately after the crisis. This phenomenon can be attributed to the system’s adaptation over the ten-year period of reduced electricity demand. Upon returning to pre-crisis demand levels, the system undergoes further readjustment, resulting in a slight increase in both electricity prices and CO2 emissions. Subsequent to this realignment, energy prices and emissions diminish to levels akin to those observed during the crisis scenario.
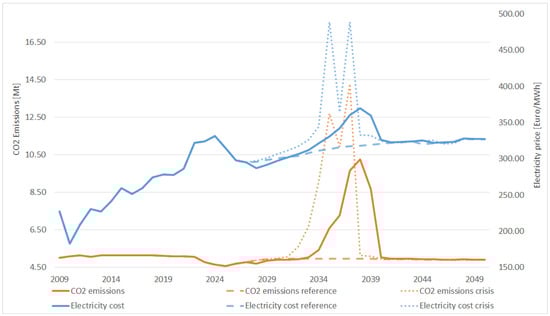
Figure 6.
Carbon dioxide emissions and electricity price of the reference and crisis run and the 10% decreased demand scenario from 2009 to 2050.
3.3. Optimal Strategy
Figure 7 illustrates the normalized electricity prices alongside carbon dioxide emissions for all examined strategies. The mean electricity price is assessed for the period spanning 2027 to 2037, a timeframe that encompasses the crisis. Meanwhile, the CO2 emissions are evaluated over the interval from 2027 to 2050, thereby facilitating an assessment both during and subsequent to the crisis. Both average metrics are normalized relative to the crisis-exclusive outcomes.
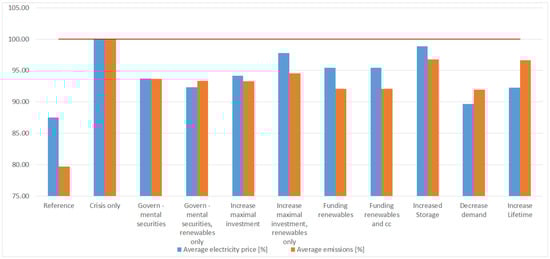
Figure 7.
Strategy comparison of all scenarios with average electricity price and emissions of all strategies, normalized on crisis only run.
Figure 7 illustrates that a financial crisis within the electricity sector is anticipated to lead to a 13% escalation in average electricity costs and a 20% rise in average CO2 emissions. The principal aim of the strategies under scrutiny is to mitigate these two variables.
As previously articulated, the ‘Decreases Demand’ strategy is identified as the most efficacious in diminishing both electricity costs and emissions. Relative to the crisis-only scenario, this strategy achieves an 11% reduction in electricity costs and a 9% decrease in emissions. Among the considered strategies, it demonstrates the largest average mitigation across both parameters.
The ‘Governmental Securities, Renewable Only’ and ‘Governmental Securities’ strategies rank as the second and third optimal strategies, respectively, when averaging across both parameters. These strategies reduce energy costs by 8% and 6%, and emissions by 7% and 6%, respectively.
Conversely, if analysis is confined to a singular evaluation parameter, the ranking of optimal strategies differs. Regarding electricity costs alone, the ‘Increase Lifetime’ and ‘Governmental Securities, Renewables Only’ strategies emerge as the second and third most favorable, effectuating an approximate 8% reduction in electricity prices. When examining carbon dioxide emissions in isolation, both ‘Funding Renewables’ and ‘Funding Renewables and CC’ strategies are recognized as the second and third most effective, each contributing to an approximate 8% reduction in emissions.
4. Discussion
The findings of this study indicate that a management approach involving a 10% reduction in electric energy consumption represents an optimal strategy to mitigate financial crises associated with short-term electricity pricing and long-term carbon dioxide emissions. As previously mentioned, a 10% reduction in electricity demand is feasible. Such a reduction was indeed observed in Japan in response to the Fukushima catastrophe. In the aftermath of the nuclear reactor meltdown, all nuclear power plants were shut down, leading to a considerable decrease in energy supply. Consequently, the government instituted energy-saving regulations that proved to be highly effective, resulting in an 18% reduction in peak loads [43].
In addition to this 10% reduction, a comprehensive series of simulations were executed wherein diverse reductions were applied to the electricity demand. The findings reveal that a diminution in energy demand of less than 10% is insufficient to yield a significant reduction in the evaluation parameters. Conversely, a more pronounced decrease in energy demand would lead to suboptimal outcomes in terms of energy costs and emissions. This phenomenon can be attributed to the system’s adaptation process to the altered level of energy demand. In the event of a resurgence in demand, the system is likely to be overwhelmed, precipitating a surge in electricity prices and carbon dioxide emissions, an undesirable consequence. Thus, the optimal reduction in energy demand is approximately 10%. Attaining a further reduction in demand is feasible through the strategic implementation of a gradual adjustment to the new energy demand, thereby facilitating the system’s adaptation to any potential increase in demand.
Furthermore, a sensitivity analysis of the model was conducted, in which multiple simulations were executed while the parameters and data sets were modified extensively. The findings of this analysis indicate that minor alterations in parameters and variables can result in significant discrepancies in simulation results. However, the model’s self-regulation effect has been demonstrated to effectively mitigate the majority of these variations. Consequently, the model was determined to be sufficiently robust to address the research question.
The principal conclusion of this study is that there is significant variability in the effectiveness of different strategies. Certain strategies currently utilized by authorities are suboptimal concerning the two evaluation metrics employed in this study. Consequently, these management strategies are not recommended when the primary goals include reducing electricity prices in the short term and decreasing carbon dioxide emissions over the long term. It is imperative, therefore, to perform a pre-crisis evaluation of the potential impacts of the crisis management strategies to be implemented, to facilitate the most effective response to the crisis.
It is imperative to acknowledge that the outcomes of this study are not intended to foresee future developments. The precise forecasting of future events is inherently challenging due to the complex and uncertain nature of real-world phenomena. The progression of future scenarios is influenced by an intricate web of variables, encompassing social, economic, technological, and environmental factors, each possessing distinctive trajectories and interconnections. The inherent non-linearity of these systems further complicates accurate outcome prediction. Moreover, human perception is prone to biases and constrained by limited information, impacting the accuracy of projections. The rapid and unforeseen evolution of innovations and disruptive occurrences might render historical data inadequate for future predictions. Consequently, the findings delineated in this paper should not be construed as definitive guides for action. Rather, this paper is intended to propose efficacious solutions to emergent challenges that may arise during crises by delineating possible variable outcomes.
The reliability of the findings derived from this study is constrained by several factors. Firstly, a computer model cannot wholly encapsulate the complexity of a real-world system; it merely serves as an approximation. Furthermore, the model’s scope is narrowly defined, omitting critical system components such as the consumer aspect. The incorporation of dynamic consumption into the analysis may result in variable outcomes due to the influence of a crisis and applicable management strategies on consumer energy consumption behavior. Additionally, in the actual energy market, power plants engage in competition with one another, which additionally complicates interactions between system stakeholders. The model excludes various technical and economic parameters pertinent to power plants, each of which operates under distinct conditions. These complexities were necessarily simplified to enable the development of the model delineated in this paper. It is imperative to acknowledge that with the introduction of human elements within a system, predicting their behavior with absolute precision becomes unattainable. This unpredictability stems from the inherently erratic nature of human responses, especially during crises. Moreover, the model presumes the absence of temporal delays between the planning and construction phases of new power plants. Additionally, economic feasibility methodologies, both within and external to the energy market, are not considered in the model. Moreover, an analysis of cost-benefit has not yet been conducted for the strategies under consideration. The financial implications associated with the implementation of the examined crisis management strategies remain unquantified, a factor that is crucial for a comprehensive evaluation of various crisis management strategies.
Future research may enhance the model by integrating additional factors currently omitted, such as the planning and construction phases of power plants, market mechanics including supply and demand, a cost analysis of crisis management strategies, and the option to import or export energy. Additionally, the model must incorporate consumer psychology during crises, as individuals tend to exhibit unpredictable behavior in such situations. Furthermore, to comprehensively analyze crisis management strategies, it is imperative to encompass a wider array of crises within the model. This will necessitate modifications to include the requisite mechanisms pertinent to each crisis type, acknowledging that each crisis distinctly impacts the system. Due to these uncertainties, this study can be regarded as a proof of concept for the selected analytical method.
Evidently, the agent-based modeling approach employed in this study is particularly well-suited for analyzing both the short- and long-term effects of crisis management strategies. Such an agent-based modeling approach can be utilized in future studies, thereby expanding the scope of research in this field.
5. Conclusions
In this study a computational model of the German electricity sector is developed, focusing on the investment behavior of electricity producers. The model is utilized to analyze both the short-term and long-term effects of crisis management strategies aimed at mitigating financial crises. The study’s objective is to identify the optimal strategy concerning immediate electricity pricing and long-term carbon dioxide emissions.
In conclusion, the most efficacious approach to alleviating the consequences of the electricity costs of a financial crisis in the short-term, while concurrently reducing CO2 emissions in the long-term, is to achieve a 10% reduction in electricity consumption during the period of the crisis. Such a reduction is anticipated to lead to an 11% decline in electricity costs and a 9% decrease in CO2 emissions till 2050.
The findings of this study suggest that several strategies, initially regarded as the most effective for attaining optimal outcomes, fail to achieve the most favorable results within the energy market concerning short-term electricity prices and long-term carbon dioxide emissions. The majority of the examined strategies exhibited a similar effect on the two evaluation parameters.
As elaborated in Section 4, this study is subject to inherent limitations prompted by the simplifications implemented during the model development process. Consequently, the resultant outcomes of the model should not be interpreted as future predictions nor as guiding frameworks for entities like governmental authorities. Instead, this study serves as a proof of concept, substantiating the analytical methodology of agent-based modeling in examining crisis management strategies. Additionally, it may serve as an initial framework for subsequent research within the interdisciplinary domain of crisis management and transition research.
Further investigation is necessary to explore additional categories of crises and regions, as well as improve the accuracy of the model and thus its results, thereby establishing a framework for decision-making by authorities. It is imperative that each unique type of crisis impacting the energy market be individually integrated into the computational model. Consequently, it is crucial to conduct further research with the objective of analyzing additional crisis types and management strategies. In addition, the model has been developed exclusively with Germany as a case study. To enhance its versatility, it is imperative that additional regions be incorporated into the model. To improve the precision of the outcomes, it is vital to refine the model itself. As previously mentioned in Section 4, the model construction process entailed several simplifications. These limitations could be addressed in subsequent research to enhance the overall accuracy of the results.
To expedite the energy transition, it is imperative to assess the efficacy of diverse crisis management strategies in scenarios concerning this transition. The evidence from this study indicates that certain strategies may yield more advantageous outcomes in both the short and long term compared to others. Consequently, it is essential that a thorough evaluation of crisis management strategies be undertaken prior to their implementation. This would enable decision-makers to respond optimally to potential future crises. Therefore, a more robust and comprehensive model is required to enhance the accuracy of results and to facilitate the analysis of various crises with differing management strategies.
Author Contributions
Conceptualization, T.S. and A.N.; methodology, T.S. and A.N.; software, T.S.; validation, T.S. and A.N.; formal analysis, T.S. and A.N.; investigation, T.S.; resources, T.S.; data curation, T.S.; writing—original draft preparation, T.S. and A.N.; writing—review and editing, T.S. and A.N.; visualization, T.S.; supervision, T.S. and A.N.; project administration, T.S. and A.N.; funding acquisition, T.S. and A.N. All authors have read and agreed to the published version of the manuscript.
Funding
This research was funded by the Open Access Publication Fund of the TH Köln.
Data Availability Statement
The original data presented in the study are openly available at [18].
Conflicts of Interest
The authors declare no conflicts of interest.
Abbreviations
The following abbreviations are used in this manuscript:
| LNG | Liquid natural gas |
| DLR | Deutsches Zentrum für Luft- und Raumfahrt (German aerospace center) |
| CT | Combustion turbine |
| CC | Combined cycle |
| LIBOR | London interbank offered rate |
| IRR | Internal rate of return |
| NRMSD | Normalized root mean square deviation |
| TEMPCO | Tokyo electric power company |
References
- Nicola, M.; Alsafi, Z.; Sohrabi, C.; Kerwan, A.; Al-Jabir, A.; Iosifidis, C.; Agha, M.; Agha, R. The socio-economic implications of the coronavirus pandemic (COVID-19): A review. Int. J. Surg. 2020, 78, 185–193. [Google Scholar] [CrossRef]
- Austermann, F.; Shen, W.; Slim, A. Governmental responses to COVID-19 and its economic impact: A brief Euro-Asian comparison. Asia Eur. J. 2020, 18, 211–226. [Google Scholar] [CrossRef] [PubMed]
- Levy, D.; Mayer, T.; Raviv, A. Economists in the 2008 financial crisis: Slow to see, fast to act. J. Financ. Stab. 2020, 60, 100986. [Google Scholar] [CrossRef]
- da Costa, V.G.; Saivish, M.V.; Santos, D.E.R.; de Lima Silva, R.F.; Moreli, M.L. Comparative epidemiology between the 2009 H1N1 influenza and COVID-19 pandemics. J. Infect. Public Health 2020, 13, 1797–1804. [Google Scholar] [CrossRef]
- Truedinger, A.J.; Jamshed, A.; Sauter, H.; Birkmann, J. Adaptation after Extreme Flooding Events: Moving or Staying? The Case of the Ahr Valley in Germany. Sustainability 2023, 15, 1407. [Google Scholar] [CrossRef]
- Kreibich, H.; Thieken, A.H.; Petrow, T.; Müller, M.; Merz, B. Flood loss reduction of private households due to building precautionary measures—Lessons learned from the Elbe flood in August 2002. Nat. Hazards Earth Syst. Sci. 2005, 5, 117–126. [Google Scholar] [CrossRef]
- Březovská, R.; Zachmann, G.; Sgaravatti, G.; Pellerin-Carlin, T.; Nguyen, P.V.; Leuser, L.; Thalberg, K.; Panzeri, D.; Galindo, J. United in Diversity? National Responses to the European Energy Crisis. Climate Paper No. 16. 2022. Available online: https://institutdelors.eu/wp-content/uploads/2022/05/20220530_AMO_United_in_diversity-3.pdf (accessed on 8 November 2024).
- Chen, H.; Shi, L.; Zhang, Y.; Wang, X.; Jiao, J.; Yang, M.; Sun, G. Response to the COVID-19 Pandemic: Comparison of Strategies in Six Countries. Front. Public Health 2021, 9, 708496. [Google Scholar] [CrossRef] [PubMed]
- Umweltbundesamt. Beobachtete und Künftig zu Erwartende Globale Klimaänderung. 2022. Available online: https://www.umweltbundesamt.de/daten/klima/beobachtete-kuenftig-zu-erwartende-globale#aktueller-stand-der-klimaforschung- (accessed on 12 August 2024).
- Gitelman, L.; Kozhevnikov, M.V. New Approaches to the Concept of Energy Transition in the Times of Energy Crisis. Sustainability 2023, 15, 5167. [Google Scholar] [CrossRef]
- Steffen, B.; Egli, F.; Pahle, M.; Schmidt, T. Navigating the Clean Energy Transition in the COVID-19 Crisis. Joule 2020, 4, 1137–1141. [Google Scholar] [CrossRef] [PubMed]
- Geels, F. The impact of the financial-economic crisis on sustainability transitions: Financial investment, governance and public discourse. Environ. Innov. Soc. Transitions 2013, 6, 67–95. [Google Scholar] [CrossRef]
- Dam, K.H.; Nikolic, I.; Lukszo, Z. Agent-Based Modelling of Socio-Technical Systems; Springer: Dordrecht, The Netherlands, 2012. [Google Scholar]
- Schimeczek, C.; Nienhaus, K.; Frey, U.; Sperber, S.; Sarfarazi, S.; Nitsch, F.; Kochems, J.; Ghazi, A.E. AMIRIS: Agent-based Market model for the Investigation of Renewable and Integrated energy Systems. J. Open Source Softw. 2023, 8, 5041. [Google Scholar] [CrossRef]
- Chappin, E.; Nikolic, I.; Yorke-Smith, N. Agent-Based Modelling of the Social Dynamics of Energy End-Use. In Energy and Behaviour: Towards a Low Carbon Future; Lopes, M., Henggeler, C., Janda, K., Eds.; Academic Press: Cambridge, MA, USA, 2019; pp. 321–351. [Google Scholar] [CrossRef]
- Frauenhofer ISE Installierte Netto-Leistung zur Stromerzeugung in Deutschland. 2023. Available online: https://energy-charts.info/charts/price_spot_market/chart.htm?l=de&c=DE&interval=year&year=2009 (accessed on 12 August 2024).
- Bundesnetzagentur. SMARD: Marktdaten Visualisieren. 2024. Available online: https://www.smard.de/home/marktdaten (accessed on 12 August 2024).
- Schell, T. ABM Electricity Sector Germany. 2023. Available online: https://github.com/TimSchell98/ABM_electricity_sector_Germany (accessed on 8 November 2024).
- Brown, T.; Hörsch, J.; Schlachtberger, D. PyPSA: Python for Power System Analysis. J. Open Res. Softw. 2018, 6, 4. [Google Scholar] [CrossRef]
- Hossain, E.; Faruque, H.M.R.; Sunny, M.S.H.; Mohammad, N.; Nawar, N. A Comprehensive Review on Energy Storage Systems: Types, Comparison, Current Scenario, Applications, Barriers, and Potential Solutions, Policies, and Future Prospects. Energies 2020, 13, 3651. [Google Scholar] [CrossRef]
- Coulter, B.; Shapiro, J.; Zimmerman, P. A Machanism for LIBOR. Rev. Financ. 2017, 22, 491–520. [Google Scholar] [CrossRef]
- Triami Media BV. LIBOR—Most Recent and Historical LIBOR Interest Rates. 2024. Available online: https://www.global-rates.com/en/interest-rates/libor/ (accessed on 12 August 2024).
- Energy Institute. Energy Institute Based on S&P Global Platts—Statistical Review of World Energy; Energy Institute: London, UK, 2023. [Google Scholar]
- Birol, D.F.; Priddle, R. World Energy Outlook 2016; IEA: Paris, France, 2016; Available online: https://www.iea.org/reports/world-energy-outlook-2016 (accessed on 12 August 2024).
- Kohlenstatistik, e.V. Energiepreise Zeitreihe. 2023. Available online: https://kohlenstatistik.de/wp-content/uploads/2023/01/enpr.xlsx (accessed on 28 February 2024).
- International Monetary Fund Uranium/US Dollar. 2024. Available online: https://data.imf.org/?sk=471dddf8-d8a7-499a-81ba-5b332c01f8b9&sid=1393552803658 (accessed on 12 August 2024).
- Umweltbundesamt Stromverbrauch. 2024. Available online: https://www.umweltbundesamt.de/daten/energie/stromverbrauch (accessed on 12 August 2024).
- Gustedt, V.; Greve, B.; Brehm, C.; Halici, C. Netzentwicklungsplan Strom 2037 mit Ausblick 2045, Version 2023; Zweiter Entwurf der Übertragungsnetzbetreiber. 2023. Available online: https://www.netzentwicklungsplan.de/ (accessed on 12 August 2024).
- Trading Economics. EU Carbon Permits; Trading Economics: New York, NY, USA, 2024; Available online: https://tradingeconomics.com/commodity/carbon (accessed on 12 August 2024).
- Open Power System Data Renewable Power Plants. 2020. Available online: https://data.open-power-system-data.org/renewable_power_plants/2020-08-25 (accessed on 12 August 2024).
- European Commission: Directorate-General for Energy; Badouard, T.; Moreira de Oliveira, D.; Yearwood, J.; Torres, P.; Altman, M. Final Report Cost of Energy (LCOE): Energy Costs, Taxes and the Impact of Government Interventions on Investments. Publications Office. 2020. Available online: https://trinomics.eu/wp-content/uploads/2020/11/Final-Report-Cost-of-Energy-LCOE.pdf (accessed on 12 August 2024).
- IEA. Projected Costs of Generating Electricity; IEA: Paris, France, 2020; Available online: https://www.iea.org/reports/projected-costs-of-generating-electricity-2020 (accessed on 12 August 2024).
- U.S. Energy Information Administration Cost and Performance Characteristics of New Generating Technologies, Annual Energy Outlook 2023. 2023. Available online: https://www.eia.gov/outlooks/aeo/assumptions/pdf/elec_cost_perf.pdf (accessed on 12 August 2024).
- NREL (National Renewable Energy Laboratory). 2016 Annual Technology Baseline; National Renewable Energy Laboratory: Golden, CO, USA, 2016. Available online: https://www.nrel.gov/docs/fy16osti/66944.pdf (accessed on 12 August 2024).
- Federal Office for the Safety of Nuclear Waste Management. The Nuclear Phase out in Germany; Federal Office for the Safety of Nuclear Waste Management: Berlin, Germany, 2024. Available online: https://www.base.bund.de/en/nuclear-safety/nuclear-phase-out/nuclear-phase-out_content.html (accessed on 12 August 2024).
- Umweltbundesamt. Nutzung von Flüssen: Wasserkraft. 2023. Available online: https://www.umweltbundesamt.de/themen/wasser/fluesse/nutzung-belastungen/nutzung-von-fluessen-wasserkraft#wasserkraftnutzung-global (accessed on 12 August 2024).
- Tzelepi, V.; Zeneli, M.; Kourkoumpas, D.S.; Karampinis, M.; Gypakis, A.; Nikolopoulos, N.; Panagiotis, G. Biomass Availability in Europe as an Alternative Fuel for Full Conversion of Lignite Power Plants: A Critical Review. Energies 2020, 13, 3390. [Google Scholar] [CrossRef]
- Kroeger, F. The development, escalation and collapse of system trust: From the financial crisis to society at large. Eur. Manag. J. 2015, 33, 431–437. [Google Scholar] [CrossRef]
- Collins, A.; Koehler, M.; Lynch, C. Methods That Support the Validation of Agent-Based Models: An Overview and Diccussion. J. Artif. Soc. Soc. Simimulations 2024, 27, 1–32. [Google Scholar] [CrossRef]
- Fraunhofer IOSB. IOSB-Strommarktmodell FENIA—Optimierung des Kraftwerkparks; Fraunhofer IOSB: Karlsruhe, Germany, 2021; Available online: https://www.iosb-ast.fraunhofer.de/de/abteilungen/kognitive-energiesysteme/modelle-energiewirtschaft/energieoptimierung/IOSB_strommarktmodell_FENIA.html (accessed on 20 November 2024).
- Fraunhofer-Institut für Solare Energiesysteme ISE. Open Source Investitionsentscheidungsmodell für neue Technologien. 2024. Available online: https://www.ise.fraunhofer.de/de/geschaeftsfelder/systemintegration/energiesystemanalyse/energiesystemmodelle-am-fraunhofer-ise/inve2st.html (accessed on 20 November 2024).
- IEA. Saving Electricity in a Hurry 2011; IEA: Paris, France, 2011; Available online: https://www.iea.org/reports/saving-electricity-in-a-hurry-2011 (accessed on 20 November 2024).
- Wakiyama, T.; Zusman, E.; Monogan, J.E. Can a low-carbon-energy transition be sustained in power-Fukushima Japan? Assessing the varying impacts of exogenous shocks. Energy Policy 2014, 73, 654–666. [Google Scholar] [CrossRef]
Disclaimer/Publisher’s Note: The statements, opinions and data contained in all publications are solely those of the individual author(s) and contributor(s) and not of MDPI and/or the editor(s). MDPI and/or the editor(s) disclaim responsibility for any injury to people or property resulting from any ideas, methods, instructions or products referred to in the content. |
© 2025 by the authors. Licensee MDPI, Basel, Switzerland. This article is an open access article distributed under the terms and conditions of the Creative Commons Attribution (CC BY) license (https://creativecommons.org/licenses/by/4.0/).