Article

A WGAN-GP Approach for Data Imputation in Photovoltaic Power Prediction

1
China Southern Power Grid Research Technology Co., Ltd., Guangzhou 510663, China
2
Qingyuan Yingde Power Supply Bureau, Guangdong Power Grid Limited Liability Company, Qingyuan 513000, China
3
School of Electrical Engineering and Automation, Wuhan University, Wuhan 430072, China
*
Author to whom correspondence should be addressed.
Energies 2025, 18(5), 1042; https://doi.org/10.3390/en18051042
Submission received: 21 January 2025 / Revised: 12 February 2025 / Accepted: 19 February 2025 / Published: 21 February 2025
(This article belongs to the Special Issue Solar and Wind Energy Prediction and Its Application Technology)

Abstract

:
The increasing adoption of photovoltaic (PV) systems has introduced challenges for grid stability due to the intermittent nature of PV power generation. Accurate forecasting and data quality are critical for effective integration into power grids. However, PV power records often contain missing data due to system downtime, posing difficulties for pattern recognition and model accuracy. To address this, we propose a GAN-based data imputation method tailored for PV power generation. Unlike traditional GANs used in image generation, our method ensures smooth transitions with existing data by utilizing a data-guided GAN framework with quasi-convex properties. To stabilize training, we introduce a gradient penalty mechanism and a single-batch multi-iteration strategy. Our contributions include analyzing the necessity of data imputation, designing a novel conditional GAN-based network for PV data generation, and validating the generated data using frequency domain analysis, t-NSE, and prediction performance. This approach significantly enhances data continuity and reliability in PV forecasting tasks.

1. Introduction

The rapid increase in energy demand and growing concerns about climate change have driven the adoption of renewable energy sources, particularly photovoltaic (PV) systems. Over the past decades, PV technology has become more affordable due to significant cost reductions and supportive global policies, enabling its integration into energy markets [1]. However, the intermittent and variable nature of PV power generation poses challenges for grid stability, reliability, and efficiency [2]. Accurate PV power generation forecasting is essential to address these challenges, as it optimizes grid operations, minimizes balancing costs, and supports energy trading [3]. Moreover, accurate forecasts enhance the integration of PV systems with storage solutions, electric vehicles, and smart grid technologies [4].
Existing PV forecasting methods, including physical modeling, traditional machine learning, and deep learning approaches, focus heavily on model design [5,6,7,8]. However, these methods are inherently data-driven, and their performance is heavily influenced by data quality. PV power generation records often contain missing data due to system downtime caused by equipment failures, aging, maintenance, or reduced energy demand [9]. These data gaps increase the difficulty of identifying patterns or can mislead models into generating incorrect predictions, especially for short-term prediction [1].
Currently, missing PV power generation data are often excluded from training datasets, which can result in problems such as spectral leakage and phase discontinuity in time-domain signals. A more desirable approach is to use interpolation methods [9]. For sequences with the point-type missing data, linear interpolation and cubic spline interpolation generally perform well under sunny conditions. However, these methods struggle to adapt to abrupt weather changes [10]. Moreover, when the PV output power data are subjected to the block-type missing, the accuracy of interpolation methods declines significantly [11]. For sequences with consecutive missing data points, data imputation remains a highly challenging problem.
Although there are many of approaches with different levels of sophistication for imputation tasks, they are usually failed to fill PV power data due to time series observed in every field has unique characteristics [1].
To address these issues, we propose a GAN-based data imputation method specifically designed for PV power generation. Unlike forecasting tasks, the data imputation task lacks ground truth, requiring a different training strategy for the network.
Traditional GANs are primarily used for image generation, where the input is typically random noise. In our task, however, the generated data must maintain smoothness with neighboring known data points. This requires an infinite-label conditional GAN framework. GAN training is already recognized as a challenging problem, and the requirement for infinite labels further increases the difficulty.
To overcome these challenges, we leverage the fact that PV power generation data are predominantly positive. We designed a data-guided GAN network with a structure that exhibits quasi-convex properties. By introducing a gradient penalty mechanism and employing a single-batch multi-iteration strategy, we stabilized the model training process.
Traditional GAN [12] uses the Jensen–Shannon (JS) divergence to measure the difference between real and generated data distributions, but suffers from mode collapse and training instability. Wasserstein GAN (WGAN) [13] replaces JS divergence with Earth Mover’s distance, providing a smoother and more meaningful loss function. However, it requires weight clipping to enforce the Lipschitz constraint, which can lead to optimization issues. WGAN-GP [14] improves WGAN by replacing weight clipping with a gradient penalty, resulting in more stable training, better convergence, and superior sample quality compared to both GAN and WGAN. For these reasons, we adopt WGAN-GP for the PV data imputation network.
Our main contributions include:
(1)
Proposing the Concept of Data Imputation
Using discrete cosine transform, we analyzed the effects of interruptions in time-domain signals and demonstrated the necessity of imputing PV power generation data.
(2)
Designing a PV Data Imputation Network
Based on the conditional GAN framework, we constructed a data-guided network structure with quasi-convex properties to address the challenges of imputing PV generation data.
(3)
Validating the Generated Data
We evaluated the effectiveness of the generated data using three approaches: frequency domain analysis, t-NSE analysis, and comparative prediction performance.
The remainder of this paper is organized as follows: Section 2 provides an overview of the related methods. Data continuity analysis is presented in Section 3. The proposed method is described in Section 4. In Section 5, the experiments are conducted and the results are discussed. Finally, the conclusion is provided in Section 6.

2. Related Work

Existing studies on PV power generation have primarily focused on the design of forecasting models, with limited attention given to data imputation. However, various studies have been conducted on data imputation in the wider fields. These methods can be roughly divided into three categories: (1) interpolation-based methods, (2) classical machine learning methods, and (3) deep learning-based methods.

2.1. Interpolation-Based Methods

Interpolation-based methods are the basic and plain approaches that estimate missing values based on mathematical functions using neighboring data points. Due to high computational speed, Interpolation-based methods have been applied in the wide fields. These methods include linear interpolation, spline interpolation and nearest neighbor interpolation [15]. For example, Brooks et al. [16] use linear interpolation, Autoregressive Integrated Moving Average (ARIMA) methodology and decompositions to replace missing values in global horizontal solar irradiance series. Layanun et al. [17] propose use of a linear interpolation approach based on the mean of solar irradiance values under different weather types. Benitez et al. [18] expanded the column mean imputation method for solar PV output forecasting.
Only two data points are required to construct new data points or estimate the missing data [15]. Demirhan and Renwick [1] compared the accuracy of 36 classical imputation methods for solar irradiance series and found that linear and Stineman interpolations, and Kalman filtering with structural model and smoothing are accurate for minutely and hourly series. However, the estimation quality is reduced when the period of continuous missing data increases.

2.2. Classical Machine Learning Methods

Machine learning-based methods excel in capturing complex, non-linear relationships and leveraging large datasets to improve imputation accuracy. They usually outperform the interpolation-based methods [19]. As a result, machine learning-based methods have been the mainstream choice for handling missing data.

2.2.1. Regression-Based Methods

Regression-based methods utilize statistical models to predict missing values based on relationships within the available data. Due to their simplicity, interpretability, and effectiveness in leveraging relationships within the data, regression-based imputation methods have garnered significant attention. For instance, Miguel et al. [20] utilized regression trees to impute indoor condition data effectively. Similarly, Jain Vinith et al. [21] employed polynomial regression to enhance the performance of PV power prediction by addressing missing data challenges. Chen et al. [22] proposed a low-rank autoregressive tensor completion method, which incorporated temporal variation as a regularization term, demonstrating its capability to handle spatiotemporal data gaps effectively. Jain et al. [21] also explored polynomial regression for estimating missing values. Additionally, Turrado et al. [23] proposed multivariate adaptive regression splines as a generalized approach to estimating missing values across classification and regression tasks.
Despite their merits, regression-based imputation methods have limitations. They often assume a linear or predefined relationship between variables, which may not hold in complex or nonlinear scenarios. Additionally, their performance relies significantly on the quality and representativeness of the observed data. When data are sparse, highly dynamic, or exhibits non-linear dependencies, these methods may fail to accurately capture underlying patterns, leading to suboptimal imputations.

2.2.2. Other Machine Learning Methods

Beyond regression-based approaches, various other classical machine learning methods have been widely applied to data imputation. These methods often demonstrate higher flexibility and robustness when dealing with missing data, especially in cases where relationships between variables are highly non-linear.
For example, Tatiane Costa et al. [24] suggested that Random Forest (RF) model notably excels in harnessing solar data. Stekhoven and Bühlmann [25] developed a RF-based method capable of imputing mixed data types, while Kim et al. [26] introduced K-Nearest Neighbors for adaptive imputation, which estimates missing values based on historical data patterns.
Unlike interpolation-based and regression-based methods, non-regression-based machine learning models can learn patterns from the entire dataset, making them more effective for handling missing data in complex and non-linear environments. However, they struggle with long-range correlations and large missing gaps.

2.3. Deep Learning-Based Methods

2.3.1. Supervised Learning Methods

Supervised learning methods have been widely applied to impute missing values. Silva-Ramirez et al. [27] employed a Multi-Layer Perceptron (MLP), training it on complete data to impute missing measurements in partially filled samples. For PV power generation data, Liu et al. [28] employed a Super-Resolution Perception Convolutional Neural Network (SRPCNN) to reconstruct high-frequency data from low-frequency industrial sensor inputs, effectively recovering incomplete PV generation data. Similarly, Ma et al. [29] utilized a hybrid LSTM model for imputing building energy data through model transfer, and Lei et al. [10] demonstrated that LSTM outperforms traditional models such as relevance vector machines (RVM) in filling accuracy. De-Paz-Centeno et al. [30] further explored encoder-decoder architectures for imputing PV production data.
However, these supervised learning methods generally assume that the missing data shares the same distribution or features as the observed data. While this assumption holds for isolated missing points or short sequences, it may not be valid for long-term missing data sequences, which limits their applicability in such scenarios.

2.3.2. Semi-Supervised Learning Methods

Semi-supervised learning methods, particularly those using GAN-based architectures, have recently gained traction for data imputation. Xu et al. [31] presented an autoencoder model for RNA sequencing data imputation. Xueqian Fu et al. [32] proposed a GAN-based framework for PV data imputation, but the generator in this architecture lacked a noise input. The absence of noise can lead to mode collapse, a common problem in GANs where the generator produces limited or repetitive outputs. The noise input in GANs represents a latent space, which the generator maps to realistic data outputs. Without noise, the generator struggles to explore the full data distribution, resulting in less diverse and lower-quality imputations.
To address this, SolarGAN [33] introduced a GAN with inputs including real samples and random noise. However, its discriminator was designed to differentiate between real data with missing values and imputed data without missing values. This setup risks using the presence of missing values as a superficial criterion for distinguishing real from fake data, thereby diminishing the focus on the intrinsic characteristics of real PV data.
Hwang and Suh [11] presented a clustering and classification-based generative adversarial imputation network (CC-GAIN), which excels in pattern classification and feature extraction. CM-GAN [34], on the other hand, introduced node embedding modules into the GAN framework, enabling cross-site generation of PV power data. This approach represents a promising direction for improving data imputation by capturing inter-site correlations and enhancing data robustness. However, the generator of CM-GAN produces single-value outputs, making it difficult for the discriminator to effectively distinguish real from fake samples. Consequently, the discriminator’s function may degrade into a simple threshold-based classification.
Overall, deep learning-based methods offer significant advantages in missing data imputation, particularly in complex and high-dimensional datasets, but challenges related to generalizability, training stability, and long-term sequence handling remain key areas of ongoing research.

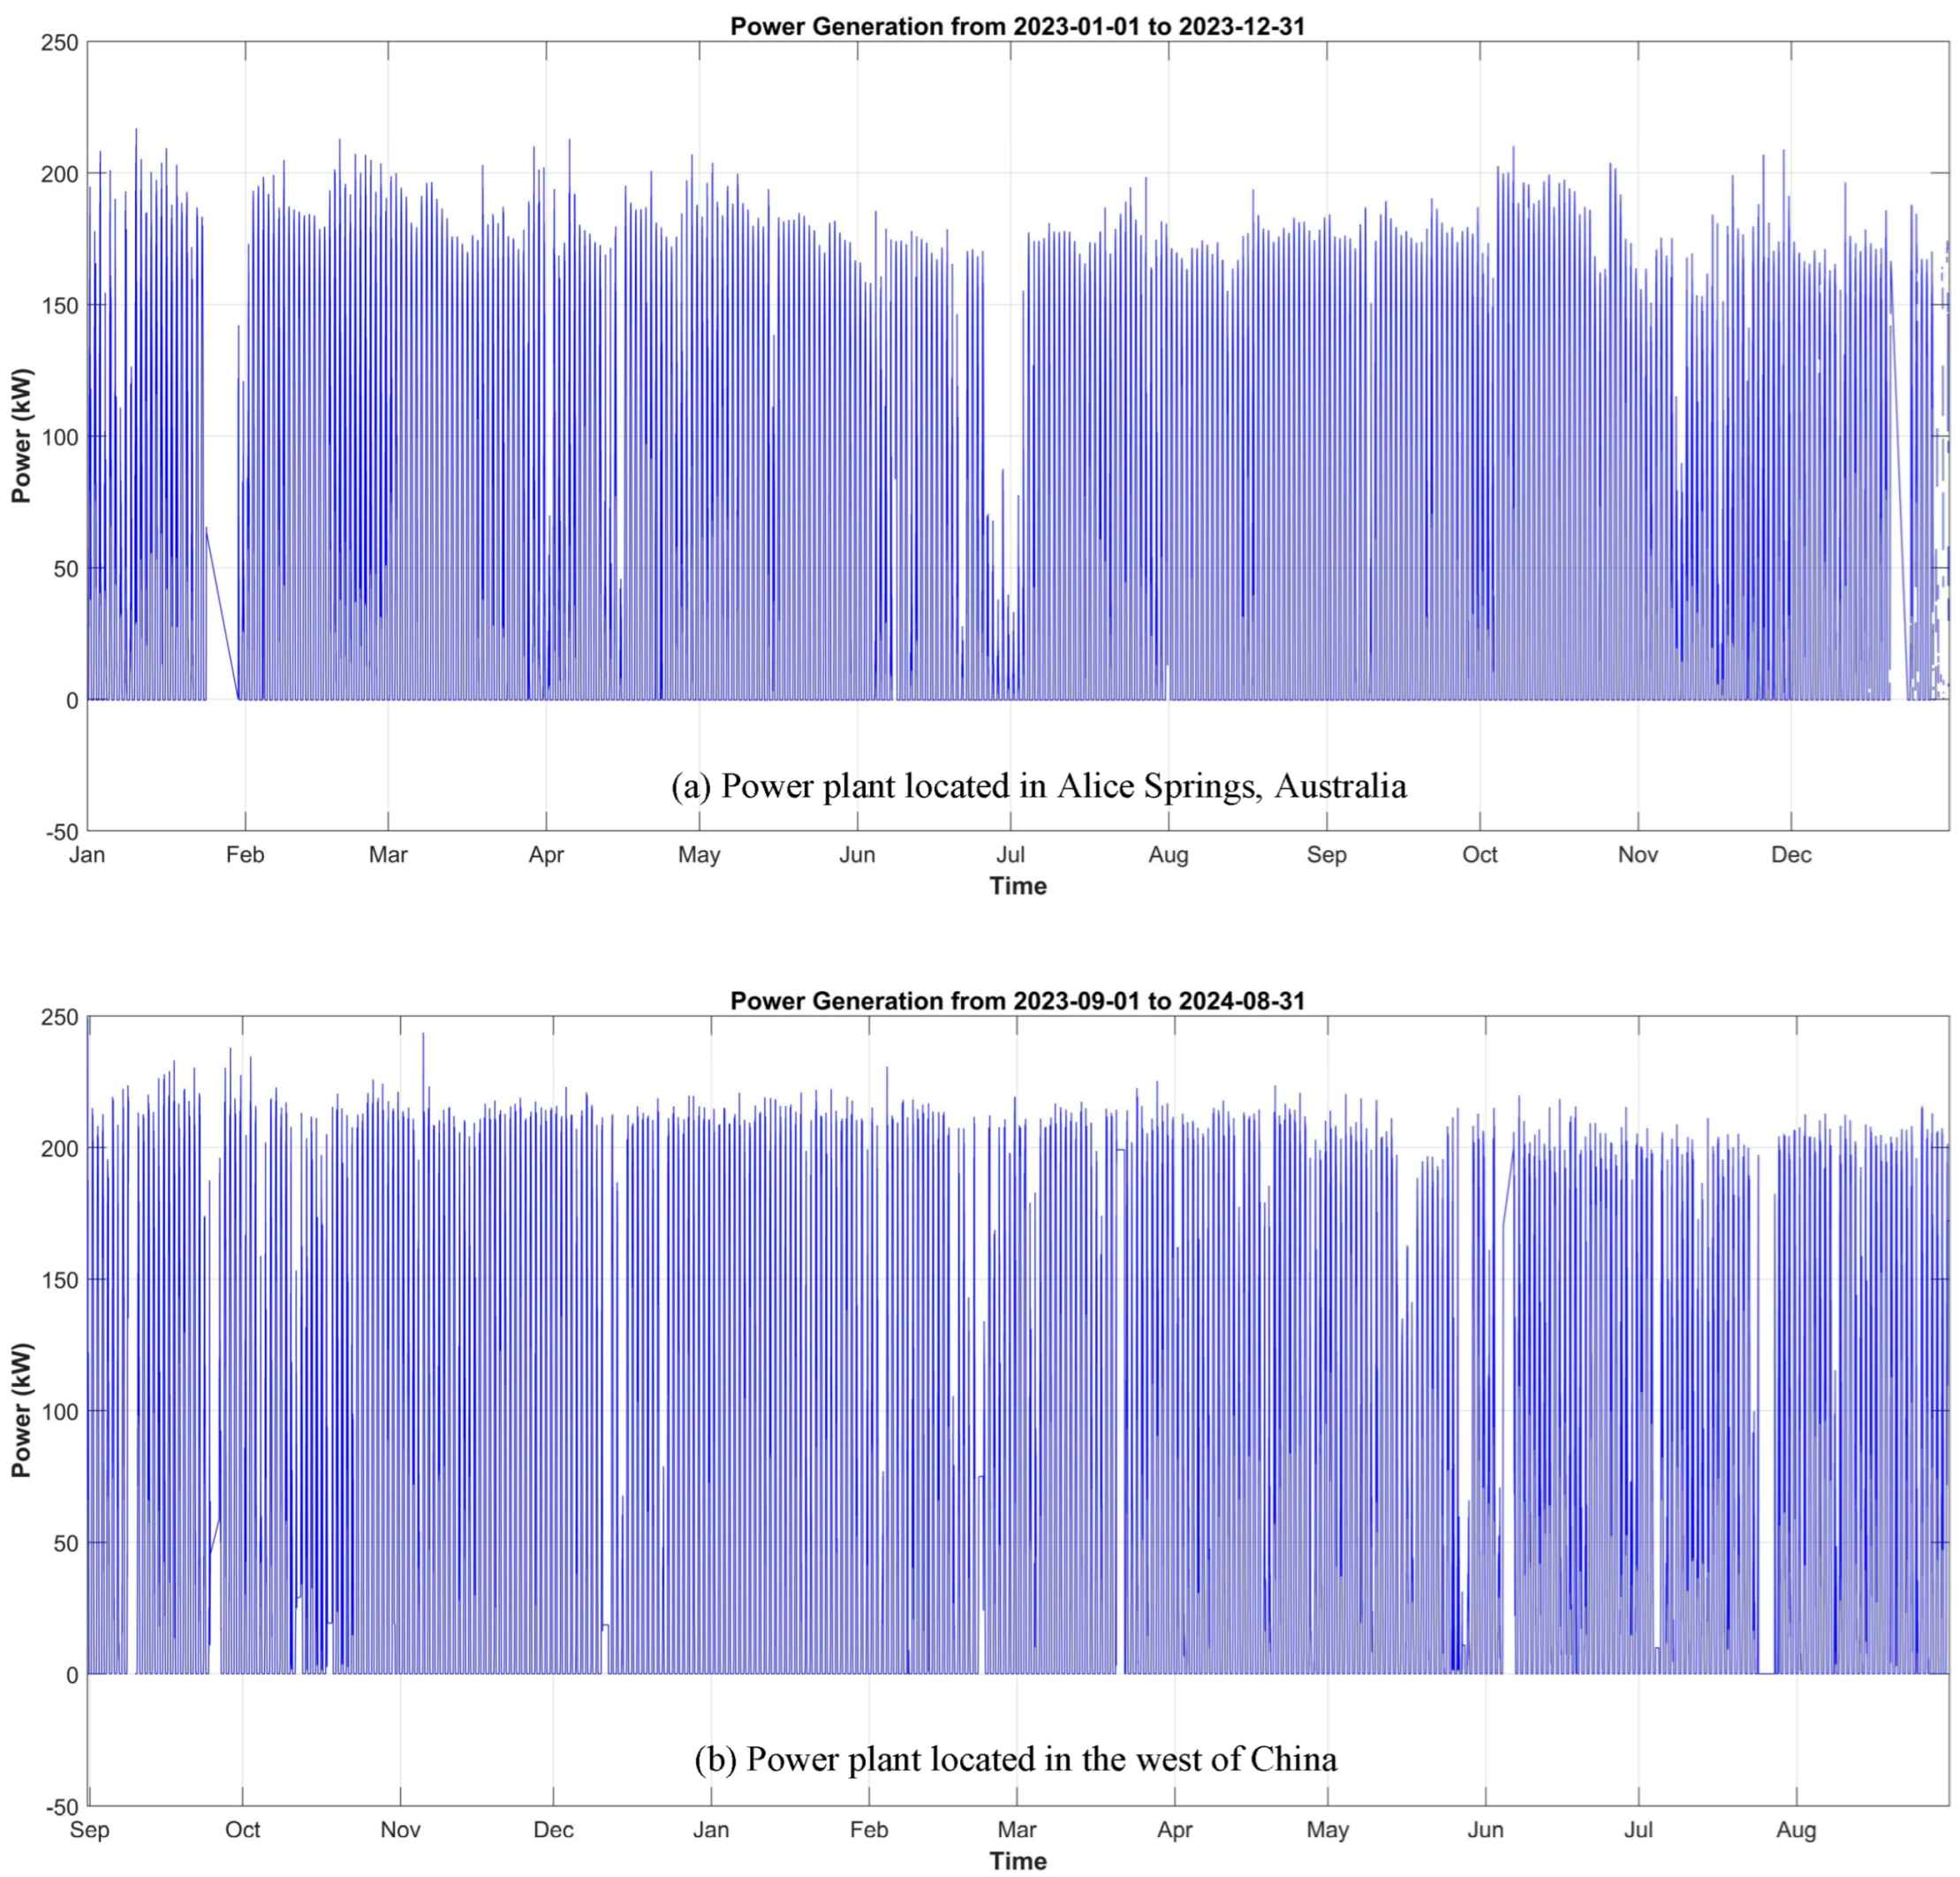
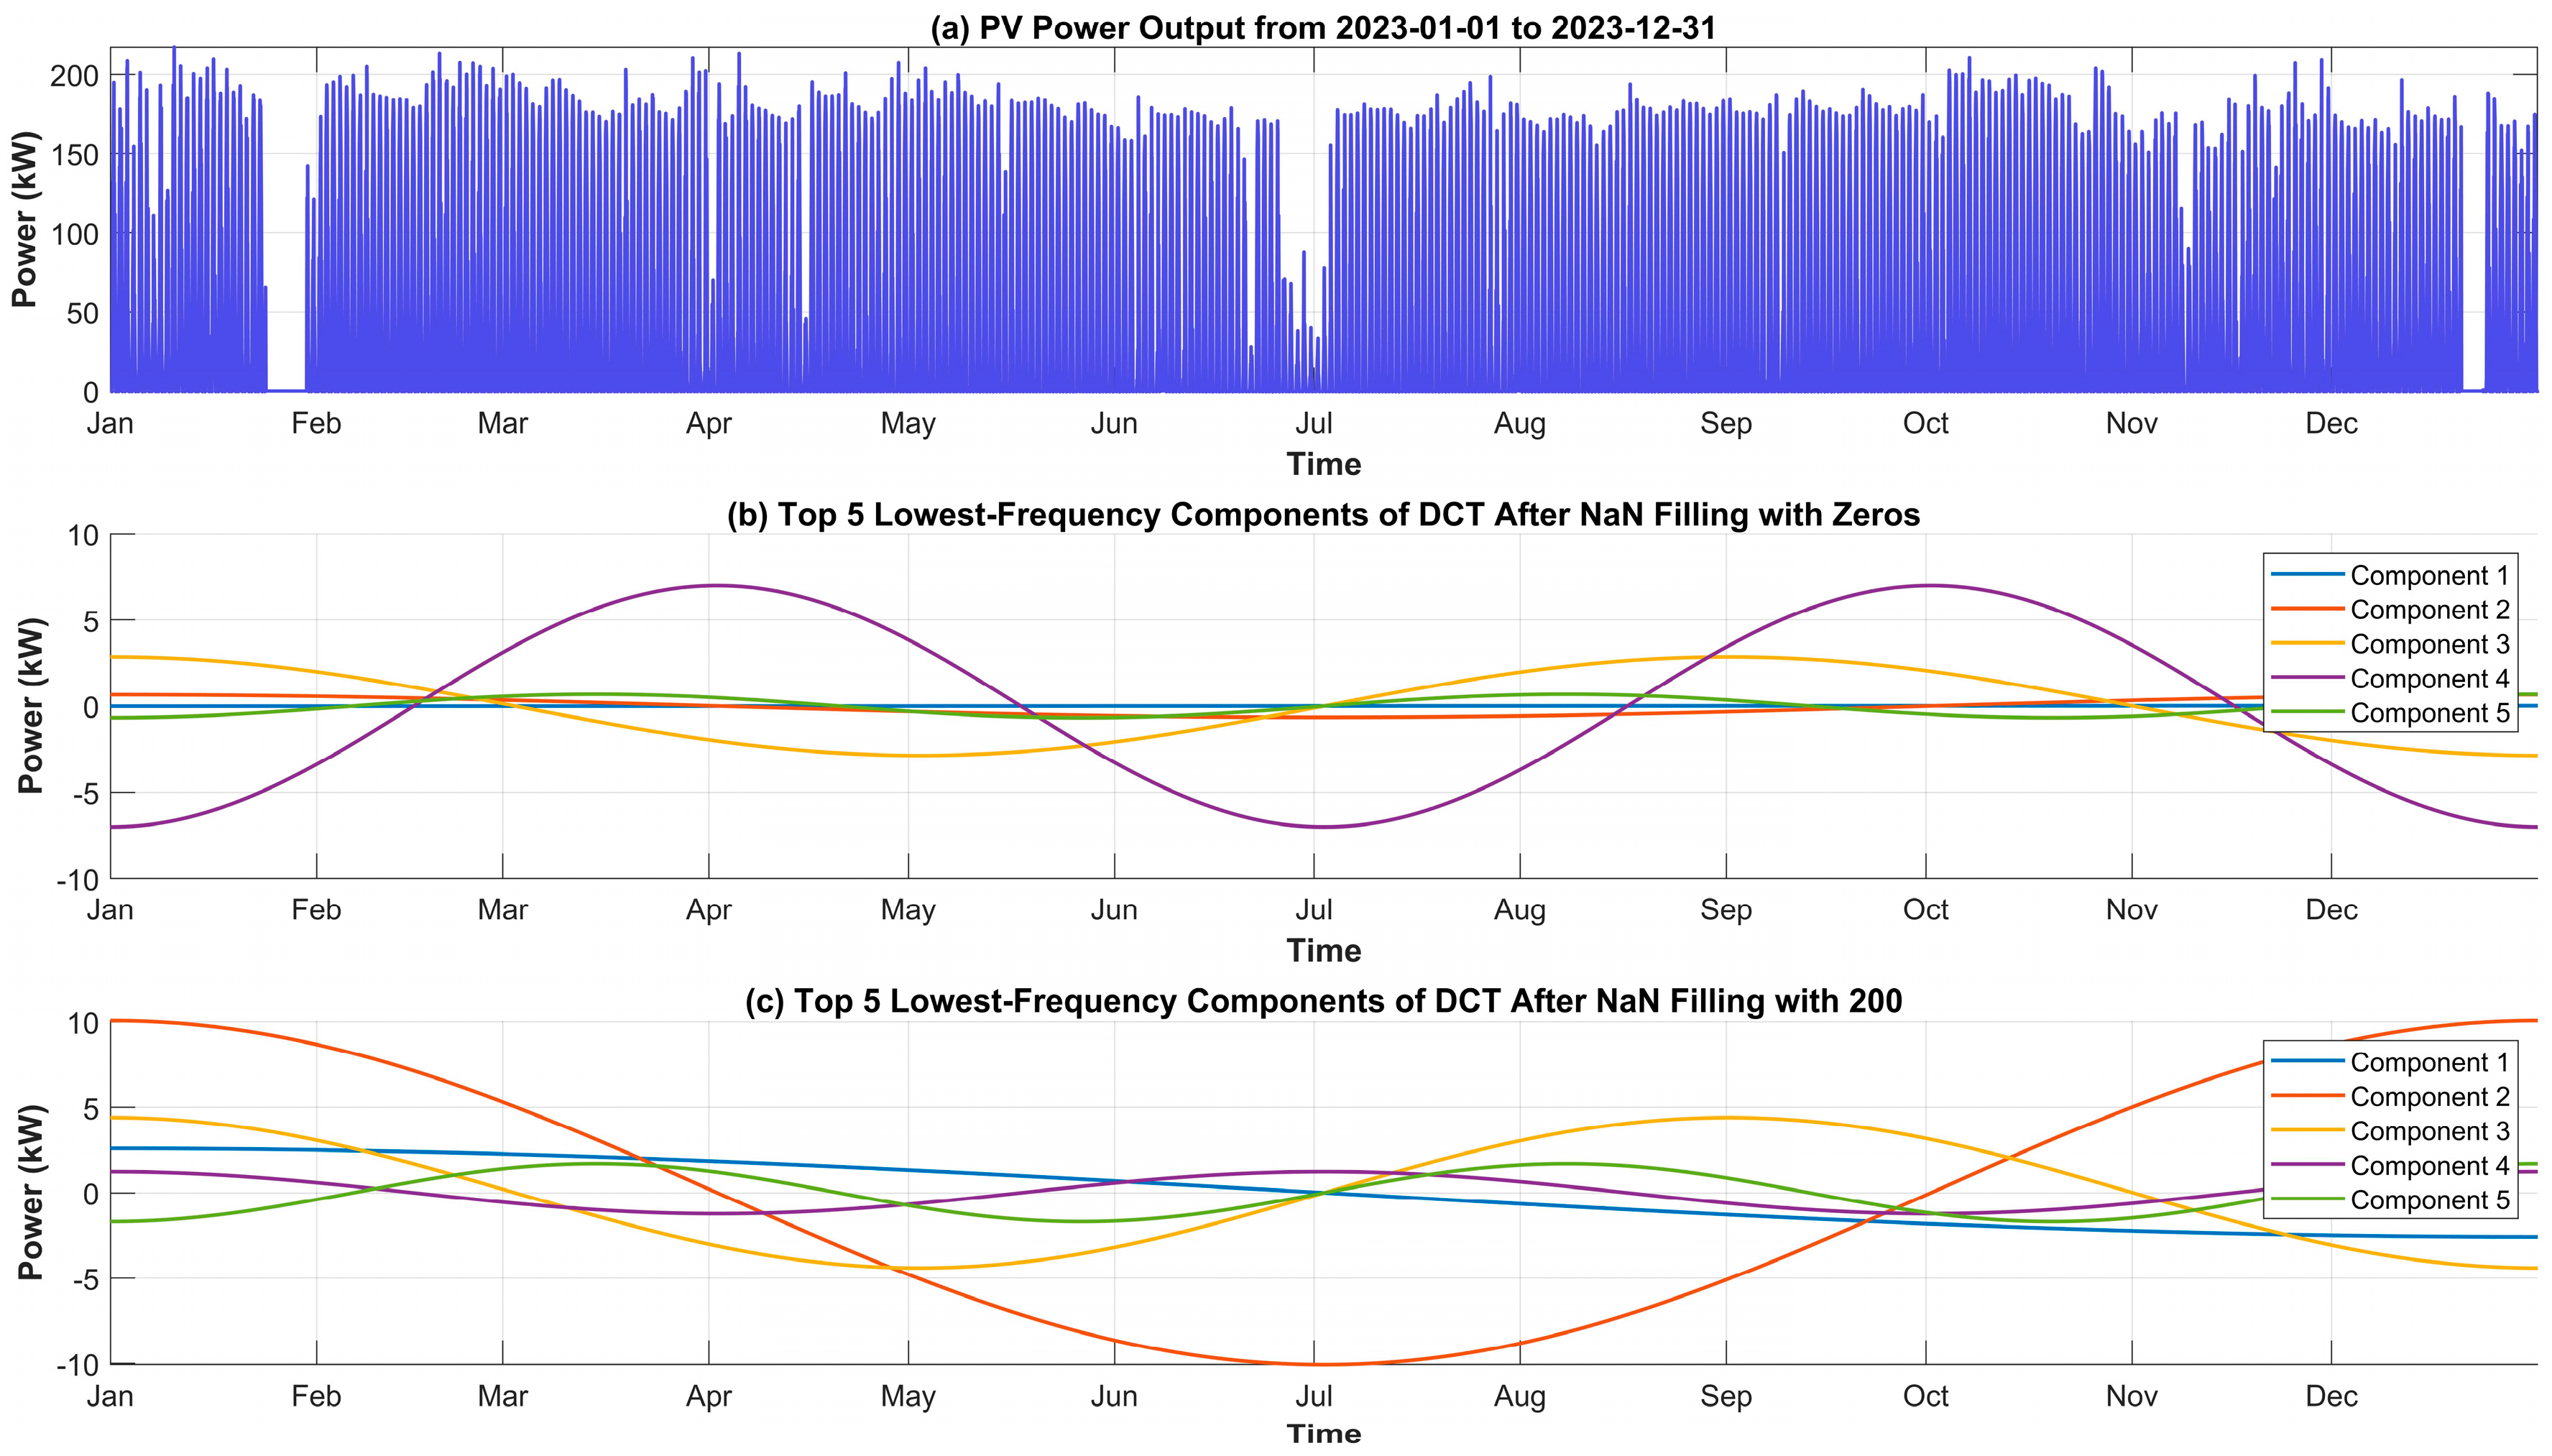
3. Data Continuity Analysis
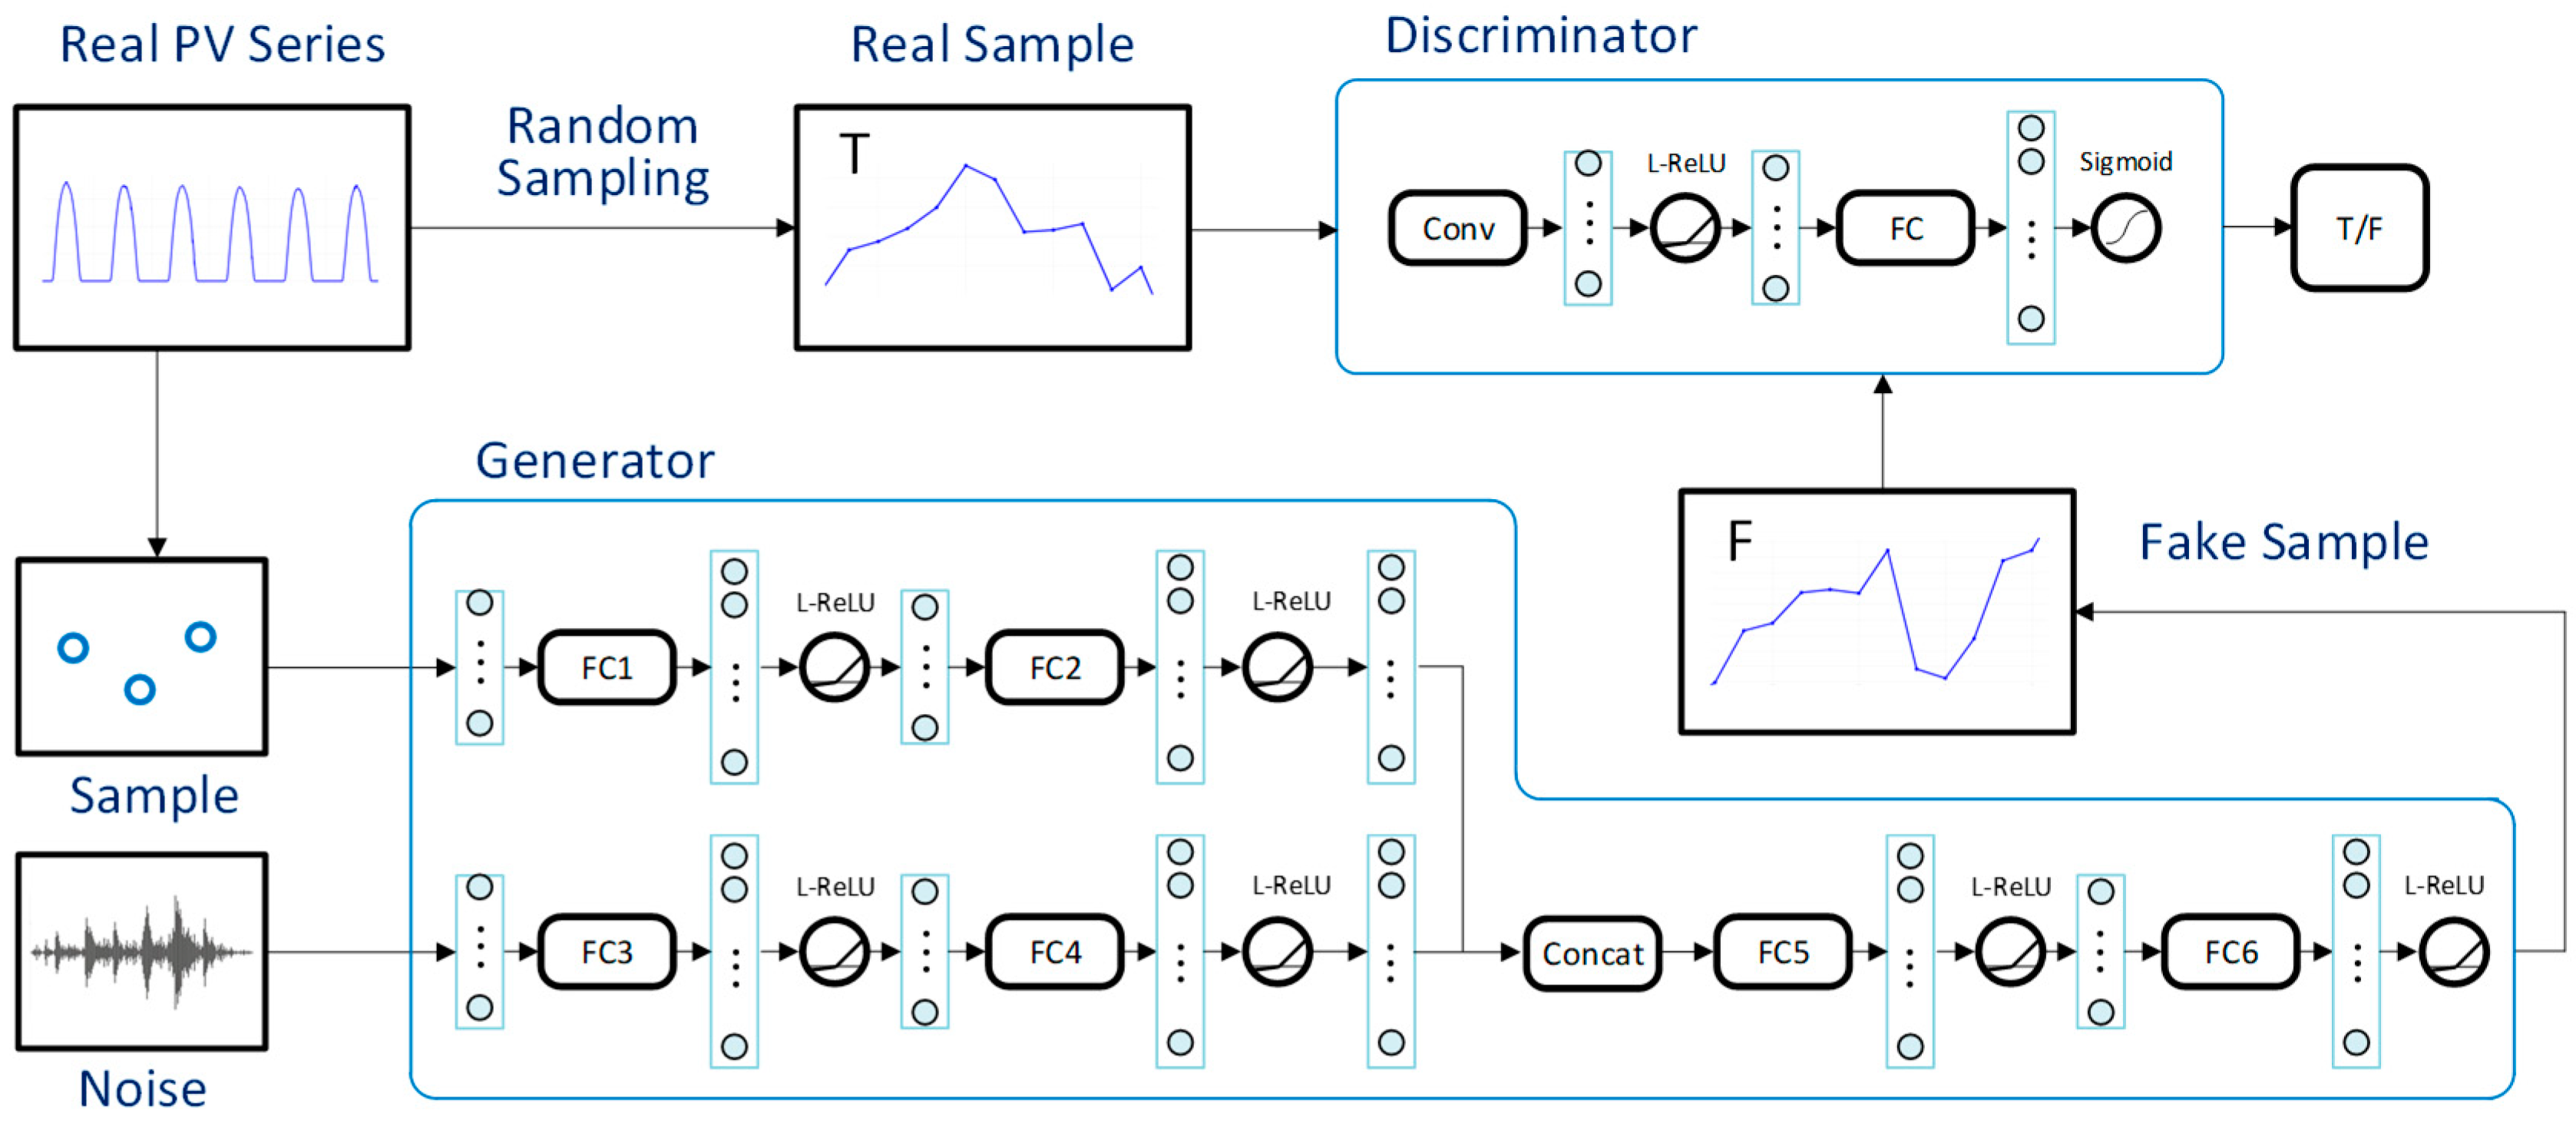
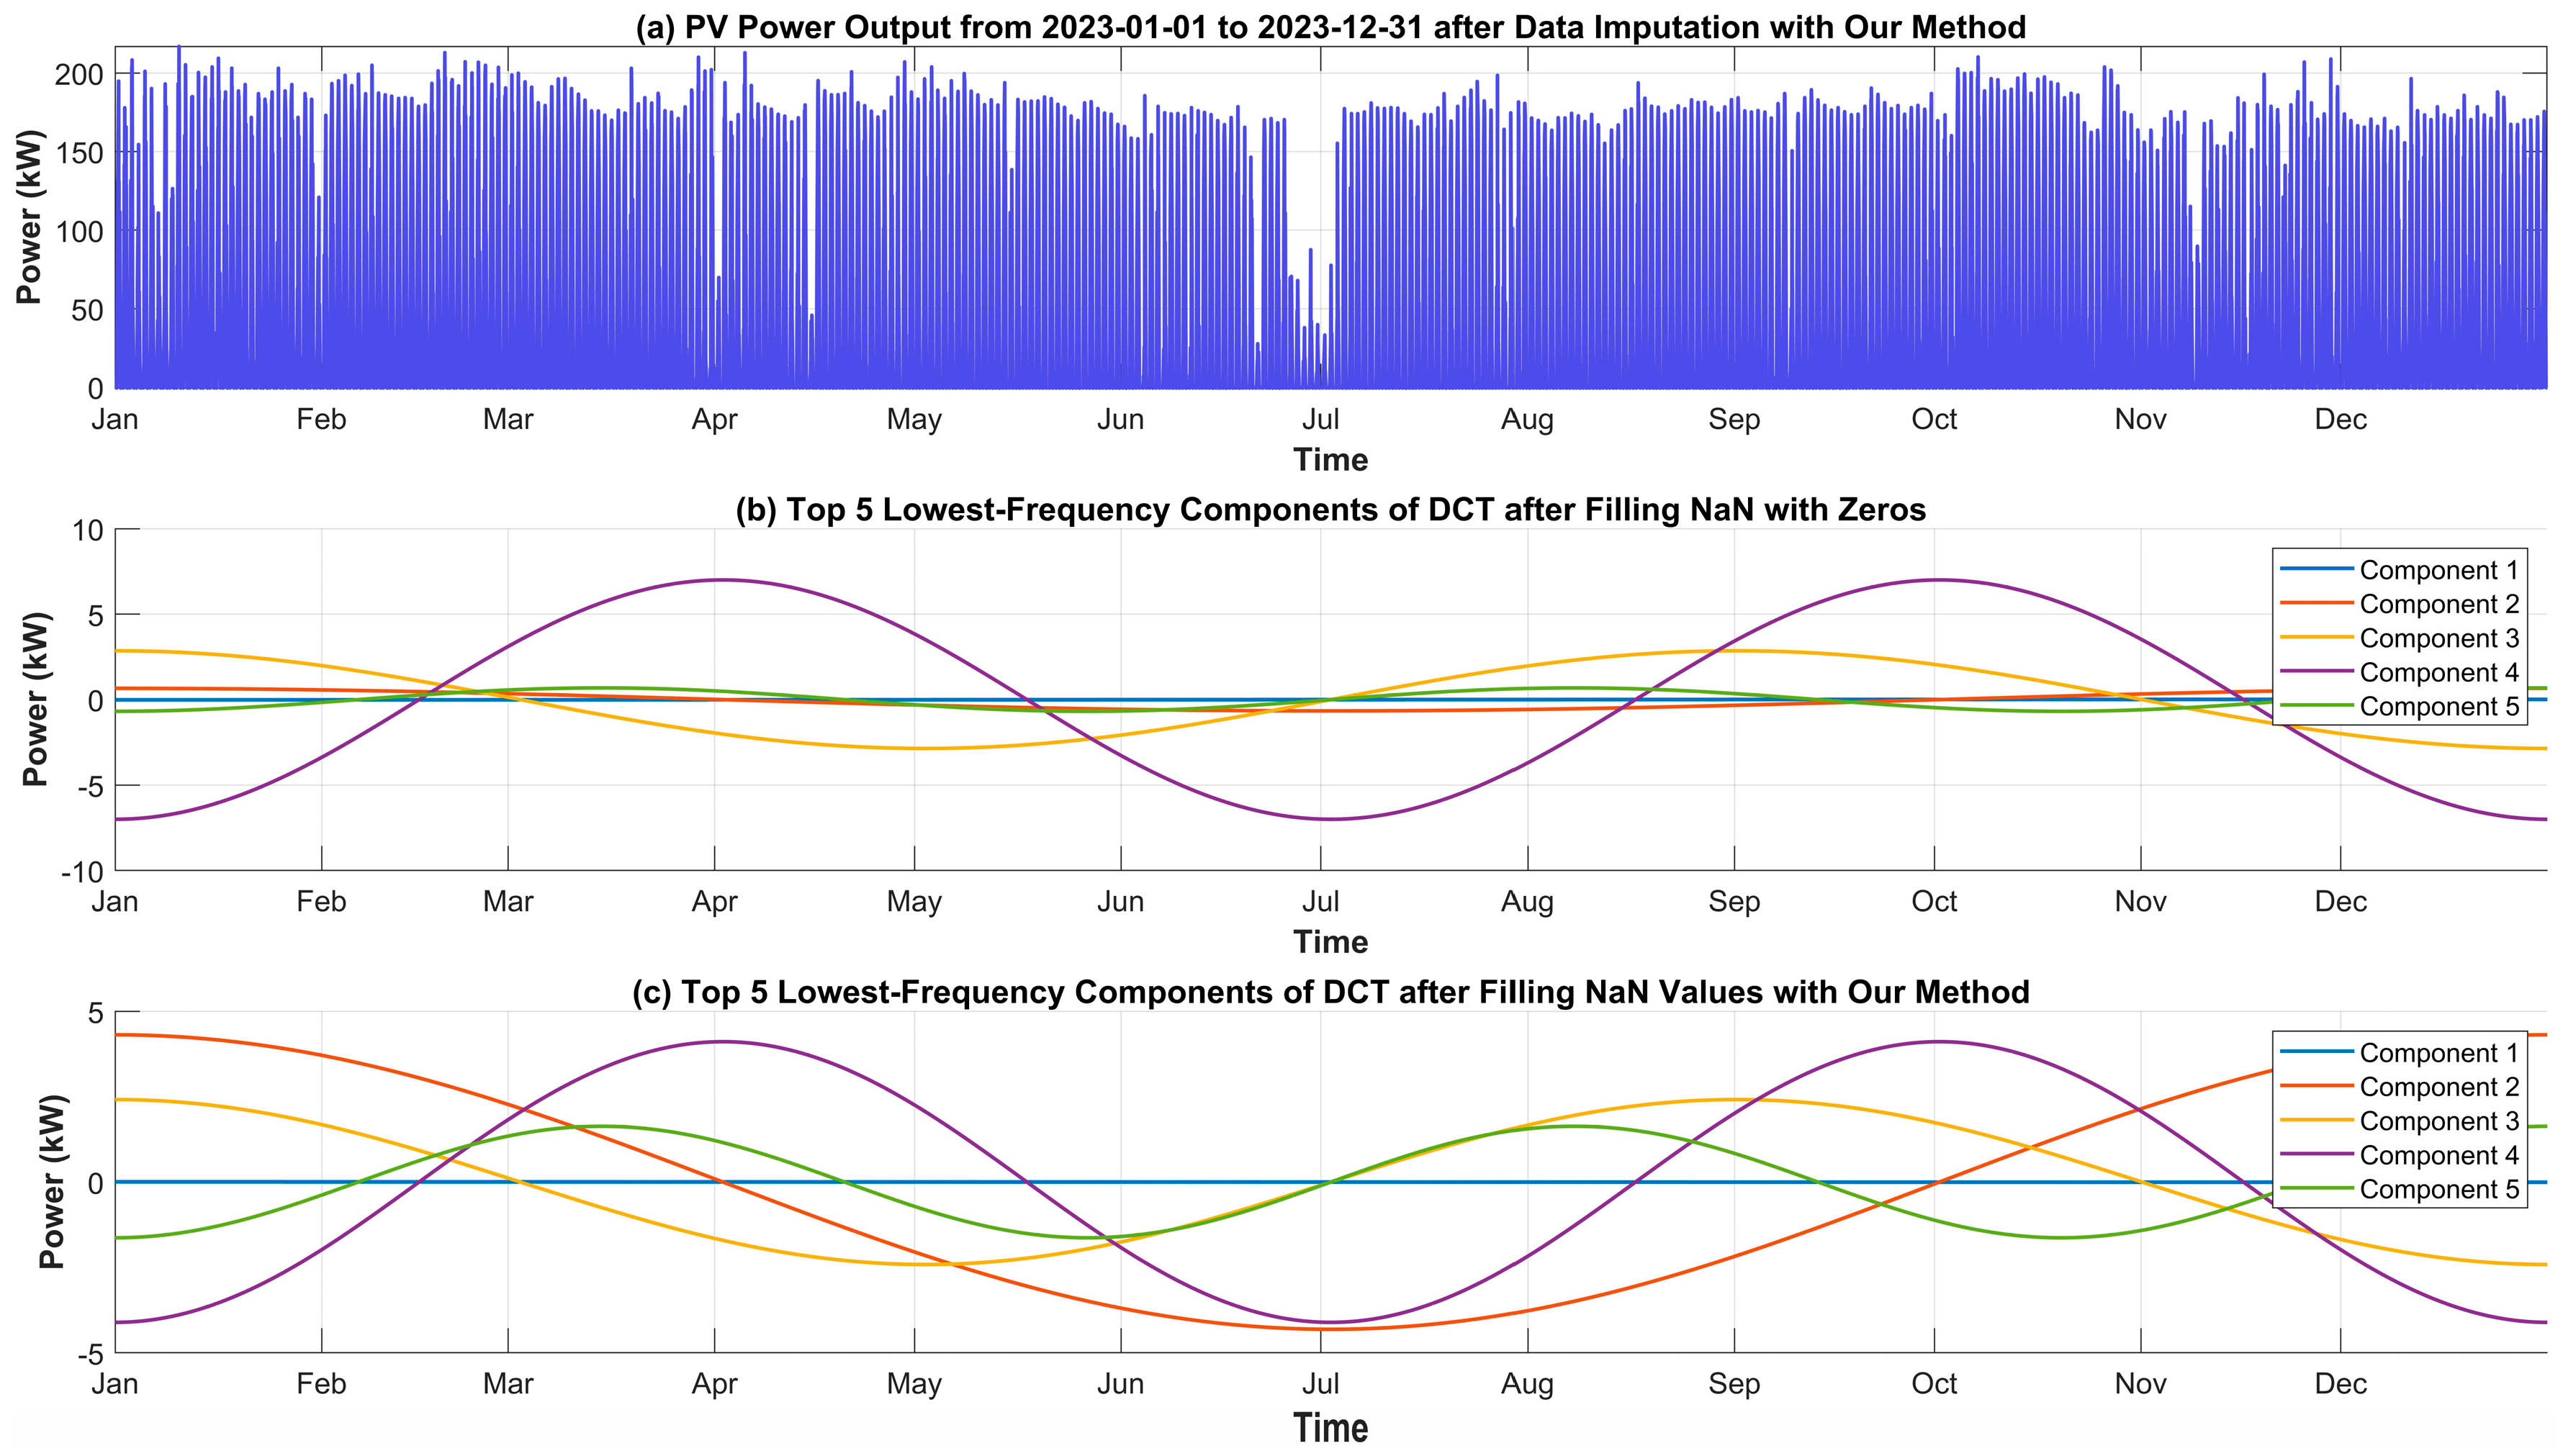
We conducted a comprehensive survey of photovoltaic power generation records from various power plants. These records exhibit interruptions of varying durations. Due to space limitations, we present data spanning one year from the DKA Solar Centre and a power plant located in western China, as illustrated in Figure 1. The interruptions primarily occurred because the photovoltaic systems were periodically shut down for equipment maintenance or replacement necessitated by component aging. Additionally, the PV systems were often forcibly shut down during periods of insufficient electricity demand.
To analyze the characteristics of PV generation data, we conducted a Discrete Cosine Transform (DCT) analysis. For comparison, missing values in the solar power output data were filled with 0 (minimum) and 200 (near-maximum). Figure 2a presents the DCT results for 2023 PV generation data from the DKA Solar Centre, while Figure 2b,c show the top five low-frequency components after filling with 0 and 200, respectively. From them, it is apparent that the amplitudes of different frequency components vary depending on the filled value, which highlights that different imputation methods can alter data patterns, potentially distorting PV predictions and leading to errors.
To address this, we aim to impute missing data effectively. While linear or spline interpolation is an option, missing records often appear as continuous gaps, complicating interpolation. Zero-padding, a common imputation strategy [35,36], preserves signal length but alters frequency amplitudes and introduces unwanted high-frequency components.

4. Data Imputation

A typical Generative Adversarial Network (GAN) comprises two core components: a generator and a discriminator. The optimization goal of the Generator is not to approximate the true data values but to generate data that are indistinguishable from real data by the discriminator. Unlike PV forecasting, where accuracy in approaching true values is crucial, the generator’s output in data generation only needs to capture the general characteristics of PV sequences, rather than being close to the actual data. Fundamentally, data generation serves to augment the dataset and mitigate spurious frequency components caused by missing segments in sequential data.
Traditional GANs, which were initially designed for image generation, use noise as input data for the generator. Conditional GANs were later introduced by incorporating label information into the generator’s input. Unlike image data, PV power generation records are time series with temporal dependencies. To address this, our proposed GAN architecture incorporates historical data as auxiliary input to enhance the quality of generated data. Furthermore, since PV power generation data are generally positive, with negative values being minimal, the Generator employs a Leaky ReLU activation function instead of the conventional Tanh function.
Considering these factors, this paper introduces a GAN-based framework for repairing missing segments in PV power generation data. The architecture, illustrated in Figure 3, consists of Generator and Discriminator modules composed primarily of linear layers and activation functions.

4.1. Generator

Assuming the goal is to generate a vector g out consisting of k PV power generation data points starting from time t 0 , and given a vector g in of m consecutive PV power values prior to t 0 , the local feature extraction process for g in can be represented as:
γ 1 = σ fc 2 σ fc 1 g in .
In these expressions, σ(·) represents a non-linear activation function like the leaky ReLU function, f c i ( · ) ( i = 1 , 2 , ) denotes a fully connected layer.
To avoid directly truncating the input sequence to produce the output sequence, it is essential to impose a strict condition where m < k . This constraint ensures that the generator is forced to learn meaningful relationships and patterns from the data. By iteratively applying this data generation process, the model can produce sequences of arbitrary length, allowing it to effectively handle missing data over both short and long intervals.
The global feature representation of the PV power series, which incorporates random or noise-related global patterns, can be expressed as:
γ 2 = σ fc 4 σ fc 3 Noise .
The local feature vector γ 1 and the global feature vector γ 2 are then concatenated to obtain a comprehensive feature representation:
γ = concat γ 1 , γ 2 .
Finally, the generated PV power output vector g out is computed as:
g out = σ fc 6 σ fc 5 γ .
This process integrates local temporal dependencies from g in with global characteristics represented by noise driving, enabling the generation of g out that captures both short-term dynamics and broader patterns in PV power generation.

4.2. Discriminator

The discriminator’s main objective is to differentiate between real and generated data, essentially solving a binary classification problem. It assesses the authenticity of input data and provides feedback to enhance the generator throughout the training process. The discriminator’s architecture typically consists of convolutional layers followed by a fully connected layer and a sigmoid activation function for binary classification, which can be expressed as:
x out = sigmoid fc σ conv X in .
In this equation, X in , x out denote the input and output of the discriminator, respectively. σ(⋅) represents a non-linear activation function, such as the leaky ReLU function, which introduces non-linearity into the model and helps in learning complex patterns. conv(⋅) denotes convolutional layers that extract temporal features from the input data. The final sigmoid function maps the output to a range of [0, 1], providing a probabilistic interpretation of whether the input data are real or generated.

4.3. Loss Function

The training process of a GAN involves optimizing two models simultaneously: the generator G and the discriminator D. The generator aims to produce realistic data that the discriminator cannot distinguish from real data, while the discriminator strives to correctly classify real and generated data. This adversarial framework is formulated as a minimax optimization problem, where the design of the loss function is crucial for achieving optimal performance and ensuring the effectiveness of the GAN.
In this work, the original GAN is replaced with the Wasserstein GAN with Gradient Penalty (WGAN-GP) approach [14] to achieve a more stable parameter training process. The loss functions for G and D are defined as:
L G = E z ~ ~ P g D z ~ ,
L D = E z ~ ~ P g D z ~ E z ~ P r D z + λ E z ^ ~ P z ^ z ^ D z ^ 2 1 2 ,
where
z ^ = ε z + 1 ε z ~ .
In the above expressions, E represents the expectation function. z ,   z ~ , and z ^ represent real, generated, and interpolated data, while Pr, Pg, and P z ^ are the distribution of them, respectively. λ ,   ε denote the regularization coefficient and a random value ranging from 0 to 1.
The discriminator, as a binary classifier, outputs 0 for generated data and 1 for real data. The generator aims to maximize L G to deceive the discriminator, producing realistic data, while the discriminator minimizes L D to enhance its ability to distinguish real from generated samples.

4.4. Hyperparameter Determination

The learning rate is a crucial hyperparameter in WGAN-GP training, as it directly affects convergence stability and model performance. In this work, the learning rate is set to 5 × 10⁻⁵, the same as used in WGAN [13], and it effectively provides a good balance between convergence speed and training stability.
For WGAN, the regularization penalty λ plays a crucial role in balancing the Lipschitz continuity with overall model stability. To determine an appropriate λ value, we systematically explored a range of values (5, 10, 20) through a grid search. Experimental results indicated that λ = 10 achieved the best compromise between stable training and high-quality data generation for our specific application.
Another critical aspect of model training is determining the optimal number of updates for the generator and discriminator. In GAN training, an imbalance between these components can lead to instability—excessive updates to one may overpower the other, hindering effective learning.
To mitigate this issue, we conducted multiple training runs with different update frequencies (1, 2, 5, and 10 iterations per component) while closely monitoring loss trends for both networks. We analyzed fluctuations and potential divergence in loss values to identify the most stable configuration. Through experimentation, we found that updating the generator five times per batch and the discriminator twice per batch resulted in smooth convergence and stable training dynamics.

5. Experiments

The experiments were conducted on a computer platform equipped with an NVIDIA GeForce RTX4070 graphics card (sourced from Santa Clara, CA, USA), an Intel i9-14900HX processor (sourced from Santa Clara, CA, USA), and 64 GB of memory (sourced from Seoul, Republic of Korea).

5.1. Validation Test

To evaluate the validity of the proposed model, we utilized data from the DKA Solar Centre. The experimental dataset comprises observations collected over a period of up to one year; however, certain time periods have missing data. In the implementation, we set the batch-wise parameter optimization with the generator and discriminator iterating 5 and 2 times per batch, respectively.
Figure 4 illustrates the variation of generator and discriminator loss over training epochs in the GAN network. The generator loss (blue) and discriminator loss (orange) indicate how both components learn and adapt during the adversarial training process.
It is readily seen from Figure 4 that the discriminator loss remains relatively low and stable after the initial training phase, indicating that it effectively distinguishes real from generated samples without overfitting. Meanwhile, the generator loss significantly fluctuates in the initial phase but stabilizes as training progresses. This indicates that the generator is learning to produce more realistic outputs, gradually reducing the discrepancy between generated and real data.
Overall, both the generator and discriminator losses stabilize over time, implying that the adversarial training process has reached an equilibrium. This indicates that neither the generator nor the discriminator dominates the other, a critical factor in successful GAN training.
Figure 5 presents the generated data and its corresponding frequency components obtained through the discrete cosine transform (DCT). Compared to simple imputation methods such as zero-padding, our method produces data with noticeably different amplitude distributions across various frequency components. Zero-padding and similar techniques often introduce distortions, such as artificially amplifying or suppressing certain frequency components, which can disrupt the original data structure.
In contrast, our method better preserves the natural frequency characteristics of the data. If the imputed data exhibits significantly higher low-frequency amplitudes, it may indicate the introduction of artificial trends or over-smoothing, while a decrease could suggest the loss of important long-term patterns. This highlights the limitations of simple imputation techniques and underscores the effectiveness of our approach in maintaining the integrity of the original data.
To intuitively assess data generation quality, we use t-SNE (t-Distributed Stochastic Neighbor Embedding) for visualization. t-SNE performs nonlinear dimensionality reduction by preserving pairwise similarities between data points, mapping high-dimensional data into a lower-dimensional space while maintaining relative distances. This technique is valuable for understanding data structure and distribution.
In our study, t-SNE compares real and generated data to evaluate how well the generator learns the real data distribution. If the two datasets are well separated, it suggests poor generation quality, whereas significant overlap indicates effective learning and high-quality synthetic data.
Figure 6 shows that the generated data substantially overlaps with the real data in the two-dimensional plane. This suggests that the generator successfully captures the structural and distributive characteristics of the original dataset. The alignment confirms the model’s effectiveness and highlights its potential for reliable data synthesis.

5.2. Effectiveness Test

To assess the proposed imputation method, we compared the photovoltaic (PV) output forecasting results before and after data imputation. In the experiment, two datasets were employed: one from the DKA Solar Centre and the other from a power plant located in western China. The experimental data span a period of up to one year, although certain time periods exhibit missing records.
The data were collected at 5 min intervals and subsequently divided into two subsets: 80% of the dataset was allocated for training purposes, while the remaining 20% was reserved for testing. This split was designed to ensure a robust and reliable evaluation of the model’s performance in handling missing data and improving the subsequent forecasting accuracy.

5.2.1. Evaluation Metrics

Various metrics are used to evaluate PV forecasts, with different studies selecting various combinations depending on their objectives [37]. However, some metrics may not effectively reflect forecasting performance. For example, the Mean Absolute Percentage Error (MAPE) becomes undefined when the actual value is zero while the predicted value is non-zero, causing the metric to approach infinity.
Similar to references [38,39], three evaluation metrics were chosen in this experiment to compare the prediction performance. Assuming y and y ^ represent the actual and predicted values, respectively, these metrics are detailed as follows:
(1)
Mean Absolute Error (MAE)
MAE calculates the average of the absolute differences between predicted and actual values, providing an intuitive measure of prediction error [40]. A lower MAE indicates a better performance. MAE can be calculated by
MAE = 1 n i = 1 n y ^ i y i .
(2)
Root Mean Squared Error (RMSE)
RMSE measures the standard deviation of prediction errors, penalizing larger errors more heavily. It’s expressed in the same units as the target variable, aiding interpretability [41]. RMSE can be calculated by
R M S E = 1 n i = 1 n ( y ^ i y i ) 2 .
(3)
R-squared (R2)
R-squared evaluates how much of the variance in the dependent variable is explained by the independent variable, ranging from 0 to 1, with 1 indicating a perfect performance [42]. R2 is formulated by
R 2 = 1 y ^ i y i 2 y i y ¯ 2 .

5.2.2. Experimental Results

In the experiments, we selected six commonly used time-series forecasting models to evaluate the impact of data imputation on PV output predictions: Long Short-Term Memory (LSTM) [43], Bidirectional LSTM (BiLSTM) [44], Stacked LSTM (SLSTM) [45], a hybrid model combining Convolutional Neural Network and LSTM (CNN_LSTM) [46], Gated Recurrent Units (GRUs) [47], and Bidirectional GRU (BiGRU) [44]. These models were chosen for their proven effectiveness in handling sequential data and their widespread use in time-series prediction tasks.
For a fair comparison, all algorithms in the experiment were configured with a batch size of 64 and were trained for 50 epochs. In the implementation of all models, the Adam optimizer was employed due to its robust performance across various types of neural architectures. The learning rate was uniformly set to 0.001, balancing the need for rapid convergence with the risk of overshooting minimal loss values.
The performance comparison on the missing and filled data from the DKA Solar Centre is presented in Table 1. The one on the data from China is presented in Table 2. In the tables, the letters ‘F’ stands for ‘filled data’.
Table 1 and Table 2 demonstrate that the model trained on data with filled data exhibits significantly improved performance in terms of MAE, RMSE, and R2. Additionally, the testing datasets include varying lengths of missing data, ranging from 1 to 1797 points. The results indicate that the model maintains robust performance even for extended periods of missing data.
WGAN-GP, as a deep generative model, naturally requires more computational resources than traditional regression or interpolation methods due to its iterative adversarial training process. In contrast, methods such as linear regression and spline interpolation rely on direct mathematical formulations, resulting in significantly lower computational costs.
Specifically, the simplest linear interpolation requires only basic addition and shift operations. On a 2.20 GHz CPU, these operations take approximately 1 × 10⁻⁹ s to process. In comparison, our method requires 20 min to train on 81,522 samples for 50 epochs, but once trained, it only takes 3 × 10⁻⁶ s to generate a single missing data point. Overall, the training and inference times remain within a reasonable range for practical applications.

6. Conclusions

This paper addresses the critical challenge of missing data in photovoltaic (PV) power generation records, which significantly impacts forecasting accuracy and system reliability. We proposed a novel Generative Adversarial Network (GAN)-based data imputation method tailored for PV power generation. Unlike traditional GANs, our approach incorporates a data-guided generator with quasi-convex properties, a gradient penalty mechanism, and a single-batch multi-iteration strategy to ensure stable training and high-quality data reconstruction.
The proposed model was evaluated using datasets from the DKA Solar Centre and a power plant in western China. Experimental results demonstrate that the generated data successfully bridges data gaps, mitigates spectral leakage and phase discontinuity issues, and aligns closely with the original data’s structure and distribution. The effectiveness of the generated data were validated through frequency domain analysis, t-NSE visualization, and prediction performance comparisons.
In terms of forecasting accuracy, our imputation-enhanced datasets outperformed raw datasets with missing values across multiple evaluation metrics, including MAE, RMSE, and R2. These findings highlight the significance of addressing missing data in PV power records and the effectiveness of our GAN-based imputation method.
Future work will focus on enhancing the model’s generalizability across diverse PV power datasets and integrating the imputed data with advanced forecasting models to further improve prediction accuracy. Additionally, the application of the proposed method to other renewable energy domains will be explored to broaden its utility and impact.

Author Contributions

Conceptualization, Z.L. (Zhu Liu); Methodology, L.X.; Software, X.X.; Formal analysis, L.X.; Investigation, D.G. and D.Z.; Resources, X.X.; Data curation, L.X.; Writing—original draft, L.X.; Writing—review & editing, Z.L. (Zhu Liu), D.G., X.X., Z.L. (Zhongwen Liang) and D.Z.; Supervision, Z.L. (Zhu Liu); Project administration, D.Z.; Funding acquisition, D.Z. All authors have read and agreed to the published version of the manuscript.

Funding

This research was funded by the Southern Power Grid Network-level Science and Technology Project (GDKJXM20222474).

Data Availability Statement

Restrictions apply to the availability of these data. Data were obtained from DKA Solar Centre and are available at https://dkasolarcentre.com.au/download?location=alice-springs (accessed on 12 February 2025) with the permission of DKA Solar Centre.

Conflicts of Interest

Author Zhu Liu was employed by the China Southern Power Grid Research Technology Co., Ltd. Authors Lingfeng Xuan, Dehuang Gong, Xinlin Xie, Zhongwen Liang were employed by the Guangdong Power Grid Limited Liability Company. The remaining authors declare that the research was conducted in the absence of any commercial or financial relationships that could be construed as a potential conflict of interest.

References

  1. Demirhan, H.; Renwick, Z. Missing value imputation for short to mid-term horizontal solar irradiance data. Appl. Energy 2018, 225, 998–1012. [Google Scholar] [CrossRef]
  2. Zang, H.; Chen, D.; Liu, J.; Cheng, L.; Sun, G.; Wei, Z. Improving ultra-short-term photovoltaic power forecasting using a novel sky-image-based framework considering spatial-temporal feature interaction. Energy 2024, 293, 130538. [Google Scholar] [CrossRef]
  3. Yue, H.; Ali, M.M.; Lin, Y.; Liu, H. Ultra-short-term forecasting of large distributed solar PV fleets using sparse smart inverter data. IEEE Trans. Sustain. Energy 2024, 15, 1968–1980. [Google Scholar] [CrossRef]
  4. Xu, Y.; Zheng, S.; Zhu, Q.; Wong, K.-c.; Wang, X.; Lin, Q. A complementary fused method using GRU and XGBoost models for long-term solar energy hourly forecasting. Expert Syst. Appl. 2024, 254, 124286. [Google Scholar] [CrossRef]
  5. Liao, R.; Liu, Y.; Xu, X.; Li, Z.; Chen, Y.; Shen, X.; Liu, J. Enhanced photovoltaic power generation forecasting for newly-built plants via Physics-Infused transfer learning with domain adversarial neural networks. Energy Convers. Manag. 2024, 322, 119114. [Google Scholar] [CrossRef]
  6. Liu, W.; Mao, Z. Short-term photovoltaic power forecasting with feature extraction and attention mechanisms. Renew. Energy 2024, 226, 120437. [Google Scholar] [CrossRef]
  7. Peng, T.; Song, S.; Suo, L.; Wang, Y.; Nazir, M.S.; Zhang, C. Research and application of a novel graph convolutional RVFL and evolutionary equilibrium optimizer algorithm considering spatial factors in ultra-short-term solar power prediction. Energy 2024, 308, 132928. [Google Scholar] [CrossRef]
  8. Zhou, H.; Zheng, P.; Dong, J.; Liu, J.; Nakanishi, Y. Interpretable feature selection and deep learning for short-term probabilistic PV power forecasting in buildings using local monitoring data. Appl. Energy 2024, 376, 124271. [Google Scholar] [CrossRef]
  9. Hoyos-Gómez, L.S.; Ruiz-Muñoz, J.F.; Ruiz-Mendoza, B.J. Short-term forecasting of global solar irradiance in tropical environments with incomplete data. Appl. Energy 2022, 307, 118192. [Google Scholar] [CrossRef]
  10. Lei, Z.; Wang, B.; Wang, K.; Pei, Y.; Huang, Z. Photovoltaic power missing data filling based on multiple matching and long- and short-term memory network. Int. Trans. Electr. Energy Syst. 2021, 31, 12829. [Google Scholar] [CrossRef]
  11. Hwang, J.; Suh, D. CC-GAIN: Clustering and classification-based generative adversarial imputation network for missing electricity consumption data imputation. Expert Syst. Appl. 2024, 255, 124507. [Google Scholar] [CrossRef]
  12. Goodfellow, I.; Pouget-Abadie, J.; Mirza, M.; Xu, B.; Warde-Farley, D.; Ozair, S.; Courville, A.; Bengio, Y. Generative adversarial nets. Adv. Neural Inf. Process. Syst. 2014, 27, 1–9. [Google Scholar]
  13. Arjovsky, M.; Chintala, S.; Bottou, L. Wasserstein generative adversarial networks. In Proceedings of the International Conference on Machine Learning, PMLR, Sydney, NSW, Australia, 6–11 August 2017; pp. 214–223. [Google Scholar]
  14. Gulrajani, I.; Ahmed, F.; Arjovsky, M.; Dumoulin, V.; Courville, A.C. Improved training of Wasserstein GANs. Adv. Neural Inf. Process. Syst. 2017, 30, 1–11. [Google Scholar]
  15. Junninen, H.; Niska, H.; Tuppurainen, K.; Ruuskanen, J.; Kolehmainen, M. Methods for imputation of missing values in air quality data sets. Atmos. Environ. 2004, 38, 2895–2907. [Google Scholar] [CrossRef]
  16. Brooks, M.J.; von Backström, T.W.; van Dyk, E.E. Performance characteristics of a perforated shadow band in the presence of cloud. Sol. Energy 2016, 139, 533–546. [Google Scholar] [CrossRef]
  17. Layanun, V.; Suksamosorn, S.; Songsiri, J. Missing-data imputation for solar irradiance forecasting in Thailand. In Proceedings of the 56th Annual Conference of the Society of Instrument and Control Engineers (SICE), Kanazawa, Japan, 19–22 September 2017; pp. 1234–1239. [Google Scholar]
  18. Benitez, I.B.; Ibañez, J.A.; Lumabad, C.D.; Cañete, J.M.; De los Reyes, F.N.; Principe, J.A. A novel data gaps filling method for solar PV output forecasting. J. Renew. Sustain. Energy 2023, 15, 1–6. [Google Scholar] [CrossRef]
  19. Wang, M.-C.; Tsai, C.-F.; Lin, W.-C. Towards missing electric power data imputation for energy management systems. Expert Syst. Appl. 2021, 174, 114743. [Google Scholar] [CrossRef]
  20. Martínez-Comesaña, M.; Eguia-Oller, P.; Martinez-Torres, J.; Febrero-Garrido, L.; Granada-Álvarez, E. Optimisation of thermal comfort and indoor air quality estimations applied to in-use buildings combining NSGA-III and XGBoost. Sustain. Cities Soc. 2022, 80, 1–12. [Google Scholar] [CrossRef]
  21. Vinith, P.J.; Sam, K.N.; Vidya, T.; Kathiresan, A.C. Development and performance analysis of aquila algorithm optimized SPV power imputation and forecasting models. IEEE Trans. Sustain. Energy 2024, 15, 2103–2114. [Google Scholar] [CrossRef]
  22. Chen, X.; Lei, M.; Saunier, N.; Sun, L. Low-rank autoregressive tensor completion for spatiotemporal traffic data imputation. IEEE Trans. Intell. Transp. Syst. 2021, 23, 12301–12310. [Google Scholar] [CrossRef]
  23. Crespo Turrado, C.; Sánchez Lasheras, F.; Calvo-Rollé, J.L.; Piñón-Pazos, A.J.; de Cos Juez, F.J. A new missing data imputation algorithm applied to electrical data loggers. Sensors 2015, 15, 31069–31082. [Google Scholar] [CrossRef] [PubMed]
  24. Costa, T.; Falcão, B.; Mohamed, M.A.; Annuk, A.; Marinho, M. Employing machine learning for advanced gap imputation in solar power generation databases. Sci. Rep. 2024, 14, 23801. [Google Scholar] [CrossRef] [PubMed]
  25. Stekhoven, D.J.; Bühlmann, P. MissForest—Non-parametric missing value imputation for mixed-type data. Bioinformatics 2012, 28, 112–118. [Google Scholar] [CrossRef] [PubMed]
  26. Kim, M.; Park, S.; Lee, J.; Joo, Y.; Choi, J.K. Learning-based adaptive imputation method with kNN algorithm for missing power data. Energies 2017, 10, 1668. [Google Scholar] [CrossRef]
  27. Silva-Ramírez, E.-L.; Pino-Mejías, R.; López-Coello, M.; Cubiles-de-la-Vega, M.-D. Missing value imputation on missing completely at random data using multilayer perceptrons. Neural Netw. 2011, 24, 121–129. [Google Scholar] [CrossRef]
  28. Liu, W.; Ren, C.; Xu, Y. PV generation forecasting with missing input data: A super-resolution perception approach. IEEE Trans. Sustain. Energy 2020, 12, 1493–1496. [Google Scholar] [CrossRef]
  29. Ma, J.; Cheng, J.C.; Jiang, F.; Chen, W.; Wang, M.; Zhai, C. A bi-directional missing data imputation scheme based on LSTM and transfer learning for building energy data. Energy Build. 2020, 216, 109941. [Google Scholar] [CrossRef]
  30. de-Paz-Centeno, I.; García-Ordás, M.T.; García-Olalla, Ó.; Alaiz-Moretón, H. Imputation of missing measurements in PV production data within constrained environments. Expert Syst. Appl. 2023, 217, 1–17. [Google Scholar] [CrossRef]
  31. Xu, L.; Xu, Y.; Xue, T.; Zhang, X.; Li, J. AdImpute: An imputation method for single-cell RNA-seq data based on semi-supervised autoencoders. Front. Genet. 2021, 12, 1–9. [Google Scholar] [CrossRef]
  32. Fu, X.; Zhang, C.; Zhang, X.; Sun, H. A novel GAN architecture reconstructed using Bi-LSTM and style transfer for PV temporal dynamics simulation. IEEE Trans. Sustain. Energy 2024, 15, 2826–2829. [Google Scholar] [CrossRef]
  33. Zhang, W.; Luo, Y.; Zhang, Y.; Srinivasan, D. SolarGAN: Multivariate solar data imputation using generative adversarial network. IEEE Trans. Sustain. Energy 2020, 12, 743–746. [Google Scholar] [CrossRef]
  34. Kang, M.; Zhu, R.; Chen, D.; Liu, X.; Yu, W. CM-GAN: A cross-modal generative adversarial network for imputing completely missing data in digital industry. IEEE Trans. Neural Netw. Learn. Syst. 2023, 35, 2917–2926. [Google Scholar] [CrossRef] [PubMed]
  35. Chai, S.; Xu, Z.; Jia, Y.; Wong, W.K. A robust spatiotemporal forecasting framework for photovoltaic generation. IEEE Trans. Smart Grid. 2020, 11, 5370–5382. [Google Scholar] [CrossRef]
  36. Marzouq, M.; El Fadili, H.; Zenkouar, K.; Lakhliai, Z.; Amouzg, M. Short term solar irradiance forecasting via a novel evolutionary multi-model framework and performance assessment for sites with no solar irradiance data. Renew. Energy 2020, 157, 214–231. [Google Scholar] [CrossRef]
  37. Ramadhan, R.A.; Heatubun, Y.R.; Tan, S.F.; Lee, H. Comparison of physical and machine learning models for estimating solar irradiance and photovoltaic power. Renew. Energy 2021, 178, 1006–1019. [Google Scholar] [CrossRef]
  38. Korkmaz, D. SolarNet: A hybrid reliable model based on convolutional neural network and variational mode decomposition for hourly photovoltaic power forecasting. Appl. Energy 2021, 300, 117410. [Google Scholar] [CrossRef]
  39. Tang, Y.; Yang, K.; Zhang, S.; Zhang, Z. Photovoltaic power forecasting: A hybrid deep learning model incorporating transfer learning strategy. Renew. Sustain. Energy Rev. 2022, 162, 112473. [Google Scholar] [CrossRef]
  40. Willmott, C.J.; Matsuura, K. Advantages of the mean absolute error (MAE) over the root mean square error (RMSE) in assessing average model performance. Clim. Res. 2005, 30, 79–82. [Google Scholar] [CrossRef]
  41. Chai, T.; Draxler, R.R. Root mean square error (RMSE) or mean absolute error (MAE). Geosci. Model Dev. Discuss. 2014, 7, 1525–1534. [Google Scholar]
  42. Chicco, D.; Warrens, M.J.; Jurman, G. The coefficient of determination R-squared is more informative than SMAPE, MAE, MAPE, MSE and RMSE in regression analysis evaluation. PeerJ Comput. Sci. 2021, 7, e623. [Google Scholar] [CrossRef]
  43. Hochreiter, S.; Schmidhuber, J. Long short-term memory. Neural Comput. 1997, 9, 1735–1780. [Google Scholar] [CrossRef] [PubMed]
  44. Schuster, M.; Paliwal, K.K. Bidirectional recurrent neural networks. IEEE Trans. Signal Process. 1997, 45, 2673–2681. [Google Scholar] [CrossRef]
  45. Malhotra, P.; Vig, L.; Shroff, G.; Agarwal, P. Long short term memory networks for anomaly detection in time series. In Proceedings of the European Symposium on Artificial Neural Networks, Computational Intelligence and Machine Learning, Bruges, Belgium, 22–24 April 2015; Volume 2015, pp. 89–94. [Google Scholar]
  46. Venugopalan, S.; Xu, H.; Donahue, J.; Rohrbach, M.; Mooney, R.; Saenko, K. Translating videos to natural language using deep recurrent neural networks. In Proceedings of the 2015 Annual Conference of the North American Chapter of the ACL, Denver, CO, USA, 31 May–5 June 2015; pp. 1494–1504. [Google Scholar]
  47. Cho, K.; Van Merriënboer, B.; Gulcehre, C.; Bahdanau, D.; Bougares, F.; Schwenk, H.; Bengio, Y. Learning phrase representations using RNN encoder-decoder for statistical machine translation. In Proceedings of the 2014 Conference on Empirical Methods in Natural Language Processing, Doha, Qatar, 25–29 October 2014; pp. 1724–1734. [Google Scholar]
Figure 1. Intermittent power generation records of photovoltaic power plants: (a) power plant located in Alice Springs, Australia; (b) power plant located in western China.
Energies 18 01042 g001
Figure 2. DCT Results of power generation records: (a) original power generation of power plant located in Alice Springs, Australia; (b) first 5 low-frequency components after NAN filled with zero; (c) first 5 low-frequency components after NAN filled with 200.
Energies 18 01042 g002
Figure 3. GAN architecture for repairing the missing PV power generation data. ‘Conv’ and ‘FC’ represent convolutional and fully connected networks, respectively, while ‘Concat’ and ‘L-ReLU’ denote concatenation operation and Leaky ReLU function.
Energies 18 01042 g003
Figure 4. Variation of generator and discriminator loss during training epochs.
Energies 18 01042 g004
Figure 5. DCT Results of power generation records: (a) original power generation of power plant located in Alice Springs, Australia; (b) first 10 frequency components (low frequency) from DCT; (c) top 5 highest energy frequency components from DCT.
Energies 18 01042 g005
Figure 6. t-NSE visualization of real and generated data.
Energies 18 01042 g006
Table 1. Performance comparison between missing and filled data from the DKA Solar Centre.
MAERMSER2
LSTM0.1861962470.3891405110.984074517
LSTM_F0.1847348120.3876180160.985344046
BiLSTM0.1907401650.3764859220.984697024
BiLSTM_F0.1894868730.3736102540.985937555
SLSTM0.179010240.4119631630.982579983
SLSTM_F0.1773060560.4107600620.982265822
CNN_LSTM0.1750977030.4016890780.983706477
CNN_LSTM_F0.1740566520.401133450.984127151
GRU0.1837889960.3982293910.984124486
GRU_F0.1844773080.3977782350.984984212
BiGRU0.1912012290.4123799080.982185075
BiGRU_F0.1913405290.4101000130.983502992
Table 2. Performance comparison between missing and filled data from China.
MAERMSER2
LSTM0.1868218390.3876102540.98446909
LSTM_F0.1851435550.3873049980.984418894
BiLSTM0.1912636830.3763926030.984692799
BiLSTM_F0.1908493180.3744208850.98653103
SLSTM0.1791793860.4120620820.982844343
SLSTM_F0.1785192650.4099873070.983222614
CNN_LSTM0.1759218770.4015769630.982665936
CNN_LSTM_F0.1739472510.3999992320.983597441
GRU0.1853312670.3982462920.982768998
GRU_F0.1849675490.3974752450.984630677
BiGRU0.1916171420.4112621550.982123923
BiGRU_F0.1912328470.4101264850.982937645
Disclaimer/Publisher’s Note: The statements, opinions and data contained in all publications are solely those of the individual author(s) and contributor(s) and not of MDPI and/or the editor(s). MDPI and/or the editor(s) disclaim responsibility for any injury to people or property resulting from any ideas, methods, instructions or products referred to in the content.

