Article

Study on the Propagation Law of CO2 Displacement in Tight Conglomerate Reservoirs in the Mahu Depression, Xinjiang, China

1
Research Institute of Exploration and Development, PetroChina Xinjiang Oilfield Company, Karamay 834000, China
2
College of Earth and Planetary Sciences, University of Chinese Academy of Sciences, Beijing 100049, China
*
Author to whom correspondence should be addressed.
Energies 2025, 18(4), 990; https://doi.org/10.3390/en18040990
Submission received: 19 January 2025 / Revised: 11 February 2025 / Accepted: 14 February 2025 / Published: 18 February 2025
(This article belongs to the Special Issue Advanced Transport in Porous Media for CO2 Storage and EOR)

Abstract

:
To achieve the efficient utilization of low-permeability tight sand and gravel reservoirs with strong heterogeneity in the Mahu oil area of Xinjiang, CO2 injection is used to improve oil recovery. The sweep pattern of the injected gas is closely related to the development of reservoir pores and throats. Firstly, a three-dimensional model of the average pore-throat radius was established based on complete two-dimensional nuclear magnetic resonance scanning data of the target layer’s full-diameter core in the Wuerhe Formation. Subsequently, an online NMR injection CO2 continuous oil displacement experiment was conducted using tight conglomerate rock cores to clarify the rules of CO2 oil displacement in each pore-throat interval. Finally, the three-dimensional pore-throat model was combined with microscopic utilization patterns to quantitatively characterize the reservoir utilization rate of the CO2 displacement oil and guide on-site dynamic analysis. The research results indicate that the reservoir space of the Wuerhe Formation is mainly composed of residual intergranular pores, accounting for 40.9% of the pores, followed by intragranular dissolution pores and shrinkage pores. The proportion of pore-throat coordination numbers less than 1 is relatively high, reaching 86.3%. The average pore-throat radius calculation model, established using online NMR data from the continuous coring of full-diameter cores, elucidates the characteristics of the average pore-throat radius in the Wuerhe Formation reservoir. Based on gas displacement experiments that explored the pore-throat behavior at the microscale, the calibrated CO2 injection oil recovery rate was determined to be 43.9%, and the proportion of reserves utilized within the main range during CO2 displacement amounted to 60.77%. The injection pressure is negatively correlated with the maximum pore-throat radius of the gas injection well group, and negatively correlated with the proportion of the 0.9~2 μm distribution of large pore throats in each gas injection well group.

1. Introduction

The Mahu oil area in the Junggar Basin is rich in unconventional oil and gas resources, but the reservoir heterogeneity is strong, its pore structure is complex [1,2,3,4], and its gas logging permeability is below 1 mD. For this ultra-low-permeability conglomerate reservoir, the development method of deploying horizontal wells and a large-scale hydraulic volume was adopted in the early stages of its development [5]. However, the Wuerhe Formation reservoir has a high content of clay minerals and a large amount of plastic mudstone. The clay minerals are mainly composed of Yimeng mixed layers [6], which have strong water sensitivity and pressure sensitivity [7]. The production of the horizontal wells in in this reservoir is decreasing greatly, and the economic benefits of predicting the cumulative oil production of a single well do not meet the standard. Indoor experiments have shown that CO2 mixed-phase displacement in the Wuerhe Formation can utilize pores with a diameter of 0.1 μm or more, and, as a result, gas drive pressure maintenance is a key research direction. However, the difficulty in controlling the volume of gas injected into multimodal conglomerates is the biggest challenge faced by field experiments [8,9,10,11,12,13]. CO2 injected into the formation can migrate along the pores, throats, and gravel fractures developed in the reservoir (Figure 1). The migration pathway of the gas is closely related to the size and connectivity of the pores and throats, and the study of the mobility of fluid in micro pores and throats is a necessary condition for gas displacement to improve oil recovery [14].
With the development of pore-throat analysis technology, techniques such as mercury intrusion porosimetry, scanning electron microscopy, nuclear magnetic resonance, and micro nano X-CT have been widely used. Qiao et al. [15] used the three-dimensional visualization of micro nano pores in online physical simulation experiments to finely characterize and analyze the flow and distribution characteristics of gas and water in micro nano pore networks. Qiao et al. [16] pointed out, through conducting joint micro X-CT and core permeability experiments, that the pore-throat configuration relationship controls the fluid flow characteristics of tight gas injection. Bai et al. [17] studied the lower limit of gas displacement pore-throat utilization by utilizing the law that the oil saturation and NMR signal amplitude gradually decrease synchronously during the core displacement process. Lv et al. [18] conducted CO2 displacement experiments using the NMR scanning analysis of core samples of different mineral types, and quantitatively evaluated the crude oil utilization patterns under different pores.
The dominant reservoirs of the Wuerhe Formation in the Mahu oil region of Xinjiang are mostly developed in the microfacies of the subaqueous distributary channel at the front edge of the fan delta. The lithology is mainly fine to medium conglomerate, with a finer grain size along the source direction. The lithology changes rapidly longitudinally, and the reservoir heterogeneity is strong with large differences. The extremely low porosity and permeability of the Mahu tight gravel reservoir make it difficult to implement conventional water injection [19,20]. In order to explore new development methods, CO2 displacement experiments were conducted on tight gravel reservoirs. After on-site gas injection, there are significant differences in the gas injection pressure and gas coverage range among different well groups. Therefore, it is necessary to quantitatively characterize the micro pore-throat distribution pattern in the entire area, clarify the main controlling factors of injection and production parameters, and provide a research basis for the success and promotion of the experiment.
This article establishes a three-dimensional model for the average pore-throat radius of the reservoir in question using comprehensive 2D NMR scanning data of full-diameter core samples from the entire well section of the Wuerhe Formation. We conducted continuous oil displacement experiments through the online NMR injection of CO2, clarifying the patterns of CO2 oil displacement within each pore-throat interval. Additionally, the three-dimensional pore-throat model is integrated with the identified microscopic mobilization rules to achieve quantitative characterization of the CO2 displacement oil reservoir utilization rate, which is used for the dynamic analysis of field experiments involving on-site gas injection.

2. Distribution Pattern of Pore Throats

2.1. Core Experiment

The constant-rate mercury injection data show that the Wuerhe Formation reservoir as a whole develops nanoscale pore throats. By organizing the experimental data of the entire wellbore section, information such as its porosity, its permeability, and the average capillary radius of the samples were extracted. The effective porosity of the Wuerhe Formation reservoir is 6.71%, its permeability is 3.0 mD, its median pressure is 4.72 MPa, its median radius is 0.54 μm, its average capillary radius is 0.39–4.53 μm, and its unsaturated pore volume is 38.54% (Table 1). The overall pore-throat radius of the Wuerhe Formation reservoir is small, the displacement pressure is high, and the pore structure is poor. The pore-throat coordination number can reflect the permeability characteristics of different reservoirs, and the lower pore-throat coordination numbers of the Mahu conglomerate reservoir are an important factor leading its lower permeability. The reservoir space of the Wuerhe Formation is mainly composed of residual intergranular pores, accounting for 40.9% of its pores, followed by intragranular dissolution pores and shrinkage pores. The proportion of pore-throat coordination numbers less than 1 reaches 86.3%, and the proportion between 1 and 2 is 10.7%.

2.2. Full-Diameter Core Nuclear Magnetic Resonance Scanning

The tight conglomerate in the Mahu oil region of Xinjiang has strong heterogeneity, with a low crude oil density and viscosity. The use of indoor core experiments to determine its pore fluid characteristics has significant limitations. Especially when selecting rock samples for indoor experiments, the test results were discontinuous, making it difficult to establish a comprehensive understanding of the reservoir. By using a mobile on-site NMR core analyzer, fresh core measurements can be taken on site without damaging the core, obtaining high-resolution and continuous reservoir and fluid information [21]. Full-diameter core T2 measurements were conducted on the designed sealed coring well core in the Wuerhe Formation reservoir to obtain its standard T2 spectra, porosity, pore structure, and other parameters with a longitudinal resolution of 2 cm. Simultaneously, we obtained two-dimensional nuclear magnetic T1–T2 spectra, selecting core sections with good oil content, moderate oil content, poor oil content, and no oil content for T1–T2 measurement based on the on-site core conditions, providing a data foundation for establishing a regional two-dimensional nuclear magnetic fluid identification map (Figure 2). Subsequently, the core was selected and immediately wrapped with plastic wrap after being removed from the tube. Then, the T2 spectrum measurement and T1–T2 displacement measurement were started to observe the changes in porosity and oil content.
The core depth was 98.57 m, the core length was 92.66 m, and the yield was 94%. The on-site full-diameter core NMR scanning of the entire well section was completed. The scanning results indicate the presence of high-porosity mudstone at both the top and bottom of the Wuerhe Formation, and a section of low-porosity mudstone of about 3 m across in the middle. The physical properties and oil content of the upper sandstone are poor, and the T2 spectrum of this area is dominated by a single peak, with the main peak leaning to the right. The total porosity is 4–7% and the effective porosity is 1.5–2%. The T2 spectrum of the lower sandstone shows good physical properties in a bimodal pattern, with a porosity of 10–14.0% and an effective porosity of 4.0–6.0%. The main oil reservoir is a sandstone reservoir, as shown in core 3366.81–3372.67 m of the 13th cylinder (Figure 3). The T2 spectrum of this area shows a bimodal distribution range of 0.02–100 ms, with the main peak on the left ranging from 0.03 to 2 ms. The right peak signal is obvious, with a total porosity of 10–14% and an effective porosity of only 4–6%. The corresponding two-dimensional NMR shows obvious oil content.

2.3. Calculation of Average Pore-Throat Radius

The transverse and longitudinal heterogeneities of tight conglomerate reservoirs are very strong, reflecting the rapid changes in rock pore structure at the microscopic level. The average pore-throat radius is an important parameter for characterizing the pore structures of reservoirs. Through the continuous coring of full-diameter core online nuclear magnetic data, an accurate reservoir porosity and rich information on the pore structure are provided, providing a favorable approach for calculating the pore-throat radius. We established a relationship based on the logarithmic mean of the T2 relaxation time obtained from the continuous NMR in order to calculate the pore-throat radius [22]. Firstly, we calculated the logarithmic mean of the nuclear magnetic relaxation time T2gm. The pore-throat radius determined by core mercury intrusion testing shows a proportional relationship with the T2gm (Figure 4), allowing us to establish a formula for the nuclear magnetic calculation of the pore-throat radius (Equation (1)).
NMR calculation of pore-throat radius:
r = 0.4829 × T2gm1.4709
Based on the NMR scanning data of the full-diameter core of the entire well section, the pore-throat size was calculated using T2gm, and the overall NMR calculation of the Wuerhe Formation reservoir showed a high degree of fit for the pore-throat radius (Figure 5).
Considering that it is difficult to cover the entire reservoir with full-diameter core NMR scanning, it is necessary to select parameters that can be obtained in the entire area and to establish their relationship with the average pore-throat radius. There is a good correlation between the movable porosity calculated based on the NMR and reservoir properties [23]. By utilizing the abundant movable porosity parameters determined by the NMR of the full-diameter core samples, a fitting relationship was established with the calculated average pore-throat radius of the entire wellbore section (Figure 6), showing a clear positive relationship. A formula for calculating the pore-throat radius of the movable porosity was established (Equation (2)). Based on the three-dimensional geological attribute model of the research area, a three-dimensional model of the average pore-throat radius was established (Figure 7) to explain the reservoir pore-throat radius of 0.01~4.36 μm, which had an average of 0.33 μm and was concentrated in the range of 0.03~0.9 μm.
Calculation of pore-throat radius for movable porosity:
r = 0.4186φ + 0.1683

3. The Law of Two-Phase Fluid Flow

The oil–water two-phase permeability curve shows that the experimental success rate of low-permeability conglomerate samples in the Mahu Depression is relatively low, and the measured relative permeability curve does not conform to the characteristics of typical low-permeability reservoir permeability curves. When the sample encounters water, the relative permeability of the oil phase rapidly decreases to below 0.1, while the relative permeability of the water phase rapidly increases to above 0.4. After encountering water, the pore oil does not have the ability to flow, and only the water phase circulates in the micro pore throats (Figure 8). Therefore, the water sensitivity of the low-permeability conglomerate reservoir in Mahu is moderate to strong, and the flow channels of the micro pores are unstable. Strong water sensitivity leads to a rapid decrease in the permeability of the oil phase upon contact with water, while the permeability of the water phase increases rapidly. It is difficult to effectively displace porous crude oil through water injection, which has a significant impact on the recovery rate.
The oil–water two-phase flow curve of the low-permeability conglomerate reservoirs shows that the relative permeability change curve of oil–water does not conform to the characteristics of typical reservoirs. After the reservoir comes into contact with water, the permeability of the oil phase will rapidly decrease, and it will lose its flow capacity. The reservoir has strong water sensitivity. The oil–gas two-phase permeability curve shows that the relative permeability curve conforms to the characteristics of typical low-permeability reservoir permeability curves, and the two-phase zones are relatively narrow. As the gas saturation in the core increases, the relative permeability of the oil phase decreases and the relative permeability of the gas phase increases, but the final increase in the relative permeability of the gas phase is not high, with all increases being below 0.55 (Figure 9).
Effective data can be obtained on the two-phase permeability of gas and oil in core samples, indicating that the flowability of gas in the micro pores of the low-permeability conglomerate reservoir in Mahu is much stronger than that of liquid, and the oil displacement effect is better than that of water displacement. Therefore, gas displacement is used for low-permeability conglomerate reservoirs in the Mahu Depression, which results in a slower decrease in the relative permeability of the oil phase and effective seepage. The displacement effect and recovery rate are better than for water displacement.
According to the analysis of the oil–water and oil–gas two-phase flow curves, the low-permeability conglomerate reservoir in the Mahu oil area has strong water sensitivity. After the reservoir encounters water, the oil phase permeability will rapidly decrease. However, for the oil–gas two-phase flow, as the gas saturation increases, the oil phase permeability will decrease, but it still has the ability to flow. Therefore, when there are three types of fluids present in the pore space, the higher the gas content, that is, the higher the gas–oil ratio, the slower the decrease in oil phase permeability during displacement, which is beneficial for crude oil production and has a significant promoting effect on improving reservoir recovery.

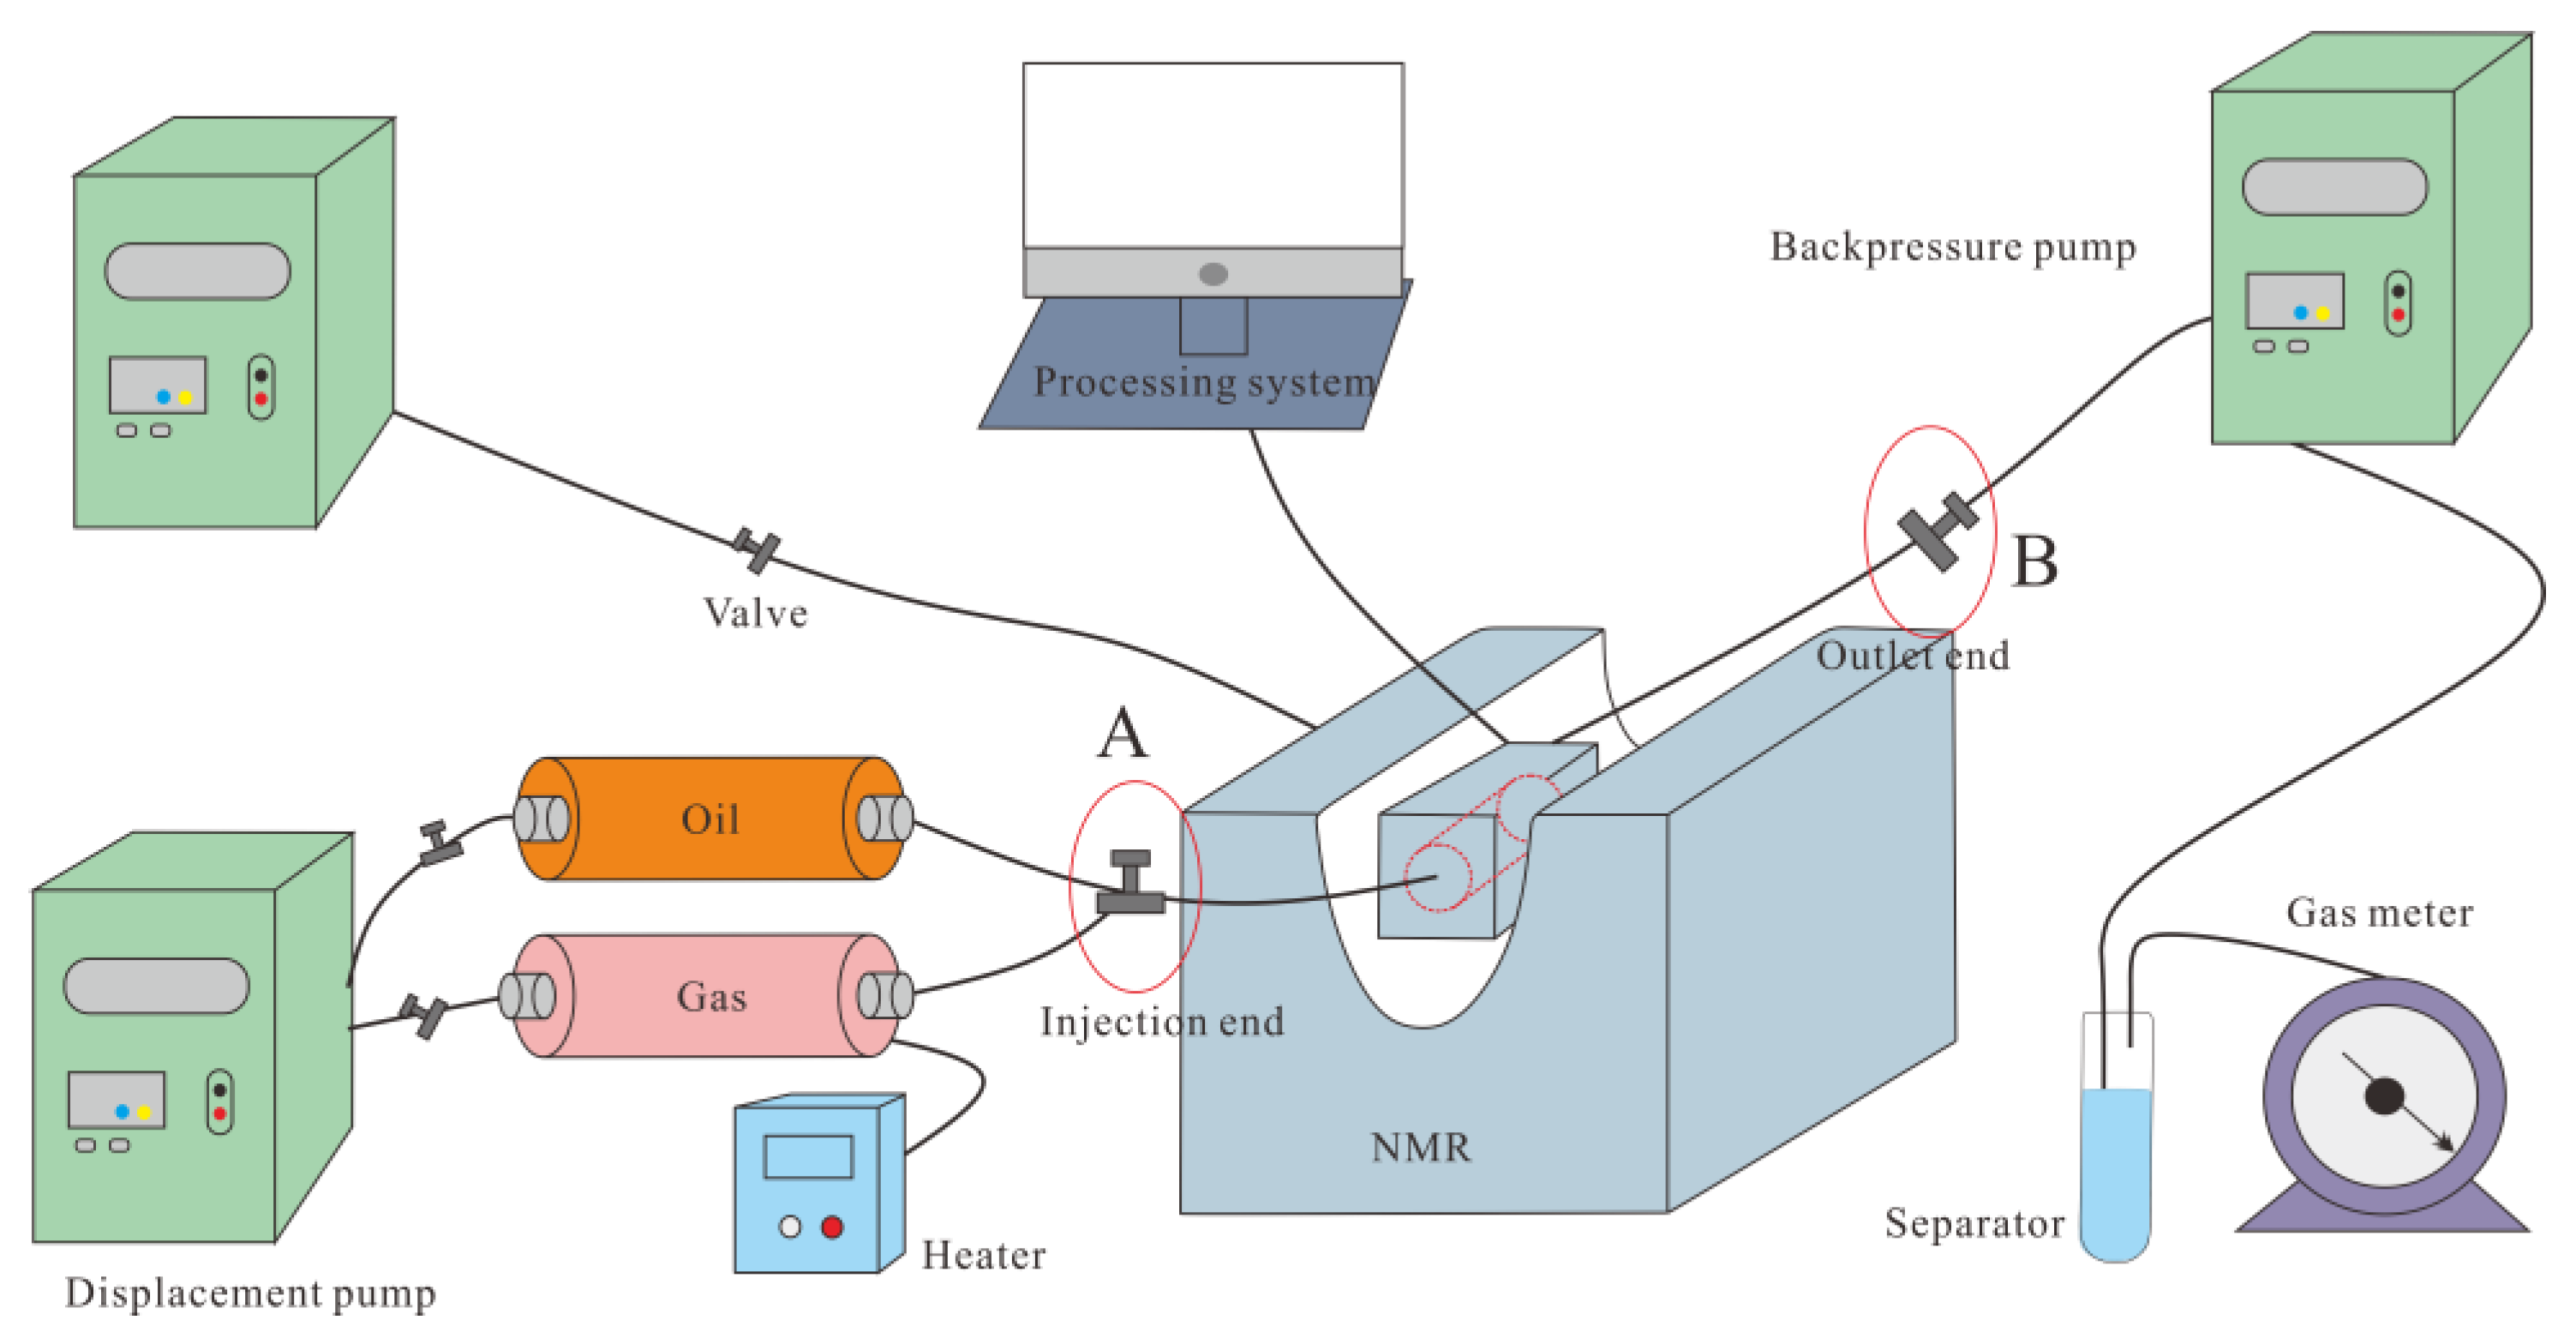
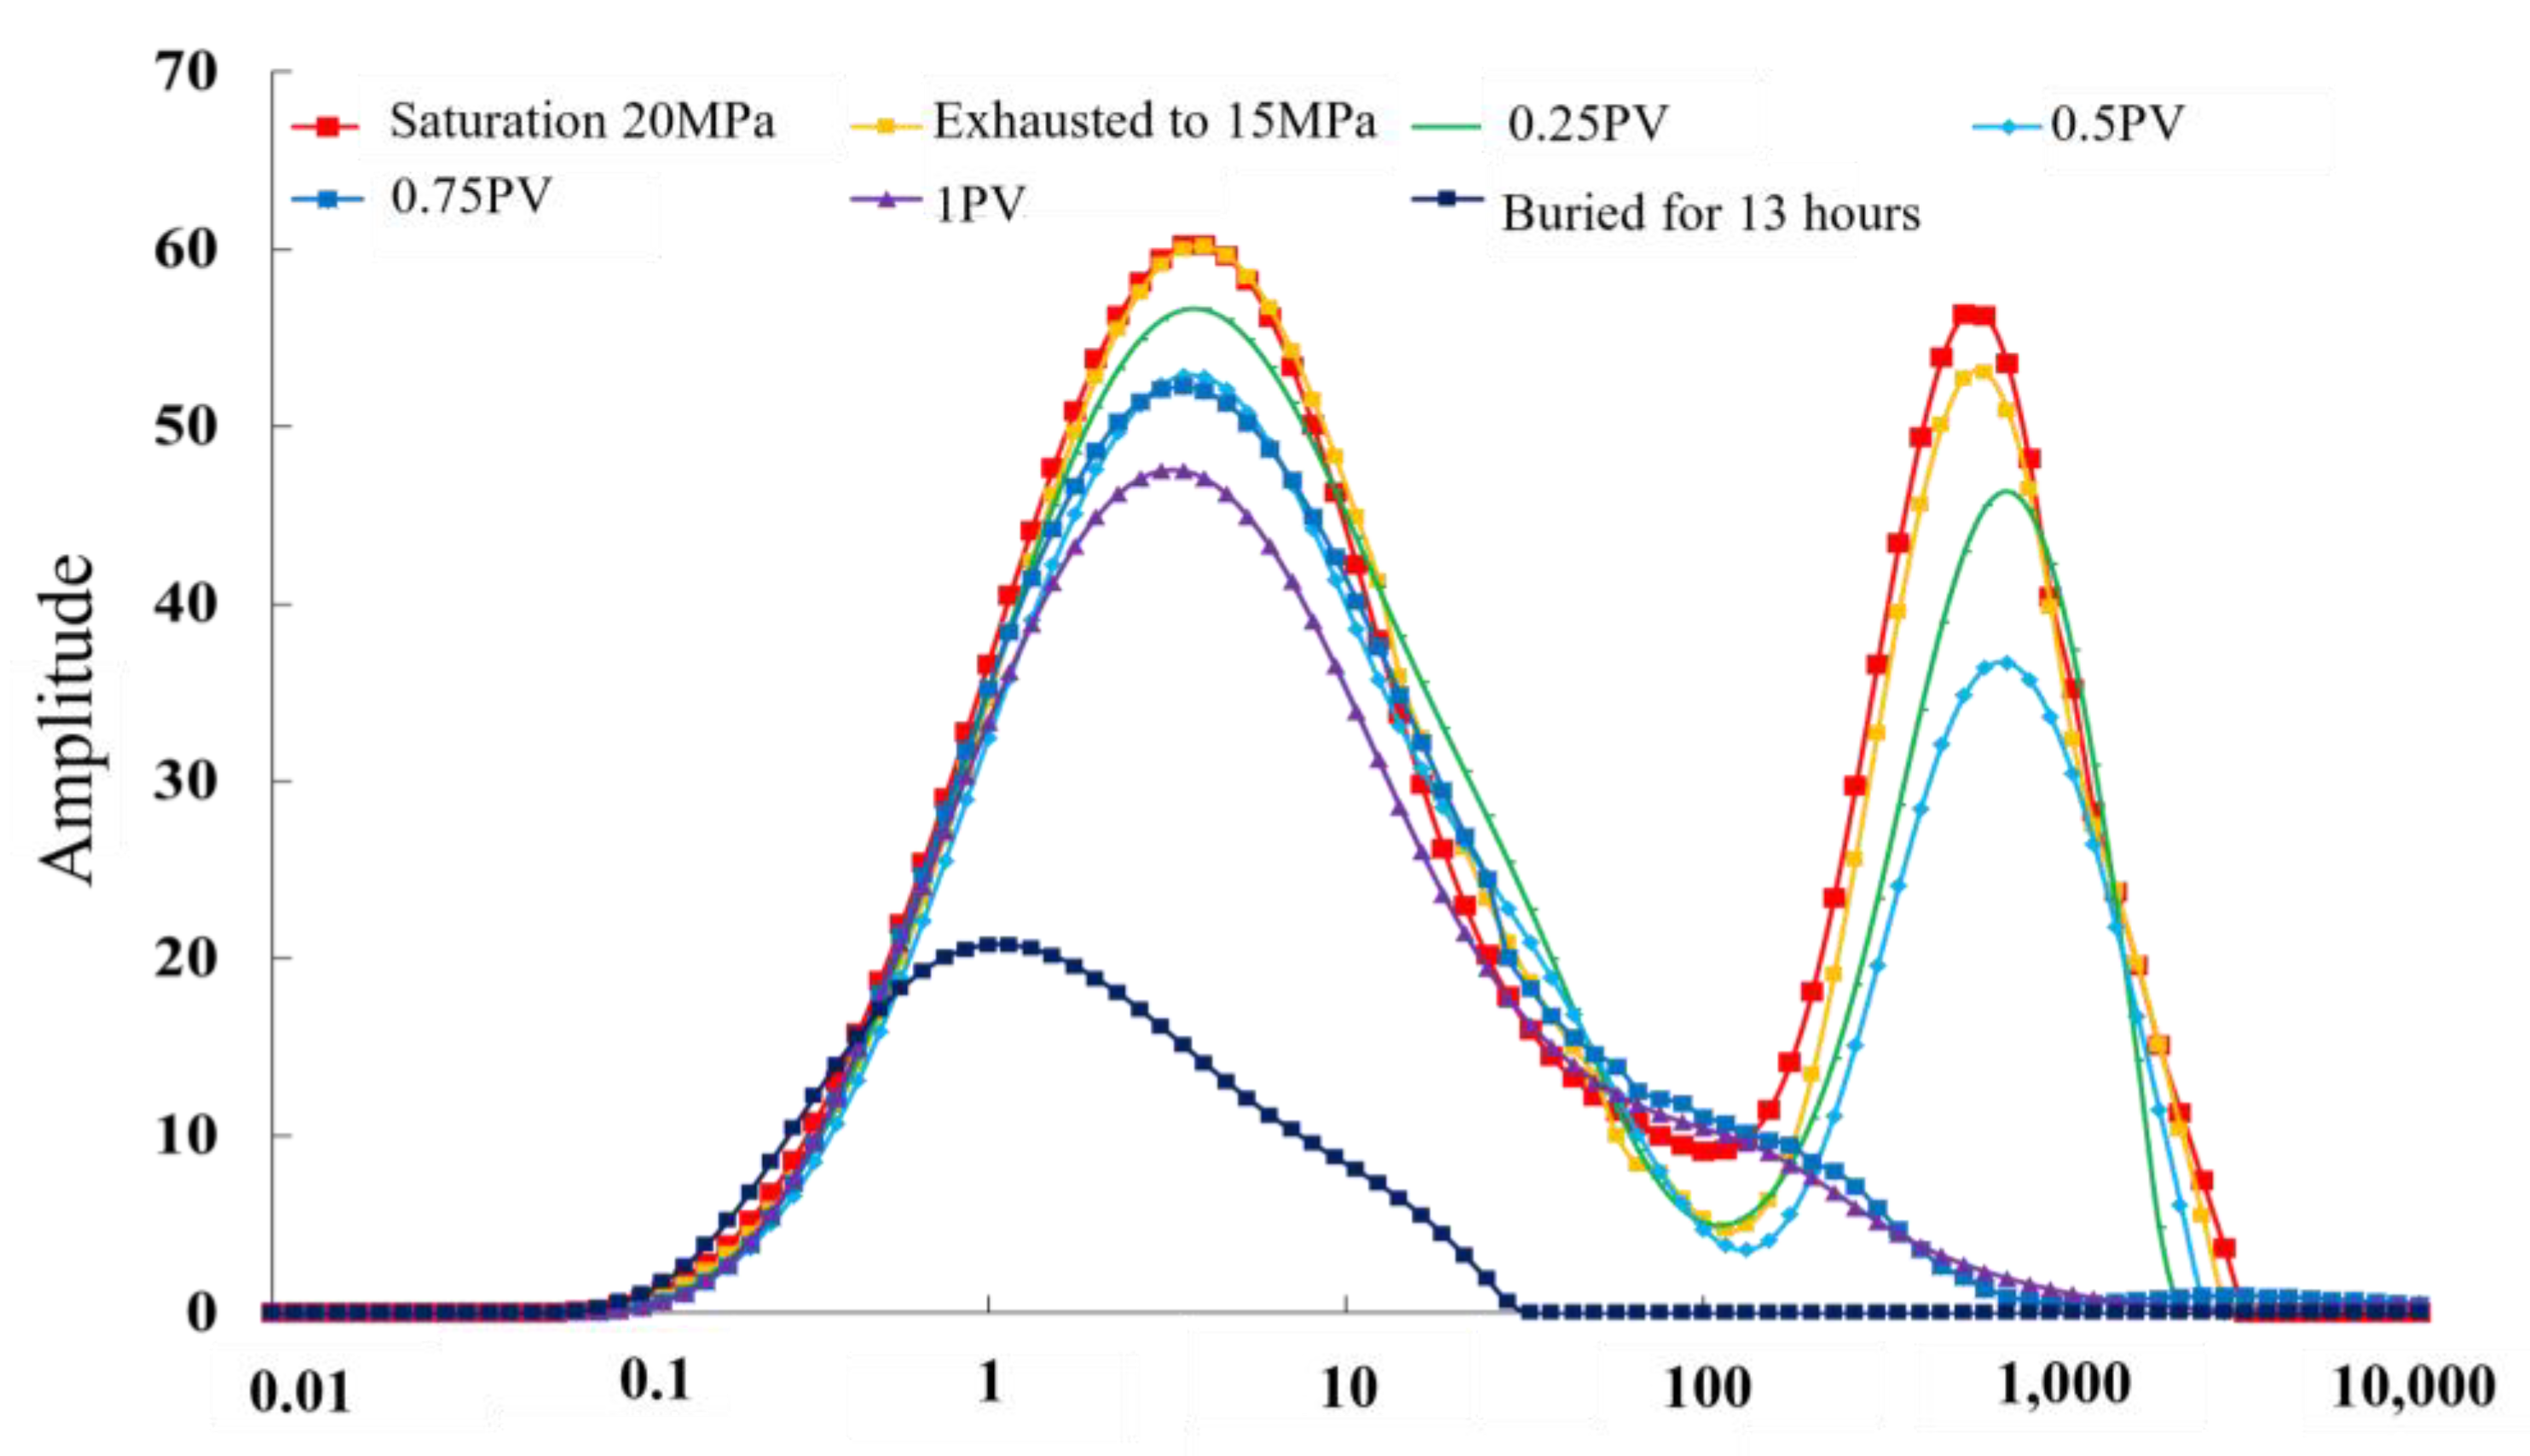
4. The Utilization Law of T2 Spectrum in CO2 Continuous Displacement

By conducting online NMR injection CO2 continuous oil recovery experiments on tight conglomerate rock cores, the CO2 gas recovery laws in each pore-throat interval were determined. The experimental design was carried out under the conditions of 15 MPa and 50 °C. CO2 was continuously injected into the A end of the gripper at a rate of 0.03 mL/min, while the B end remained open. The core was scanned by NMR every minute until the outlet end no longer produced oil, ending the experiment (Figure 10).
By continuously injecting CO2 into the core at a lower rate for continuous oil recovery, dynamic changes in the NMR T2 spectra of the core samples were obtained at different injection pore volume multiples (Figure 11). It can be clearly seen from the figure that six T2 spectral curves are provided for CO2 continuous displacement, representing the occurrence state of crude oil in the micro pore throats of the core under saturated crude oil, depleted conditions, and injected pore volume multiples of 0.25 PV, 0.5 PV, 0.75 PV, and 1 PV, respectively. In the saturated oil state, the T2 spectrum shows a bimodal distribution, with the left peak representing the crude oil present in the small pore throats under the initial conditions of the core, and the right peak representing the crude oil present in the artificial fractures. In order to further clarify the displacement law of the CO2 continuous displacement of micro pore-throat crude oil, the time domain of the T2 spectrum was converted into the spatial domain of the pore-throat size. By comparing and analyzing the utilization degree of crude oil in a pore throat of the same scale under different displacement states and the utilization degree of crude oil in different pore-throat radii under the same displacement state, the utilization law of pore-throat crude oil was quantitatively characterized.
After determining the conversion coefficient C between the T2 relaxation time and the pore-throat radius based on the literature, the corresponding relationships between the T2 relaxation time and various types of pore throats can be determined [24,25]. There are three types of relaxation behavior of fluids in pores and throats: free relaxation T2B, surface relaxation T2S, and diffusion relaxation T2D. For rock cores saturated with crude oil, the T2 relaxation time mainly depends on the surface relaxation T2S. It can be expressed as:
1 T 2 S = ρ 2 ( S V ) pore
ρ2 is the transverse surface relaxation rate, μm/ms; S/V is the ratio of the pore surface area to the volume. The relationship between S/V and the pore radius is S/V = FS/r, where FS is the geometric factor and r is the pore radius, FS.
Accordingly, Equation (3) can be transformed into the following equation:
T 2 S = 1 ρ 2 F S r
Let 1 ρ 2 F S = C , then Equation (4) can be converted to 1 ρ 2 F S = C . Therefore, after obtaining the value of coefficient C, the T2 spectrum of NMR can be converted into a pore radius distribution.
The results indicate that, for different displacement states, CO2 gas has a good utilization degree for crude oil in pores with a radius greater than 20 μm, especially after injecting a pore volume of 0.75 PV. However, the utilization degree of crude oil in pore throats with radii ranging from 0.9 μm to 20 μm is generally low, and these pores are the main enrichment space for remaining oil. Based on the established average pore-throat three-dimensional model, the experiment to determine the micro pore-throat law of gas displacement was used to calibrate the CO2 injection oil recovery rate of 43.9%. CO2 displacement mainly utilizes reserves within the range of 0.3 μm to 9 μm, accounting for 60.77% of the reserves in the studied reservoir (Table 2).

5. Support Dynamic Analysis

According to the pressure data of each well group injected with CO2 on site, the injection pressure distribution is 20.3~22.7 MPa, and the formation pressure distribution is 32.6~53.1 MPa. Under a small injection production well spacing of 280 m, the pressure of the well group shows significant differences. By statistically analyzing the poor-fitting relationship between the injection pressure and the physical properties of reservoir perforation sections, it is considered that the injection pressure is strongly correlated with the upper limit of reservoir permeability. Based on the established three-dimensional pore-throat model, the distribution proportion of large pore throats of 0.9~2 μm in each gas injection well group was statistically analyzed (Figure 12). The injection pressure showed a negative correlation with the maximum pore-throat radius of the gas injection well group, and a negative correlation with the distribution proportion of large pore throats of 0.9~2 μm in each gas injection well group (Figure 13).

6. Conclusions

(1)
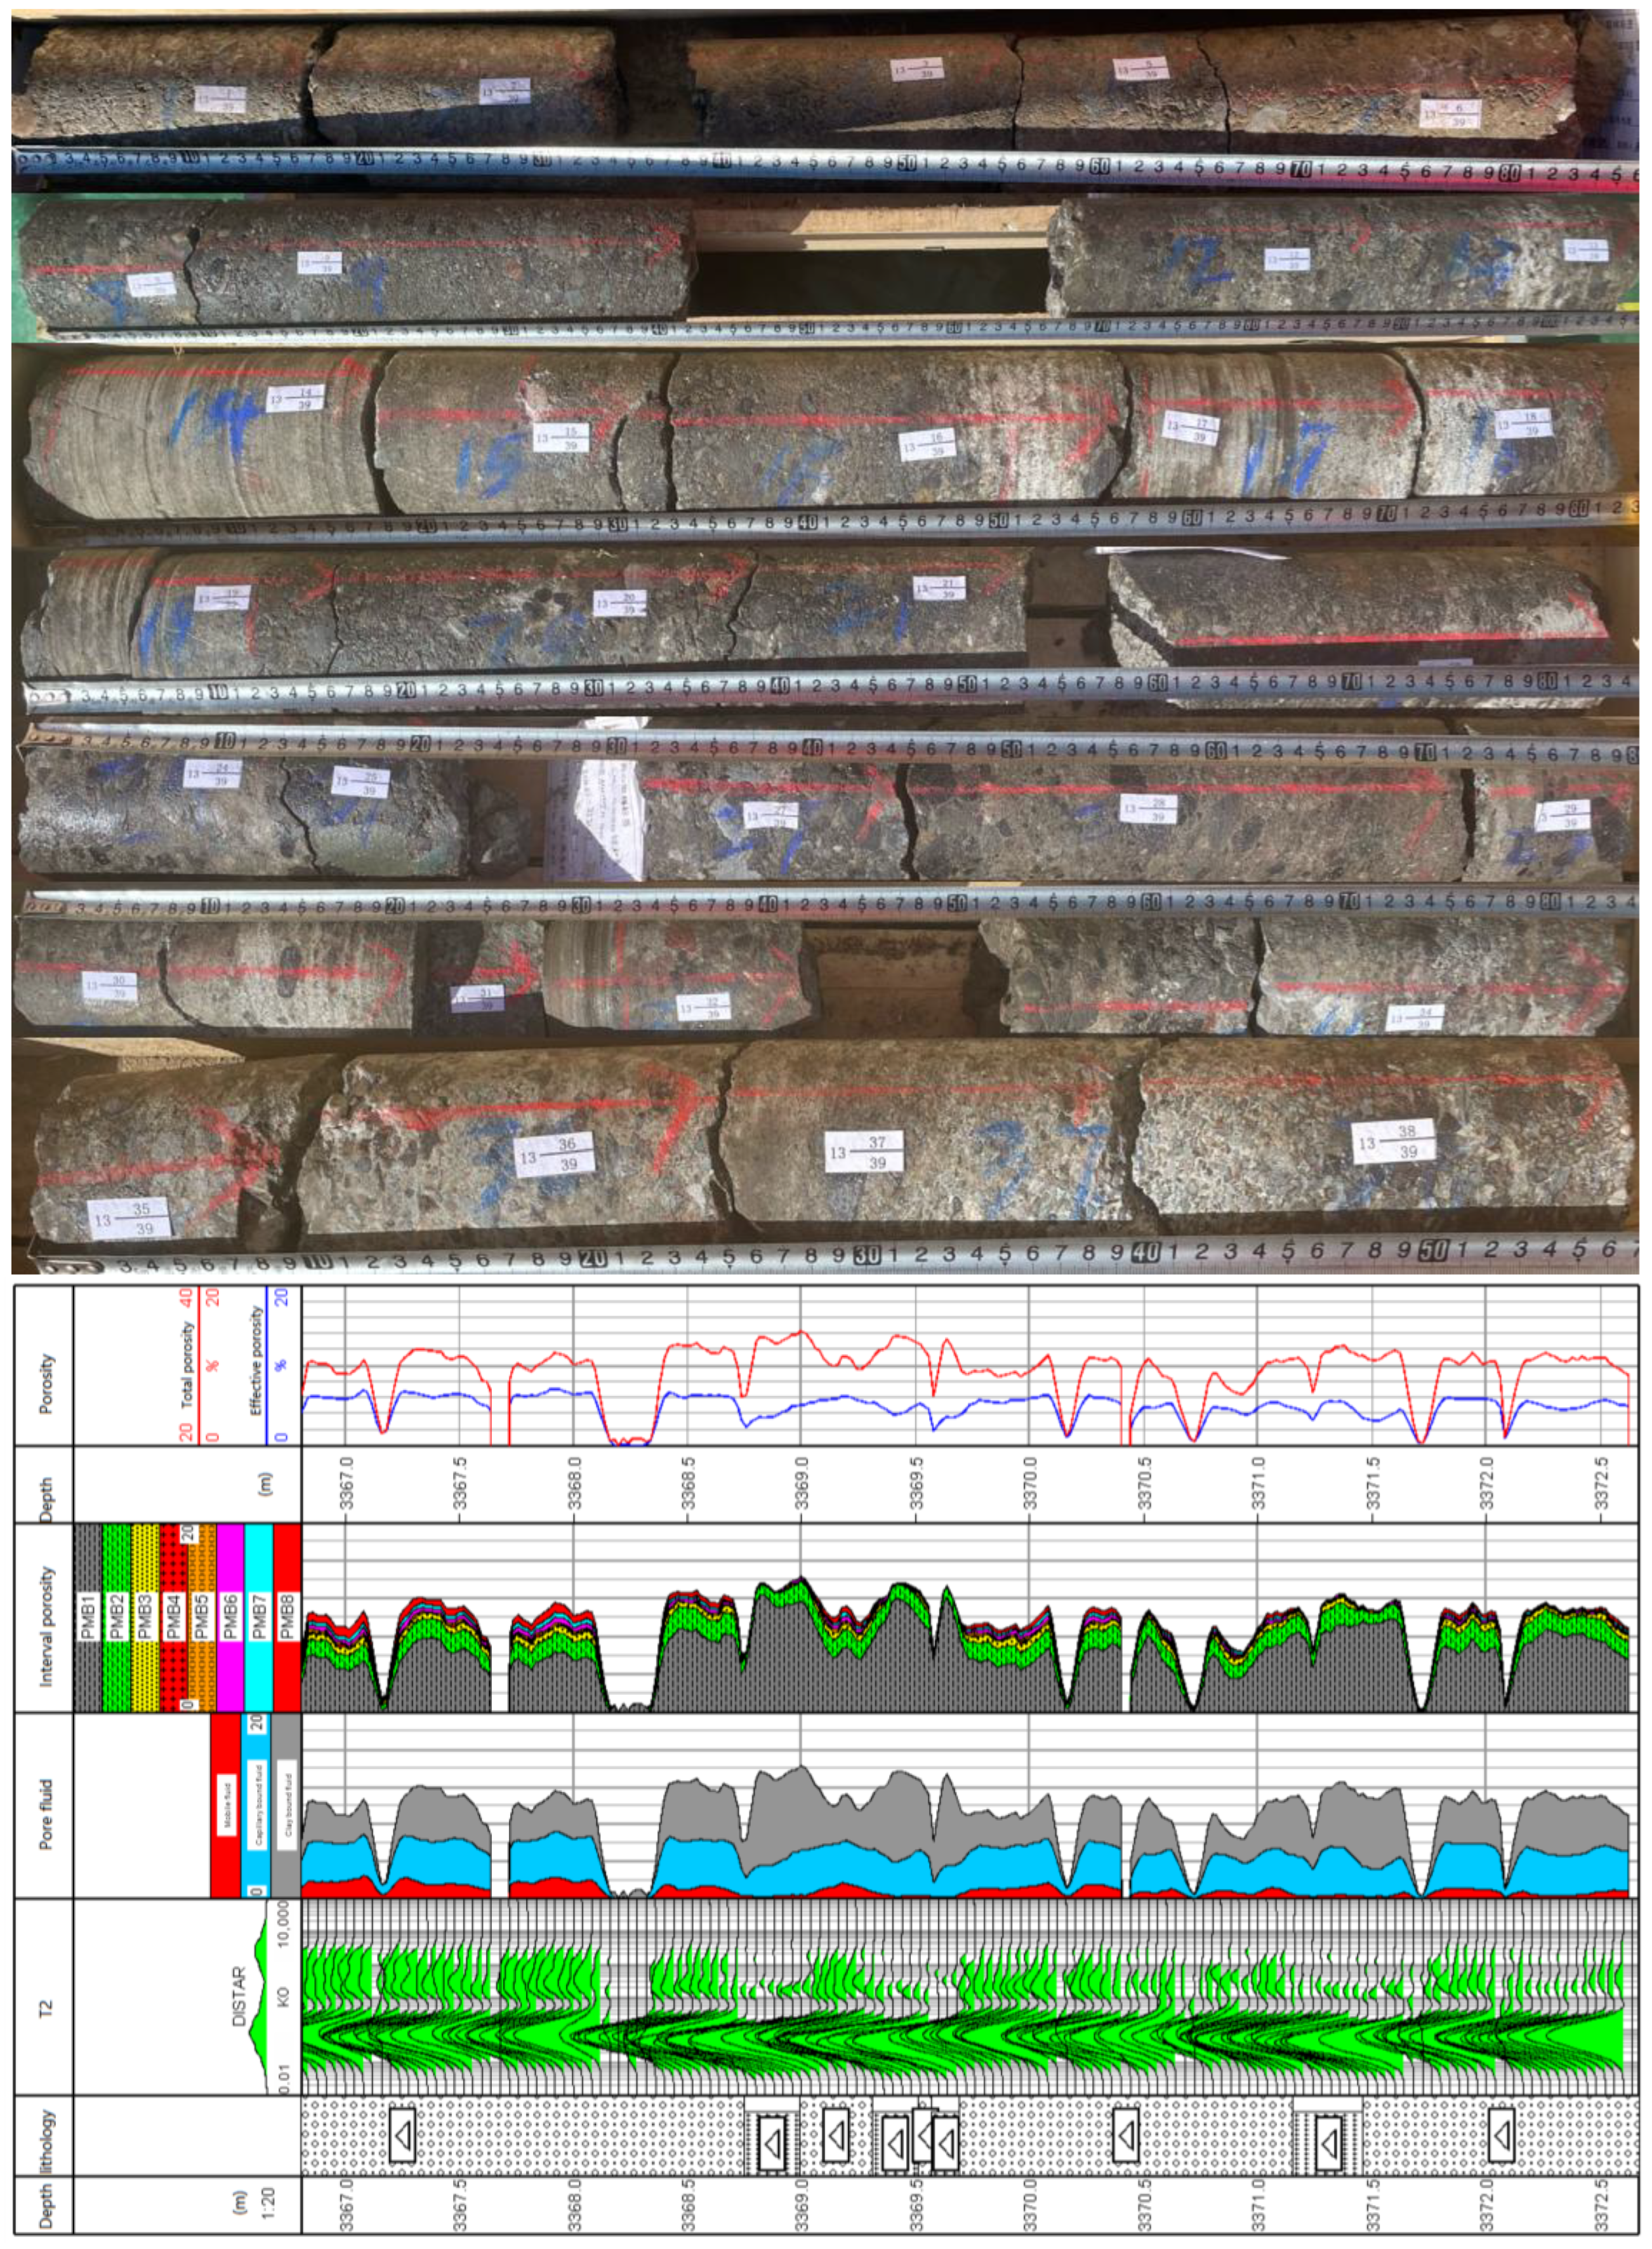
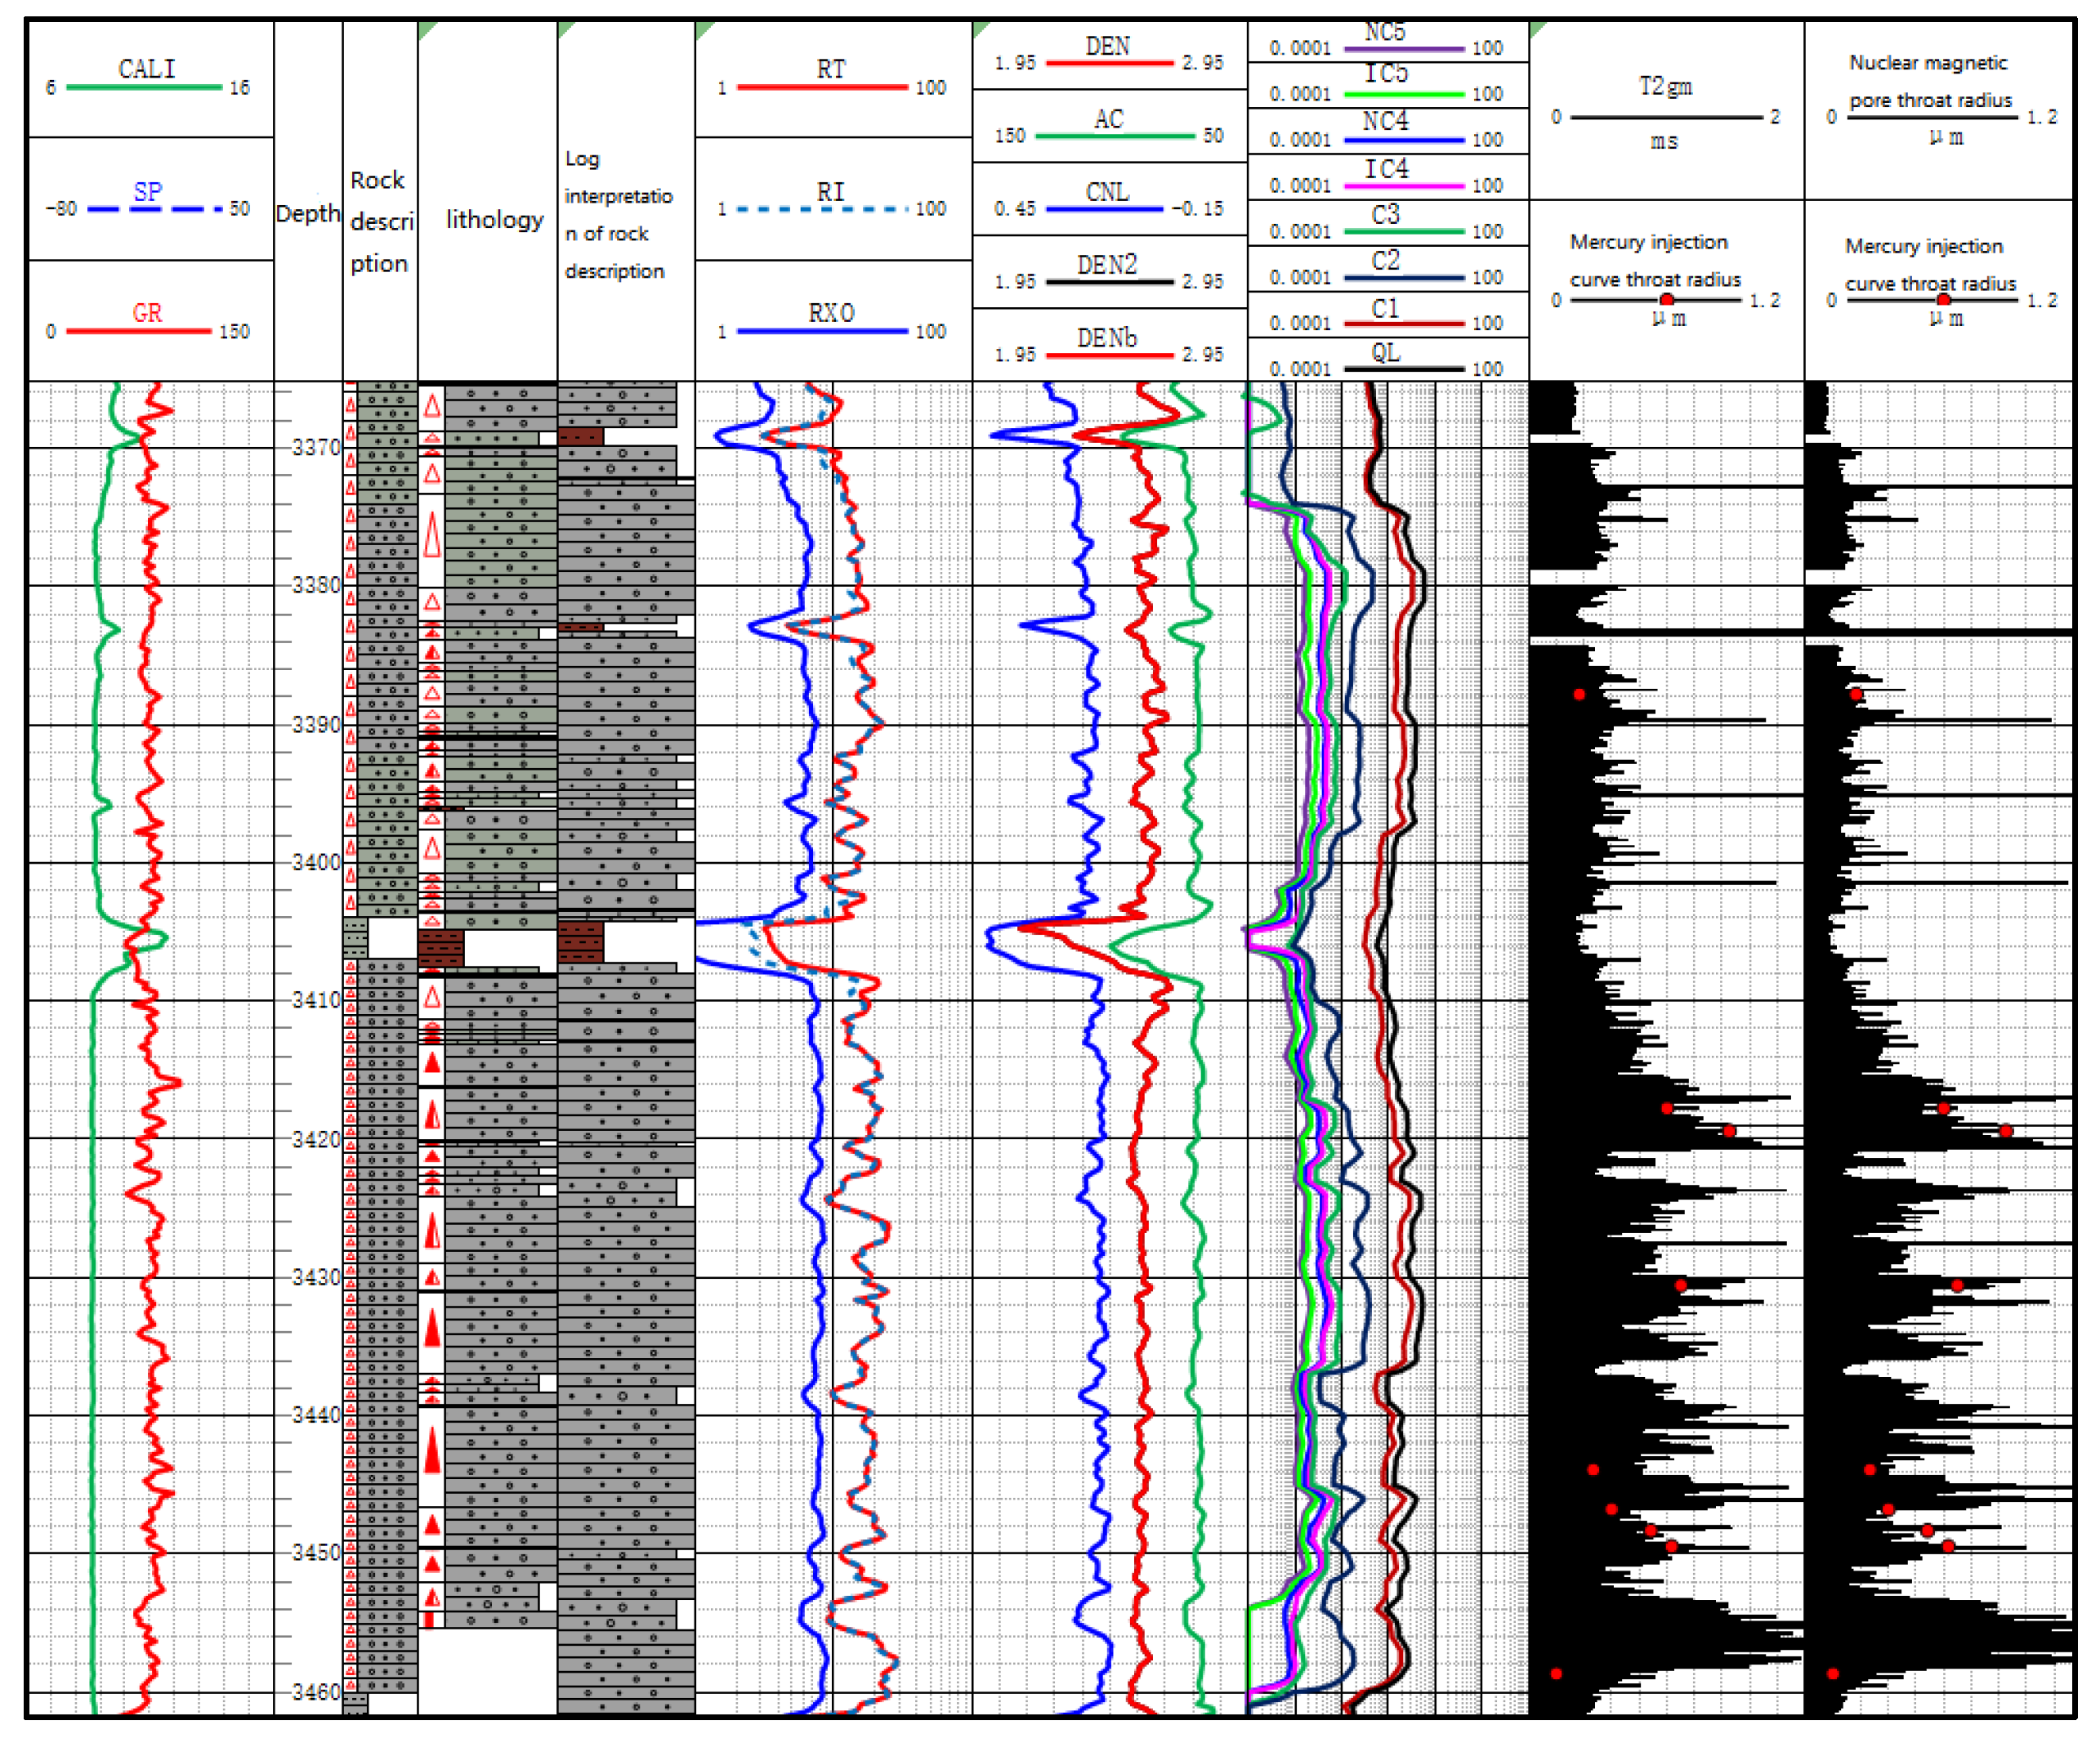
The pore-throat coordination number of the Wuerhe Formation reservoir space is low, with a proportion of 86.3% of its pore throats being below 1 μm. The on-site full-diameter core NMR scanning results of the entire well section show that the total porosity of the Wuerhe Formation is 10–14%, and the effective porosity is only 4–6%;
(2)
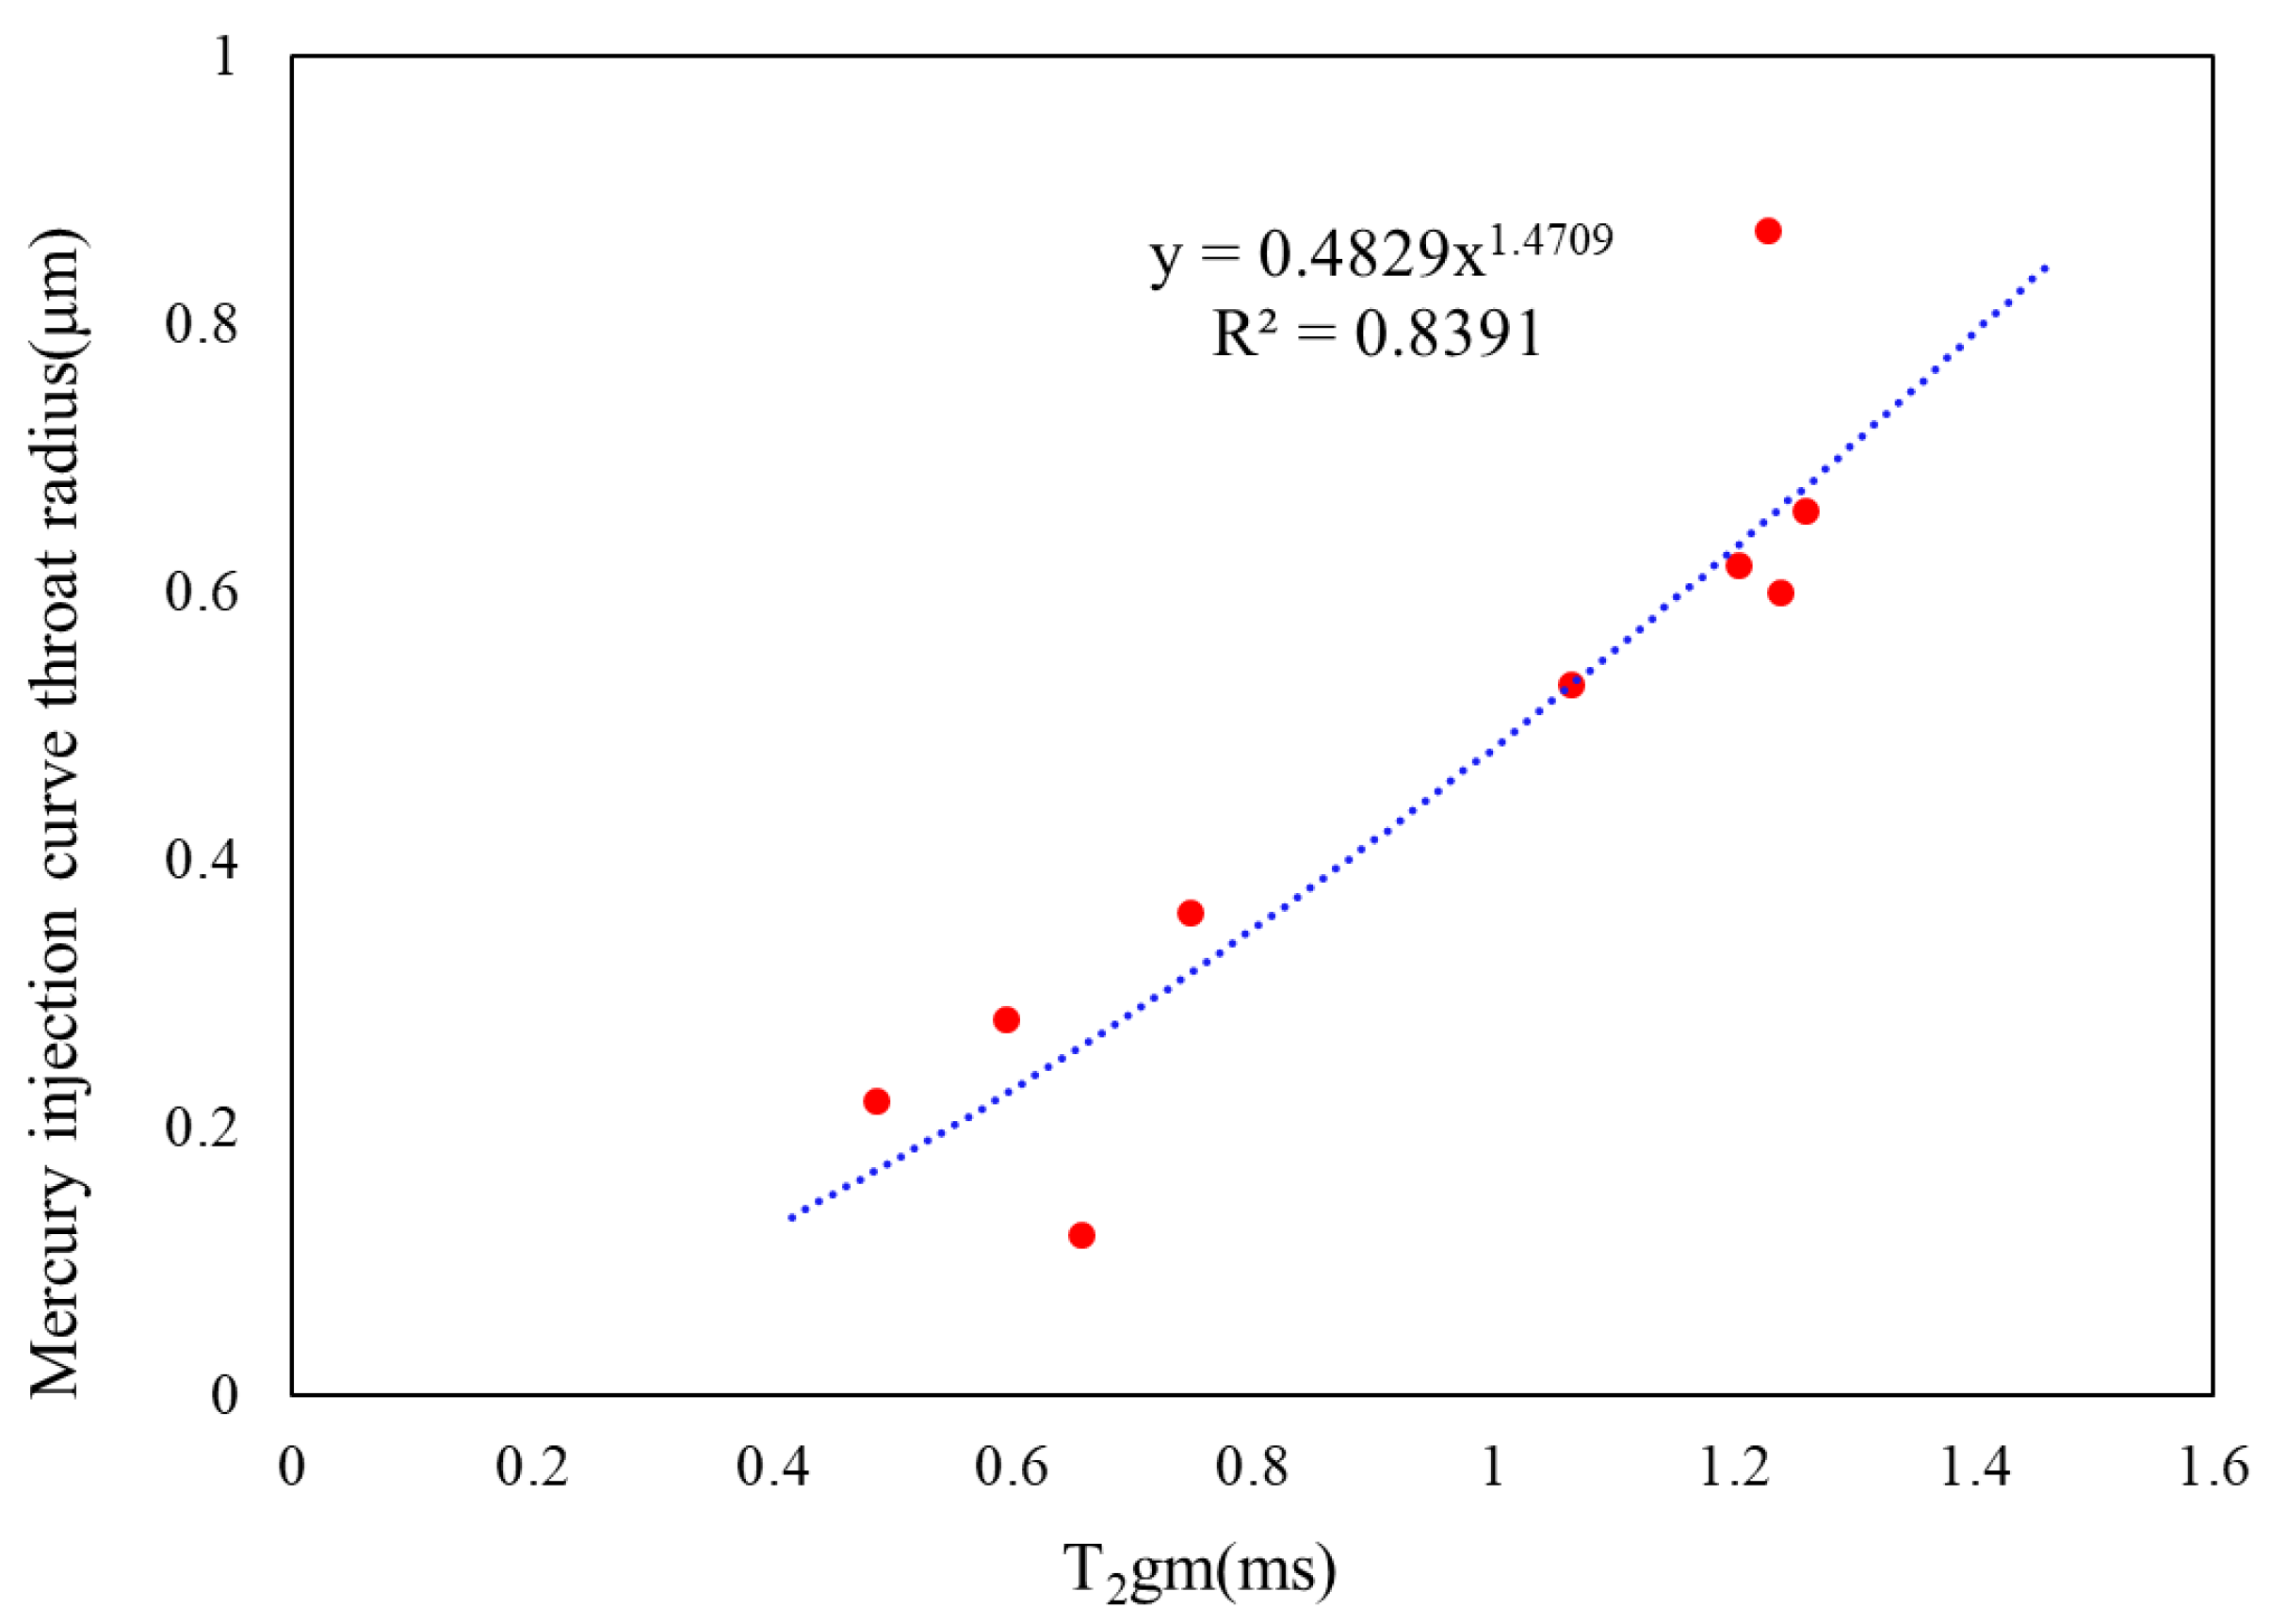
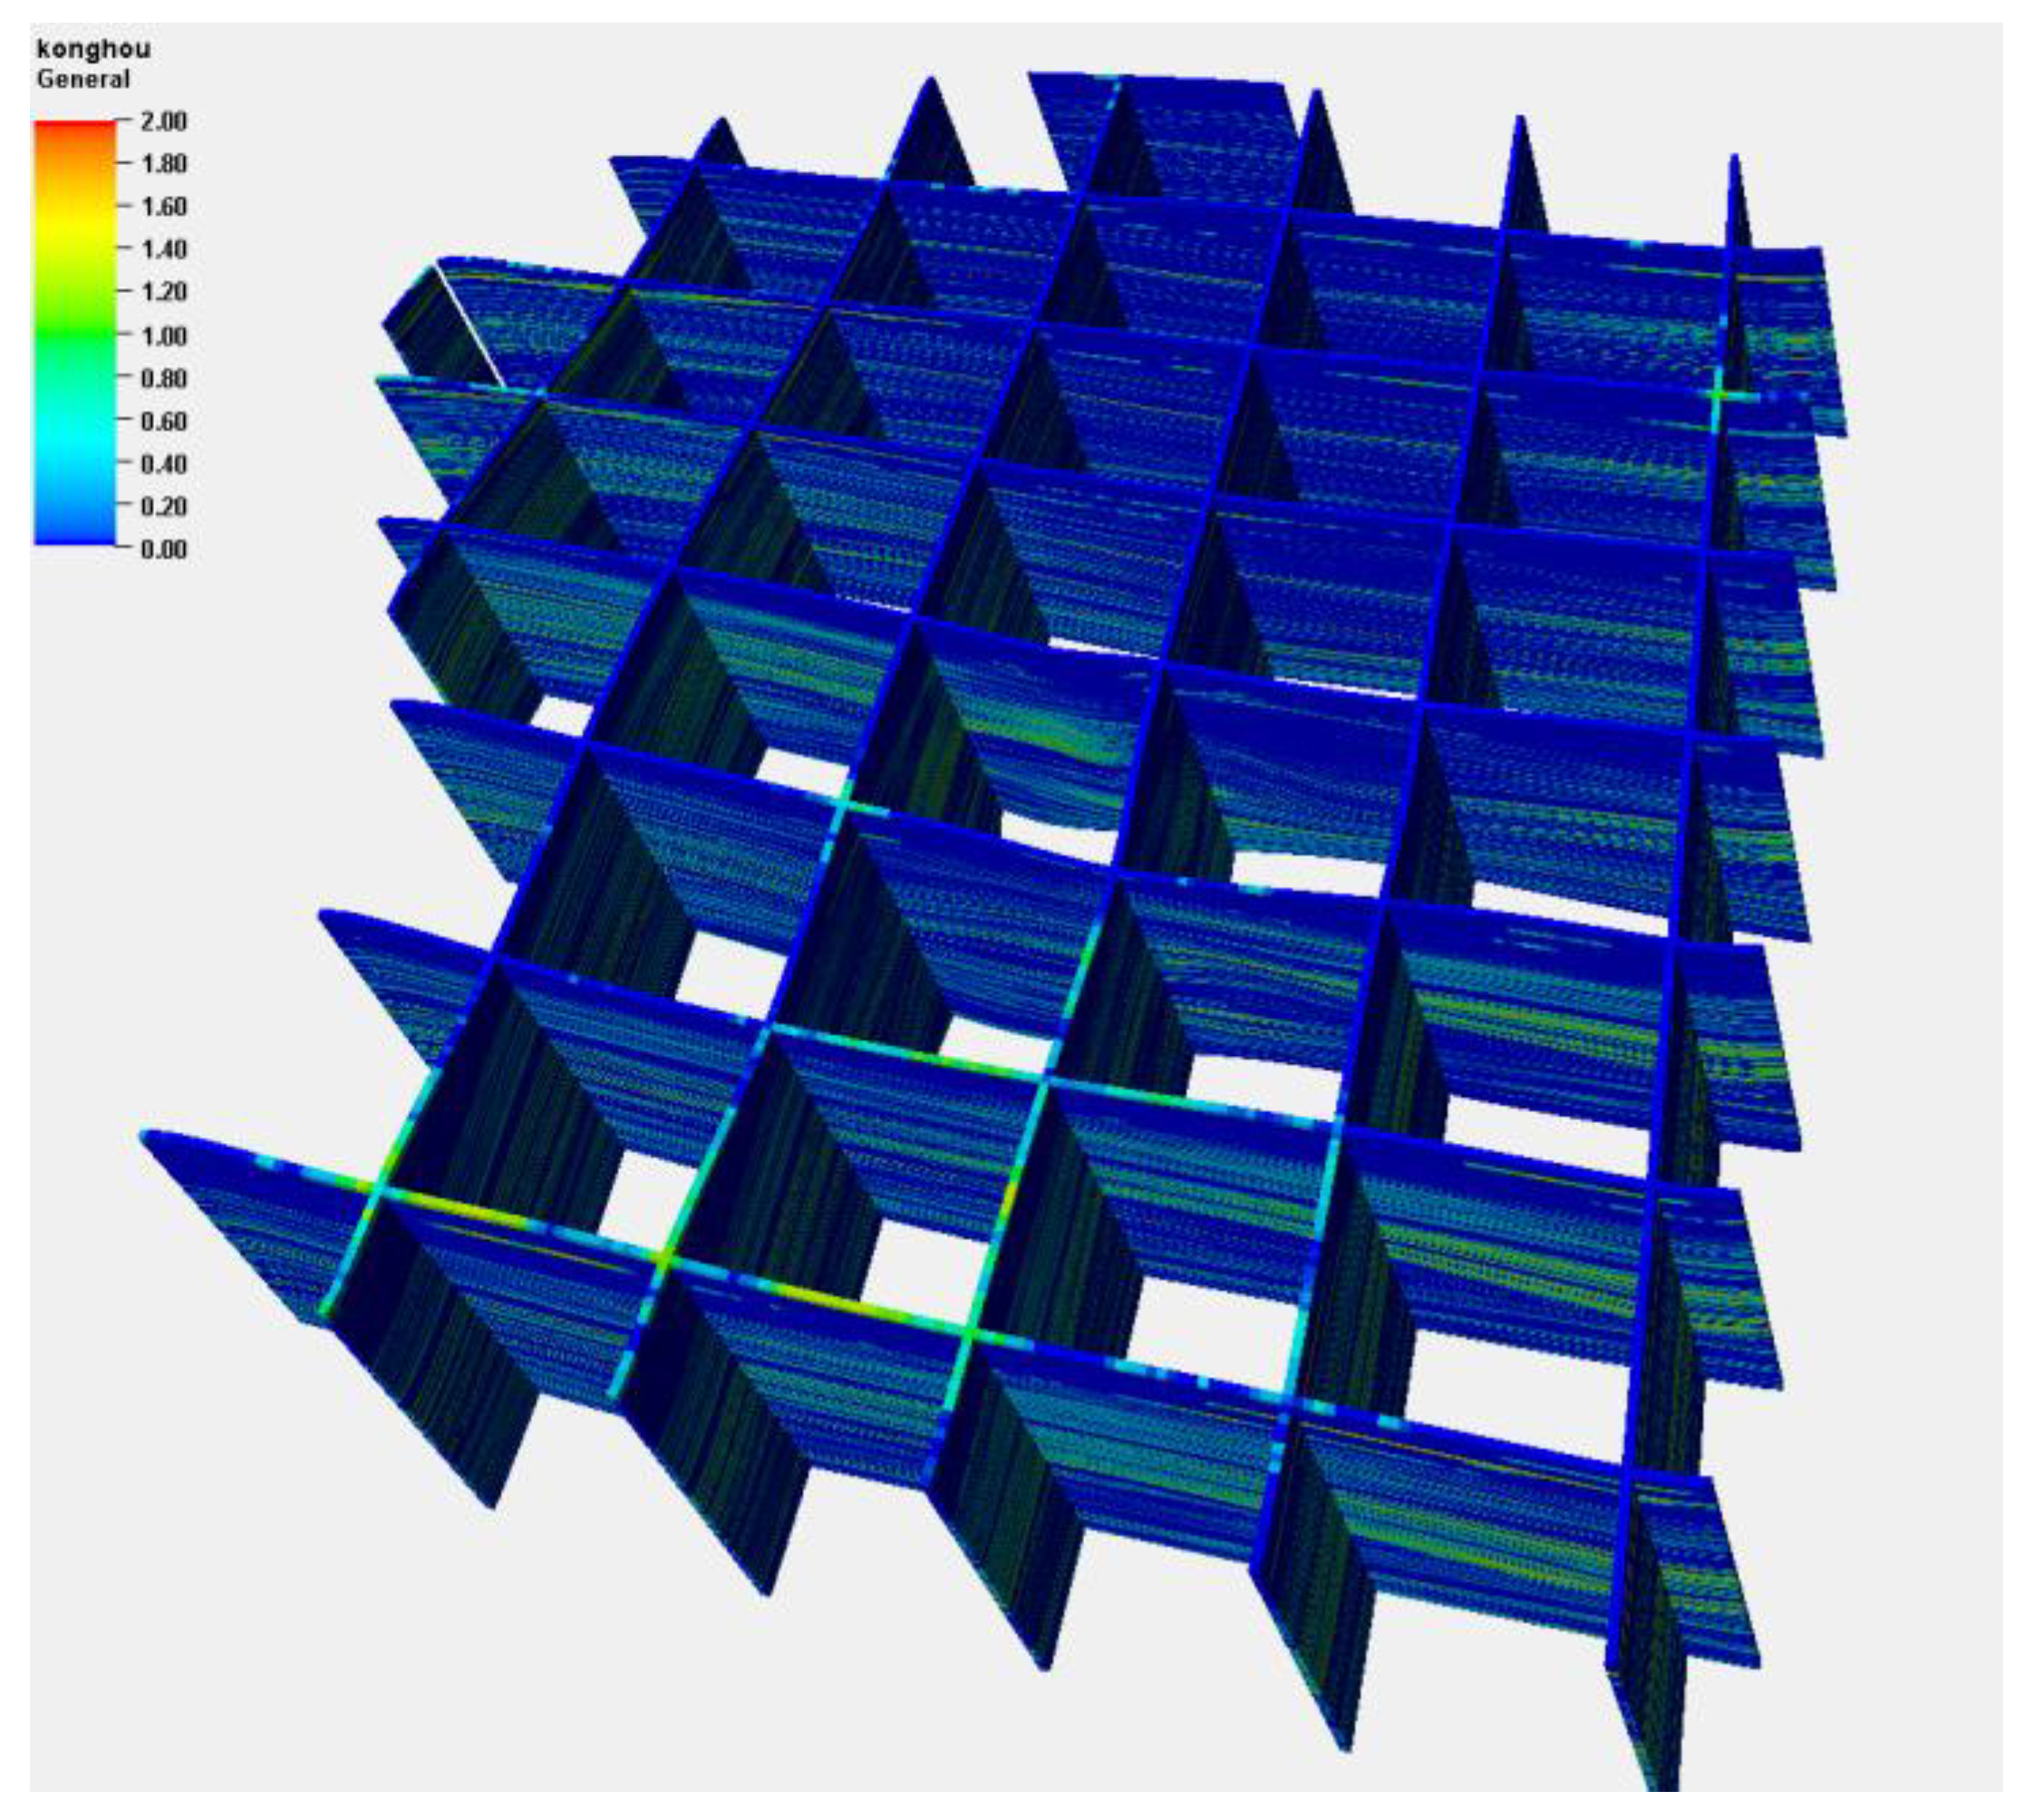
A correlation between the movable porosity parameters determined by NMR of the full-diameter core and the calculated average pore-throat radius can be established, thus allowing us to establish a formula for calculating the pore-throat radius of movable porosity. In addition, based on the three-dimensional geological attribute model of the research area, an average pore-throat radius three-dimensional model can be established to explain the reservoir pore-throat radius of 0.01~4.36 μm, which has an average of 0.33 μm and is concentrated in 0.03–0.9 μm areas;
(3)
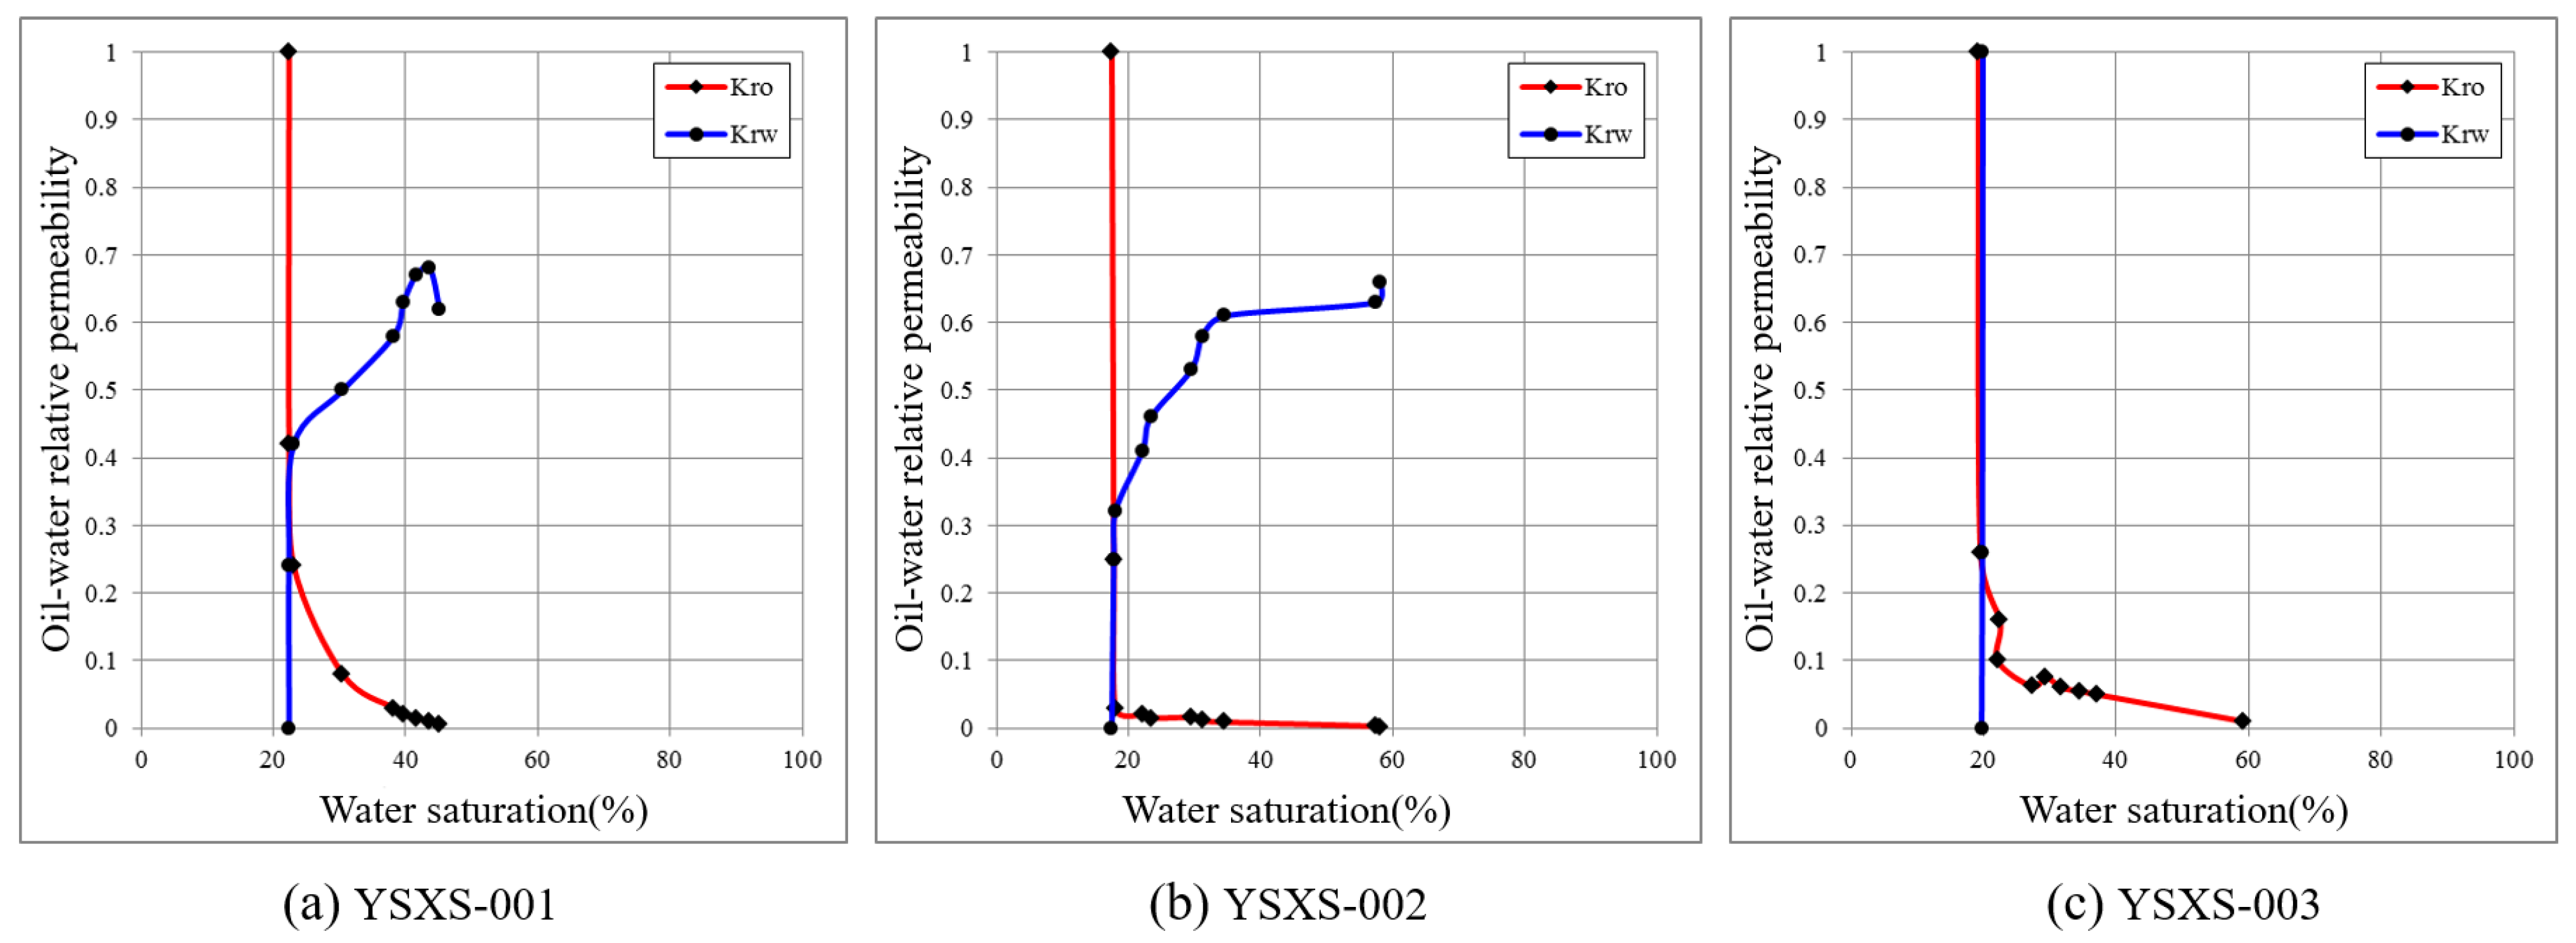
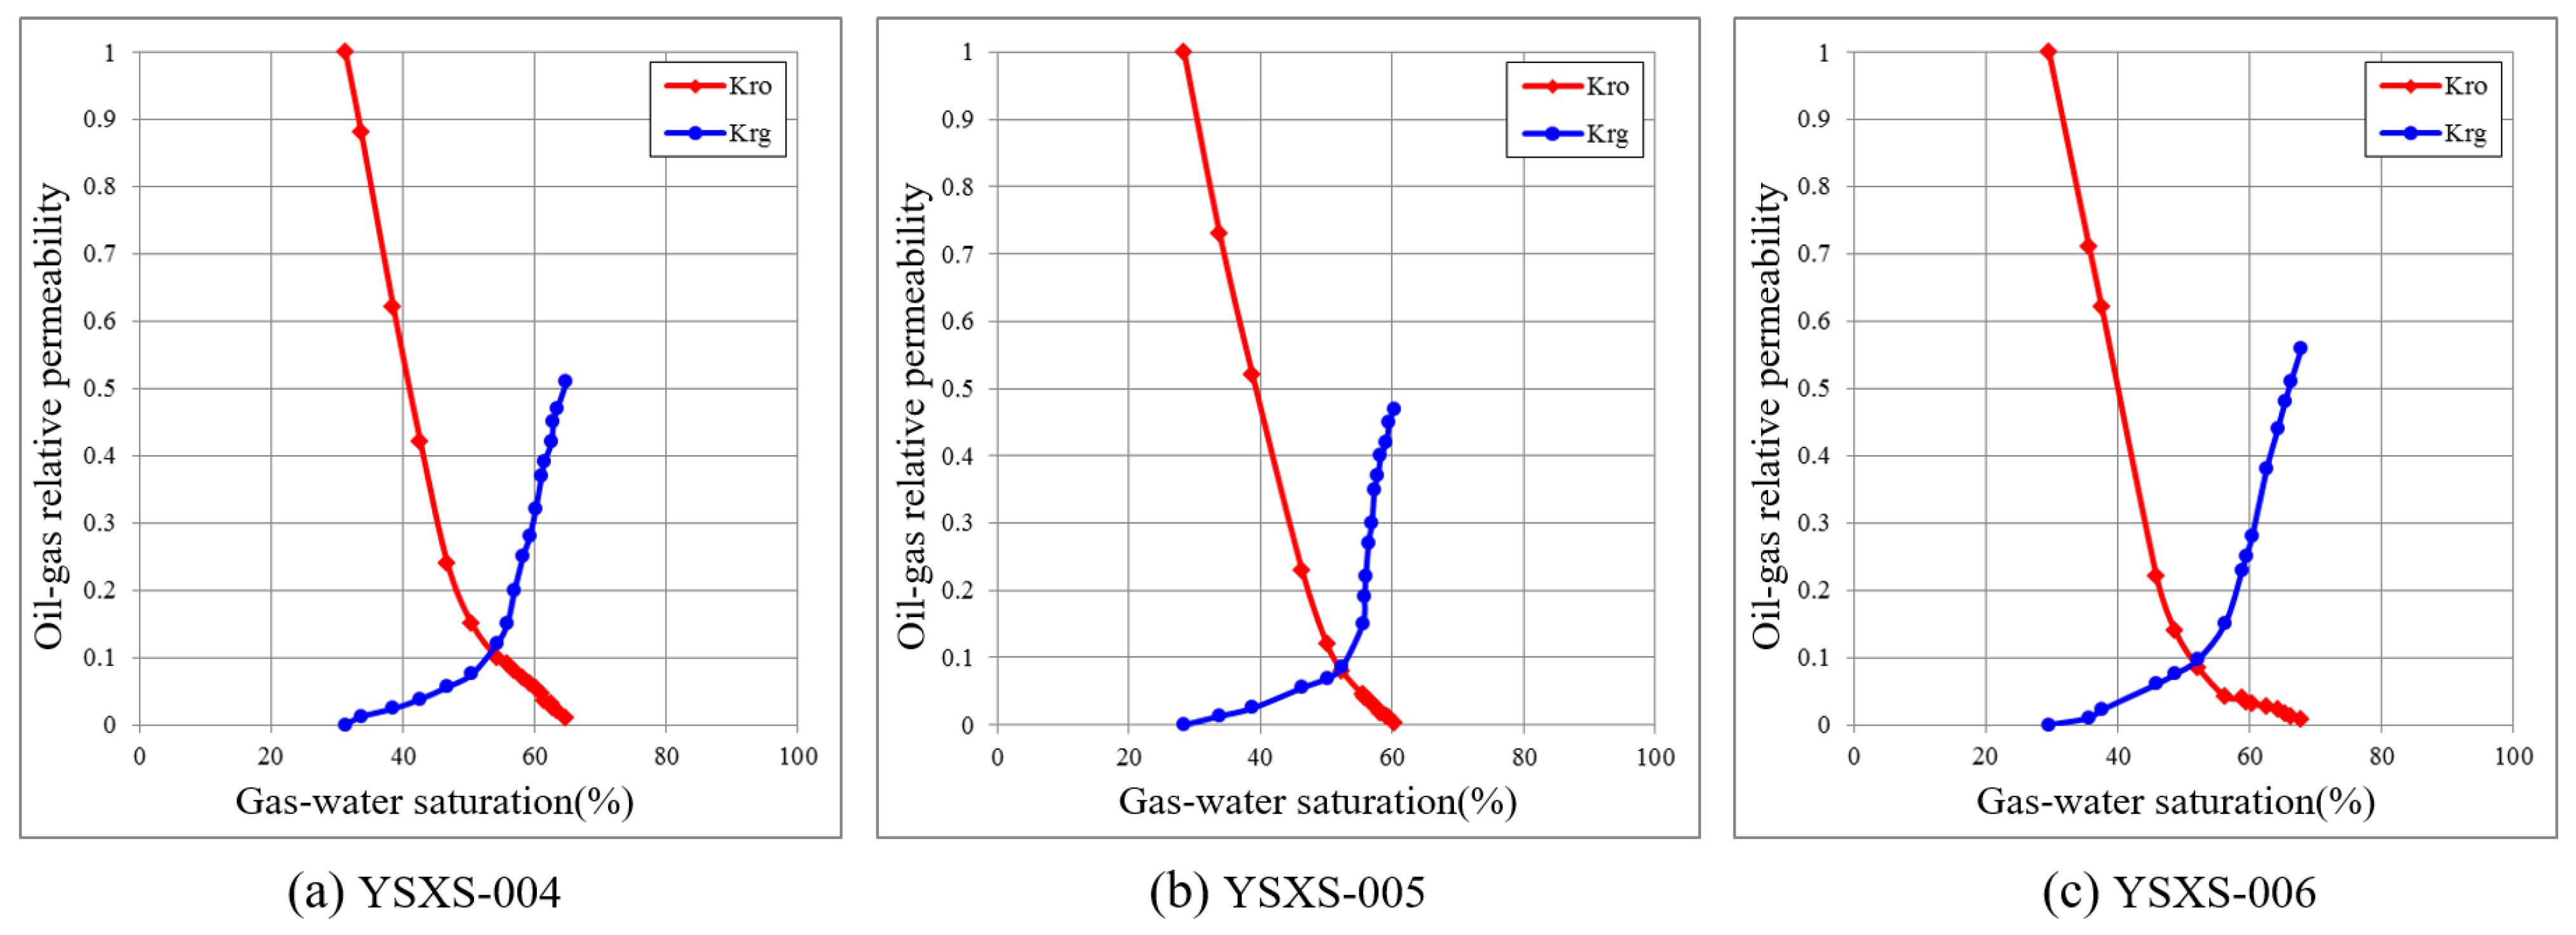
The low-permeability conglomerate reservoir of the Wuerhe Formation in the Mahu oil area has strong water sensitivity [19], and the oil–water permeability of the experimental core will rapidly decrease after it encounters water. The oil–gas two-phase permeability experiment shows that, with an increase in gas saturation in the rock core, the relative permeability of the oil phase decreases, and the final increase in the relative permeability of the gas phase is 0.55, indicating that gas displacement has good oil displacement potential;
(4)
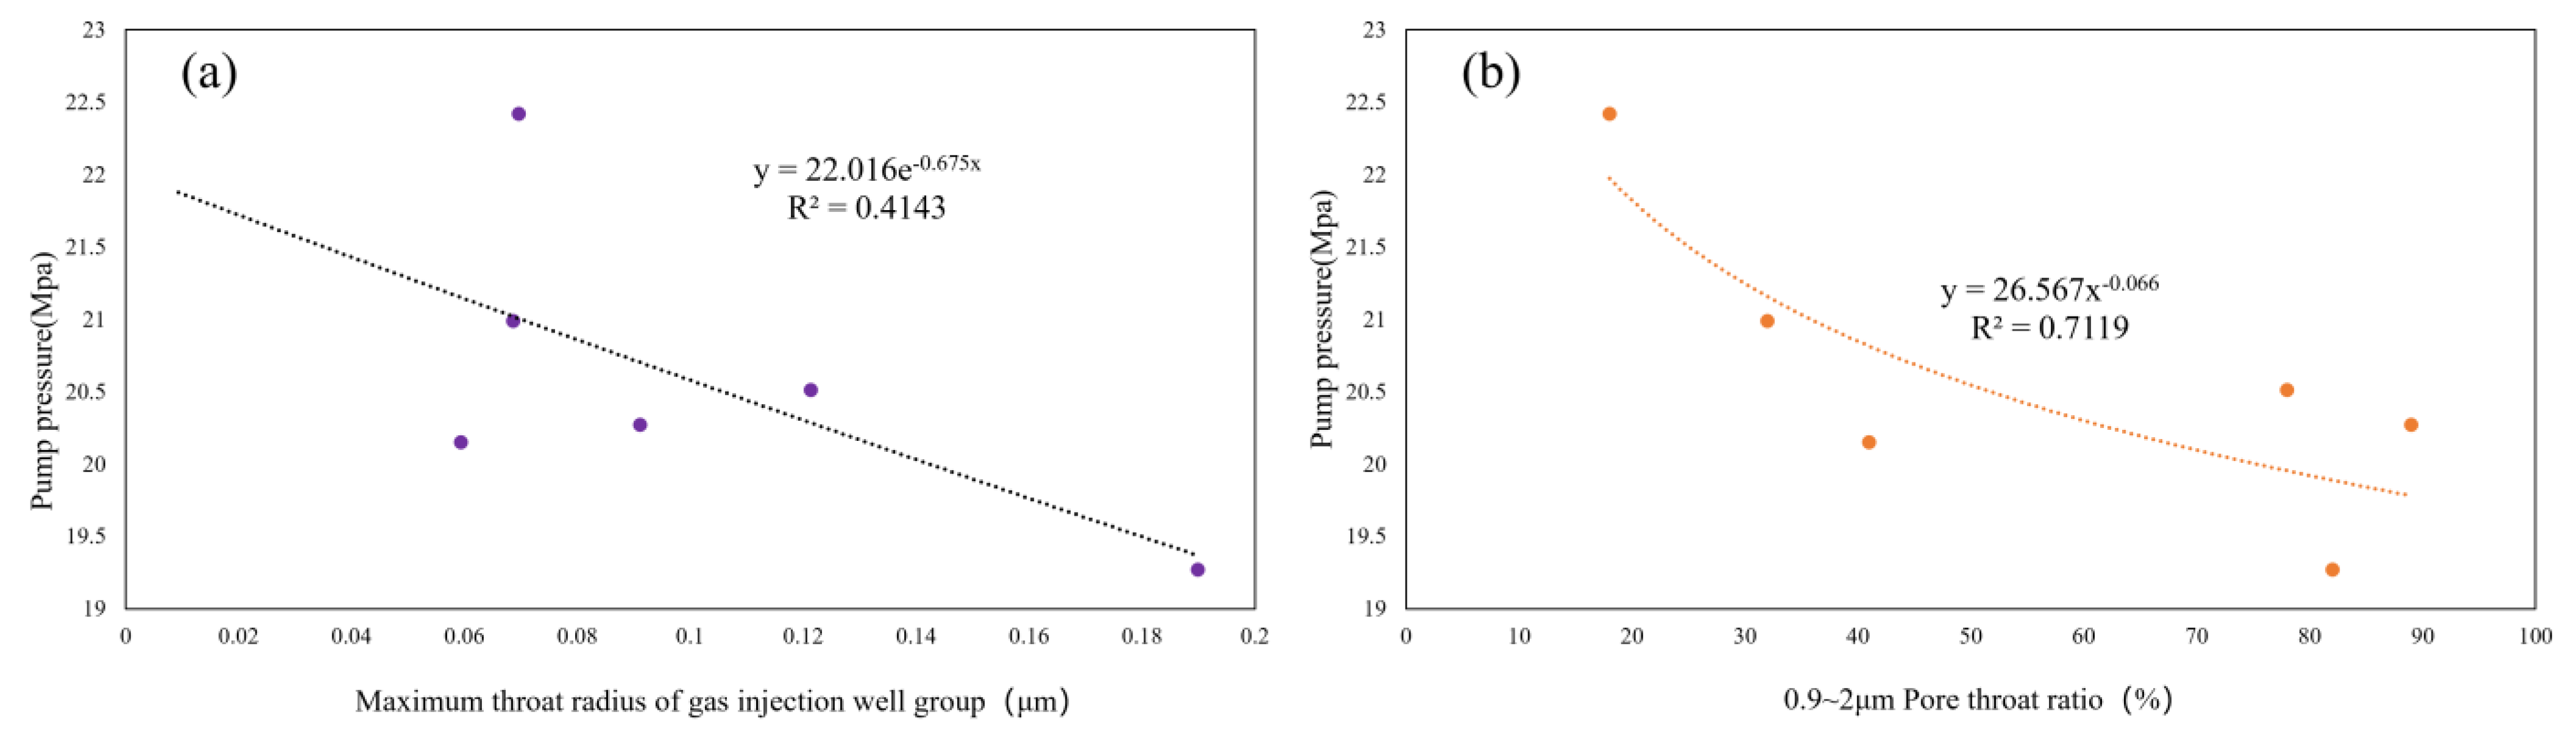
By employing online NMR CO2 displacement experiments in conjunction with a three-dimensional pore-throat model, the oil recovery rate for CO2 displacement in the Wuerhe Formation reservoir was calibrated to currently be at 43.9% based on the microscopic pore-throat utilization patterns observed during the gas displacement experiments. The primary pore-throat range utilized by CO2 displacement spans from 0.3 to 9 μm, encompassing 60.77% of the reservoir’s storage capacity. An ongoing analysis of injection pressures across various well groups indicates a negative correlation of the injection pressure with the average pore-throat radius of the injection well groups, as well as a negative correlation of the injection pressure with the proportion of pore throats falling within the 0.9–2 micrometer range within each injection well group. The microscopic pore-throat characteristics of tight conglomerate reservoirs serve as the fundamental controlling factors influencing the sweep efficiency of CO2 displacement and the associated injection-production parameters [26].

Author Contributions

Conceptualization, L.T. and J.Z. (Jigang Zhang); methodology, L.T. and J.Z. (Jigang Zhang); software, J.Z. (Jing Zhang); validation, J.Z. (Jing Zhang); formal analysis, J.Q. and Y.D.; investigation, J.Q. and Y.D.; resources, L.T.; data curation, Z.D. and P.S.; writing—original draft preparation, L.T.; writing—review and editing, R.J. and F.T.; visualization, C.C. and W.Z.; supervision, J.Q.; project administration, L.T.; funding acquisition, L.T. All authors have read and agreed to the published version of the manuscript.

Funding

This research was funded by the key applied science and technology project of PetroChina Company Limited (grant number 2023ZZ24YJ03).

Data Availability Statement

The data are not publicly available due to the need for further relevant research, but they are available on request from the corresponding author.

Conflicts of Interest

Authors Long Tan, Jigang Zhang, Jing Zhang, Jianhua Qin, Yan Dong, Zhenlong Deng, Ping Song, Chenguang Cui, Wenya Zhai were employed by the PetroChina Xinjiang Oilfield Company. The remaining authors declare that the research was conducted in the ab-sence of any commercial or financial relationships that could be construed as a potential conflict of interest.

References

  1. Qian, M.; Wang, X.; Li, M.; Li, Z.; Leng, J.; Sun, Z. Oil-bearing properties and hydrocarbon occurrence states of Fengcheng formation shale in Well Maye-1, Mahu sag. Xinjiang Pet. Geol. 2022, 43, 693–703. [Google Scholar]
  2. Wu, J.; Yang, S.; Li, Q. Movable pore limits of tight glutenite reservoir in Mahu sag of Junggar basin. Pet. Geol. Oilfield Dev. Daqing 2022, 41, 167–174. [Google Scholar]
  3. Li, G.; Qin, J.; Xian, C.; Fan, X.; Zhang, J.; Ding, Y. Theoretical understandings, key technologies and practices of tight conglomerate oilfield efficient development: A case study of the Mahu oilfield, Junggar Basin, NW China. Pet. Explor. Dev. 2020, 47, 1185–1197. [Google Scholar] [CrossRef]
  4. Tang, Y.; Song, Y.; Guo, X.; Zhao, J.; Wu, T.; Huang, L.; He, W.; Wu, W.; Wu, H. Main controlling factors of tight conglomerate oil enrichment above source kitchen in Ma hu sag, Junggar Basin. Acta Pet. Sin. 2022, 43, 192–206. [Google Scholar]
  5. Zheng, X.; He, C.; Yang, N.; Weng, D.; Cai, B.; Yi, X. Volumetric fracturing 2.0 process for unconventional oil and gas reservoirs and R&D suggestions. Pet. Sci. Techonology Forum 2022, 41, 1–9. [Google Scholar]
  6. Kuang, H.; Zhou, R.; Wang, J.; Liu, H.; Tan, X.; Cai, X.; Xiao, Z. Differences and genesis of upper Wuerhe formation reservoirs in Mahu sag and Shawan Sag. Xin Jiang Pet. Geol. 2023, 44, 18–24. [Google Scholar]
  7. Ye, Y.; Jiang, Q.; Liang, C.; Xiong, Q.; Qiu, Z.; Li, S.; Zhang, H. Experimental study on the mechanism of water-sensitive injury in Upper Urho formation sand and gravels of the Mahu well area. Sci. Technol. Eng. 2022, 22, 11895–11903. [Google Scholar]
  8. Song, P.; Cui, C.; Zhang, J.; Liu, K.; Deng, Z.; Tan, L.; Yu, X. Simultaneous CO2 huff-n-puff test in highly sensitive reservoirs in upper Wuerhe formation, Mahu sag. Xinjiang Pet. Geol. 2024, 45, 355–361. [Google Scholar]
  9. Deng, Z.; Wang, X.; Tan, L.; Zhang, J.; Chen, C.; Song, P. Enhancing oil recovery of tight conglomerate reservoirs by asynchronous CO2 huff and puff in Mahu sag. Xinjiang Pet. Geol. 2022, 43, 200–205. [Google Scholar]
  10. Huang, X.; Jia, X.; Zhou, X.; Zheng, S.; Yan, W.; Yua, Y. Optimization of long core CO2 huff-n-puff experimental parameters in low permeability reservoir, Yanchang Oilfield. XinJiang Pet. Geol. 2015, 36, 313–316. [Google Scholar]
  11. Li, S.; Lei, S.; Chen, Z. Further discussion on reservoir engineering concept and development mode of CO2 flooding-EOR technology. Reserv. Eval. Dev. 2020, 10, 1–14. [Google Scholar]
  12. Wang, G.; Zheng, X.; Zhang, Y.; Lü, W.; Wang, F.; Yin, L. A new screening method of low permeability reservoirs suitable for CO2 flooding. Pet. Explor. Dev. 2015, 42, 358–363. [Google Scholar]
  13. Shi, L.; Zhu, S.; Ma, J.; Yang, M.; Peng, Y.; Ye, Z. Numerical simulation of tight oil extraction with supercritical CO2. Pet. Geol. Recovery Effic. 2019, 9, 25–31. [Google Scholar]
  14. Tan, F.; Ma, C.; Li, X.; Jing, Y. Application and prospect of fluid mobility in oilfield development. J. Southwest Pet. Univ. 2024, 46, 1–20. [Google Scholar]
  15. Qiao, J.; Zeng, J.; Xia, Y.; Cai, J.; Chen, D.; Jiang, S.; Han, G.; Cao, Z.; Feng, X.; Feng, S. A three dimensional visualized physical simulation for natural gas chargingin the micro-nano pore system. Pet. Explor. Dev. 2022, 49, 306–318. [Google Scholar] [CrossRef]
  16. Master, J.A. Deep basin gas trap, western Canada. AAPG Bull. 1979, 63, 152–181. [Google Scholar]
  17. Bai, Z.; Wang, Q.; Song, W. Lower limits of pore throat producing in natural gas drive reservoirs based on nuclear magnetic resonance. Xinjiang Pet. Geol. 2023, 44, 58–63. [Google Scholar]
  18. Lv, L.; Zhang, T.; Li, J.; Sun, J.; Zheng, H.; Wang, G. Influence of reservoir mineral types on CO2 displacement effect of tight reservoir. Pet. Geol. Oilfield Dev. Daqing 2022, 41, 1–10. [Google Scholar]
  19. Shi, L.; Zhang, Y.; Ye, Z. Field test effect analysis of CO2, huff and puff for FOR of horizontal wells in tight glutenite reservoir of Mahu Oilfield. Pet. Reserv. Eval. Dev. 2021, 11, 871–877. [Google Scholar]
  20. Pu, W.; Wang, Y.; Li, L.; Gao, H.; Shan, D.; Wang, W. Feasibility of supercritical CO2 huff-puff development of tight conglomerate reservoirs. Xinjiang Pet. Geol. 2021, 42, 456–461. [Google Scholar]
  21. Kirizov, H.X.; Murzakaev, V.M. Application of complex nuclear magnetic resonance measurements to supervicious oil deposits in Russian republic of Tatarstan. Well Logging Technol. 2017, 41, 506–511. [Google Scholar]
  22. Zhao, W. Estimation of average pore throat radius by NMR log data. Pet. Geol. Recovery Effic. 2009, 16, 43–45. [Google Scholar]
  23. Qin, J.; Li, Y.; Du, G.; Zhou, Y.; Deng, Y.; Peng, S.; Xiao, D. NMR logging based productivity analysis and sweet spot evaluation for shale oil. Xin Jiang Pet. Geol. 2024, 45, 317–326. [Google Scholar]
  24. Cong, Y.; Fan, Y.; Deng, S.; Ye, Q.; Chen, F. The research on pore structure in tight sand reservoir based on the three-component decomposition Theory of the NMR T2 Spectrum. Well Logging Technol. 2013, 37, 600–604. [Google Scholar]
  25. Li, T.; Zheng, W.; Geng, Z.; Lee, J.-F.; Wu, T. Formation mechanism and flow limits of residual oil based on microscopic pore throat structure. Sci. Technol. Eng. 2023, 23, 12892–12899. [Google Scholar]
  26. Song, X.; Liu, Y.; Yang, X. Numerical simulation of CO2 miscible displacement at pore scale. Pet. Geol. Recovery Effic. 2024, 31, 1–13. [Google Scholar]
Figure 1. Geological conceptual model of controlled migration by dominant channels in the Mahu oil region.
Energies 18 00990 g001
Figure 2. Two−dimensional nuclear magnetic T1−T2 spectra identification of reservoir fluid properties. (a) Good oil content; (b) moderate oil content; (c) poor oil content; (d) no oil content.
Energies 18 00990 g002
Figure 3. Mobile full-diameter core two-dimensional nuclear magnetic scanning result map.
Energies 18 00990 g003
Figure 4. Intersection diagram of T2gm and mercury injection pore-throat radius.
Energies 18 00990 g004
Figure 5. Calculation results of T2gm and mercury intrusion pore-throat radius.
Energies 18 00990 g005
Figure 6. Fitting curve between nuclear magnetic movable porosity pore throat and average pore-throat radius.
Energies 18 00990 g006
Figure 7. Three-dimensional model of average pore-throat radius in the experimental area.
Energies 18 00990 g007
Figure 8. Comparison of oil–water two-phase flow curves in different well areas of Baikouquan Formation.
Energies 18 00990 g008
Figure 9. Comparison of oil–gas two-phase flow curves in different well areas of Baikouquan Formation.
Energies 18 00990 g009
Figure 10. Schematic diagram of CO2 continuous injection experimental equipment.
Energies 18 00990 g010
Figure 11. T2 spectrum of CO2 continuous displacement core experiment.
Energies 18 00990 g011
Figure 12. Distribution map of 0.9~2 μm pore throats in CO2 injection test area.
Energies 18 00990 g012
Figure 13. Curve of factors affecting gas injection pressure in CO2 injection test area. (a) Relationship curve between pump pressure and maximum throat radius of gas injection well group; (b) Relationship curve between pump pressure and 0.9~2μm Pore throat ratio.
Energies 18 00990 g013
Table 1. Geological conceptual model of controlled migration by dominant channels in the Mahu oil region.
Depth/mHorizonCharacteristic Parameters of Porosity and PermeabilityStructural Parameters of Porosity and PermeabilityMercury Pressure Capillary Force Curve and Pore Throat Distribution HistogramCast Thin Sheet
3419.39P3w22−1Porosity (%): 8.5
Penetration rate (10−3 μm2): 0.945
Displacement/median pressure (MPa): 0.18/14.67
Median radius (μm): 0.05
Maximum pore-throat radius (μm): 4.06
Visual pore-throat volume ratio: 3.89
Average capillary radius (μm): 0.87
Homogeneity coefficient: 0.11
Unsaturated pore volume percentage (%):47.15
Pore type and relative content (%):
gravel hole: 50;
intergranular dissolved pores: 40;
dissolved pores in gravel: 10
Average pore diameter (μm): 8.0
Energies 18 00990 i001Energies 18 00990 i002
3432.87P3w22−2Porosity (%):7.3
Penetration rate (10−3 μm2): 0.346
Visual pore-throat volume ratio: 2.27
Unsaturated pore volume percentage (%): 68.27
Pore type and relative content(%):
dissolved pores in gravel: 50;
construction seam: 50
Average pore diameter (μm): 21.5
Average crack width (μm): 2.1
Crack surface density (strips/mm2): 0.2
Crack rate (%): 0.041
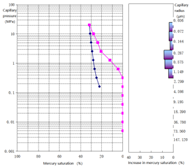
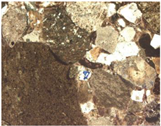
Energies 18 00990 i003Energies 18 00990 i004
3448.28P3w22−3Porosity (%): 10.8
Penetration rate (10−3 μm2): 0.432
Displacement pressure (MPa): 0.34
Maximum pore-throat radius (μm): 2.15
Visual pore-throat volume ratio: 2.78
Average capillary radius (μm): 0.53
Homogeneity coefficient: 0.12
Unsaturated pore volume percentage (%): 61.33
Pore type and relative content (%):
gravel hole: 93;
intergranular dissolved pores: 5;
dissolved pores in gravel: 2
Average pore diameter (μm): 175.6
Average throat width (μm): 5.2
Average pore-throat ratio: 9.1
Average coordination number: 0.14
Energies 18 00990 i005Energies 18 00990 i006
3454.4P3w22−4Porosity (%): 10.5
Penetration rate (10−3 μm2): 0.469
Visual pore-throat volume ratio: 1.99
Unsaturated pore volume percentage (%): 65.26
Pore type and relative content (%):
gravel hole: 92;
intergranular dissolved pores: 5;
dissolved pores in gravel: 3
Average pore diameter (μm): 135.1
Average throat width (μm): 11.5
Average pore-throat ratio: 6.6
Average coordination number: 0.11
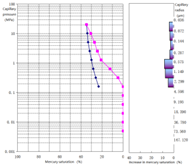
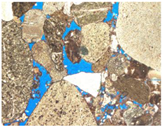
Energies 18 00990 i007Energies 18 00990 i008
Table 2. The degree of utilization of porous crude oil by continuous CO2 displacement.
T2 Cutoff Value (ms)Pore-Throat Radius (μm)Proportion of Reserves (%)Inject the Extraction Degree Under Different PV Conditions
0~0.250.25~0.50.5~0.750.75~1
0.1~0.30.01–0.0320.938.317.731.738.2
0.3~90.03–0.960.7711.222.342.548.9
9~20.9–218.30.35.319.934.1
total//8.618.236.143.9
Disclaimer/Publisher’s Note: The statements, opinions and data contained in all publications are solely those of the individual author(s) and contributor(s) and not of MDPI and/or the editor(s). MDPI and/or the editor(s) disclaim responsibility for any injury to people or property resulting from any ideas, methods, instructions or products referred to in the content.

