Article

A Retrospective Assessment of Türkiye’s Recent Energy Policy in Terms of Energy Security and Climate Change Mitigation

by
Hasan Hüseyin Miraç Gül
1,2,*,
Hakan Ercan
3,
Bülent Akınoğlu
4,* and
Şenay Açıkgöz
5
1
Sigun Ekolojik Danışmanlık Ltd. Şti., Ankara 06815, Türkiye
2
Earth System Science, Middle East Technical University, Ankara 06800, Türkiye
3
Department of Economics, Middle East Technical University, Ankara 06800, Türkiye
4
Department of Physics, Middle East Technical University, Ankara 06800, Türkiye
5
Department of Econometrics, Ankara Hacı Bayram Veli University, Ankara 06570, Türkiye
*
Authors to whom correspondence should be addressed.
Energies 2025, 18(4), 951; https://doi.org/10.3390/en18040951
Submission received: 10 January 2025 / Revised: 2 February 2025 / Accepted: 8 February 2025 / Published: 17 February 2025
(This article belongs to the Section B1: Energy and Climate Change)

Abstract

:
Countries prioritize secure and cheap energy over clean energy in their energy policies, and Türkiye is no different. The Strategy Plan 2015–2019 of the Ministry of Energy and Natural Resources emphasizes the exploitation of domestic coal for energy security, while Türkiye intends to curb its emissions by 41% by 2030. These two targets contradict in terms of climate change mitigation. In retrospect, this study aims to determine the role of coal, wind, and solar power in energy policy-making through scenario analyses. The results indicate that if Türkiye continued its pre-2020 energy policy, its use of domestic coal would be important for energy security. On the other hand, both wind and solar have the capacity to contribute to the country’s efforts towards energy security and climate change mitigation.

1. Introduction

At the crossroads of the Balkans, the Caucasus, the Middle East, and the eastern Mediterranean, Türkiye, with its unique geographic position, is both a bridge and a barrier between Asia and Europe [1]. Having a population of 85.8 million with a USD 11,938.8 per capita GDP as per 2023, Türkiye is an upper-middle-class country with specific economic vulnerabilities [2]. Global environmental uncertainties in connection with climate change and Türkiye’s highly import-dependent energy system exacerbate these risks for the wealth of the country.
Inefficient and below-global-average per capita electricity consumption, high demand increase, and foreign dependency with limited suppliers define Türkiye’s energy profile [3]. Challenges that Türkiye is facing to securing energy include the large share represented by imported fuel in its economy, risks related to suppliers, high energy consumption, and the need for investments in the energy sector. The country’s fossil reserves can only meet a small amount of demand. Türkiye imports 92% of its required oil and 99% of its natural gas [4], which means the country depends on foreign sources and suppliers. Russia (19% of oil, 53% of gas) and Iran (18% of oil, 17% of gas) [4] are the two biggest suppliers to Türkiye, and this heavy dependence on such politically, socially, and economically unstable countries creates vulnerabilities for Türkiye [4,5].
Based on the Development Plans, Türkiye has followed three major approaches to energy security in the past 60 years. The first four Development Plans describe energy security as “access to appropriate and accessible energy resources at low cost”. The focus during this period was engineering solutions and infrastructure development with the intention of increasing energy efficiency and sustaining economic activity. The second energy security approach is based on Türkiye’s geostrategic position. The last four reports are concerned with energy security concerning international politics and energy markets. The final approach to energy security is shaped by environmental concerns. Specifically, since the 1992 United Nations Conference on Environment and Development, i.e., the Rio Conference or Earth Summit, sustainability has been consistently emphasized [5].
Nevertheless, local, regional, and global events change priorities. The 1973 oil crisis diverted attention towards the importance of domestic reserves. Türkiye accepted this stance, and coal became important for the country because it was used in electricity generation, steel, and cement industries. However, in the 1990s, Türkiye gave up reliance on domestic reserves and started importing energy sources. Thus, the share of imported fuel increased, and the country has since become energy dependent [6].
As a response to the aforementioned import dependence and global climate talks, Türkiye released its Supply Security Strategy in 2009. In particular, coal is prioritized, with the commitment being to exploit all reserves that were known by 2023. Besides this, renewables are emphasized, with the target being to reach a minimum 30% share with 20 GW wind in 2023. Finally, the strategy intends to lower dependence on natural gas for electricity generation below 30% [7]. Similarly, the Strategy Plan 2015–2019 of the Ministry of Energy and Natural Resources (MENR) focuses on energy supply security, and includes production and import, enhancing storage and distribution infrastructure, and demand management as fundamental elements of the concept. The Strategy Plan emphasizes the role of domestic sources in supply security and commits to increasing the contribution of domestic coal to electricity generation to 60 TWh by 2020. Along with coal, the utilization of wind and solar power is also emphasized [8]. Türkiye has adopted an energy policy similar to that from the pre-1990 period, but with the prime difference that environmental stresses are on the agenda. Despite the high fossil fuel dependence, Türkiye intends to reduce its greenhouse gas (GHG) emissions by 41% through 2030 in its updated Nationally Determined Contribution (NDC) (Türkiye’s INDC: https://unfccc.int/sites/default/files/NDC/2023-04/TÜRKİYE_UPDATED%201st%20NDC_EN.pdf, accessed on 15 April 2023). Moreover, National Renewable Energy Action Plans, prepared in response to the (2009/28/EC) European Commission Directive, accelerated the deployment of wind and solar power [9].
All forms of energy use create environmental problems. In today’s world, the most challenging problem is climate change. The Fifth Assessment Report (AR5) Synthesis Report of the Intergovernmental Panel for Climate Change (IPCC) indicates that atmospheric CO2 emissions between 1750 and 2011 were 2040 ± 340 GtCO2, and about 40% of these, 880 ± 35 GtCO2, remained in the atmosphere. The contribution of fossil fuel combustion and industrial processes to CO2 emission increases was 78% in this period, and the increasing use of coal has changed the long-term trend of the reduced carbon intensity of the energy supply. Since 1970, CO2 emissions from these sectors have tripled. In the ten years after 2000, the increase in GHG emissions was about 10 GtCO2-eq, and 47% of this rise was related to the energy sector. In 2010, the energy sector was alone responsible for 35% of GHG emissions. Electricity and heat production alone was responsible for 25% of 49 GtCO2-eq in 2010 [10].
Other than GHG emissions, traditional fossil-fueled power generation is associated with substantial environmental degradation, such as air pollution, water pollution, land degradation, and habitat loss. Fossil fuel combustion releases harmful gases that impact air quality and public health [11,12,13]. Additionally, the extraction and transportation of fossil fuels may lead to habitat loss [12,13], as well as degradations in soil and water quality. In contrast, renewable energy sources, such as wind and solar, generally have a lower environmental impact. For instance, wind and solar energy generation produce minimal emissions during operation, and have a significantly reduced carbon footprint compared to fossil fuels [14]. However, the production and installation of renewable energy technologies can still have environmental consequences, such as land use changes, habitat disruption, and resource extraction for materials. For example, large-scale solar farms may require significant land areas, which can lead to habitat losses for local wildlife [14,15]. Wind energy, for instance, can affect local bird and bat populations due to turbine collisions [12,13].
Türkiye’s emission profile is presented in Figure 1. As shown, Türkiye’s total carbon emission shows an increasing trend with GDP increases. However, Türkiye’s population does not exhibit a sharp increase as carbon and GDP increase. According to the data from the World Development Indicators Database (WDI), Türkiye’s total carbon dioxide emissions were 27,388.82 kt in 1965, and reached 345,981.45 kt in 2014. In almost 50 years, the country’s emissions increased more than 10 times, GDP less than 10 times, and population 2.5 times.
Energy security is a recently emerging concept in the Turkish literature. Energy security analyses for Türkiye have been undertaken by [16,17,18,19,20,21], which employed index analyses or models to quantify energy security. All these studies referred to Türkiye’s historical energy security index and indicated the vulnerability of the country, but did not analyze the future. The following studies used econometric methods to analyze the issue. Refs. [22,23,24,25,26] investigated the determinants of supply security for Türkiye and emphasized the country’s import dependence.
The relationship between carbon dioxide emissions and the Turkish electricity sector is a relatively hot topic, and is analyzed by [27,28,29,30,31,32,33,34,35,36,37,38]. These studies use economic or econometric models, and show that the fossil reliance of the country challenges it ability to meet mitigation targets, while also discussing renewables’ potential role in emission reduction.
In light of the above discussion, the main objective of this study is to assess whether domestic coal utilization is a viable solution in the long term for addressing the energy security of Türkiye in the context of climate change discussions. This study also questions the role of solar and wind power in Türkiye’s energy policy. It is based on scenario analyses that prioritize these domestic energy sources. The main contribution of this study to the literature is that it combines two seemingly unrelated research topics, energy security and climate change mitigation, and analyzes their interdependence, which is not evaluated in the referenced literature. Thus, the aim is to contribute to the evaluation of opportunities for the Turkish power sector to address climate mitigation, as emphasized by [39]. After portraying the pre-COVID-19 world, and Türkiye in particular, the study provides a basis for comparing the outcomes of energy policies before and after COVID-19 and the Russia–Ukraine war. In other words, the study stops time in 2019, and forecasts a future following the prevailing conditions of that time.

2. Materials and Methods

2.1. Methodology

This study uses three panel equations (PE), constructed by [40], and conducts scenario analyses based on these equations. A panel of data is formed by the combination of cross-sectional units, e.g., people, households, firms and countries, who are observed over time. In other words, panel data are obtained by “pooling time-series of cross-sections” [41,42]. To form the panel data set, socioeconomic and energy-related data from 47 countries were gathered from the WDI Database, the BP Statistical Review of World Database, and the Data Explorer of International Energy Agency (IEA) [40].
The panel equations forming the basis of the analyses are given below.
P E 1 : l n C O 2 = 2.42 + 0.21 l n C T P + 0.03 l n G T P 0.005 l n S P 0.015 l n W P + 0.439 l n I N D U S T R Y + 0.042 l n G D P + 0.64 l n P O P
P E 2 : l n E I = 5.82 + 0.32 l n C T P + 0.09 l n G T P 0.022 l n W P 0.698 l n E N E R G Y I N T E N S I T Y + 0.578 l n G D P 2.81 l n P O P
P E 3 : l n E I = 0.16 l n C T P + 0.12 l n G T P 0.016 l n S P + 0.684 l n G D P 2.057 l n P O P
Equation PE1 is used to forecast the carbon emissions of Türkiye. This equation explains the impacts of the independent variables (on the left) on carbon emissions, lnCO2. Equations PE2 and PE3 are used to forecast the energy imports, lnEI, of Türkiye. Due to the collinearity between lnWP and lnSP [40], the impacts of wind power and solar power on net energy imports are separately estimated by PE2 and PE3, respectively.
There are three business-as-usual (BAU) cases, which differ in terms of GDP increase, and four energy mix scenarios. Each scenario is repeated using two different population estimations: Turkish Statistics Institution (TUIK) and Organization for Economic Cooperation and Development (OECD).
For the forecast, Microsoft Excel TREND function (Microsoft 365 (Office)) is used to extend the data from 2017 to 2050.

2.2. Data and Forecast

The details of the data set used in the estimation of the panel equations given in the previous section are provided by [40]. The WDI Database, the BP Statistical Review of World Database, and the Data Explorer of the International Energy Agency (IEA) are used to obtain data for Türkiye. The descriptions of the variables used in this study are listed in Table 1, and Table 2 gives descriptive statistics. Except for population and GDP, the data set covering the 1990–2017 period is used for the forecast up to 2050. Population estimations are gathered from the TUIK and OECD forecasts for 2050. Future GDP is calculated with 4%, 4.5%, and 5% annual increase estimations based on the 2017 real value. The data set and forecast analysis as a Microsoft Excel file is available by the link provided by Supplementary Materials heading of this text.
Although the panel equations given in Section 2.1 can all be used to determine the variables, each has its own function. CO2 and EI are the dependent variables. CO2 is included because it is the prime concern in climate change, as it is a by-product of energy generation. EI is accepted as a proxy of energy security, meaning that the larger the net energy imports of Türkiye, the greater its dependence on energy imports. In spite of its associated air pollution and carbon emissions, coal will be used in electricity generation in the coming decades because it already has a place in the energy mix and is able to generate constant power, and Türkiye still has large coal reserves, which the MENR aims to exploit. Therefore, CTP is included in the analyses. Noting that natural gas is imported by Türkiye, GTP is taken due for the same reasons that CTP is taken. SP and WP are included because they are the prime independent variables of this study, along with CTP, since these technologies offer hope for climate change mitigation. Moreover, their role in energy security is of interest. Sectoral energy consumption data are included since different sectors substantially contribute to climate change, play critical roles in energy security, and are affected by development. Energy intensity is a measure of energy efficiency, the “fifth fuel”, and an indicator of a nation’s commitment to climate change mitigation.
Scenarios are run for Türkiye based on the three equations, PE1, PE2, and PE3, given before. Figure 2, Figure 3 and Figure 4 show the trend equations used to forecast lnCTP, lnGTP, lnSP, lnWP, lnINDUSTRY, lnRESIDENTIAL, and lnENERGYINTENSITY.
Figure 2 shows the pattern of independent variables, lnCTP, lnGTP, and lnINDUSTRY, over the period of 1990–2017. As seen, all variables increase smoothly in this period. The assumption is that this behavior continues for the forecast period until 2050.
Figure 3 and Figure 4 show the behaviors of lnSP and lnWP. Both variables show a sharp rise during their sampling periods. As for the other independent variables, lnSP and lnWP are assumed to follow these trends from 2019 till 2050.

3. Scenario Results and Discussion

As indicated before, there are three BAU scenarios determined by different degrees of GDP growth. There are four energy mix scenarios that are concerned with the maximum utilization of coal, solar, and wind. The Table 3 below is a summary of scenarios detailed by the preceding sections.

3.1. Business-As-Usual (BAU)

The BAU scenarios are run with the forecasted data described above for three GDP increase alternatives, 4%, 4.5%, and 5%. Future carbon emissions and energy import data are calculated by use of the equations given in Section 2.1.
As the TUIK and OECD population forecasts are almost equal, there is no significant difference between the two figures. Also, different GDP increases do not result in significant distinctions. With a 4% GDP rise and TUIK population forecast, lnCO22018 is 6.367 and lnCO22050 is 7.305. With a 5% GDP rise and TUIK population forecast, lnCO22018 is 6.368 and lnCO22050 is 7.330. Therefore, for brevity, further results are shared only via the TUIK data.
lnEI with wind power in the energy mix is calculated by PE2. With a 4% GDP rise and TUIK population forecast, lnEI2018 is 2.191, and lnEI2050 is 3.512. With 5% GDP rise and TUIK population forecast, lnEI2018 is 2.194, and lnCO22050 is 3.622.
lnEI with solar power in the energy mix is calculated by PE3. With 4% GDP rise and TUIK population forecast, lnEI2018 is 1.745, and lnEI2050 is 1.673. With 5% GDP rise and TUIK population forecast, lnEI2018 is 1.754, and lnEI2050 is 1.961.
As expected, both carbon emissions and energy imports, i.e., energy dependency, increase under BAU scenarios.

3.2. 60 TWh Domestic Coal-Based Generation

This scenario is actually a target designated in the 2015–2019 Strategic Plan [8], which aims for 60 TWh electricity generation from domestic coal by the end of 2019. The purpose here is to assess whether the target is attained and to evaluate its impact on emissions and energy security in 2018 and 2019. Unlike BAU scenarios, real data are used, except for in the lnINDUSTRY, lnENERGYINTENSITY, and lnPOP variables. Electricity generation data are obtained from the TEİAŞ electricity statistics webpage (TEİAŞ, 2020, Elektrik İstatistikleri Türkiye Elektrik Üretim–İletim İstatistikleri, https://www.teias.gov.tr/tr-TR/turkiye-elektrik-uretim-iletim-istatistikleri, last access on 27 May 2021), and GDP is taken from the World Bank database (The World Bank Group, 2021, GDP (current USD)–Türkiye, https://data.worldbank.org/indicator/NY.GDP.MKTP.CD?locations=TR, last access on 27 May 2021). The 2018 and 2019 carbon emissions and energy import data are calculated by use of the equations given in Section 2.1.
The electricity generation information from TEİAŞ does not provide distinct data for all domestic coal types. Therefore, from the installed capacities given by TEİAŞ, electricity generation from domestic coal is estimated. The calculation results are tabulated in Table 4, revealing that 60 TWh by the end of 2019 was not attained.
Besides this, based on the real values and TUIK population forecast, lnCO22018 is 6.390 and lnCO22019 is 6.395. lnEI2018 is 2.181, and lnEI2019 is 2.145 with wind power. With solar power in the energy mix, lnEI2018 is 1.661 and lnEI2019 is 1.604.
Compared with BAU, the lnCO2 results are slightly higher and the lnEI results are slightly lower. The difference in lnEI is higher for the equation using lnWP.

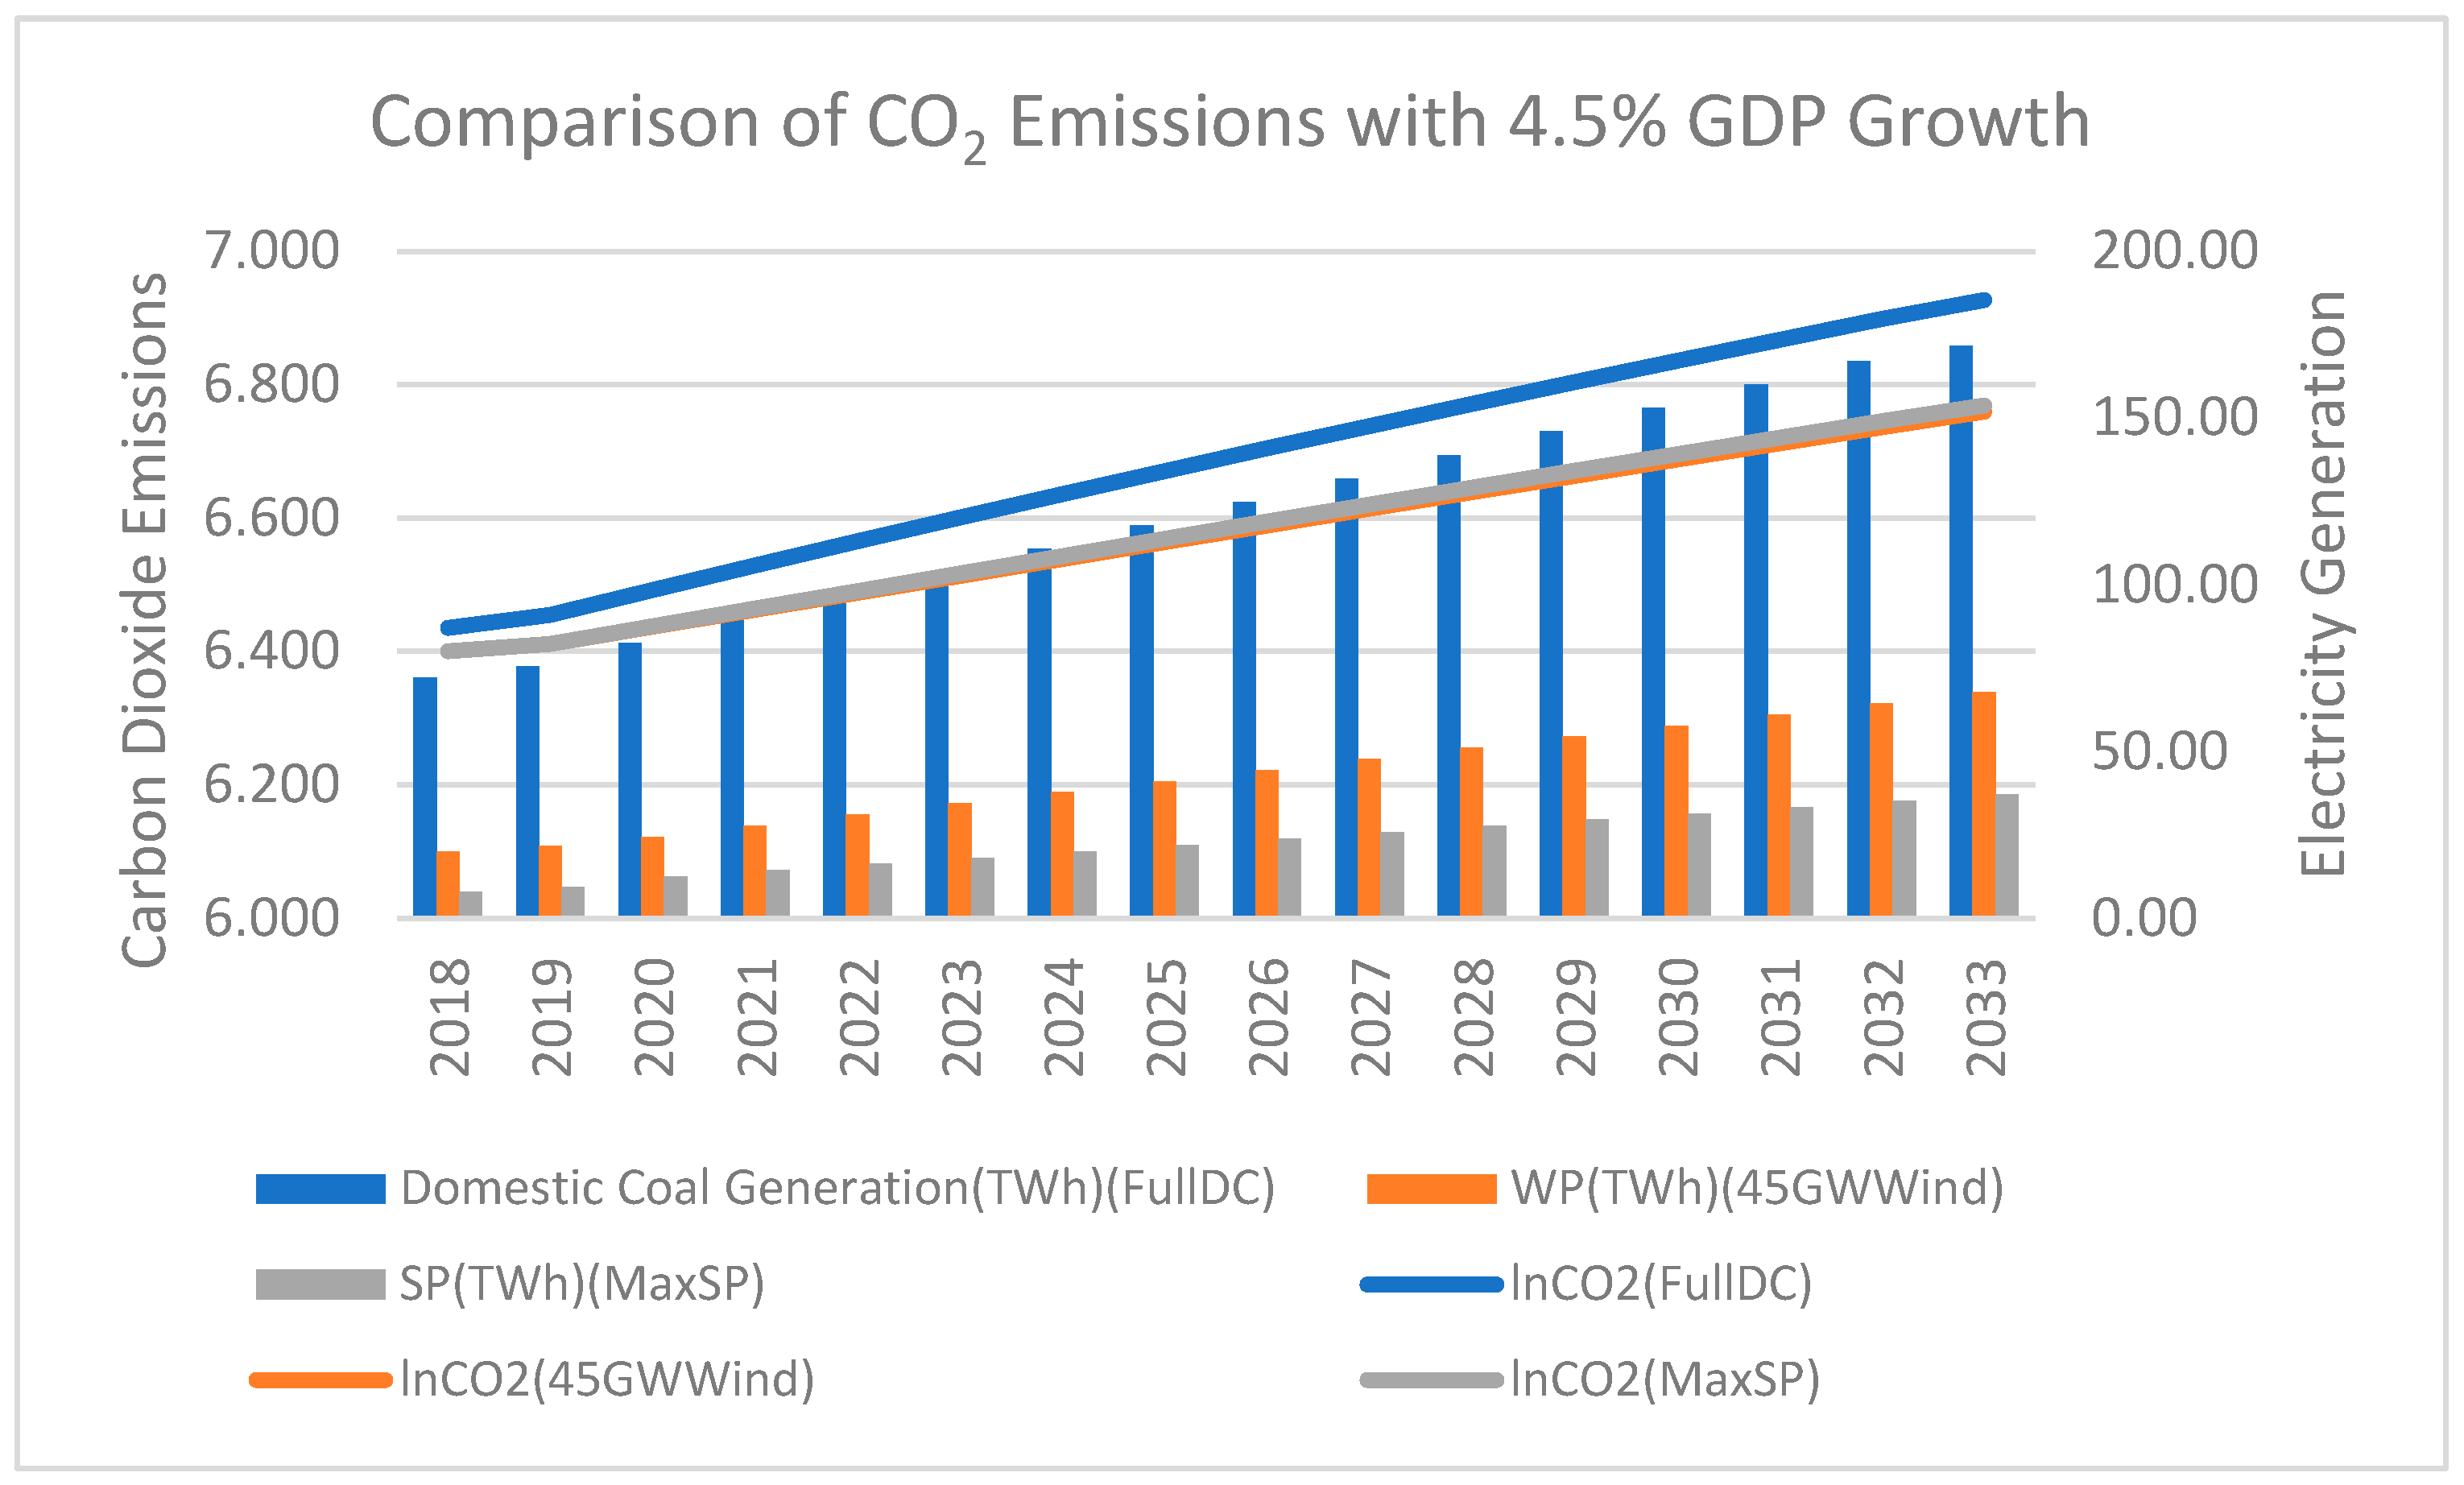
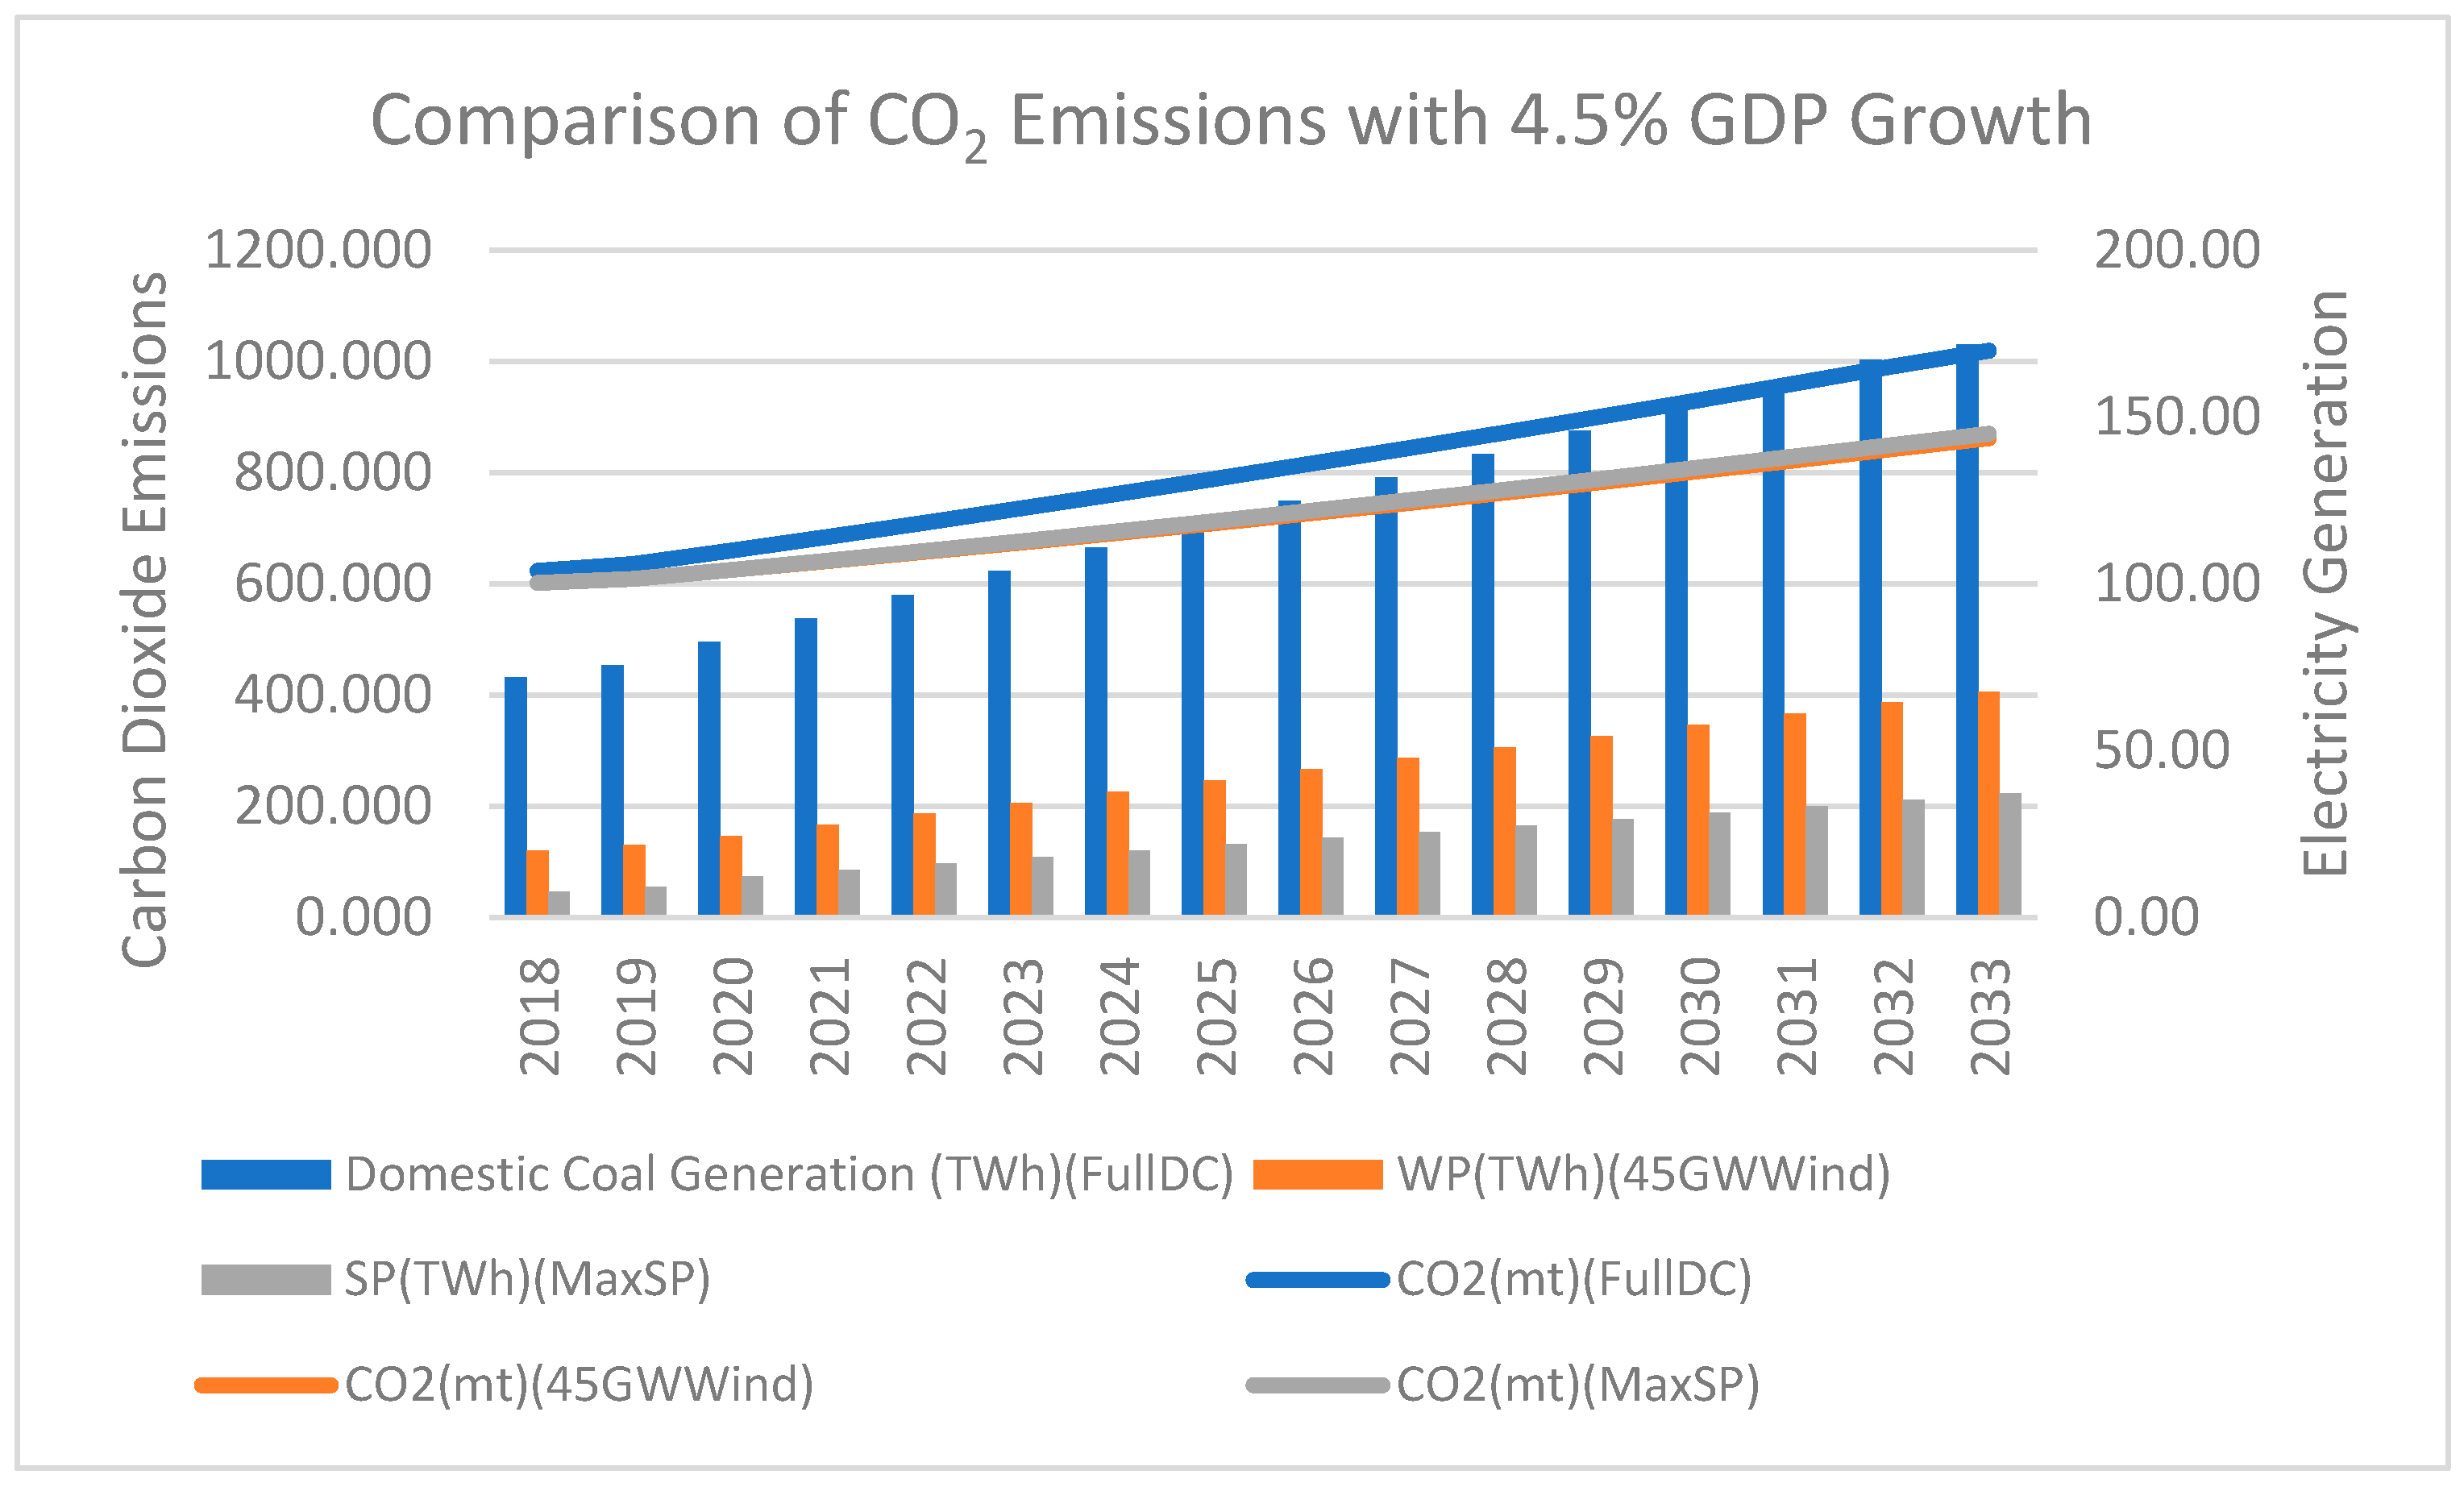
3.3. Full Domestic Coal (FullDC)

This scenario assumes the utilization of all potential domestic coal in electricity generation, which is calculated to yield an additional 13,670 MW by [35]. The scenario is run considering a 1000 MW increase in annual installed domestic coal capacity until 2033, while keeping all other electricity generation variables constant at the real 2019 values. The capacity factor is also taken as remaining constant from 2019 (see Table 4).
Different degrees of GDP increase do not result in significant distinctions. With a 4% rise in GDP and TUIK population forecasted, lnCO22018 is 6.435 and lnCO22033 is 6.920. With 5% rise in GDP and TUIK population forecasted, lnCO22018 is 6.436 and lnCO22033 is 6.933.
Energy security with wind power in the energy mix is calculated by PE2. Different GDP increases do not result in significant distinctions. With a 4% rise in GDP and TUIK population forecasted, lnEI2018 is 2.274 and lnEI2033 is 2.756. With a 5% rise in GDP and TUIK population forecasted, lnEI2018 is 2.277 and lnEI2033 is 2.809.
Energy security with solar power in the energy mix is calculated by PE3. Different GDP increases do not result in significant distinctions. With a 4% rise in GDP and TUIK population forecasted, lnEI2018 is 1.818 and lnEI2033 is 2.066. With a 5% rise in GDP and TUIK population forecasted, lnEI2018 is 1.827 and lnEI2033 is 2.206.
Compared with the results for BAU, all the outcomes of this scenario are higher. The calculation is performed as in the 60TWhDC scenario, and it is found that including domestic coal in electricity generation reduces the total energy imports by 91.25% in 2033. However, CO2 emissions increase almost 7-fold in comparison to the 1990 value (136.442 million tonnes).

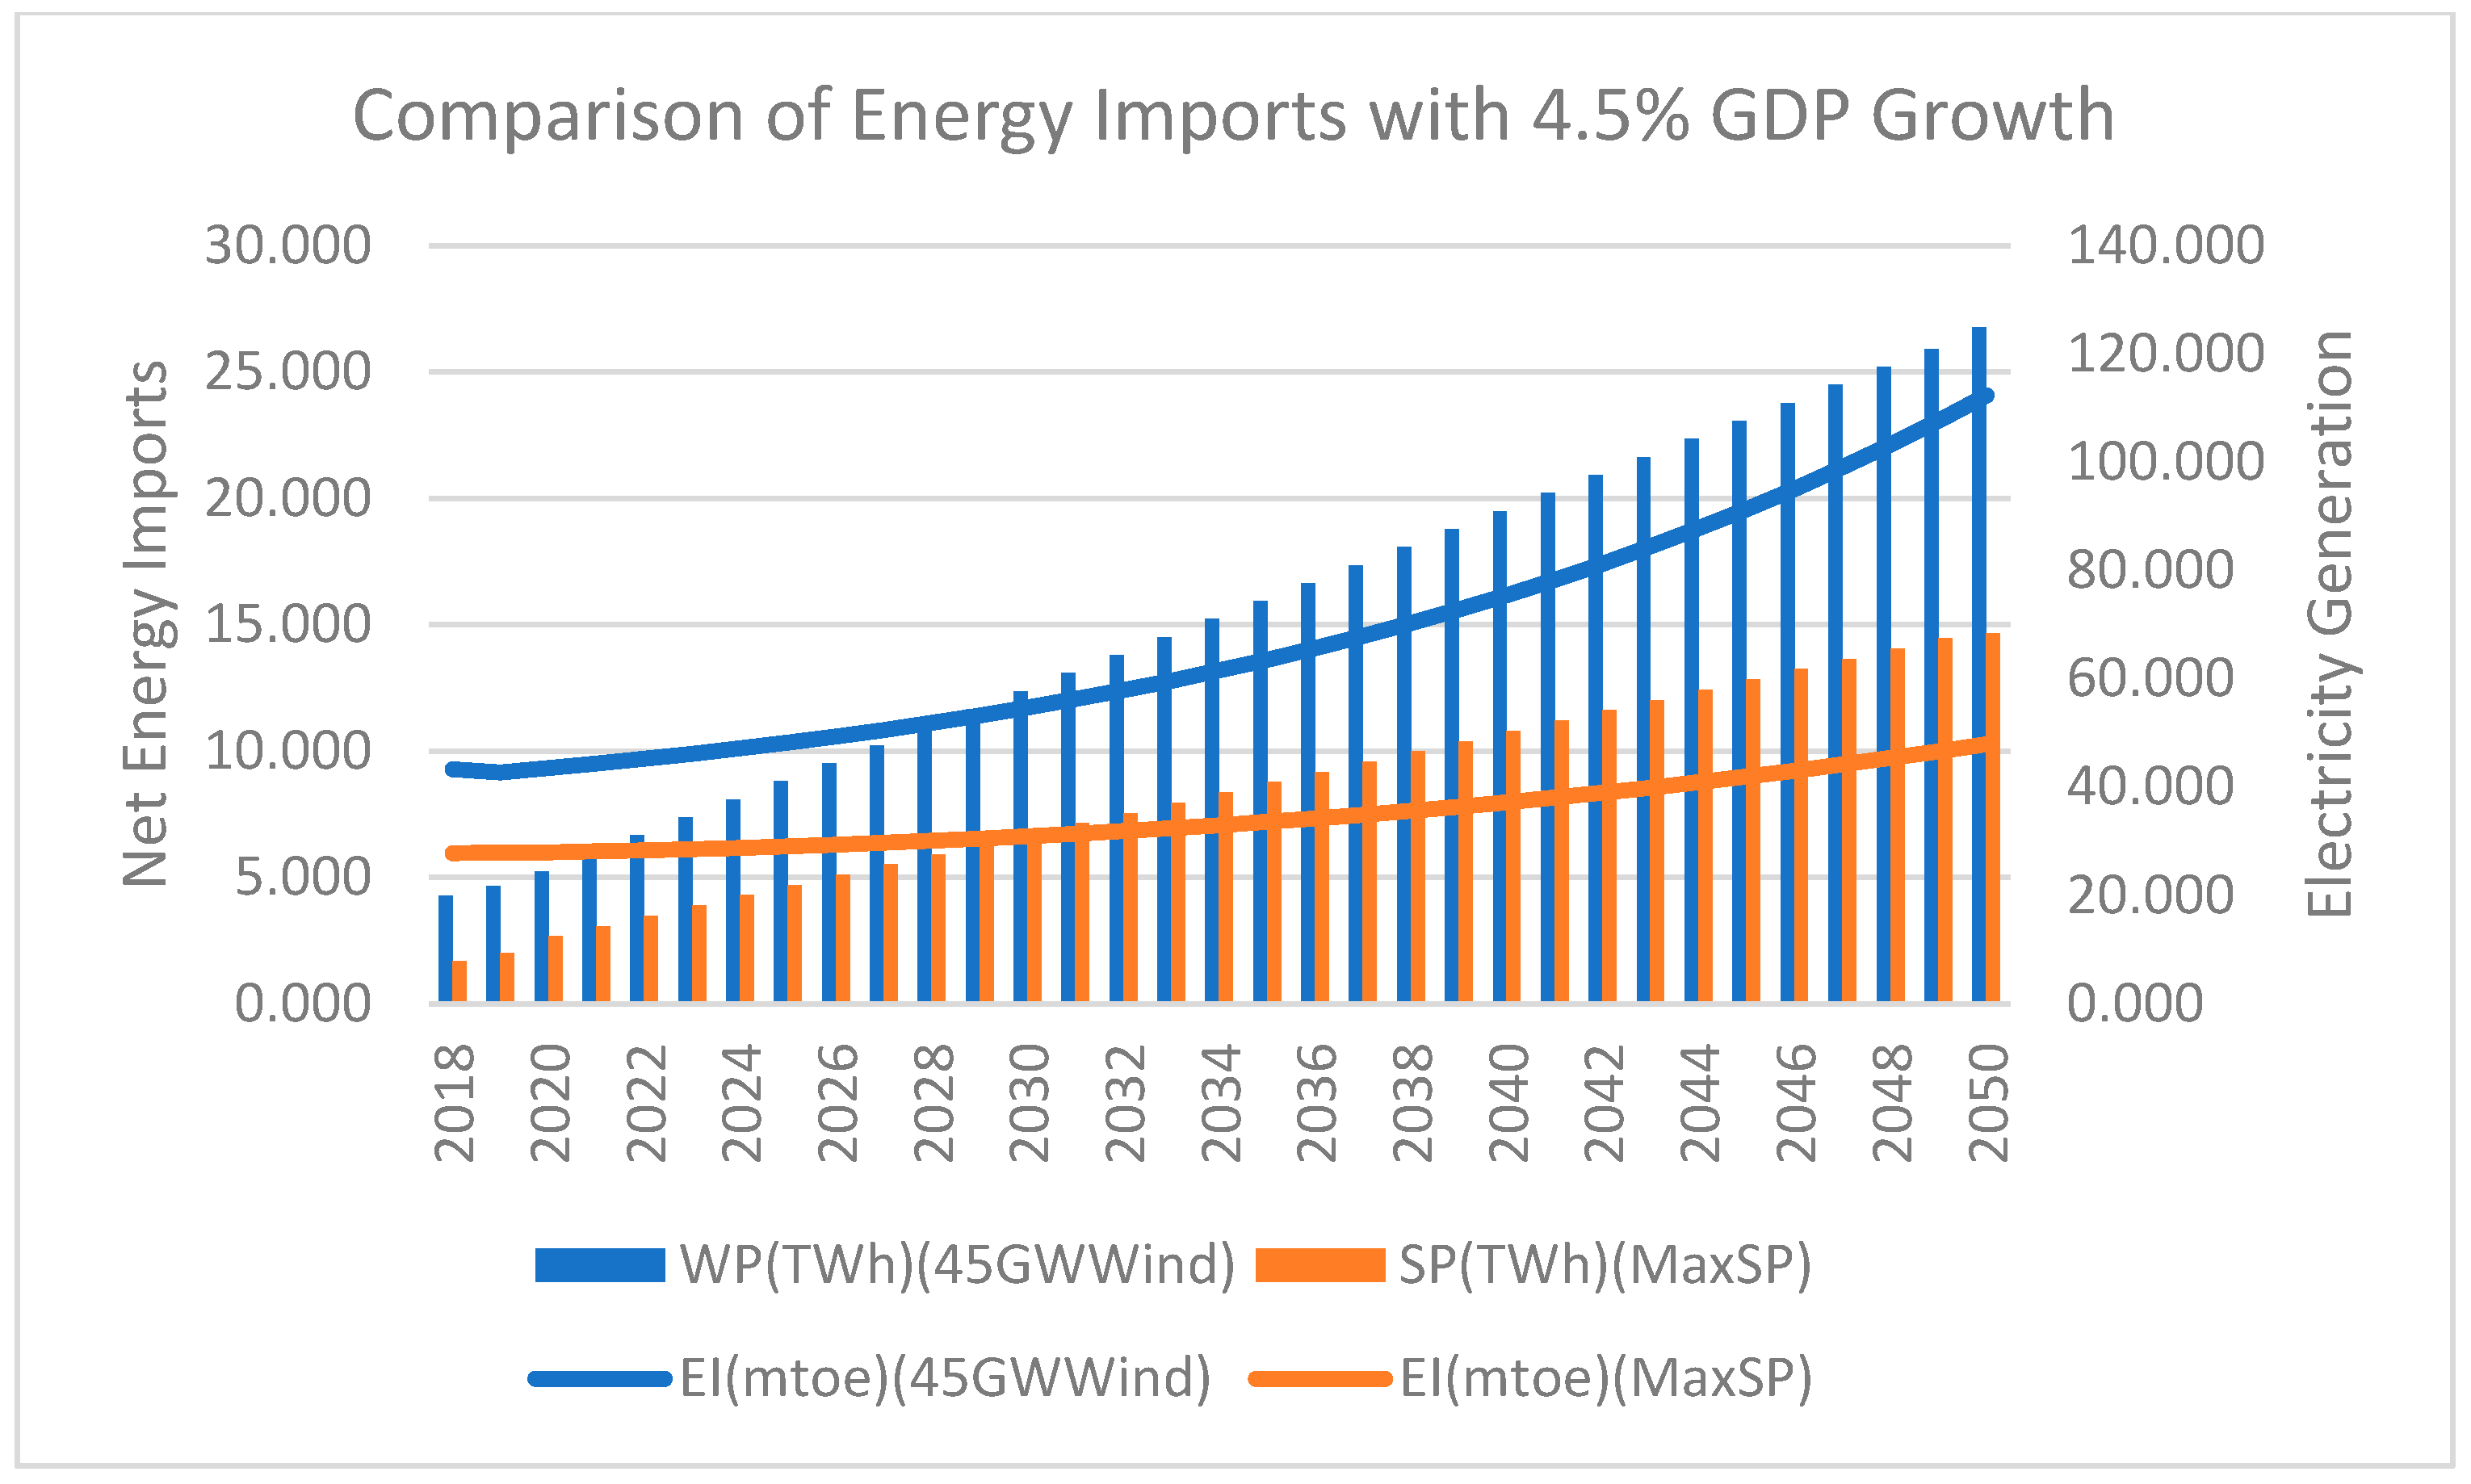
3.4. 45 GW Installed Wind Capacity (45GWWind)

This scenario aims for the full utilization of wind potential in electricity generation until 2050. The assumption is that the annual installed wind capacity increases by 1200 MW. All other electricity generation data are kept constant at their real 2019 values. Also, the capacity factor for wind is kept as the 2019 TEİAŞ value, 38%. This scenario takes energy efficiency into account due to PE2, and makes a positive contribution to energy security.
PE1 indicates that different GDP increases do not result in significant distinctions. With a 4% rise in GDP and TUIK population forecasted, lnCO22018 is 6.400, and lnCO22050 is 7.124. With a 5% rise in GDP and TUIK population forecasted, lnCO22018 is 6.401 and lnCO22050 is 7.149.
PE2 also shows that different GDP increases do not result in significant distinctions. With a 4% rise in GDP and TUIK population forecasted, lnEI2018 is 2.226 and lnEI2050 is 3.126. With a 5% rise in GDP and TUIK population forecasted, lnEI2018 is 2.230 and lnEI2050 is 3.236.
Compared with the BAU and FullDC results, all the outcomes of this scenario are lower. In other words, investing in wind power reduces both carbon emissions and energy imports. Regarding the impact of energy efficiency, which is represented by lnENERGYINTENSITY, PE2 emphasizes that if Türkiye gives priority to wind power, it will need energy-intensive, i.e., inefficient, power technologies in order to lower its energy imports. This means that coal should be used along with wind due to the latter’s intermittent character. Otherwise, the high reliance on wind power might necessitate more energy imports.

3.5. Maxiumum Solar Power (MaxSP)

This scenario aims at the maximum utilization of solar potential in electricity generation, which is 46.8 GW installed capacity, as estimated by [35]. The assumption is that the installed solar capacity increases by 1300 MW annually up to 2050. All other electricity generation data are kept constant at their real 2019 values. The average daily net electricity generation duration is taken as 4 h.
PE1 discusses carbon emissions. Increases in GDP do not yield a remarkable difference. With a 4% rise in GDP and TUIK population forecasted, lnCO22018 is 6.400 and lnCO22050 is 7.139. With a 5% rise in GDP and TUIK population forecasted, lnCO22018 is 6.401 and lnCO22050 is 7.164.
Unlike in other scenarios, PE3 reveals that GDP increases matter in Max SP. With a 4% rise in GDP and TUIK population forecasted, lnEI2018 is 1.781 and lnEI2050 is 2.185. With a 5% rise in GDP and TUIK population forecasted, lnEI2018 is 1.789 and lnEI2050 is 2.473. This result confirms those of [43] and implies that GDP is an important factor in solar deployment.
Compared with all other scenarios, the results for MaxSP are lower than those for BAUs and FullDC. However, the 45GWWind emission forecast yields results lower than those for MaxSP (see Figure 5 and Figure 6), while MaxSP shows better outcomes in terms of energy security (see Figure 7).
In brief, relying on domestic coal exacerbates CO2 emissions, but wind power and solar power may be beneficial in helping Türkiye to reach its emission reduction targets (see Figure 5). These results are in line with those from the literature referred to above. According to Figure 6, among the technologies analyzed in this study, wind power is more promising in lowering carbon emissions, i.e., achieving climate change mitigation, while Figure 7 highlights the benefits of solar power to securing energy, which exceed those of wind. The former outcome is attributed to the intermittent character and smaller capacity factor of solar power, since wind can generate more power than solar. The latter outcome is attributed to the off-grid use potential of solar power. The results of the manual calculations of Türkiye’s domestic coal-based power generation are positive in the context of the country’s energy security, but these come at the expense of climate change mitigation efforts.
In terms of linear values, the above results are repeated (see Figure 7, Figure 8 and Figure 9). Under the FullDC scenario, in 2033, the CO2 emissions will increase to 1018.943 million tonnes, which is 747% higher than the 1990 value. With the 45GWWind and MaxSP scenarios, the CO2 emissions in 2033 are forecasted to reach 861.949 million tonnes (632% rise) and 870.146 million tonnes (638% rise), respectively. These values will be 1256.726 million tonnes and 1275.693 million tonnes in 2050, respectively. Comparing energy import results, we see that the 45GWWind scenario achieves 24.077 mtoe in 2050, while the MaxSP scenario results in 10.273 mtoe, which is less than half the value of wind power. Ref. [24] gives similar results in terms of renewables’ contributions to energy security in Türkiye.
The updated NDC of Türkiye sets the target of “up to 41% reduction in GHG emissions by 2030”. BAU scenarios show a forecasted rise of 213%, while the Full DC scenario yields a forecasted rise of 232%. The 45GWWind and MaxSP scenarios yield a doubling of emissions in 2030 compared with the 2012 values. Refs. [27,28,36] give similar results, emphasizing the role of renewables in emission reduction. It is thus safe to say that investing in renewal energy-based power generation may contribute to the attainment of emission reduction targets in Türkiye, however, only changing the electricity generation technology or fuel used will be insufficient for achieving climate change mitigation.

4. Conclusions

Although environmental pressures, along with others, dominate the daily life and perceptions of the public in Türkiye, policies in the country fail to address these realities and the expectations of the public. Energy policies are shaped by economic and/or political priorities. For instance, the Strategy Plan of MENR [8] emphasizes electricity generation security over environmental problems related to the power sector. The Ministry’s main objective in the plan for securing electricity supply is the exploitation of domestic coal rather than prioritizing investment in solar and wind power. This study is thus developed in this context.
Inefficiency, below-global-average per capita electricity consumption, high demand increases, and foreign dependence on limited suppliers define Türkiye’s energy profile [3]. Challenges that Türkiye faces in securing energy include the large share of imported fuel in the economy, risks related to suppliers, increasing levels of energy consumption, and the need for investments in the energy sector. The country’s fossil reserves are able to meet only a small amount of its needs. Russia and Iran are the two biggest suppliers to Türkiye, and this heavy dependence on such politically, socially, and economically unstable countries creates vulnerabilities for this country [4,44]. Despite this high level of dependence on fossil fuels in power generation, Türkiye intends to reduce its greenhouse gas (GHG) emissions by 41% by 2030, as stated in its updated Nationally Determined Contribution (NDC). Thus, Türkiye has challenged herself to not lag behind in global climate diplomacy.
There are three ways to maintain energy security: “managing energy demand, increasing domestic energy supply, and increasing the reliability of imported or domestic supplies”. Nations can reduce their energy supply vulnerability by reducing demand or increasing efficiency, restructuring and arranging stockpiles, preparing plans for emergency conditions, increasing the share of alternative domestic supplies, diversifying external supplies, and taking “diplomatic, industrial and military measures” [45,46]. Similarly, Strategy Plan 2015–2019 of the Ministry of Energy and Natural Resources [8] focuses on energy supply security, and accepts production and import, enhancing storage and distribution infrastructure, and managing demand as fundamental elements of the concept. The Strategy Plan emphasizes the role of domestic sources in supply security and commits to increasing the contributions of domestic coal to electricity generation. Along with coal, the utilization of wind and solar power is also indicated.
According to the sector reports of the Turkish Electricity Transmission Corporation (TEİAŞ) (Sector Reports of Turkish Electricity Transmission Corporation: https://www.teias.gov.tr/tr-TR/sektor-raporlari, last access on 22 March 2020), the installed capacity of the country increased every year during 2015–2019; here, the share represented by fossil fuels was always the largest, and considerably increased in 2016 and 2017, as did other non-fossil sources. Regarding the latter, their share significantly increased, with solar showing the largest rise, even larger than the rise in fossil fueled-power plants. Specifically, during 2015–2019, the rise in installed capacity for solar was 5350.4 MW, whereas the same for fossil fuels was 4909 MW, and the total for non-fossil fuels was 11,877.7 MW, almost 2.5 times greater than the rise for fossil-based sources. In brief, Türkiye showed progress, although only slight, towards accomplishing its security and sustainability goals in the energy context in the pre-2020 years.
Based on this progress, in retrospect, this study aims to evaluate the role of domestic coal, solar, and wind in securing the electricity supply of Türkiye, and in fulfilling its efforts towards climate change mitigation. The results for different scenarios indicate that relying on domestic coal exacerbates CO2 emissions, but using wind power and solar power may be beneficial in helping Türkiye to reach its emission reduction targets. Among the technologies analyzed, wind power is more promising in terms of lowering carbon emissions, i.e., achieving climate change mitigation, while solar power is helpful for securing energy. Also, Türkiye’s use of domestic coal is important in securing its electricity supply.
In linear terms, the BAU scenarios forecast a rise of 213%, while the FullDC scenario forecasts an increase of 232% in carbon emissions. The 45GWWind and MaxSP scenarios reveal a doubling of emissions in 2030 compared with 2012 values. Considering the NDC of Türkiye, investing in renewal energy-based power generation may contribute to the attainment of emission reduction targets in this country, however, only changing electricity generation technology and/or the fuel used is not adequate for climate change mitigation.
If Türkiye preserved its pre-2020 energy policy approach, it would reduce its energy dependency by exploiting more domestic coal, wind and solar power. However, the results indicate that resuming the pre-2020 approach might not help the country to attain its emission reduction targets with similar success. The Strategy Plan of MENR [8] does not specify renewable targets. Thus, this study assumes a steady rise in the share of wind and solar until 2050, which is not viable, as the results prove. Therefore, Türkiye needs to define renewable installation targets in its policy documents. In the meantime, the country should renovate the grid to become resilient against the intermittency of solar and wind.
Also, each power source may contribute to the resolution of a different problem. As the scenario results indicate, investing in solar energy will be helpful to securing energy, while wind power will be more helpful to mitigating climate change. This result is attributed to the off-grid use potential of solar power. Thus, Türkiye requires more research on innovative uses of solar capacity. The building code may be revised to oblige owners to mount solar panels on rooftops and suitable façades, not only for power generation but also for hot water supply. Moreover, the development planning law and municipal laws should be amended to impose conditions that promote the use of solar power in public areas. Wind power is limited to certain locations and atmospheric conditions. Thus, Türkiye should prioritize investment in wind to improve its potential availability. To facilitate the energy transition, finance is a crucial factor. Subsidies, grants and low-interest loans are resources offered by public funding. To encourage private sector tax credits, feed-in tariffs or renewable energy certificates may be used. The government also has the choice to issue green bonds to raise funds for solar and wind investments. One other option is funding through the use of international loans.
Furthermore, the results indicate that only changing power generation technology is not sufficient to attain policy targets. Türkiye needs to manage demand via fiscal and administrative measures. Instead of a constant tariff, one that is adjusted to power consumption may reduce demand and indirectly contribute to energy efficiency. Finally, reducing working hours, accelerating automation in bureaucracy, and rescheduling energy-intensive public activities, e.g., night football games, would help to regulate demand.
This study assumes a static Türkiye after 2019. Thus, the basic limitation of the analysis is that it does not consider the impacts of global events like COVID-19, current wars, and national economic, political or social issues. Also, the study neglects to consider potential improvements in power generation technology and consumption efficiency. Global and local energy prices might be included to forecast the cost imposed on the public. The true cost of energy security might be calculated with consideration of the externalities emerging because of electricity generation. Finally, the impacts of the introduction of electric vehicles into the system on electricity demand and supply security need to be contemplated.

Supplementary Materials

The following supporting information can be downloaded at: https://www.mdpi.com/article/10.3390/en18040951/s1.

Author Contributions

Conceptualization, H.H.M.G. and H.E.; methodology, H.H.M.G. and H.E.; Microsoft Excel TREND function (Microsoft 365 (Office)) software, H.H.M.G.; validation, B.A. and Ş.A.; formal analysis, H.H.M.G. and H.E.; investigation, H.H.M.G.; resources, H.H.M.G.; data curation, H.H.M.G.; writing—original draft preparation, H.H.M.G.; writing—review and editing, B.A., H.E. and Ş.A.; supervision, H.E and B.A. All authors have read and agreed to the published version of the manuscript.

Funding

This research received no external funding.

Data Availability Statement

The original contributions presented in this study are included in the article/Supplementary Materials. Further inquiries can be directed to the corresponding author.

Conflicts of Interest

Author Hasan Hüseyin Miraç Gül was employed by the company Sigun Ekolojik Danışmanlık Ltd. Şti. The remaining authors declare that the research was conducted in the absence of any commercial or financial relationships that could be construed as a potential conflict of interest.

Nomenclature

AbbreviationExplanation
BAUBusiness-As-Usual
CTPCoal-fired Thermal Power
GDPGross Domestic Product
GHGGreenhouse Gas
GTPGas-fired Thermal Power
IEAInternational Energy Agency
IPCCIntergovernmental Panel for Climate Change
MENRMinistry of Energy and Natural Resources
mtoeMillion Tons Oil Equivalent
NDCNationally Determined Contribution
OECDOrganization for Economic Cooperation and Development
PEPanel Equation
SPSolar Power
TEİAŞTurkish Electricity Transmission Corporation
TUIKTurkish Statistics Institution
TWhTerawatt Hours
WDIWorld Development Indicators Database
WPWind Power

References

  1. Dewdney, J.C.; Yapp, M.E. Turkey. Encyclopædia Britannica. 2020. Available online: https://www.britannica.com/place/Turkey (accessed on 10 March 2020).
  2. The World Bank Group. The World Bank in Türkiye. 2024. Available online: https://www.worldbank.org/en/country/turkey/overview (accessed on 28 November 2024).
  3. Çimen, S. “Enerji Güvenliği: Dünya ve Türkiye” Paneli. In Dünya’da ve Türkiye’de Enerji Sektörü; Dündar, D., İşeri, M., Pamir, N., Eds.; TC İstanbul Kültür Üniversitesi: İstanbul, Turkey, 2010; pp. 21–37. [Google Scholar]
  4. Özalp, M. Küresel Ölçekte Türkiye’nin Enerji Arz ve Talep Güvenliği. J. Turk. Stud. 2019, 14, 537–552. [Google Scholar] [CrossRef]
  5. Toprak, N.G. Turkey’s Energy Security Policy within the Framework of Development Plans. EnergyTR 2024, 1, 73–92. [Google Scholar]
  6. Yilmaz, A.O.; Uslu, T. The role of coal in energy production-Consumption and sustainable development of Turkey. Energy Policy 2007, 35, 1117–1128. [Google Scholar] [CrossRef]
  7. ETKB. Elektrik Enerjisi Piyasası ve Arz Güvenliği Strateji Belgesi; Ministry of Energy and Natural Resources: Ankara, Turkey, 2009. [Google Scholar]
  8. ETKB. Enerji ve Tabii Kaynaklar Bakanlığı 2015–2019 Stratejik Planı; ETKB: Ankara, Turkey, 2017. [Google Scholar]
  9. Soylu, O.B.; Turel, M.; Balsalobre-Lorente, D.; Radulescu, M. Evaluating the impacts of renewable energy action plans: A synthetic control approach to the Turkish case. Heliyon 2024, 10, e25902. [Google Scholar] [CrossRef] [PubMed]
  10. Bruckner, T.; Bashmakov, I.A.; Mulugetta, Y.; Chum, H.; de la Vega Navarro, A.; Edmonds, J.; Faaij, A.; Fungtammasan, B.; Garg, A.; Hertwich, E.; et al. Energy systems. In Climate Change 2014: Mitigation of Climate Change Contribution of Working Group III to the Fifth Assessment Report of the Intergovernmental Panel on Climate Change; Edenhofer, O., Pichs-Madruga, R., Sokona, Y., Farahani, E., Kadner, S., Seyboth, K., Eds.; Cambridge University Press: Cambridge, UK; New York, NY, USA, 2014; pp. 511–597. [Google Scholar]
  11. Bridges, A.; Felder, F.A.; McKelvey, K.; Niyogi, I. Uncertainty in energy planning: Estimating the health impacts of air pollution from fossil fuel electricity generation. Energy Res. Soc. Sci. 2015, 6, 74–77. [Google Scholar] [CrossRef]
  12. Zhu, J.; Cheung, K. Summary of environment impact of renewable energy resources. Adv. Mater. Res. 2013, 616–618, 1133–1136. [Google Scholar] [CrossRef]
  13. Oluwatoyin, K.; Oluwasegun, A.; Alabi, A. Power Generation and Its Impacts on the Environment. J. Sci. Res. Rep. 2015, 7, 551–566. [Google Scholar] [CrossRef] [PubMed]
  14. Zhao, S.; Suo, X.; Ma, Y.; Dong, L. Multi-Point Layout Planning Method for Multi-Energy Power System Based on Complex Adaptive System Theory. CSEE J. Power Energy Syst. 2024, 10, 2138–2146. Available online: https://ieeexplore.ieee.org/stamp/stamp.jsp?tp=&arnumber=9606942 (accessed on 2 February 2025).
  15. Gkalonaki, S.; Karatzas, K. Assessing the environmental impacts of renewable energy sources with emphasis on wind energy. In IOP Conference Series: Earth and Environmental Science, Proceedings of the 3rd International Conference on Environmental Design (ICED2022), Athens, Greece, 22–23 October; IOP Publishing Ltd.: Bristol, UK, 2022. [Google Scholar]
  16. Cansın, Y. Enerji Güvenliğinin Değerlendirilmesine Yönelik Temel Göstergelerin Küresel Eğilimler İle Ulusal Tehdit Algılamaları Ekseninde Analizi. Master’s Thesis, İstanbul Teknik Üniversitesi, İstanbul, Turkey, 2007. [Google Scholar]
  17. Kardaşlar, S. Türkiye’nin Enerji Güvenliğinde Yenilenebilir Kaynakların Rolü. Master’s Thesis, Harp Akademileri Stratejik Araştırmalar Enstitüsü, Ankara, Turkey, 2016. [Google Scholar]
  18. Dursun, S. Enerji Bağımlılığı: Türkiye ve İsveç Karşılaştırması. Master’s Thesis, Ege Üniversitesi, İzmir, Turkey, 2019. [Google Scholar]
  19. Kocaslan, G. International energy security indicators and Turkey’s energy security risk score. Int. J. Energy Econ. Policy 2014, 4, 735–743. [Google Scholar]
  20. Peker, H.S. Türkiye’nin Enerji Arz Güvenliği ve Ölçülmesi: Türkiye’nin Enerji Arz Güvenliği Endeksine Yönelik Bir Uygulama. Master’s Thesis, Selçuk Üniversitesi, Selçuk, Turkey, 2014. [Google Scholar]
  21. Öznazik, H.A. Türkiye’de Enerji Arz Güvenliği: Uygulanan Politikalar ve Etkileri. Master’s Thesis, Gazi Üniversitesi, Ankara, Turkey, 2019. [Google Scholar]
  22. Erdal, L. Enerji Arz Güvenliğini Etkileyen Faktörler Ve Yenilenebilir Enerji Kaynakları Alternatifi. Ph.D. Thesis, Adnan Menderes Üniversitesi, Adnan, Turkey, 2011. [Google Scholar]
  23. Dogan, M. A Public Energy Policy Proposal for Turkey in the Light of Econometric Findings. Kırklareli Üniversitesi Sos. Bilim. Mesl. Yüksekokulu Derg. 2023, 4, 1–23. [Google Scholar] [CrossRef]
  24. Erdal, L. Determinants of Energy Supply Security: An Econometric Analysis for Turkey. Ege Akad. Bakis (Ege Acad. Rev.) 2015, 15, 153–164. [Google Scholar] [CrossRef]
  25. Avar, A. Türkiye’nin Enerji Arz Güvenliğinin Ekonometrik Analizi. Master’s Thesis, Akdeniz Üniversitesi, Antalya, Turkey, 2018. [Google Scholar]
  26. Çoruh, B. Enerji Arz Güvenliği Kapsamında Türkiye’nin Enerji Politikaları. Master’s Thesis, Kahramanmaraş Sütçü İmam Üniversitesi, Onikişubat, Turkey, 2019. [Google Scholar]
  27. Arı, İ. Investigating the CO2 Emission of Turkish Electricity Sector and Its Mitigation Potential. Master’s Thesis, Middle East Technical University, Ankara, Turkey, 2010. [Google Scholar]
  28. Arı, İ.; Köksal, M.A. Carbon dioxide emission from the Turkish electricity sector and its mitigation options. Energy Policy 2011, 39, 6120–6135. [Google Scholar] [CrossRef]
  29. Boran, F.E.; Dizdar, E.; Toktas, I.; Boran, K.; Eldem, C. A Multidimensional Analysis of Electricity Generation Options with Different Scenarios in Turkey. Energy Sources Part B Econ. Plan. Policy 2013, 8, 44–55. [Google Scholar] [CrossRef]
  30. Atılgan, B.; Azapagic, A. Life cycle environmental impacts of electricity from fossil fuels in Turkey. J. Clean. Prod. 2015, 106, 555–564. [Google Scholar] [CrossRef]
  31. Özcan, M. Estimation of Turkey’s GHG emissions from electricity generation by fuel types. Renew. Sustain. Energy Rev. 2016, 53, 832–840. [Google Scholar] [CrossRef]
  32. Dulkadiroğlu, H. Türkiye’de Elektrik Üretiminin Sera Gazı Emisyonları Açısından İncelenmesi. Ömer Halisdemir Üniversitesi Mühendislik Bilim. Derg. 2018, 7, 67–74. [Google Scholar]
  33. Aydın, L. Effects of increasing indigenous coal share in Turkey’s electricity generation mix on key economic and environmental indicators: An extended input–output analysis. Energy Explor. Exploit. 2018, 36, 230–245. [Google Scholar] [CrossRef]
  34. Dikmen, A.Ç. Türkiye’de Güneş ve Rüzgar Enerjisinden Elektrik Üretiminin Sera Gazı Emisyonları ve Çevre Maliyetinin Azaltılmasına Katkıları. Turk. Stud. 2019, 14, 275–293. [Google Scholar] [CrossRef]
  35. Önenli, Ö. Emission Reductions and Future of Energy Policies in Turkey. Are Renewables an Alternative? Ph.D. Thesis, Middle East Technical University, Ankara, Turkey, 2019. [Google Scholar]
  36. Arı, İ.; Yıkmaz, R.F. The role of renewable energy in achieving Turkey’s INDC. Renew. Sustain. Energy Rev. 2019, 105, 244–251. [Google Scholar] [CrossRef]
  37. Saint Akadiri, S.; Adewale Alola, A.; Olasehinde-Williams, G.; Udom Etokakpan, M. The role of electricity consumption, globalization and economic growth in carbon dioxide emissions and its implications for environmental sustainability targets. Sci. Total Environ. 2020, 708, 134653–134662. [Google Scholar] [CrossRef]
  38. Onenli, O.; Ercan, H.; Acikgoz, S.; Kat, B. Emission reduction pathways for satisfying Türkiye’s future electricity demand: A cross-country dynamic panel analysis with linear programming scenarios. Clean. Energy Syst. 2023, 6, 100085. [Google Scholar] [CrossRef]
  39. Gungor, G.; Sari, R. Meta-analysis of the Turkish energy and climate pathways to achieve the net-zero emission target. Energy 2024, 305, 132337. [Google Scholar] [CrossRef]
  40. Gül, H.H.M.; Açıkgöz, Ş.; Ercan, H.; Akınoğlu, B. Securing energy while mitigating climate change. Energy Clim. Chang. 2022, 3, 100085. [Google Scholar] [CrossRef]
  41. Hill, R.C.; Griffiths, W.E.; Lim, G.C. Principles of Econometrics International Student Version, 4th ed.; John Wiley & Sons, Inc.: Singapore, 2012; 758p. [Google Scholar]
  42. Baltagi, B.H. Econometrics, 5th ed.; Springer: Berlin/Heidelberg, Germany, 2011; 410p. [Google Scholar]
  43. Lu, Y.; Yi, F.; Yu, S.; Feng, Y.; Wang, Y. Pathways to Sustainable Deployment of Solar Photovoltaic Policies in 20 Leading Countries Using a Qualitative Comparative Analysis. Sustainability 2022, 14, 5858. [Google Scholar] [CrossRef]
  44. Balat, M. Security of energy supply in Turkey: Challenges and solutions. Energy Convers. Manag. 2010, 51, 1998–2011. [Google Scholar] [CrossRef]
  45. Deese, D.A. Energy: Economics, Politics, and Security. Int. Secur. 1979, 4, 140–153. [Google Scholar] [CrossRef]
  46. The World Bank Group. Energy Security Issues; The World Bank Group: Moscow, Russia; Washington, DC, USA, 2005. [Google Scholar]
Figure 1. Türkiye’s carbon emission profile (data source: WDI).
Energies 18 00951 g001
Figure 2. Trend equations used in forecast.
Energies 18 00951 g002
Figure 3. Trend equation for natural logarithm of solar power used in forecast.
Energies 18 00951 g003
Figure 4. Trend equation for natural logarithm of wind power used in the forecast.
Energies 18 00951 g004
Figure 5. Comparison of carbon emissions with domestic sources.
Energies 18 00951 g005
Figure 6. Comparison of carbon emissions between WP and SP.
Energies 18 00951 g006
Figure 7. Comparison of levels of energy security between WP and SP.
Energies 18 00951 g007
Figure 8. Comparison of carbon emissions with domestic sources.
Energies 18 00951 g008
Figure 9. Comparison of energy security between WP and SP.
Energies 18 00951 g009
Table 1. Description of variables.
VariableLabel
CO2Carbon dioxide emissions, millions of tonnes
EINet energy imports, million tonnes of oil equivalent
CTPElectricity generation by coal, TWh
GTPElectricity generation from natural gas sources, TWh
SPElectricity generation by solar pv, gross output, TWh
WPElectricity generation from wind power, gross output, TWh
NPElectricity generation from nuclear power, TWh
INDUSTRYTotal final energy consumption by industry sector, ktoe
RESIDENTIALTotal final energy consumption by residential sector, ktoe
ENERGYINTENSITYTotal primary energy supply by GDP, tonne per 2010 constant USD
GDPCurrent billion USD
POPTotal population, million
Table 2. Descriptive statistics.
VariableObsMeanStd.Dev.MinMax
lnCO212924.811.6180.6939.133
lnEI9893.21.52206.601
lnCTP11883.1172.242−6.9088.409
lnGTP12322.2482.33−6.8047.257
lnSP785−3.2133.121−11.5134.769
lnWP959−1.2263.108−11.7445.687
lnINDUSTRY12929.3161.5685.86413.837
lnRESIDENTIAL12929.0791.5585.60912.718
lnCARBONINTENSITY1292−1.120.695−2.8130.924
lnGDP12925.6311.5871.3889.877
lnPOP12923.0541.763−1.3677.234
Table 3. Summary of scenarios.
ScenarioAssumptionsDeterminant Variable
Business-as-Usual1 (BAU1)All variables except GDP and POP increase according to historical trends.GDP
Business-as-Usual2 (BAU2)All variables except GDP and POP increase according to historical trends.GDP
Business-as-Usual3 (BAU3)All variables except GDP and POP increase according to historical trends.GDP
60 TWh Domestic Coal (60TWhDC)Electricity generation and GDP variables are real values.
Domestic coal-based generation is 60 TWh by the end of 2019.
CTP
Full Domestic Coal (FullDC)All domestic coal potential is used until 2033.
The additional capacity is 13,670 MW.
The annual increase in installed domestic coal capacity is 1000 MW.
CF is taken as constant at the 2019 value for all years.
WP, SP, GTP, and imported coal are kept constant at 2019 values.
CTP
45 GW Installed Wind (45GWWind)All wind potential is used until 2050.
The annual increase in installed wind capacity is 1200 MW.
CF is taken as constant at the 2019 TEİAŞ value for all years, 38%.
The average daily generation is 20 h.
CTP, GTP, and SP are kept constant at their 2019 values.
WP
Maximum Solar Power (MaxSP)Total solar potential is 46.8 GW, utilized until 2050.
The annual increase in installed solar capacity is 1300 MW.
The average net daily solar generation is 4 h.
CTP, GTP, and WP are kept at their 2019 values.
SP
Table 4. Approximation of electricity generation from domestic coal.
YearMENA Domestic Coal Generation Target (TWh)TEİAŞ Hard Coal + Imported Coal + Asphaltite (TWh)TEİAŞ Lignite (TWh)Hours/Day Lignite Used for Electricity GenerationHard Coal + Asphaltite (TWh)Total Domestic Coal (TWh)CF by TEİAŞ for Fossil Fuel
201332.9
20154044.8331.3415.934.3935.730.622
2016 53.7038.5718.415.0743.640.629
20175056.7840.6919.025.4346.130.642
2018 68.1645.0919.945.7050.780.655
20196066.0246.8719.265.5052.370.669
Energies 18 00951 i001 realized; Energies 18 00951 i002 estimate.
Disclaimer/Publisher’s Note: The statements, opinions and data contained in all publications are solely those of the individual author(s) and contributor(s) and not of MDPI and/or the editor(s). MDPI and/or the editor(s) disclaim responsibility for any injury to people or property resulting from any ideas, methods, instructions or products referred to in the content.

