
Frequency Stability Analysis and Control Parameter Optimization in High-Voltage Direct Current-Asynchronous Power Systems with Automatic Generation Control


Abstract
1. Introduction
1.1. Motivation
1.2. Literature Review
1.3. Contributions
- Building a frequency dynamic analysis model of an asynchronous interconnected two-area system with AGC in frequency synchronous control, conducting an adaptive analysis of HVDC frequency control and AGC control, analyzing system stability under changes in HVDC frequency control parameters, and analyzing system frequency characteristics and HVDC power under different AGC control modes.
- Developing a parameter optimization method for an asynchronous interconnected power grid on both sides to synchronize frequency, optimizing the proportional coefficient and integral coefficient in the HVDC frequency controller to achieve the best frequency control effect.
2. Frequency Dynamic Analysis Model of the Asynchronous Interconnected Two-Area System with HVDC
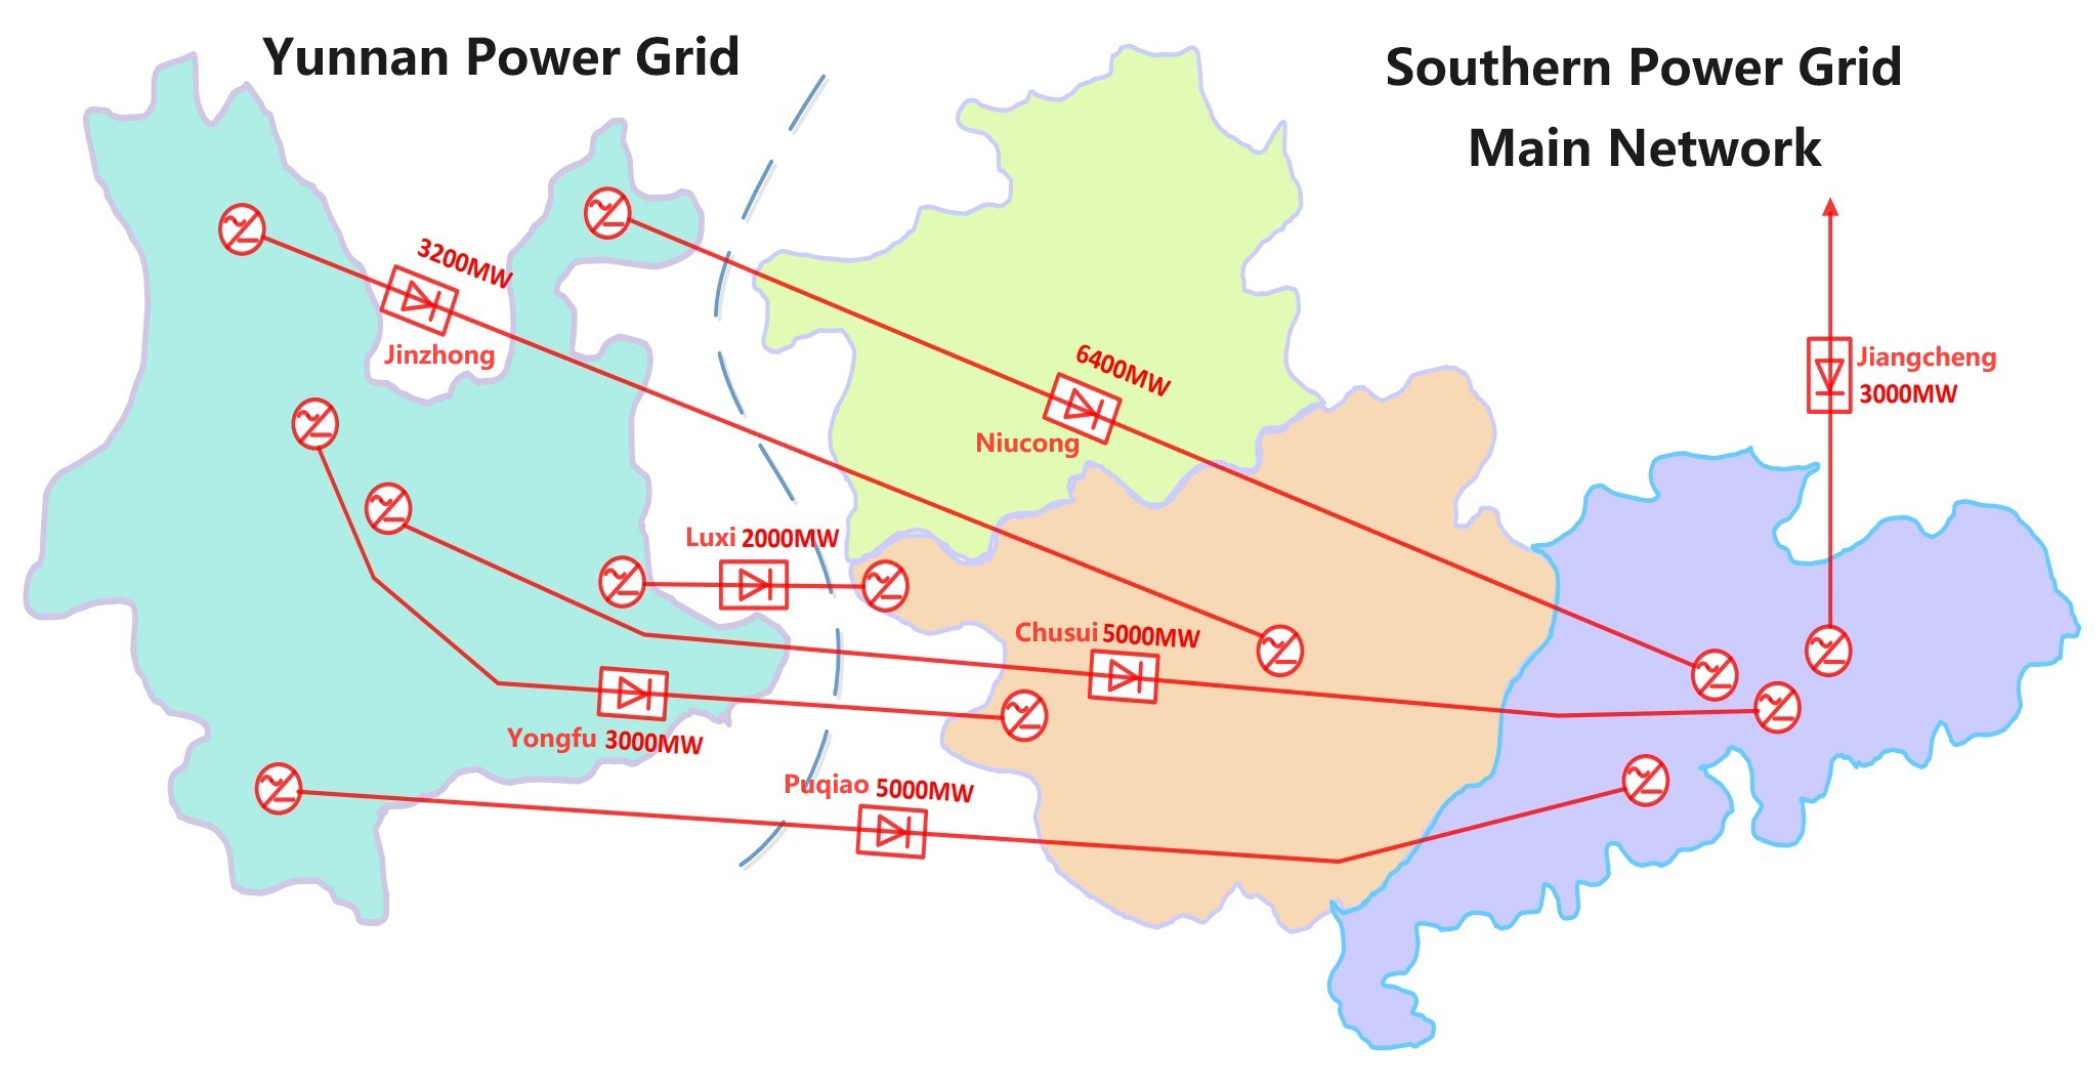
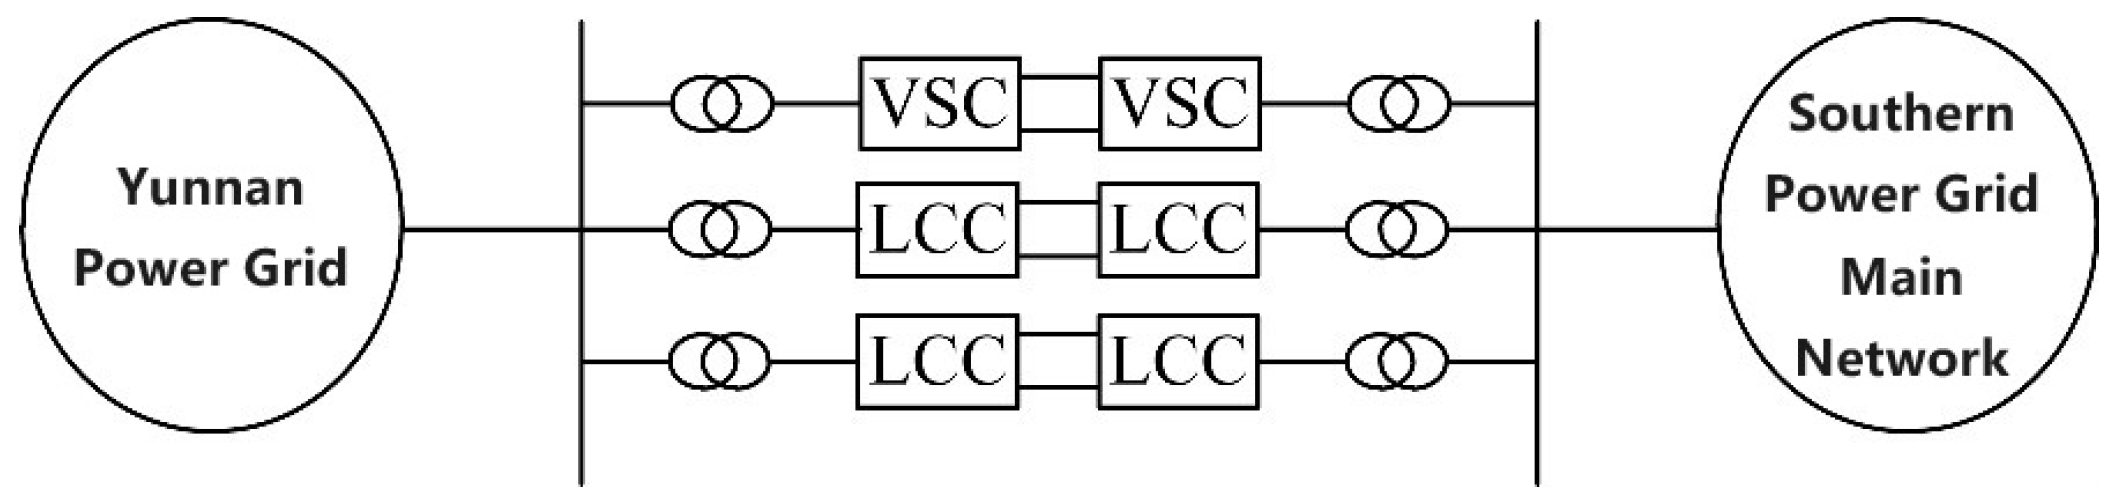
2.1. Implementation and Challenges of HVDC-Asynchronous Interconnected Power Grids
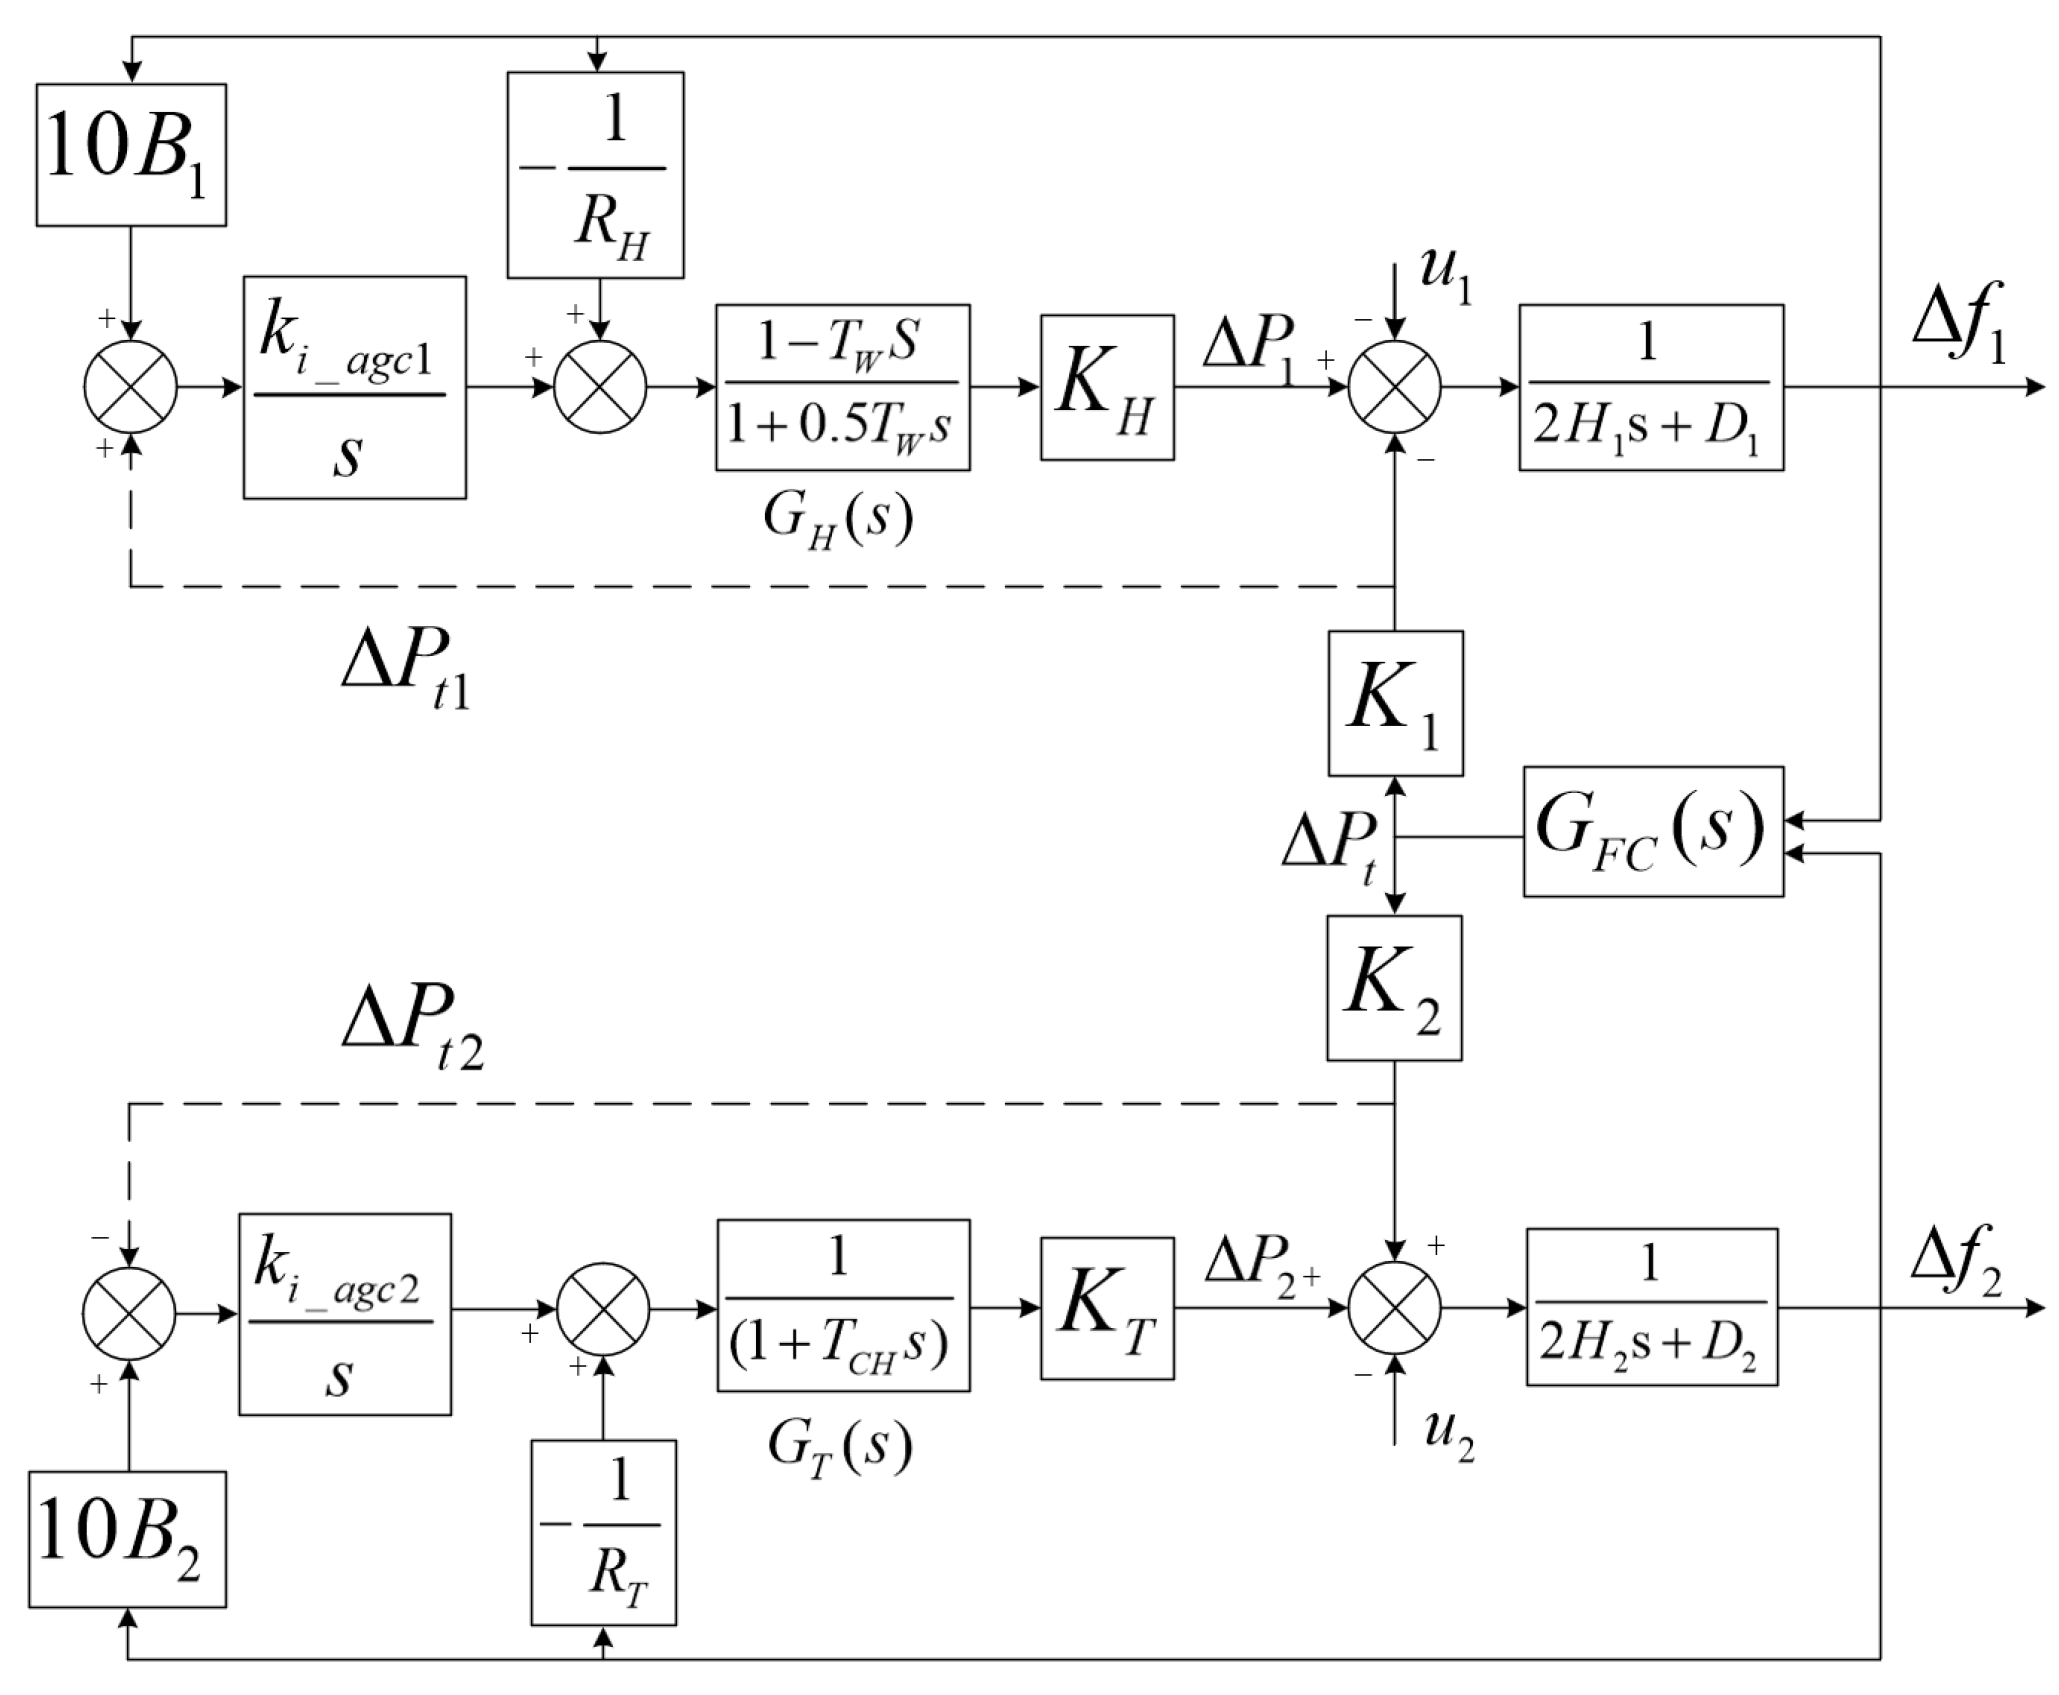
2.2. Frequency Dynamics Analysis Model of HVDC-Asynchronous Interconnected Two-Area Systems
3. Stability Analysis and Control Parameter Determination for Asynchronously Interconnected Two-Area Frequency Control Involving HVDC Participation
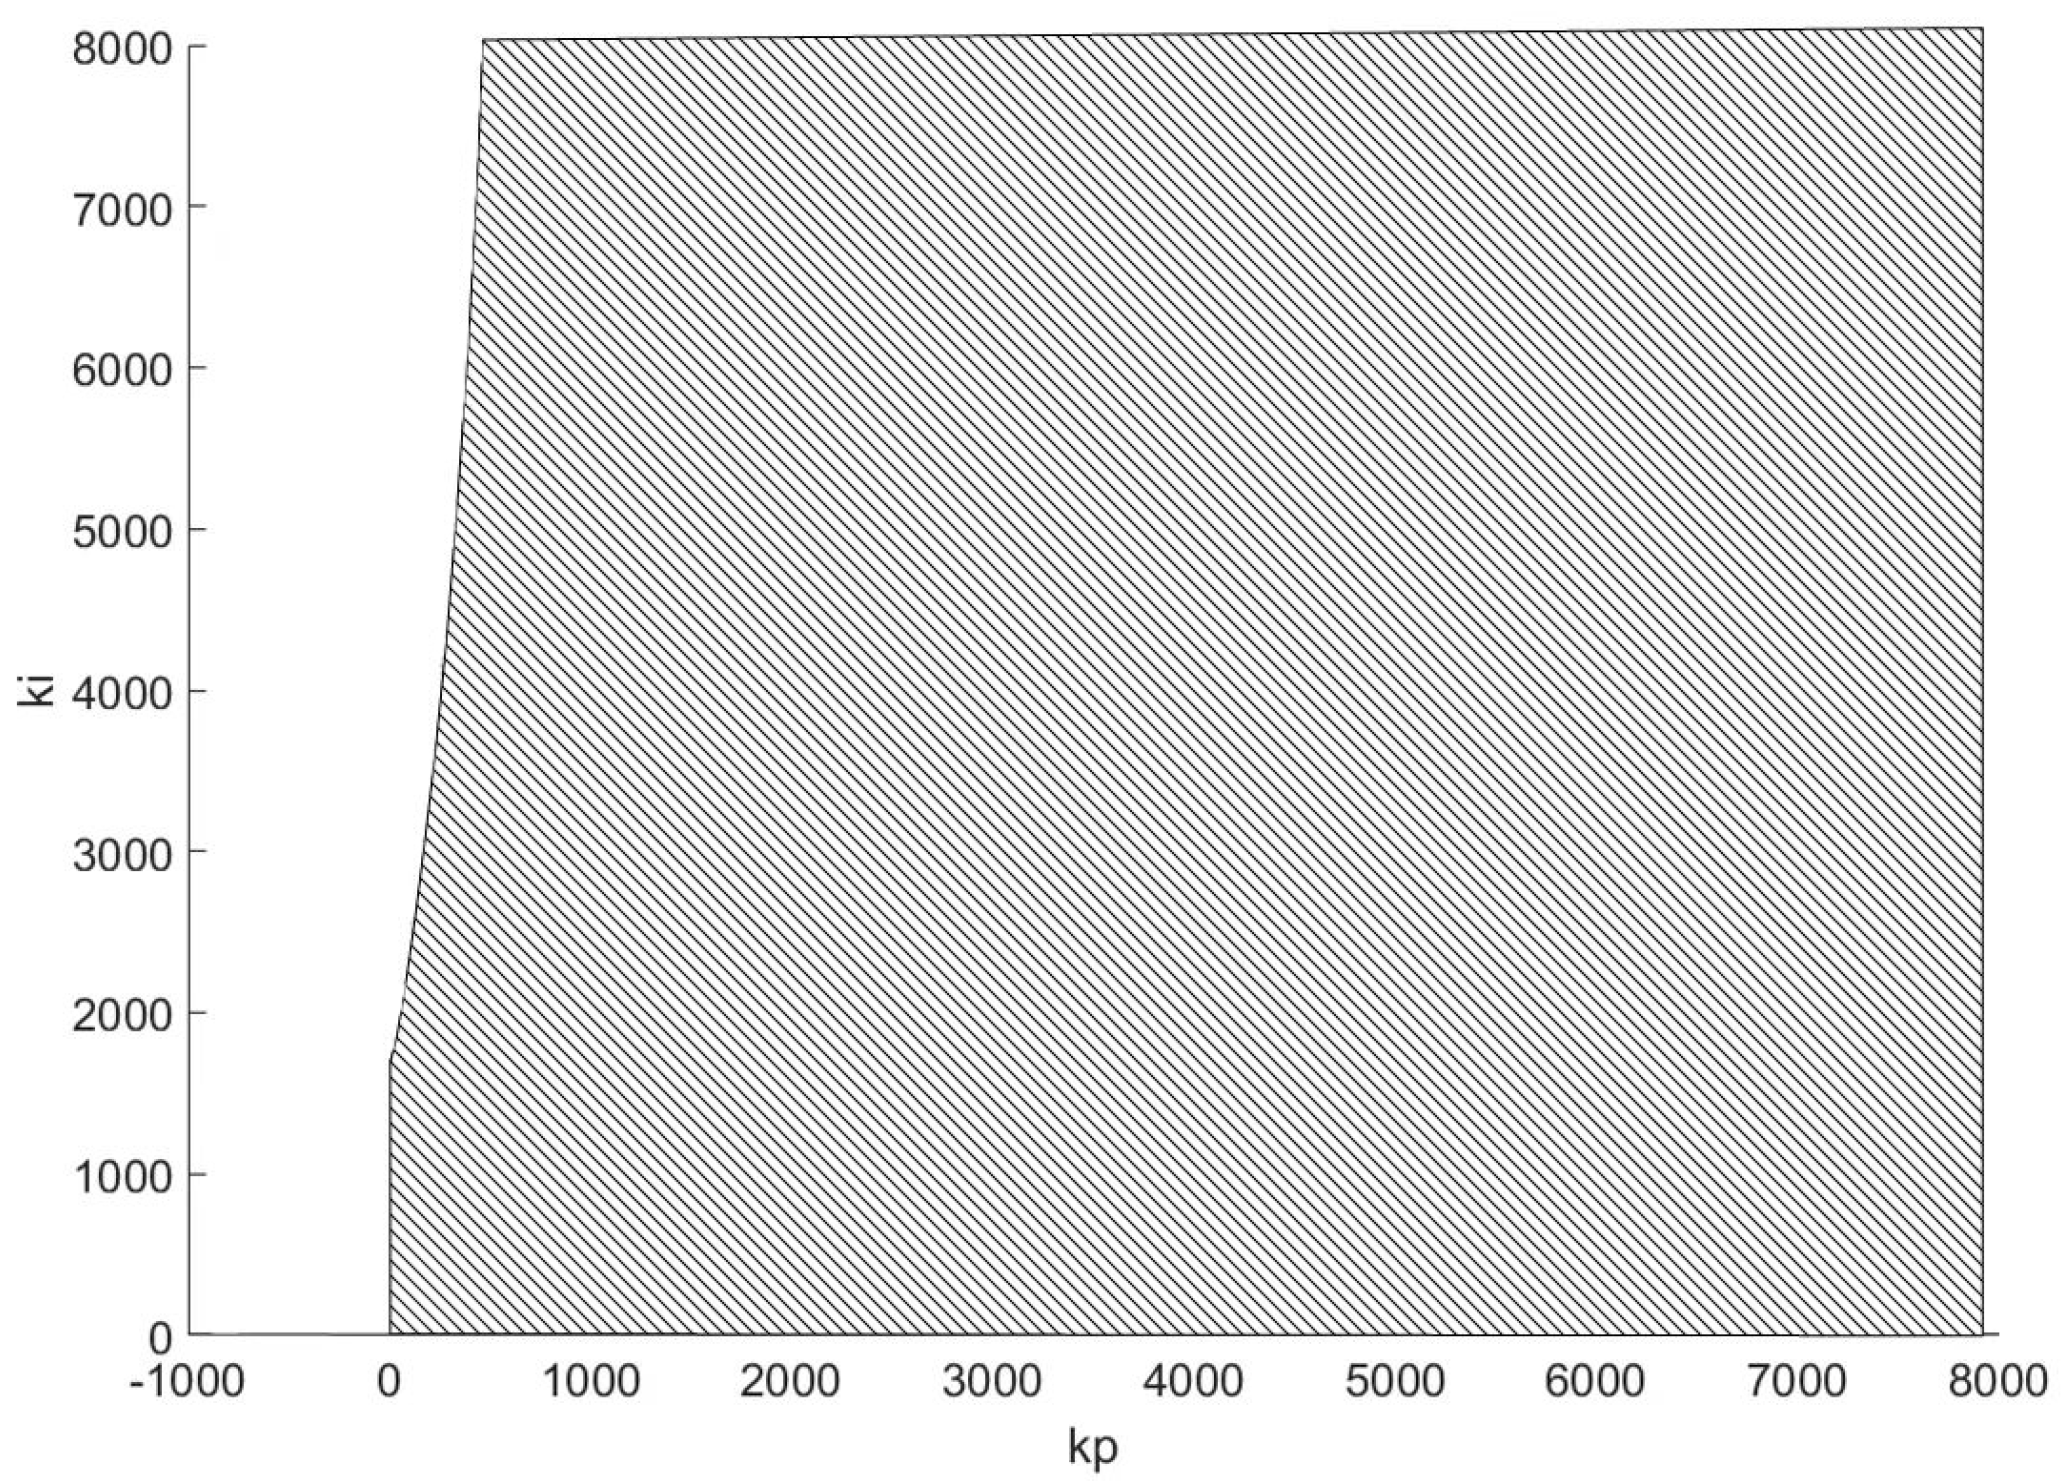
3.1. Stability Analysis of Asynchronously Interconnected Two Areas with HVDC Frequency Control
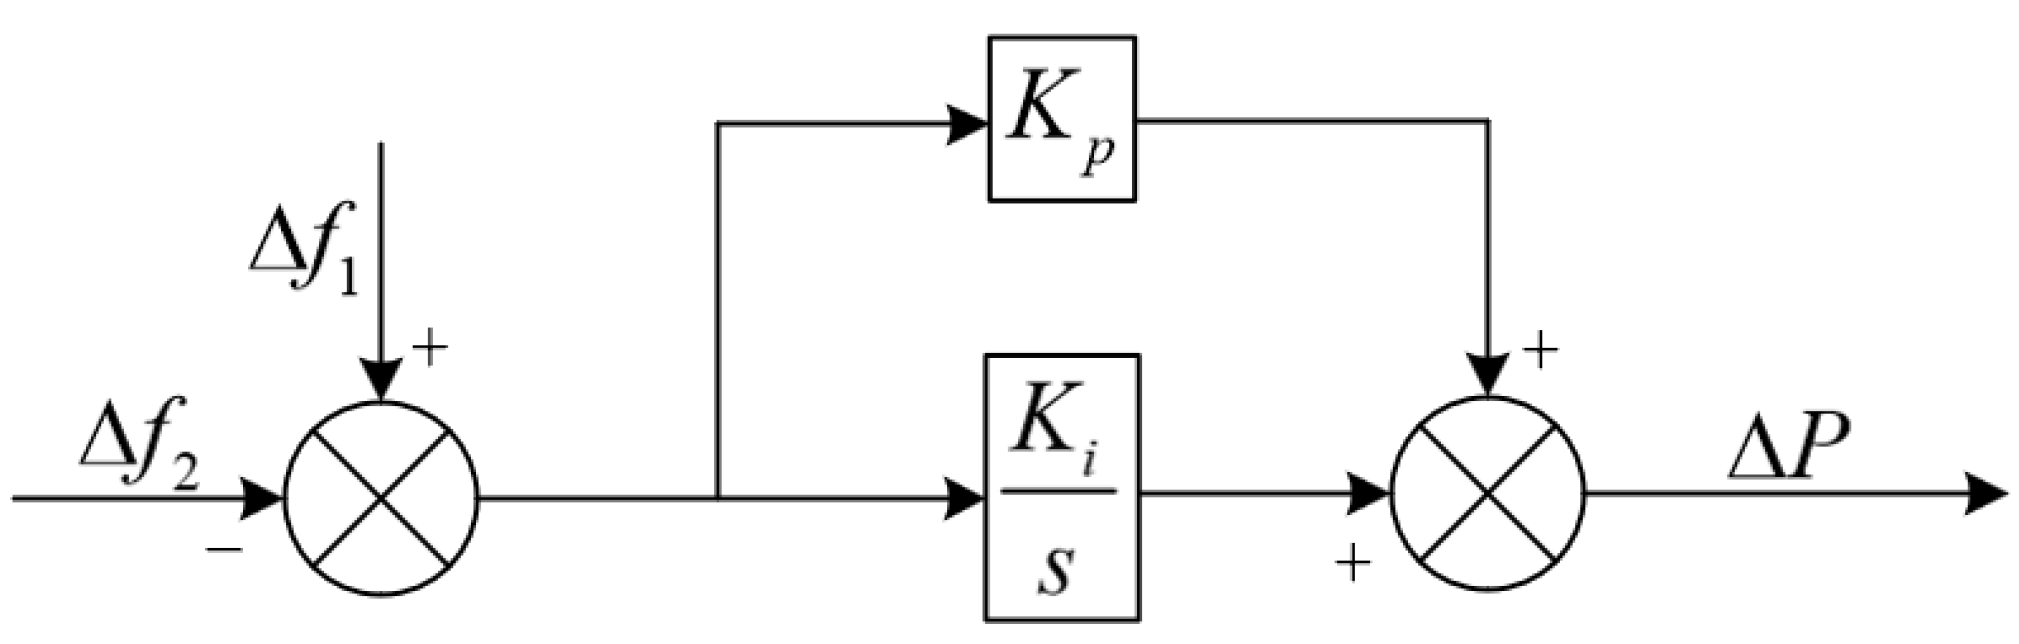
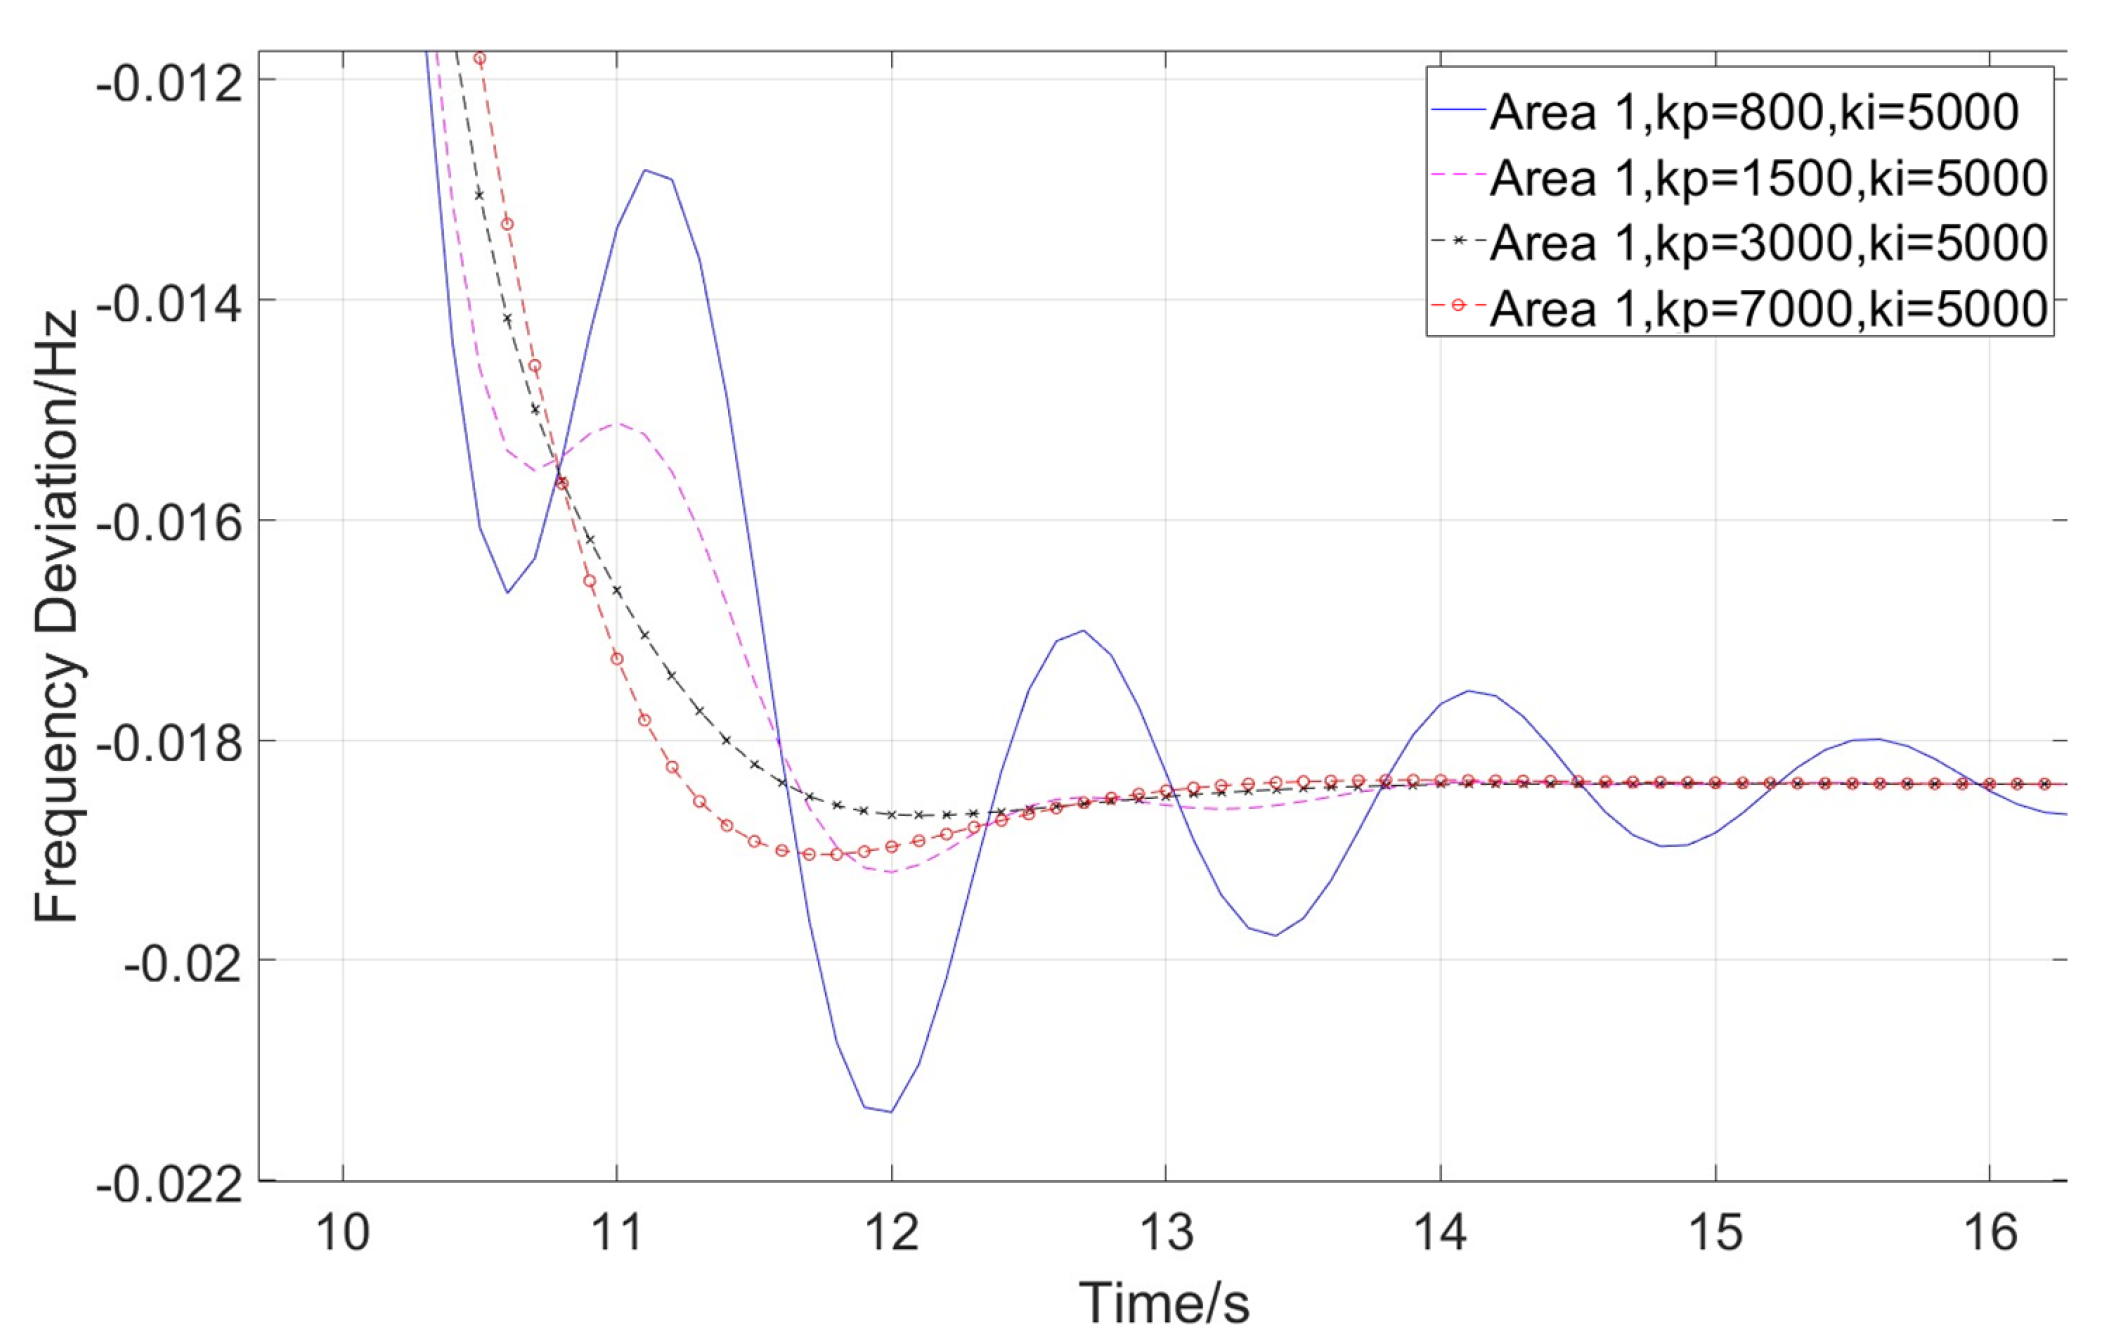
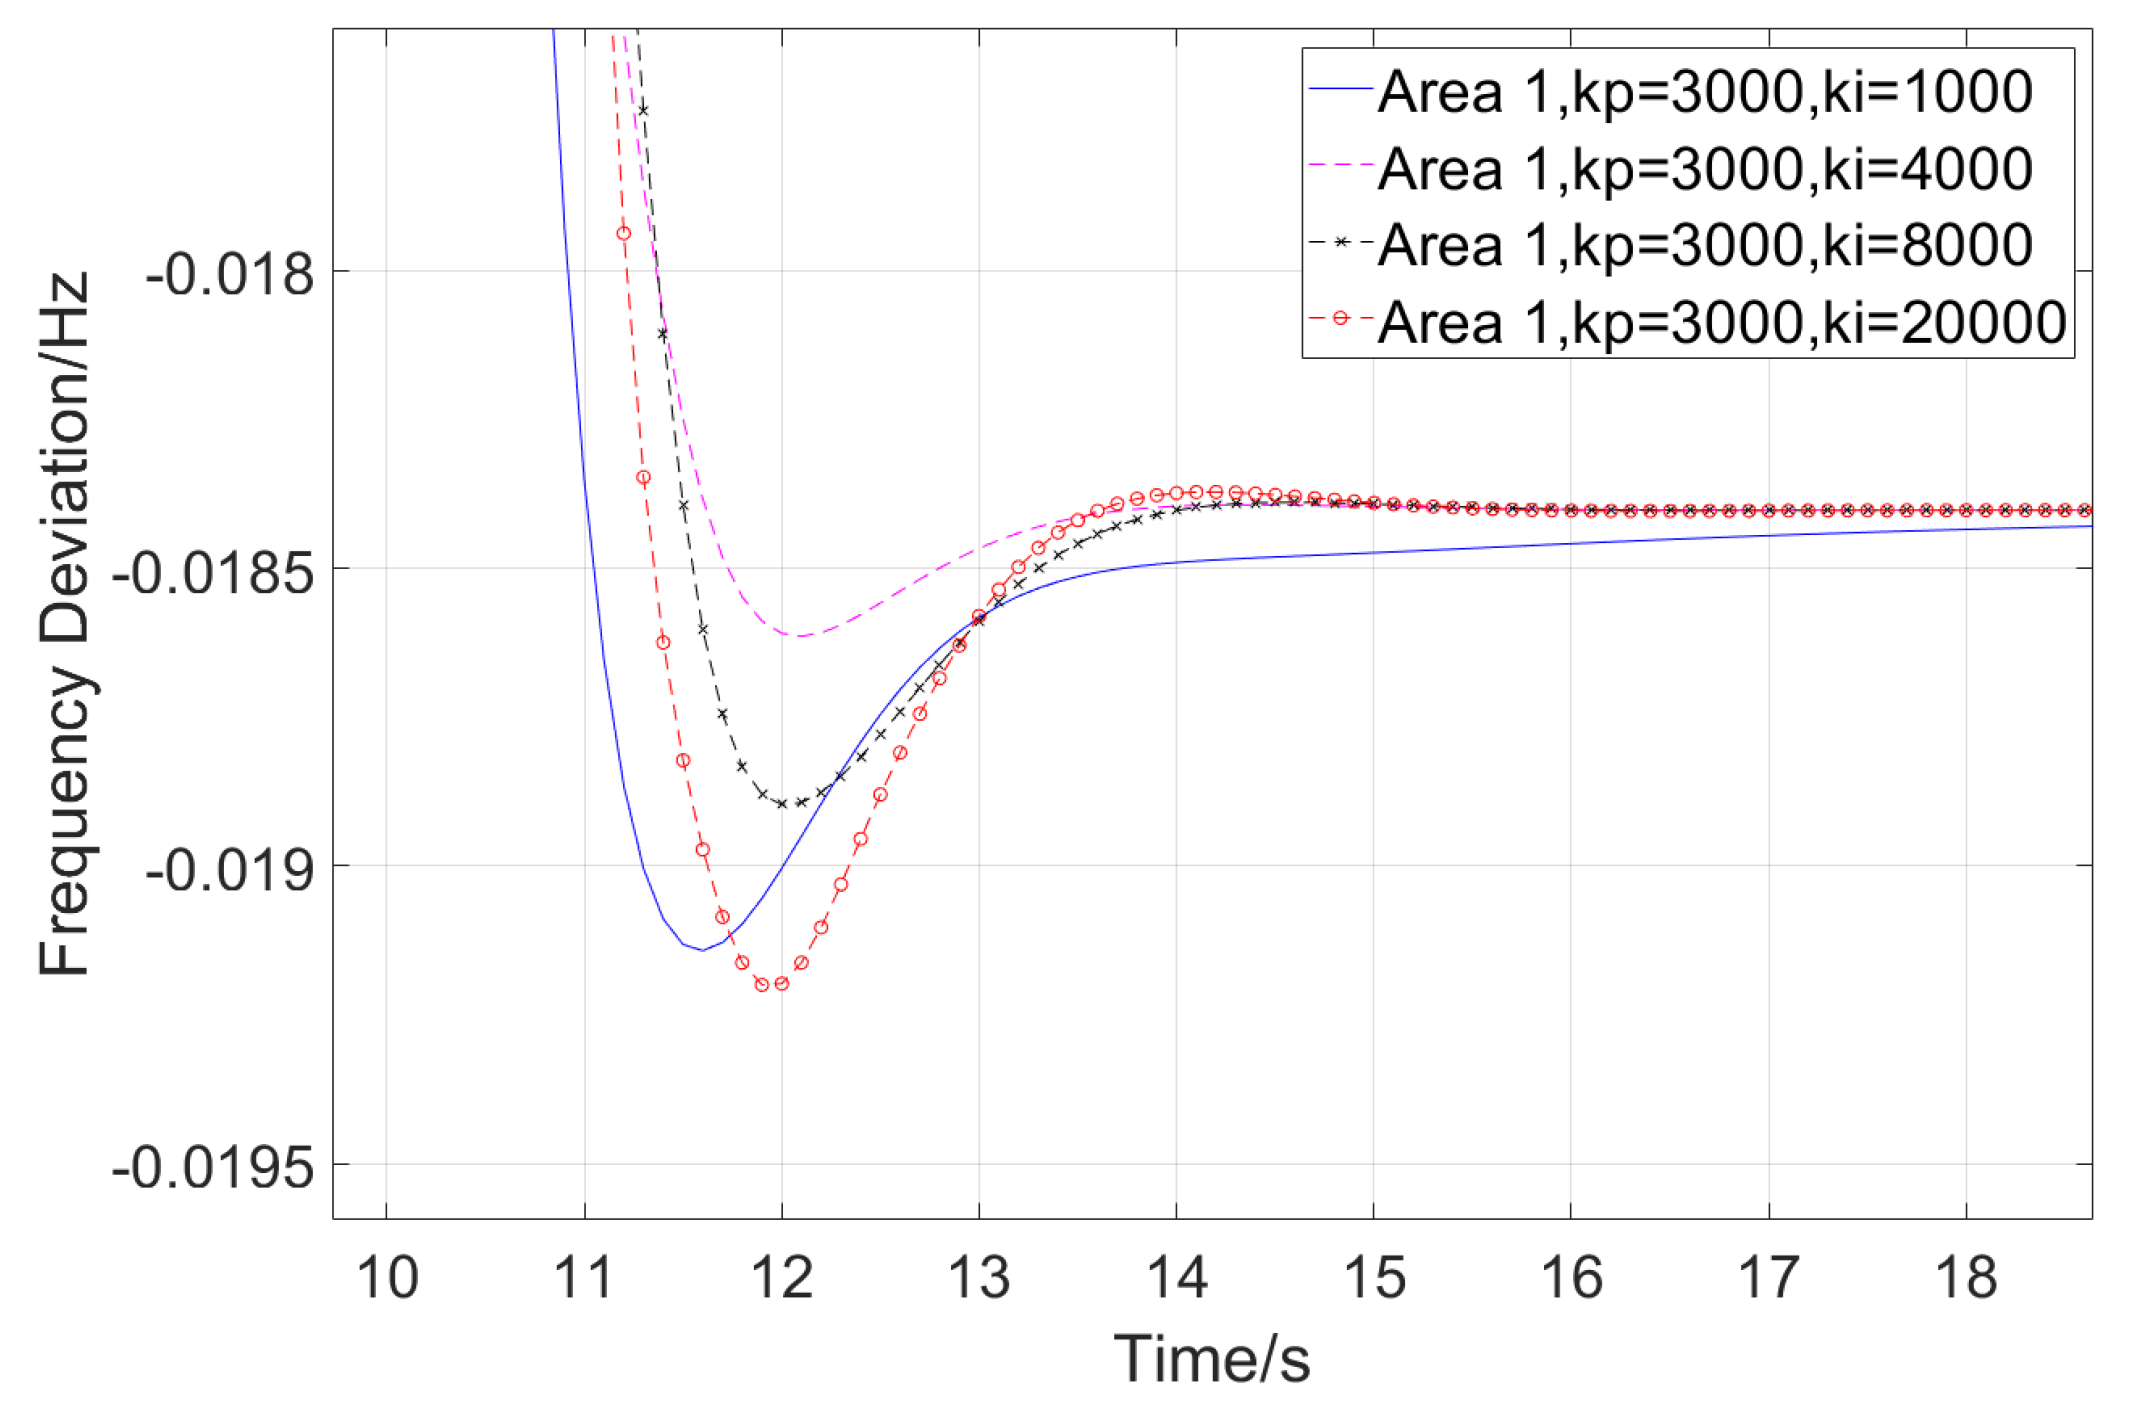
3.2. Optimization of Control Parameters for HVDC Frequency Controllers
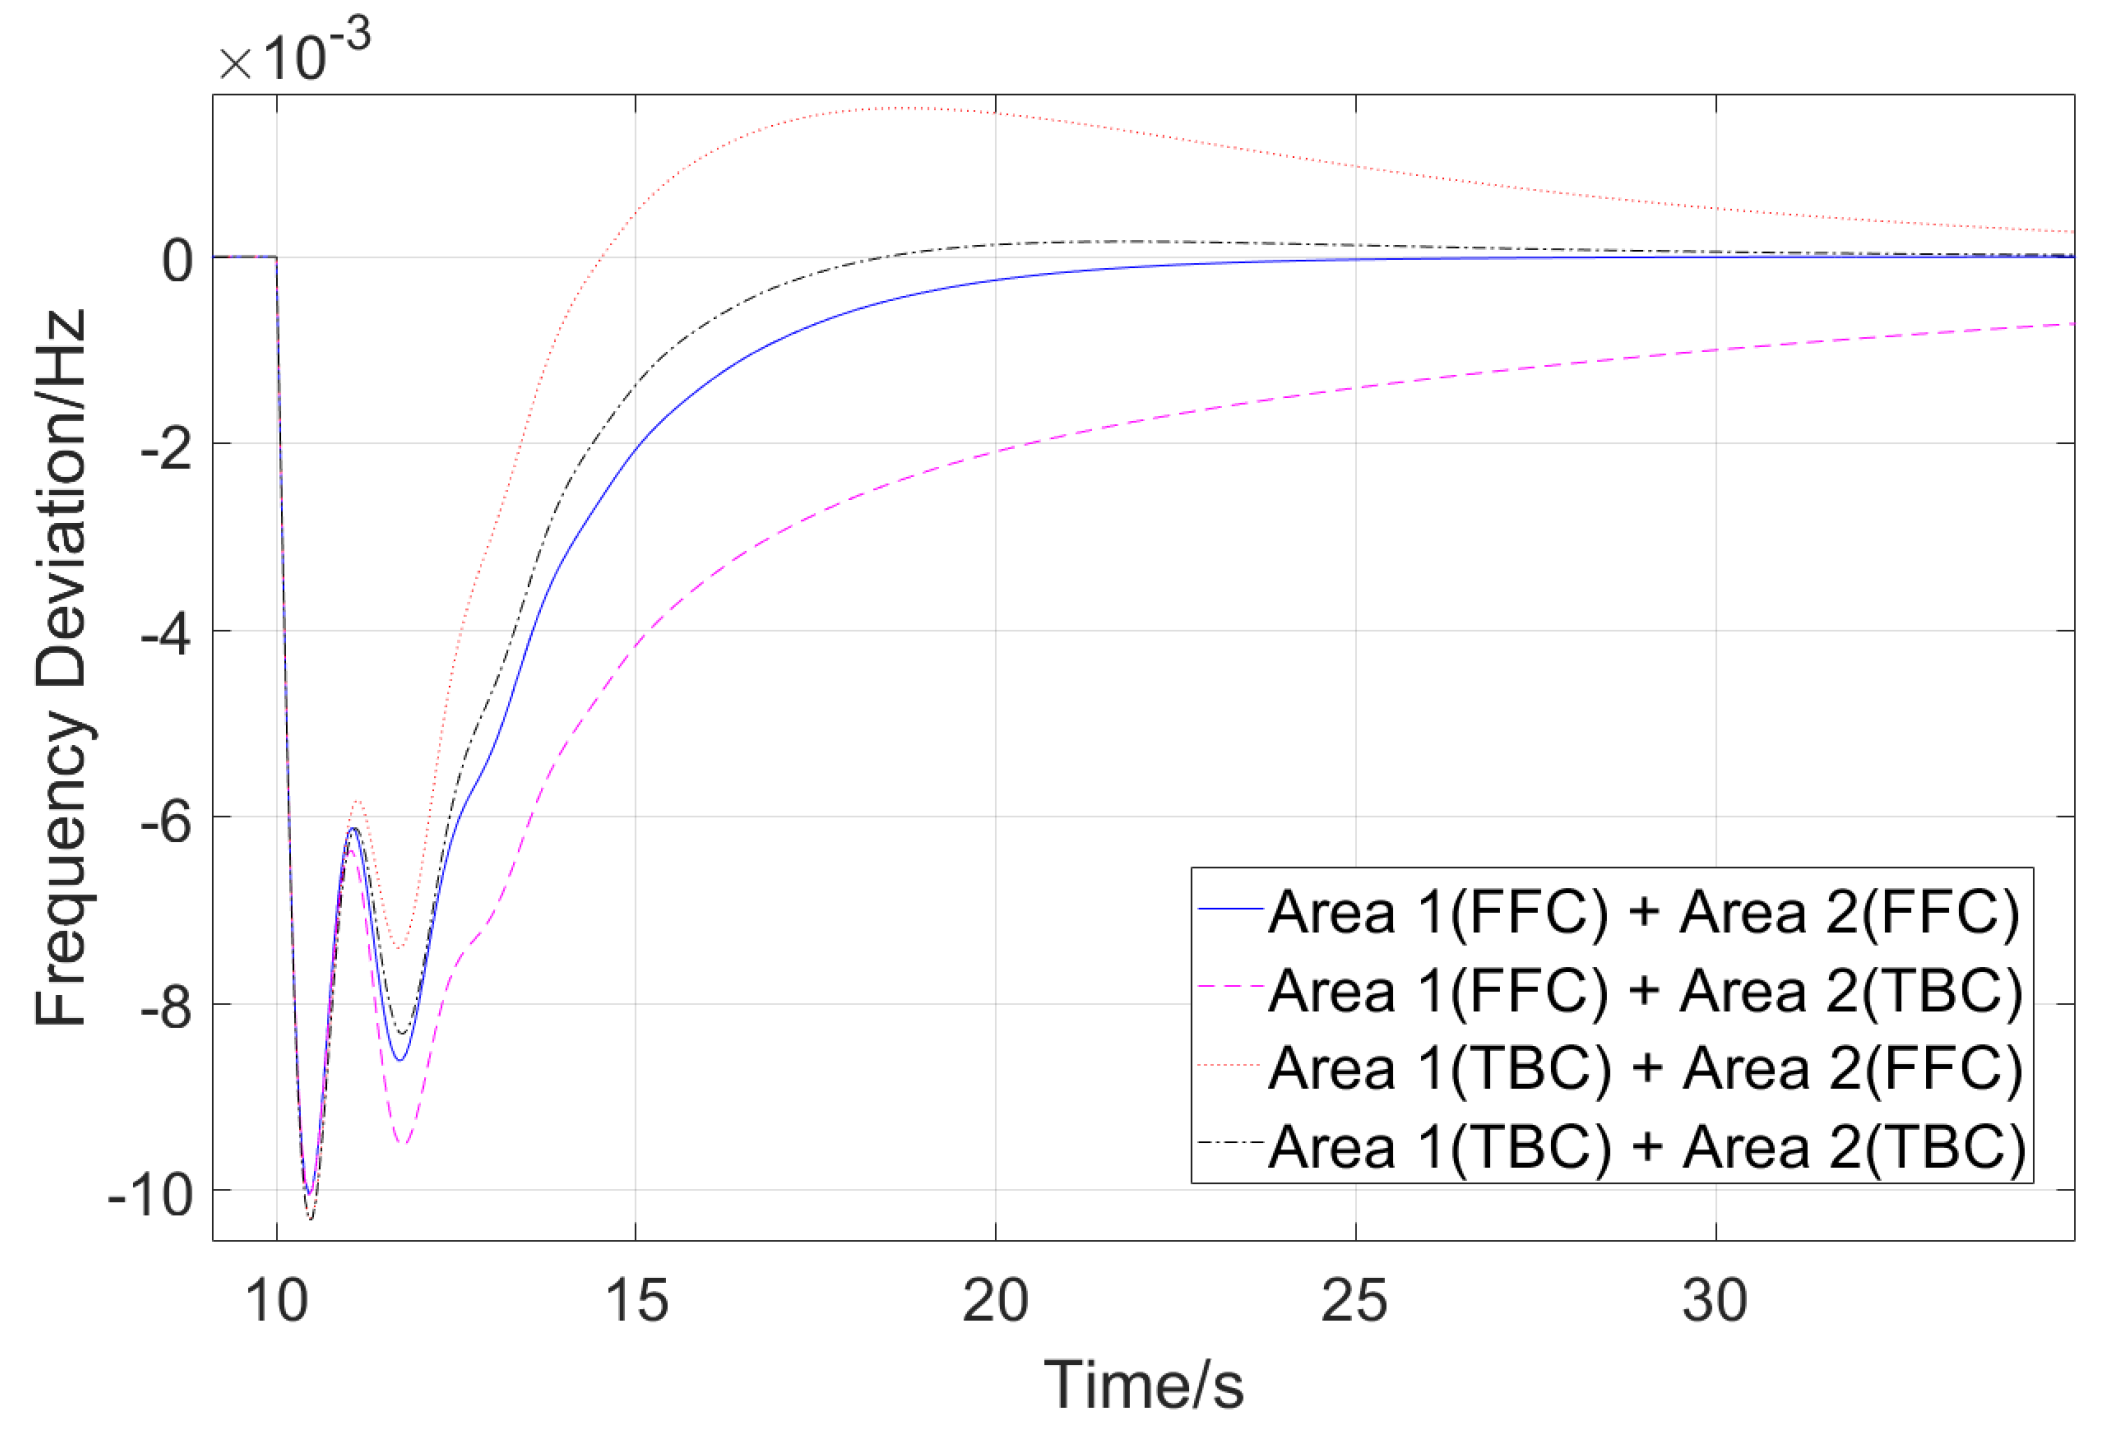
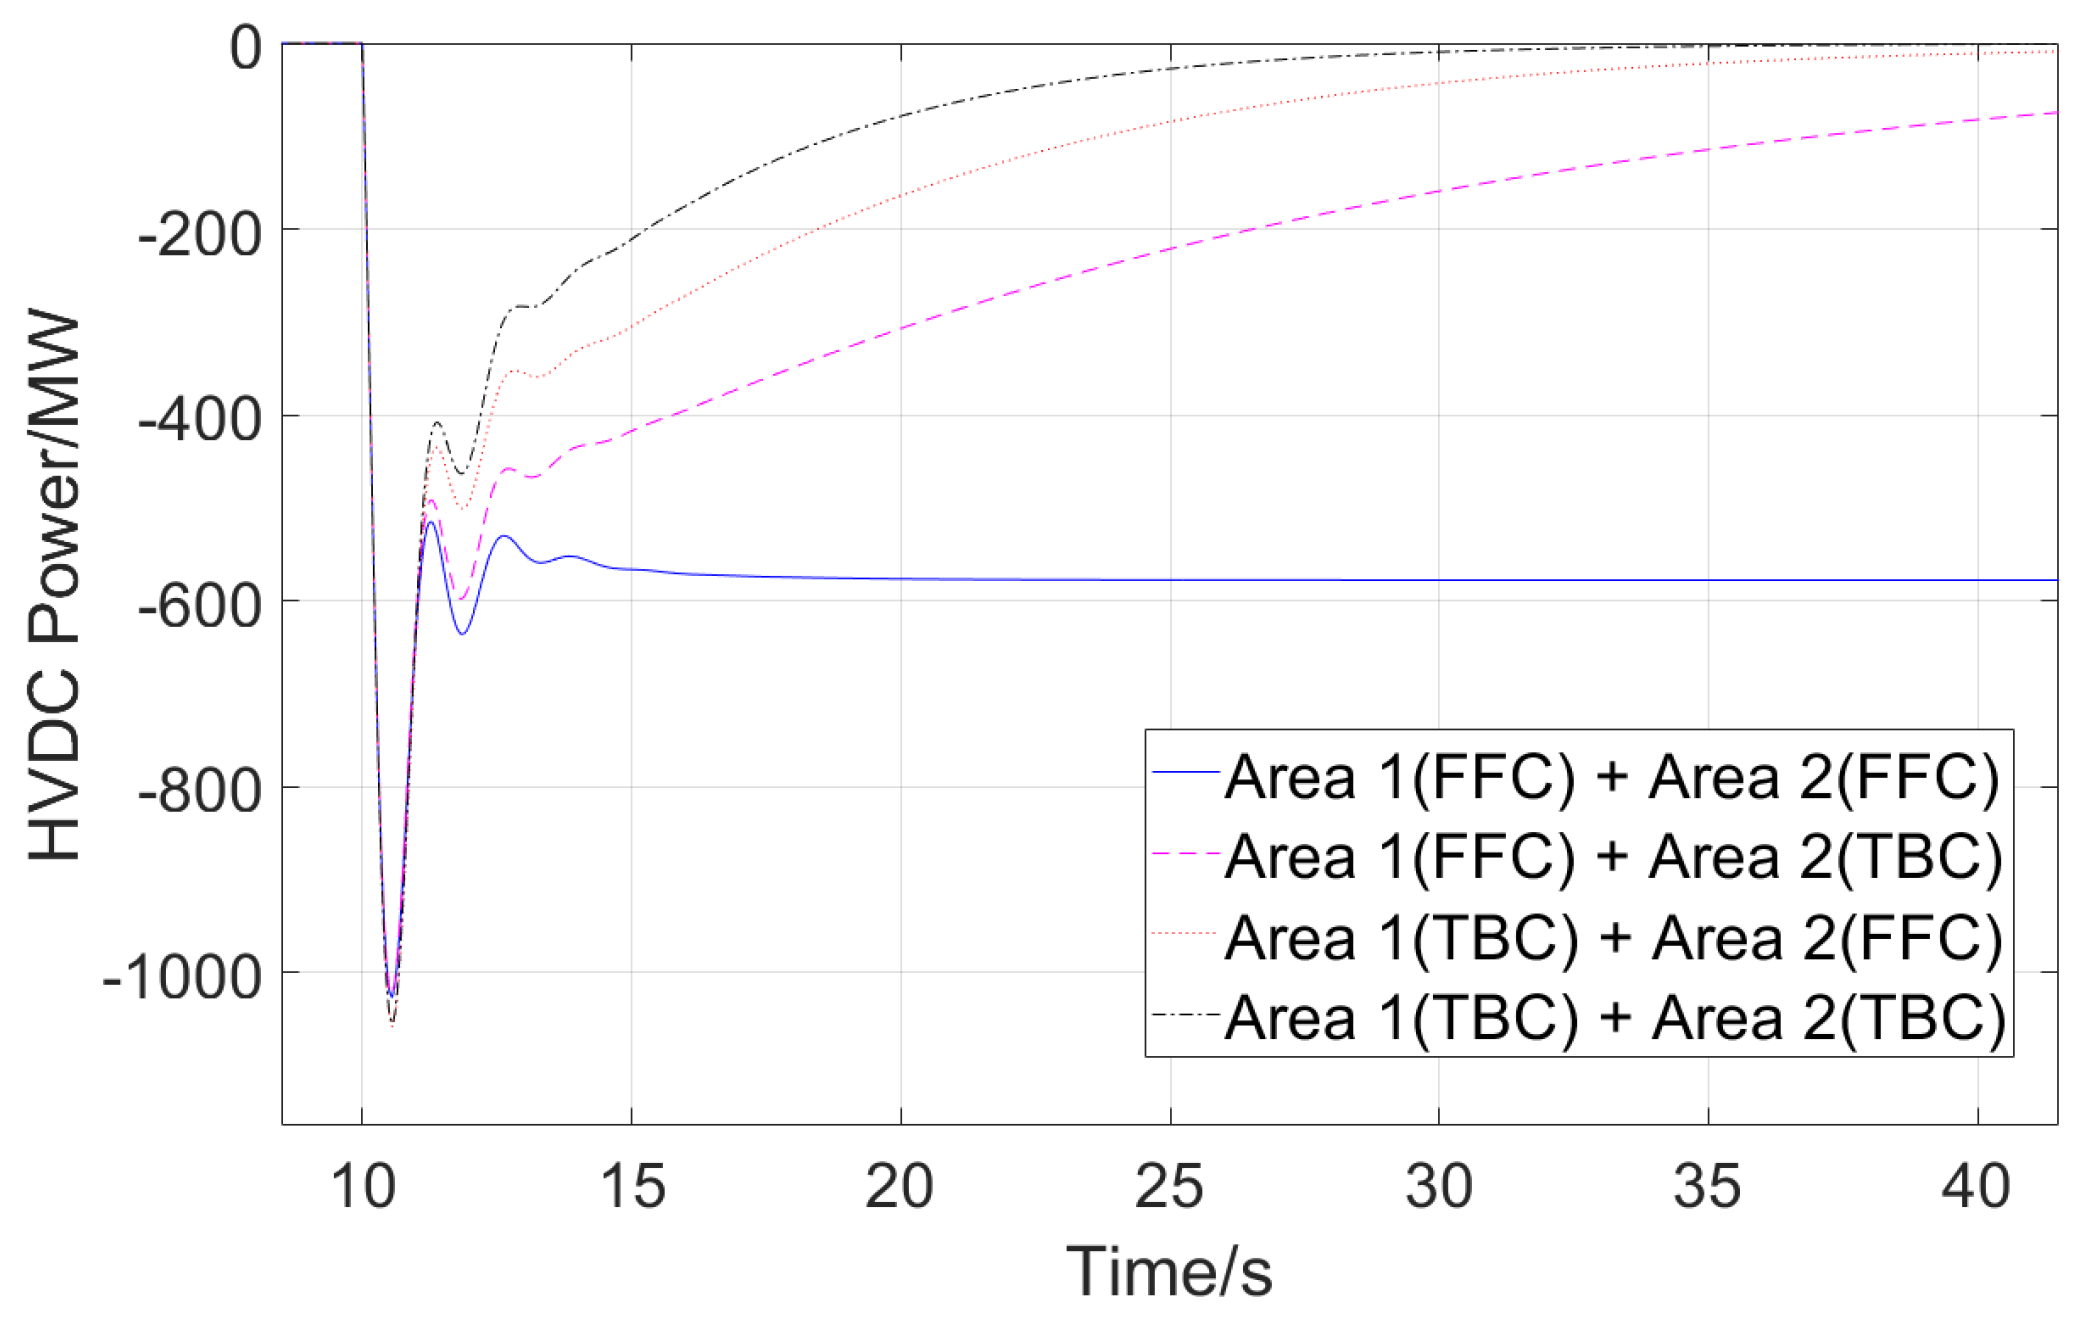
3.3. Analysis of the Adaptability of HVDC Frequency Control with AGC
4. Case Study
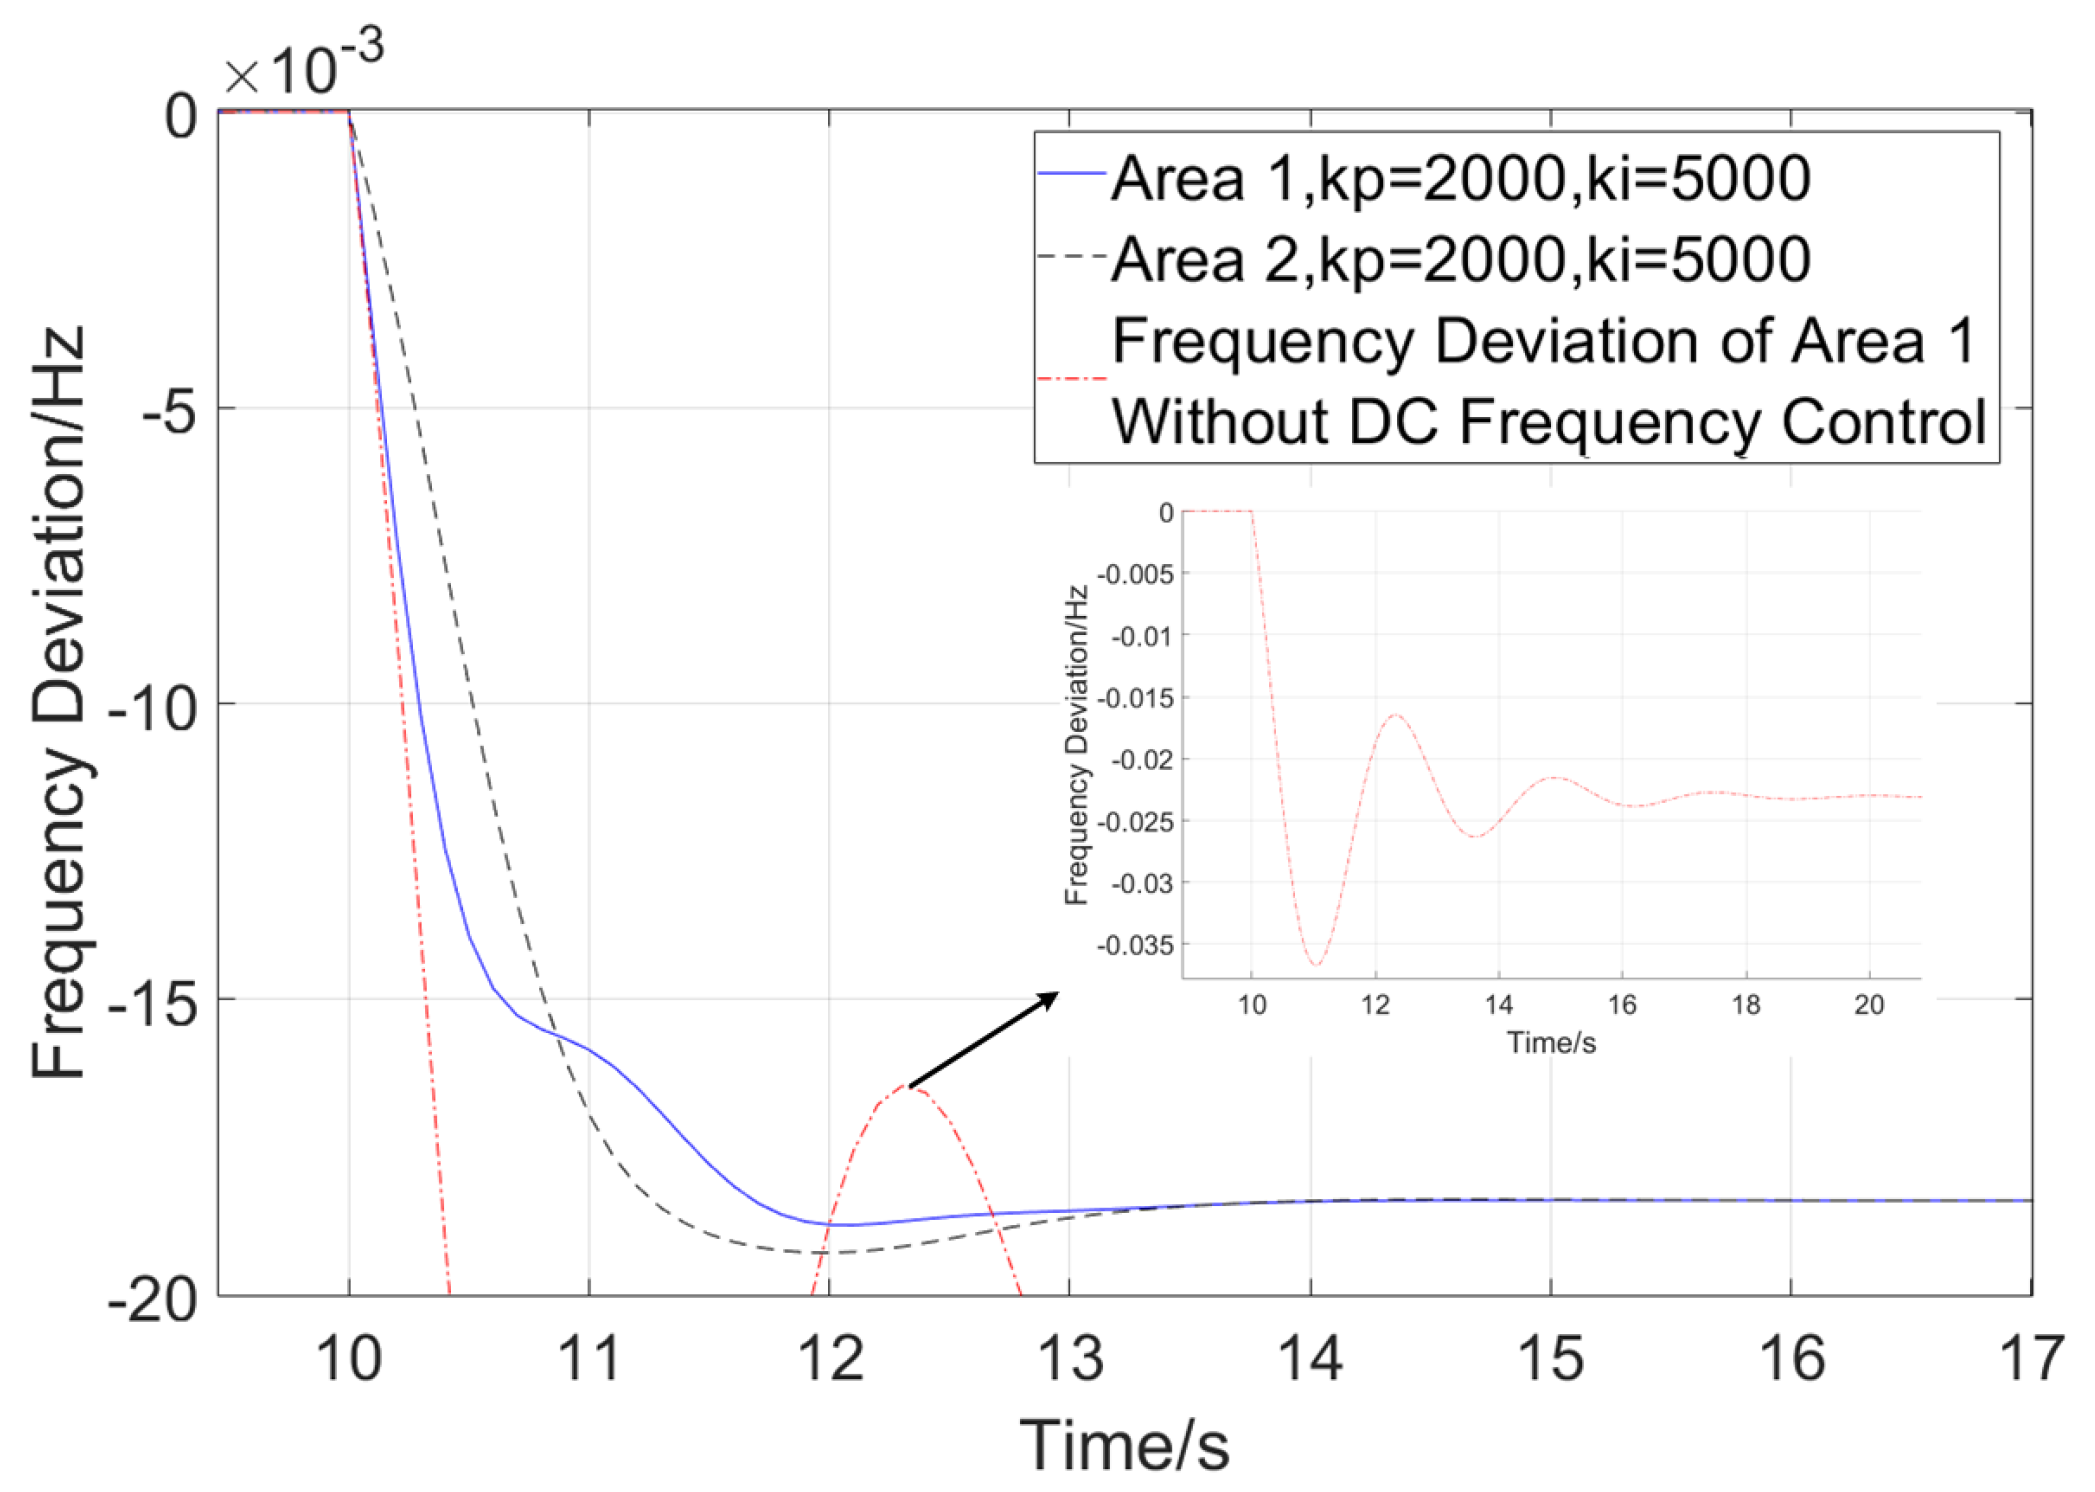
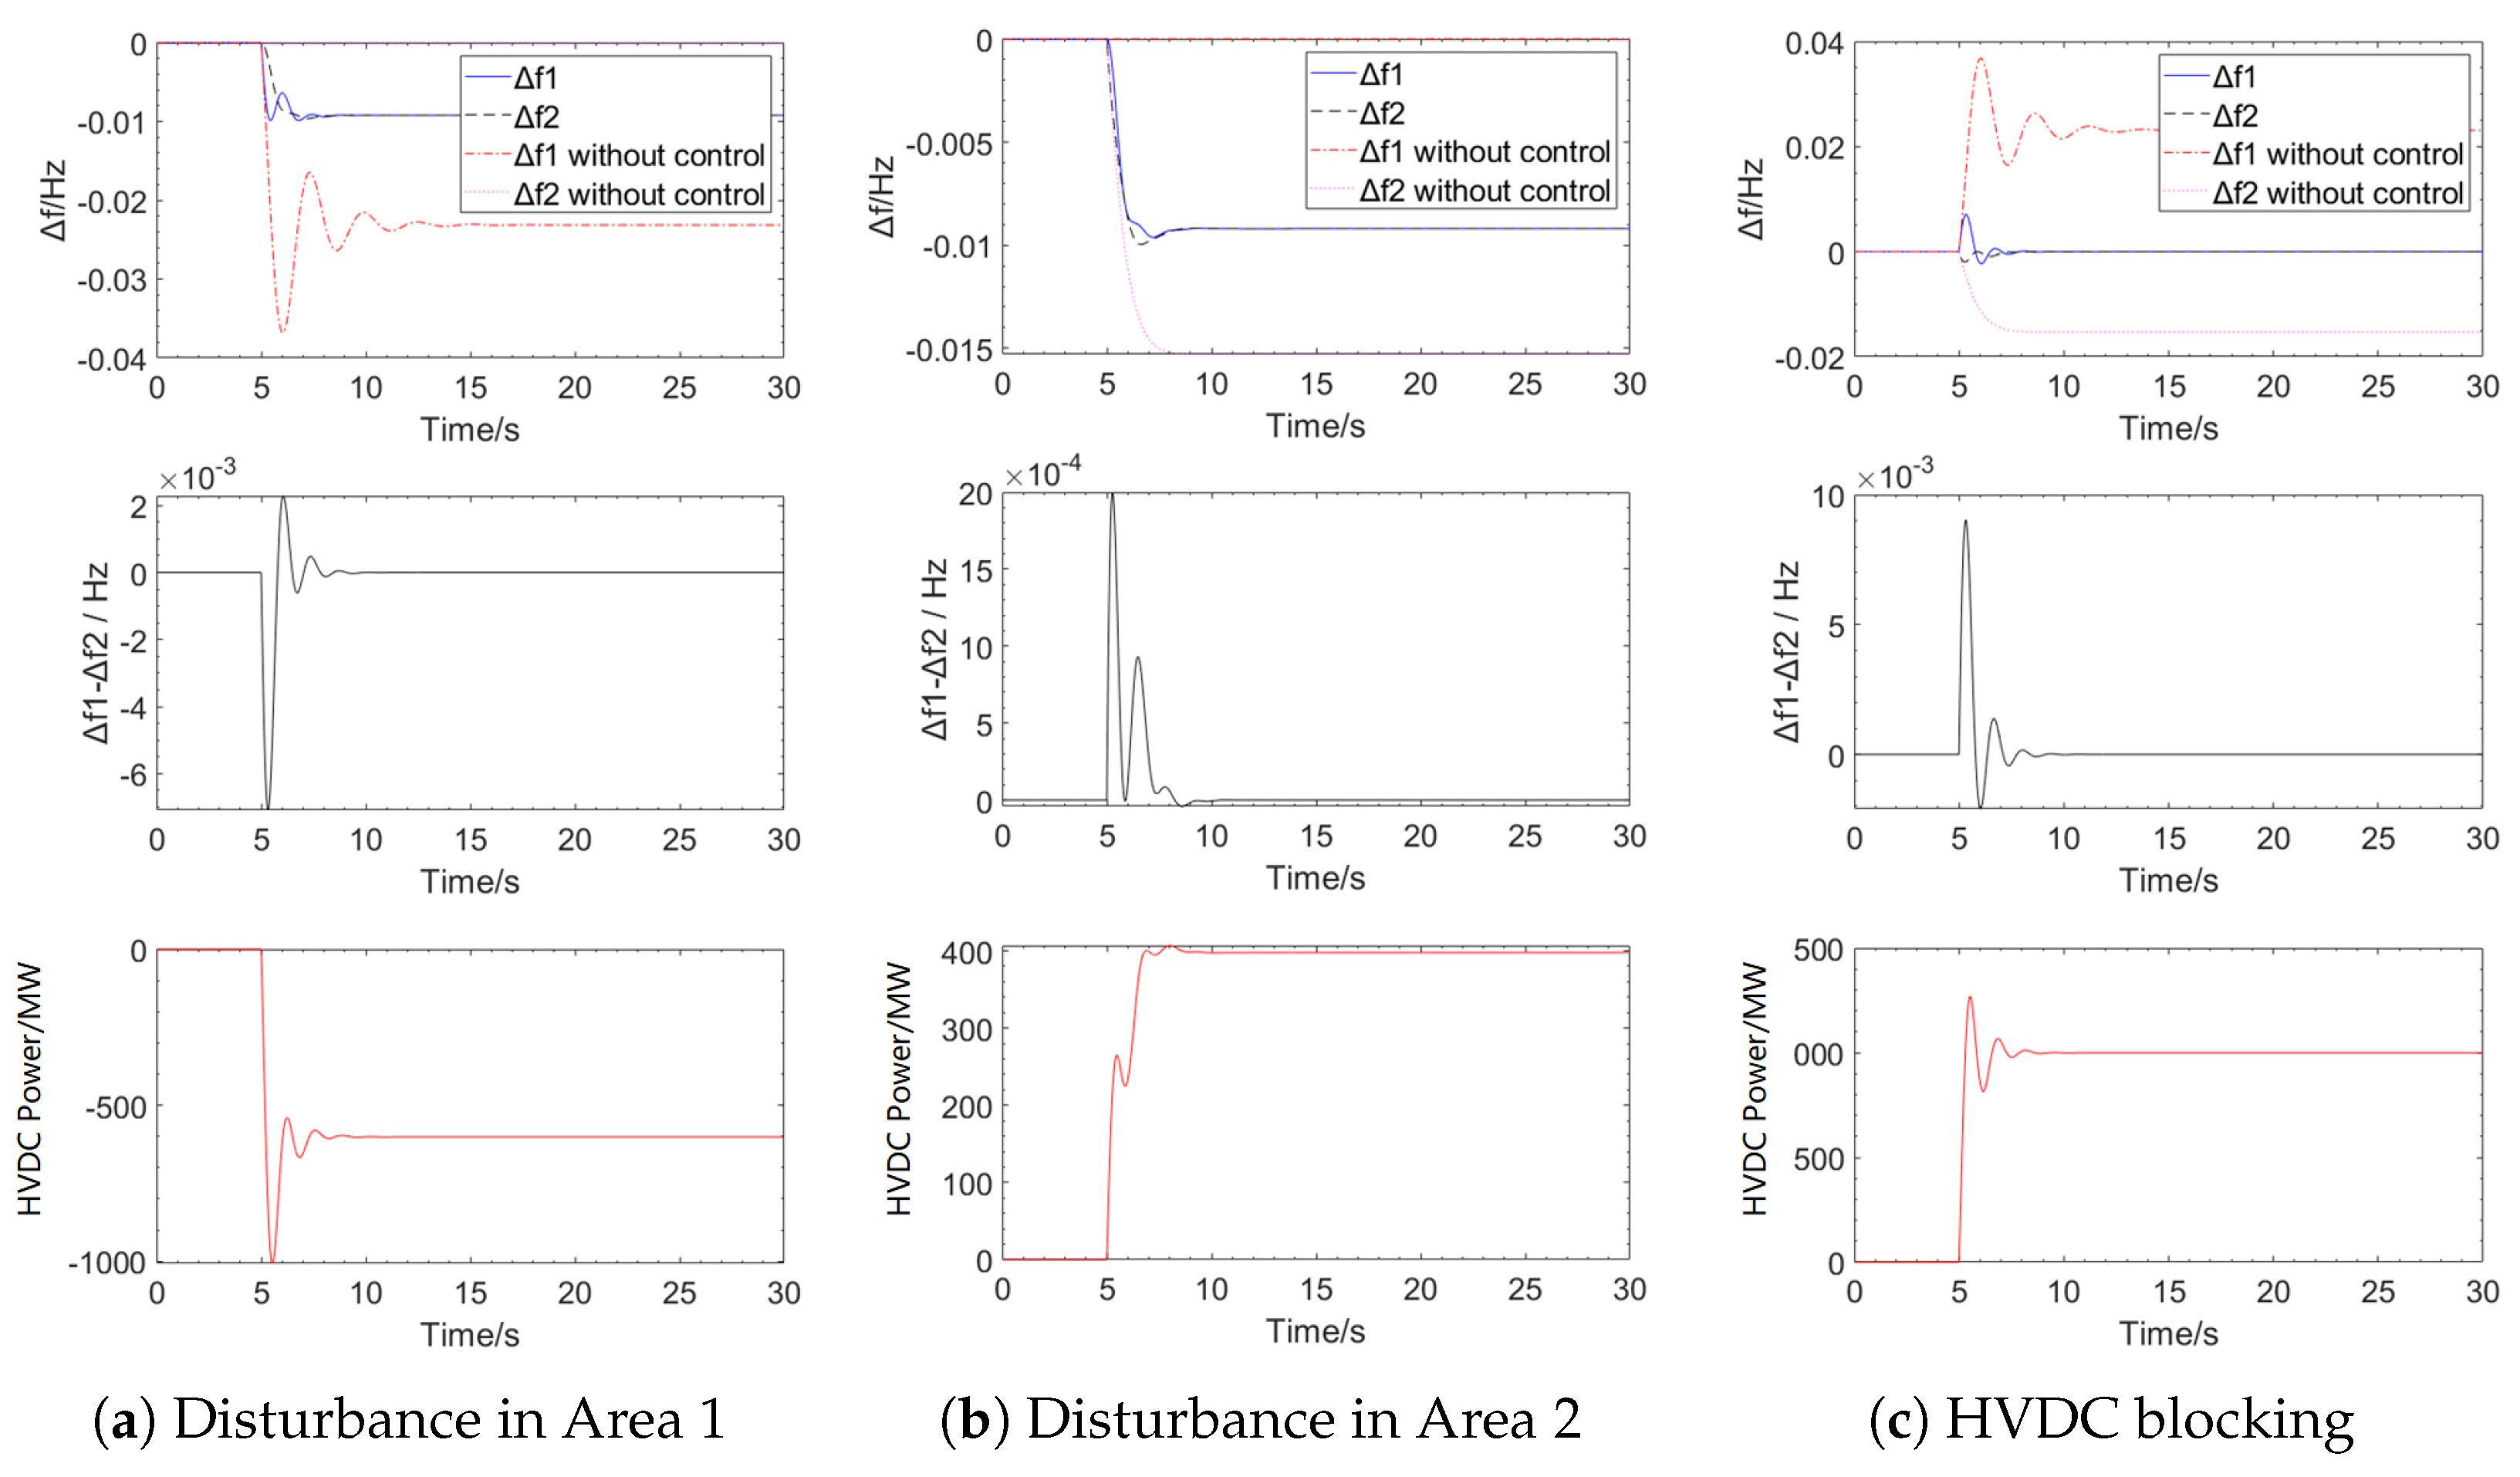
4.1. Case Study of the HVDC Asynchronously Interconnected Two-Area Model Without AGC
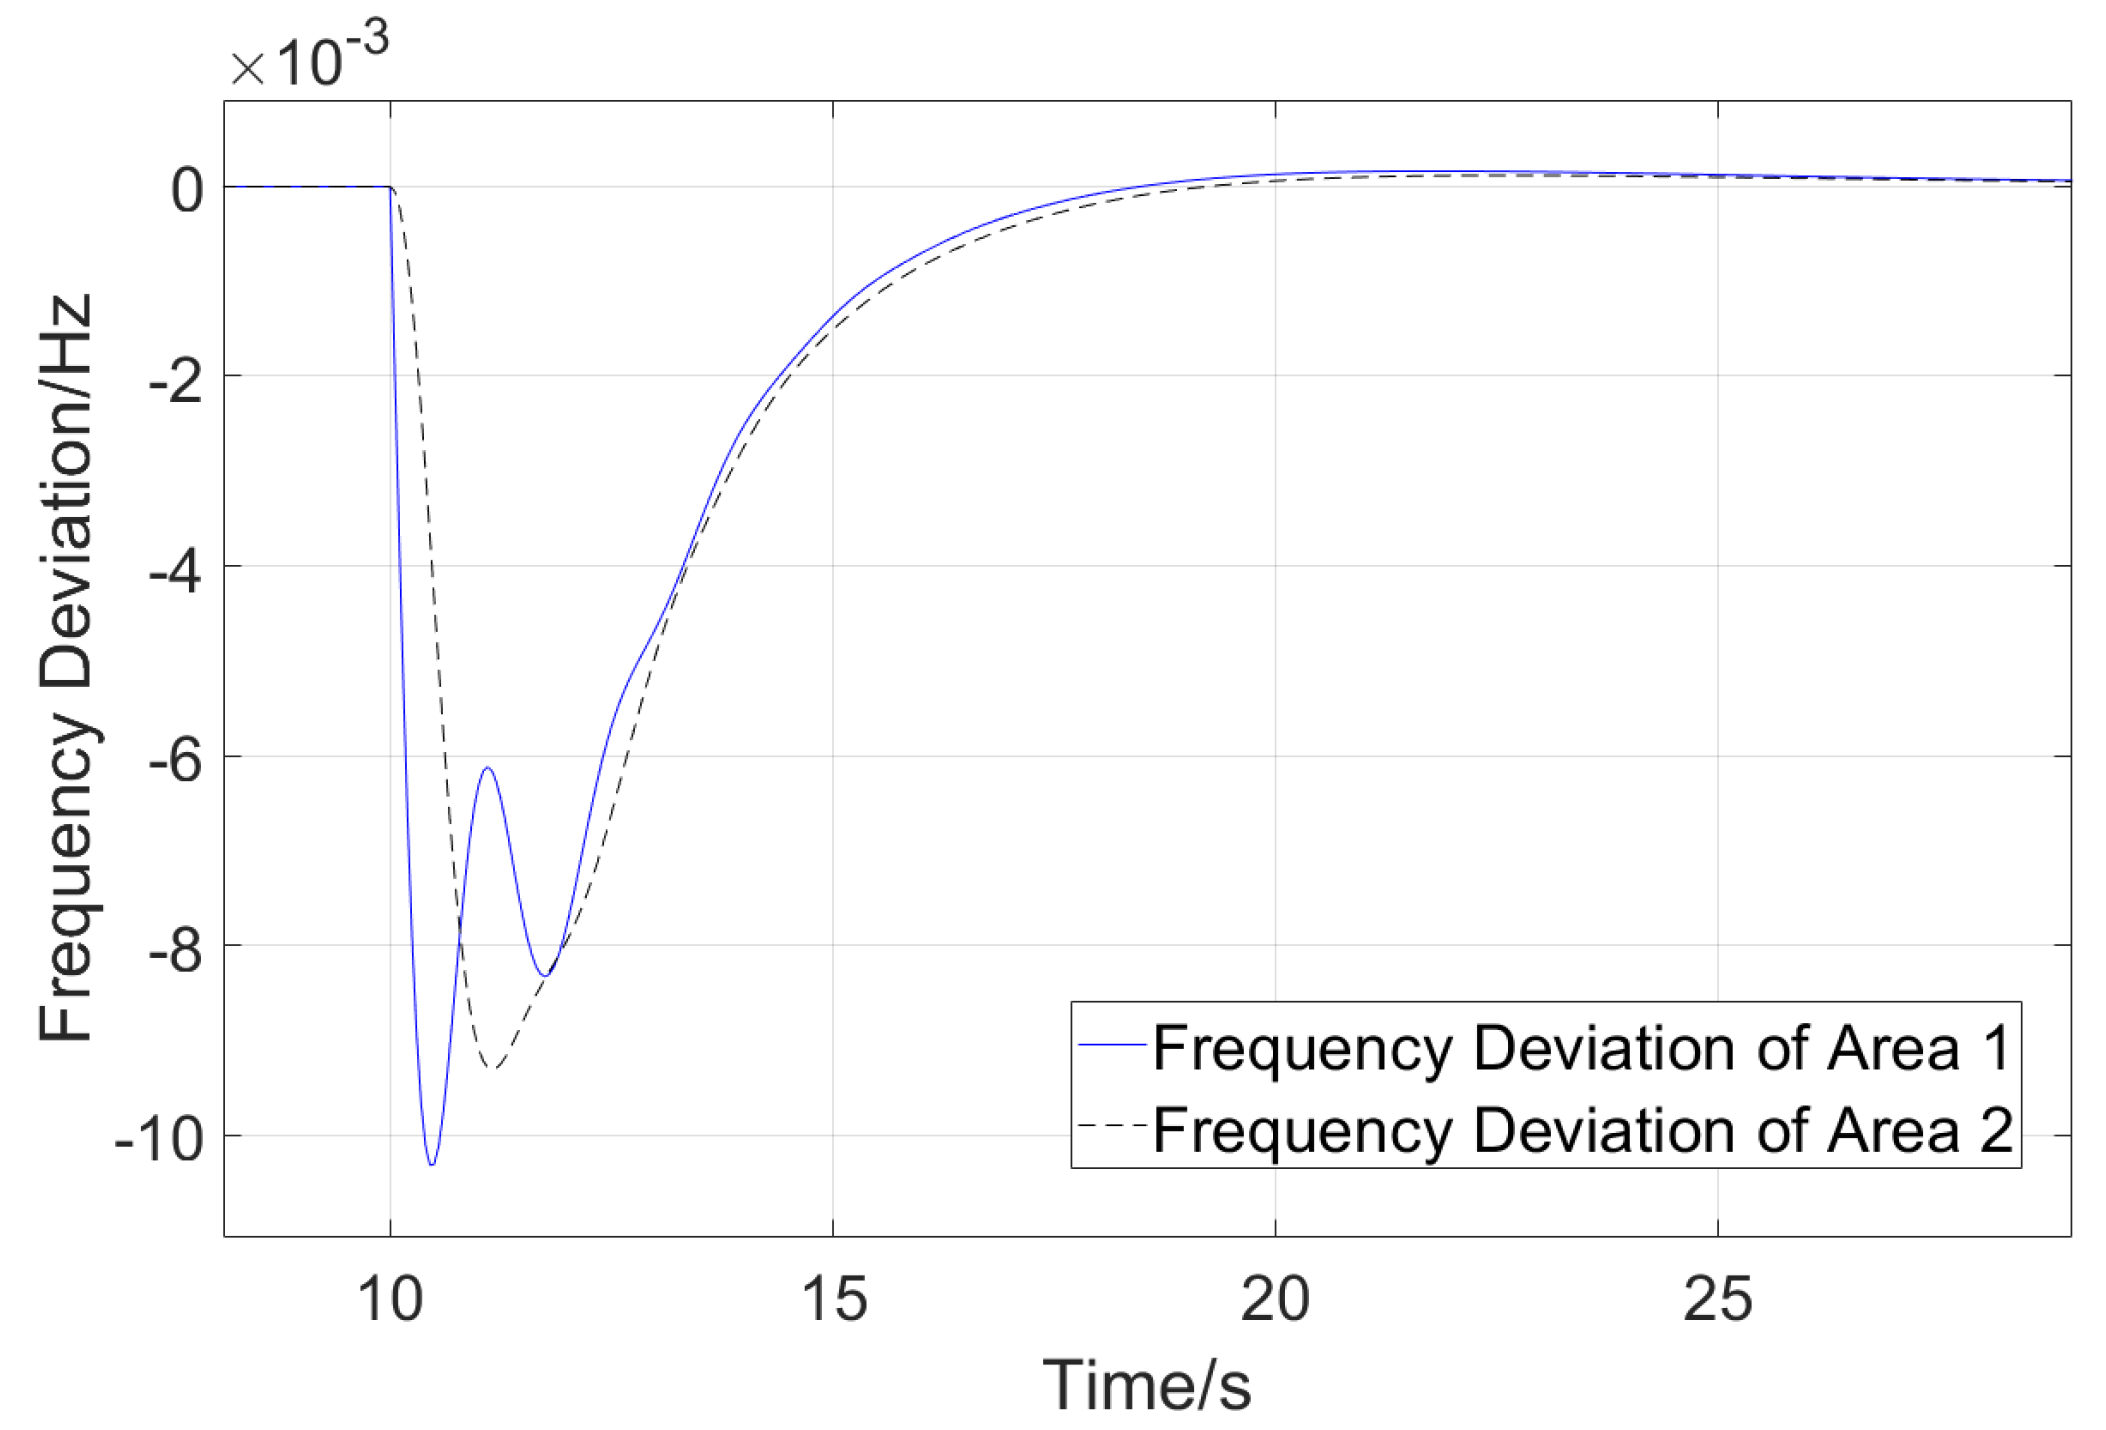
4.2. Case Study of the HVDC Asynchronously Interconnected Two-Area Model with AGC
5. Conclusions
Author Contributions
Funding
Data Availability Statement
Conflicts of Interest
Appendix A. The Detailed Value of the Coefficients of the Closed-Loop Transfer Function
References
- Liang, X.; Abbasipour, M. HVDC transmission and its potential application in remote communities: Current practice and future trend. IEEE Trans. Ind. Appl. 2022, 58, 1706–1719. [Google Scholar] [CrossRef]
- Li, B.; Wang, Z.; Liu, J.; Chao, Z.; Zhang, D.; Wang, Q.; Zhong, J.; Guo, Y. Review of Asynchronous Interconnection Techonology in China Southern Power Grid. In Proceedings of the 2019 IEEE Milan PowerTech, Milan, Italy, 23–27 June 2019; IEEE: Piscataway, NJ, USA, 2019; pp. 1–5. [Google Scholar]
- Shu, Y.; Tang, G.; Pang, H. A back-to-back VSC-HVDC system of Yu-E power transmission lines to improve cross-region capacity. CSEE J. Power Energy Syst. 2019, 6, 64–71. [Google Scholar]
- Zhou, B.; Rao, H.; Wu, W.; Wang, T.; Hong, C.; Huang, D.; Yao, W.; Su, X.; Mao, T. Principle and application of asynchronous operation of China southern power grid. IEEE J. Emerg. Sel. Top. Power Electron. 2018, 6, 1032–1040. [Google Scholar] [CrossRef]
- Sanchez Garciarivas, R.; Rasilla Gonzalez, D.; Navarro, J.A.; Soriano, L.A.; Rubio, J.d.J.; Gomez, M.V.; Garcia, V.; Pacheco, J. VSC-HVDC and its applications for black start restoration processes. Appl. Sci. 2021, 11, 5648. [Google Scholar] [CrossRef]
- Yan, K.; Li, G.; Zhang, R.; Xu, Y.; Jiang, T.; Li, X. Frequency control and optimal operation of low-inertia power systems with HVDC and renewable energy: A review. IEEE Trans. Power Syst. 2023, 39, 4279–4295. [Google Scholar] [CrossRef]
- Obradović, D.; Dijokas, M.; Misyris, G.S.; Weckesser, T.; Van Cutsem, T. Frequency dynamics of the Northern European AC/DC power system: A look-ahead study. IEEE Trans. Power Syst. 2022, 37, 4661–4672. [Google Scholar] [CrossRef]
- Wu, J.; Wang, Z.; Rao, H.; Chen, Y.; Huang, W. A review of control strategies for inertia support in VSC-HVDC system. In Proceedings of the 2019 4th IEEE Workshop on the Electronic Grid (eGRID), Xiamen, China, 11–14 November 2019; IEEE: Piscataway, NJ, USA, 2019; pp. 1–6. [Google Scholar]
- Li, H.; Zhao, C.; Wang, Z. Frequency control strategy for sending-end of hybrid cascaded UHVDC system with large-scale wind power access. Energy Rep. 2022, 8, 494–504. [Google Scholar] [CrossRef]
- Wang, Y.; Zhu, J.; Zeng, Q.; Zheng, Z.; Yu, G.; Yin, A. Frequency coordinated control strategy for an HVDC sending-end system with wind power integration based on fuzzy logic control. Energies 2021, 14, 6095. [Google Scholar] [CrossRef]
- Wei, P.; Chai, B.; Shi, L.; Shi, Q.; Liu, R.; Wang, Y.; Liu, K. RPC-based frequency control strategy of LCC-HVDC sending end power system with renewable energy. Front. Energy Res. 2022, 10, 1037825. [Google Scholar] [CrossRef]
- Shi, Q.; Liu, H.; Liu, K.; Wang, Y.; Zhang, Q.; Lu, Y.; Li, H.; Zou, Q. Coordinated sending-end power system frequency regulation via UHVDC. Electronics 2021, 10, 1909. [Google Scholar] [CrossRef]
- Rao, H.; Wu, W.; Mao, T.; Zhou, B.; Hong, C.; Liu, Y.; Wu, X. Frequency control at the power sending side for HVDC asynchronous interconnections between Yunnan power grid and the rest of CSG. CSEE J. Power Energy Syst. 2020, 7, 105–113. [Google Scholar]
- Ai, Q.; Liu, T.; Yin, Y.; Tao, Y. Frequency coordinated control strategy of HVDC sending system with wind power based on situation awareness. IET Gener. Transm. Distrib. 2020, 14, 3179–3186. [Google Scholar] [CrossRef]
- Zhao, J.; Zhu, Y.; Tang, J. Transient voltage and transient frequency stability emergency coordinated control strategy for the multi-infeed HVDC power grid. In Proceedings of the 2020 IEEE Power & Energy Society General Meeting (PESGM), Montreal, QC, Canada, 2–6 August 2020; IEEE: Piscataway, NJ, USA, 2020; pp. 1–5. [Google Scholar]
- Wang, L.; Xie, X.; Peng, L.; Hu, Y.; Zhao, Y. Real-time optimisation of emergency demand response and HVDC power modulation to improve short-term frequency stability of the receiving-end power systems. J. Eng. 2019, 2019, 1952–1957. [Google Scholar] [CrossRef]
- Li, B.; Liu, T.; Xu, W.; Li, Q.; Zhang, Y.; Li, Y.; Li, X.Y. Research on technical requirements of line-commutated converter-based high-voltage direct current participating in receiving end AC system’s black start. IET Gener. Transm. Distrib. 2016, 10, 2071–2078. [Google Scholar] [CrossRef]
- Hu, Y.; Wang, X.; Huang, T.; Lei, X.; Wang, T. An optimal frequency control method of asynchronous power grid considering multi-HVDC emergency power support. IEEE Access 2022, 10, 78011–78021. [Google Scholar] [CrossRef]
- Hu, Y.; Lei, X.; Huang, T.; Zhang, Y. Frequency coordinated control for the asynchronous interconnected power system with multiple HVDC links. IEEE Access 2022, 10, 108216–108225. [Google Scholar] [CrossRef]
- Liu, Y.; Song, Y.; Wang, Z.; Shen, C. Optimal emergency frequency control based on coordinated droop in multi-infeed hybrid AC-DC system. IEEE Trans. Power Syst. 2021, 36, 3305–3316. [Google Scholar] [CrossRef]
- Du, P.; Li, W. Frequency response impact of integration of HVDC into a low-inertia AC power grid. IEEE Trans. Power Syst. 2020, 36, 613–622. [Google Scholar] [CrossRef]
- Stojković, J.; Lekić, A.; Stefanov, P. Adaptive control of HVDC links for frequency stability enhancement in low-inertia systems. Energies 2020, 13, 6162. [Google Scholar] [CrossRef]
- Castro, L.M.; Acha, E. On the provision of frequency regulation in low inertia AC grids using HVDC systems. IEEE Trans. Smart Grid 2015, 7, 2680–2690. [Google Scholar] [CrossRef]
- Liu, B.; Du, P. Virtual inertia and droop parameters quantitative determination method for VSC-HVDC in receiving-end area power systems with online inertia estimation based. Int. J. Circuit Theory Appl. 2024, 52, 1280–1301. [Google Scholar] [CrossRef]
- Zheng, T.; Chen, L.; Guo, Y.; Wei, W.; Zhou, B.; Sun, X. A VSG-Based Coordinated DC Voltage Control for VSC-HVDC to Participate in Frequency Regulation. Energies 2021, 14, 2712. [Google Scholar] [CrossRef]
- Jiang, H.; Zhou, Y.; Gao, Y.; Gao, S. Droop Frequency Limit Control and Its Parameter Optimization in VSC-HVDC Interconnected Power Grids. Energies 2024, 17, 3851. [Google Scholar] [CrossRef]
- Hoffmann, M.; Chamorro, H.R.; Lotz, M.R.; Maestre, J.M.; Rouzbehi, K.; Gonzalez-Longatt, F.; Kurrat, M.; Alvarado-Barrios, L.; Sood, V.K. Grid Code-Dependent Frequency Control Optimization in Multi-Terminal DC Networks. Energies 2020, 13, 6485. [Google Scholar] [CrossRef]
- Zhu, J.; Shen, Z.; Yu, L.; Bu, S.; Li, X.; Chung, C.Y.; Booth, C.D.; Jia, H.; Wang, C. Bilateral inertia and damping emulation control scheme of VSC-HVDC transmission systems for asynchronous grid interconnections. IEEE Trans. Power Syst. 2022, 38, 4281–4292. [Google Scholar] [CrossRef]
- Zhu, J.; Wang, X.; Zhao, J.; Yu, L.; Li, S.; Li, Y.; Guerrero, J.M.; Wang, C. Inertia emulation and fast frequency-droop control strategy of a point-to-point VSC-HVdc transmission system for asynchronous grid interconnection. IEEE Trans. Power Electron. 2022, 37, 6530–6543. [Google Scholar] [CrossRef]
- Pi, J.; Zhang, K.; Chen, Y.; Liu, C. Modeling and Stability Analysis of HVDC Auxiliary Control for Pseudo-synchronous Operation of Asynchronous Interconnected Systems. Autom. Electr. Power Syst. 2023, 47, 82–92. (In Chinese) [Google Scholar]
- Harnefors, L.; Johansson, N.; Zhang, L. Impact on interarea modes of fast HVDC primary frequency control. IEEE Trans. Power Syst. 2016, 32, 1350–1358. [Google Scholar] [CrossRef]
- Wen, Y.; Chung, C.; Ye, X. Enhancing frequency stability of asynchronous grids interconnected with HVDC links. IEEE Trans. Power Syst. 2017, 33, 1800–1810. [Google Scholar] [CrossRef]
- Kwon, D.H.; Kim, Y.J.; Gomis-Bellmunt, O. Optimal DC voltage and current control of an LCC HVDC system to improve real-time frequency regulation in rectifier-and inverter-side grids. IEEE Trans. Power Syst. 2020, 35, 4539–4553. [Google Scholar] [CrossRef]
- Xie, H.; Su, Y.; Xu, S.; Xu, G.; Luo, H.; Chen, Y.; Peng, G.; Chen, Q.; Yang, R.; Liu, T. Controller Design and Application Based VSC for Frequency Synchronous Operation of Asynchronous Grid of China Southern Power Grid. South. Power Syst. Technol. 2023, 18, 87–94. [Google Scholar]


| Reference | Connection | Considered Grids | Control Method | AGC Adaptability Analysis |
|---|---|---|---|---|
| [25] | VSC-HVDC | Weak grid | VSG + HVDC voltage control | No |
| [12] | UHVDC | Sending end | Droop + virtual inertia control | No |
| [16] | HVDC | Receiving end | Real-time control | No |
| [30] | LCC-HVDC | Both grids | AFC (PI controller) | No |
| This paper | VSC-HVDC | Both grids | Frequency controller (PI controller) | Yes |
| Area | Parameters | Value |
|---|---|---|
| Area 1 | Equivalent inertia /s | 6 |
| Equivalent damping coefficient | 1 | |
| Regulation coefficient | 0.04 | |
| The proportion of power generation of the hydropower unit | 0.712 | |
| Water hammer effect time constant /s | 0.5 | |
| HVDC power coefficient | 0.0174 | |
| Area 2 | Equivalent inertia /s | 6 |
| Equivalent damping coefficient | 1 | |
| Regulation coefficient | 0.05 | |
| The proportion of power generation of the thermal power unit | 0.5385 | |
| Steam volume time constant /s | 0.3 | |
| HVDC power coefficient | 0.0072 |
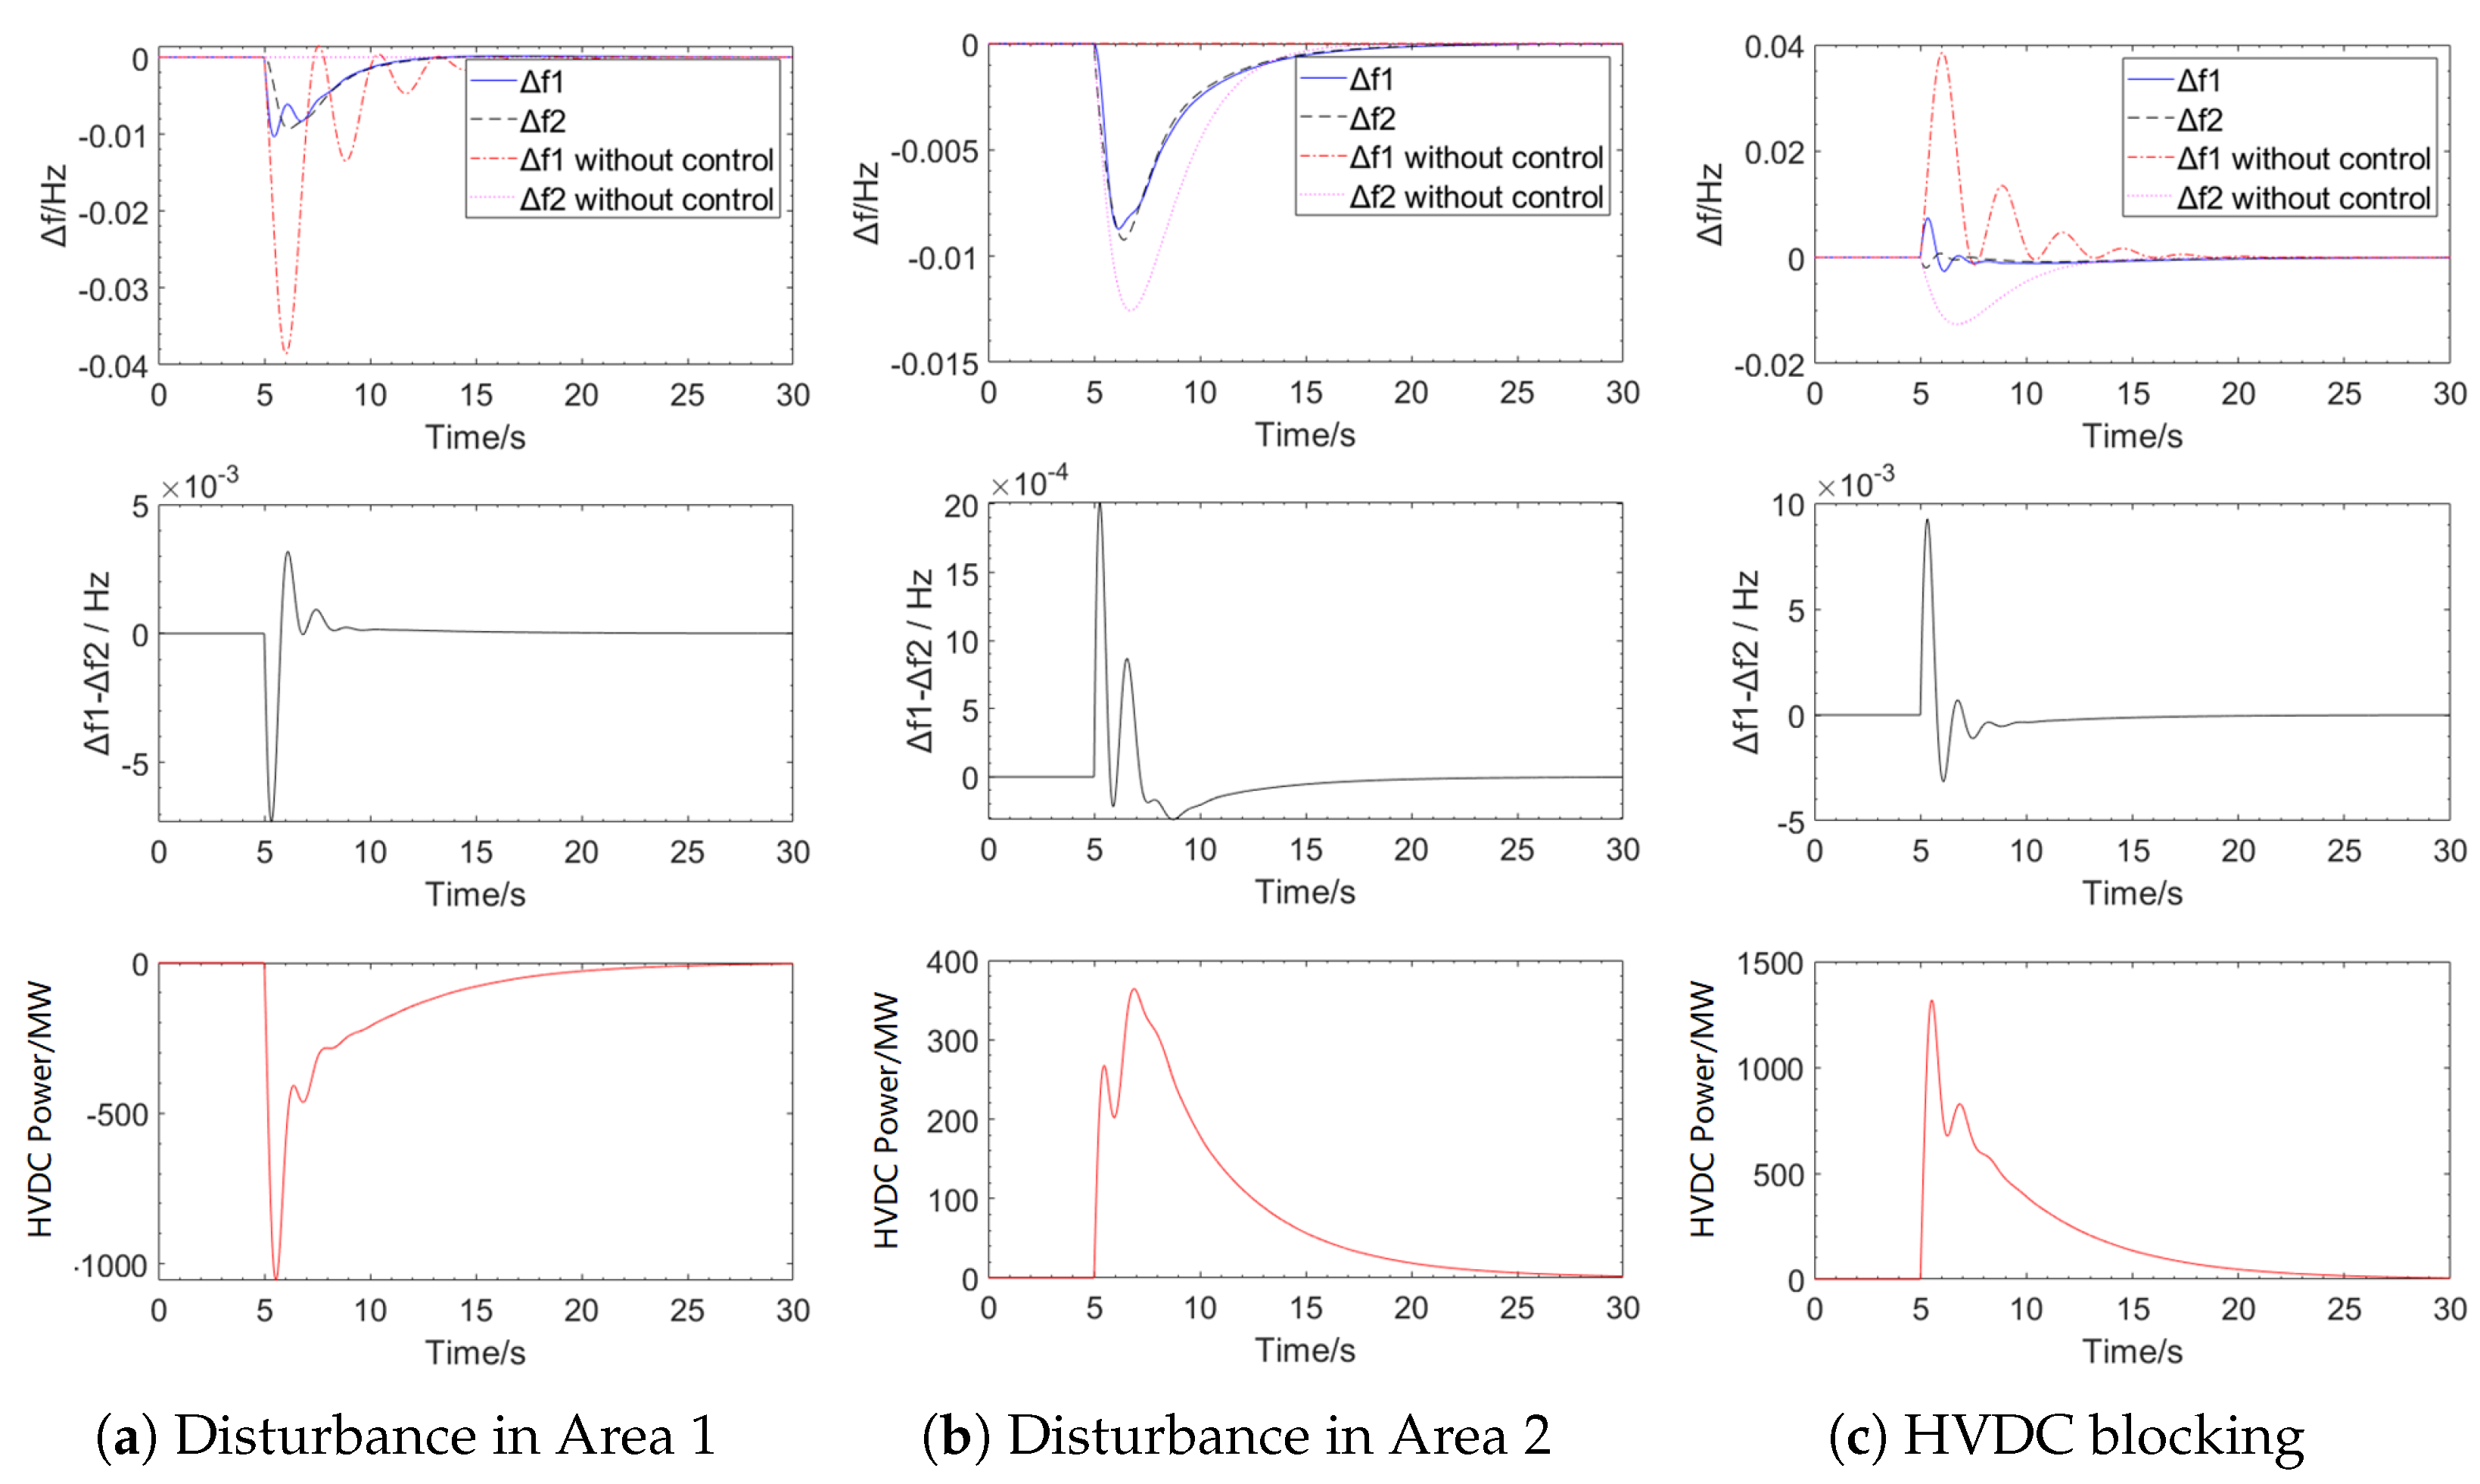
| Disturbance in Area 1 | Disturbance in Area 2 | HVDC Blocking Fault | |
|---|---|---|---|
| The maximum frequency deviation of Area 1/Hz | −0.0099 | −0.0096 | 0.0070 |
| The maximum frequency deviation of Area 1 (without control)/Hz | −0.0368 | / | 0.0368 |
| The maximum frequency deviation of Area 2/Hz | −0.0096 | −0.0100 | −0.0020 |
| The maximum frequency deviation of Area 2 (without control)/Hz | / | −0.0153 | −0.0153 |
| Ts/s | 2.71 | 3.60 | 2.62 |
| Disturbance in Area 1 | Disturbance in Area 2 | HVDC Blocking Fault | |
|---|---|---|---|
| The maximum frequency deviation of Area 1/Hz | −0.0103 | −0.0087 | 0.0074 |
| The maximum frequency deviation of Area 1 (without control)/Hz | −0.0385 | / | 0.0385 |
| The maximum frequency deviation of Area 2/Hz | −0.0093 | −0.0092 | −0.0020 |
| The maximum frequency deviation of Area 2 (without control)/Hz | / | −0.0126 | −0.0126 |
| Ts/s | 5.64 | 11.37 | 8.11 |
Disclaimer/Publisher’s Note: The statements, opinions and data contained in all publications are solely those of the individual author(s) and contributor(s) and not of MDPI and/or the editor(s). MDPI and/or the editor(s) disclaim responsibility for any injury to people or property resulting from any ideas, methods, instructions or products referred to in the content. |
© 2025 by the authors. Licensee MDPI, Basel, Switzerland. This article is an open access article distributed under the terms and conditions of the Creative Commons Attribution (CC BY) license (https://creativecommons.org/licenses/by/4.0/).
Share and Cite
Ye, K.; Yang, R.; Li, W.; Mo, W. Frequency Stability Analysis and Control Parameter Optimization in High-Voltage Direct Current-Asynchronous Power Systems with Automatic Generation Control. Energies 2025, 18, 864. https://doi.org/10.3390/en18040864
Ye K, Yang R, Li W, Mo W. Frequency Stability Analysis and Control Parameter Optimization in High-Voltage Direct Current-Asynchronous Power Systems with Automatic Generation Control. Energies. 2025; 18(4):864. https://doi.org/10.3390/en18040864
Chicago/Turabian StyleYe, Kai, Rongzhao Yang, Wei Li, and Weike Mo. 2025. "Frequency Stability Analysis and Control Parameter Optimization in High-Voltage Direct Current-Asynchronous Power Systems with Automatic Generation Control" Energies 18, no. 4: 864. https://doi.org/10.3390/en18040864
APA StyleYe, K., Yang, R., Li, W., & Mo, W. (2025). Frequency Stability Analysis and Control Parameter Optimization in High-Voltage Direct Current-Asynchronous Power Systems with Automatic Generation Control. Energies, 18(4), 864. https://doi.org/10.3390/en18040864