Article

A Study on the Impact of Energy Diplomacy on China’s Crude Oil Trade

1
China National Petroleum Corporation Economics and Technology Research Institute, Beijing 100724, China
2
School of Energy Resources, China University of Geosciences (Beijing), Beijing 100083, China
*
Author to whom correspondence should be addressed.
Energies 2025, 18(4), 851; https://doi.org/10.3390/en18040851
Submission received: 30 December 2024 / Revised: 4 February 2025 / Accepted: 6 February 2025 / Published: 11 February 2025
(This article belongs to the Section C: Energy Economics and Policy)

Abstract

:
Based on the information of China’s bilateral energy diplomacy with 43 countries from 2000 to 2023, this study analyzes the impact of different diplomatic forms on China’s crude oil trade. A fixed-effects model is reconstructed to analyze the impact of various aspects of energy diplomacy on China’s crude oil trade based on panel data. These aspects include diplomacy frequency, frequency of visits, first or regular visits by heads of state, changes in diplomatic relationship levels, whether oil or energy is involved in joint public statements, and the nature of diplomacy (bilateral or multilateral). This study provides a reference for strategic decision-making in China’s energy diplomacy and indicates that frequent meetings of heads of state and proactive “going out” strategies in energy diplomacy significantly promote crude oil trade cooperation between two countries and ensure national energy security. Bilateral energy diplomacy is more effective in fostering crude oil trade cooperation with resource countries compared to multilateral diplomacy, with particularly notable effects in neighboring countries and those that belong to the Belt and Road Initiative (BRI). The Chinese government could increase the frequency of energy diplomacy, appropriately increase the frequency of overseas visits, and be more proactive in “going out” for energy diplomacy. There should be a greater focus on bilateral energy diplomacy with key resource countries, including neighboring countries such as Russia and Kazakhstan, as well as BRI countries such as Saudi Arabia, Iraq, the UAE, and Indonesia. It is also crucial to enhance the discourse power and influence of China in the global energy governance system. If the outcome documents of diplomatic activities involve crude oil or energy cooperation, they may invite competition from other resource countries or intervention from external forces. It is recommended that the principle of “do more, say less” is upheld. Any sensitive or controversial topics that would cause external interferences should be avoided, and not be included or actively mentioned. Based on practical cooperation with potential partner countries, the entire industry chain of energy investment, trade, technical services, and engineering equipment will be strengthened.

1. Introduction

With the continuous growth in energy demand, energy security has already become an important research topic for the national economy and social development of many countries [1,2]. As the country with the largest global energy demand and import volume, China’s dependence on foreign countries for oil has remained at a high level of over 70% since 2019. Changes in factors such as geopolitics, the macroeconomic situation, the international market, the security situation, the foreign cooperation policies of resource countries, and global energy governance exert a huge impact on the country’s foreign investment, trade, and cooperation in the crude oil industry, as well as its energy security [1,3]. Numerous authors believe that energy diplomacy is an important part of the political and economic interactions among countries [2,4,5,6,7,8]. Although the world is reducing its dependence on fossil energy in response to climate change, the interaction between geopolitical factors and international energy trade, especially crude oil trade, is still continuously developing.
At present, the world’s centennial changes are accelerating, the international energy market turbulence is intensifying, and the energy trade pattern is undergoing a historic restructuring. As an important component of China’s diplomatic strategy, energy diplomacy not only concerns national energy security but also directly affects the balance and stability of China’s energy trade. The study of the relationship and impact between energy diplomacy and international crude oil trade is of great significance for understanding the evolution of the global energy market, predicting future development trends, and formulating relevant energy policies. Current studies mainly focus on the impact of geopolitical conflicts, political factors, overseas institutions, and diplomatic activities faced by a certain country on international trade [9], energy diplomacy in various evolutionary stages of global politics, economy, and energy [8,10], or the energy trade security of a certain country under bilateral political diplomacy [2]. However, the characteristics of the energy trade international cooperation of target countries throughout history have not been comprehensively and systematically studied. Moreover, there is no systematic quantitative study on the impact of multilateral and bilateral high-level association in the energy sector on a country’s crude oil foreign trade cooperation, especially for China as a major energy importing country. Therefore, the purpose of this study is to explore the impact of different diplomatic forms on China’s crude oil trade in the past 20 years, build a systematic and complete dataset of energy diplomatic visits between China and 43 other countries, establish a quantitative model of “energy diplomacy–crude oil trade”, and present an in-depth discussion on the impacts of factors such as the frequency of high-level visits, the upgrading of the level of energy diplomacy, and the types of visits on China’s crude oil trade, thus providing a reference for strategic decision-making in the country’s energy diplomacy and energy trade.

2. An Overview of the Impact of Diplomatic Activities on Energy Trade Cooperation

Currently, studies on the impact of energy diplomacy on international energy cooperation can be divided into several main categories (Table 1). The first category is political factors that could affect international trade, such as political pressure [11], political motives [12], political separatism [13], intervention from relevant government departments [14], and political conflicts [15]. Previous studies have shown that good political relations will have a beneficial impact on international trade. The second category is the impact of overseas institutions on international trade, including overseas embassies [13,16,17,18,19], consulates [20,21,22], overseas trade promotion institutions, and overseas cultural institutions [23,24]. Previous studies indicated that overseas embassies and consulates can promote trade growth at the levels of developing countries and enterprises. Overseas embassies and consulates had little impact on Organization for Economic Co-operation and Development (OECD) countries. The third category is the impact of diplomatic activities on international trade. Numerous authors have drawn quite different conclusions based on data and materials such as the existence of diplomatic relations, diplomatic levels, and diplomatic events. Some authors believed that state visits, official visits, and visits by heads of state played a significant role in promoting trade [20,25,26]. Some authors suggested that country heterogeneity was involved in the impact of trade, but others believed that there was no significant impact [27] or that there was even a crowding-out effect on the trade of some enterprises [28]. Some authors suggested that bilateral and multilateral energy diplomacy had different impacts on international energy cooperation and trade [29,30,31,32,33]. For example, global energy governance, as an important form of multilateral energy diplomacy, plays an important role in ensuring energy supply and demand security, economic development, international security and environmental sustainability on a global scale. Although all countries participate in global energy governance through well-known organizations such as the International Energy Agency (IEA), the International Renewable Energy Agency (IRENA), and the Organization of the Petroleum Exporting Countries (OPEC), direct bilateral diplomatic contacts can obviously reach a consensus on interests more efficiently and at a lower cost.
Through the review of the above studies, it can be firstly found that previous studies mainly focused on the overall impact of diplomatic activities on international trade in all industries, with relatively few studies directly focusing on the impact of high-level diplomacy on a certain industry such as energy industry [11,12,13,14,15,16,17,18,19,20,21,22,23,24,25,26,27,28]. Secondly, many studies were conducted mostly from a perspective of developed countries, and the conclusions have weak applicability and inspiration for developing countries such as China [11,12,13,14,20,22,29]. Thirdly, some studies had a relatively narrow research perspective, with most focusing on the impact of single variable of a head of state’s diplomatic visits on trade [20,25,26,27,28,29,30,31,32,33].
Compared with previous studies, this study had three major innovations. The first is theme innovation. From a perspective of China, this study focused on the impact of high-level diplomatic visits on China’s crude oil trade using latest data. The second is data innovation. This study constructed a comprehensive dataset of high-level diplomatic visits, which included records of high-level diplomatic visits between China and major countries around the world from 2000 to 2023. Based on this database, various distributions and trends of high-level diplomatic visits were depicted, providing high-quality data sources for related studies. The third is the innovation in research perspectives. This study selects a fixed-effects model to comprehensively explore the impact of diplomatic activities from multiple perspectives and forms (including number of meetings between the leaders of two countries in given year, first meeting between the leaders of two countries or not; diplomatic relations between two countries were upgraded or not; joint statement involving oil or not; number of times the leader of the country visited China in given year; bilateral diplomacy or not) on China’s crude oil trade. The variable of “Joint statement involving energy or not” is used as a replacement to ensure the robustness of the regression results.

3. Background of Model and Parameter Descriptions

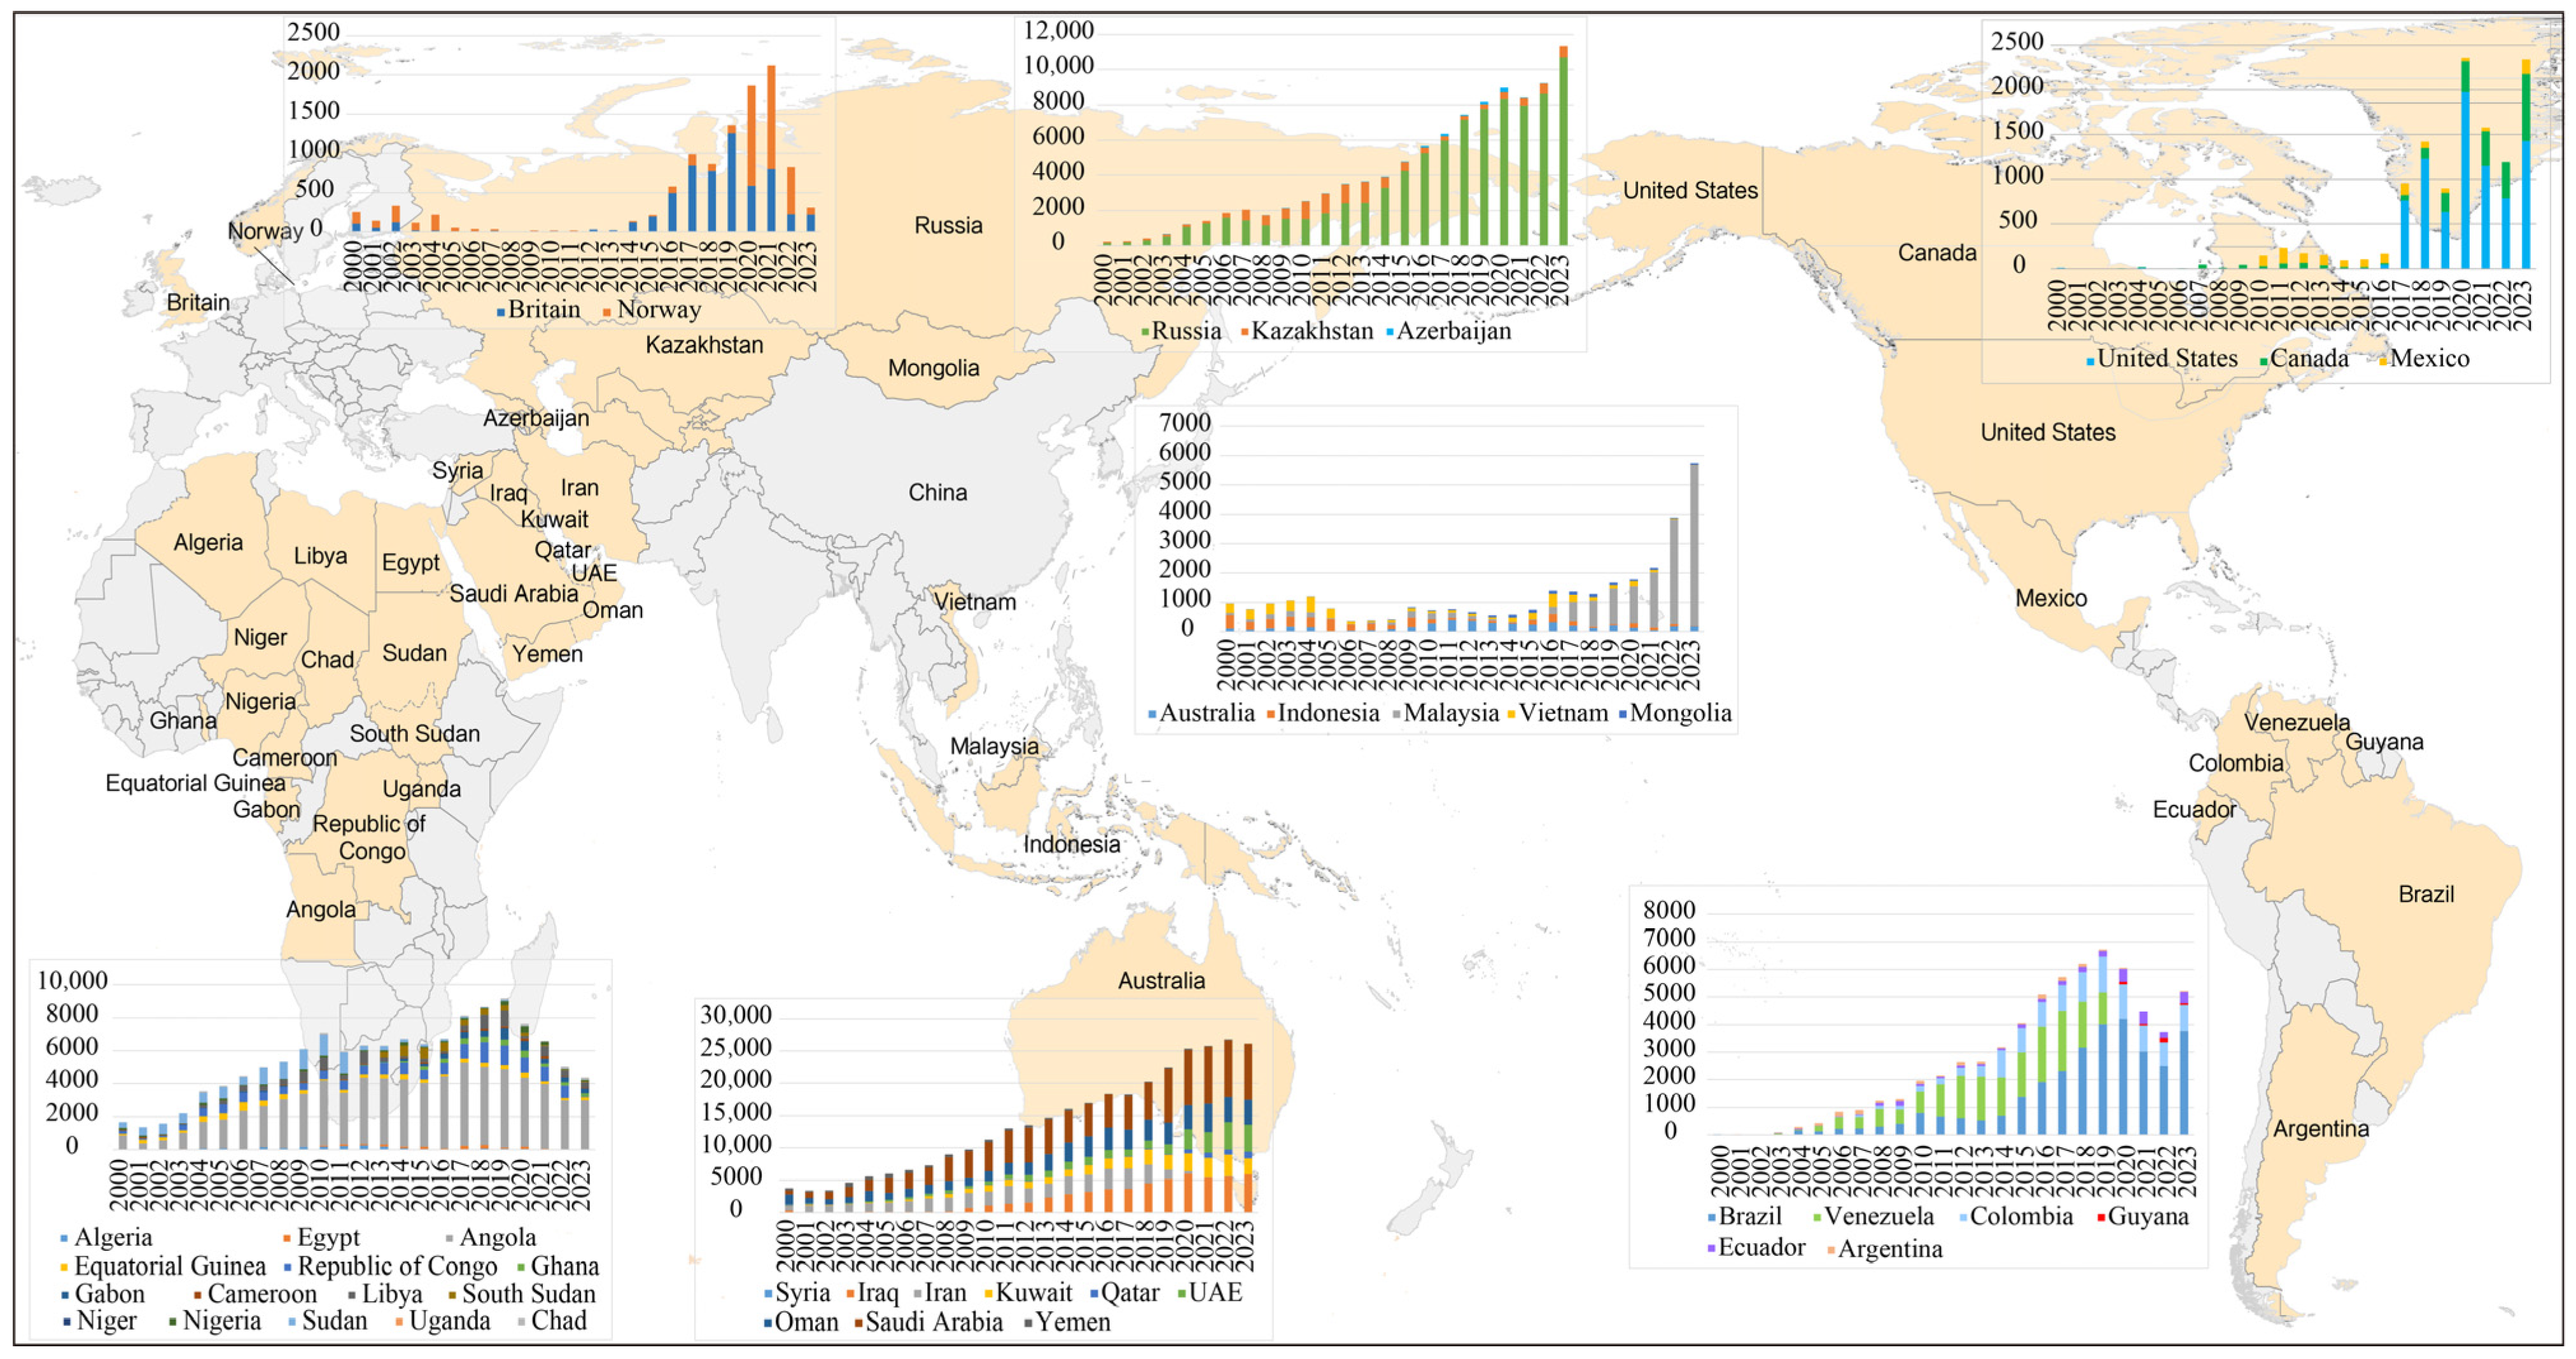
3.1. Characteristics of China’s Crude Oil Trade

There are basically 43 countries that engage in oil and gas investment cooperation and trade with China on a global scale. Figure 1 shows these 43 countries. Nine of these countries are located in the Middle East region, namely, Iraq, Iran, Kuwait, Qatar, the United Arab Emirates, Oman, Saudi Arabia, Yemen, and Syria. In the African region, there are a total of 15 countries, namely, Algeria, Egypt, Angola, Equatorial Guinea, the Republic of the Congo, Ghana, Gabon, Cameroon, Libya, South Sudan, Niger, Nigeria, Chad, Sudan, and Uganda. There are three countries of the Commonwealth of Independent States: Russia, Kazakhstan, and Azerbaijan. In the Americas region, there are nine countries in total, namely, the United States, Canada, and Mexico in North America, and Venezuela, Guyana, Colombia, Ecuador, Brazil, and Argentina in South America. In the Asia–Pacific region, there are five countries: Australia, Indonesia, Malaysia, Vietnam, and Mongolia. In the European region, there are two countries: the UK and Norway.
Figure 1 shows the distribution of crude oil export data of these 43 countries from 2000 to 2023. In terms of regional distribution, the crude oil export volume in the Middle East has maintained the highest level for a long time. Although there are fluctuations in the annual export volume, it generally remains at a level above 800 million tons. Saudi Arabia, Iraq, the United Arab Emirates, Kuwait, and Oman are the major exporting countries in this region, with Saudi Arabia’s export volume accounting for approximately 40% of the region’s total export volume. The three countries of the Commonwealth of Independent States rank second in global crude oil export volume, maintaining an average level of 300 million tons per year, mainly from Russia. The African region, having the largest number of countries, ranks third in global crude oil export volume. Total annual average export volume in this region varied from 200 to 250 million tons. Nigeria, Libya, and Angola are the major exporting countries in this region. Among the American countries, the crude oil export volume of the United States and Brazil shows an increasing trend, while that of other countries remains constant or shows a decreasing trend. Influenced by the increase in the United States’ exports, the export volume in the North American region has rapidly increased from less than 200 million tons to over 400 million tons in 2023. From the perspective of individual countries, in 2023, Saudi Arabia, Russia, and the United States ranked as the world’s first, second, and third largest crude oil-exporting countries, respectively.
Figure 2 shows the distribution of crude oil exports from 43 countries to China from 2000 to 2023. In terms of regions, the Middle East has the largest volume of crude oil exports to China globally, and the volume has maintained continuous growth. In 2023, the total crude oil exports to China was over 250 million tons, with Saudi Arabia, Iraq, Oman, the United Arab Emirates, and Kuwait being the major exporting countries. The region in second is the Commonwealth of Independent States. Since 2000, its exports to China have shown a continuous increasing trend and have remained at a level of 80 to 90 million tons in recent years. Russia is the most important, as well as the largest, crude oil exporter to China in this region. After gradually rising from the year 2000 to about 80 million tons in 2019, the African region’s exports began to decline year by year and dropped to around 43 million tons in 2023. Angola is the major crude oil exporter to China in this region. In the Americas region, the crude oil exports from North America to China rose sharply from less than 2 million tons before 2017 to a peak close to 25 million tons, but the annual export volume fluctuates greatly. In South America, after the exports to China increased to about 67 million tons in 2019, the export volume continuously dropped to around 37 million tons in 2022 and then rebounded to a level of over 50 million tons in 2023. The United States and Brazil are the major crude oil exporters to China in this region. From the perspective of individual countries, in 2023, Russia, Saudi Arabia, and Iraq were the top three sources of China’s crude oil imports.
Changes in energy import volumes and energy-sourcing regions influence China’s geopolitical energy security. Among them, changes in the geographical environment, transportation channels, geopolitical relations, and the international geopolitical energy landscape caused by changes in energy-sourcing regions are the main factors affecting geopolitical energy security.

3.2. Characteristics of China’s Energy Diplomacy

3.2.1. Overview of China’s Energy Diplomacy

Based on the data on energy diplomatic visits by Chinese high-level officials to 43 countries from 2000 to 2023, there are significant differences in the frequency of energy diplomatic visits between China and these countries, highlighting the heterogeneity among the countries. As shown in Figure 3, among all bilateral and multilateral energy diplomatic activities from 2000 to 2023, the top five countries in terms of the frequency of diplomatic activities with China are Russia, Kazakhstan, Vietnam, Indonesia, and Malaysia (with an average of about 41 and a median of 20). The frequency of such activities with these five countries was much higher than that of the other countries. Among them, the visit frequency of Russia is significantly higher than that of Kazakhstan. In addition, the top five countries in terms of the frequency of incoming visits are Russia, Kazakhstan, Vietnam, the United States, and Malaysia, and the top five countries in terms of bilateral diplomatic frequency are Russia, the United States, Kazakhstan, Vietnam, and the UK. Overall, among the countries with a high visit frequency, countries with rich oil resources and China’s neighboring developing countries are dominant, instead of developed countries in the West or Middle Eastern countries with rich oil resources. Therefore, China’s energy diplomatic activities are influenced by energy resource endowments and geographical factors.
In terms of annual bilateral and multilateral energy diplomatic activities, the 43 countries have energy diplomatic visits with China. Russia visited China more than 15 times within a year, which ranks as the highest diplomatic frequency. The number of diplomatic visits of Kazakhstan, Malaysia, Indonesia, and Vietnam to China ranges from 10 to 15 per year. There are 14 countries diplomatically visiting China 5 to 10 times at most, which are Algeria, Argentina, the United Arab Emirates, Egypt, Australia, Brazil, Colombia, Libya, the United States, Mongolia, Mexico, Norway, Sudan, and the UK. The diplomatic activity frequency of other countries per year is below five times. Thus, the countries engaging in bilateral and multilateral energy diplomatic activities with China in the short and mid/long term are relatively fixed and stable.
In terms of annual bilateral energy diplomatic activities among the 43 countries, Russia and the United States show a high frequency of mutual energy diplomatic visits with China, which are at most four to six times per year. Kazakhstan and Mongolia make mutual energy diplomatic visits to China a maximum of 3 times per year. Brazil, Canada, Indonesia, the UK, and Vietnam diplomatically visit China at most twice a year, while other countries visit China once a year at most or only participate in multilateral visits. Thus, there is significant national heterogeneity of bilateral energy diplomacy and multilateral diplomacy among the various countries, and bilateral diplomatic activities could highlight the diplomacy characteristics of major countries.

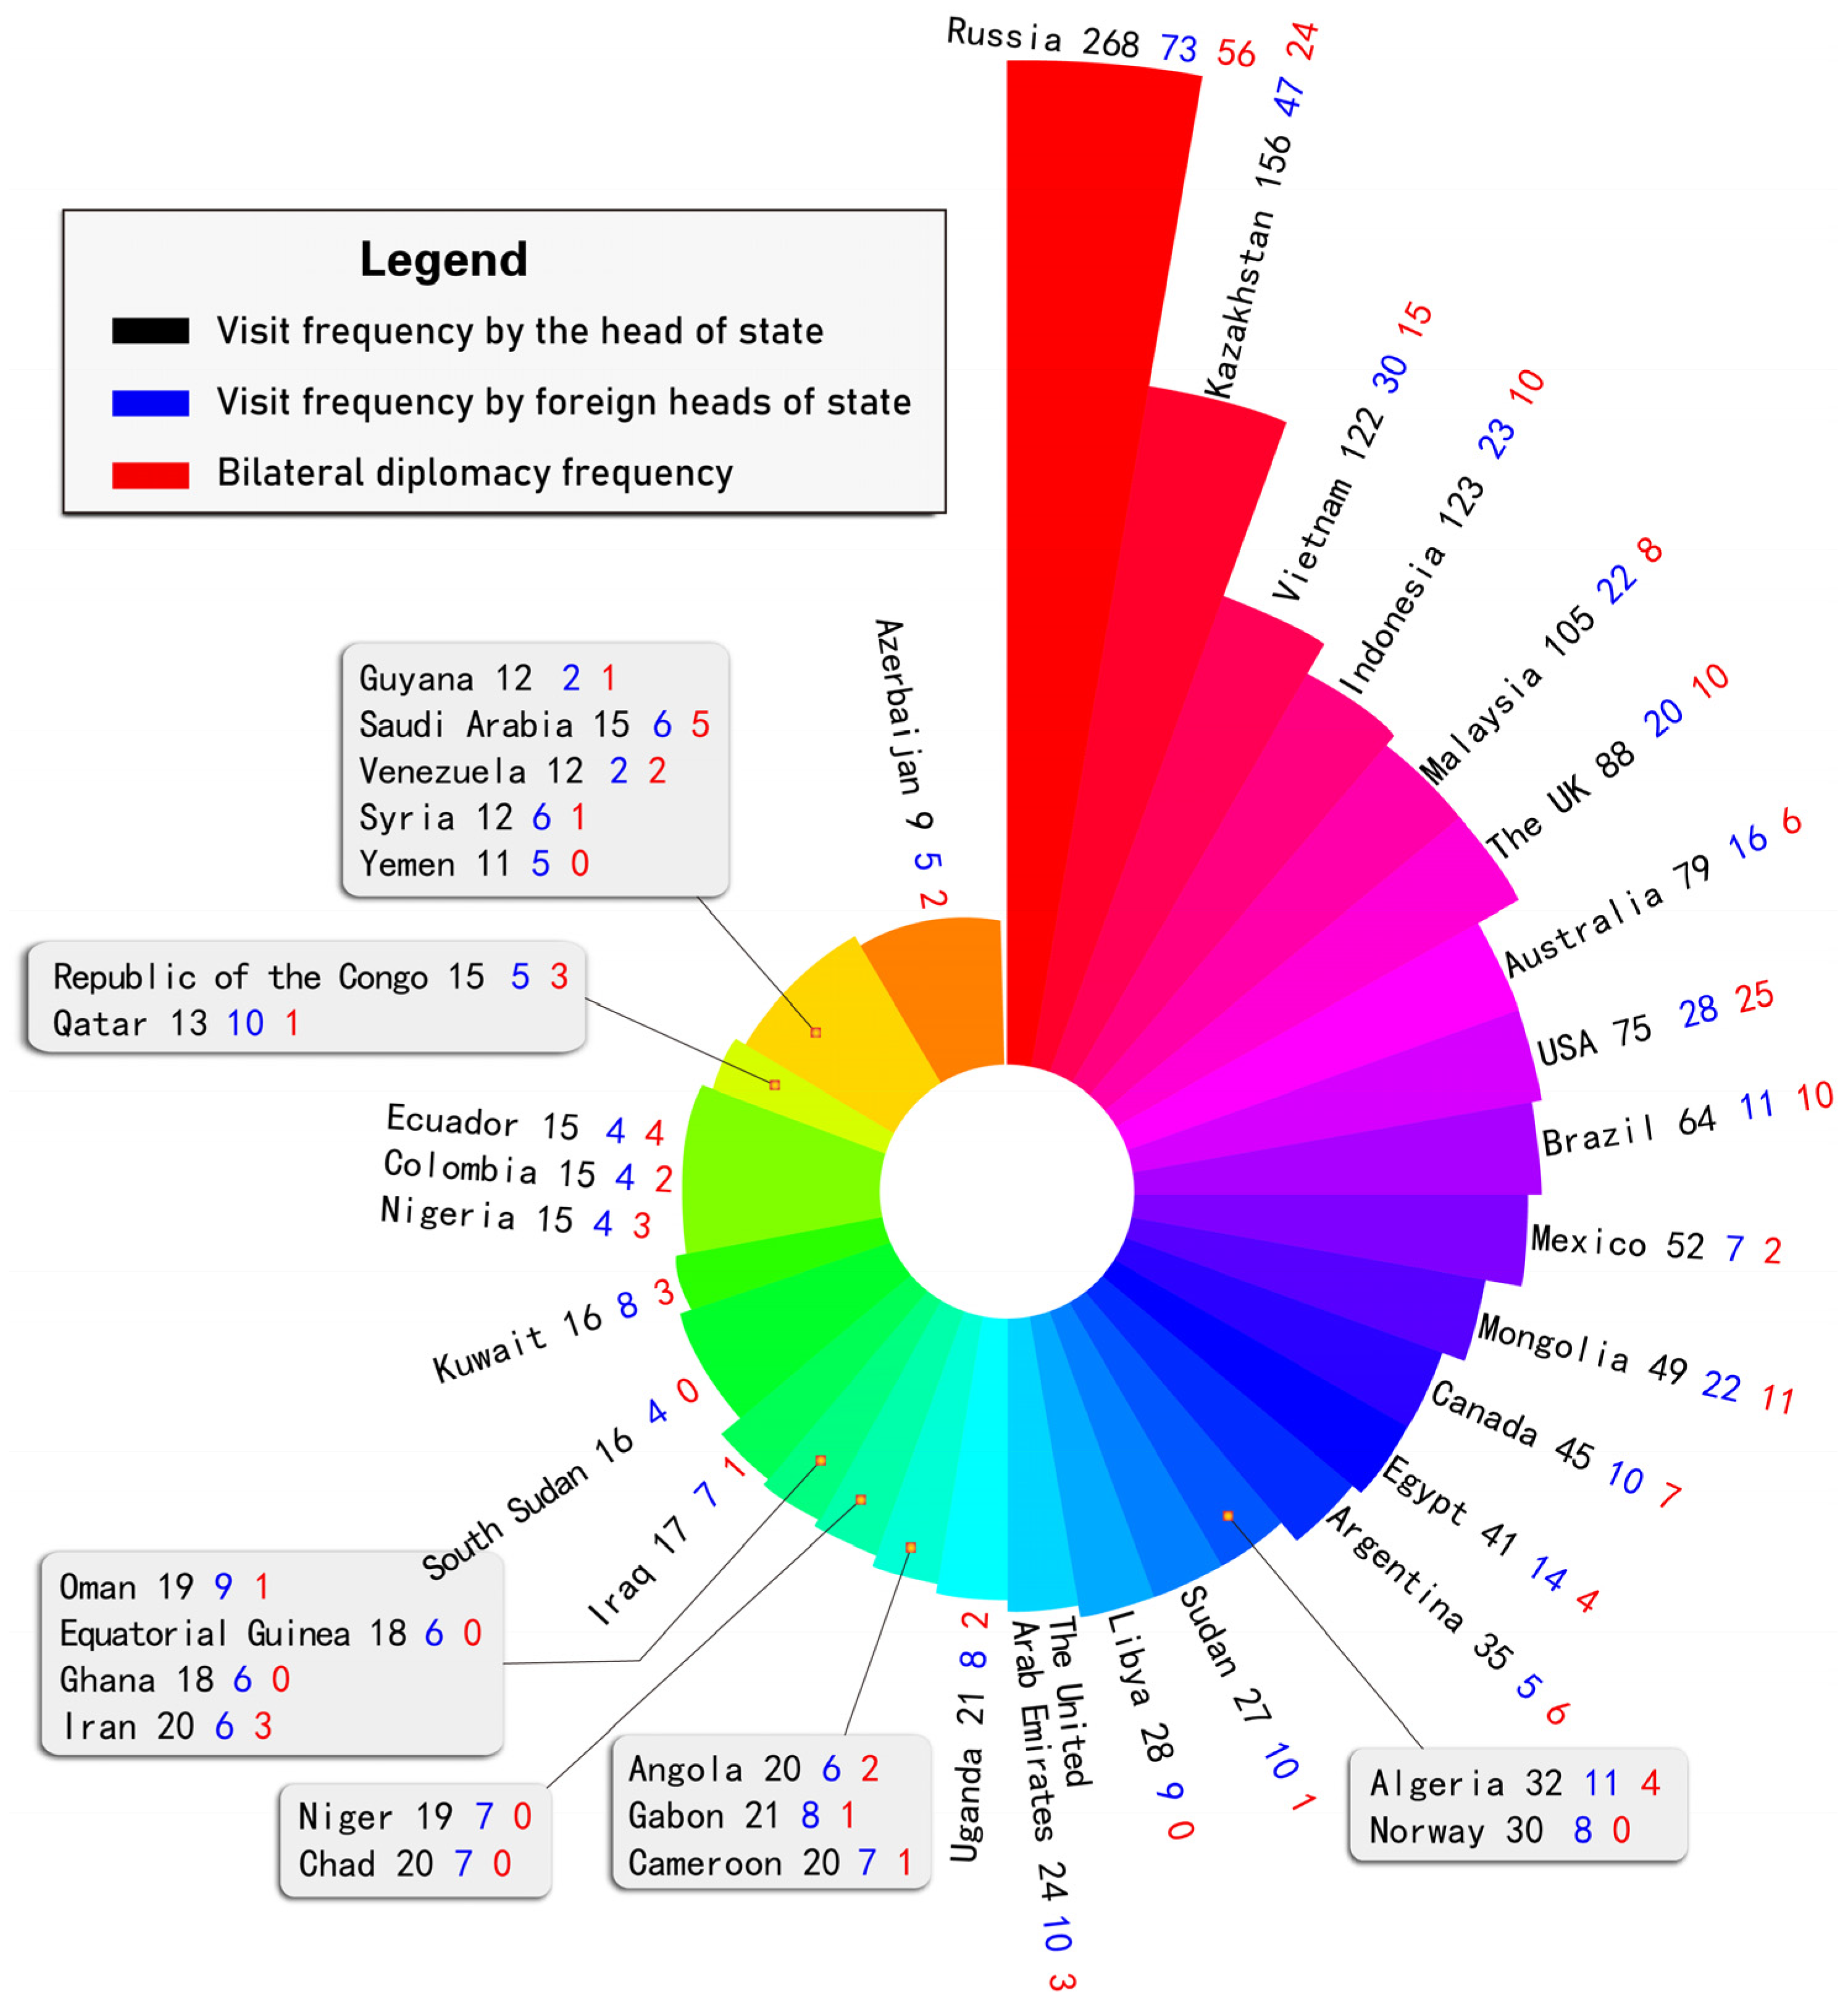
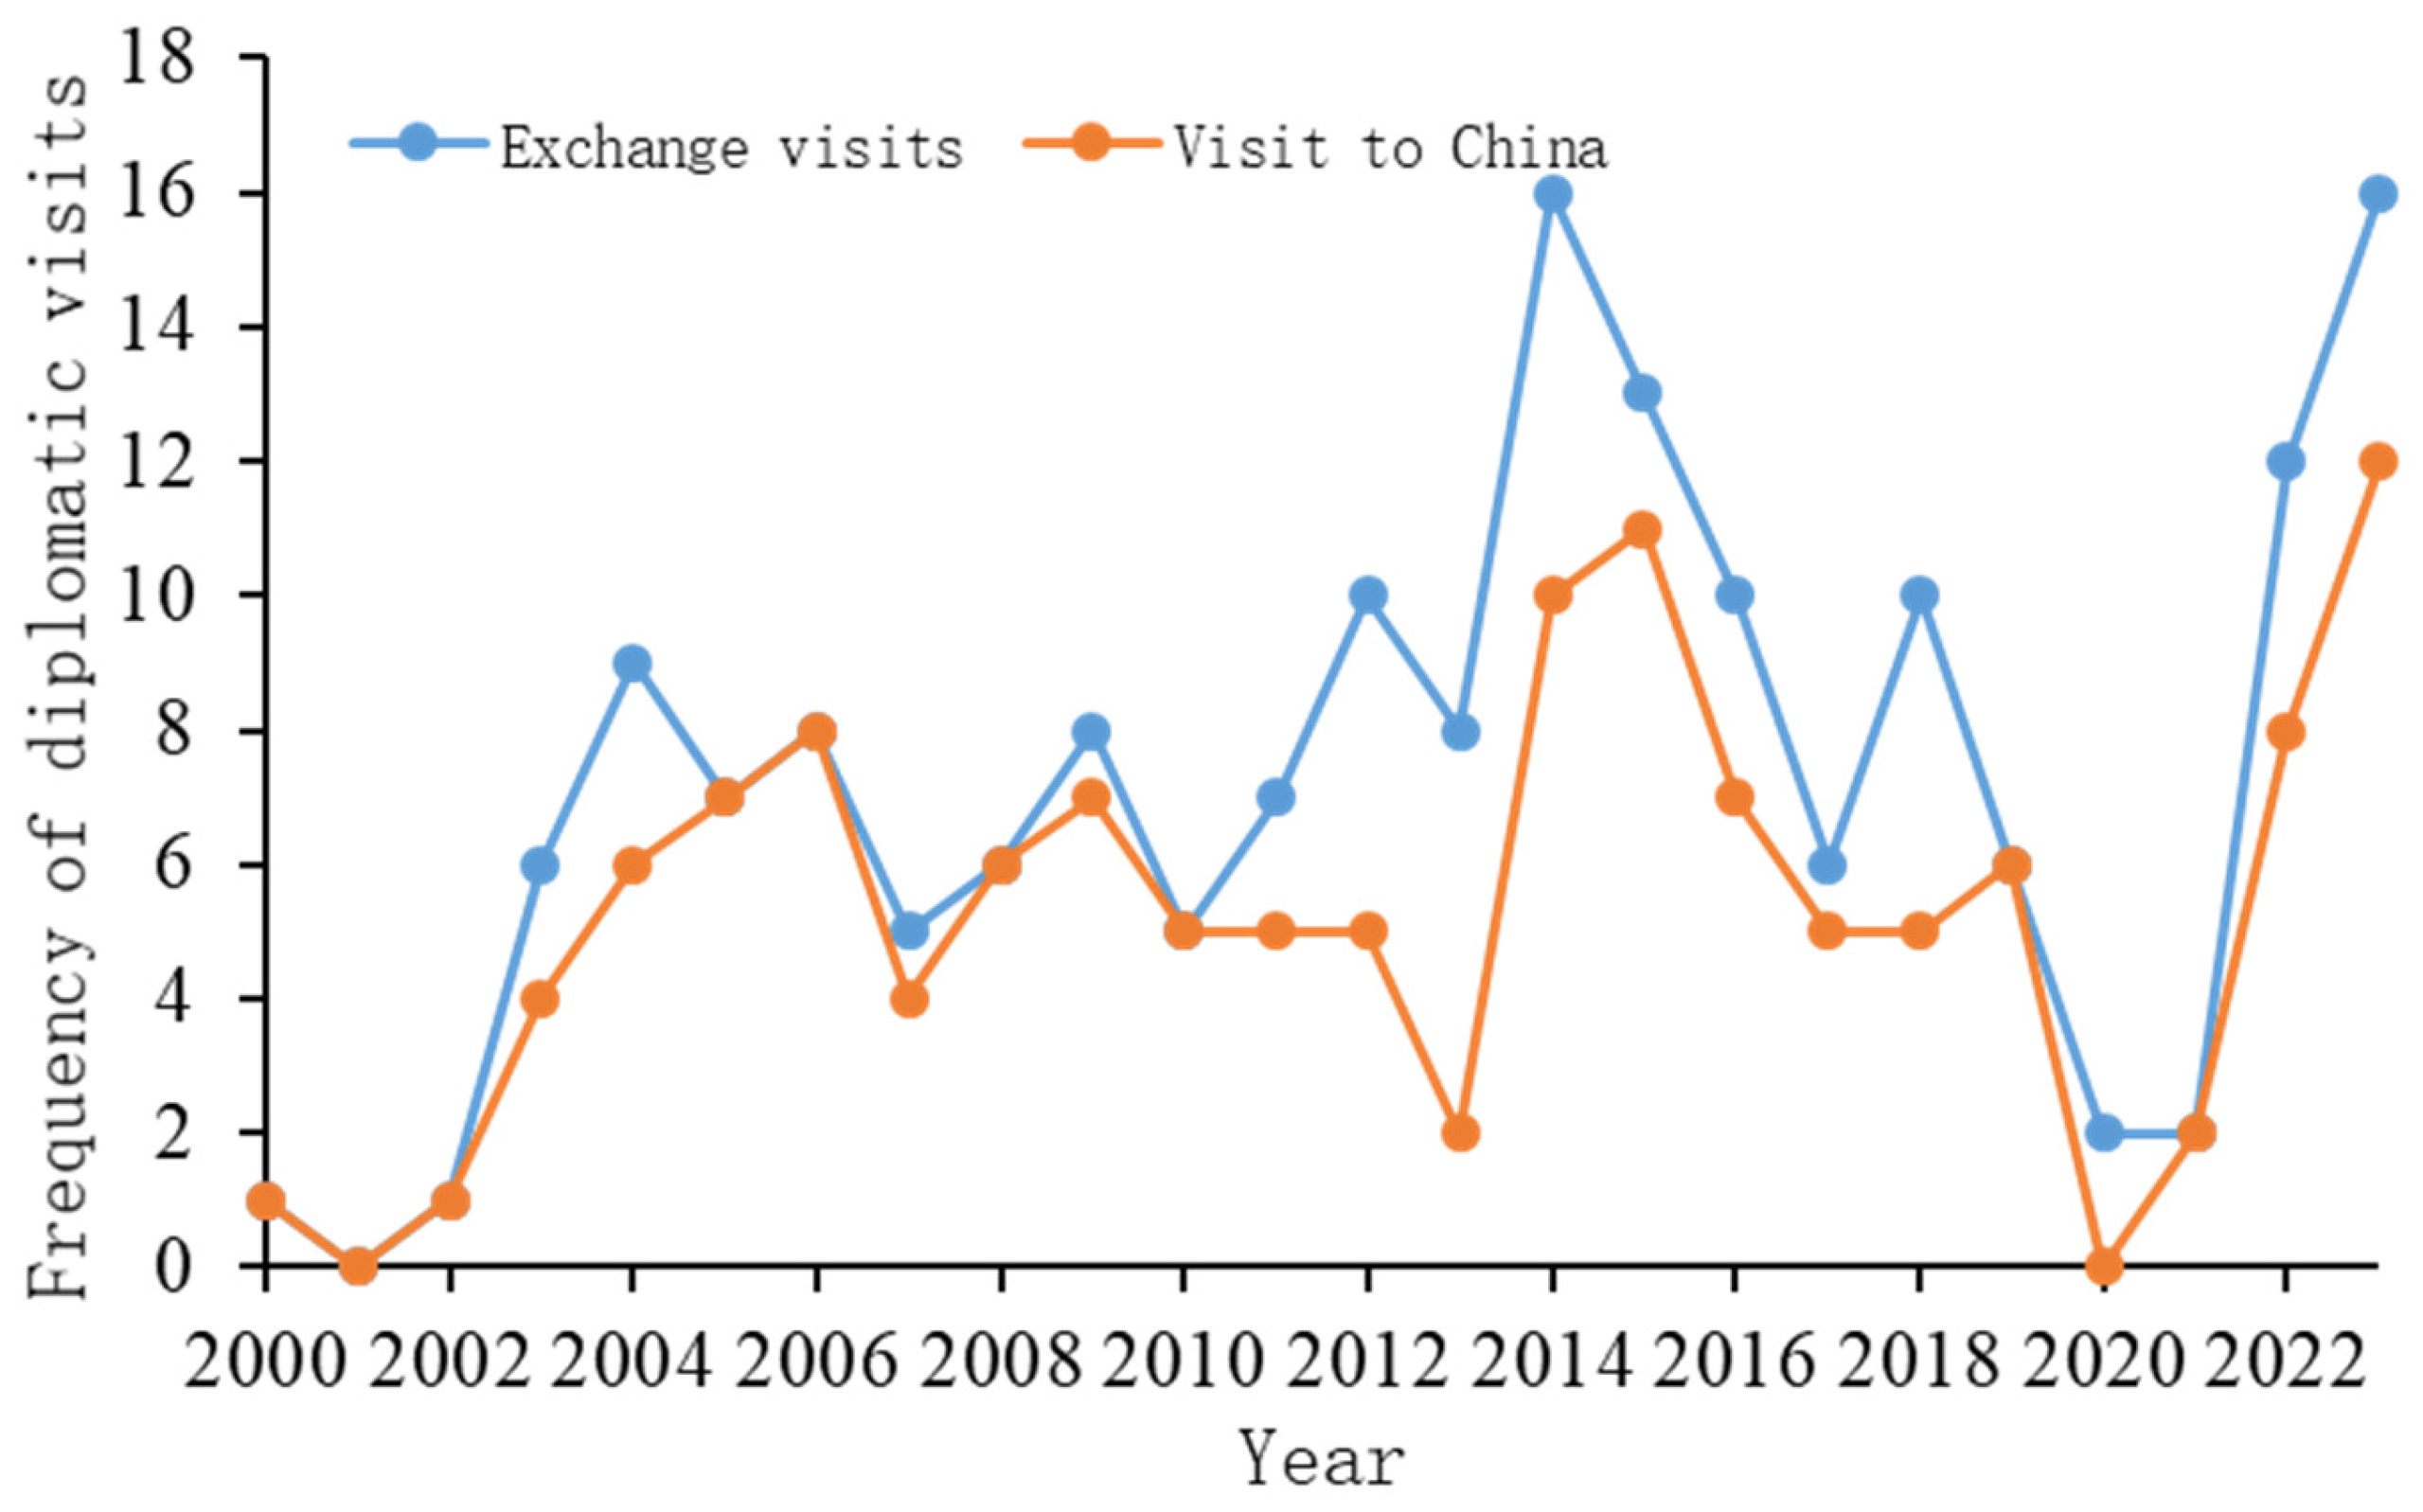
3.2.2. Frequency of Bilateral Mutual Visits and Incoming Visits

Among the 43 countries making bilateral diplomatic visits to China from 2000 to 2023, the location and frequency of incoming visits also showed different characteristics in the country sequence and the time sequence. In terms of countries, Russia had the highest frequency of incoming visits per year, up to eight times. Second, Kazakhstan, the United States, Mongolia, and Vietnam had relatively high frequencies of incoming visits, ranging from four to six times per year. Third, the frequency of Egypt, Australia, Canada, Malaysia, and Indonesia visiting China was at most three times per year. Fourth, the frequency of Argentina, the United Arab Emirates, Egypt, Qatar, Kuwait, Saudi Arabia, Uganda, and the UK visiting China was at most twice per year. Finally, the frequency of the remaining countries visiting China was at most once per year.
In terms of time period, the frequency of annual bilateral mutual visits from 2000 to 2023 generally showed a trend of “fluctuating upward–dropping significantly-–rising sharply again” (Figure 4). The main reason for the peak in 2014 was that high-frequency mutual visits occurred in 2013 after the change in China’s leadership. Comparing the distribution curves of the frequency of mutual visits and incoming visits, there was little difference before 2010, indicating that the visiting activities were dominated by the incoming visits from foreign countries during this time interval. From 2010 to 2019, the frequency of China’s outgoing visits increased significantly, reflecting the enhanced attention of leadership to energy diplomacy and international energy cooperation. The significant reduction in mutual energy diplomatic visits frequency from 2019 to 2021 was mainly due to the impact of restrictions caused by the COVID-19 pandemic. Most foreign affairs activities were carried out online through video conferences and phone calls. Since 2022, diplomatic activities have been resumed successfully and carried out intensively. China’s “face-to-face” diplomatic mutual visits between heads of state rapidly became frequently. There engaged in both “inviting in” and “going out” diplomatic activities with other countries. By 2023, the visit frequency had risen again to the highest level since 2014.

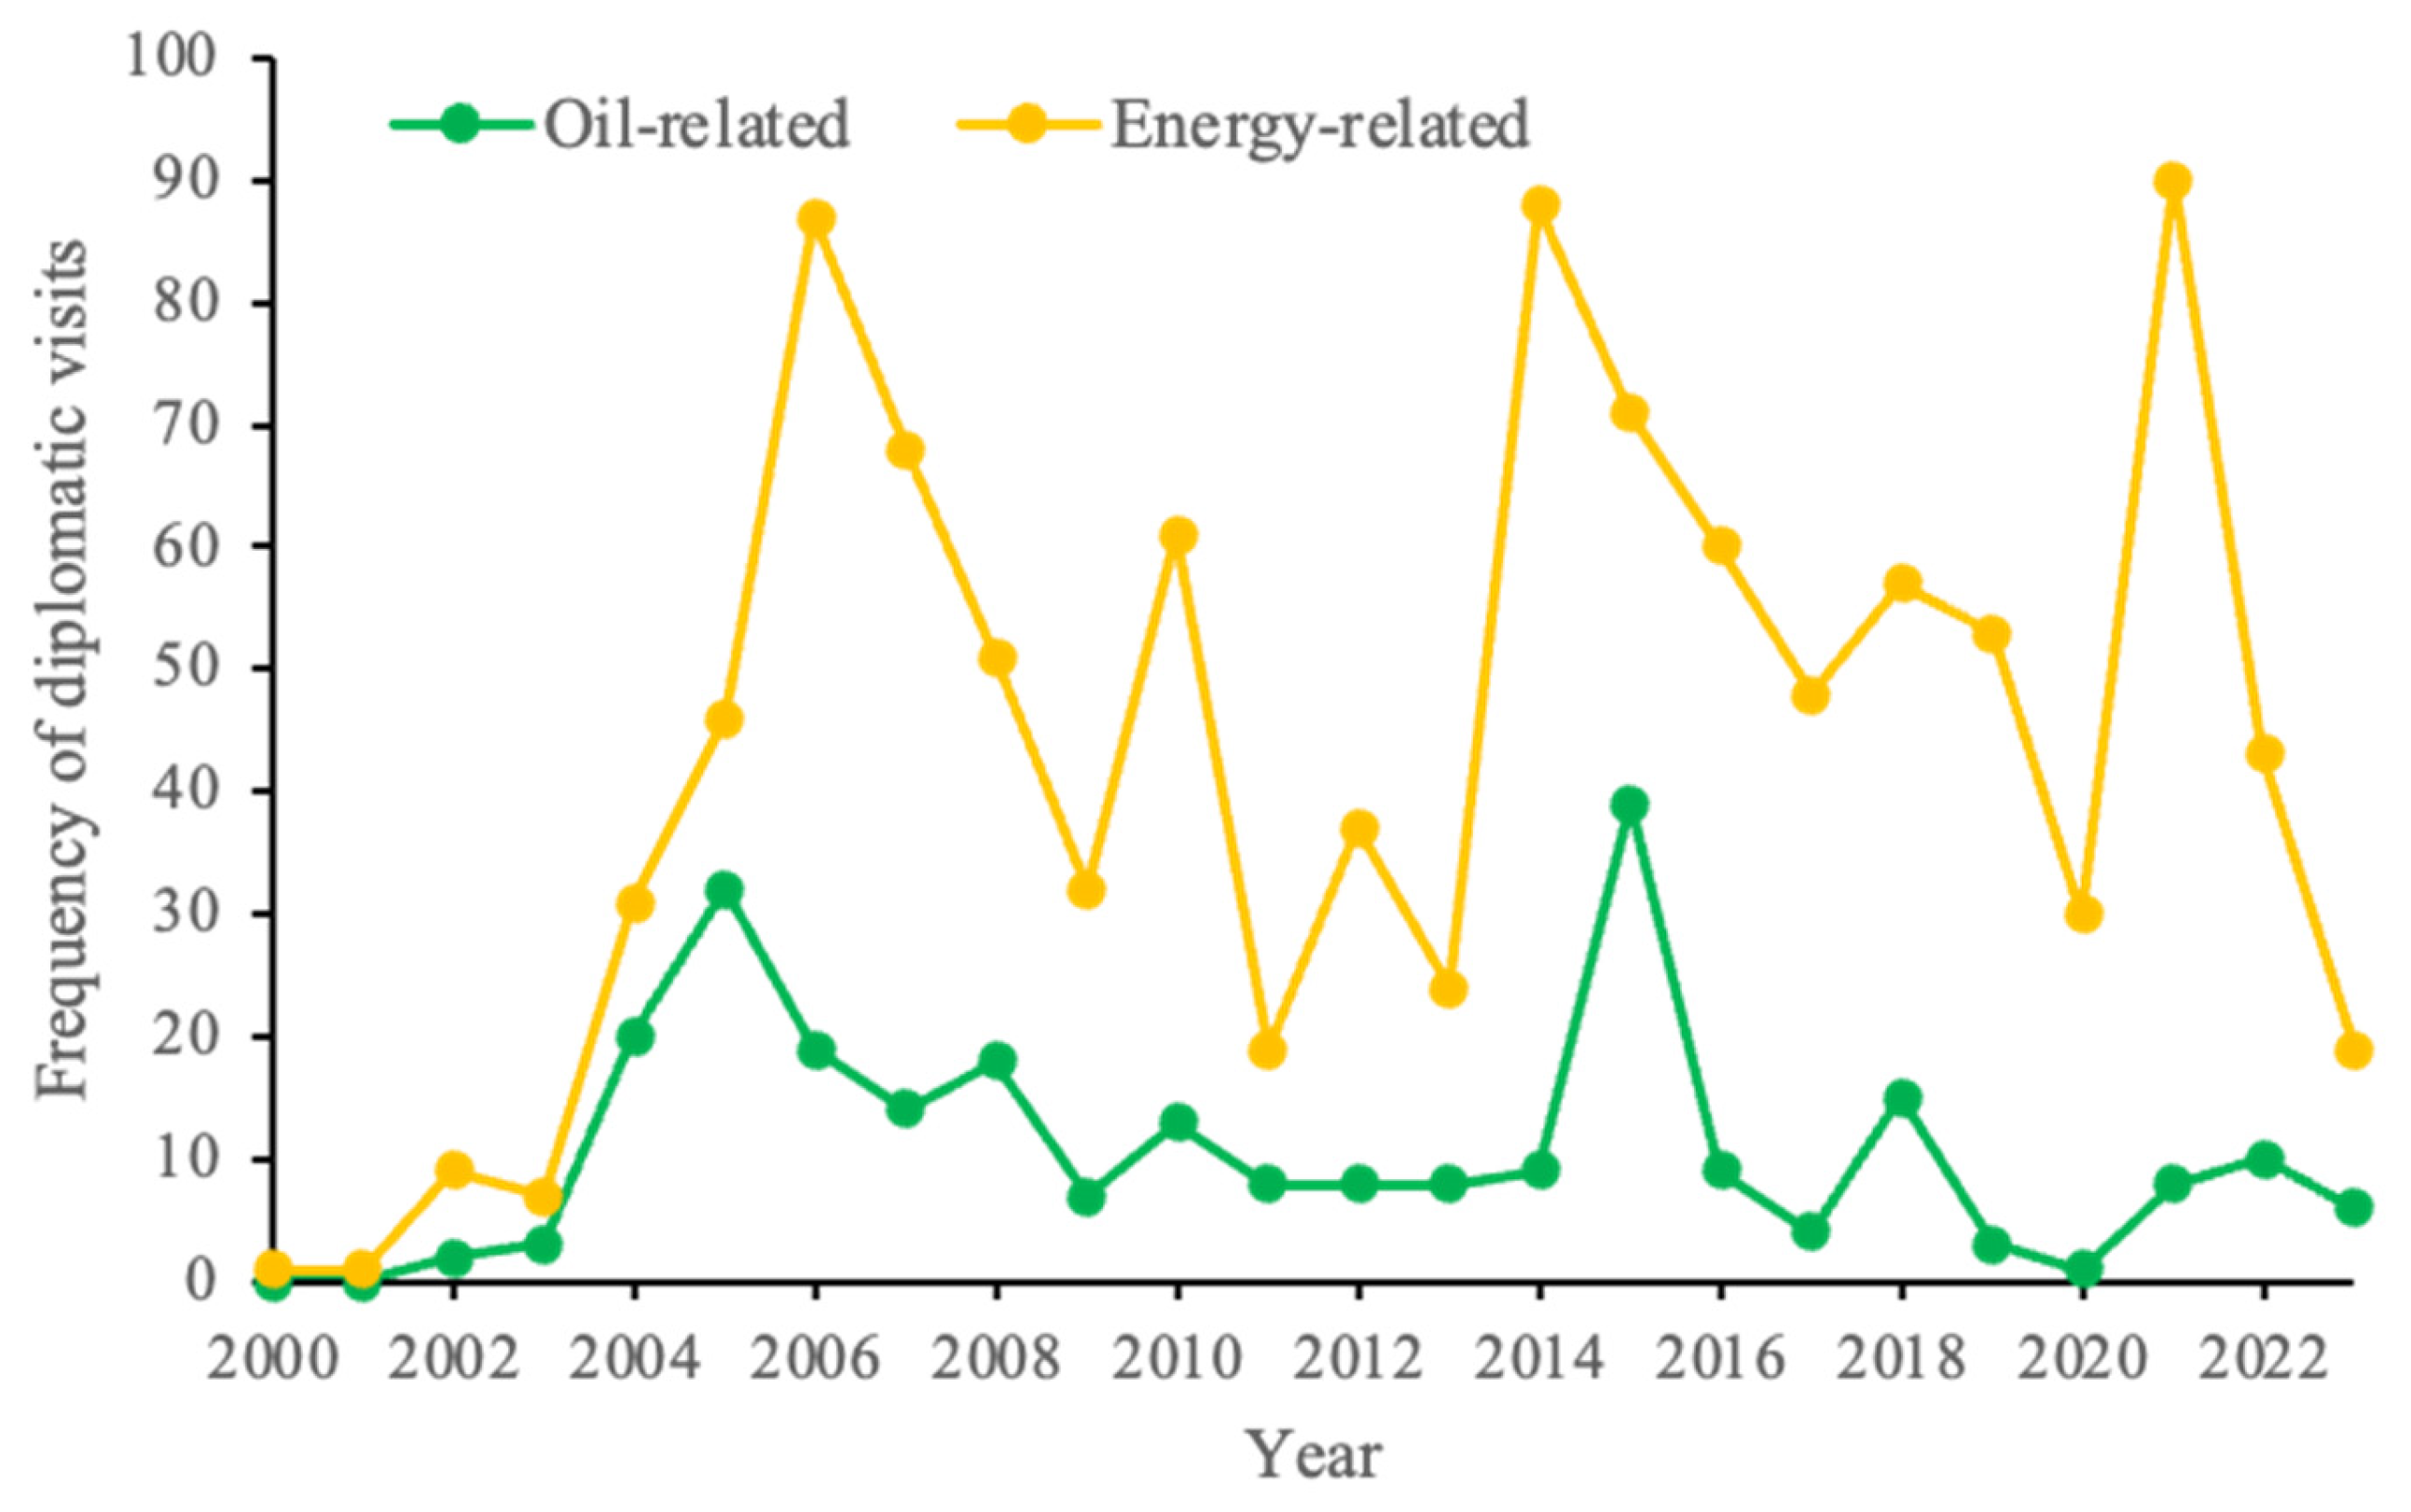
3.2.3. Characteristics of Joint Statements Related to Energy Diplomacy

(1)
Enhancement of Strategic Cooperative Partnership
Of the 43 countries engaging in bilateral energy diplomatic activities with China from 2000 to 2023, 29 enhanced their strategic cooperative partnerships with the country (Table A1). In terms of the frequency of bilateral relation level upgrade between China and the other countries, the first in rank is Russia and Kazakhstan (three times), and second in rank is the United Arab Emirates, Ecuador, and Argentina (two times). The frequency of the 24 remaining countries was at most once. Most of these countries had upgraded to the level of strategic partnership or comprehensive strategic partnership. Moreover, nearly 80% of the level upgrades in diplomatic relations took place after 2013, illustrating that China’s leadership constantly paid more attention to energy-related diplomacy after the latest change of leadership.
(2)
Joint statement involving the energy or petroleum fields
Among the 43 countries, the frequencies of energy and petroleum mentioned in the contents of mutual visits showed certain regularities and characteristics in terms of years and countries during 2000–2023 (Figure 5). Although they displayed similar variation trends, the frequency of energy mentioned in diplomacy activities was significantly higher than that of petroleum. However, the frequency of energy mentioned in annual diplomatic mutual visits showed larger fluctuations than that of petroleum, indicating that energy cooperation in diplomacy activities was strongly affected by changes in the international energy landscape, including the geopolitical situation, energy supply and demand, and international energy price fluctuations. The frequency of energy and petroleum mentioned in diplomacy activities was relatively high during the following four periods: 2004 to 2008, 2010, 2014 to 2018, and 2021. The energy-associated contents mentioned in diplomacy activities were recorded as being high in 2006, 2014, and 2021, specifically 87 times, 88 times, and 90 times, respectively. The following petroleum-associated contents in diplomacy activities were recorded in 2005 and 2015: 32 times and 39 times, respectively. Thus, there was a tendency to enhance energy cooperation in the first year of energy-related diplomacy activities, and to strengthen petroleum cooperation in the second year.

3.3. Basic Assumptions

From the perspective of historical development laws, changes in diplomatic relations between China and resource countries have a certain impact on crude oil trade [42]. According to China Customs data, if the diplomatic relations between China and a resource country were cooled, the crude oil trade between the two countries would have a direct and significant negative influence. Here, we take the crude oil trade between China and the United States as an example. With the United States achieving energy independence, China began to import crude oil from the United States on a small scale in 2016. It expanded rapidly to 7.65 million tons in 2017, accounting for 32% of total crude oil exports of the United States. However, as trade disputes between China and the United States escalated, the growth of crude oil trade slowed and declined sharply. The trade volume rose to 12.28 million tons in 2018, but the proportion was only 20%. The trade volume dropped significantly to 6.35 million tons in 2019, accounting for only 7% of the United States’ crude oil exports of that year [43]. This also happened to the crude oil trade between China and Australia. In recent years, as diplomatic relations between the two countries have cooled, Australia’s crude oil exports to China have continued declining, while its total crude oil exports have not changed much. The proportion of China in Australia’s crude oil export destinations dropped from 39% at its peak in 2016 to 6% in 2021 [43].
If the diplomatic relations between China and resource countries tend to improve in an environment of peaceful development, the volume of crude oil trade will tend to increase after a period of stagnation. The main reason for this is that the imported crude oil needs to enter appropriate refineries for refining. Refineries usually have fixed crude oil sources and will not change easily. For example, in 2016, President Xi Jinping visited Saudi Arabia, and the diplomatic relations between the two countries were upgraded to a comprehensive strategic cooperative partnership. However, the annual trade volume of crude oil between China and Saudi Arabia remained at a level of 50 million tons in 2016 and the following two years. When two large projects, Zhejiang Petrochemical and Hengli Petrochemical in China, which involved refined Saudi crude oil, were completed and put into production in 2019, Saudi Arabia’s total crude oil exports increased to 20 million tons, and the annual trade volume of crude oil between China and Saudi Arabia climbed significantly to more than 80 million tons.
If two party countries were trading with each other during a crisis period, the cooperation between them would immediately lead to an increase in trade scales. For example, Russia experienced a diplomatic dilemma after the Crimean Incident in March 2014. In May 2014, President Putin visited China, and two heads of state jointly issued the “Joint Statement on a New Stage in the Comprehensive Strategic Partnership of Coordination”. Subsequently, China actively expanded its imports of Russian crude oil. By 2018, the import volume had jumped from less than 25 million tons in 2013 to more than 70 million tons. Meanwhile, Russia also actively increased its total crude oil export capacity from 240 million tons to 260 million tons. After the Russian invasion of Ukraine in 2022, Russia was affected by sanctions such as the price limit on crude oil exports, and its trade shifted from the west to the east [9,44]. In 2023, President Xi Jinping made his first visit to Russia during his new term, and in 2024, President Putin also made his first visit to China during his new term. The two countries issued multiple joint statements. The crude oil trade volume between them increased again, reaching more than 100 million tons in 2023 [43].
Based on the analysis of the impact of some diplomatic activities on China crude oil trade in history, three hypotheses were proposed.
Hypothesis 1.
High-frequency mutual visits between the leaders of two countries have an obvious promoting effect on crude oil trade, benefiting the stable supply of energy and the maintenance of trade volume.
Hypothesis 2.
If the energy-related contents in bilateral and multilateral outcome documents were repeatedly and significantly mentioned, the situations for the crude oil trade between the two countries would be favorable.
Hypothesis 3.
Under the same conditions, bilateral diplomacy is more conducive to promoting China’s crude oil imports relative to multilateral diplomacy.

3.4. Parameter Descriptions

This study systematically summarizes the relevant information and data on high-level energy diplomacy between China and these 43 countries from 2000 to 2023 (Table 2). The collection scope covers the openly published outcomes of bilateral and multilateral energy diplomatic visits during this time interval, including joint statements, joint communiques, outcome lists, joint declarations, and initiatives. Our results suggested that the diplomatic visit dataset contained a total of 989 items, with detailed information of the time of mutual visits, the visited countries, the number of meetings between heads of state, the number of visits, the number of times of upgrading diplomatic levels, the diplomatic contents involving or not involving crude oil and energy, and the number of bilateral and multilateral diplomatic occasions. Through further exploration and quantification of this dataset, it is proposed to present the distribution characteristics and trends in various types of information on China’s high-level energy diplomatic visits as well as the quantitative relationship with China’s crude oil trade. The results will clarify the impact of China’s diplomacy on energy trade and provide support and references for further high-level diplomacy performance in the energy sector.

3.5. Econometric Model

Based on the above analyses, this study constructs a fixed-effects model based on panel data to analyze the impact of China’s diplomatic behavior on energy imports. The formula for establishing the model is as follows.
Expotr_Chinait = f(Leader_meet_numit, First_meetit, Diplomacy_rankit, Diplomacy_rank_oilit, Meet_in_China, Two_sideit, Cotrolit, NationFEit, TimesFEit)
where Expotr_Chinait refers to the dependent variable of the model, representing the oil export volume of country i to China in year t. Leader_meet_numit, First_meetit, Diplomacy_rankit, Diplomacy_rank_oilit, Meet_in_China, and Two_sideit refer to the independent variables of the model, representing the number of meetings between the leaders of two countries in that year, first meeting of the national leaders or not, joint statement upgrading or not upgrading diplomatic relations between the two countries, joint statement containing contents involving or not involving oil cooperation, number of diplomatic activities carried out in China in that year, and number of bilateral meetings of the leaders in the given year, respectively.
Regarding the issue of control variables, based on previous studies [45,46], this study emphatically selects two controlling variables, i.e., Export_totalit and China_total_importt, which refer to the total oil export volume of country i in year t, and China’s total oil import volume in year t, respectively. The time fixed effect and country fixed effect are also taken into consideration. This study also established whether the joint statement contains content related to energy cooperation, which is used as a robustness test variable (Table 3).
In addition, based on previous studies [47,48], this study determined whether the above 43 oil-exporting countries are the “Belt and Road” signatory countries and whether they are neighboring countries of China. Then, a country grouping analysis was conducted to examine the heterogeneity of the “Belt and Road” countries and non-“ Belt and Road” countries as well as the heterogeneity of neighboring countries and non-neighboring countries in this model. Descriptions of variables are shown in Table 3.

4. Results and Discussion

4.1. Main Regression and Various Factors Influencing China’s Crude Oil Trade

The main regression model was established based on the impact of China’s energy diplomacy activities in a given year (base year), the previous year (one year earlier than the base year), and the previous two years (two years earlier than the base year) on China’s crude oil imports in the base year. The time dimension of this model was set to vary from 2000 to 2023. Meanwhile, three types of controlling variables in the above-mentioned three scenarios were introduced in our model, i.e., time fixed effects (Model 1, Model 4, Model 7), country fixed effects (Model 2, Model 5, Model 8), and time and country fixed effects (Model 3, Model 6, Model 9). Therefore, a total of nine simulated regression analyses were run in our model (Table 4).
The three models, i.e., the base model, the previous year model, and the previous two years model, usually showed consistent significance characteristics in the cases of considering the time fixed effect, country fixed effect, and the combination of both, illustrating the stable impact of energy diplomatic activities on crude oil trade.

4.1.1. Impact of the Frequency of Meetings Between the Heads of State on Crude Oil Trade

Models 1, 2, and 3 focused on the impact of the number of meetings between national leaders on China’s crude oil trade in the current year. The regression coefficients of independent variable Leader_meet_num (the number of meetings between the leaders of two countries in the base year) were 50.268 ***, 49.523 ***, and 53.193 ***, respectively, showing a significant positive effect (Table 4). Models 4, 5, and 6 focused on the impact of the number of meetings between national leaders in the previous year on crude oil trade in the current year. The corresponding regression coefficients of independent variable Lleader_meet_num (the number of meetings in the previous year) were 57.969 ***, 49.012 ***, and 62.520 ***, respectively, showing a significant positive correlation. Models 7, 8, and 9 analyzed the meetings between national leaders in the previous two years, and the regression coefficients of independent variable LLleader_meet_num (the number of meetings in the two years before) were 45.013 ***, 35.650 **, and 49.994 ***, showing a significant positive trend. The results of these models suggested that the number of meetings between the leaders of two countries in the current year had a significant positive effect on China’s crude oil imports from corresponding resource countries in the current year, the following year, and even the third year, meaning that China’s crude oil imports from these resource countries had a continuous growth trend within a time span of at least three years. The frequent interactions between the senior leaders of two countries have effectively promoted bilateral crude oil trade cooperation, strengthened the foundation for China’s crude oil supply security, and provided practical and effective positive assistance, fully verifying the correctness of hypothesis 1.
Combined with previous results [2], the effect of high-level visits between two countries on strengthening bilateral relations is more prominent in countries with relatively small energy trade scales. Thus, on the one hand, the Chinese government should continue to stabilize energy diplomatic relations with major crude oil import source countries. On the other hand, the government should also pay attention to those countries with large fluctuations in crude oil import rankings in history, and strengthen energy diplomatic ties with them, thus promoting the diversified development of energy trade, reducing the over-reliance on a single energy supply source, and comprehensively safeguarding national energy security.

4.1.2. Impact of the First Meetings Between the Heads of State on Crude Oil Trade

Models 1–3 focused on the impact of the first meetings between the leaders of two countries on China’s crude oil trade in the current year, and the regression coefficients of independent variable first_meet (First meeting between the leaders of two countries or not in the base year) were −172.85, −191.64, and −168.05, respectively. Models 4–6 displayed the impact of the first meetings between the leaders of two countries in the previous year on crude oil trade in the current year, and the regression coefficients of independent variable Lfirst_meet (First meeting between the leaders of two countries or not in the previous year) were −211.15, −209.97, and −209.01, respectively. Models 7–9 showed the effect of the first meetings between the leaders of two countries in the previous two years on crude oil trade in the current year, and the corresponding regression coefficients of independent variable LLfirst_meet (First meeting between the leaders of two countries or not in the two years before) were −184.07, −201.32, and −186.90, respectively (Table 4). It is worth noting that no significance was found in the above regressions, clearly indicating that the variable of the first meetings between the leaders of two countries did not have an obvious impact on China’s crude oil imports in the current year, the following year, or even the third year.
Previous results [20,26] have suggested that the first visit of leaders usually brought huge and far-reaching impacts and changes to the international trade pattern covering all industries. However, in terms of the specific sector of the petroleum industry, the situation is different. Since petroleum is a kind of traditional commodity, its trade model mainly depends on long-term agreements and spot transactions in the international market. Under normal circumstances, most resource countries and consuming countries already have relatively fixed and main target markets, and the trade flow is not likely to change subversively. However, due to the Russian invasion of Ukraine, the international energy trade structure had already begun to be reshaped with the continuous escalation of sanctions by the United States and Europe against Russia’s energy sector. India can be taken as an example. As the third-largest oil-consuming country in the world, the oil import strategy of India has undergone a very significant shift. The sources of original major crude oil imports, for example, Middle Eastern countries such as Saudi Arabia, have gradually been replaced by Russia. Currently, the proportion of Russian oil in India’s total crude oil imports has exceeded 30%. At the same time, the high-level officials of India and Russia have always maintained close and frequent exchanges and interactions, and the two sides have in-depth discussions on cooperation in many key areas such as energy trade and local currency settlement.
Therefore, to effectively strengthen international cooperation in the petroleum industry, more frequent and diversified diplomatic activities need to be engaged in, and the forces of various types of institutions such as national government departments, enterprises, financial institutions, universities, and think tanks need to be fully mobilized to make them work unison, comprehensively enhancing coordination, communication, and information exchange within the industry, and thus laying a solid foundation for more practical and efficient cooperation between the two countries in the energy sector. On the other hand, it is necessary to closely follow the dynamic evolution of the global energy pattern, seize the emerging opportunity windows for international energy cooperation under the new situation, and strengthen energy diplomacy decisively under the premise of meeting national interests and demands, and quickly implement a consensus reached by the leaders of two countries, divide it into specific actions, and turn them into tangible cooperation results.

4.1.3. Impact of Diplomatic Relation Level Upgrade on Crude Oil Trade

Models 1–3 illustrated the impact of the upgrading of diplomatic relations between two countries on China’s crude oil trade in the current year, and the regression coefficients of independent variable diplomacy_rank (Whether diplomatic relations between two countries were upgraded or not in the base year) were 68.93, 56.06, and 58.22, respectively. Models 4–6 presented the effect of the upgrading of diplomatic relations between two countries in the previous year on crude oil trade in the current year, and the corresponding regression coefficients of independent variable Ldiplomacy_rank (Whether diplomatic relations between two countries were upgraded or not in the previous year) were 75.11, 59.94, and 62.38, respectively. Models 7–9 displayed the correlation effect of the upgrading of diplomatic relations between two countries in the previous two years on crude oil trade in the current year, and the regression coefficients of independent variable LLdiplomacy_rank (Whether diplomatic relations between two countries were upgraded or not in the two years before) were 180.58, 161.37, and 170.53, respectively (Table 4). However, it is worth noting that there were no significant characteristics in the above regressions, which strongly indicates that the upgrading of diplomatic relations between two countries will not have a significant promotional or inhibitory effect on China’s crude oil imports from corresponding resource countries in the current year, the following year, or even the third year.
This conclusion profoundly revealed that the advancement of diplomatic relations between two countries was difficult to effectively transform into practical cooperation achievements in the economic sector, especially in the crude oil trade sector, in the short term. In other words, the scale of China’s crude oil imports from relevant countries will not expand rapidly simply because the bilateral diplomatic relations reach a new height. Previous results [49] also suggested that the optimization of bilateral diplomatic relations can indeed create a favorable atmosphere and lay a solid foundation for bilateral trade cooperation, but they did not accurately identify the specific industrial sectors and subdivided tracks involved in this positive factor.
The sublimation of bilateral diplomatic relations will inevitably open up new space and inject new impetus for the two sides to expand economic and trade cooperation. However, from the perspective of practical operation, the upgrading of diplomatic relations levels often only stays at the top-level planning and strategic blueprint stage where the leaders of two countries achieve high-level and sustainable development of bilateral relations in the short term. To implement it in specific sectors such as crude oil trade, in-depth analysis of many subsequent implementation details is still required, such as the dynamic changes in the proportion of crude oil trade in the total bilateral trade, the medium- and short-term growth plans for the crude oil production or export volume of resource countries, the growth expectation plans for the crude oil consumption demand of consuming countries, the fluctuation trends in the settlement prices of bilateral crude oil trade, and favorable policies for crude oil trade.

4.1.4. Impact of Joint Statements Involving Petroleum Cooperation on Crude Oil Trade

In Models 1–3, the impact of the petroleum cooperation mentioned in the joint statements of two countries, a key variable, on China’s crude oil trade in the current year was explored, and the regression coefficients of independent variable diplomacy_rank_oil (Joint statement involving oil or not in the base year) were −154.043 ***, −157.688 ***, and −149.632 ***, respectively, showing significant negative characteristics. Models 4–6 focused on the effect of the petroleum cooperation mentioned in the joint statements of two countries in the previous year on crude oil trade in the current year, and the corresponding regression coefficients of independent variable Ldiplomacy_rank_oil (Joint statement involving oil or not in the previous year) were −118.466 **, −113.839 ***, and −107.539 **, respectively, showing a strong negative significance (Table 4). These results indicated that there were obvious negative impacts on the crude oil trade activities of two countries in the current year and the following year when official documents (e.g., joint statements) containing key points about petroleum cooperation were signed during diplomatic interactions between them. Moreover, the degree of negative impact in the following year is somewhat lower than that in the current year.
Models 7–9 showed the correlation impact of the petroleum cooperation mentioned in the joint statements of two countries in the previous two years on crude oil trade in the current year, and the regression coefficients of independent variable LLdiplomacy_rank_oil (Joint statement involving oil or not in the two years before) were −89.429 *, −89.261 **, and −78.624 *, respectively, showing general negative significance and indicating that the negative impact of such diplomatic activities on crude oil import in the third year was further weakened. In general, when diplomatic activities such as joint statements involving petroleum cooperation were conducted in the current year and the following year, China’s crude oil imports from corresponding countries generally showed a downward trend, and the declining rate showed a decreasing trend year by year.
This conclusion seems to be in obvious conflict with our daily understanding. To further verify its reliability, this study introduced the variable of energy cooperation mentioned or not mentioned in the joint statement and conducted a robustness test on the model again. Surprisingly, the obtained results still showed the same characteristics as those described above. It is speculated that this phenomenon is most likely caused by the interference of many complex factors in the external environment within actual practical scenarios.
In the context of globalization, the international geopolitical situation is unstable and commercial competition is becoming increasingly fierce. Affected by the superposition of multiple factors, third countries or other countries with relevant interest demands are likely to deliberately interfere with crude oil trade between China and resource countries by using political pressure and economic sanctions. In the short term, this external intervention force may quickly build trade barriers for crude oil imports, directly leading to a significant decline in trade volume. However, with the continuous dynamic evolution of the international situation, countries have begun to take a series of countermeasures based on consideration of their own interests to gradually resolve various potential obstacles in the crude oil trade process. As a result, the impact of the above negative interference factors will be gradually weakened.

4.1.5. Impact of Foreign Visits on China’s Crude Oil Trade

In Models 1–3, the impact of the number of meetings of the leaders of two countries in China in the current year on China’s crude oil trade in the same period was studied, and the regression coefficients of independent variable meet_in_china (the situation of meetings in China in the base year) were −93.517 ***, −98.354 ***, and −91.698 ***, respectively. Models 4–6 presented the impact of the number of meetings of the leaders of two countries in China in the previous year on crude oil trade in the current year, and the corresponding regression coefficients of independent variable Lmeet_in_china (the situation of meetings in China in the previous year) were −83.775 ***, −84.738 ***, and −84.603 ***, respectively. Models 7–9 focused on the correlation effect of the meetings of the leaders of two countries in China in the previous two years on crude oil trade in the current year, and the regression coefficients of independent variable LLmeet_in_china (the situation of meetings in China in the two years before) were −76.984 **, −77.880 ***, and −78.751 ***, respectively (Table 4). It is worth noting that the results of all models showed significant negative effects, indicating that the occurrence of diplomatic meeting activities in China will inhibit its crude oil imports from corresponding resource countries.
This conclusion seems to overturn the inherent perception in people’s subconscious, that as long as the diplomatic interactions between two countries are continuously increased, the bilateral crude oil trade cooperation can naturally be promoted to a new level. However, in the context of this simulation scenario, there is a key detail hidden behind this conclusion; that is, most diplomatic activities are represented by representatives of resource countries visiting China, while the frequency of China’s proactive visits is relatively low. From the perspective of conventional logic, this diplomatic activity model indeed has the limited positive promotional effects on China’s crude oil trade. Only when both sides initiate high-frequency mutual visits or Chinese senior officials are able to visit more frequently can the growth of China’s crude oil imports from relevant resource countries be effectively increased. Thus, to achieve the goal of increasing crude oil imports, Chinese senior officials urgently need to initiate more “going global” energy diplomatic actions and actively expand the space for foreign exchange and cooperation.

4.1.6. Impact of Bilateral Diplomacy on China’s Crude Oil Trade

Models 1–3 revealed the impact of bilateral diplomacy in the current year, a key variable, on China’s crude oil trade in the same period, and the regression coefficients of independent variable two_side (the bilateral cooperation situation in the base year) were 82.930 *, 78.265 *, and 90.495 **, respectively, showing significant positive correlations. Models 4–6 focused on the effect of bilateral diplomacy in the previous year on crude oil trade in the current year, and the corresponding regression coefficients of independent variable Ltwo_side (the bilateral cooperation situation in the previous year) were 91.318 **, 93.129 **, and 99.565 **, respectively, showing strong positive promotional effects. Models 7–9 showed the impact of bilateral diplomacy activities in the previous two years on crude oil trade in the current year, and the regression coefficients of independent variable LLtwo_side (the bilateral cooperation situation in the two years before) were 121.200 ***, 126.729 ***, and 127.470 ***, respectively, indicating significant positive impacts (Table 4). It is worth noting that the significance of regression results continued to increase from the current year to the following year and then to the third year, and its promotional effect on crude oil trade also increased day by day. These results clearly indicated that bilateral diplomacy had an increasing promotional effect on crude oil trade between China and resource countries year by year, effectively verifying the correctness of hypothesis 3, which was also highly consistent with previous results [2], fully confirming that two countries were more likely to seek and reach common interest demands via bilateral diplomatic channels, and then promote the efficient implementation of crude oil trade cooperation.
This trend is presented in China’s crude oil trade sector, but it is also universal at the international society level. Previous authors [50] pointed out that the majority of countries in the world expected to build a more equal and reciprocal environment, conducive to maintaining world peace, stability, and economically sound development, as well as the formation of a global governance system co-led by multilateral forces. However, given the structural power advantages of some countries, some superpowers show strong intervention capabilities in the process of energy trade practice. They can use various channels, such as the World Trade Organization (WTO), financial institutions, and multinational companies, to exert influence on energy trade, presenting the global energy system with numerous challenges in the journey toward fairness, ensuring supply security and achieving green development.
In recent years, China has been active in establishing close cooperative relationships with more than 30 energy-related international organizations and multilateral mechanisms, and it has also played a key leading role in issues related to energy cooperation on multilateral platforms such as the International Energy Agency (IEA), the International Renewable Energy Agency (IRENA), the G20, the Asia–Pacific Economic Cooperation (APEC), BRICS, and the Shanghai Cooperation Organization. However, China is still rarely the main initiator or founding member of international cooperation organizations and initiatives. Currently, among the projects initiated by China, well-developing projects in the energy sector are the “Belt and Road Initiative” and the Shanghai Cooperation Organization [51,52,53]. However, since multilateral cooperation involves many countries, there are significant differences in the country development goals and plans in the energy sector. Thus, many problems such as geopolitical conflicts and unbalanced industry development are prominent. It is very difficult to coordinate the interests of all parties and achieve balanced development, and it often takes longer to achieve multilateral practical cooperation. Therefore, China still has plenty of room for improvement in promoting the effectiveness of crude oil trade cooperation with member states, and its capacity level and international status in the process of helping to build a global energy governance system also urgently need to be further strengthened and improved.

4.2. Heterogeneity Test

In the context of globalization, energy—a key element in national development—is of crucial importance to China in terms of the stability of its trade [51,53,54,55]. The selection of target countries and associated energy diplomacy activities should be carefully conducted and be of far-reaching strategic significance. This study focused on 43 specific countries to explore in depth the characteristics and laws of different country groups in the energy trade based on a classified simulation analysis method.
Specifically, on the one hand, the 43 countries can be accurately divided into 17 Belt and Road countries and 26 non-Belt and Road countries based on the key attribute of whether a country participates in the Belt and Road Initiative. On the other hand, from the perspective of geopolitics, a secondary classification can be made according to the country belonging or not belonging to a neighbor of China; thus, 4 neighboring countries and 39 non-neighboring countries can be distinguished. Based on four types of countries divided by the above two dimensions and the same modeling paradigm established in Section 4.1, the time fixed effects and country fixed effects were introduced, and a total of 12 simulations were conducted (Table 5). This method can test the stability of the simulations and further conduct an analysis of national heterogeneity.

4.2.1. Impact of Diplomacy with “One Belt and One Road” Countries on Crude Oil Trade

Based on the classification of the countries belonging or not belonging to the Belt and Road Initiative, the simulation results are presented in Models 13–15. The detailed analyses are as follows.
Firstly, the regression coefficients of three variables (leader_meet_num, Lleader_meet_num and LLleader_meet_num) were 78.138 ***, 88.138 ***, and 89.323 ***, respectively, showing significant positive correlations. These results indicated that the meetings between the leaders injected strong impetus into the crude oil trade between two countries in the current year, the following year, and the third year, serving as a powerful support for trade growth.
Secondly, the regression coefficients of three variables (meet_in_china, Lmeet_in_china, and LLmeet_in_china) were −183.772 ***, −158.194 ***, and −165.335 ***, respectively, showing negative significances to crude oil trade, and indicating that the meeting place had a special impact on crude oil trade. Visits by Chinese leaders abroad are more conducive to increasing China’s crude oil imports relative to the visits by foreign leaders to China.
Thirdly, the regression coefficients of three variables (two_side, Ltwo_side, and LLtwo_side) were 149.042 *, 197.763 **, and 313.643 ***, respectively, displaying a significant positive impact to crude oil trade year by year. This result indicated that the deepening of bilateral cooperation can continuously contribute to the development of national crude oil trade.
In particular, it should be noted that the degree of impact of the above three key parameters on crude oil trade was significantly higher than the average values of other categories of countries (including non-Belt and Road Initiative countries, neighboring countries or non-neighboring countries) (Table 5), highlighting the uniqueness of Belt and Road Initiative countries under the influence of these variables.
In addition, variables such as the first meeting between the leaders of two countries or not, the upgrading of diplomatic levels, and joint statement involving oil cooperation mostly have insignificant regression results of their impact on crude oil trade in the current year. Overall, high-frequency bilateral diplomacy is conducive to increasing China’s crude oil imports, and visits by Chinese leaders abroad are more advantageous than visits by foreign leaders to China.
In contrast, almost all the simulation results of energy diplomacy indicators in Models 16–18 were insignificant for non-Belt and Road Initiative countries, indicating that the forms and behaviors of diplomatic activities with these countries currently had a weak promotional effect on China’s crude oil imports. Thus, it is necessary to re-examine the diplomatic strategies and explore potential cooperation opportunities.

4.2.2. Impact of Diplomacy with Neighboring Countries on Crude Oil Trade

Based on the classification of the countries belonging or not belonging to a neighbor of China, the results of neighboring countries were presented in Models 19–21 (Table 5). The detailed analyses were as follows.
Firstly, the regression coefficients of three variables (leader_meet_num, Lleader_meet_num, and LLleader_meet_num) were 318.492 ***, 318.144 ***, and 331.090 ***, respectively, showing significant positive promotional effects. These results indicated that the meetings between the leaders of China and its neighboring countries can promote China’s crude oil trade with these countries in the current year, the following year, and the second year. Compared with the Belt and Road Initiative countries, such a promotional effect is more prominent, laying a solid foundation for bilateral energy cooperation.
Secondly, the regression coefficients of three variables (meet_in_china, Lmeet_in_china, and LLmeet_in_china) were −263.671 **, −211.247 *, and −200.289, respectively, showing different degrees of significance to crude oil trade. The first two reached moderate and significant levels, and all three showed a negative impact trend, indicating that the meeting place factor also played a key role in crude oil trade between China and its neighboring countries, and the degree of negative effects induced by the meeting place factor was still higher than that induced by the factor of the Belt and Road Initiative countries. The underlying reasons for this need to be explored to help optimize the diplomatic meeting strategy.
Thirdly, the regression coefficients of three variables (two_side, Ltwo_side, and LLtwo_side) were 385.405 **, 354.798 *, and 417.538 **, respectively, showing significant positive pulling effects on China’s crude oil trade. It is worth noting that the degree of impact of the above-mentioned three key variables on crude oil trade was significantly greater than that of the corresponding variables contributed by the Belt and Road Initiative countries, further highlighting the important geopolitical role of neighboring countries under the influence of these key variables.
In addition, the impacts of the variables, such as the first meeting between the leaders of two countries or not, the upgrading of diplomatic levels, and the joint statement involving oil cooperation, on crude oil trade in the current year all have insignificant regression results.
In contrast, the simulation results of all indicators related to energy diplomacy for non-neighboring countries clearly displayed non-significance in Models 22–24. On the one hand, it is similar to the situation of non-Belt and Road Initiative countries, indicating that diplomatic activities with non-neighboring countries in terms of the form or specific behaviors had a relatively limited promotional effect on China’s crude trade imports. It is difficult to promote trade growth at present. On the other hand, it highlights that the high-frequency mutual visits between the leaders of two countries had a more decisive strategic value and far-reaching and lasting impact on strengthening China’s crude oil trade with its neighboring countries under the bilateral diplomatic framework, providing a key focus for future diplomatic policy adjustments.

5. Conclusions and Suggestions

The Chinese government has adopted an initiative to go out and conduct bilateral diplomacy with key resource countries. In particular, increasing the frequency of diplomacy with Belt and Road countries and neighboring countries has a significant impact on China’s ability to boost its crude oil trade. In contrast, high-level visits to China by resource countries or the inclusion of energy or oil-related contents in diplomatic outcome documents seem not to be conducive to raising China’s crude oil trade. Hypothesis 1 and 3 were proven to be correct, while hypothesis 2 was proven to be wrong. Moreover, hypothesis 2 is contrary to the general knowledge of many scholars. In addition, further research is needed on the impact of other diplomatic forms (e.g., video or phone calls between heads of state) on China’s crude oil trade.
As a major global energy importer, China urgently needs to attach great importance to safeguarding its own energy security via energy diplomacy. Based on our modeling analyses, the Chinese government should focus on the following aspects.
Firstly, the frequency and depth of energy diplomacy should be increased, and practical cooperation in the energy sector should be strengthened. Considering that high-frequency mutual visits between leaders play a significant role in promoting cooperation in the petroleum industries of two countries and safeguarding national energy security, the Chinese government should adopt a more proactive and higher-frequency high-level visit strategy to weave a denser international energy cooperation network and lay a solid foundation for energy cooperation.
Secondly, the “going global” strategy should be implemented to expand the breadth and effectiveness of energy diplomacy. Actively going abroad for diplomatic activities not only demonstrates China’s respect for its energy partners but also establishes a new path for deepening oil cooperation with resource-rich countries. Chinese senior officials should appropriately increase the frequency of visits to oil-producing countries and accurately match cooperation demands via face-to-face communication, thus facilitating the successful implementation of equal, mutually beneficial agreements in the petroleum sector.
Thirdly, more attention should be paid to key resource countries, and the strategic potential of bilateral energy diplomacy should be explored. Compared with broad discussions in multilateral settings, bilateral energy diplomacy has achieved remarkable results in promoting in-depth cooperation between China and core oil-supplying countries (such as Russia, Saudi Arabia, and Kazakhstan). Therefore, China should increase its investment in bilateral diplomacy with these key countries and promote the implementation of large-scale oil projects and the deepening of strategic cooperation via customization of strategic dialogs and project cooperation.
Fourthly, the layout of energy diplomacy should be optimized, and more attention should be paid to neighboring countries and those countries participating in the Belt and Road Initiative. Considering the advantages of geographical proximity and strong economic complementarity, China enjoys unique opportunities in conducting energy diplomacy with neighboring countries and those belonging to the Belt and Road Initiative (including neighboring countries such as Russia and Kazakhstan, as well as key node countries such as Saudi Arabia, Iraq, the United Arab Emirates, and Indonesia). China should further strengthen the energy diplomacy layout in this region and achieve resource sharing, risk sharing, and mutually beneficial development via the construction of an energy cooperation community of interests.
Fifthly, statements related to oil and gas or energy cooperation in documents describing energy diplomacy achievements should be made with caution, and the relationship between cooperation and competition should be properly balanced. When joint statements are publicly issued, great caution must be taken in deciding whether or not content related to oil and gas and energy cooperation is included. Given the possible chain reactions, such as intensified competition among resource countries or improper intervention from external forces, the Chinese government should make flexible decisions according to the specific stage and goals of cooperation. If the aim is to rapidly promote relevant cooperation in the short term, the government should avoid publicity. If the intention is to introduce competition, increase bargaining chips, and enhance the right to speak on energy prices, appropriate public statements can be considered to strategically guide the cooperation pattern in the international energy market.

Author Contributions

Conceptualization, B.L. and Z.R.; methodology, B.L.; software, B.L.; validation, B.L. and Z.R.; formal analysis, B.L.; investigation, B.L. and P.G.; resources, Z.R.; data curation, B.L.; writing—original draft preparation, B.L. and P.G.; writing—review and editing, B.L. and P.G.; visualization, B.L.; supervision, Z.R.; project administration, Z.R.; funding acquisition, B.L. and Z.R. All authors have read and agreed to the published version of the manuscript.

Funding

This research was funded by the Key Project of Sino-Pipeline International “Research on the Action of Creating Value by Benchmarking World-Class Enterprises for Sino-Pipeline International Company Limited in 2024–2025” (grant No. 2024-N/G-54811) and the Key Soft Science Project of China National Petroleum Corporation “Strategic Research on Mutually Beneficial Energy Cooperation between China and Russia in the New Era and New Journey” (grant No.2024B01241).

Data Availability Statement

The original contributions presented in the study are included in the article, further inquiries can be directed to the corresponding author.

Acknowledgments

All the editors and anonymous reviewers are gratefully acknowledged.

Conflicts of Interest

Authors Boyuan Li and Zhongyuan Ren were employed by the company CNPC. The remaining author declares that the research was conducted in the absence of any commercial or financial relationships that could be construed as a potential conflict of interest. The authors declare that this study received funding from the company CNPC. The funder was not involved in the study design, collection, analysis, interpretation of data, the writing of this article or the decision to submit it for publication.

Appendix A

Table A1. Statistics of the levels of diplomatic relations between China and 43 countries.
CountriesLevels of Diplomatic RelationsYear
RussiaDeepening Comprehensive Strategic Partnership2010
Comprehensive Strategic Partnership New Level2014
Comprehensive Strategic Partnership in New era2019
KazakhstanComprehensive Strategic Partnership2011
Comprehensive Strategic Partnership New Level2015
Permanent Comprehensive Strategic Partnership2019
The United Arab EmiratesStrategic Partnership2012
Comprehensive Strategic Partnership2018
EcuadorStrategic Partnership2015
Comprehensive Strategic Partnership2016
ArgentinaStrategic Partnership2004
Comprehensive Strategic Partnership2014
IranComprehensive Strategic Partnership2016
IraqStrategic Partnership2015
Saudi ArabiaComprehensive Strategic Partnership2016
QatarStrategic Partnership2014
KuwaitStrategic Partnership2018
OmanStrategic Partnership2018
EgyptComprehensive Strategic Partnership2016
AlgeriaComprehensive Strategic Partnership2014
SudanStrategic Partnership2015
UgandaComprehensive Cooperative Partnership2019
NigeriaStrategic Partnership2006
AngolaStrategic Partnership2010
Republic of the CongoComprehensive Strategic Partnership2016
Equatorial GuineaComprehensive Cooperative Partnership2015
GabonComprehensive Cooperative Partnership2016
Comprehensive Strategic Cooperative Partnership2023
CanadaStrategic Partnership2005
MexicoComprehensive Strategic Partnership2013
VenezuelaComprehensive Strategic Partnership2014
Round-the-Clock Comprehensive Strategic Partnership2023
BrazilComprehensive Strategic Partnership2012
AustraliaComprehensive Strategic Partnership2014
IndonesiaComprehensive Strategic Partnership2013
MalaysiaComprehensive Strategic Partnership2013
MalaysiaComprehensive Strategic Cooperative Partnership2008
MongoliaComprehensive Strategic Partnership2014
BritainGlobal Comprehensive Strategic Partnership toward the 21st Century2015
NorwayNormalizing the Bilateral Relations2016
South SudanEstablishing Diplomatic Relations2011
ChadReestablish Diplomatic Relations2006
YemenFriendly and Cooperative Relationsbefore 2010
SyriaFriendly and Cooperative Relationsbefore 2010
Strategic Partnership2023
AmericaConstructive Strategic Partnerships1997
New Model of Major Power Relationship2015
NigerReestablishing Diplomatic Relations1996
AzerbaijanFriendly and Cooperative Relationsbefore 1994
ColombiaEstablishing Diplomatic Relations1980
Strategic Partnership2023
LibyaEstablishing Diplomatic Relations1978
GuyanaEstablishing Diplomatic Relations1972
CameroonEstablishing Diplomatic Relations1971
GhanaEstablishing Diplomatic Relations1960
Source: Ministry of Foreign Affairs of the People’s Republic of China (https://www.gov.cn/, accessed on 1 March 2024).

References

  1. Wang, J.; Cao, Y.; Wang, Y.; Rao, J. Ensuring energy security in China through international energy cooperation. Strateg. Study CAE 2021, 23, 118–123. [Google Scholar] [CrossRef]
  2. Tang, W.; Wang, J.; Yuan, X.; Wang, S.; Shao, Q.; Hu, J. Bilateral political relations and the security of China’s energy imports. Energy Explor. Exploit. 2024, 42, 789–813. [Google Scholar] [CrossRef]
  3. Zhou, Y.; Wu, L. Global energy governance transformation and China’s strategic choice. J. Zhejiang Univ. Humanit. Soc. Sci. 2024, 54, 30–40. [Google Scholar]
  4. Benjamin, E.; Steven, T.L. The stabilizing effects of international politics on bilateral trade flows. Foreign Policy Anal. 2015, 11, 151–171. [Google Scholar]
  5. Chia-yi, L. China’s energy diplomacy: Does Chinese foreign policy favor oil-producing countries? Foreign Policy Anal. 2019, 15, 570–588. [Google Scholar]
  6. Davis, L.C.; Fuchs, A.; Johnson, K. State control and the effects of foreign relations on bilateral trade. J. Confl. Resolut. 2019, 63, 405–438. [Google Scholar] [CrossRef]
  7. Lin, L.; Lei, J.; Singh, G.; Federico, R. Peace engineering in practice: China’s energy diplomacy strategy and its global implications. Sustainability 2023, 15, 1442. [Google Scholar] [CrossRef]
  8. Gökçe, Z.O.; Hatipoglu, E.; Belaïd, F. Navigating energy diplomacy in times of recovery and conflict: A study of cross-border energy trade dynamics. Resour. Policy 2024, 90, 104850. [Google Scholar] [CrossRef]
  9. Xin, B.; Zhang, M. Evolutionary game on international energy trade under the Russia-Ukraine conflict. Energy Econ. 2023, 125, 106827. [Google Scholar] [CrossRef]
  10. Griffiths, S. Energy diplomacy in a time of energy transition. Energy Strategy Rev. 2019, 26, 100386. [Google Scholar] [CrossRef]
  11. Grossman, G.M.; Helpman, E. Trade wars and trade talks. J. Political Econ. 1995, 103, 675–708. [Google Scholar] [CrossRef]
  12. Mitra, D. Endogenous lobby formation and endogenous protection: A long-run model of trade policy determination. Am. Econ. Rev. 1999, 89, 1116–1134. [Google Scholar] [CrossRef]
  13. Alesina, A.; Spolaore, E.; Wacziarg, R. Economic integration and political disintegration. Am. Econ. Rev. 2000, 90, 1276–1296. [Google Scholar] [CrossRef]
  14. Berger, D.; Easterly, W.; Nunn, N.; Satyanath, S. Commercial imperialism? Political influence and trade during the cold war. Am. Econ. Rev. 2013, 103, 863–896. [Google Scholar] [CrossRef]
  15. Heilmann, K. Does political conflict hurt trade? Evidence from consumer boycotts. J. Int. Econ. 2016, 99, 179–191. [Google Scholar] [CrossRef]
  16. Yakop, M.; Bergeijk, V.G.A.P. Economic diplomacy, trade and developing countries. Camb. J. Reg. Econ. Soc. 2011, 4, 253–267. [Google Scholar] [CrossRef]
  17. Moons, V.J.S.; Bergeijk, G.A.P. Does economic diplomacy work? A meta-analysis of its impact on trade and investment. World Econ. 2017, 40, 336–368. [Google Scholar] [CrossRef]
  18. Ferguson, S.; Forslid, R. Sizing up the impact of embassies on exports. Scand. J. Econ. 2019, 121, 278–297. [Google Scholar] [CrossRef]
  19. Martincus, V.C.; Carballo, J. Is export promotion effective in developing countries? Firm-level evidence on the intensive and the extensive margins of exports. J. Int. Econ. 2008, 76, 89–106. [Google Scholar] [CrossRef]
  20. Nitsch, V. State visits and international trade. World Econ. 2007, 30, 1797–1816. [Google Scholar] [CrossRef]
  21. Head, K.; Ries, J. Do trade missions increase trade? Can. J. Econ. Rev. Can. D’economique 2010, 43, 754–775. [Google Scholar] [CrossRef]
  22. Yeo, T.; Lee, M. Presidential diplomacy and international trade: A case of Korea. J. Korea Trade 2009, 13, 1–19. [Google Scholar]
  23. Lien, D.; Lo, M.; Bojanic, D. Asymmetric effects of cultural institutes on trade and foreign direct investment. World Econ. 2019, 42, 1520–1553. [Google Scholar] [CrossRef]
  24. Demir, F.; Im, H. Effects of cultural institutes on bilateral trade and FDI flows: Cultural diplomacy or economic altruism? World Econ. 2020, 43, 2463–2489. [Google Scholar] [CrossRef]
  25. Yang, X.; Zhang, Q. China’s foreign economic and trade relations and diplomatic layout. Q. J. Int. Politics 2010, 25–48. [Google Scholar]
  26. Jiang, Y.; Li, Q. Research on the promoting effect of foreign relations on bilateral trade. Dongyue Trib. 2013, 34, 151–157. [Google Scholar]
  27. Wang, X.; Tian, X. Trade creation effects of diplomatic visits: Evidence from China. J. Int. Trade 2017, 6, 15–26. [Google Scholar]
  28. He, Z.; Liang, X.; Chen, Y. Diplomatic visits, imports of extrusion and welfare of enterprises. J. Int. Trade 2019, 11, 88–99. [Google Scholar]
  29. Florini, A.; Sovacool, K.B. Who governs energy? The challenges facing global energy governance. Energy Policy 2009, 37, 5239–5248. [Google Scholar] [CrossRef]
  30. Graaf, D.V.T.; Colgan, J. Global energy governance: A review and research agenda. Palgrave Commun. 2016, 2, 15047. [Google Scholar] [CrossRef]
  31. Luomi, M. Is the Paris Agreement a success and what does it mean for the energy sector? Oxf. Energy Forum 2017, 105, 4–7. [Google Scholar]
  32. Griffiths, S. Renewable energy policy trends and recommendations for GCC countries. Energy Transit 2017, 1, 3. [Google Scholar] [CrossRef]
  33. Griffiths, S. A review and assessment of energy policy in the Middle East and North Africa region. Energy Policy 2017, 102, 249–269. [Google Scholar] [CrossRef]
  34. Pollins, B.M. Does trade still follow the flag? Am. Political Sci. Rev. 1989, 8, 465–480. [Google Scholar] [CrossRef]
  35. Nitsch, V. Honey, I shrunk the currency union effect on trade. World Econ. 2002, 25, 457–474. [Google Scholar] [CrossRef]
  36. Rose, K.A. The foreign service and foreign trade: Embassies as export promotion. World Econ. 2007, 30, 22–38. [Google Scholar] [CrossRef]
  37. Martincus, V.C.; Estevadeordal, A.; Gallo, A.; Gallo, A.; Luna, J. Information barriers, export promotion institutions, and the extensive margin of trade. Rev. World Econ. Weltwirts Chaftliches Arch. 2010, 146, 91–111. [Google Scholar] [CrossRef]
  38. Jacques, M. Does a Country Need a Promotion Agency to Attract Foreign Direct Investment? A Small Analytical Model Applied to 58 Countries; Policy, Research working paper series; no. WPS 3028; World Bank Group: Washington, DC, USA, 2003. [Google Scholar]
  39. Gil, S.; Llorca, R.; Serrano, M.A.J. Measuring the impact of regional export promotion: The Spanish case. Pap. Reg. Sci. 2008, 87, 139–146. [Google Scholar] [CrossRef]
  40. Yang, Q. The Impact of Diplomatic Relations on Bilateral Trade: A Case Study of China. Master’s Thesis, China Foreign Affairs University, Beijing, China, 2015. [Google Scholar]
  41. Tao, X. A Study on the Influence of Political Diplomacy on China’s Bilateral Trade Flows. Master’s Thesis, Anhui University of Finance and Economics, Bengbu, China, 2017. [Google Scholar]
  42. Shao, Y.; Qiao, H.; Wang, S. What determines China’s crude oil importing trade patterns? Empirical evidences from 55 countries between 1992 and 2015. Energy Policy 2017, 109, 854–862. [Google Scholar] [CrossRef]
  43. Global Trade Tracker. The Swiss Army Knife for Global Trade Flows. 2023. Available online: https://www.globaltradetracker.com (accessed on 1 January 2024).
  44. Du, J.; Sun, Z.; Zhao, Y.; Diao, X.; Chen, H. New pattern and trends of global crude oil trade under turbulent situations. Int. Pet. Econ. 2023, 31, 50–59. [Google Scholar]
  45. Xia, S.; Hao, L.; Tang, W.; Cui, P.; Wu, F. The evolution of competition and cooperation in world crude oil flows from the perspective of complex networks and its enlightenment to China’s oil cooperation. J. Nat. Resour. 2020, 35, 2655–2673. [Google Scholar] [CrossRef]
  46. Bai, S. Risk and management analysis of China’s petroleum import and export trade. Mod. Econ. Inf. 2019, 12, 160. [Google Scholar]
  47. Dong, L.; Gao, Q. Trade facilitation, neighboring effects and bilateral agricultural exports—Empirical research based on spatial models of China and neighboring countries. World Agric. 2020, 04, 66–77. [Google Scholar]
  48. Liu, Y.; Zhou, J.; Zeng, X. Mutualism effect of industrial transfer between China and the Belt and Road countries. China Ind. Econ. 2023, 02, 55–73. [Google Scholar]
  49. Wang, J.; Sun, X.; Li, J.; Chen, J.; Liu, C. Has China’s oil-import portfolio been optimized from 2005 to 2014? A perspective of cost–risk tradeoff. Comput. Ind. Eng. 2018, 126, 451–464. [Google Scholar] [CrossRef]
  50. Zhao, Y.; Kong, G.; Li, Z.; Ma, L.; Ni, W. Strategic analysis of global energy transition and China’s energy revolution. Strateg. Study CAE 2021, 23, 15–23. [Google Scholar] [CrossRef]
  51. Shi, B.; Cai, T. Has China’s oil investment in Belt and Road initiative countries helped its oil import? Energies 2020, 13, 3176. [Google Scholar] [CrossRef]
  52. Chen, W.; Niu, X.; Ke, W.; Yu, Z. Investigating the energy trade networks in the Belt and Road regions: Structures and evolution. Energy 2023, 283, 129157. [Google Scholar] [CrossRef]
  53. Duan, M.; Duan, Y. Research on oil and gas energy cooperation between China and Central-North Asian countries under the “One Belt and One Road” strategy. Energies 2023, 16, 7326. [Google Scholar] [CrossRef]
  54. Niu, X.; Chen, W.; Wang, N. Spatiotemporal dynamics and topological evolution of the global crude oil trade network. Energies 2023, 16, 1728. [Google Scholar] [CrossRef]
  55. Berdysheva, S.; Ikonnikova, S. The energy transition and shifts in fossil fuel use: The study of international energy trade and energy security dynamics. Energies 2021, 14, 5396. [Google Scholar] [CrossRef]
Figure 1. The distribution of the total crude oil export volume of major global resource countries from 2000 to 2023 (unit: 104 tons/year). Source: Map Technology Review Center of the Ministry of Natural Resources of the People’s Republic of China; BP stats review 2023 (https://www.energyinst.org/statistical-review, accessed on 1 July 2024); Global Trade Tracker (http://www.globaltradetracker.com/start, accessed on 1 July 2024); China National Petroleum Corporation Economics and Technology Research Institute.
Energies 18 00851 g001
Figure 2. Distribution of crude oil exports of major global resource countries to China from 2000 to 2023 (unit: 104 tons/year). Source: Map Technology Review Center of the Ministry of Natural Resources of the People’s Republic of China; General Administration of Customs of the People’s Republic of China (http://stats.customs.gov.cn/, accessed on 1 July 2024); Economics & Technology Research Institute, CNPC.
Energies 18 00851 g002
Figure 3. Statistics on China’s bilateral and multilateral diplomatic activities of major resource countries from 2000 to 2023. Source: Ministry of Foreign Affairs of the People’s Republic of China (https://www.fmprc.gov.cn/zyxw/, accessed on 1 July 2024).
Energies 18 00851 g003
Figure 4. The distribution of bilateral energy diplomatic visits between China and 43 countries from 2000 to 2023. Source: Ministry of Foreign Affairs of the People’s Republic of China (https://www.fmprc.gov.cn/zyxw/, accessed on 1 July 2024).
Energies 18 00851 g004
Figure 5. Frequency distribution of joint statements between China and 43 countries mentioning energy and petroleum. Source: Ministry of Foreign Affairs of the People’s Republic of China (https://www.fmprc.gov.cn/zyxw/, accessed on 1 July 2024).
Energies 18 00851 g005
Table 1. An overview of the impact of energy diplomacy on international energy cooperation and trade.
TopicVariable FactorsReferences
The impact of political factors on international tradePolitical relations (pressure, motivation, etc.)[11,12,34]
Political separatism[13]
Intervention from relevant government departments[14]
The impact of overseas institutions on international tradePolitical conflicts[15,35]
Overseas embassies[16,17,18,19,36]
Consulates[21,22,37]
Overseas trade promotion institutions[38,39]
Overseas cultural institutions[23,24]
The impact of diplomatic activities on international tradeState visits, official visits, and visits by heads of state[26,27,28,35,40]
Diplomatic relations, diplomatic levels, diplomatic events, and high-level mutual visits [40,41]
Bilateral and multilateral diplomacy[29,30,31,32,33]
Table 2. Energy diplomacy results between China and other countries from 2000 to 2023.
CountriesNMHSNVNTUDLDCIOGDCIEDCMNNBMDO
Algeria32111414164
Argentina3551418176
United Arab Emirates2410251593
Oman199141271
Azerbaijan9501532
Egypt41141320204
Angola216111282
Australia79161947306
Brazil641118372710
Equatorial Guinea18601980
Russia2687335015210956
Ecuador15424774
Republic of the Congo15511563
Colombia15411872
Guyana12201571
Kazakhstan15647229906024
Canada45101632137
Ghana18601980
Gabon218229101
Cameroon207011091
Qatar131013941
Kuwait168151053
Libya2890214120
Malaysia1052211155498
USA7528121502425
Mongolia492217301711
Mexico5271732202
South Sudan16401870
Niger19701990
Nigeria15411673
Norway3080416130
Saudi Arabia156151145
Sudan27101314121
Venezuela12222662
Uganda218111192
Syria12611661
Yemen11501650
Iraq17712981
Iran206131183
Indonesia12323116705210
UK882019543010
Vietnam12230113685215
Chad20701990
Abbreviations: NMHS = number of meetings between heads of state; NV = number of visits; NTUDL = number of times of upgrading diplomatic levels; DCIOG = diplomatic contents involving oil and gas; DCIE = diplomatic contents involving energy; DCMN = diplomatic contents mentioning no oil, gas, or energy; NBMDO = number of bilateral and multilateral diplomatic occasions. Source: Ministry of Foreign Affairs of the People’s Republic of China (https://www.gov.cn/, accessed on 1 July 2024).
Table 3. Descriptions of several variables in our model.
Variable TypeVariable NameVariable ExplanationData Sources
Dependent variableExport_ChinaOil export volume to China of certain country in given yearGeneral Administration of Customs of the People’s Republic of China (http://stats.customs.gov.cn/, accessed on 1 July 2024); Economics & Technology Research Institute, CNPC
Independent variableLeader_meet_numNumber of meetings between the leaders of two countries in given yearMinistry of Foreign Affairs of the People’s Republic of China (https://www.gov.cn/, accessed on 1 July 2024); Author Compilation
First_meetFirst meeting between the leaders of two countries or not
Diplomacy_rankWhether diplomatic relations between two countries were upgraded or not
Diplomacy_rank_oilJoint statement involving oil or not
Meet_in_ChinaNumber of times the leader of the country visited China in given year
Two_sideBilateral diplomacy or not
Control variableExport_totalTotal oil export volume of country in given yearBP stats review 2023 (https://www.energyinst.org/statistical-review, accessed on 1 July 2024), Global Trade Tracker (http://www.globaltradetracker.com/start/, accessed on 1 July 2024)
China_total_importTotal oil import volume of China in given yearGeneral Administration of Customs of the People’s Republic of China (http://stats.customs.gov.cn/, accessed on 1 July 2024); Economics & Technology Research Institute, CNPC
Stability test variableDiplomacy_rank_energyJoint statement involving energy or notMinistry of Foreign Affairs of the People’s Republic of China (https://www.gov.cn/, accessed on 1 July 2024); Author Compilation
Categorical variableNeighborWhether the partner country is a neighboring country of China or not
Belt and Road PlanWhether the partner country is a “The Belt and Road” signatory country or not
Table 4. Summary of overall results of the fixed-effects model for China’s energy diplomacy—crude oil imports.
CategoryBase ModelsModels with a One-Period Forward ShiftModels with a Two-Period Forward Shift Substitution
VariablesModel 1Model 2Model 3Model 4Model 5Model 6Model 7Model 8Model 9Model 10Mode 11Model 12
leader_meet_num50.268 ***49.523 ***53.193 *** 78.023 ***
first_meet−172.85 −191.64 −168.05 −215.29
diplomacy_rank68.93 56.06 58.22 59.97
diplomacy_rank_oil−154.043 ***−157.688 ***−149.632 ***
diplomacy_rank_energy −85.475 ***
meet_in_china−93.517 ***−98.354 ***−91.698 *** −90.730 ***
two_side82.930 *78.265 *90.495 ** 78.201 *
Lleader_meet_num 57.969 ***49.012 ***62.520 *** 83.200 ***
Lfirst_meet −211.15 −209.97 −209.01 −242.55
Ldiplomacy_rank 75.11 59.94 62.38 63.08
Ldiplomacy_rank_oil −118.466 **−113.839 ***−107.539 **
Ldiplomacy_rank_energy −70.568 ***
Lmeet_in_china −83.775 ***−84.738 ***−84.603 *** −80.831 ***
Ltwo_side 91.318 **93.129 **99.565 ** 93.319 **
LLleader_meet_num 45.013 ***35.650 **49.994 *** 44.599 **
LLfirst_meet −184.07 −201.32 −186.90 −213.92
LLdiplomacy_rank 180.58 161.37 170.53 167.45
LLdiplomacy_rank_oil −89.429 *−89.261 **−78.624 *
LLdiplomacy_rank_energy −11.06
LLmeet_in_china −76.984 **−77.880 ***−78.751 *** −81.145 ***
LLtwo_side 121.200 ***126.729 ***127.470 *** 115.292 **
ControlYES YES YES YES YES YES YES YES YES YES YES YES
ConstantYES YES YES YES YES YES YES YES YES YES YES YES
Time FixedYES YES YES
Nation Fixed YES YES YES
Time&Nation Fixed YES YES YESYESYESYES
Observations989.00 989.00 989.00 903.00 903.00 903.00 860.00 860.00 860.00 989.00 903.00 860.00
Number of id43.00 43.00 43.00 43.00 43.00 43.00 43.00 43.00 43.00 43.00 43.00 43.00
R-squared0.56 0.55 0.56 0.55 0.53 0.55 0.53 0.52 0.54 0.56 0.55 0.53
Explanations: *** p < 0.01, ** p < 0.05, and * p < 0.1.
Table 5. Summary of country grouping analysis results of the fixed-effects model for China’s energy diplomacy—crude oil imports.
Category“Belt and Road” CountriesNon-“Belt and Road” CountriesNeighboring CountriesNon-Neighboring Countries
VariablesModel 13Model 14Model 15Model 16Model 17Model 18Model 19Model 20Model 21Model 22Model 23Model 24
leader_meet_num78.138 *** 24.816 318.492 *** −25.411 *
first_meet−425.808 43.008 −255.713 −161.103
diplomacy_rank92.968 25.983 38.337 24.534
diplomacy_rank_oil−130.887 * −39.055 −367.105 * 33.574
meet_in_china−183.772 *** −12.99 −263.671 ** 20.587
two_side149.042 * −11.961 385.405 ** 27.937
Lleader_meet_num 88.180 *** 41.131 ** 318.144 *** −12.007
Lfirst_meet −492.603 11.442 −145.58 −207.715
Ldiplomacy_rank 100.072 −66.549 201.549 −53.49
Ldiplomacy_rank_oil −115.38 −42.594 −337.144 50.533
Lmeet_in_china −158.194 *** −6.004 −211.247 * 11.05
Ltwo_side 197.763 ** −10.123 354.798 * 45.169
LLleader_meet_num 89.323 *** 38.265 * 331.090 *** −11.351
LLfirst_meet −317.004 −196.824 −89.422 −212.244
LLdiplomacy_rank 86.57 51.078 168.88 111.098
LLdiplomacy_rank_oil −114.809 −27.978 −375.542 82.332 *
LLmeet_in_china −165.335 *** −23.506 −200.289 −9.174
LLtwo_side 313.643 *** −15.488 417.538 ** 14.447
ControlYESYESYESYESYESYESYESYESYESYESYESYES
ConstantYESYESYESYESYESYESYESYESYESYESYESYES
TimeFixed*Nation FixedYESYESYESYESYESYESYESYESYESYESYESYES
Observations374357340572546520888480858819780
Number of id171717262626444393939
R-squared0.66 0.64 0.63 0.46 0.47 0.48 0.70 0.64 0.59 0.64 0.64 0.63
Explanations: *** p < 0.01, ** p < 0.05, and * p < 0.1.
Disclaimer/Publisher’s Note: The statements, opinions and data contained in all publications are solely those of the individual author(s) and contributor(s) and not of MDPI and/or the editor(s). MDPI and/or the editor(s) disclaim responsibility for any injury to people or property resulting from any ideas, methods, instructions or products referred to in the content.

