Article

Simulated Results of a Passive Energy Retrofit Approach for Traditional Listed Dwellings in the UK

School of Architecture, Technology and Engineering, University of Brighton, Brighton BN2 4GJ, UK
*
Authors to whom correspondence should be addressed.
Energies 2025, 18(4), 850; https://doi.org/10.3390/en18040850
Submission received: 8 December 2024 / Revised: 26 January 2025 / Accepted: 31 January 2025 / Published: 11 February 2025
(This article belongs to the Special Issue Building Energy Performance Modelling and Simulation)

Abstract

:
Energy performance improvements in existing homes play a substantial role in the achievement of the UK’s net-zero emissions target. However, retrofitting dwellings remains a particularly challenging task in the UK, where traditional dwellings make up a large part of the building repository. Traditional dwellings’ contribution to decarbonization has not yet been fully realized due to the risks imposed to the thermo-hygrometric balance of their constructions and to their heritage value. These tend to hinder the “fabric-first” approach for the retrofit of such dwellings, where active measures are often prioritized. The aim of this research is to propose a systemic approach to intervene in Traditional Listed Dwellings (TLDs) to improve their energy performance by means of passive retrofit measures and to shape a more future-proof heritage. A mixed methodology was developed that utilizes 19th C TLD case studies (CSs) in South-East England and dynamic energy simulation (DES) to investigate their current energy performance and possible improvements using responsible, safe and effective energy retrofit scenarios. Providing an overview of the methodology adopted in this research, this paper presents the main results of this study. This paper highlights the savings associated with the best-performing combinations of retrofit measures and the areas of intervention where the highest energy and carbon savings can be achieved.

1. Introduction

In the UK, buildings are responsible for 20% of total greenhouse gas emissions; most of such emissions are due to dwellings, from the combustion of natural gas for heating [1]. Therefore, energy efficiency improvements for this part of the stock have been newly emphasized as a key strategy to work towards the achievement of the zero emissions target [2]. Active retrofit measures, e.g., transitioning away from gas boilers, are relatively straightforward to implement, primarily subject to the establishment of appropriate regulatory frameworks. Passive measures, which focus on enhancing the building envelope to reduce energy demand, on the other hand, present significantly greater challenges. These challenges arise from a variety of factors, as outlined below.
Approximately one quarter of the UK’s dwellings are considered traditional buildings, being built before 1919 [3]. Their envelope constructions are made of solid permeable masonry walls, single-glazed timber windows and uninsulated floors and roofs; therefore, these dwellings are generally poorly performing [4]. However, these are also “hard to treat” properties [5]; in fact, any retrofit intervention must consider their delicate thermo-hygrometric balance, or it might result in unintended consequences, detrimental for the health of the fabric and occupants [3,6]. Furthermore, most traditional buildings have some heritage value, contributing to the character and aesthetics of their area [7]. Consequently, approximately one quarter of the traditional housing stock in the UK is either listed as or within a conservation area [8]. This makes the energy upgrade of such dwellings even more challenging as the potential energy savings from retrofit measures need to be weighed against the damage they may pose to their heritage value. As a result, the contribution of traditional dwellings to carbon reduction efforts within the residential sector has remained relatively limited thus far. Nevertheless, in the view of multiple stakeholders, historic buildings can play a substantial part in achieving the net-zero target and should be included in decarbonization policies [9]. This stresses the need for a major planning reform to enable heritage buildings’ full contribution to be realized. It is the government’s intention [10] to review, update and simplify the planning framework for listed buildings and conservation areas to facilitate sympathetic interventions “that support their continued use and address climate change” [11]. This could be achieved by revising the National Planning Policy Framework (NPPF) [12] to allow for a closer relationship between heritage protection and environmental sustainability. This principle is already contained in the NPPF, which describes sustainable development as one that contributes to protecting the historic environment while prescribing “positive improvements” to it [12]. Retrofit interventions may ultimately contribute to the aim of listing by allowing these assets to be kept in use and fully enjoyed by future generations.
Given this agenda, the study described in this paper aimed to propose suitable passive retrofit interventions for Traditional Listed Dwellings (TLDs) in South-East England to reduce their heating energy consumption, and hence their carbon emissions. The geographical setting chosen for this study is the city of Brighton and Hove, where buildings of traditional construction account for nearly 40% of the total dwelling stock [13]. Most of these traditional buildings date back to the early 19th C, the Regency period, when Brighton flourished from a fishing town into a seaside resort [14]. Over time, the grand terraced houses built in this period (Figure 1) were split into flats, and many were rented out, leading to a high rate of deterioration [15]. This study selected representative case studies (CSs) amongst the 19th C TLD population of Brighton and utilized a mixed-method approach centered around dynamic energy simulation (DES) to assess their current energy performance and the energy and carbon savings achievable by means of a range of suitable passive retrofit measures.
After an overview of the methodology adopted for this research, this paper presents the results of this study, highlighting the most effective combinations of responsible and safe interventions, as well as the areas of intervention where the highest energy and carbon savings could be attained.

2. Literature Review

2.1. Energy Retrofit for Buildings: The Body of Research

A critical literature review was carried out to aid in the decisions regarding the methodological approach for this study. The analysis of the literature cast light on a gap in research concerning the investigation of the current energy performance and thermal behavior of TLDs and highlighted the need for a holistic and comprehensive methodology to propose interventions and to balance environmental and cultural issues.
Table 1 reports a synthesis of the studies reviewed, their geographic setting (highlighted in grey those carried out in the UK), the main method(s) utilized and the retrofit interventions assessed (in bold the passive measures).
The studies conducted on heritage buildings constitute only a minority of the whole body of research on building energy efficiency. The literature review showed that the use of energy simulation was extensive in such studies; when simulation was the main method, the use of CSs allowed for a reliable validation tool because it allowed for a comparison of simulated and measured data, providing a triangulation of the findings and better reliability of the results generated. However, the studies on heritage buildings were often limited either to the investigation of a single retrofit intervention or a single CS of (often public) buildings, whereas little has been conducted on heritage buildings using multiple CS methods. The studies conducted by Ingram [64] and Moran [52] on traditional dwellings used a limited number of CSs and a limited validation strategy (energy consumption data for some of the cases). Organ et al. [7] and Wise et al. [63] attempted a more comprehensive approach to the problem of traditional heritage dwellings retrofit; however, their results had some limitations due to the use of steady-state models and archetypal dwellings, as well as the lack of a validation strategy based on measured data. Their methodology could be improved using multiple methods of data collection, a quality check and analysis and multiple CSs to enhance the validity and reliability of the results generated. Due to the wide range of uncertainties in the input data and in the assumptions necessary to model traditional dwellings, the potential of such models to accurately represent the thermal behavior of the real building depends on the quality of the data used for calibration. Only a few studies on traditional heritage buildings calibrated their results with real data, and they were frequently limited to a single CS [7,17,24,26,29,35,36,37,46,47,50,52,54,57,58,61,63].

2.2. Energy Retrofit for Buildings of Heritage Value: Guidance and Advice from Conservation Bodies

To make an informed decision concerning the retrofit measures available to improve the energy performance of TLDs, a wide range of studies were consulted, covering regulation, guidance and advice, as well as previous academic research on the energy retrofit of traditional buildings and buildings of heritage value.
When addressing energy improvement interventions for older buildings of heritage value, a special approach is advocated unanimously by conservation bodies; one that takes the fabric of such buildings in special account for their heritage value and thermo-hygrometric behavior, while aiming to improve their energy performance [3,6,65,66,67,68,69,70,71,72,73,74,75,76,77,78,79,80,81,82,83,84].
Traditional buildings are made of porous, breathable materials; their envelope can easily absorb moisture from the indoor and outdoor environment and release it when it dries out. Thick, solid masonry walls also provide them with high thermal inertia. These proprieties combined facilitate traditional buildings’ ability to buffer humidity and heat fluctuations [6,83]. Sympathetic interventions for traditional dwellings must account for such a delicate balance in their thermo-hygrometric behavior [4,16,65,77,78]. Therefore, before planning any retrofit interventions on buildings of traditional construction, a clear understanding of their heat and moisture behavior is key to avoid unintended consequences, such as the problems of moisture condensation and timber decay [6,83].
A whole-building approach is often called for by conservation bodies, one that considers the building as a whole and in its context, to find “balanced solutions that save energy, sustain heritage significance, and maintain a comfortable and healthy indoor environment” [77] (p. 9). This can be achieved by ensuring that any adopted measure is responsible (respects the heritage features of the building), safe (accounts for the thermo-hygrometric equilibrium of its constructions, minimizing the risk of unintended consequences) and effective (improves energy performance).
The validity of a ‘fabric-first’ approach, widely recommended to date for energy improvement interventions, has recently been questioned due to the urgency of the net-zero target, which might be more quickly addressed at a large scale by first decarbonizing heating for existing dwellings [85]. Even more difficult is the application of the fabric-first approach for TLDs, whose envelopes are their most vulnerable and valuable features. Retrofit interventions in this case must aim to strike a balance between improving energy performance, respecting the special character of the dwelling and avoiding risks for the health of the building’s fabric and occupants.
The least invasive measures are the most favorable to conservation bodies [75,77,78,80]; therefore, the systematic maintenance and repair of the building fabric and systems should be a priority before considering any more invasive interventions [6,77,83,84,86]. Thus, a whole-building retrofit approach tailored to TLDs should consider improving building services and controls and addressing the occupants’ behavior; lastly, any alteration to their fabric should be addressed [57,66].

3. Methodology—Materials and Methods

3.1. The Research Framework

The body of literature recommends a sequential approach to address energy efficiency improvements and the management of change for heritage buildings [4,33,52,58,64,86]. The most common approach starts with establishing a baseline scenario for the evaluation of different retrofit solutions [25,87,88] and for heritage impact assessment [24,89,90]. It is then possible to identify potential changes to be introduced to the baseline scenario and measure their impact against the base case performance.
Our study adopted this framework, and hence a methodological sequential approach; this stems from identifying the heritage value recognized by the listing of selected 19th C TLD CSs and assessing the current energy performance and thermal behavior of the CSs investigated, then follows by devising appropriate retrofit solutions and assessing their effect on energy consumption and carbon emissions. The mixed methodology adopted in this study further develops this approach to include an analysis of the impact of such interventions on the thermo-hygrometric balance and heritage value of TLDs and comes up with a range of responsible, safe and effective energy retrofit scenarios.
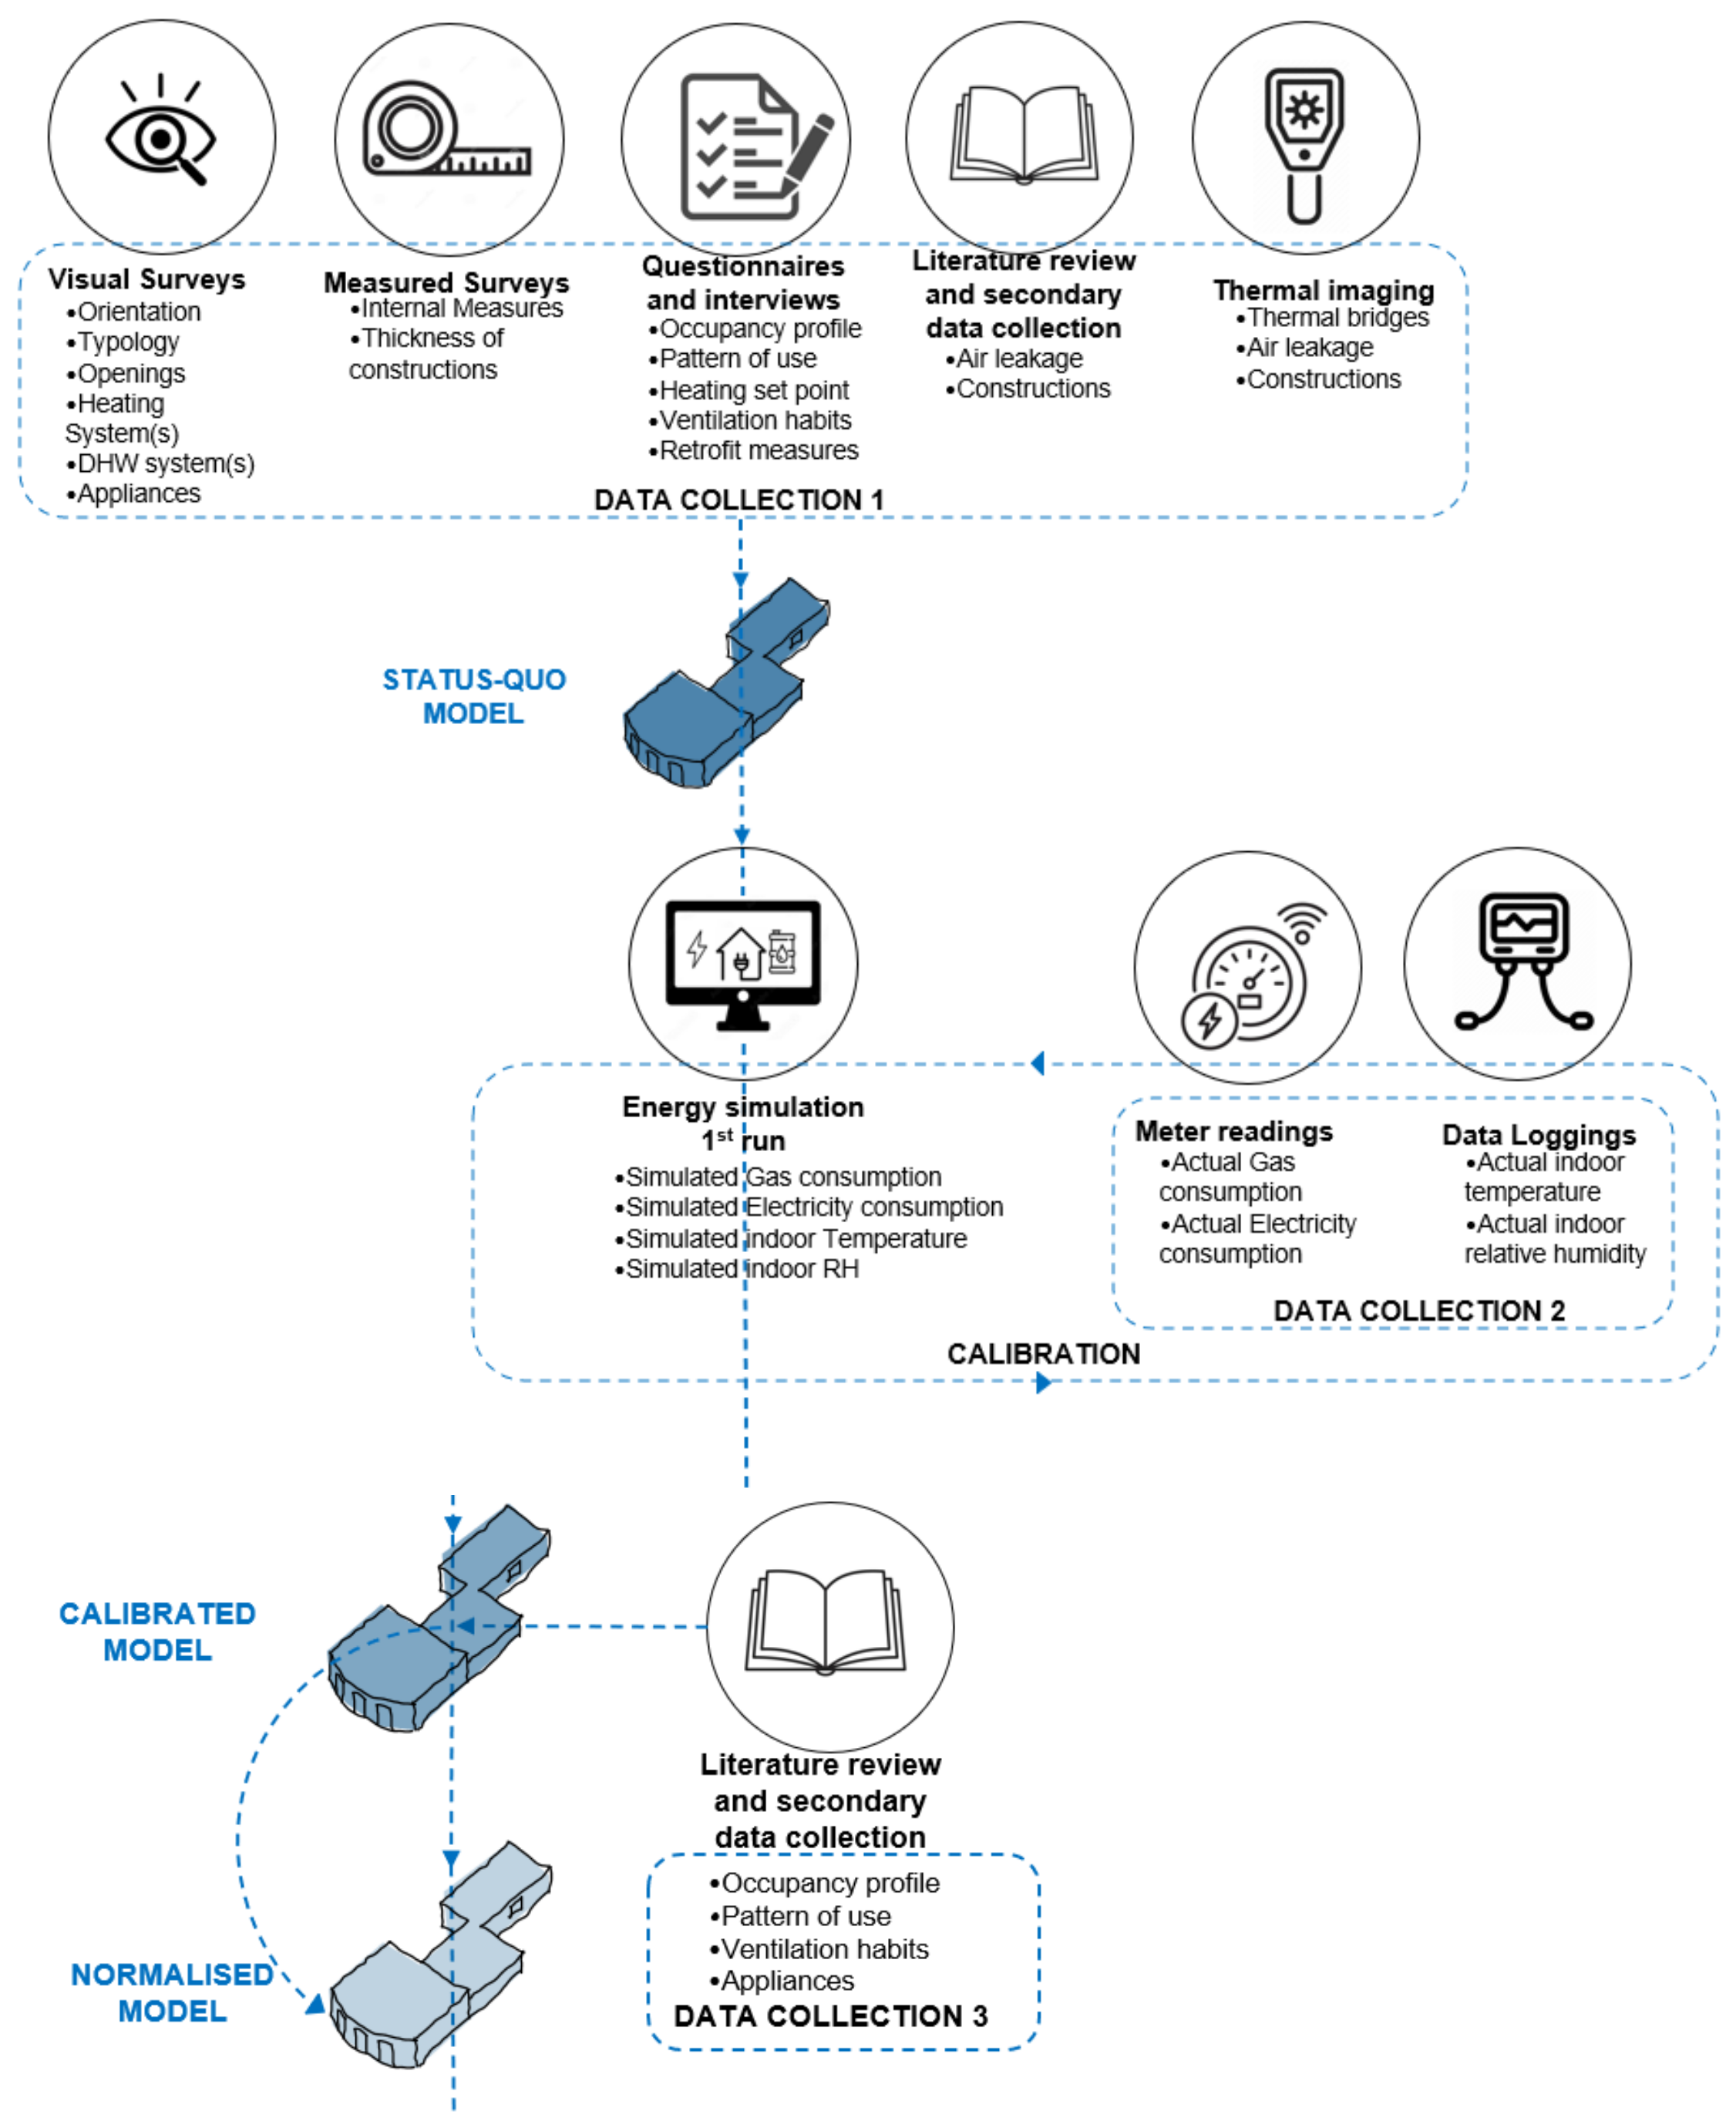
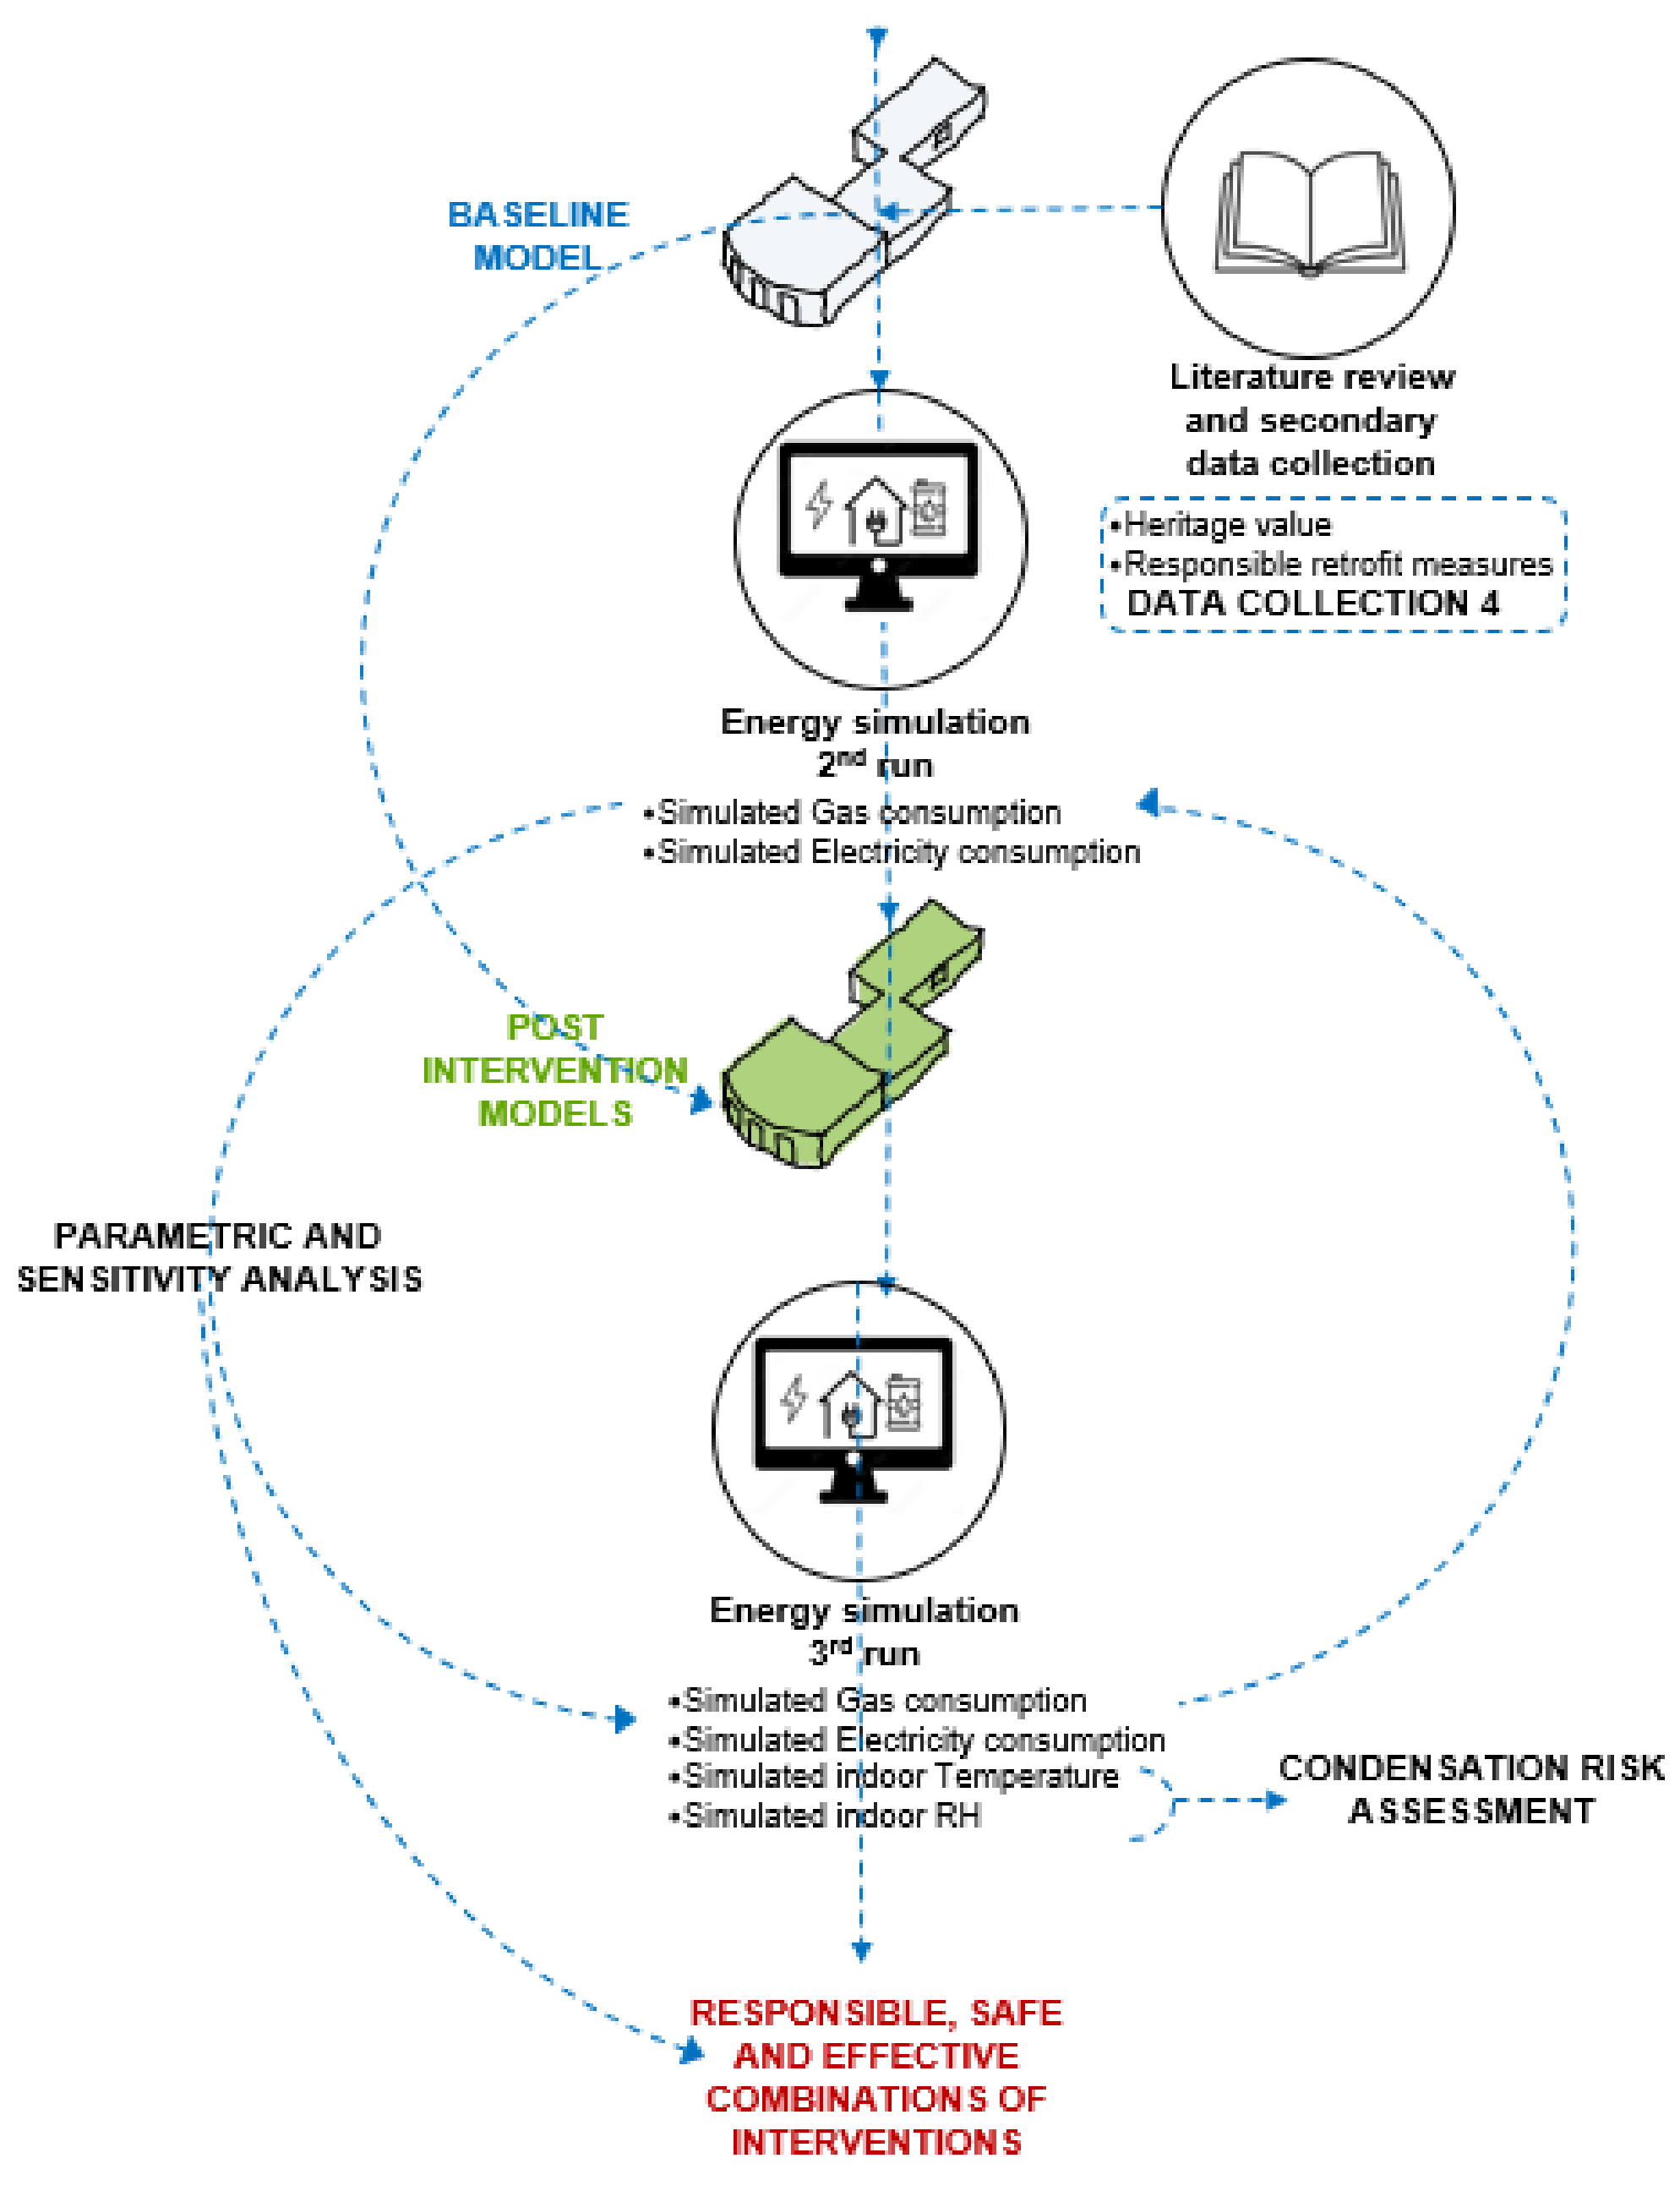
Figure 2 describes the methodological approach of this study, the methods utilized (in the circles), the data collected or generated from them (bullet points) and the models created at each subsequent stage of research. After the critical review of the literature and the secondary data collection, primary data were gathered through visual and measured surveys, questionnaires, interviews and thermal imaging. The output of the first data collection stage was used to feed into the following data generation stages via dynamic energy simulation (DES) applications using the software IES-VE 2019 (for details, please see [91]). The first stage of simulation was run for the status-quo models; the energy consumption and indoor condition results from this stage were then compared with metered data (data collection 2 in Figure 2) to calibrate the models (For details, please see [92]. An example of the calibration process can be found in the Supplementary Materials S1). Next, the calibrated models were normalized to standardize any behavioral determinant of energy consumption. Finally, a baseline scenario of energy consumption was generated by upgrading all the normalized models by means of a high-energy-efficient boiler; this was aimed to facilitate a fair cross-case comparison where only heating energy consumption (HEC) and the envelope characteristics could be considered (for details, please see [93]). The baseline scenario was used as a benchmark in the following stages of research to assess the effectiveness of a range of passive retrofit solutions by weighing the HEC outcome of simulations pre- and post-interventions. Therefore, responsible passive retrofit measures were selected for the CSs (for details, please see [94]); being listed buildings, the responsible measures selected were those allowed by their listing, and hence were respectful of their heritage value. The measures were modelled and applied—individually and combined—to the baseline models, and further stages of simulations were run to investigate the potential risks to the thermo-hygrometric balance of their constructions (ensuring they are safe) and the changes in the energy efficiency of the selected CSs (aiding in the selection of the most effective measure). A parametric analysis of the proposed solutions permitted the development of responsible, safe and effective combinations of retrofit interventions; finally, a sensitivity analysis of the simulation results highlighted the areas of the envelope where appropriate combinations of interventions are more likely to generate the highest energy and carbon savings.

3.2. The Case Studies

The use of mixed methods, multiple units of analysis and multiple CSs enabled the triangulation of the findings, which enhanced the validity and reliability of the results generated. To maximize what could be learnt from the cases, the sample size had to cover the key variables in the population from which they were drawn. Such variables were identified as follows: (1) aspect (number of sides where windows are located; being flats in converted terraced houses, the CSs were either single-aspect-in the case of small properties opened only on one side-or dual-aspect-if opened with windows on two opposite sides; a few triple-aspect ones could be found at the end of a row of terraced houses, but they were not taken into account because of their rarity), (2) floor level and (3) orientation (for the double-aspect dwellings, the orientation of the main elevation was considered). Eight representative CSs, converted flats within grand Regency buildings, were chosen in the two earliest Regency developments in Brighton: Brunswick Town and Kemp Town (for a detailed account of the CS selection process and their existing constructions, please see [95]).
Table 2 and Table 3 present a synthesis of the key variables for each CS, alongside the treated floor area (TFA-the heated floor area of the dwellings), form factor (calculated as the ratio of the thermal envelope to the treated floor area), windows-to-walls ratio (WWR), geometry and envelope constructions. The external walls in the dwellings investigated are made of uninsulated solid brickwork; most windows are (original or replacement) timber sashes, some are replacement casement windows and a few have secondary glazing or double glazing (in the original or replacement frame); the ground floors have solid or suspended timber constructions (uninsulated or insulated); and top-floor dwellings have pitched and/or flat (uninsulated or insulated) roofs.

3.3. The Selection and Simulation of Suitable Retrofit Measures

Responsible retrofit measures for the CSs under investigation were devised following an in-depth review of the literature, regulation and guidance (for details, please see [94]). Further developing the list of interventions shaped by Historic England [77], the energy retrofit measures available were arranged into low- (green), medium- (amber) and high-risk (red) options (Table 4). Each of the measures available and permissible was then assessed against the level of impact it has on the heritage features needing protection (assessment of heritage significance [4]). Finally, a systematic approach was taken to shape the list of responsible measures to use in this study, subdividing the building envelope into six different areas of intervention (Table 4). The range of low-, medium- and high-risk interventions available for the CS models were then modeled in IES-VE to obtain a range of post-intervention scenarios.
The simulation of interventions was carried out in two stages. Firstly, it applied all the low-risk options available for each CS to the baseline model (B scenario) and generated the BL scenario. The following stage involved the medium- and/or high-risk options applied to the BL scenario. This strategy is unanimously recommended by conservation bodies [4,66,77,78,80,82,84] and previous research [6,83] which suggest the application of low-risk measures prior to medium- and/or high-risk ones. In fact, they are the most easily applicable and removable, and they imply lower costs, low levels of disruption, no need for planning application or listed building consent and the lowest risk of unintended consequences. To firstly apply low-risk interventions and in due course add other more expensive, delicate and disruptive ones is also a common practice, which was confirmed by interviews with the occupants.
To effectively manage the large number of simulations that resulted from the combination of the interventions selected and modeled in IES-VE, a coding system was devised. This way, each unique simulation’s name indicated, for each CS, the variable (and its variation) or combination of variables (and their variations) associated with it. Table 4 summarizes the key areas of intervention (parameters in the sensitivity analysis), the measures (variations) for each area and their codes. The measures listed in this Table are allowable by regulation and are respectful of the heritage value of each specific CS (responsible).
The interventions proposed utilize breathable insulants and finishing materials, allowing for the movement of water vapor [4,78,83]. The hygroscopic properties of breathable insulation materials, together with the right amount of ventilation, are meant to store part of the vapor that can pass through the insulation from the inside, preventing it from reaching the cold masonry and condensing, while also permitting some moisture movement and evaporation both internally and externally [83]. All the modeled retrofitted constructions for the walls (A6) were also tested for condensation, utilizing the function available in IES-VE, to ensure that the newly created solutions were moisture safe. The IES condensation assessment is a steady state analysis, and is hence only capable of investigating vapor diffusion in each construction at a specific moment in time under steady boundary conditions. Like the Glaser method, it does not account for variations in the material properties due to changes in moisture content [21]. Therefore, the setting of boundary conditions that allow for the analysis of a worst-case scenario was considered extremely important to overcome the limitations that may be due to the use of a steady-state approach. The data input approach utilized in similar studies, together with what is suggested by standards (i.e., the Glaser method [96] and the dynamic hygrothermal simulation method [97], both described in BS 5250:2021 [98]) were considered to help make decisions regarding the boundary conditions to use for the analysis.
Because the IES analysis only assesses one specific moment in time, and because the highest difference between the indoor and outdoor temperature (leading to the highest risk of condensation) is recorded during the winter months for heated dwellings in this climatic area, the lowest monthly temperature value and the highest monthly relative humidity (RH) value were inputted in IES to account for the worst-case scenario in the external conditions. For the internal conditions, for each construction in this study, temperature set-points (21 °C in the living area and 18 °C in the rest of the dwelling) were used. For the indoor RH, the same value of 50% was used for all the constructions investigated. This reflects the average indoor RH based on the external daily mean temperature data, as recommended by BS EN 15026 [97], and was often used in precedent studies to assess the risk of condensation, even when a dynamic simulation method was adopted [37,44,61,99], to cite some). As a result of this analysis, wherever needed, the thickness of the insulation layer was decreased to decrease the temperature gradient between internal and external spaces and reduce the risk of condensation taking place within the envelope in order to generate a range of responsible and safe interventions. All the medium- and high-risk measures were finally applied to the BL scenario, both individually and combined, aiming to achieve the target U-value given by the Building Regulations in place at the time of this study [11] for each thermal element. It was not always possible to achieve the target U-value due to heritage value considerations, condensation risk analysis, space constraints and the maximum thickness of insulation achievable with the material selected. Condensation risk was the main cause of the limits imposed on the thickness of the insulation layer added to wall constructions. This restricted the extent of U-value improvements. Table 5, which follows, shows, for each area of intervention, the area-weighted baseline U-value of the construction (in dark grey) and the U-values achieved as an outcome of the interventions (in light grey)-in bold those that met or exceeded the target U-value. The U-values post-retrofit ranged from 0.44W/m2K (for solid walls-finished with plaster on the brickwork, as opposed to walls finished with plaster-on-lath internally-with aerogel insulation A6bH1-in CS7) to 0.92W/m2K (for walls finished in plaster-on-lath and solid walls with wood fiberboard insulation—A6aH2 and A6bH2—in CS13).
The final stage of research assessed the effectiveness of the responsible and safe interventions applied by comparing the HEC output—and correlated CO2 emissions—from the simulation to that of the B scenario to finally obtain combinations of responsible, safe and effective interventions. The results were assessed using parametric and sensitivity analyses where the areas of intervention constituted parameters, subject to variations as a result of potential retrofit interventions, that were reflected in the variance of their respective U-value. Section 4, which follows, reports and discusses the outcomes of the sensitivity analysis of the simulation results.

4. Results

The results of this study were produced in three stages as the outcomes of the following simulation scenarios:
  • Status-quo, normalized and baseline (B) scenario (for details, please see [93])
  • BL scenario, obtained from the simulation of low-risk interventions applied to the B scenario (for details, please see [95])
  • Whole retrofit scenario, obtained from the simulation of medium- and/or high-risk interventions applied to the BL scenario.
This paper presents stage 3 in the analysis to assess the impact of medium- and/or high-risk options—individually and combined—on the energy performance of the base-case models once all the low-risk interventions were implemented (BL scenario [95]).
A total of 770 new models were generated for all combinations of medium- and/or high-risk options, which, added to the low-risk interventions simulations, totaled 800 simulations runs. The resulting annual gas and electricity consumption data were accessed in IES-VE utilizing Vista-pro and exported, firstly into Excel for parametric analysis, and then into SPSS 2020, for sensitivity analysis.
Figure 3 shows the HEC savings percentages after the application of medium- and high-risk interventions individually (OAAT) on the BL scenario (B scenario upgraded with all the low-risk interventions applicable in each CS).
The savings percentages ranged from nearly 0 to more than 30% for different interventions. Interestingly, a wide range of results is also noticeable when looking at the same intervention across different CSs. This is likely due to the following:
-
differences in the thermal envelope area addressed by the intervention
-
differences in the baseline U-value of the same constructions across different CSs when they were subject to previous interventions aimed at improving their energy efficiency
-
limitations imposed by heritage value, where the application of some interventions was not allowed or insulation was limited in thickness because heritage features could have been compromised
-
limitations due to condensation risk, where the application of some interventions was not possible and might have required the use of a dehumidifier.
For these same reasons, there are intrinsic limitations in the comparison between the results from this study and from other studies, even when these were conducted in the same climatic conditions and on similar constructions.
The results of the simulations of all the combinations of measures were then used to produce a ranking matrix of combinations for each CS. To aid the assessment of the interventions selected, the tables of combinations highlight those producing the highest energy and carbon savings, alongside their level of risk, to come up with effective combinations that also imply the lowest risks to the thermo-hygrometric balance and heritage value of the envelope (Supplementary Materials S2).
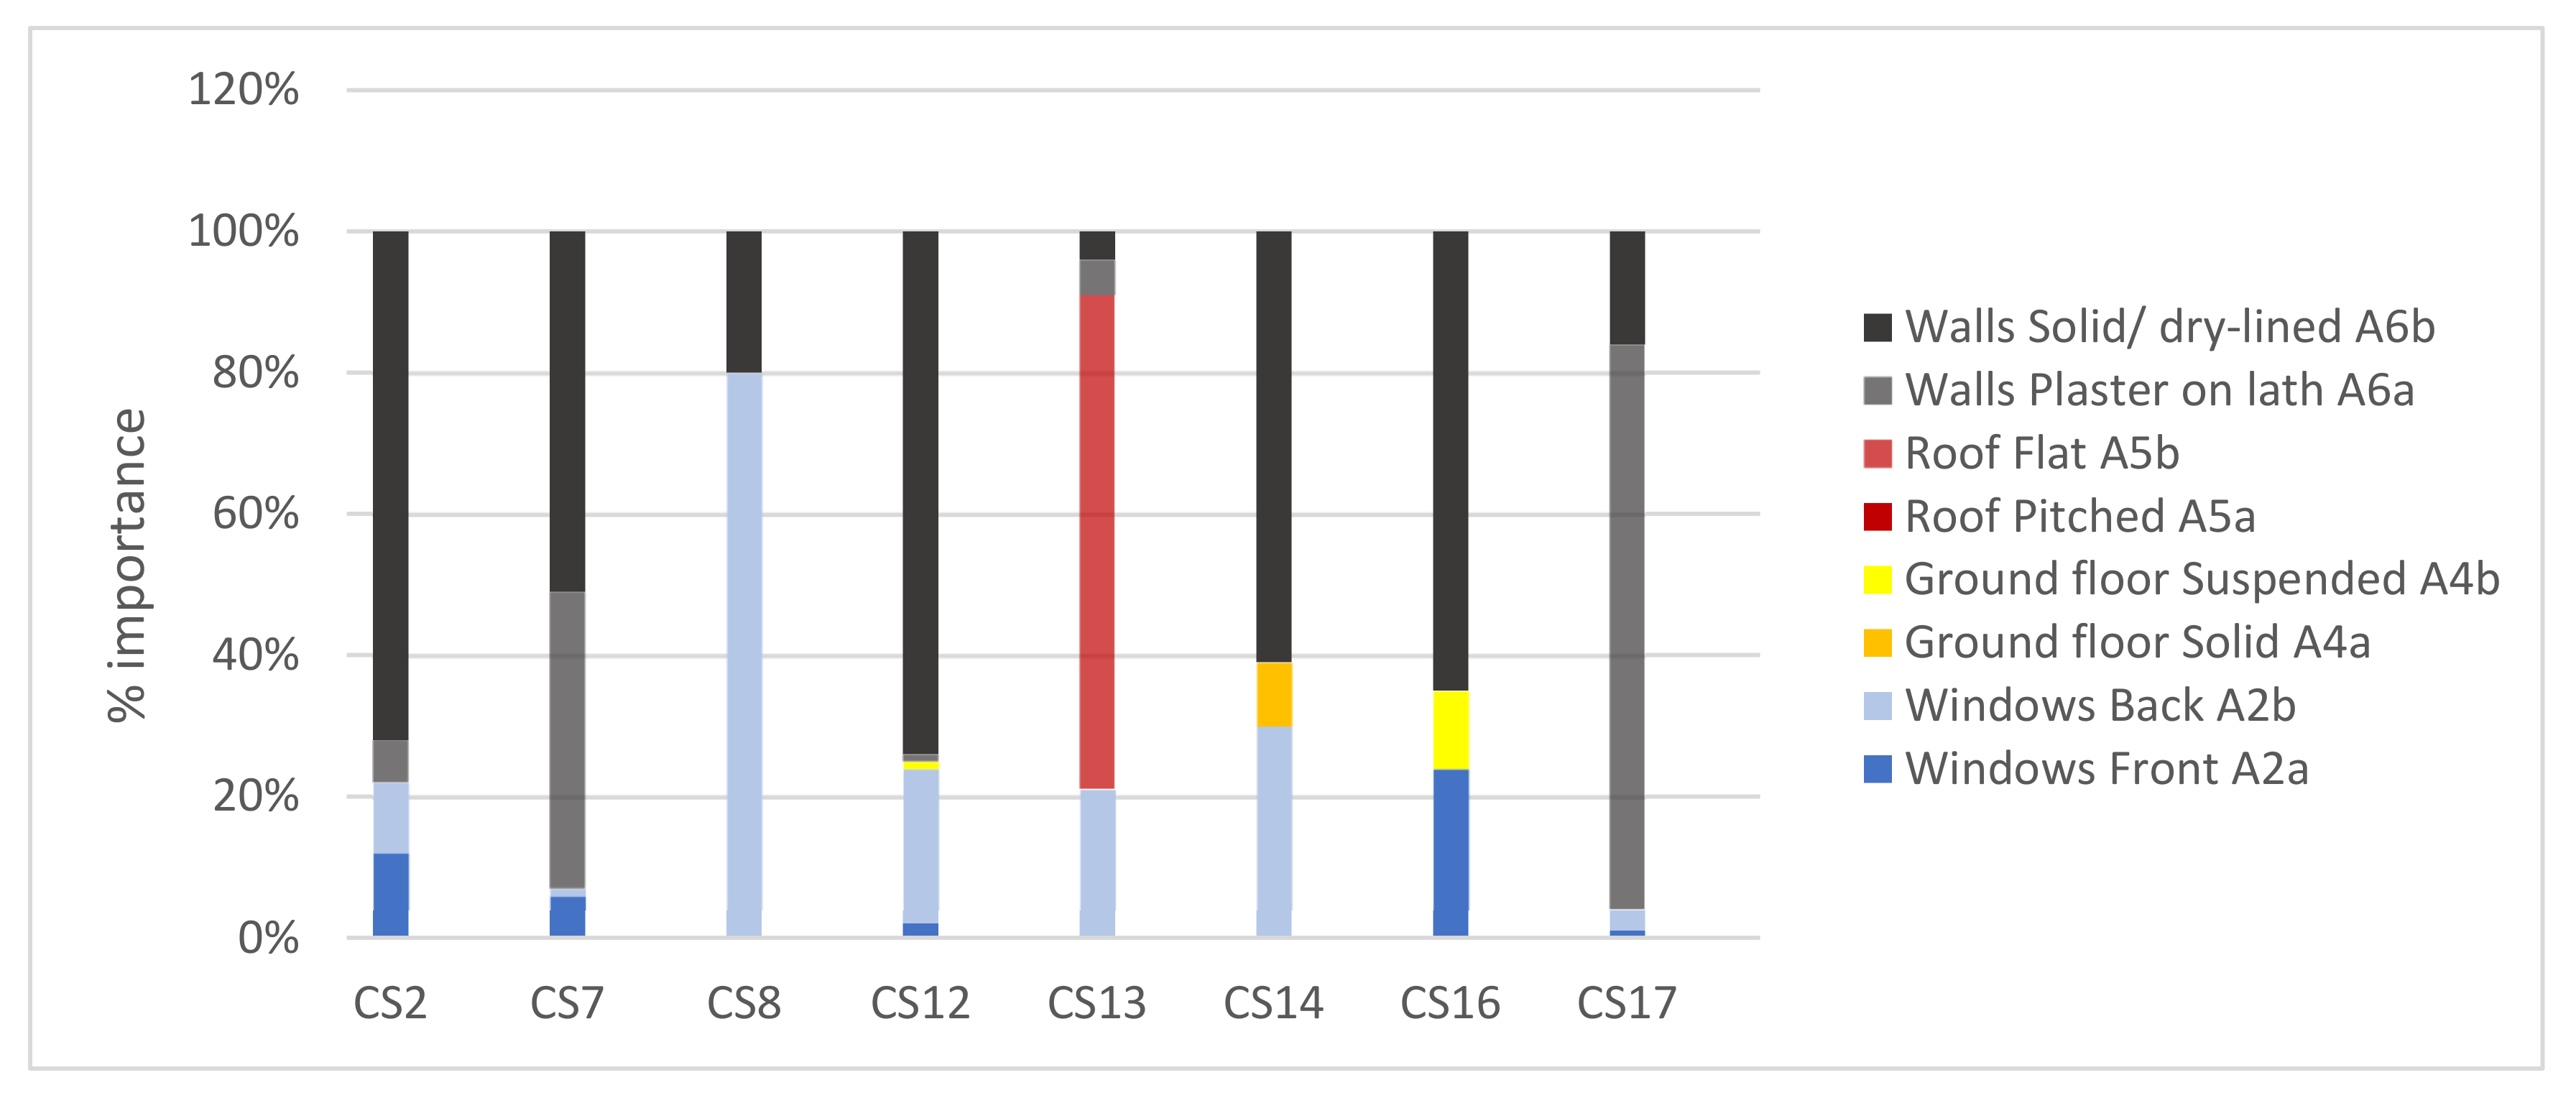
Figure 4 shows a synthesis of the sensitivity analysis of the results from the simulation of the combinations of medium- and high-risk interventions, showing the parameters’ % importance, and hence the impact that the retrofit measures—applied to each area of intervention—had on the reduction in HEC (and CO2 emissions) in each CS.
In six out of eight dwellings, the most important area of intervention was the external wall (in dark and light gray—A6), and more specifically solid walls (in dark gray—A6b). Solid (internally finished with plaster on the brickwork) walls also constituted the largest area of the thermal envelope in most CSs. Where walls finished in plaster-on-lath (in light gray in Figure 4—A6a) were found, they generally formed the front of the dwelling, often the most decorated part in Regency buildings. Therefore, this is where more limitations were likely imposed by the listing, which might hinder major alterations of the status-quo, limiting the fabric performance improvements achievable with the interventions. In all the dwellings except CS17, solid walls enclosed rooms to the back of the building, which were often the object of interventions over time. This might have led to the loss of the original plaster-on-lath, if there was any in place, hence allowing the application of a wider range of interventions.
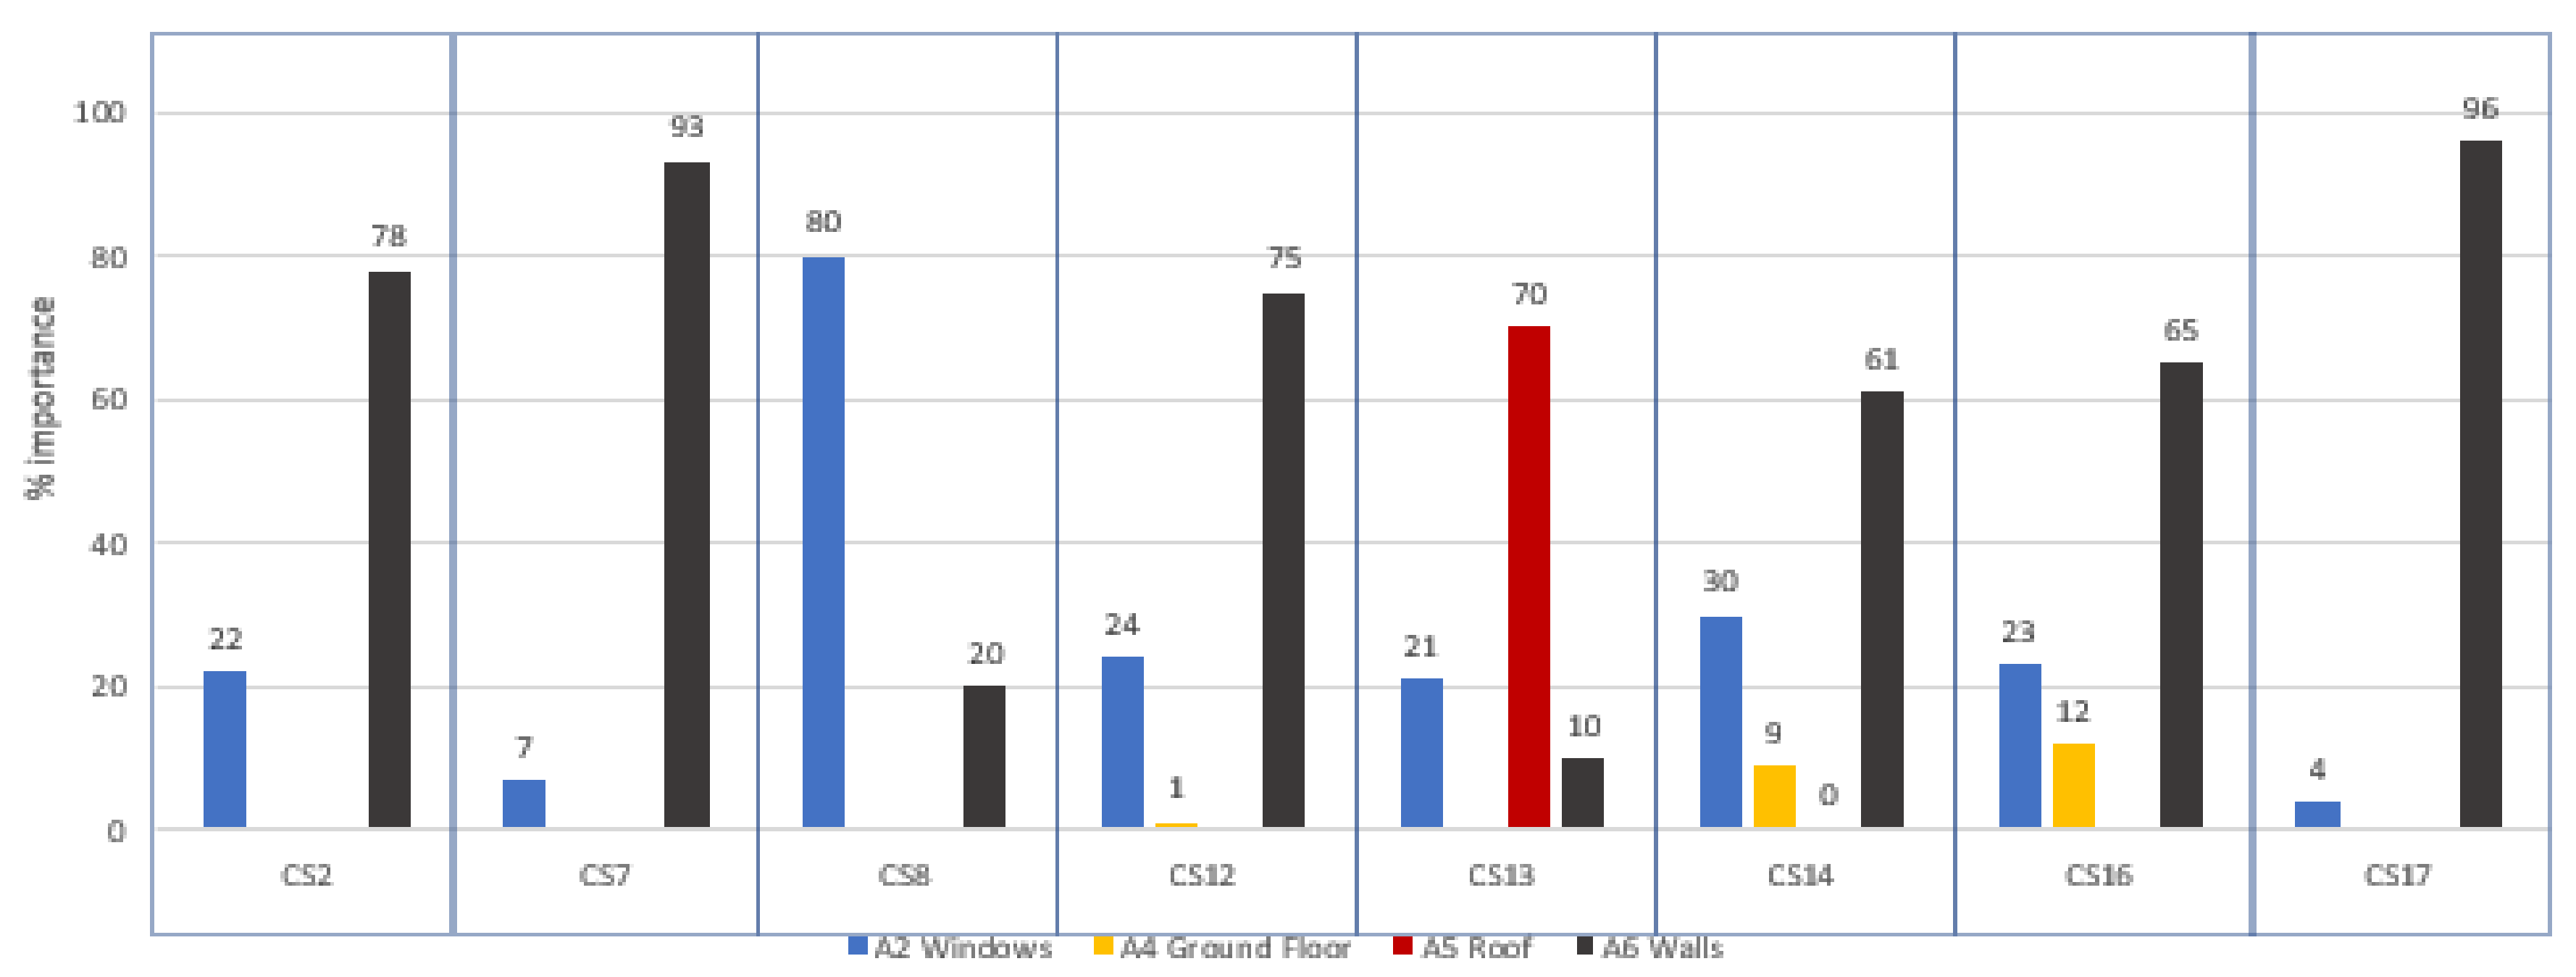
Figure 5 represents a summary of the parameters’ importance % of each area of intervention, obtained by summing up the % importance of the two sub-areas in which they are divided (e.g., A2 = A2a + A2b). It confirms that overall, walls (A6 = A6a + A6b, in gray) result as the most influential parameter targeting both HEC and CO2 emissions, far outweighing windows (in blue), the ground floor (in yellow) and the roof (in red). Windows (in blue—A2) are generally poorly performing in the population investigated and offer a high potential for heat loss reduction. However, confirming the findings from the simulations of the medium- and high-risk interventions OAAT (Figure 3), windows only result as the most important parameter in CS8 (Figure 4 and Figure 5). In this studio flat (62.4 m2 of TFA), windows (A2b) take up 33% of the external envelope vs. 67% taken by walls (A6b), and the dwelling has the highest windows-to-walls ratio of all the CSs (33% vs. 21% average value of the other cases).
The parameter importance results were then divided by their area in m2 (Figure 6). Windows (in dark and light blue in Figure 6) resulted as the area of intervention having the highest importance/m2 in five out of eight CSs, hence showing that retrofit interventions on them could be prioritized to maximize energy savings where a whole-building approach is not applicable.
At this stage of our study, it was also considered necessary to assess how the importance of window interventions could change if including internal shading devices (this was considered a low-risk measure, and hence was part of the first stage of simulations of interventions, which was used to generate the BL scenario for the following stages of parametric and sensitivity analysis) as part of the window upgrades in the sensitivity analysis. A test was carried out on CS2. For the test, a new baseline scenario was created by excluding all internal shading devices from the BL scenario. Then, the shading devices were added to the windows alongside each medium- and/or high-risk retrofit intervention. The new ranking obtained was the same as in the previous stage of analysis (where the impact of window interventions on the final HEC was estimated only based on secondary glazing and slim double-glazing interventions). Solid walls were confirmed to be the most important parameter; however, the percentage value of the parameter importance changed drastically, and windows resulted to be much more important when the interventions considered included the use of shading devices (from just above 10% to more than 30% for front windows and from nearly 10% to nearly 20% for back windows). The collective savings obtained from the front and back window (A2a + A2b) retrofit exceeded those obtained from the wall (A6a + A6b) retrofit.
The findings from this further stage of analysis confirm the need for a targeted study for each individual dwelling to devise the most responsible, safe and effective interventions. They contribute to the results of this study, shedding new light on the importance of a comprehensive approach to TLD retrofit, where the significance of retrofit interventions for windows should not be underestimated. This is especially true for the CSs where the area (m2) of windows is higher than that of walls. Window interventions could then be prioritized in these cases where retrofitting internal wall insulation would noticeably reduce the usable internal space, result in higher condensation risks and/or impose higher risks to heritage value.
As previously noted by Historic England [7], original single-glazed window performance can sensibly be improved with the addition of double-glazed secondary glazing (A2aM2 and A2bM2 in Figure 3), resulting in windows becoming almost as energy efficient as if they were upgraded to slim double glazing (A2aH1 and A2bH1 in Figure 3). This can be particularly important for front windows, where the originals are often still in place, to ensure their conservation while improving performance. This is mostly true for the windows in CSs 2, 8, 12 and 16 (west-facing), as well as in CSs 7 and 13 (south-facing), which are exposed to the prevailing winds in this area (coming from the south-west). In fact, although double-glazed secondary glazing gives slightly lower energy savings compared to slim double-glazing in these CSs, their orientation is ideal to reduce the risk of condensation with this intervention [74,77,80]. Any intervention on windows in TLDs should, however, be negotiated with conservation officers due to the impact on their heritage value. In some dwellings, the risks imposed to the heritage value and the negative consequences for the usability of the window may outweigh the benefits of any medium- or high-risk interventions. In CS17, for instance, the savings obtainable by means of secondary glazing or slim-double glazing are minimal, ranging from 1.6% to 4.6% (Figure 3), and only the addition of internal shading devices permitted the achievement of similar savings (3.1%).
Further analyzing the parameter importance results presented in Figure 4, the flat roof (A5b) only results in the most important parameter for CS13, potentially producing up to 20% energy savings (Figure 3), far outweighing what can be achieved by means of wall insulation. This is certainly due, in this CS, to the large area ratio taken up by the flat roof construction (41%), uninsulated in the baseline scenario. In the other dwellings where roof constructions are found (CSs 7, 12, 14 and 17), these constitute a smaller area of the external envelope and are either suitable only for loft insulation (CSs 7 and 17) and/or have already been insulated in their baseline scenario (CSs 7, 12 and 14), which leads to a low potential of U-value improvement in the retrofitted scenarios.
In none of the ground floor-level dwellings investigated (CSs 12, 14 and 16) does the ground floor construction result in the most important parameter (Figure 4 and Figure 5), and it is rather overshadowed by the importance of walls. In CS12, the energy savings achievable by means of retrofit options for the suspended timber ground floor are negligible (3.1% for aerogel insulation board above the ground floor construction—A4bM1—and 2.5% for sheep wool insulation between the joists—A4bH1—as shown in Figure 3) because only one room is in contact with the ground; hence, the area ratio of this construction is only 17% of the total thermal envelope. Anyway, in CSs 14 and 16, the results obtained for the solid ground floor (A4a, in CS14) and suspended ground floor (A4b, in CS16) show energy savings just below 10% and should not be disregarded (Figure 3). In these CSs, the whole dwelling area is at ground level, corresponding to 40% (in CS14) and 73% (in CS16) of the thermal envelope.

5. Discussion

5.1. Triangulation of Results Concerning Window and Wall Retrofit

The findings from this study confirm the results of most of the literature on building retrofit, both in the UK and elsewhere. Ben and Steemers [22] investigated non-traditional dwelling retrofit and found higher energy savings from cavity wall insulation (9%) than from secondary glazing (6%). The savings obtained from wall retrofit were smaller in this study than the ones reached in our study (approximately 5% to 25%—see Figure 3), which instead investigated traditional dwellings. However, the savings predicted from secondary glazing by Ben and Steemers were in the range of those calculated in our study. The study conducted by He et al. [38], simulating traditional and non-traditional dwellings in the north-east of England, obtained lower energy savings than our study but achieved a similar ranking of intervention effectiveness. Their study showed that the highest energy savings were achieved by means of solid wall insulation (heating demand reduction of 5.7%), which far outweighed those achievable by double glazing (heating demand reduction of 0.6%). A comprehensive review of the outcome of UK retrofit projects was conducted for the DEEP research paper [21] whose findings suggest that upgrading windows could reduce HEC by between 5% and 15% (slightly less than what was found in our study), while solid wall insulation could generate from 13% to 68% savings in HEC (within the same range as that obtained in our study), confirming the significant reductions in heat transfer achievable with solid wall insulation. The NEED analysis of domestic energy consumption [31] resulted in lower energy savings from solid wall insulation measures (median gas savings of 14%) compared to those achieved in our study. Nonetheless, solid wall interventions were potentially the most effective compared with the other measures evaluated in NEED (new condensing boiler, loft insulation, cavity wall insulation and PV panels). Other studies in cold climatic conditions came to different conclusions: from the analysis of an old Danish multi-family building retrofit, Morelli et al. [53] found the savings achievable with window interventions in the range of those achievable with interventions on walls—both about 20%. However, their best-performing intervention for windows used three panes of glass, which was applicable in our context due to the listing.
Most studies conducted in the Mediterranean area [24,32,35] came to similar conclusions to those achieved in most of the CSs in our research, showing the impact of energy-efficient windows to be less significant than the impact of thermal insulation on the HEC of the buildings investigated. The Mediterranean climate is the main cause for the low overall HEC savings post-intervention in the studies conducted in Turkey by Sahin [58] and in Portugal by Flores [33]. In both studies, the energy savings achievable with window retrofit interventions (for a public historic building and for historic dwellings, respectively) were estimated to be below those achievable through wall interventions. However, savings from each measure individually accounted for only below 5%. The study conducted on solid-walled residential building prototypes by Kolaitis et al. [44] showed a higher energy saving potential for internal wall insulation configurations when the modeled flat was simulated in the Mediterranean climate (65%) than when the same intervention was simulated in the colder Oceanic climate (47%) where the risks of condensation were higher.
There are also studies conducted in the Mediterranean area on historic public buildings, where window retrofit obtained the highest energy savings [17,50], showing opposite findings to those of our study. Ascione et al. [17] found that the heating energy demand was reduced by 37% with the application of new double-glazed windows (to achieve a U-value of 1.49 W/m2K) vs. 9% with 5 cm of insulating plaster for most of the walls. Mancini et al. [50] showed potential HEC savings due to retrofit interventions for windows in the range of 28%, which far outweigh those achievable through other retrofit interventions, e.g., wall insulation (21%), loft insulation (9%) and floor insulation (7%).
Few studies refer to traditional dwellings in the UK, and even fewer address traditional dwellings of heritage value. Rhee Duverne and Baker [57], assessing the outcome of a range of retrofit interventions for a Victorian terraced house in the UK, conceded to the energy improvements achievable by reinstating old timber windows upgrading their glazing, which also aids in restoring the original character of the building. Their study showed that retrofit interventions for windows obtained a 43% heat loss reduction through the element; however, solid wall retrofit measures reduced heat loss through the wall by more than 80%. Wall insulation resulted in their study as the best-performing intervention (given the SAP rating). These data might not be directly comparable to the results of our study, but they confirm that interventions on walls can potentially generate the highest energy savings. The study conducted by Moran [52] in three 19th C terraced houses considered retrofit interventions applied progressively in packages. It included window retrofit in a first combination of measures involving draught-proofing, ground floor insulation and roof insulation, as well as boiler and appliance upgrades. The savings attributable to this package of interventions ranged from 8% to 51%, while those obtained when adding wall insulation to these measures ranged from 54% to 85%. Although in Moran’s study it was not possible to directly compare the savings due to the walls’ retrofit to those attributable to other parts of the building envelope, it is evident that external wall performance played an important role in determining the final HEC, and hence the CO2 emissions, as shown for many of the CSs investigated here. A different conclusion was obtained in the study of a Victorian terrace house conducted by Neroutsou and Croxford [55]. Their study found a significant disproportion between the heating load reduction achievable with window retrofit interventions (30%) and that achievable with wall insulation (18%)—both aiming to meet the target U-value imposed by Building Regulations—despite the high percentage of the external envelope taken up by walls in their CS (based on an end of terrace house). When the building was simulated to meet EnerPHit standards (hence lower envelope U-values), the heating load reductions from retrofitting the walls (33%), roof (31%) and windows (32%) were similar.

5.2. Triangulation of Results Concerning Roof and Floor Retrofit

It is not possible to compare our results concerning roof retrofit with the majority of previous studies as most of them are either focused on retrofit interventions for walls exclusively [18,28,30,36,37,42,44,46,47,62], for windows only [40,41,45,51], or on combinations of multiple interventions, often including both active and passive measures [17,22,25,26,29,32,33,34,40,43,48,49,50,52,53,57,58] and frequently assessing them as a whole. Neroutsou and Croxford [55] found a 24% HEC saving potential from the pitched roof insulation between rafters in a traditional Victorian house when aiming to achieve a target U-value of 0.20W/m2K, hence resulting in a similar scenario to the one found in our research. Similarly, the DEEP research paper [21] found that insulation at the rafters’ level could reduce whole-house heat loss by 20%, as much as solid wall insulation. These data are not directly comparable with our results as the pitched roof constructions investigated were already insulated in the baseline scenario in our study.
Most of the previous studies did not include ground floor interventions or consider them together with a package of retrofit measures for the envelope. The DEEP literature review on domestic retrofit practices [21] found that suspended ground floor retrofits are rare in the UK despite there being around 10 million uninsulated floors. However, their study suggested that insulating these floors could reduce heat loss in homes by up to 20%, depending on how much infiltration is taking place through the ground floor. This value is much higher than that found in CS16 in our study, despite the large proportion of the thermal envelope taken up by the ground floor in that dwelling. This is possibly due to the combined effect of adding insulation and draught-proofing, which in our study are instead considered as two separate interventions (with draught-proofing as part of the first stage—low-risk interventions). The few studies that assessed the outcome of ground floor insulation for traditional dwellings generally showed lower savings than those found in our study. Wise et al. [63], investigating traditional heritage dwellings in the UK, obtained 1.5% and 1.7% HEC savings. This is likely because, in their study, the dwellings investigated presented a mixture of solid and suspended ground floor constructions, but only the suspended floors were insulated as part of the interventions proposed. Similarly, Neroutsou and Croxford [55] found a 3.5% HEC saving potential from the ground floor insulation in the Victorian two-story terraced house investigated. Rhee Duverne and Baker [57] found the energy savings achievable by floor insulation to be nine times smaller than those achievable by wall insulation (approximately 10 kWh/m2yr vs. 90 kWh/m2yr) for a Victorian terrace house and double those achievable by loft insulation. CSs 14 and 16 in our study showed similar energy savings obtained by ground floor insulation (from 7.7 kWh/m2yr with limecrete floor—A4aH1—in CS14 to 8.9 kWh/m2yr with thin aerogel board—A4bM1—for CS16). However, the maximum savings achievable by the walls in these CSs were below 20 kWh/m2yr, hence just double the size of those achievable by ground floor insulation. These results are likely due to the thermal envelope area ratio taken by the ground floor constructions, which is certainly larger when assessing an individual dwelling (as in our study) than when assessing two-story terrace houses (like in Neroutsou and Croxford [55] and Rhee Duverne and Baker [57]).

5.3. Triangulation of Results Concerning the Whole Energy Retrofit Approach

A comparison of the results of our study with previous studies in the UK and elsewhere shows similarities but also many differences, even when considering the same population and similar climatic contexts. Such variances are a consequence of three main factors:
-
differences in the specific baseline conditions and in the range of interventions, and hence in the achievable reduction in the U-values of the constructions
-
differences in the surface areas of the envelope attributed to each intervention
-
differences (if any) in the climatic conditions in which the studies were carried out.
This conforms to the suggestions made by heritage and conservation bodies (Historic England, 2012 and 2018a; Historic Scotland, 2013; STBA, 2012a) when it comes to traditional heritage building retrofit, articulating them further into the following conclusions:
-
each building must be assessed individually
-
each building is characterized by an individual baseline scenario
-
it is essential to strike a balance between the following:
respect for heritage features
the thermo-hygrometric behavior of the construction; and
the target energy performance.
-
These all play a special role in the selection of the most responsible, safe and effective retrofit measures and affect their outcome.
A wide range of energy and carbon savings were computed in this study based on different combinations of responsible and safe interventions. Figure 7 shows the HEC savings % achievable with the most effective combinations of the following:
-
medium- and/or high-risk interventions against the BL scenario (in blue)
-
low-, medium- and/or high-risk interventions against the B scenario (in orange)
-
boiler upgrade and low-, medium- and/or high-risk interventions against the normalized (N) scenario (in green).
The most effective combinations of medium- and/or high-risk interventions (in blue in Figure 7) for the selected CSs could provide energy savings ranging from 18% (CS7) to 54% (CS2) compared to the energy consumption in the BL scenario. This is due to differences in baseline scenarios, where CS7 has already been partially retrofitted (added floor level, loft insulation and upgraded windows). In contrast, CS2, which has not been subject to any prior retrofit intervention, shows the highest energy savings potential despite its limitations due to heritage features and condensation risks. Furthermore, CS7 has a large form factor (1.69), which is double that of CS2 (0.81)—see Table 2 and Table 3. Despite the windows-to-walls ratio (WWR) being higher in CS2—24% for CS2 vs. 18% for CS7—the windows can be retrofitted to higher levels of performance compared to the walls of CS2 (achieving a maximum ∆U-value of 4.11W/m2K with secondary double glazing for both the front and back windows vs. a ∆U-value of 1.58W/m2K with an aerogel blanket for solid walls). CSs 14 and 16 both show 45% energy savings with the best-performing combination of medium- and/or high-risk options, despite having large form factors (1.63 for CS16 and 1.94 for CS14—the largest of all CSs). This is likely because a large part of the thermal envelope of these dwellings is the ground floor construction (about 40% for the solid ground floor in CS14 and 61% for the suspended ground floor in CS16) and both dwellings are sheltered from the weather, being at a lower ground floor (with CS14 overlooking the internal courtyard of the building). Considering the impact of low-, medium- and/or high-risk interventions on the baseline scenario (orange bar in Figure 7), the savings range from a minimum of 33% for CS7 to a maximum of 57% for CS2. The savings due to low-risk options (the difference between the first and second bar for each CS in Figure 7) are highest for CS7 (where draught-proofing, internal shading devices and loft insulation can all be applied) despite the loft already being partially insulated. This is because the baseline air leakage rates are particularly high (ranging from 1.2 to 1.4ACH in most rooms vs. values for the other CSs ranging from 0.4ACH for CS14 to 1.1ACH for CS16); hence, CS7 has a larger potential for improvement by means of draught-proofing compared to the other dwellings (for details, please see Menconi et al. [95]).
When assessing these findings in the wider context of the literature, it is obvious that a unique pattern is very difficult to discern and probably less relevant because no two properties are the same. Nevertheless, this paper aims to present results that can be cross compared meaningfully not only between the CSs under investigation but also with those of other studies and can therefore be generalized with a satisfactory level of reliability both internally and externally. The energy and carbon savings potential of interventions are strictly related to the following:
-
the geometry of each dwelling
-
the thermo-physical characteristics of the envelope in its base case
-
the area ratio of each part of the envelope to the whole thermal envelope
-
the target performance to be achieved
-
the limitations due to the thermo-hygrometric balance and heritage value of the constructions.
Bothwell et al. [25], simulating retrofit packages for the social housing stock in the UK, found a 25% HEC reduction when combining external wall, ground floor and loft insulation; triple-glazed windows; and draught-proofing. He et al. [38] reached an overall reduction of 13.9% in total heating demand by applying a range of passive retrofit options on a large sample of dwellings in the UK. Both UK studies resulted in energy savings predicted by the most effective combinations of interventions on dwellings (not of traditional construction), which were significantly lower than in our study.
Similar results to our study were obtained by Neroutsou and Croxford [55] and by Rhee Duverne and Baker [57] investigating passive retrofit measures for Victorian terrace houses (end-of-terrace and mid-terrace houses, respectively). They achieved approximately 50% and 43% energy savings, respectively, through the combination of all the measures selected.
When considering combinations of measures, a large part of the literature considers heating system upgrade alongside a range of passive measures applied to the envelope. To compare the findings of the current study with this part of the literature, the HEC savings achieved by the best-performing combinations of low-, medium- and/or high-risk passive measures together with boiler upgrade were considered (green bar in Figure 7); they ranged from 48% (CS17) to 67% (CS8). This resulted in a mean reduction in operational CO2 emissions of 1800kg among the CSs selected. As expected, CS8 achieved the highest energy savings. This dwelling is heated by an old LPG heater and a small electric heater (in the bathroom) in its status-quo condition; hence, the change to a high-efficiency gas boiler certainly improved its energy performance. All the CSs showed considerable to significant improvements achievable by their heating system upgrade, resulting in an average 15% HEC savings potential across the CSs investigated. This finding further confirms the advice of conservation bodies concerning the importance of this intervention prior to any passive retrofit measure that can pose higher risks to the heritage value of the dwelling and to the thermo-hygrometric balance of its constructions [4,66,83,84], to cite but some.
The study conducted by Broström et al. [26] for dwellings of heritage value in Sweden resulted in annual energy savings ranging from just below 20% (for heating system upgrade, draught-proofing and loft insulation) to nearly 75% (when those measures were combined with external wall insulation and new triple-low-E-glazing windows). In the Mediterranean area, the study conducted by Dalla Mora et al. [29] demonstrated that the combination of all the retrofit interventions proposed for a traditional listed building (heating system upgrade, solar and photovoltaic panels, energy-efficient windows and internal wall insulation) achieved 88% HEC savings.
Amongst the UK studies, the NEED literature review [31] suggests that the HEC savings obtained by whole house retrofit studies in the UK range from 35 to 56%. Ben and Steemers’s study [22] of a non-traditional heritage dwelling resulted in 30% energy savings achievable by means of the most effective combination of measures (including both passive measures and boiler upgrade). The study by Heat et al. [40] on a traditional heritage dwelling in Scotland utilized steady-state energy simulation software applications to simulate boiler upgrade together with a range of passive measures (double-glazed windows, ground floor insulation, loft insulation and internal wall insulation). They obtained a wide range of results, with average energy savings of approximately 65%. This high value can be attributed to the derelict conditions of the building in its baseline scenario, confirming the variability of the findings due to diversities in the status-quo conditions. Moran (2013) found savings ranging from 54% to 85%. This range of results is also a consequence of the range of baseline scenarios of the CSs (whose base-case energy use ranged from 499 kWh/m2 to 197 kWh/m2). The gap between these results and those of the current study is again due to different baseline scenarios (base-case energy use in the current study ranging from 231 kWh/m2 to 40 kWh/m2). Different U-value targets for the envelope—which were based on the passive house standards of Moran [52]—are another contributing factor to the differences between findings. Organ et al. [7] obtained HEC savings for the archetype models of a pre-1850 terrace house and two Victorian terrace houses ranging from 53% to 67% with a low-impact package of measures (including heating system upgrade alongside measures for the envelope). They also simulated the same models with a high-impact package of measures (including photovoltaic panels alongside all other measures, applied to a greater extent) and found HEC savings ranging from 68% to 75%. The Historic England report on carbon reduction scenarios in the built environment [7] concluded that out of the three sources of carbon savings evaluated (i. building fabric and air tightness improvements; ii. a shift away from fossil fuel-based heating; and iii. the decarbonization of the national electricity grid), building fabric improvements indicated the greatest potential for carbon reductions.
The results obtained in our study are in the range of those found in previous studies that investigated retrofitting traditional dwellings in the UK. These findings prove the significant energy and carbon saving potential for TLDs and in general for the pre-1919 dwelling stock. Our study showed that this such potential can be fulfilled by means of safe interventions that respect the heritage value of this part of the housing stock.

6. Conclusions

6.1. Summary of Results

This paper presented the results of our study aimed at devising a suitable whole house passive retrofit approach for TLDs. Each influential parameter analyzed in this study was considered and its contribution towards the change in HEC (hence, CO2 emissions) assessed. Energy savings achievable through individual interventions and with the most effective combinations of interventions were discussed comparing the CSs transversally between each other and in the wider context of the literature. The analysis and discussion confirmed that each dwelling is unique, requiring individual assessment to devise the most effective, responsible and safe retrofit measures to improve energy performance and decrease carbon emissions while respecting heritage character and traditional construction. Nevertheless, the analysis highlighted some patterns in the results from this study that link the importance of each parameter to its corresponding area ratio of the envelope and to the actual change in its thermal performance as a result of interventions.
In this study, the most effective low-, medium- and high-risk interventions, combined with boiler upgrade, reduced operational CO2 emissions by a mean of 1800kg among the CSs selected. As a rough estimate, if all the listed converted flats in Brighton (over 5000, as estimated from an analysis of the listed entries for Brighton and Hove—[15]) were retrofitted, approximately 9000 tCO2 could be saved. If the whole number of traditional dwellings in Brighton (40,000 [13]) were retrofitted, the savings could increase to up to 72,000 tCO2. The results of our study show that traditional heritage dwellings should not be overlooked in the effort to tackle the climate change crisis.
The following are wider implications that can be extrapolated from the findings of this study.
  • Among the medium- and high-risk interventions, IWI generally outperforms all other measures. However, if combining window upgrade with draught-proofing and shading devices, interventions on windows can produce similar or higher HEC savings than those produced by IWI.
  • IWI implies the risk of interstitial condensation. To avoid this, the insulation should be breathable, and the retrofitted construction should aim for a U-value ranging from 0.44 to 0.92 W/m2K (for solid walls) and from 0.55 to 0.77 W/m2K (for walls finished in plaster-on-lath). Hence, to be on the safe side, the target U-value suggested by AD Part L1B of the Building Regulations should not generally be aimed for dwellings of traditional construction.
  • Among window measures, secondary slim double low-E glazing is the best performing and results in HEC savings higher than slim double glazing while implying less risk for the heritage value. To avoid risks of condensation, secondary double glazing should be prioritized, especially for windows facing south or south-west in Brighton, as these are exposed to its prevailing winds.
  • Both secondary slim double low-E glazing and slim double low-E glazing allow the achievement of lower U-values than those asked for windows by AD Part L1B of the Building Regulations.
  • External door retrofit produces only small HEC savings and is often discouraged in traditional dwellings for front doors due to heritage value considerations.
  • Insulating ground floors can achieve nearly 10% HEC savings in both solid and suspended ground floors, especially when the ground floor construction takes up a large proportion of the external envelope.
  • Both aerogel insulation blankets and sheep wool insulation (for suspended floors) or limecrete (for solid floors) help achieve similar energy savings for ground floors. The choice should be made by balancing the level of acceptable disruption. When there are no historic finishes to conserve, the option of aerogel blankets is preferable to limit the level of disruption; when historic finishes are in place, high-risk measures (i.e., sheep wool insulation or limecrete floor) are more suitable as they allow the conservation of the existing flooring material although causing more disruption.
  • Roof insulation is an effective option when the roof is uninsulated and even more if it takes up a large proportion of the external envelope, e.g., in top-floor flats.
  • For roofs, the choice between medium- or high-risk solutions mainly depends on the level of disruption acceptable and on the heritage value of the ceiling. When the ceiling is not decorated, sheep wool insulation is preferable if some disruption is acceptable. This may not be permitted if the occupants stay in the flat during the work. If there is a decorative ceiling, it is preferable to add insulation on top of rafters/joists when this does not lead to unacceptable changes in the uniformity of the roofs’ height (i.e., in a row of listed terraces) and allowing for the higher costs associated with the removal and repositioning of the roof cladding.
  • The highest HEC savings from the retrofit measures can be obtained, as expected, in the dwellings that have the highest thermal envelope-to-TFA ratio by combining low-, medium- and high-risk options with boiler upgrade.

6.2. Contributions of This Paper

The main novelty of this research lays in the rigorous, layered and systemic mixed-method approach taken to devise effective retrofit solutions for TLDs, applied and tested on multiple representative CSs, of which multiple units of analysis were accounted for. The critical review of the literature highlighted a major research gap indicating a lack of an all-inclusive methodology capable of ensuring that all participating factors (within the scope of the study) are considered, while the need for it has been repeatedly called for by academics. The methodological approach devised for this study builds upon that already taken by previous UK and international projects, e.g., CALEBRE, EFFESUS and RIBuild, as follows:
  • it stems from a similar approach to retrofit to that of the CALEBRE project [100], aimed at improved air tightness and U-values of the external envelope
  • it filters the range of measures selected through the identification of the specific heritage values to be protected in each CS
  • it assesses the impact of each measure on such values, similarly to the EFFESUS [30] project, to come up with a list of responsible measures
  • it applies a further filtering of the responsible retrofit measures selected, assessing the associated condensation potential, as in the CALEBRE and RIBuild [101] projects, to obtain a responsible and safe range of measures and determine in detail material build-ups for each of them
  • it assesses the effectiveness of the interventions devised by measuring their impact on energy consumption and associated CO2 emissions by means of DES, as in the CALEBRE project.
This strategy contributes to the novelty of this study, implementing what precedent studies had partially achieved, though they curtailed their ability to fully account for all the complex interrelated factors that characterize TLD retrofit. The strategy developed in this study, by contrast, aimed to take a holistic approach to address all these multiple aspects of the problem (HEC and carbon emission reduction, heritage value preservation and condensation risk). It does so by devising a trade-off between the need for individual solutions—accounting for the complexity of all factors involved in each dwelling—and the necessity of consistency in the rationale behind the choice of interventions and materials.
Due to its multifaceted, modular and adaptable approach, the methodology devised, used and tested for dwellings in South-East England is flexible and customizable; therefore, it could easily be applied to investigate the current behavior and formulate energy improvement solutions for similar or different buildings in similar or different contextual conditions.
The analysis and discussion of the results of this and similar studies showed that the solution to the problem of whole dwelling retrofit for TLDs cannot be easily generalized because each specific CS needs an individual assessment. Nevertheless, the results presented in this paper are a contribution to the body of research because a range of passive interventions were tested and studied in terms of their feasibility and effectiveness on selected TLD CSs to generate a framework of tested solutions. The need for decision making/assisting tools for retrofit has been highlighted in the literature to aid both users and designers in the choice of the most suitable and effective retrofit scenario. The envisaged results could, finally, provide a more reliable framework of tested solutions and could facilitate dialogue with conservation officers and public conservation bodies to extend the effective and healthy service life of heritage buildings, safely enhancing their energy performance while preserving their heritage values.

6.3. Research Limitations

6.3.1. U-Value Calculations

Invasive investigations (e.g., core sampling) were not possible in the CSs investigated due to the private ownership of the dwellings and their heritage value. Hence, the material build-ups for the whole envelope were based on the actual thickness of the construction, as measured in situ, the visual and tactile investigation of the internal and external surfaces, the thermal imaging survey and the literature review and conversations with local experts on the construction methods and materials of the time. The thermal performance of such envelopes, therefore, was subject to a certain degree of uncertainty. For this matter, it was also considered whether to collect primary data from the real cases to calculate the U-values of their envelopes using heat fluxmeters coupled with internal and external temperature sensors [102,103,104]. This could have been an option, adding to the credibility of the study, but did not prove to be the most practical one as it had cost implications and involved more time or repeated visits that might not have been welcomed by the participants. Furthermore, due to the range of materials used within the same envelope in traditional dwellings and to the varied thicknesses of one such envelope, the test should have been repeated in more than a few spots for each CS in order to reach credible fabric survey outcomes.
Therefore, the contingency plan was to use the calculated U-value for each building element according to the assumptions related to the material build-ups. A quality check of such values was achieved by comparing the U-values calculated by the software with those measured by similar research on traditional masonry buildings. The comparison showed U-values in the range of those measured [64,102,103,104] or calculated [105] by previous studies. A further confirmation of the assumptions made was given by the success of the calibration stage.

6.3.2. Condensation Risk Analysis

There are intrinsic limitations to the use of a steady-state method for condensation risk analysis. These were addressed in this study by the application of a worst-case scenario of boundary conditions. To assess how conservative the IES predictions were and whether this may have affected the results, a dynamic hygrothermal simulation test was carried out for a wall construction in its baseline scenario and post-interventions. The test confirmed the results given by the steady-state assessment carried out in IES.

6.4. Recommendations for Future Research

This study could be further developed to add other insights into this field of research, and the methodology applied here could also be further applied to other similar or different contexts to widen the impact of this research and allow for a wider breadth of results. Some areas where this research could be further developed, or the methodology could further be applied, are as follows.

6.4.1. Indoor Comfort

The retrofit measures selected and tested in this study were assessed against four main criteria, i.e., impact on heritage value, risk of condensation and potential reductions in both HEC and CO2 emissions. The assessment of indoor comfort criteria pre- and post-intervention can add another useful output to this study and further contribute to its holistic approach. This could be important to address the risk of overheating for retrofitted dwellings and is particularly needed for dwellings retrofitted using internal wall insulation. A test run of thermal comfort and an overheating analysis using the TM59 methodology was carried out to ensure compliance with PAS 2035 [106] and can be used for future research. A further stage of simulation would then be needed to explore forthcoming climate scenarios using future weather projection averages.

6.4.2. Economic Implications of the Interventions

The cost of the interventions was excluded from this study. However, this could be a further decision factor to add to the investigation of suitable retrofit measures alongside other analysis criteria. The modularity and flexibility of the methodology devised in this study, however, prove effective and customizable to serve a wider analysis.

Supplementary Materials

The following supporting information can be downloaded at https://www.mdpi.com/article/10.3390/en18040850/s1: Table S1: CS2 Calibration stage 1-energy data; Figure S1: CS2 floor plan with annotated position of data loggers in the living area (L) and in the bedroom area (B1 and B2); Figure S2: CS2 Calibration stage 2a-graphic calibration-temperature data-Living room-5 May–1 July 2017; Table S2: CS2 Calibration stage 2b-NMBE and CV(RMSE) between simulated results and data logging-temperature data-Living room-5 May–1 July 2017; Figure S3: CS2 Calibration stage 2a-graphic calibration-relative humidity data-Living room-5 May–1 July 2017; Table S3: CS2 Calibration stage 2b-NMBE and CV(RMSE) between simulated results and data logging-relative humidity data-Living room-5 May–1 July 2017; Figure S4: CS2 Calibration stage 2a-graphic calibration-temperature data-Living room-14 December 2017–14 February 2018; Table S4: CS2 Calibration stage 2b-NMBE and CV(RMSE) between simulated results and data logging-temperature data-Living room-14 December 2017–14 February 2018; Figure S5: CS2 Calibration stage 2a-graphic-relative humidity data-Living room-14 December 2017–14 February 2018; Table S5: CS2 Calibration stage 2b-NMBE and CV(RMSE) between simulated results and data logging–relative humidity data-Living room-14 December 2017–14 February 2018; Figure S6: CS2 Calibration stage 2a-graphic -temperature data-Living room-30 May–1 August 2018; Table S6: CS2 Calibration stage 2b-NMBE and CV(RMSE) between simulated results and data logging-temperature data-Living room-30 May–1 August 2018; Figure S7: CS2 Calibration stage 2a-graphic calibration-relative humidity data-Living room-30 May–1 August 2018; Table S7: CS2 Calibration stage 2b-NMBE and CV(RMSE) between simulated results and data logging-relative humidity data-Living room-30 May–1 August 2018; Figure S8: CS2 Calibration stage 2a-graphic calibration-temperature data-Master bedroom-30 May–1 August 2018; Table S8: CS2 Calibration stage 2b-NMBE and CV(RMSE) between simulated results and data logging-temperature data-Master bedroom-30 May–1 August 2018; Figure S9: CS2 Calibration stage 2a-graphic calibration-relative humidity data-Master bedroom-30 May–1 August 2018; Table S9: CS2 Calibration stage 2b-NMBE and CV(RMSE) between simulated results and data logging-relative humidity data-Master bedroom-30 May–1 August 2018; Figure S10: CS2 Calibration stage 2a-graphic calibration-temperature data-Master bedroom-14 December 2017–14 February 2018; Table S10: CS2 Calibration stage 2b-NMBE and CV(RMSE) between simulated results and data logging temperature data-Master bedroom-14 December 2017–14 February 2018; Figure S11: CS2 Calibration stage 2a-graphic calibration-relative humidity data-Master bedroom-14 December 2017–14 February 2018; Table S11: CS2 Calibration stage 2b-NMBE and CV(RMSE) between simulated results and data logging-relative humidity data-Master bedroom-14 December 2017–14 February 2018; Table S12: Envelope U-values pre- and post-interventions TFA and thermal envelope area of the CSs; Figure S12: CS2 and areas of intervention A2 (windows) and A6 (wall); Figure S13: CS2 is a first-floor dwelling in the Brunswick Town Conservation Area; Table S13: Medium and high-risk interventions: individual ranking for CS2; Table S14: The combinations ranking matrix for CS2.

Author Contributions

Conceptualization, M.M., N.P. and P.P.; methodology, M.M., N.P. and P.P.; software, M.M.; validation, M.M.; formal analysis, M.M.; investigation, M.M.; resources, M.M.; data curation, M.M.; writing—original draft preparation, M.M.; writing—review and editing, M.M., N.P. and P.P.; visualization, M.M.; supervision, N.P. and P.P.; project administration, M.M. All authors have read and agreed to the published version of the manuscript.

Funding

This research received no external funding.

Data Availability Statement

The original data presented in the study are openly available at https://research.brighton.ac.uk/en/studentTheses/a-future-proof-cultural-heritage (accessed on 7 December 2024).

Conflicts of Interest

The authors declare no conflict of interest.

References

  1. BEIS. 2020 UK Greenhouse Gas Emissions, Final Figures. 2024. Available online: https://assets.publishing.service.gov.uk/media/65c0d15863a23d0013c821e9/2022-final-greenhouse-gas-emissions-statistical-release.pdf (accessed on 10 June 2024).
  2. CCC. Progress in Reducing Emissions 2024 Report to Parliament; Committee on Climate Change (CCC), 2024; Available online: https://gemserv.com/wp-content/uploads/2024/07/Gemserv-Summary-CCC-2024-Annual-Progress-Report-to-Parliament.pdf (accessed on 5 June 2024).
  3. STBA. Responsible Retrofit of Traditional Buildings; Sustainable Traditional Buildings Alliance (STBA): London, UK, 2012; Available online: http://www.sdfoundation.org.uk/downloads/RESPONSIBLE-RETROFIT_FINAL_20_SEPT_2012.pdf (accessed on 25 October 2022).
  4. Historic England. Energy Efficiency and Historic Buildings—Application of Part L of the Building Regulations to Historic and Traditionally Constructed Buildings; Historic Scotland: Edinburgh, UK, 2011. [Google Scholar]
  5. STBA. Performance and Energy Efficiency of Traditional Buildings: Gap Analysis Update 2020; Historic England: London, UK, 2020. [Google Scholar]
  6. May, N.; Griffith, N. Planning Responsible Retrofit of Traditional Buildings; STBA: London, UK, 2015. [Google Scholar]
  7. Organ, S.; Wood, M.; Drewniak, D.; Lamond, J. Carbon Reduction Scenarios in the Built Historic Environment: Final Report for Historic England; University of the West of England: Bristol, UK, 2020. [Google Scholar]
  8. Bottrill, C. Homes in Historic Conservation Areas in Great Britain: Calculating the Proportion of Residential Dwellings in Conservation Areas; University of Oxford: Oxford, UK, 2005. [Google Scholar]
  9. Grosvenor. Heritage & Carbon: How Historic Buildings Can Help Tackle the Climate Crisis; Grosvenor: London, UK, 2021. [Google Scholar]
  10. HM Government. Adapting Historic Homes for Energy Efficiency: A Review of the Barriers; HM Government, 2024. Available online: https://www.gov.uk/government/publications/adapting-historic-homes-for-energy-efficiency-a-review-of-the-barriers/adapting-historic-homes-for-energy-efficiency-a-review-of-the-barriers (accessed on 3 November 2024).
  11. HM Government. The Building Regulations 2010: Approved Document L1B—Conservation of Fuel and Power in Existing Dwellings; HM Government: London, UK, 2010. [Google Scholar]
  12. DCLG. National Planning Policy Framework; Department for Communities and Local Government (DCLG): London, UK, 2012. Available online: https://assets.publishing.service.gov.uk/government/uploads/system/uploads/attachment_data/file/6077/2116950.pdf (accessed on 1 April 2020).
  13. BEST. Brighton & Hove, Eastbourne, Hastings, Lewes, Rother, Wealden: Private Sector Housing Stock Condition Surveys-Sub Regional Overview Report; Brighton and East Sussex Together, 2008. Available online: https://ww3.brighton-hove.gov.uk/sites/brighton-hove.gov.uk/files/Brighton%20&%20Hove%20Stock%20Condition%20Survey%202008.pdf (accessed on 21 January 2020).
  14. Antram, N.; Morrice, R. Brighton and Hove; Yale University Press: New Haven, CT, USA, 2008. [Google Scholar]
  15. BHCC. Private Sector House Condition Survey 2008: Final Report; Brighton and Hove City Council (BHCC), 2008. Available online: https://www.brighton-hove.gov.uk/sites/brighton-hove.gov.uk/files/Brighton%20%26%20Hove%20Stock%20Condition%20Survey%202008.pdf (accessed on 15 September 2021).
  16. Arregi, B.; Little, J. Hygrothermal Risk Evaluation for the Retrofit of a Typical Solid-walled Dwelling. J. Sustain. Des. Appl. Res. Innov. Eng. Built Environ. 2016, 4, 3. [Google Scholar]
  17. Ascione, F.; de Rossi, F.; Vanoli, G.P. Energy retrofit of historical buildings: Theoretical and experimental investigations for the modelling of reliable performance scenarios. Energy Build. 2011, 43, 1925–1936. [Google Scholar] [CrossRef]
  18. Atkinson, J.L. Evaluating Retrofitted External Wall Insulation. Ph.D. Thesis, Cardiff Metropolitan University, Cardiff, UK, 2015. [Google Scholar]
  19. Avola, F.; Evola, G.; Marletta, L. Energy savings and summer thermal comfort for retrofitted buildings: A complex balance. In Sustainability in Energy and Buildings: Proceedings of SEB 2019; Springer: Singapore, 2019; pp. 281–293. [Google Scholar]
  20. Banfill, P.; Simpson, S.; Haines, V.; Mallaband, B. Energy-led retrofitting of solid wall dwellings: Technical and user perspectives on airtightness. Struct. Surv. 2012, 30, 267–279. [Google Scholar] [CrossRef]
  21. BEIS. Demonstration of Energy Efficiency Potential (DEEP): Literature Review of Benefits and Risks in Domestic Retrofit Practice and Modelling; Leeds Sustainability Institute, Leeds Beckett University: Great Britain, UK, 2021. [Google Scholar]
  22. Ben, H.; Steemers, K. Energy retrofit and occupant behaviour in protected housing: A case study of the Brunswick Centre in London. Energy Build. 2014, 80, 120–130. [Google Scholar] [CrossRef]
  23. Bianco, T.; Pollo, P.; Serra, V. Wood fibre vs synthetic thermal insulation for roofs energy retrofit: A case study in Turin, Italy. Energy Procedia 2017, 111, 347–356. [Google Scholar] [CrossRef]
  24. Blecich, P.; Franković, M.; Kristl, Ž. Energy retrofit of the Krsan Castle: From sustainable to responsible design—A case study. Energy Build. 2016, 122, 23–33. [Google Scholar] [CrossRef]
  25. Bothwell, K.; Saich, M.; Mallion, P. Retrofit of existing housing in the United Kingdom: The carbon reduction possibilities. In PLEA 2011 Architecture & Sustainable Development; Presses Universitaires de Louvain: Louvain-la-Neuve, Belgium, 2011. [Google Scholar]
  26. Broström, T.; Eriksson, P.; Liu, L.; Rohdin, P.; Ståhl, F.; Moshfegh, B. A Method to Assess the Potential for and Consequences of Energy Retrofits in Swedish Historic Buildings. Hist. Environ. Policy Pract. 2014, 5, 150–166. [Google Scholar] [CrossRef]
  27. Byrne, A.; Byrne, G.; Davies, A.; Robinson, A.J. Transient and quasi-steady thermal behaviour of a building envelope due to retrofitted cavity wall and ceiling insulation. Energy Build. 2013, 61, 356–365. [Google Scholar] [CrossRef]
  28. Campbell, N.; Mcgrath, T.; Nanukuttan, S.; Brown, S. Monitoring the hygrothermal and ventilation performance of retrofitted clay brick solid wall houses with internal insulation: Two UK case studies. Case Stud. Constr. Mater. 2017, 7, 163–179. [Google Scholar] [CrossRef]
  29. Dalla Mora, T.; Cappelletti, F.; Peron, F.; Romagnoni, P.; Bauman, F. Retrofit of an Historical Building toward NZEB. Energy Procedia 2015, 78, 1359–1364. [Google Scholar] [CrossRef]
  30. Eriksson, P.; Hermann, C.; Hrabovszky-Horváth, S.; Rodwell, D. EFFESUS Methodology for Assessing the Impacts of Energy-Related Retrofit Measures on Heritage Significance. Hist. Environ. 2014, 5, 132–149. [Google Scholar] [CrossRef]
  31. ESNZ; BEIS. National Energy Efficiency Data-Framework (NEED): Summary of Analysis; Department for Energy Security and Net Zero (ESNZ) and Department for Business, Energy and Industrial Strategy (BEIS): London, UK, 2023. [Google Scholar]
  32. Fabbri, K.; Tronchin, L.; Tarabusi, V. Energy Retrofit and Economic Evaluation Priorities Applied at an Italian Case Study. Energy Procedia 2014, 45, 379–384. [Google Scholar] [CrossRef]
  33. Flores, J.A.M. The Investigation of Energy Efficiency Measures in Traditional Buildings in the Oporto World Heritage Site. Ph.D. Thesis, Oxford Brookes University, Oxford, UK, 2013. [Google Scholar]
  34. Fregonara, E.; Lo Versob, V.R.M.; Lisac, M.; Callegaria, G. Retrofit scenarios and economic sustainability. A case-study in the Italian context. Energy Procedia 2017, 111, 245–255. [Google Scholar] [CrossRef]
  35. Galatioto, A.; Ricciu, R.; Salem, T.; Kinab, E. Energy and economic analysis on retrofit actions for Italian public historic buildings. Energy 2019, 176, 58–66. [Google Scholar] [CrossRef]
  36. Galliano, R.; Wakili, K.G.; Binder, B.; Daniotti, B. Evaluation of Three Different Retrofit Solutions Applied to the Internal Surface of a Protected Cavity Wall. Energy Procedia 2015, 78, 848–853. [Google Scholar] [CrossRef]
  37. Harrestrup, M.; Svendsen, S. Full-scale test of an old heritage multi-storey building undergoing energy retrofitting with focus on internal insulation and moisture. Build. Environ. 2015, 85, 123–133. [Google Scholar] [CrossRef]
  38. He, M.; Lee, T.; Taylor, S.; Firth, S.; Lomas, K. Dynamic modelling of a large scale retrofit programme for the housing stock in the North East of England. In Proceedings of the 2nd International Conference in Urban Sustainability and Resilience, London, UK, 3–5 November 2014. [Google Scholar]
  39. Heath, N.; Baker, P.; Menzies, G. Historic Scotland Technical Paper 9: Slim-Profile Double Glazing Thermal Performance and Embodied Energy; Historic Scotland: Edinburgh, UK, 2010. [Google Scholar]
  40. Heath, N.; Pearson, G.; Barnham, B.; Atkins, R. Historic Scotland Technical Paper 8: Energy Modelling of the Garden Bothy, Dumfries House; Historic Scotland: Edinburgh, UK, 2010. [Google Scholar]
  41. Heath, N.; Baker, P. Historic Scotland Technical Paper 20: Slim-Profile Double-Glazing in Listed Buildings Re-Measuring the Thermal Performance; Historic Scotland: Edinburgh, UK, 2013. [Google Scholar]
  42. Hopper, J.; Littlewood, J.R.; Taylor, T.; Counsell JA, M.; Thomas, A.M.; Karani, G.; Geens, A.; Evans, N.I. Assessing retrofitted external wall insulation using infrared thermography. Struct. Surv. 2012, 30, 245–266. [Google Scholar] [CrossRef]
  43. Hugoni, C.; Hugoni, M.E.; Causone, F.; Morello, E. A working methodology for deep energy retrofit of residential multi-property buildings. In Sustainability in Energy and Buildings: Proceedings of SEB 2019; Springer: Singapore, 2019; pp. 687–699. [Google Scholar]
  44. Kolaitis, D.I.; Malliotakis, E.; Kontogeorgos, D.A.; Mandilaras, I.; Katsourinis, D.I.; Founti, M.A. Comparative assessment of internal and external thermal insulation systems for energy efficient retrofitting of residential buildings. Energy Build. 2013, 64, 123–131. [Google Scholar] [CrossRef]
  45. Litti, G.; Audenaert, A.; Lavagna, M. Life cycle operating energy saving from windows retrofitting in heritage buildings accounting for technical performance decay. J. Build. Eng. 2018, 17, 135–153. [Google Scholar] [CrossRef]
  46. Little, J.; Ferraro, C.; Arregi, B. Historic Scotland Technical Paper 15: Assessing Risks in Insulation Retrofits Using Hygrothermal Software Tools; Historic Scotland: Edinburgh, UK, 2015. [Google Scholar]
  47. Little, J.; Arregi, B. Managing moisture—The key to healthy internal wall insulation retrofits of solid walls. In Proceedings of the 17th International Passive House Conference, Frankfurt, Germany, 19–20 April 2013. [Google Scholar]
  48. Lo Cascio, E.; Ma, Z.; Borelli, D.; Schenone, C. Residential building retrofit through numerical simulation: A case study. Energy Procedia 2017, 111, 91–100. [Google Scholar] [CrossRef]
  49. Lowe, R. Technical options and strategies for decarbonizing UK housing. Build. Res. Inf. Int. J. Res. Dev. Demonstr. 2007, 35, 412–425. [Google Scholar] [CrossRef]
  50. Mancini, F.; Cecconi, M.; De Sanctis, F.; Beltotto, A. Energy Retrofit of a Historic Building Using Simplified Dynamic Energy Modeling. Energy Procedia 2016, 101, 1119–1126. [Google Scholar] [CrossRef]
  51. Memon, S. Analysing the potential of retrofitting ultra-low heat loss triple vacuum glazed windows to an existing UK solid wall dwelling. Int. J. Renew. Energy Dev. 2014, 3, 161–174. [Google Scholar] [CrossRef]
  52. Moran, F. Benchmarking the Energy Use of Historic Dwellings in Bath and the Role for Retrofit and LZC Technologies to Reduce CO2 Emissions. Ph.D. Thesis, University of Bath, Bath, UK, 2013. [Google Scholar]
  53. Morelli, M.; Ronby, L.; Mikkelsen, S.E.; Minzari, M.G.; Kildemoes, T.; Tommerup, H.M. Energy retrofitting of a typical old Danish multi-family building to a “nearly-zero” energy building based on experiences from a test apartment. Energy Build. 2012, 54, 395. [Google Scholar] [CrossRef]
  54. Nastasi, B.; di Matteo, U. Innovative use of Hydrogen in energy retrofitting of listed buildings. Energy Procedia 2017, 111, 435–441. [Google Scholar] [CrossRef]
  55. Neroutsou, T.I.; Croxford, B. Lifecycle costing of low energy housing refurbishment: A case study of a 7year retrofit in Chester Road, London. Energy Build. 2016, 128, 178–189. [Google Scholar] [CrossRef]
  56. Rasmussen, T. Retrofitting listed buildings: Measures, savings and requirements. Open Constr. Build. Technol. J. 2011, 5, 174–181. [Google Scholar] [CrossRef]
  57. Rhee-Duverne, S.; Baker, P. A Retrofit of a Victorian Terrace House in New Bolsover: A Whole House Thermal Performance Assessment; Historic Scotland: Edinburgh, UK, 2015. [Google Scholar]
  58. Şahin, C.D.; Arsan, Z.D.; Tunçoku, S.S.; Broström, T.; Akkurt, G.G.; Humanistisk-Samhällsvetenskapliga, V.; Uppsala, U.; Historisk-Filosofiska, F.; Konstvetenskapliga, I. A transdisciplinary approach on the energy efficient retrofitting of a historic building in the Aegean Region of Turkey. Energy Build. 2015, 96, 128–139. [Google Scholar] [CrossRef]
  59. Sdei, A.G.F.; Tittelein, P.; Lassue, S.; Hannad, P.; Beslay, C.; Gournet, R.; Mcevoy, M. Social housing retrofit strategies in England and France: A parametric and behavioural analysis. Energy Res. Soc. Sci. 2015, 10, 62–71. [Google Scholar] [CrossRef]
  60. Silvero, F.; Rodrigues, F.; Montelpare, S. A Parametric Study and Performance Evaluation of Energy Retrofit Solutions for Buildings Located in the Hot-Humid Climate of Paraguay—Sensitivity Analysis. Energies 2019, 12, 427. [Google Scholar] [CrossRef]
  61. Soulios, V.; De Place Hansen, E.J.; Peuhkuri, R. Hygrothermal simulation assessment of internal insulation systems for retrofitting a historic Danish building. MATEC Web Conf. 2019, 282, 2049. [Google Scholar] [CrossRef]
  62. Vereecken, E.; van Gelder, L.; Janssen, H.; Roels, S. Interior insulation for wall retrofitting—A probabilistic analysis of energy savings and hygrothermal risks. Energy Build. 2015, 89, 231–244. [Google Scholar] [CrossRef]
  63. Wise, F.; Moncaster, A.; Derek, J. Rethinking retrofit of residential heritage buildings. Build. Cities 2021, 2, 495–517. [Google Scholar] [CrossRef]
  64. Ingram, V. Energy Performance of Traditionally Constructed Dwellings in Scotland. Ph.D. Thesis, Heriot-Watt University, Edinburgh, UK, 2013. [Google Scholar]
  65. English Heritage. Constructive Conservation in Practice; English Heritage: London, UK, 2008. [Google Scholar]
  66. English Heritage. Energy Conservation in Traditional Buildings; English Heritage: London, UK, 2008. [Google Scholar]
  67. English Heritage. Heritage Counts; English Heritage: London, UK, 2008; Available online: https://historicengland.org.uk/content/heritage-counts/pub/previous/london/london_2008-pdf/ (accessed on 25 January 2018).
  68. Historic England. Energy Efficiency and Historic Buildings: Draught-Proofing Windows and Doors; Historic Scotland: Edinburgh, UK, 2016. [Google Scholar]
  69. Historic England. Energy Efficiency and Historic Buildings: Insulating Flat Roofs; Historic Scotland: Edinburgh, UK, 2016. [Google Scholar]
  70. Historic England. Energy Efficiency and Historic Buildings: Insulating Pitched Roofs at Ceiling Level; Historic Scotland: Edinburgh, UK, 2016. [Google Scholar]
  71. Historic England. Energy Efficiency and Historic Buildings: Insulating Solid Ground Floors; Historic Scotland: Edinburgh, UK, 2016. [Google Scholar]
  72. Historic England. Energy Efficiency and Historic Buildings: Insulating Solid Walls; Historic Scotland: Edinburgh, UK, 2016. [Google Scholar]
  73. Historic England. Energy Efficiency and Historic Buildings: Insulating Suspended Timber Floors; Historic Scotland: Edinburgh, UK, 2016. [Google Scholar]
  74. Historic England. Energy Efficiency and Historic Buildings: Secondary Glazing for Windows; Historic Scotland: Edinburgh, UK, 2016. [Google Scholar]
  75. Historic England. Heritage Works: A Toolkit of Best Practice in Heritage Regeneration; Historic Scotland: Edinburgh, UK, 2017. [Google Scholar]
  76. Historic England. Traditional Windows: Their Care, Repair and Upgrading; Historic Scotland: Edinburgh, UK, 2017. [Google Scholar]
  77. Historic England. Energy Efficiency and Historic Buildings: How to Improve Energy Efficiency; Historic Scotland: Edinburgh, UK, 2018. [Google Scholar]
  78. Historic Scotland. Short Guide—Fabric Improvements for Energy Efficiency in Traditional Buildings; Historic Scotland: Edinburgh, UK, 2013. [Google Scholar]
  79. SPAB. Energy Efficiency in Old Buildings; Society for the Protection of Ancient Buildings (SPAB): London, UK, 2014. [Google Scholar]
  80. SPAB. Briefing: Windows and Doors; Society for the protection of ancient buildings (SPAB): London, UK, 2016. [Google Scholar]
  81. STBA. Performance and Energy Efficiency of Traditional Buildings: Gap Analysis Study; STBA: London, UK, 2012. [Google Scholar]
  82. STBA. Planning Responsible Retrofit of Traditional Buildings; Sustainable Traditional Buildings Alliance (STBA): London, UK, 2015. [Google Scholar]
  83. Suhr, M.; Hunt, R. The Old House Eco Handbook: A Practical Guide to Retrofitting for Energy-Efficiency & Sustainability; Frances Lincoln Limited.: London, UK, 2013. [Google Scholar]
  84. The Prince’s Regeneration Trust. The Green Guide for Historic Buildings: How to Improve the Environmental Performance of Listed and Historic Buildings; Stationery Office: London, UK, 2010. [Google Scholar]
  85. Eyre, N.; Fawcett, T.; Topouzi, M.; Killip, G.; Oreszczyn, T.; Enkinson, K.; Rosenow, J. Fabric first: Is it still the right approach? Build. Cities 2023, 4, 965–972. [Google Scholar] [CrossRef]
  86. Changeworks. Energy Heritage: A Guide to Improving Energy Efficiency in Traditional and Historic Homes; Changeworks: Edinburgh, UK, 2008. [Google Scholar]
  87. Charles, A. Factors Affecting the Transformation of Existing Dwellings to Low Carbon Homes. Ph.D. Thesis, Glasgow Caledonian University, Glasgow, UK, 2012. [Google Scholar]
  88. Hong, S.H.; Oreszczyn, T.; Ridley, I. The impact of energy efficient refurbishment on the space heating fuel consumption in English dwellings. Energy Build. 2006, 38, 1171–1181. [Google Scholar] [CrossRef]
  89. ICOMOS. How to Improve Energy Performance in European and Mediterranean Architectural and Urban Heritage? Heritage: A Model for Sustainable Development 2010 Paris; ICOMOS France, Euromed Heritage: Paris, France, 2010. [Google Scholar]
  90. Morris, P.; Therivel, R. Methods of Environmental Impact Assessment, 3rd ed.; Routledge: Abingdon, UK, 2009. [Google Scholar]
  91. Menconi, M.; Painting, N.; Piroozfar, P. Building Energy Simulation of Traditional Listed Dwellings in the UK: Data sourcing for a base-case model. In Sustainability in Energy and Buildings: Proceedings of SEB 2019; Springer: Singapore, 2020; pp. 295–307. [Google Scholar]
  92. Menconi, M.; Painting, N.; Piroozfar, P. Responsible retrofit measures for traditional listed dwellings: An energy simulation validation strategy. In Sustainable Ecological Engineering Design: Selected Proceedings from the International Conference of Sustainable Ecological Engineering Design for Society (SEEDS) 2019; Springer International Publishing: Cham, Switzerland, 2020; pp. 379–391. [Google Scholar]
  93. Menconi, M.; Painting, N.; Piroozfar, P. An energy performance baseline scenario for 19th C listed dwellings in the UK. Int. J. Build. Pathol. Adapt. 2024, 42, 133–152. [Google Scholar] [CrossRef]
  94. Menconi, M.; Painting, N.; Piroozfar, P. Building Energy Simulation of 19th C Listed Dwellings in the UK: A strategy to propose and assess suitable retrofit interventions. In Sustainability in Energy and Buildings 2020; Springer: Singapore, 2020; pp. 139–150. [Google Scholar]
  95. Menconi, M.; Painting, N.; Piroozfar, P. Modelling and simulation of low-risk energy retrofit measures for Traditional Listed Dwellings in the UK. J. Build. Eng. 2024, 82, 108346. [Google Scholar] [CrossRef]
  96. BS EN ISO 13788:2002; Hygrothermal Performance of Building Components and Building Elements. Internal Surface Temperature to Avoid Critical Surface Humidity and Interstitial Condensation. Calculation Methods. British Standard Institute (BSI): London, UK, 2002.
  97. BS EN ISO 15026:2007; Hygrothermal Performance of Building Components and Building Elements. Assessment of Moisture Transfer by Numerical Simulation. British Standard Institute (BSI): London, UK, 2007.
  98. BS 5250:2021; Management of Moisture in Buildings. Code of Practice. British Standard Institute (BSI): London, UK, 2021.
  99. Liu, F.; Jia, B.; Chen, B.; Geng, W. Moisture transfer in building envelope and influence on heat transfer. Procedia Eng. 2017, 205, 3654–3661. [Google Scholar] [CrossRef]
  100. Loveday, D.; Vadodaria, K. Project CALEBRE: Consumer Appealing Low Energy Technologies for Building REtrofitting—A Summary of the Project and Its Findings; Loughborough University: Loughborough, UK, 2013. [Google Scholar]
  101. Giorgi, M.; Favre, D.; Goulouti, K.; Lasvaux, S. Hygrothermal assessment of historic buildings’ external walls: Preliminary findings from the RIBuild project for Switzerland. J. Phys. Conf. Ser. 2019, 1343, 012183. [Google Scholar] [CrossRef]
  102. Baker, P. Historic Scotland Technical Paper 2: In-Situ u Value Measurements in Traditional Buildings; Historic Scotland: Edinburgh, UK, 2008. [Google Scholar]
  103. Baker, P. Historic Scotland Technical Paper 10: U-Values and Traditional Buildings: In-Situ Measurements and Their Comparisons to Calculated u-Values; Historic Scotland: Edinburgh, UK, 2011. [Google Scholar]
  104. Rye, C. The SPAB Research Report 1. U-value Report; SPAB: London, UK, 2010. [Google Scholar]
  105. IES-VE. Historic Scotland Technical Paper 5: Energy Modelling of a Mid-19th C Century Villa—Baseline Performance and Improvement Options; Historic Scotland: Edinburgh, UK, 2009. [Google Scholar]
  106. PAS 2035/2030:2019+A1:2022; Specification and Guidance for Retrofitting Dwellings for Improved Energy Efficiency. British Standards Institution (BSI): London, UK, 2019.
Figure 1. Brunswick square, one of the earliest Regency developments in Brighton.
Energies 18 00850 g001
Figure 2. Research framework.
Energies 18 00850 g002aEnergies 18 00850 g002b
Figure 3. Annual HEC savings % [(kWh BL-kWh post-intervention)/kWh BL] achievable after the application of the medium- and high-risk interventions individually (OAAT) on the BL scenario.
Energies 18 00850 g003
Figure 4. Parameter importance targeting HEC: % value of each area of intervention.
Energies 18 00850 g004
Figure 5. Parameter importance %: summing up all sub-areas of intervention.
Energies 18 00850 g005
Figure 6. Parameter importance targeting HEC and CO2 emissions per surface unit (m2) of each area.
Energies 18 00850 g006
Figure 7. HEC savings % achievable with the most effective combinations of interventions.
Energies 18 00850 g007
Table 1. Review of the literature concerning energy retrofit.
ReferenceSettingCase StudiesMain Research Method(s)Retrofit Intervention(s)
[16]IrelandTraditional dwellingSimulationGFI, IWI
[17]ItalyHeritage public buildingSimulationBe, Bo, DGW, DP, IWI, L
[18]UKTraditional dwellingsField observations
Secondary data collection
Thermographic surveys
EWI
[19]ItalyDwellingsSimulationEWI
[20]UKTraditional dwellingsExperiment
Simulation
DGW, DP, GFI, IWI, RI
[21]UKDwellingsBuilding performance evaluation methodsCWI, DGW, DP, GFI, IWI, RI
[22]UKListed dwellingsSimulationBe, Bo, CWI, DP, PI, SGW
[23]ItalyDwellingsExperiment
Simulation
RI
[24]CroatiaHeritage public buildingSimulationDGW, GFI, IWI, RI, SGW
[25]UKSocial housingSimulationBo, EWI, GFI, PV, RI, TGW
[26]SwedenHeritage dwellingSimulationBo, DGW, DP, EWI, IWI, RI
[27]IrelandDwellingMonitoring
Thermographic surveys
CWI, RI
[28]UKTraditional dwellingsMonitoring
Experiment
Thermographic surveys
IWI
[29]ItalyHeritage dwellingExperiment
Simulation
Bo, DGW, IWI, PV, SP
[30]SwedenHeritage dwellingsLiterature reviewEWI
[31]UKBuildingsBuilding Performance Evaluation methodsDGW, DP, GFI, RI, SGW
[32]ItalyDwellingSimulationBo, DGW, IWI, SP
[33]PortugalTraditional heritage dwellingsSimulationBe, Bo, DGW, DP, EWI, GFI, RI, SD
[34]ItalyHouseSimulationBo, DGW, EWI, PV, SP
[35]ItalyHeritage office buildingSimulationDGW, IWI, L, RI, SD
[36]ItalyHeritage public buildingMonitoring
Simulation
CWI
[37]DenmarkHeritage public buildingMonitoring
Simulation
IWI
[38]UKDwellingsSimulationCWI, DGW, IWI, RI,
[39]Scotlandn.a.ExperimentsDGW
[40]ScotlandTraditional houseSimulationBo, DGW, GFI, IWI, RI
[41]ScotlandListed buildingsExperimentsDGW
[42]UKTraditional dwellingsThermographic surveysEWI
[43]ItalyApartment buildingsMonitoring
Simulation
Bo, CWI, EWI, GFI, L, PV, RI
[44]GreeceResidential buildingsSimulationBe, EWI, IWI
[45]GermanyHeritage buildingsThermographic survey
Experiment Simulation
Life cycle assessment
DGW, DP
[46]ScotlandVictorian tenement buildingExperiment
Simulation
IWI
[47]ScotlandTraditional wallSimulationIWI
[48]AustraliaResidential buildingEnergy audit
Simulation
DGW, DP, L, RI, SP
[49]UKResidential buildingsSimulationBo, DGW, EWI, IWI
[50]Italy Heritage public buildingEnergy audit
Thermographic survey
Simulation
Bo, DGW, GFI, IWI, RI
[51]UKTraditional dwellingSimulationTGW
[52]UKTraditional dwellingsSimulationBo, DGW, DP, GFI, IWI, PV, RI, SGW
[53]DenmarkResidential buildingExperiment
Simulation
Bo, IWI, SGW
[54]ItalyHeritage buildingsSimulationBo
[55]UKVictorian houseExperimentDGWa, DP, GFI, IWI, RI, TGW
[7]UK5 Traditional dwellings archetypal modelsSimulationBo, DGW, GFI, EWI, IWI, L, RI, PV, SGW, TGW
[56]DenmarkListed residential buildingSimulationDGW, IWI, RI
[57]UKVictorian terrace houseExperiment
Simulation
Bo, DP, GFI, IWI, FR, SGW
[58]TurkeyHeritage public buildingSimulationBo, DGW, DP, GFI, IWI, RI
[59]UK and FranceSocial housingMonitoring
Simulation
DGW, DP, EWI, GFI, RI
[60]ParaguayDwellingSimulation
Sensitivity analysis
DGW, EWI, IWI, RI
[61]DenmarkHistoric buildingSimulationIWI
[62]BelgiumTraditional wallSimulation
Probabilistic analysis
IWI
[63]UK12 traditional heritage dwellingsSimulationBe, Bo, EWI, GFI, RI, SD, SGW
Be: Behavioral measures; Bo: boiler upgrade; CWI: cavity wall insulation; DGW: double-glazed windows; DGWa: double-glazed windows—argon filled; DP: draught-proofing; EWI: external wall insulation; FR: fabric repair; GFI: ground floor insulation; IWI: internal wall insulation; L: energy-efficient lighting; PI: pipe insulation; PV: photovoltaic panels; RI: roof insulation; SD: shading devices; sDGW: slim double-glazed windows; SGW: secondary glazing windows; SP: solar panels; TGW: triple-glazed windows.
Table 2. CSs 2–12 key variables, size, geometry and constructions.
CS NumberCS2CS7CS8CS12
Conservation Area Brunswick Town Kemp TownMontpellier and Clifton HillKemp Town
Date1st half 19th C1st half 19th C2nd half 19th C1st half 19th C
AspectDual aspectDual aspectSingle aspectDual aspect
Floor levelMiddle floorMiddle and top floorsMiddle floorGround floor
OrientationWest-facing South-facing West-facing West-facing
TFAm276.90195.4962.40158.15
Form Factor0.811.690.461.21
WWR24183320
GeometryEnergies 18 00850 i001Energies 18 00850 i002Energies 18 00850 i003Energies 18 00850 i004
Envelope ConstructionsExternal wall—frontLime render outside, brickwork (2 bricks), plaster-on-lath inside3rd floor: Lime render outside, brickwork (1-and-half bricks), plaster-on-lath inside.
Top floor: Cement render outside, Brickwork (1 brick), insulation and plasterboard inside
N.A.Lime render outside, brickwork (2 bricks), plaster-on-lath inside
External wall—backLime render outside, brickwork (1 brick), plaster on the hard inside3rd floor: Lime render outside, brickwork (1, 1-and-half and 2 bricks), plasterboard inside
Top floor: Cement render outside, Brickwork (1 brick), insulation and plasterboard inside
Lime render outside, brickwork (2 bricks), plaster insideLime render outside, brickwork (1 and 1-and-half bricks), plasterboard inside
Windows—frontn.3 Timber sash—single glazing3rd floor:
n.3 Timber sash—double glazing
n.3 Timber sash—double glazing + gas krypton
Top floor:
n.1 UPVC Sliding—double glazing—argon
N.A.n.2 Timber sash—single glazing
Windows—backn.5 Timber sash—single glazing3rd floor:
n.3 Timber sash—double glazing
n.1 Timber sash—secondary glazing
n.1 Upvc Casement—double glazing—argon
Top floor:
n.1 Upvc Casement—double glazing—argon-filled
n.3 Timber sash—single glazingGround floor:
n.1 Timber sash—single glazing
n.2 Timber casement—double glazing
n.1 Timber casement—single glazing
1st floor:
n.2 Timber sash—secondary glazing
n.1 Timber sash—single glazing
n.1 Timber casement—single glazing
CeilingCarpet floor, timber boarding, timber joists, plaster-on-lath ceilingCarpet floor, timber boarding, timber joists, plaster-on-lath ceilingCarpet floor, timber boarding, timber joists, plaster-on-lath ceilingCarpet floor, timber boarding, timber joists, plaster-on-lath ceiling
Ground floorN.A.N.A.N.A.Rear extension: Suspended timber floor—plastic tiles, timber boarding, timber joists, ventilation void
RoofN.A.Timber pitched roof—insulation at loft level
Timber flat roof—insulation between joists
N.A.Rear extension: Timber flat roof—waterproof membrane, timber boarding, timber joists, ventilation void, insulation between joists
Table 3. CSs 13–17 key variables, size, geometry and constructions.
CS NumberCS13CS14CS16CS17
Conservation Area Kemp TownKemp TownBrunswick TownBrunswick Town
Date1st half 19th C1st half 19th C2nd half 19th C1st half 19th C
Aspect Dual aspectDual aspectSingle aspectDual aspect
Floor levelMiddle floorLower ground floorLower ground floorGround floor
OrientationSouth-facingEast-facing West-facingEast-facing
TFAm2123.9348.7072.72120.45
Form Factor1.251.941.630.89
WWR25182019
Energies 18 00850 i005Energies 18 00850 i006Energies 18 00850 i007Energies 18 00850 i008
Envelope ConstructionsExternal wall—frontLime render outside, brickwork (1-and-half bricks), plaster-on-lath insideLime render outside, brickwork (1 and 1-and-half brick), plasterboard insideCement render outside, brickwork (1-and-half bricks), plaster insideLime render outside, brickwork (1-and-half bricks), plaster-on-lath inside
External wall—backLime render outside, brickwork (1 brick), plaster-on-lath insidePainted brickwork (1 and 1-and-half bricks) outside, plasterboard and plaster N.A.Lime render outside, brickwork (1-and-half bricks), plaster on the hard and plaster-on-lath inside
Windows—frontn.3 Timber casement—single glazingn.2 Timber casement—single glazing
n.1 Timber sash—single glazing
n.2 Timber skylights—double glazing
n.5 Timber sash—single glazingn.2 Timber sash—single glazing
Windows—backn.3 Timber casement—single glazing
n.4 Timber sash—single glazing
n.4 Timber casement—single glazing
n.1 Timber sash—single glazing
n.1 Timber skylight—double glazing
N.A.n.4 Timber sash—single glazing
n.1 Timber casement—double glazing
n.1 Timber casement—single glazing
Ceiling/floorCarpet floor, timber boarding, timber joists, plaster-on-lath ceilingCarpet floor, timber boarding, timber joists, plaster-on-lath ceilingCarpet floor, timber boarding, timber joists, plaster-on-lath ceiling
Ground floorN.A.Clay tiles and stone tiles, solid concrete floorSuspended timber floor, timber boardsN.A.
RoofAbove the kitchen and bedrooms: timber flat Above the living room and bathroom: timber pitched—insulation between raftersN.A.Above the master bedroom: timber pitched
Table 4. Responsible and safe retrofit options selected for each area of intervention.
Areas of InterventionFirst StageSecond Stage
Low-Risk OptionsMedium-Risk OptionsHigh-Risk Options
A1. Whole dwellingL1. Draught-proofingN.A.N.A.
A2. Windows/
glazed doors
A2a. FrontL1. Heavy curtains and shuttersM1. Secondary glazing (single)H1. Slim double glazing
M2. Secondary glazing (double)
A2b. BackL1. Heavy curtains and shuttersM1. Secondary glazing (single)H1. Slim double glazing
M2. Secondary glazing (double)
A3. External doorsA3a. FrontN.A.M1. Internal insulation board—wood fibreboardN.A.
A3b. BackN.A.M1. Internal insulation board—wood fibreboardN.A.
A4. Ground floorA4a. Solid ground floorL1. Carpets—woolM1. Thin insulation board—aerogelH1. New limecrete floor
A4b. Suspended timber ground floorsL1. Carpets—woolM1. Thin insulation board—aerogel H1. Insulation between joists—sheep wool
A5. RoofA5a. PitchedL1. Loft insulation—sheep woolM1. Insulation at rafters’ level between rafters—sheep woolH1. Insulation at rafters’ level above rafters—wood fibreboard
A5b. FlatN.A.M1. Insulation between joists—sheep woolH1. Insulation above flat roof—wood fibreboard
A6. WallsA6a. Internal face plaster-on-lathN.A.M1. Internal blown insulation behind lath—celluloseH1. Internal thin blanket insulation—aerogel
H2. Internal board insulation—wood fibreboard
A6b. Internal face solid or drylinedM1. New permeable plaster—corkH1. Internal thin blanket insulation—aerogel
H2. Internal board insulation—wood fibreboard
The colors assigned to the low-, medium- and high-risk measures is meant to highlight their respective level of risk, as it was also shown in the parametric tables of analysis (see Supplementary Materials S2).
Table 5. Envelope U-values pre- and post-interventions.
WindowsDoorsGround FloorRoofWalls
Target U-Value
W/m2K
1.6 11.80.25 0.18 0.30
A2a FrontA2b BackA3a FrontA3b BackA4a SolidA4b SuspendedA5a PitchedA5b FlatA6a Plaster-on-LathA6b Solid/
Drylined
CS2U-value Baseline (B)5.555.55 1.022.13
U-value M12.352.35 0.550.84
∆U-value (B-M1)3.203.20 0.471.29
U-value M21.441.44 n.a.n.a.
∆ U-value (B-M2)4.114.11 n.a.n.a.
U-value H1n.a.1.58 0.600.55
∆ U-value (B-H1)n.a.3.97 0.421.58
U-value H2n.a.n.a. n.a.0.68
∆ U-value (B-H2)n.a.n.a. n.a.1.45
CS7U-value Baseline (B)1.632.22 0.271.180.95
U-value M11.481.79 0.250.670.64
∆ U-value (B-M1)0.150.43 0.020.510.31
U-value M21.381.29 n.a.n.a.n.a.
∆ U-value (B-M2)0.250.93 n.a.n.a.n.a.
U-value H11.481.44 n.a.0.660.44
∆ U-value (B-H1)0.150.78 n.a.0.520.51
U-value H2n.a.n.a. n.a.0.940.49
∆ U-value (B-H2)n.a.n.a. n.a.0.240.46
CS8U-value Baseline (B) 5.58 1.36
U-value M1 2.25 0.69
∆ U-value (B-M1) 3.33 0.67
U-value M2 1.31 n.a.
∆ U-value (B-M2) 4.27 n.a.
U-value H1 1.46 0.71
∆ U-value (B-H1) 4.13 0.65
U-value H2 n.a. 0.57
∆ U-value (B-H2) n.a. 0.79
CS12U-value Baseline (B)5.403.682.20 0.91 0.211.031.40
U-value M13.151.841.73 0.24 0.200.600.82
∆ U-value (B-M1)2.241.830.47 0.67 0.010.430.58
U-value M22.521.10 n.a. n.a.n.a.n.a.
∆ U-value (B-M2)2.872.58 n.a. n.a.n.a.n.a.
U-value H1n.a.1.23 0.27 0.180.610.75
∆ U-value (B-H1)n.a.2.44 0.64 0.020.420.65
U-value H2n.a.n.a. n.a. n.a.n.a.0.60
∆ U-value (B-H2)n.a.n.a. n.a. n.a.n.a.0.80
CS13U-value Baseline (B)3.975.56 1.601.282.08
U-value M12.302.31 0.330.950.95
∆ U-value (B-M1)1.493.26 1.270.331.13
U-value M21.711.38 0.18n.a.n.a.
∆ U-value (B-M2)2.084.18 1.42n.a.n.a.
U-value H1n.a.1.53 n.a.0.780.78
∆ U-value (B-H1)n.a.4.04 n.a.0.491.30
U-value H2n.a.n.a. n.a.0.920.92
∆ U-value (B-H2)n.a.n.a. n.a.0.361.16
CS14U-value Baseline (B) 5.09 2.200.68 0.280.28 1.39
U-value M1 2.43 1.730.24 0.270.27 0.77
∆ U-value (B-M1) 2.67 0.470.44 0.010.01 0.62
U-value M2 1.66 n.a. n.a.n.a. n.a.
∆ U-value (B-M2) 3.43 n.a. n.a.n.a. n.a.
U-value H1 1.66 0.25 0.180.18 0.59
∆ U-value (B-H1) 3.43 0.44 0.100.10 0.80
U-value H2 n.a. n.a. n.a.n.a. 0.65
∆ U-value (B-H2) n.a. n.a. n.a.n.a. 0.74
CS16U-value Baseline (B)5.17 0.66 1.50
U-value M12.16 0.24 0.72
∆ U-value (B-M1)3.01 0.42 0.77
U-value M21.31 n.a. n.a.
∆ U-value (B-M2)3.86 n.a. n.a.
U-value H11.44 0.24 0.70
∆ U-value (B-H1)3.73 0.41 0.80
U-value H2n.a. n.a. 0.56
∆ U-value (B-H2)n.a. n.a. 0.94
CS17U-value Baseline (B)5.605.20 1.391.56
U-value M12.213.03 0.770.74
∆ U-value (B-M1)3.392.17 0.620.82
U-value M21.252.41 n.a.n.a.
∆ U-value (B-M2)4.352.79 n.a.n.a.
U-value H1n.a.1.97 0.710.50
∆ U-value (B-H1)n.a.3.23 0.681.06
U-value H2n.a.n.a. 0.670.53
∆ U-value (B-H2)n.a.n.a. 0.721.03
1 Whole window U-value.
Disclaimer/Publisher’s Note: The statements, opinions and data contained in all publications are solely those of the individual author(s) and contributor(s) and not of MDPI and/or the editor(s). MDPI and/or the editor(s) disclaim responsibility for any injury to people or property resulting from any ideas, methods, instructions or products referred to in the content.