Article

Building a Novel Electromechanical-Thermal Model for Semi-Solid-State Batteries

1
Hainan Institute of Industry, Haikou 570204, China
2
The Mechanical and Electrical Engineering College, Hainan University, Haikou 570228, China
*
Authors to whom correspondence should be addressed.
Energies 2025, 18(4), 844; https://doi.org/10.3390/en18040844
Submission received: 9 January 2025 / Revised: 6 February 2025 / Accepted: 7 February 2025 / Published: 11 February 2025
(This article belongs to the Section D2: Electrochem: Batteries, Fuel Cells, Capacitors)

Abstract

:
This article develops an electromechanical-thermal model for semi-solid-state batteries using Software COMSOL Multi-physics. The battery’s three-dimensional structure is firstly simplified into a one-dimensional electrochemical model (P2D), which combines the solid heat transfer module and the solid mechanics module. The total power consumption of the battery, obtained from the P2D model, is used to calculate the battery temperature and the lithium concentration. Then, stress analysis of the anode active particles is conducted, and the battery temperature is fed back into both the electrochemical and mechanical models. To validate the model, constant current charge/discharge cycling experiments, as well as tests on the basic electrical parameters and temperature of the battery, are conducted. The electromechanical-thermal model developed in this study serves as an effective tool for simulating semi-solid-state lithium-ion batteries, which can predict the battery’s performance under various operating conditions. The simulation results from the numerical model are consistent with experimental data at low charge/discharge rates, while slightly larger discrepancies are observed at high charge/discharge rates, with the accuracy remaining over 90%. Further, the thermal expansion behavior of the batteries with silicon-carbon anodes during the charge-discharge process can be examined using the developed model.

1. Introduction

With the rapid development of new energy and large-scale automotive energy storage industries, the increase in energy density has become more pronounced in the context of the “Made in China 2025” national policy. By 2025 and 2030, the energy density of power battery cells in China is expected to reach 400 W·h/kg and 500 W·h/kg, respectively. These targets have already reached or exceeded the maximum energy density of current liquid lithium-ion batteries, and the flammability, corrosiveness, and poor thermal stability of liquid lithium-ion battery electrolytes present significant safety issues at high energy densities [1].
To meet the driving needs of electric vehicles while ensuring reliable safety, various automakers must conduct extensive research and experiments on power batteries. The structure of lithium-ion batteries is extremely complex, and traditional experimental testing is time-consuming, resource-intensive, and unable to provide accurate numerical analysis, making it difficult to measure the physicochemical properties inside the battery. Using simulation techniques can effectively detect the working performance of lithium-ion batteries, including but not limited to battery voltage, capacity, electrolyte concentration changes, stress-strain distribution of electrode particles, state of charge (SOC) variations at the positive and negative electrodes, battery temperature, and battery expansion [2,3,4]. Simulation analysis provides valuable guidance and reference for battery design and research, accelerating the battery research process, facilitating rational battery design, and improving battery safety.
In existing research, Sun [5] et al. developed a two-dimensional electrochemical model for solid-state lithium metal batteries, combining thermodynamics and mechanics modules to evaluate the electrochemical performance, temperature field, and stress field distribution of the battery. Although this model provides a theoretical basis for exploring the multi-physics coupling of solid-state batteries, due to the simplified assumptions, the model has certain limitations in simulating the complex structure and dynamic behavior of batteries. The research of Dai [6] et al. analyzed the diffusion polarization and diffusion stress of ternary lithium batteries through the electrochemical-mechanical coupling model and found that the electrode thickness has an important impact on the battery capacity and voltage platform. However, this research mainly focused on the electrochemical process, and the joint analysis of thermal effects and mechanical behavior was insufficient. Zhang [7] et al. revealed the significant impact of ambient temperature on thermal runaway through multi-physics modeling of liquid lithium batteries, but their model still did not cover the unique characteristics of semi-solid or solid-state batteries.
In addition, Mei [8] et al. established a three-dimensional electrochemical-mechanical two-way coupling model to analyze the stress distribution of electrode particles during the charge and discharge process. Studies have shown that diffusion stress induced by the lithium concentration gradient is the main cause of high stress at particle contact points, and long-term cycling will lead to battery performance degradation. However, this model takes less into account the temperature field and cannot fully evaluate the thermo-mechanical coupling effect of the battery.
In summary, although existing research has achieved certain results in the field of liquid lithium batteries, there are still few studies on semi-solid or solid lithium-ion batteries, and there are many deficiencies in multi-physics coupling modeling. Therefore, this study aims to develop a set of electrochemistry-thermodynamics-mechanics coupling models based on COMSOL version 6.1 Multi-physics to conduct a systematic analysis of the charge and discharge behavior and thermal expansion characteristics of semi-solid lithium-ion batteries. This model simplifies the three-dimensional structure of the battery into a one-dimensional pseudo-two-dimensional electrochemical model (P2D), combines solid thermal conduction and mechanics modules, comprehensively evaluates battery performance, and verifies its accuracy through experimental data. Overall, the data indicate that the numerical results are reasonable and reliable despite the simplified sub-models used. Thus, it can achieve both efficiency and accuracy. This research not only provides theoretical support for the design optimization of semi-solid-state batteries but also lays the foundation for future research on multi-physics coupling models and new material systems.

2. Research Methodology

The electromechanical-thermal model for the lithium-ion battery presented in this paper adopts a 1D–3D approach. The pseudo-2D (P2D) model is used to build the electrochemical model of the battery, while a 3D model of the entire battery structure is used to construct the thermal and mechanical models. To verify the mesh independence of the model, two meshes were constructed with 6158 cells and 1602 cells, respectively. The convergence run times for these meshes were 15 h and 2 h, respectively, yielding similar numerical results. Due to the superior efficiency and accuracy of the 1602-cell model, it is chosen to investigate the electrochemical performance, thermal behavior, and mechanical performance of the battery during operation.

2.1. Construction of the Electrochemical Model

2.1.1. Introduction and Assumptions of the P2D Model

In lithium-ion batteries (LIBs), the cathode and anode are mainly composed of two parts: the active layer and the current collector. The active layer is a porous composite material composed of granular active materials, binders, and conductive additives. The cathode and anode electrodes are separated by a porous separator, and the separator and electrodes are immersed in the electrolyte to ensure that the ions inside the battery can be smoothly transported. The function of the current collector is to transfer electrons. At present, the most popular electrochemical model is the pseudo-two-dimensional (P2D) model proposed by Newman et al. [9]. This model combines the porous electrode theory and the concentrated solution theory to provide a basic theoretical framework for the physical and electrochemical processes occurring inside lithium-ion batteries during operation. The P2D model ensures the simplicity of constructing lithium-ion battery models while maintaining reasonable accuracy and precision. The control equations mainly include the electrode kinetic equation, the mass conservation equation, and the charge conservation equation, and the physical model is one-dimensional. Table 1 and Table 2 respectively list the electrochemical parameters and current collector’s parameters involved in the electrochemical model.
Diffusion coefficient of graphite phase:
D s , c = 7 × 10 14 × e x p [ 68025.7 8.314 1 T r e f 1 T ]
Positive electrode solid phase diffusion coefficient:
D s , p = 5 × 10 14 × e x p [ 1200 1 T r e f 1 T ]

2.1.2. Electrochemical Model Governing Equations

The governing equations that describe the internal reaction mechanisms of the lithium-ion battery are as follows:
(1)
Solid-phase charge conservation:
The solid-phase charge conservation in the battery follows Ohm’s law:
i s = σ s e f f ϕ s
σ s e f f = ε s 1.5 σ s
The boundary conditions are as follows:
σ s , n e f f ϕ s | x = 0 = σ s , p e f f ϕ s | x = L n e g + L s e p + L p o s = I
σ s , n e f f ϕ s | x = L n e g = σ s , p e f f ϕ s | x = L n e g + L s e p = 0
In the above equations, i s is the solid-phase current density, σ s e f f is the effective solid-phase conductivity of the lithium-ion battery, ϕ s is the solid-phase potential of the lithium-ion battery, ε s is the volume fraction of the active material, I is the battery current density, and σ s is the solid-phase conductivity.
The above boundary conditions indicate that at the boundary between the negative current collector and the negative electrode, as well as at the boundary between the positive current collector and the positive electrode, the battery current density is the same and continuous. At the boundaries between the negative electrode and the separator, as well as between the positive electrode and the separator, there is no solid-phase charge flux.
(1)
Liquid-phase charge conservation:
The liquid-phase charge conservation in the battery follows Ohm’s law:
i l = σ l e f f ϕ l + 2 R g T σ l e f f F t + 1 ln c l
σ l e f f = ε l 1.5 σ l
The boundary conditions are as follows:
σ l , n e f f ϕ l | x = 0 = σ l , p e f f ϕ l | x = L n e g + L s e p + L p o s = 0
In the above equations, i l is the liquid-phase current density, σ l e f f is the effective liquid-phase conductivity of the lithium-ion battery, ϕ l is the liquid-phase potential of the lithium-ion battery, R g is the gas constant, T is the battery temperature, F is Faraday’s constant, and t + is the lithium-ion transference number. The equation indicates that there is no liquid-phase charge flux at the boundaries of the positive and negative electrodes.
(2)
Solid-phase mass conservation:
The mass conservation of lithium ions in the solid-phase active particles of the battery is governed by Fick’s second law:
c s t = r c s t r 2 D s 1 r 2
The boundary conditions are as follows:
D s , n c s , n r | r = 0 = D s , p c s , p r | r = 0 = 0
D s , n c s , n r | r = R s , n = J n
D s , p c s , p r | r = R s , p = J p
In the above equations, c s is the solid-phase lithium concentration, t is time, r is the radial distance of the active particles, D s is the lithium diffusion coefficient, R s , n is P the radius of the negative electrode active particles, R s , p is the radius of the positive electrode active particles, J n is the lithium flux in the negative electrode active particles and J p is the lithium flux in the positive electrode active particles. The equation indicates that at r = 0, which is the center of the positive and negative electrode active particles, the lithium flux is zero. At r = R s , n / R s , p , which is the interface between the surface of the positive and negative electrode active particles and the liquid phase, the lithium flux equals the rate of lithium-ion insertion or extraction.
(3)
Liquid-phase mass conservation:
The diffusion and migration of lithium ions in the liquid phase can be described by the concentrated solution theory:
ε l c l t = x D l e f f c l x + 1 t + a J
The boundary conditions are as follows:
D l , n e f f c l x | x = 0 = D l , p e f f c l x | x = L n e g + L s e p + L p o s = 0
D l , n e f f c l x | x = L n e g = D l , s e f f c l x | x = L n e g +
D l , s e f f c l x | x = L n e g + L s e p = D l , p e f f c l x | x = L n e g + L s e p +
In the above equations, c l is the liquid-phase lithium concentration, ε l is the liquid-phase volume fraction, D l e f f is the effective liquid-phase diffusion coefficient, and a is the specific surface area of the active particles in each electrode. The boundary conditions indicate that at the boundary between the negative current collector and the negative electrode, as well as at the boundary between the positive current collector and the positive electrode, lithium ions cannot pass through, so the liquid-phase lithium-ion flux is zero. However, at the boundaries between the negative electrode and the separator, as well as between the separator and the positive electrode, the liquid-phase lithium-ion concentration is the same, and its concentration variation is continuous.
(4)
Electrochemical kinetics equation:
During the constant current charge and discharge process, lithium ions are embedded or de-embedded between the positive and negative electrodes. This process is generally described by the classic Butler-Volmer Equations (18)–(20). The specific equation is as follows:
i I o c = i 0 exp α a F η R g T exp α c F η R g T
i 0 = F k c s α c c l c l , r e f α a c s , m a x c s α a
η = ϕ s ϕ l U e q
In the above equation, i I o c is the local current density at the particle surface, i 0 is the exchange current density, α a is the anodic charge transfer coefficient, α c is the cathodic charge transfer coefficient, η is the overpotential of the electrode, which measures the rate of the electrochemical reaction, k is the exchange current reaction constant, c l , r e f is the reference concentration of the electrolyte at the electrode, c s , m a x is the maximum solid-phase lithium concentration in the electrode and U e q is the open-circuit voltage.

2.2. Construction of the Thermal Model

The three-dimensional model constructed in this study is shown in Figure 1. Based on the overall geometric parameters of the battery, reasonable simplifications were made: the battery cell was replaced by a rectangular domain, and the thin sheets on both sides were modeled as the tabs. An idealized air domain was used to replace the airflow field model; that is, the simulated ambient temperature remained constant, and there was no fluid flow in the air domain. Table 3 lists the relevant parameters involved in the thermal model.

Thermal Model Governing Equations

Due to the multi-layered structure of the lithium-ion battery and the different materials used in each layer, the internal heat transfer exhibits anisotropic behavior. The specific thermal diffusion behavior inside the battery is governed by Equations (21) and (22):
C p ρ T t = X k X T X + Y k Y T Y + Z k Z T Z + q h q 0
q 0 = h T e i r T
In the above equations, C p is the average specific heat capacity of the battery at constant pressure, which can be estimated experimentally; ρ is the average density of the battery, obtained through measurements; k X is the thermal conductivity of the battery along the X-axis; k Y is the thermal conductivity of the battery along the Y-axis; k Z is the thermal conductivity of the battery along the Z-axis; q h is the total heat generation rate from the electrochemical reaction within the battery; q 0 is the contribution from convective heat transfer at the battery boundary; h is the convective heat transfer coefficient and T e i r is the ambient temperature.

2.3. Construction of the Mechanical Model

The mechanical model developed in this study is applied to the geometry of the P2D model and the three-dimensional thermal model described above. In the P2D model, during the charge and discharge processes of the lithium-ion battery, the diffusion and concentration changes of lithium ions generate stress and strain in the active particles of the electrodes. Additionally, when thermal behaviors occur in the battery, the temperature variations induce stress and strain within the battery. The mechanical parameters involved in the mechanical model are listed in Table 4 and Table 5.
At the three-dimensional battery level, the battery expansion is primarily caused by temperature changes. Based on this, the general form of Hooke’s law is applied to solve for the thermal expansion behavior of the battery.

Mechanical Model Governing Equations

In this study, the active material particles of the electrodes are modeled as spherical particles. Spherical particles have the advantage of central symmetry, which simplifies the difficulty of solving the stress problem in the particles. For spherical particles, the stress can be divided into radial and tangential components as follows:
σ r r = 2 Ω E 9 v 1 c a v r c a v R s
σ θ r = Ω E 9 v 1 c a v r + 2 c a v R s 3 c s r
At the center of the particle, the stress is the hydrostatic stress [8]:
σ h r = 2 σ θ r + σ r r 3
When the electrode particles undergo elastic deformation to the limit, they will exhibit plastic deformation. The initiation of plastic deformation depends on the yield criterion, which is typically expressed using the Von Mises equivalent stress:
σ m r = σ r r σ θ r
The thermal expansion of the battery can be calculated using the generalized Hooke’s law:
ε T = α T T T r e f
In the above equations, σ r r is the radial component of the diffusion-induced stress, σ θ ( r ) is the tangential component of the diffusion-induced stress, Ω is the partial molar volume, E is the Young’s modulus, v is the Poisson’s ratio, c a v ( r ) is the average concentration within the spherical volume of radius r of the active particle with radius R s , and as r approaches zero, c a v ( r ) = c s ( 0 ) . σ h ( r ) is the hydrostatic stress at the center of the spherical particle, ε T is the thermal strain, and α T is the coefficient of thermal expansion.

2.4. Semi-Solid-State Charge-Discharge Cycling Experiment

2.4.1. Basic Parameters of the Experimental Battery

The lithium-ion battery studied in this paper is a soft-pack, square, stacked ternary lithium-ion battery. The positive electrode material is NCM111 with a ratio of nickel, cobalt, and manganese of 1:1:1, the negative electrode material is silicon-carbon composite, the diaphragm uses a multilayer composite diaphragm (PP/PE), and the electrolyte uses lithium hexafluorophosphate. Its basic parameters are shown in Table 6.

2.4.2. Experimental Equipment

The lithium-ion battery experiments in this paper were conducted using the Xinwei high-performance battery testing system, thermocouple, BTS software 7.6, and a laptop. The Xinwei high-performance battery testing system has a total of eight independent channels, each capable of transmitting current for charging and discharging the batteries. Each independent channel can be used for charging and discharging tests on a single battery. With the BTS software, various charge and discharge modes and parameters can be set on the laptop. The battery testing system and thermocouple are connected to the laptop via USB, allowing the battery voltage and temperature variations to be monitored on the computer.
Four thermocouple leads are used to register temperatures. One is bonded to the center of the battery surface to measure the battery’s working temperature; one is placed near the terminal tabs to monitor the temperature of the tabs, and the other two are used to monitor the ambient temperature. All four thermocouples are connected to the battery testing system. The BTS software is used to set up a constant current charge and discharge mode (i.e., constant current charging and constant current discharging) for the experimental battery. The charge and discharge cycles are performed at different rates. For the series of experiments, the constant current charging cut-off voltage is consistently set to 4.2 V, and the constant current discharging cut-off voltage is consistently set to 2.75 V, with three cycles of charge and discharge. During both charging and discharging and between discharge and charge, the resting times are set as 600 s (for 0.5 C and 1 C rates) and 2400 s (for 1.5 C and 2 C rates) to allow for sufficient heat dissipation. For low charge/discharge rates (0.5 C and 1 C), a single channel of the testing system is sufficient for the experiment. However, for high charge/discharge rates (1.5 C and 2 C), two parallel channels of the battery testing system are used to meet the required current. Additionally, a temperature protection limit of 65 °C is set (the experiment will automatically stop and trigger an alarm if the battery temperature reaches 65 °C) to prevent overheating.

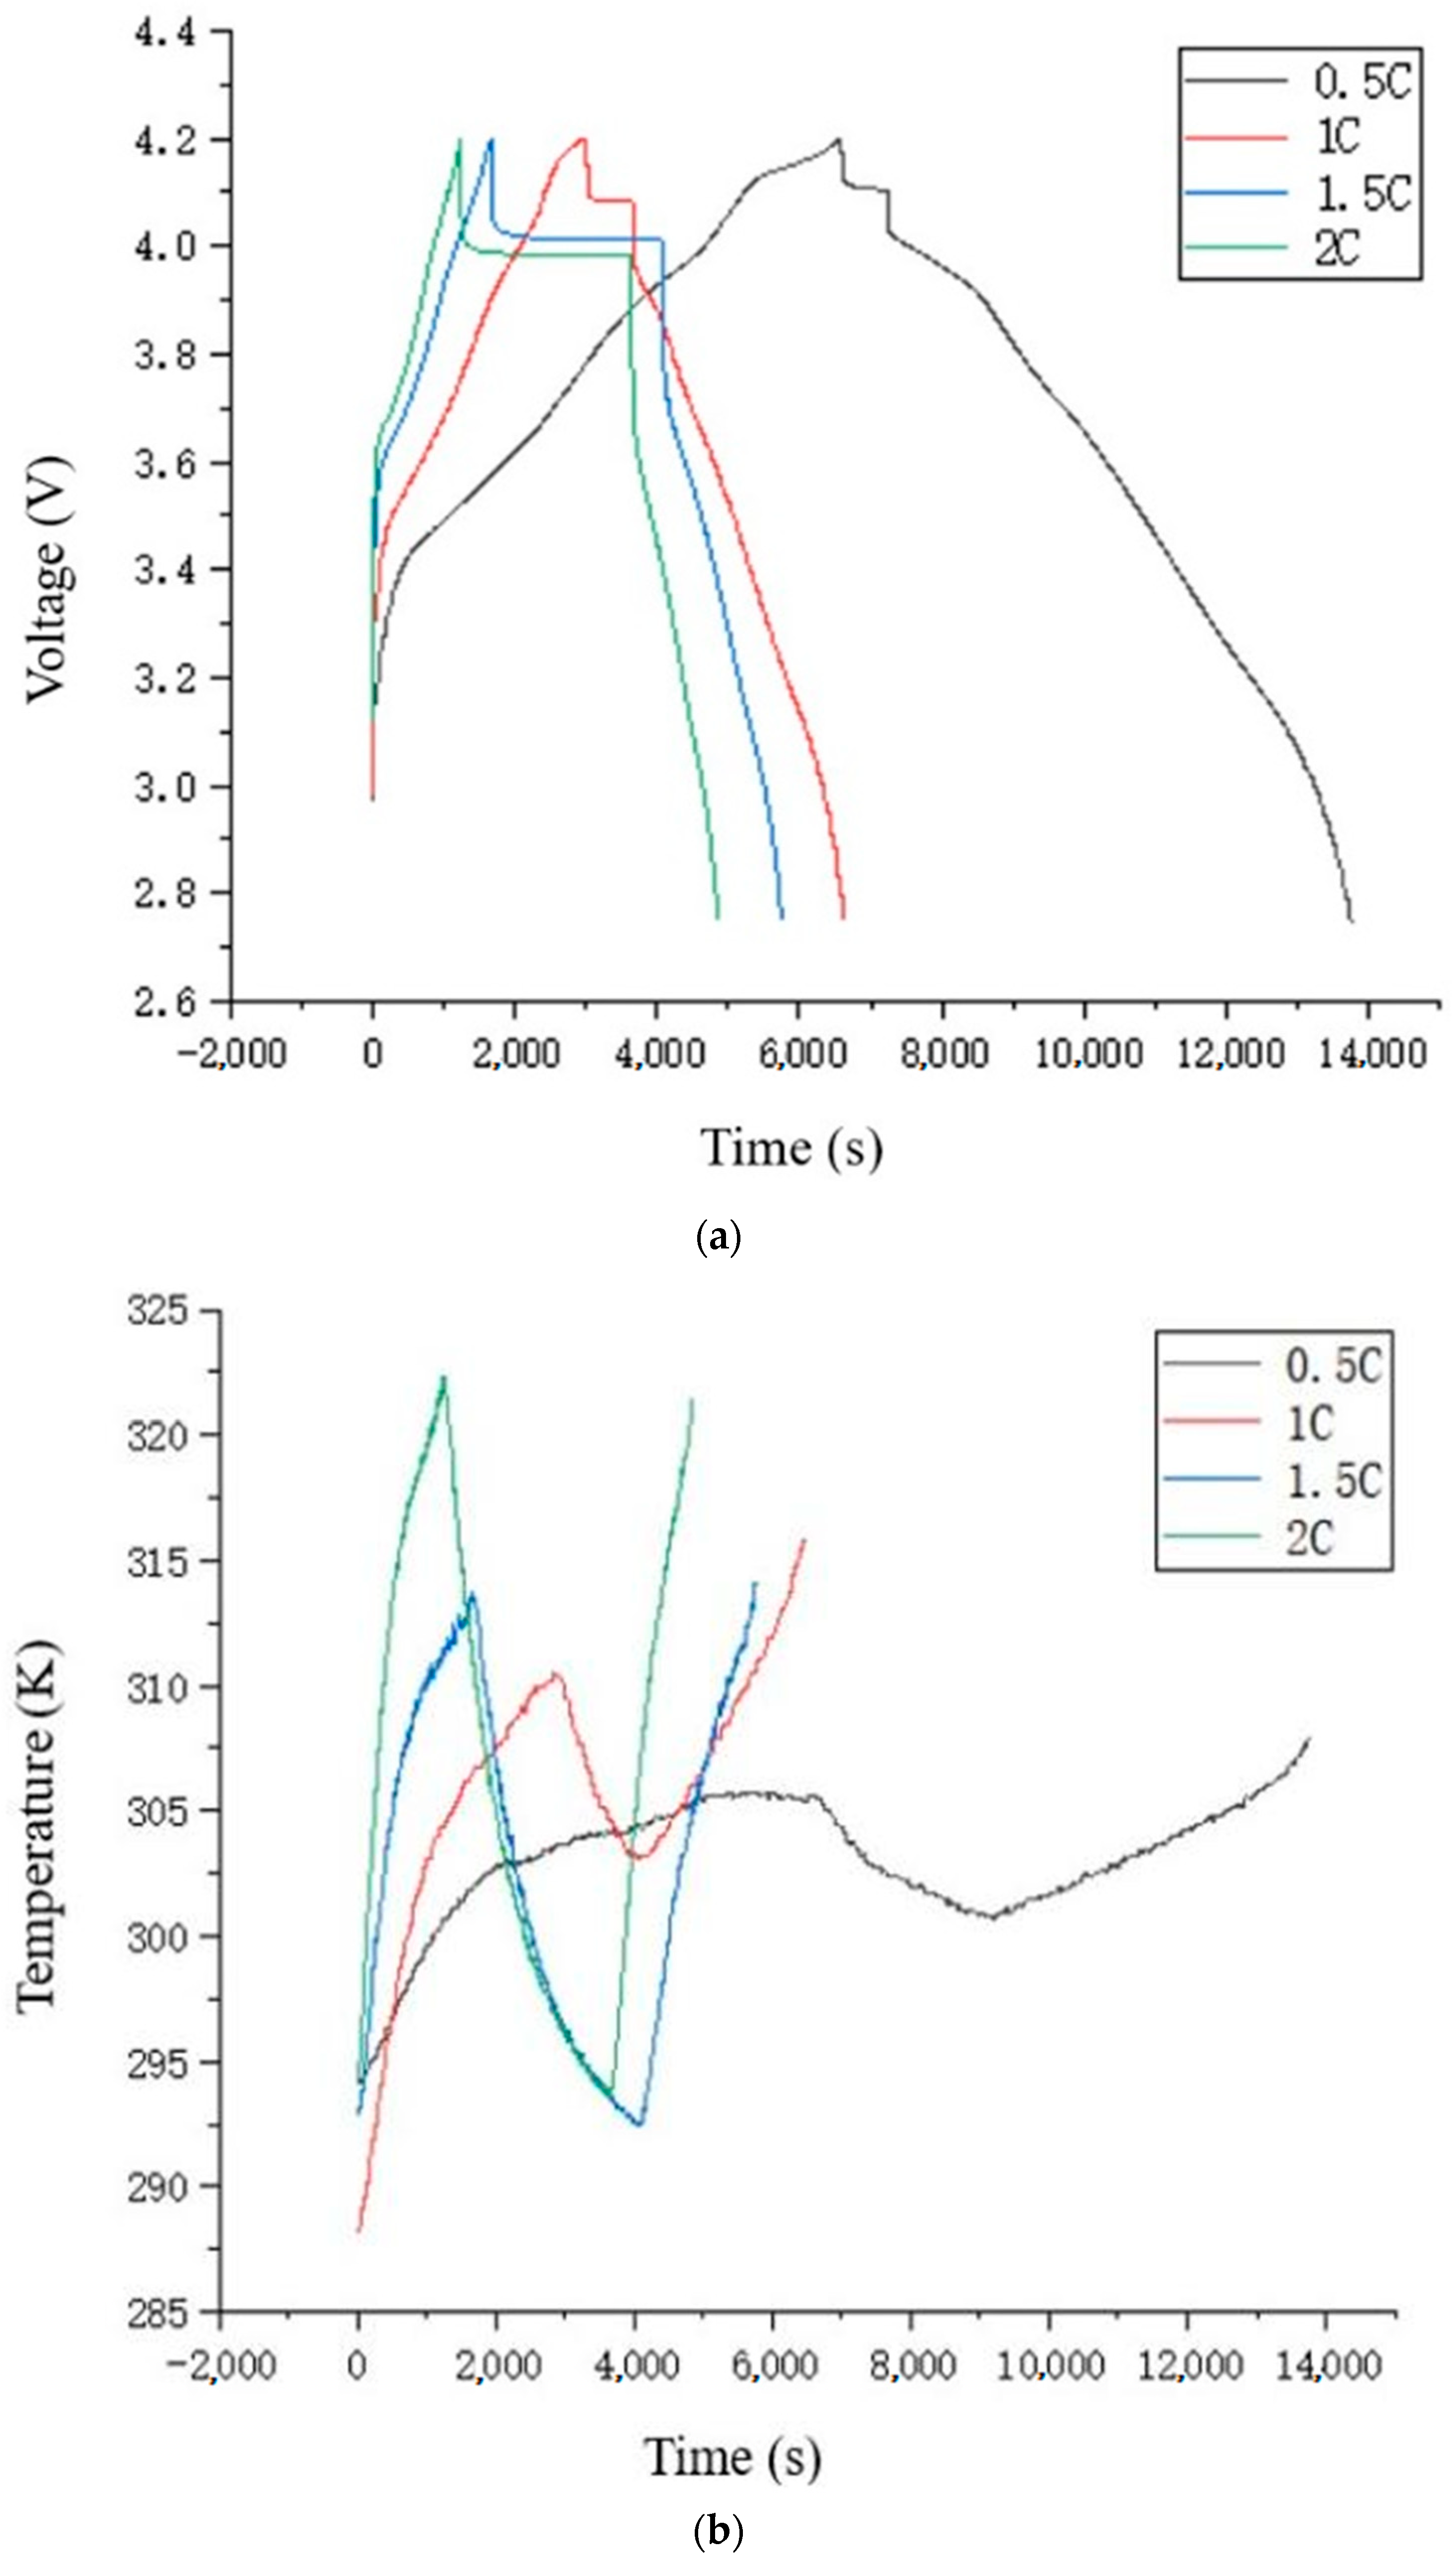
2.4.3. Experimental Data

Based on the experimental procedure described above, the semi-solid-state lithium-ion battery charge and discharge cycling tests were completed. The charge and discharge experiments were conducted in pairs to minimize random errors, and the optimal results were selected for analysis. Therefore, for the 0.5 C and 1 C rate experiments, the data from the first cycle of charge and discharge were used; for the 1.5 C and 2 C rate experiments, the data from the second cycle of charge and discharge were used. The four sets of data were processed using Origin software to generate the voltage curve and the temperature curve, as shown in Figure 2.
(1)
Battery voltage curve:
In experiments with four different charge/discharge rates, the battery voltage rises sharply to a certain level when charging begins, and then the voltage curve flattens as the lithium-ion battery charges slowly. Once the charging voltage reaches the cut-off voltage of 4.2 V and the charging is stopped, the voltage will drop sharply for a certain range, then gradually stabilize (entering the rest state). From the rest state to the start of discharge, the voltage will again drop sharply for a certain range, after which the voltage curve flattens, and the battery discharges slowly. Discharge continues until the cut-off voltage of 2.75 V is reached, marking the end of a charge-discharge cycle. The reasons for the sharp rise or drop in battery voltage at the start of charging, transitioning to the rest state, and transitioning from the rest state to discharge are due to the internal resistance of the battery. Additionally, the higher the charge/discharge rate, the greater the internal resistance, which leads to a larger increase or decrease in battery voltage.
(2)
Battery temperature curve:
During the charge-discharge experiments at four different rates, the battery temperature curve follows an “N” shape. From the start of charging to the rest state, the battery temperature gradually increases. During charging at different rates, the battery temperature can reach up to 305.65 K (0.5 C), 310.55 K (1 C), 313.55 K (1.5 C), and 322.35 K (2 C). Upon reaching the rest state, the temperature begins to gradually decrease. As shown in Figure 3, during the 0.5 C and 1 C charge/discharge rate experiments, the battery temperature did not return to the initial temperature or room temperature when the rest state ended. This is likely because the rest period was insufficient, and the battery had not completely dissipated the heat. In contrast, during the 1.5 C and 2 C rate experiments, the battery temperature returns to its initial temperature by the end of the rest state, and the temperature at the end of discharge is nearly the same as that at the end of charging. The curves are almost symmetric around the center. From the comparison of the four sets of experiments, it can be seen that as the charge/discharge rate increases, the slope of the temperature curve during charging and discharging becomes steeper, meaning that more heat is generated per unit time, and the battery temperature at the end of charging is higher.

3. Results and Discussion

This article uses open-circuit voltage (OCV) and temperature curves under different charge/discharge rates (0.5 C, 1 C, 1.5 C, 2 C) to verify the accuracy of the model. Based on this, the study investigates the diffusion-induced capacity of electrode active particles during 1 C charge/discharge, as well as the Von Mises equivalent stress and the battery’s thermal expansion behavior.

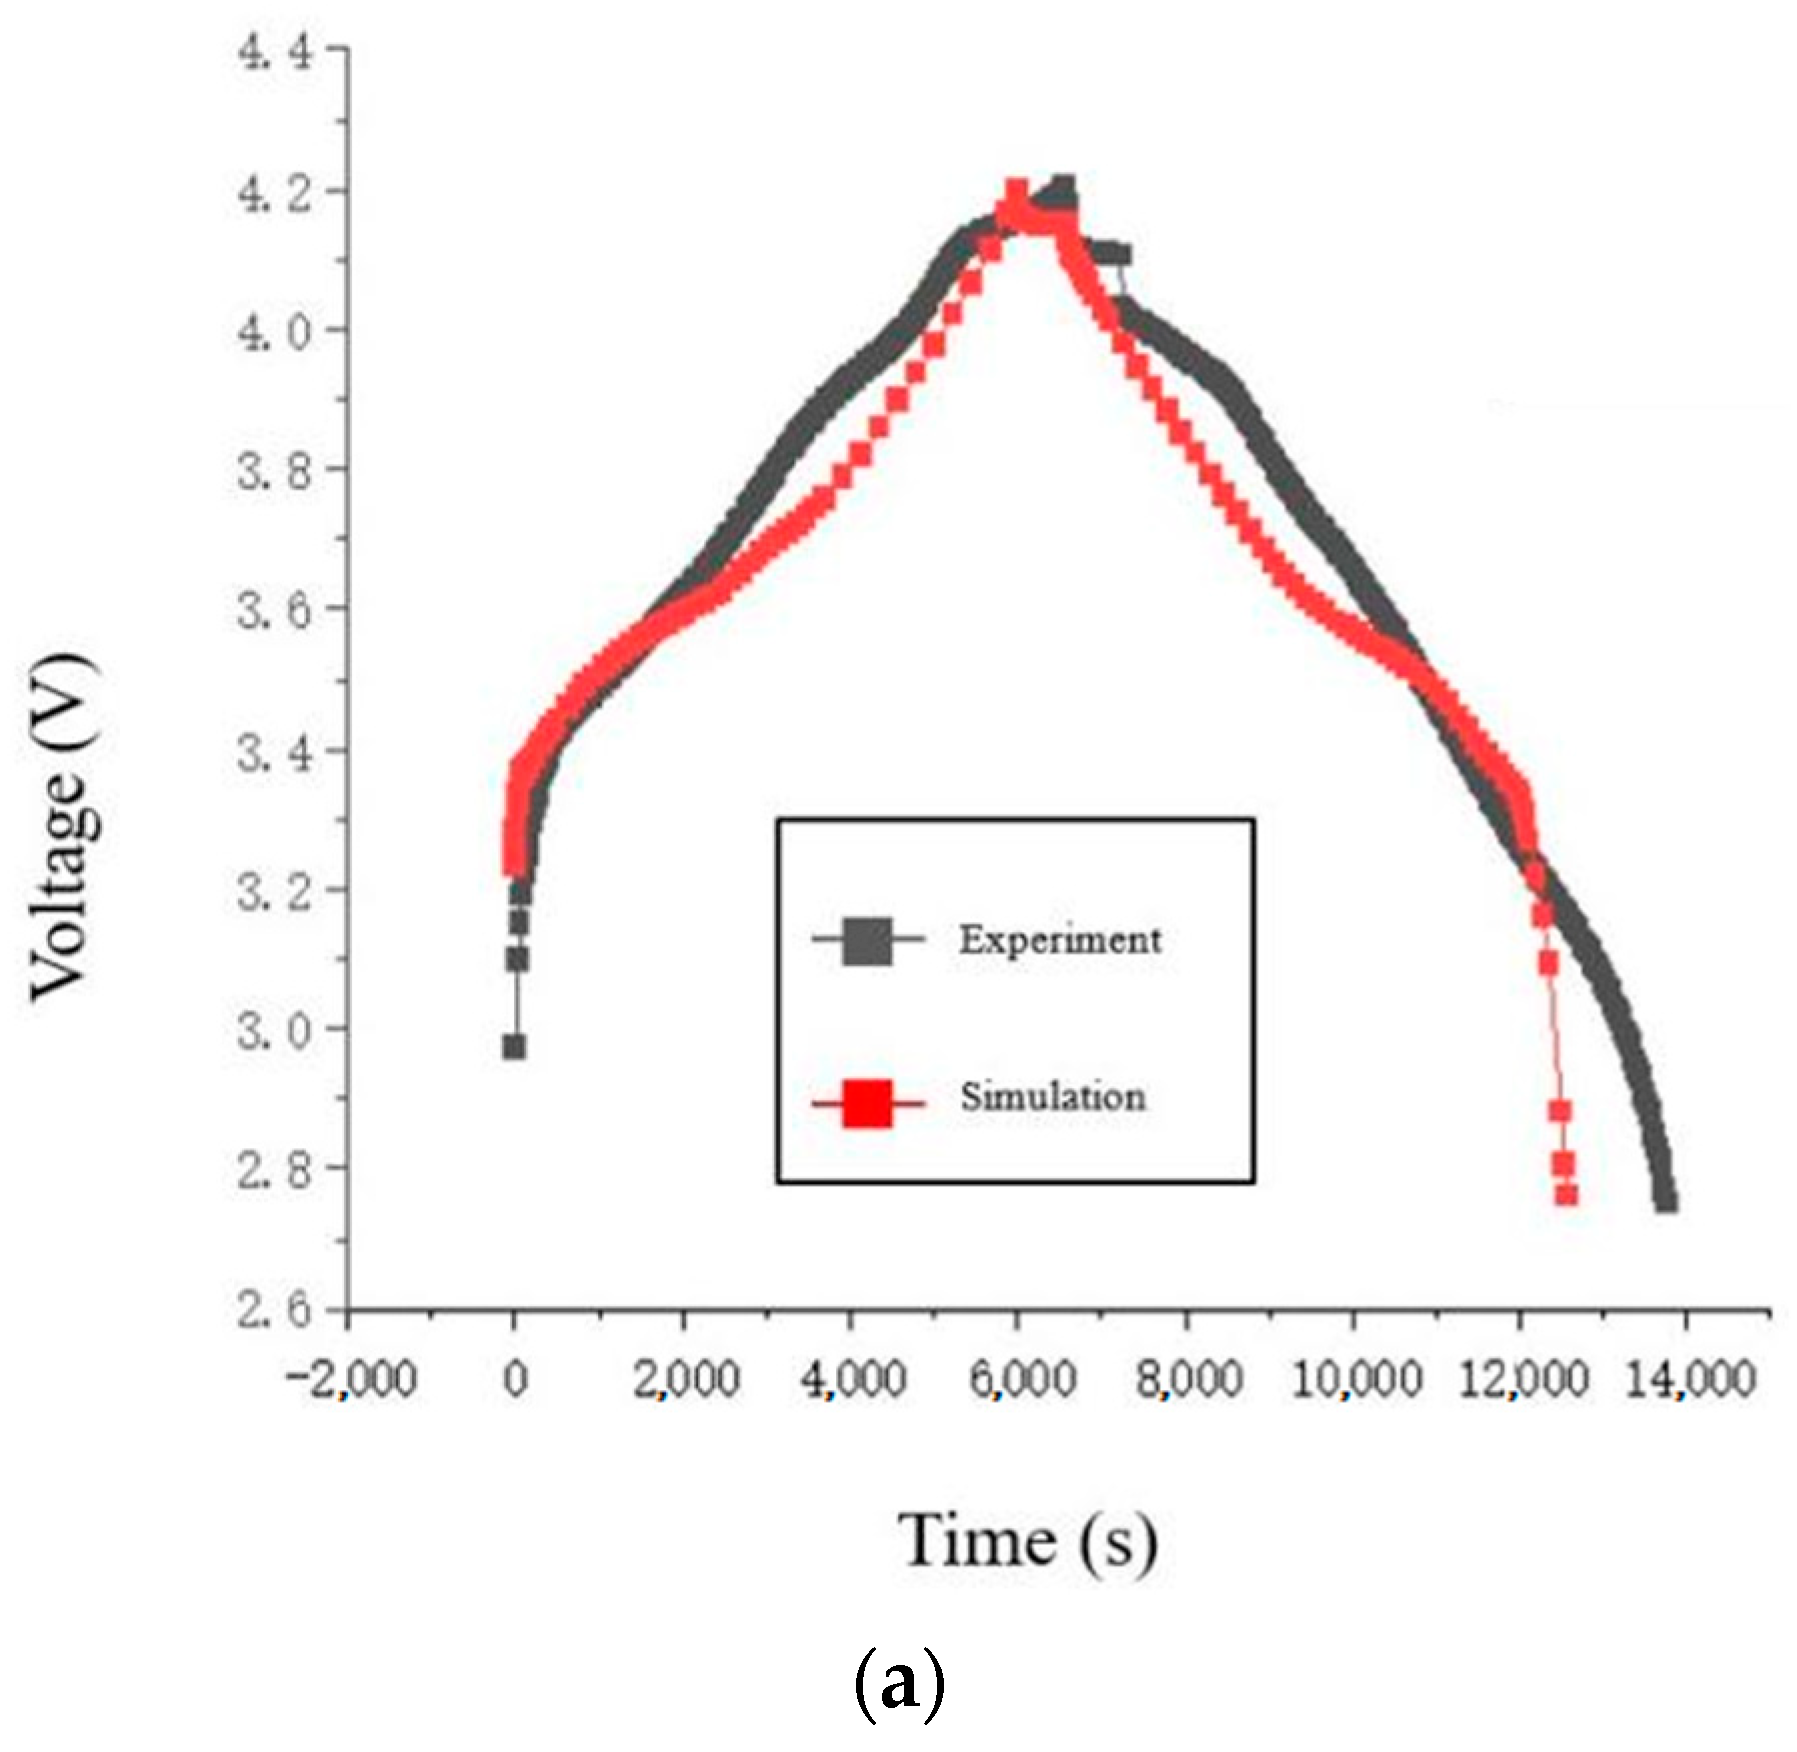
3.1. Electrochemical Model Verification and Analysis

The voltage data generated by the force-electrical coupled model run in COMSOL software (6.1) is compared with experimental data from the charge-discharge cycle. Both sets of data are processed using Origin software (2022), and four sets of voltage fitting curves are obtained, as shown in Figure 3.
The simulation model’s charge and discharge voltage curves at low rates (0.5 C, 1 C) match well with the experimentally measured curves. Since the simulation software cannot read parameter models at fixed time intervals, an estimation of the maximum absolute voltage error by comparing the voltage curves shows that it does not exceed 0.1 V, indicating acceptable simulation accuracy. When comparing the simulation model’s charge and discharge voltage curves at high rates (1.5 C, 2 C) with the experimental curves, the voltage curves during the charging and rest phases match well. Near the end of charging, the maximum absolute voltage error reaches up to 0.18 V. The voltage trend of the simulation model during the discharge phase is similar to that of the experimental measurements, but the voltage values differ by a fixed margin. Considering that during the rest and discharge phases at high discharge rates, the polarization effect in the experimental battery is more sensitive to the discharge rate than in the simulation model. The experimental battery experiences a larger voltage drop during discharge. Subsequently, the voltage trajectory in the simulation model consistently maintains the voltage difference from the moment the battery starts discharging. Therefore, the simulation model is able to accurately simulate the experimental battery behavior at low charge/discharge rates.

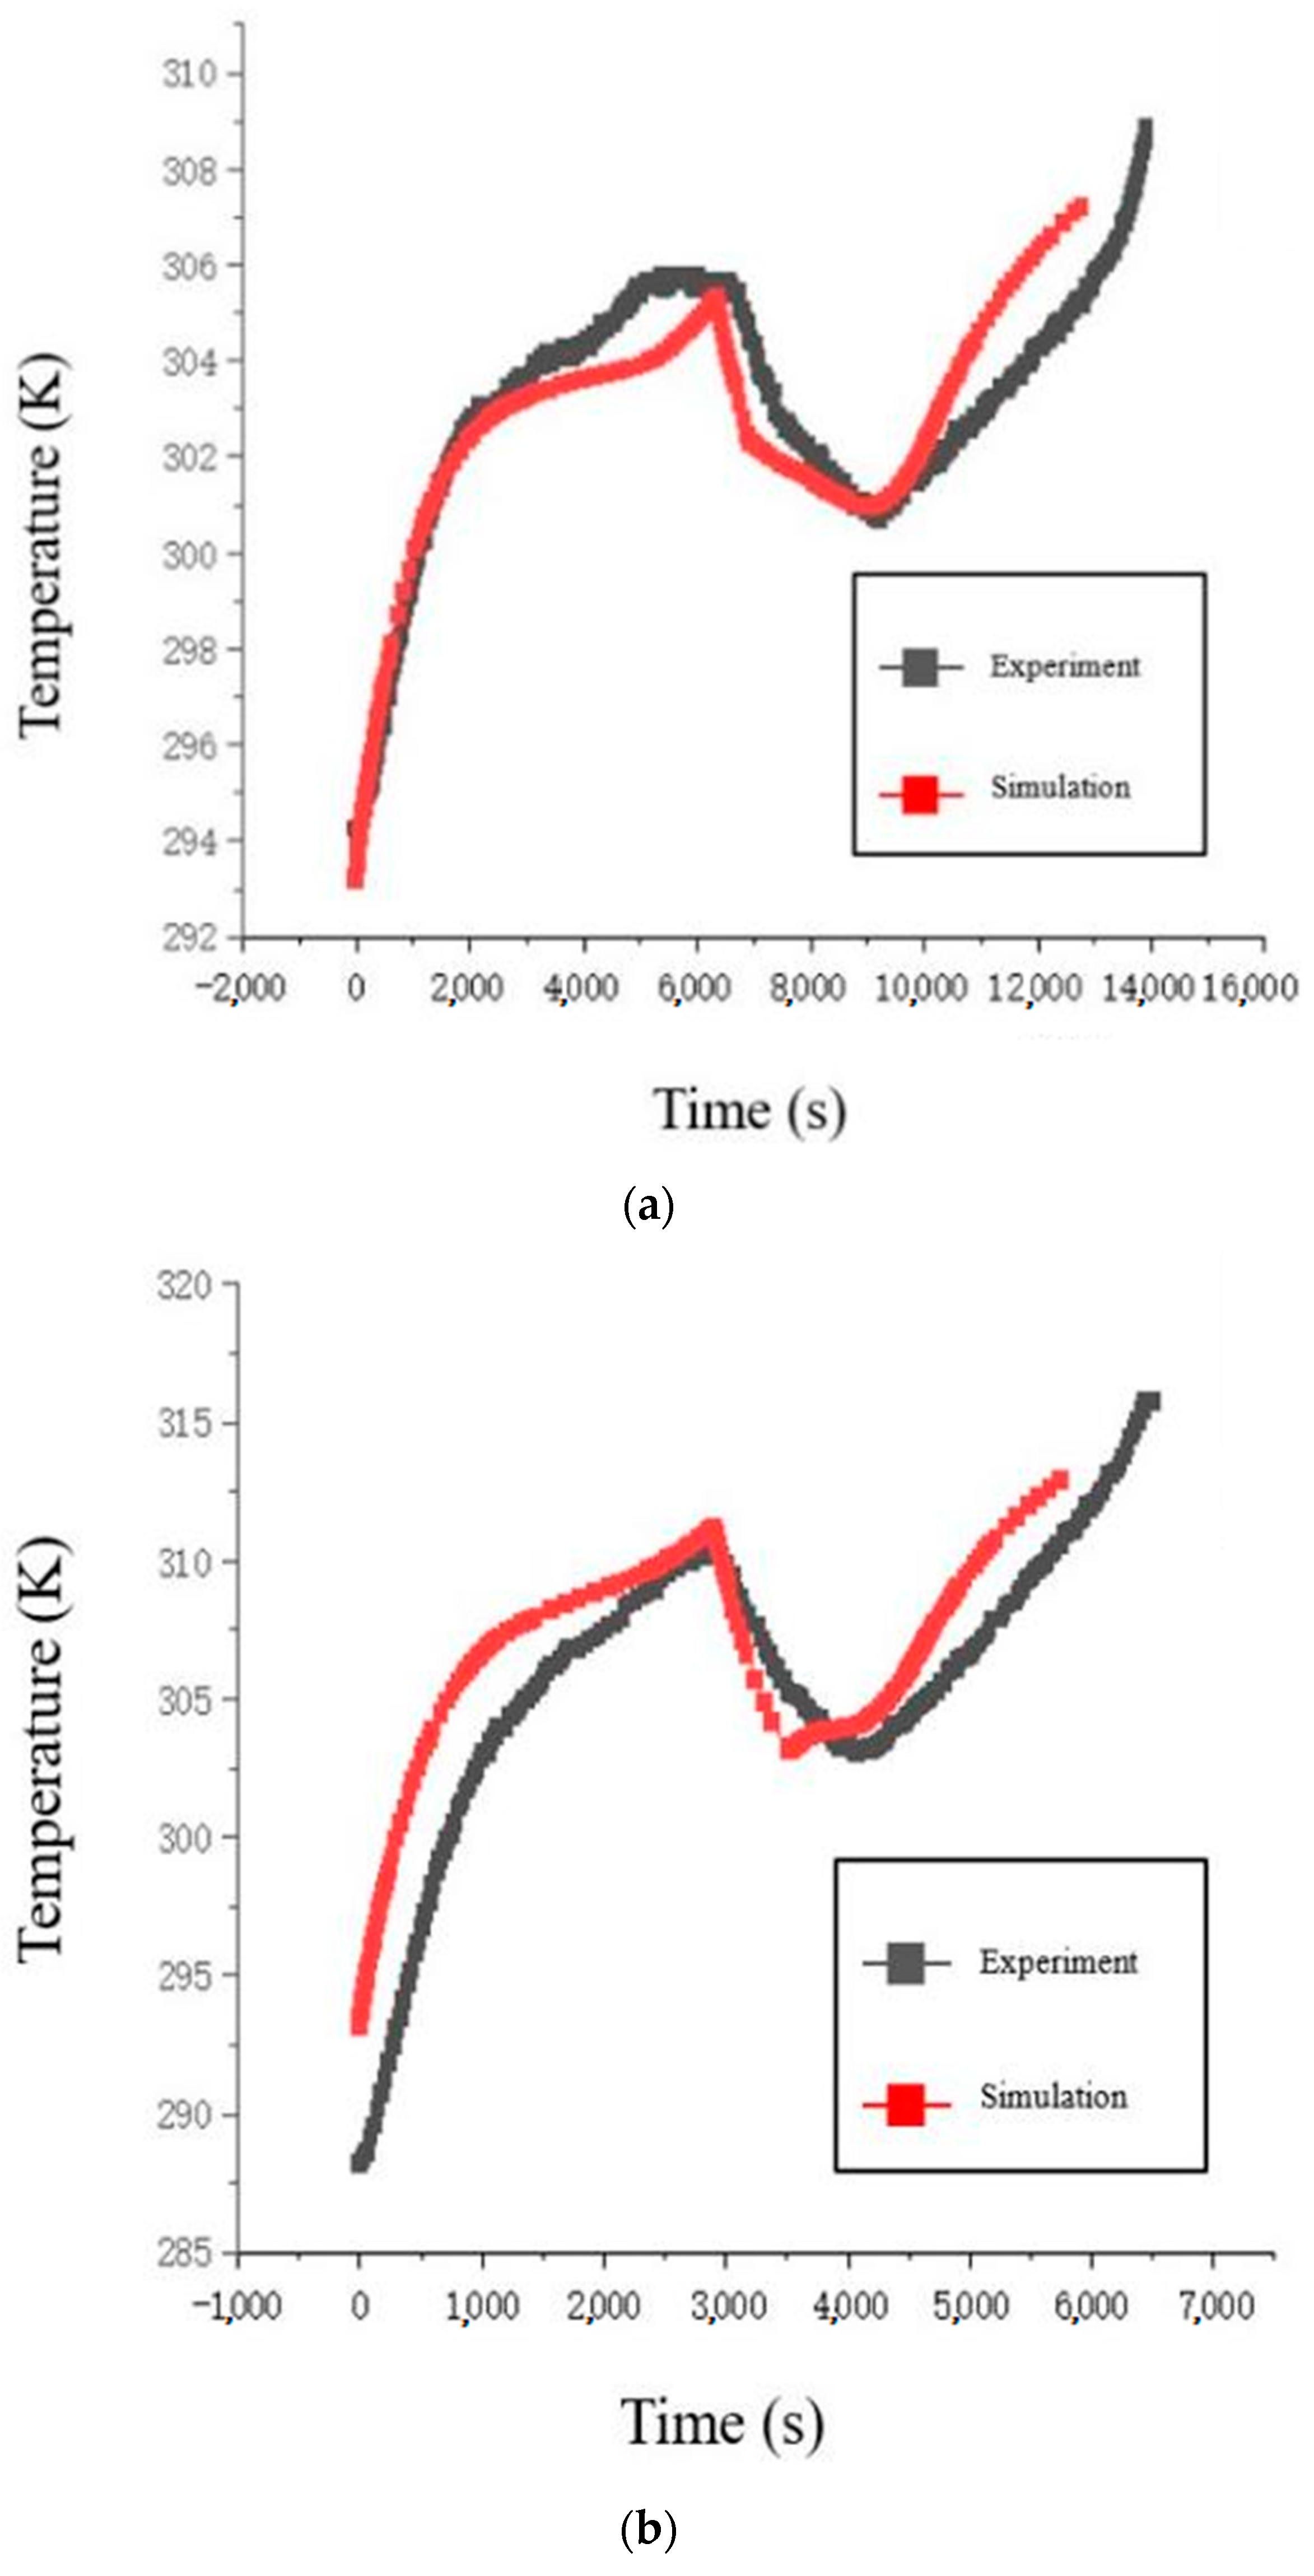
3.2. Thermal Model Validation and Analysis

The temperature data from the force-electric coupling model run by COMSOL software was exported and integrated with the charge-discharge cycle experimental data in Origin software. The following four sets of fitted curves were obtained, as shown in Figure 4.
During the simulation analysis at four different charge/discharge rates, the initial battery temperature was fixed at 293.15 K, and the ambient temperature was fixed at 298.15 K. The temperature and voltage curve fitting results during the charging phase for all four rates were relatively good (it is worth noting that the temperature error at the 1 C rate is due to the discrepancy between the experimental and model preset initial battery temperatures). In the later stage of the simulation model’s idle phase, at low charge/discharge rates, the battery had not yet reached complete heat dissipation, so the temperatures of the model and experiment overlapped. At high charge/discharge rates, the battery temperature in the simulation model stabilized at the preset ambient temperature, and the experimental battery temperature also stabilized at the laboratory ambient temperature, with temperature differences due to the ambient temperature being reasonable. During the discharge phase, at low discharge rates, the maximum temperature error at 0.5 C and 1 C was no more than 2 K, which was acceptable in terms of accuracy. At high discharge rates, at 1.5 C and 2 C, the difference in ambient temperature led to different initial battery temperatures, causing slight deviations in the temperature trend during the discharge phase, but the temperature differences remained within the acceptable accuracy range. It is important to note that part of the temperature error arises from the fact that the simulation model directly obtains temperature data from the battery surface, which is more precise. Whereas the experimental battery temperature is obtained using a thermocouple device attached to the battery surface with transparent tape (the transparent tape is used to ensure the thermocouple remains in constant contact with the battery surface). The difference in temperature measurement methods contributes to unavoidable errors.

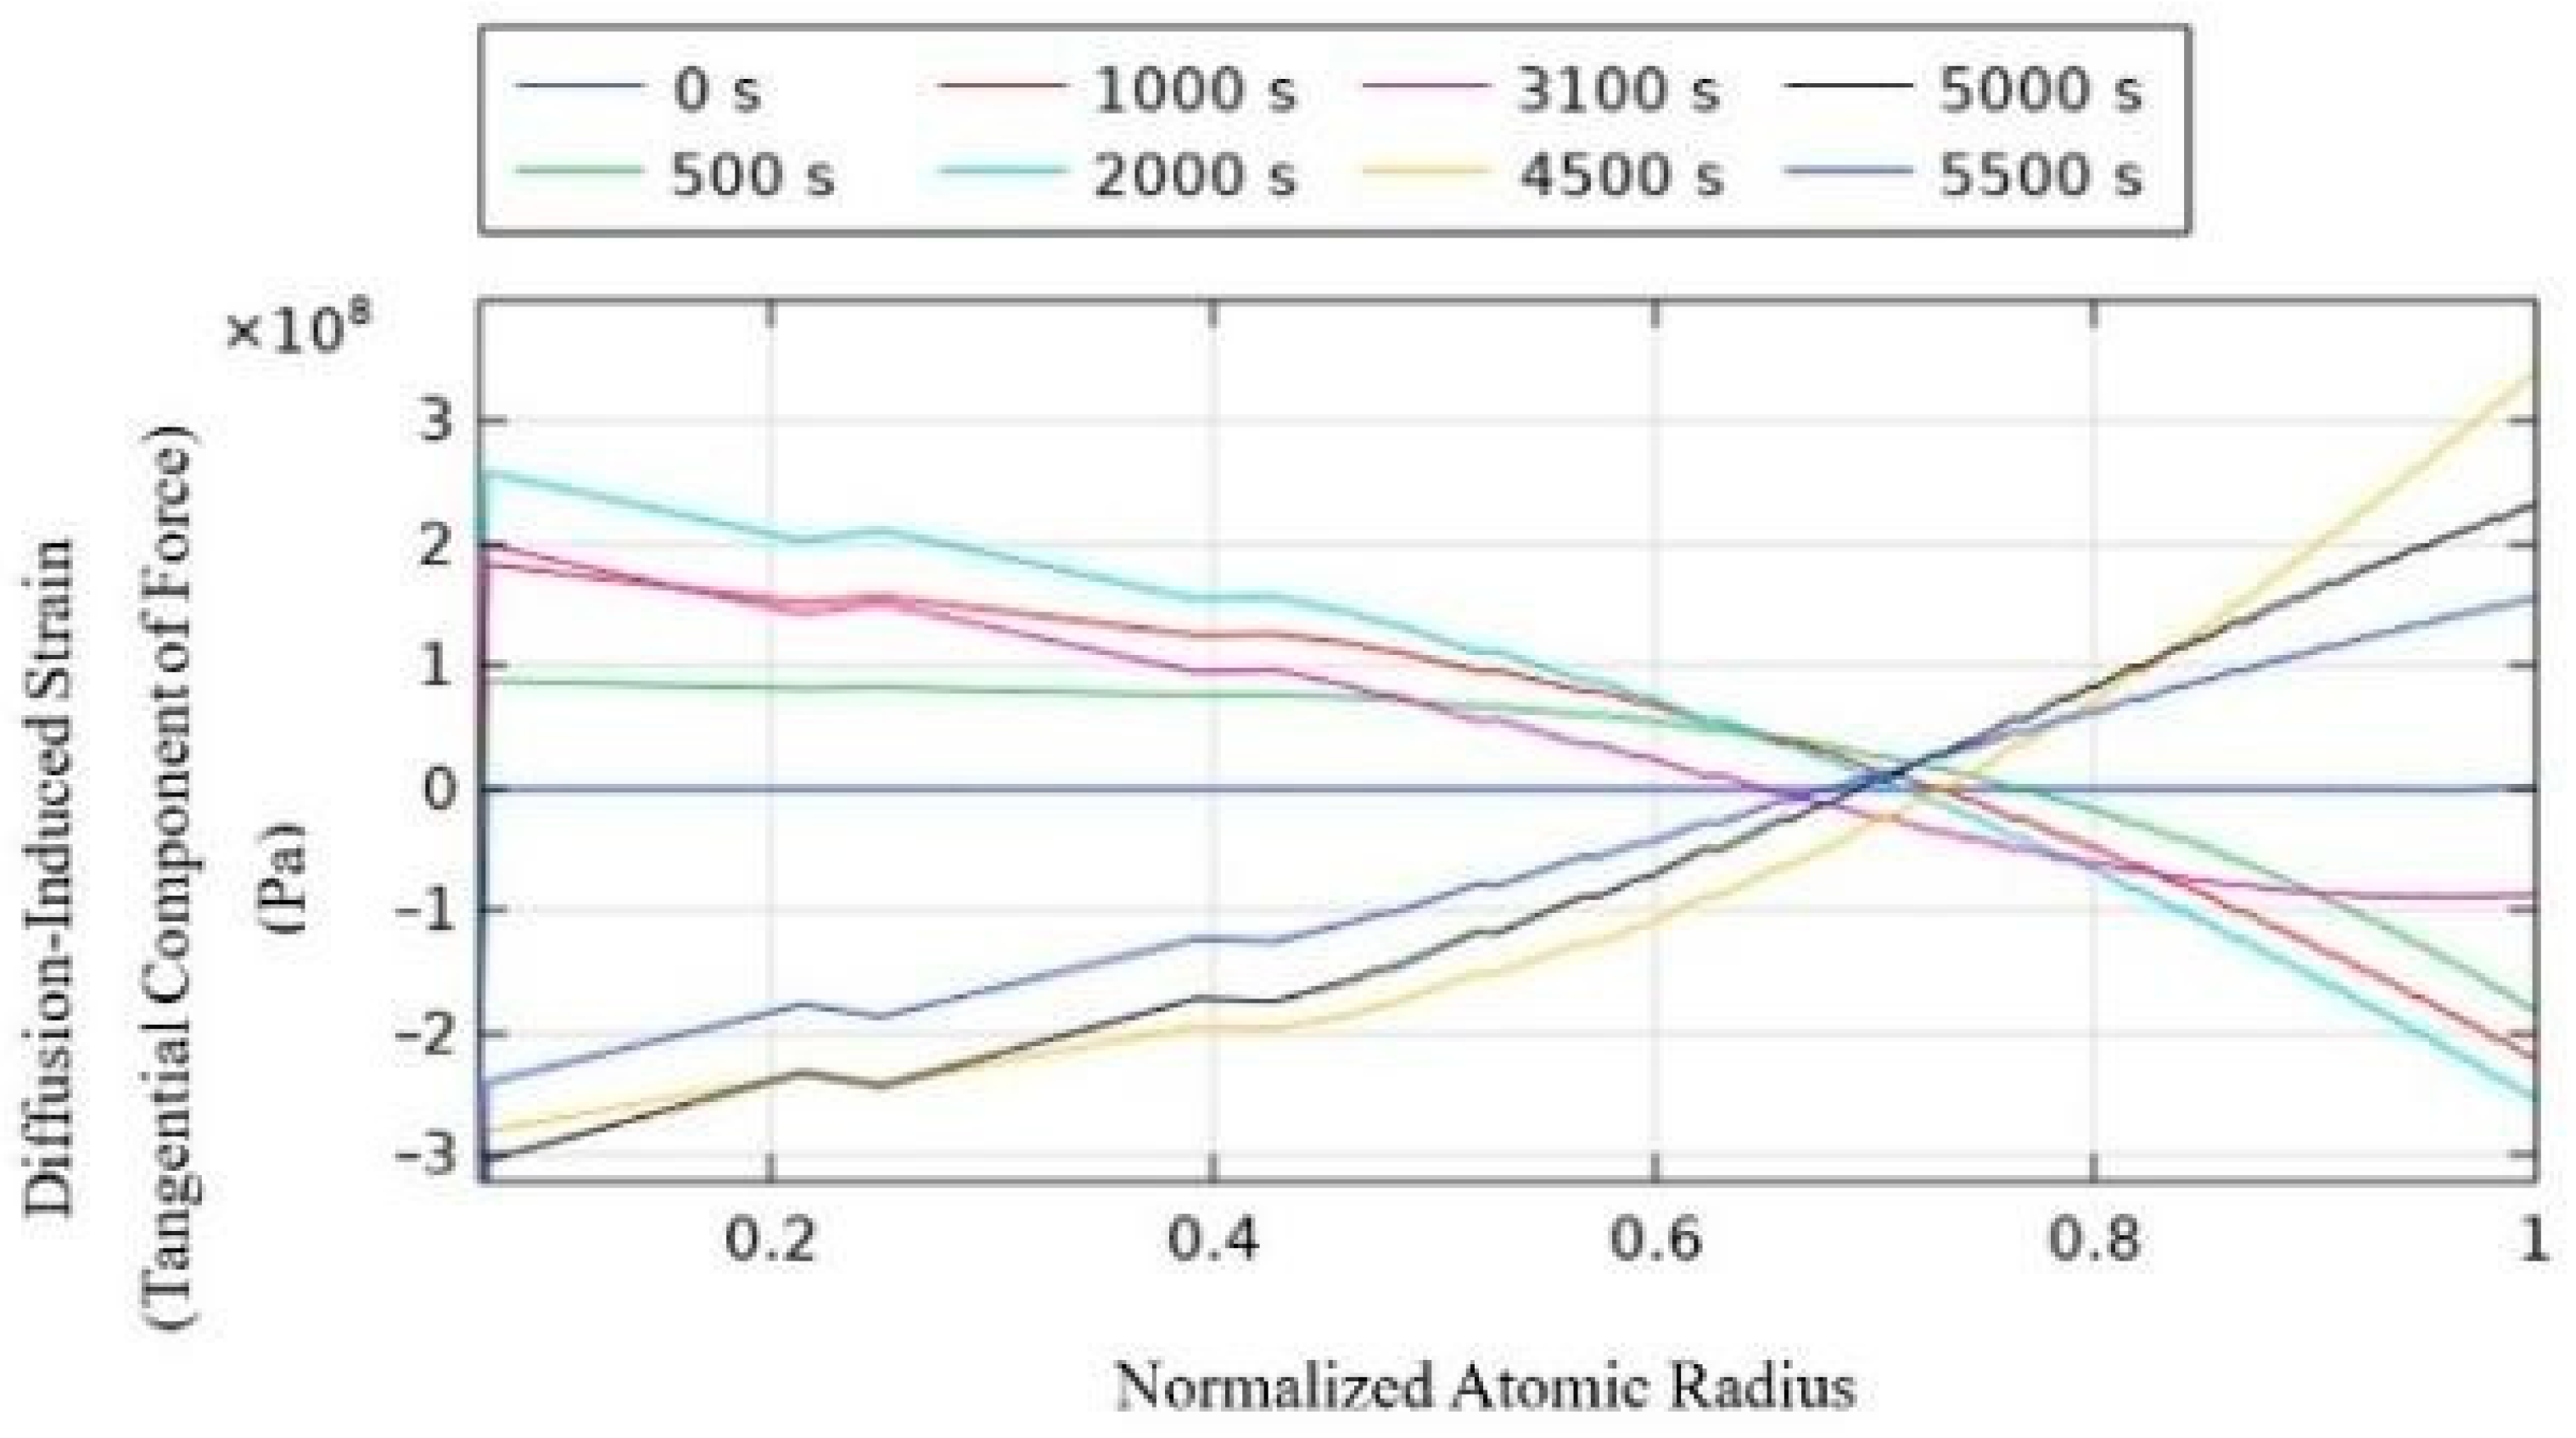
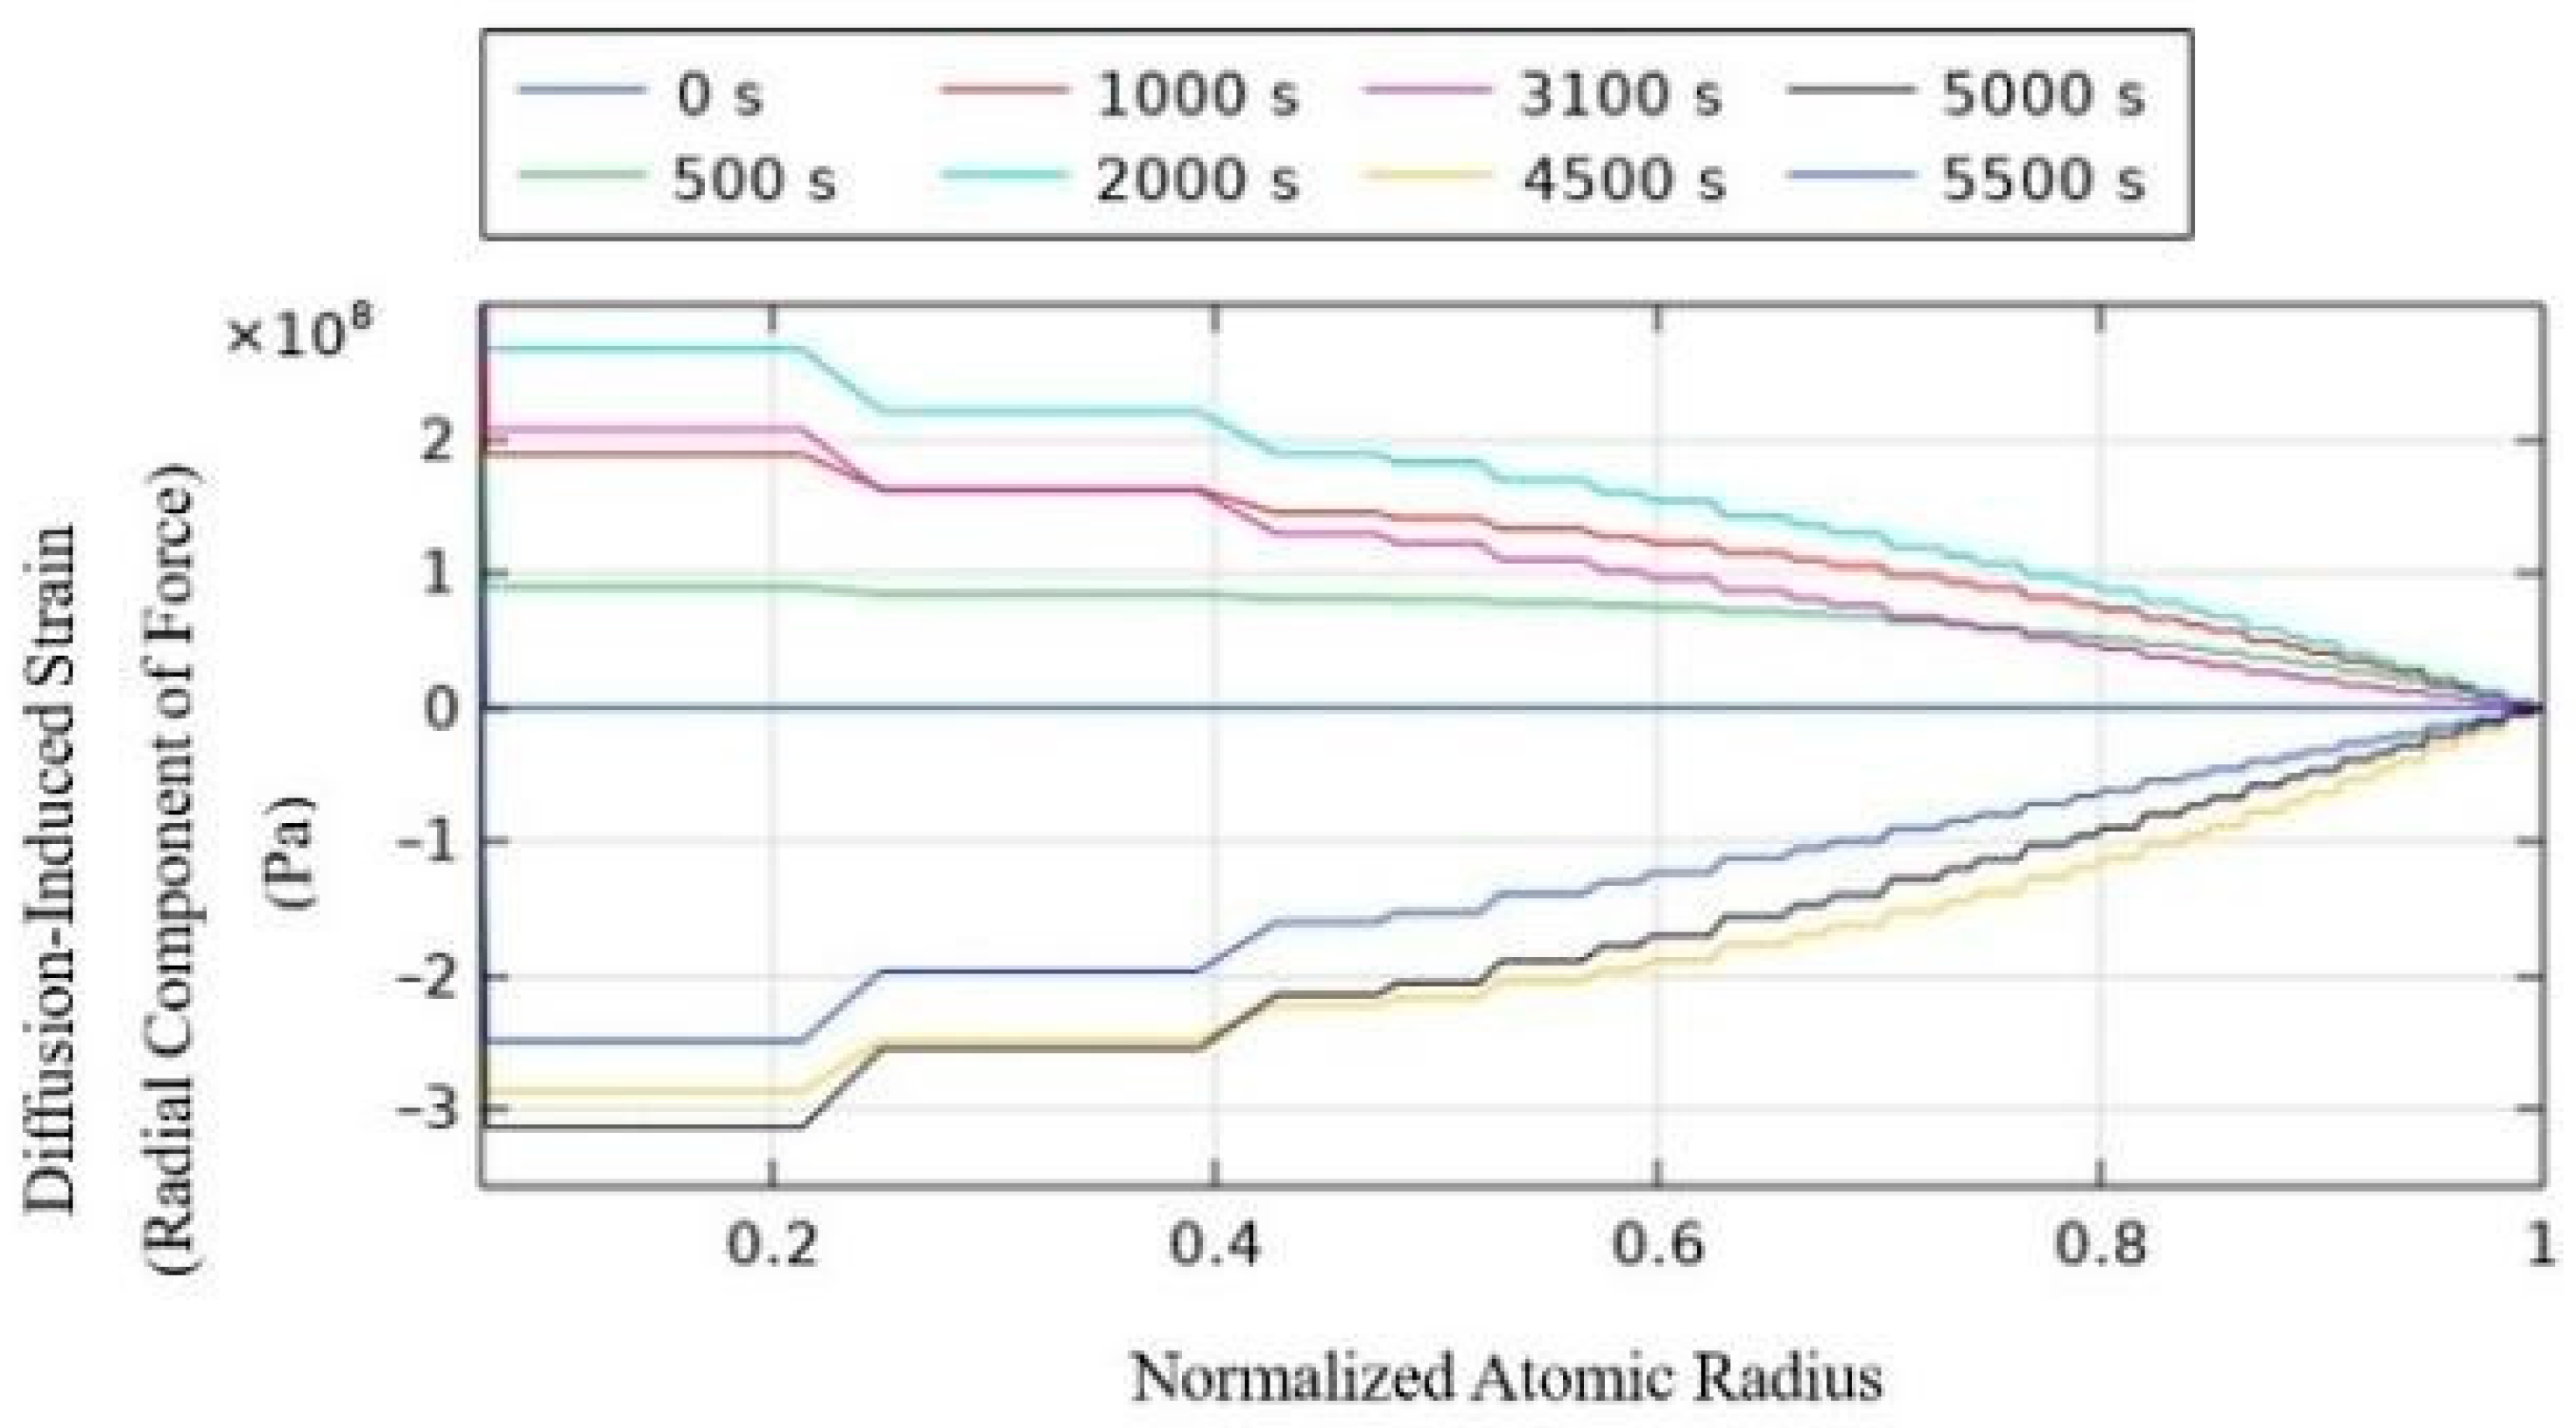
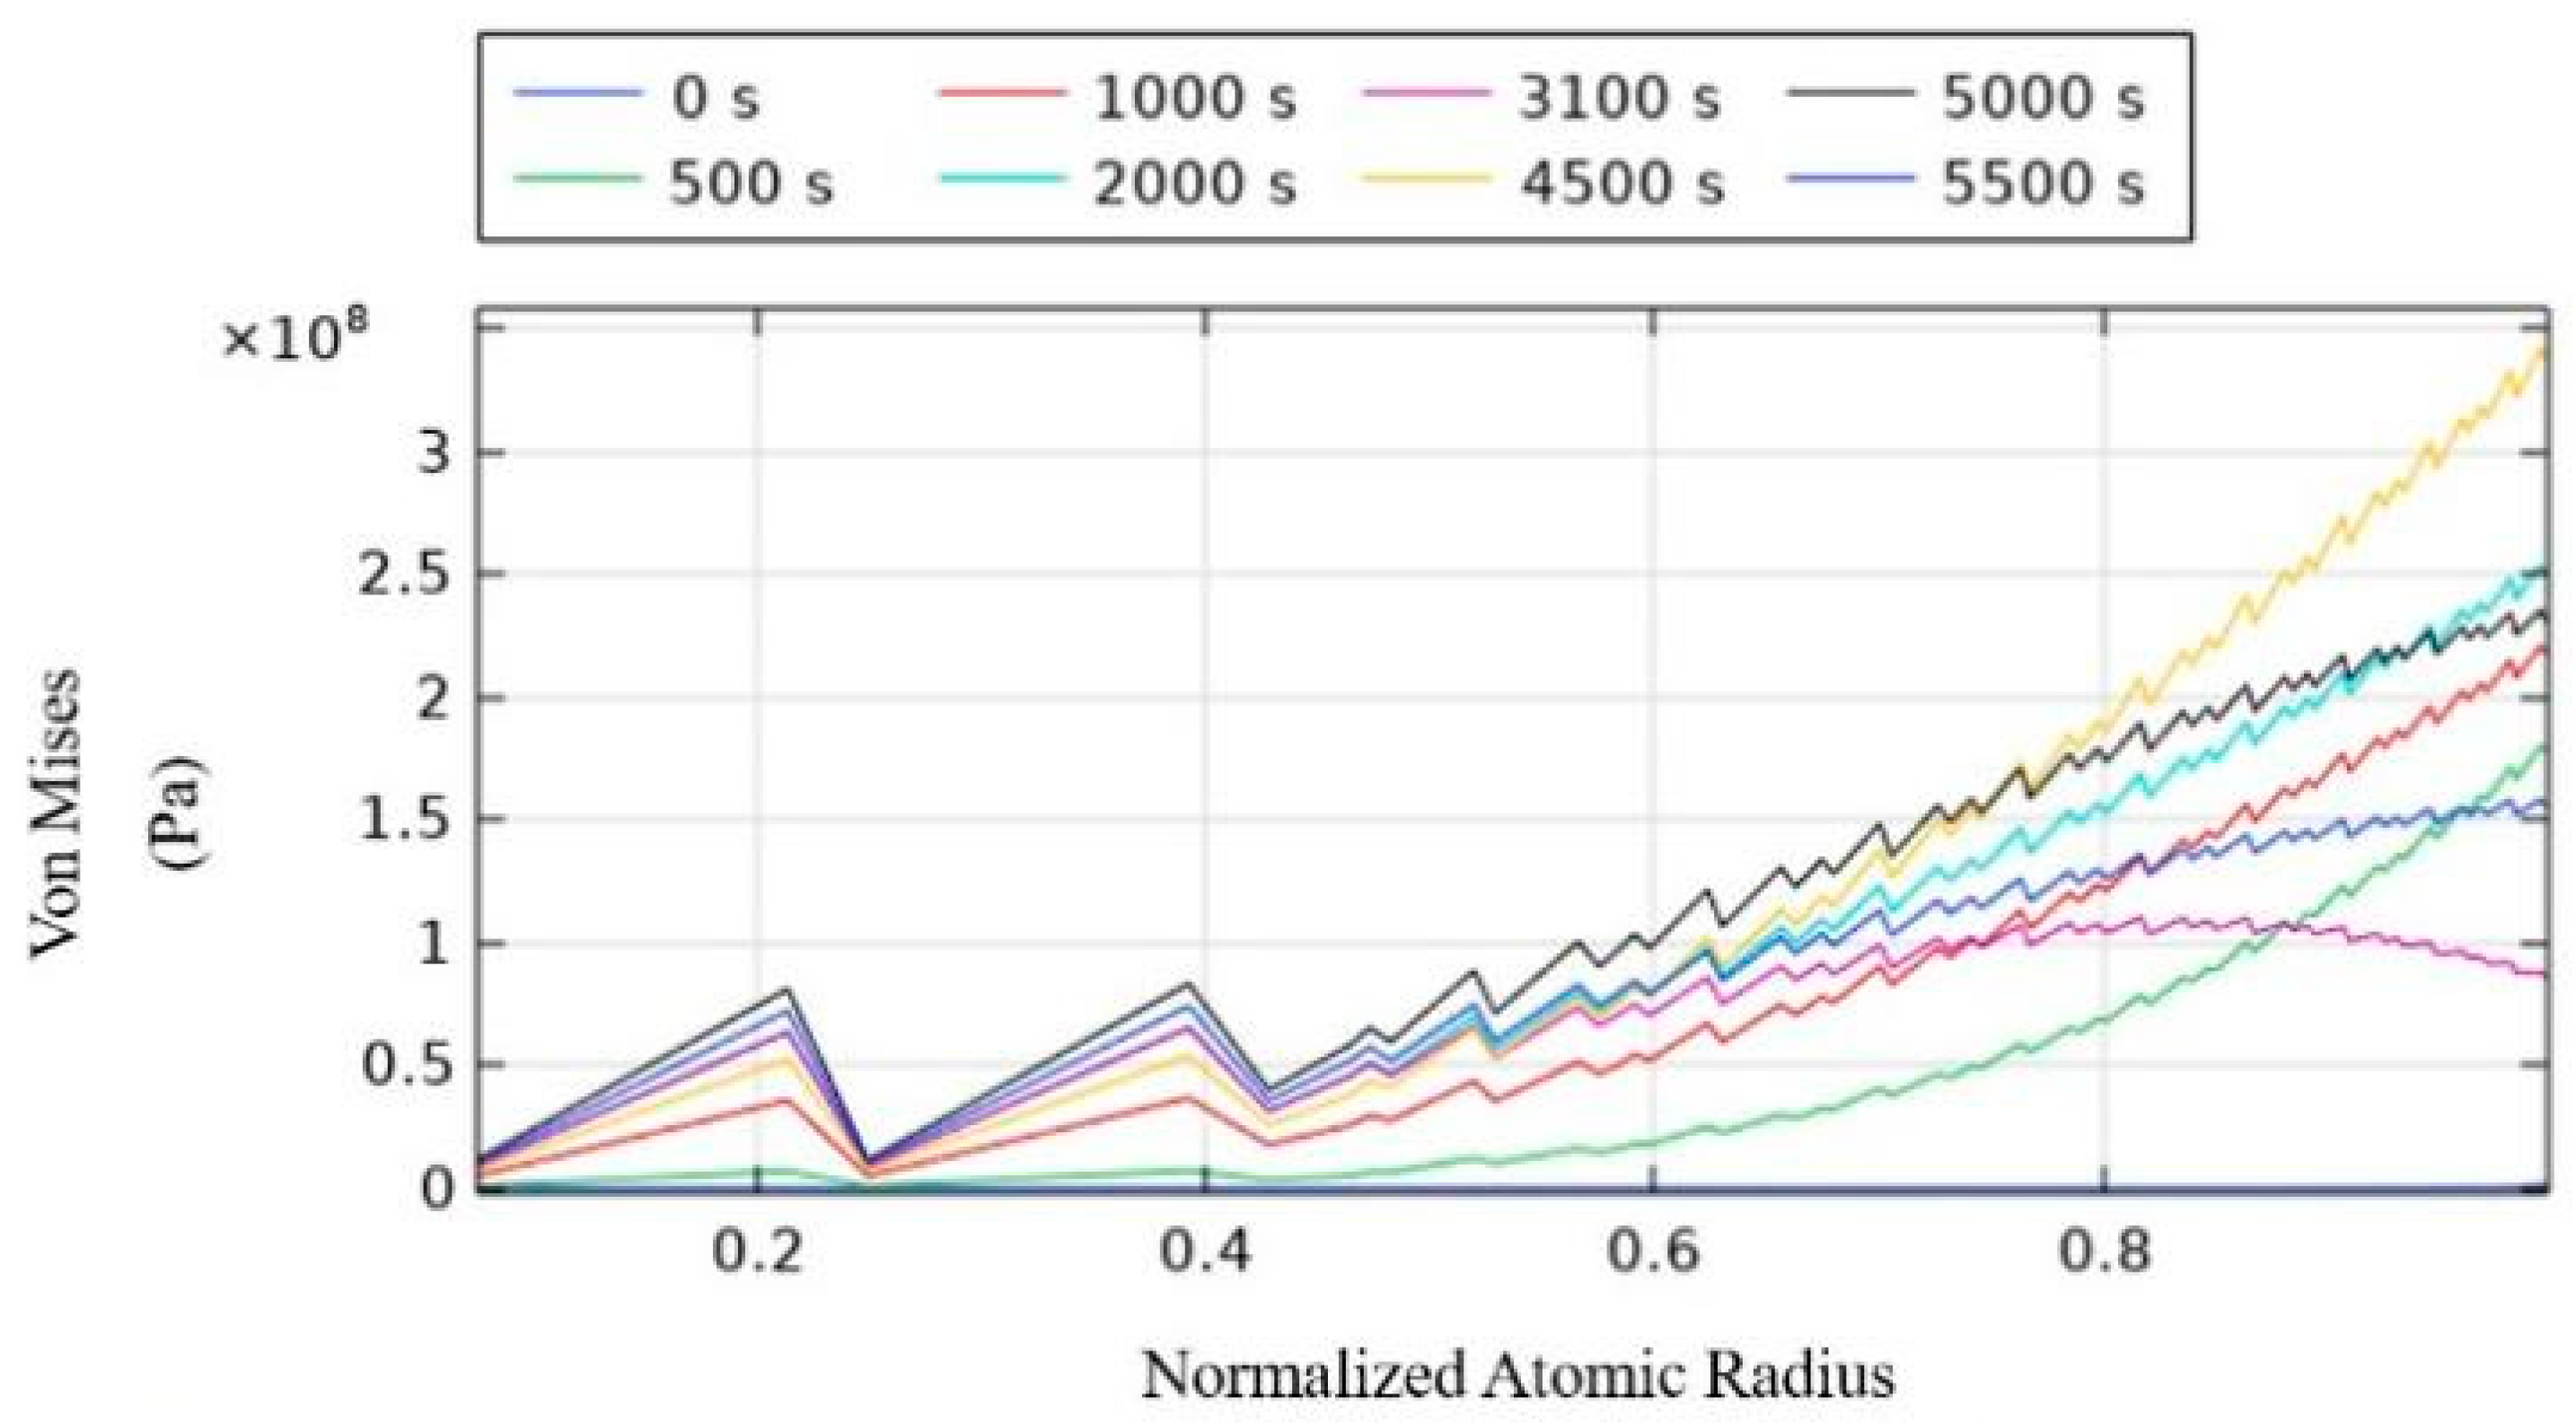
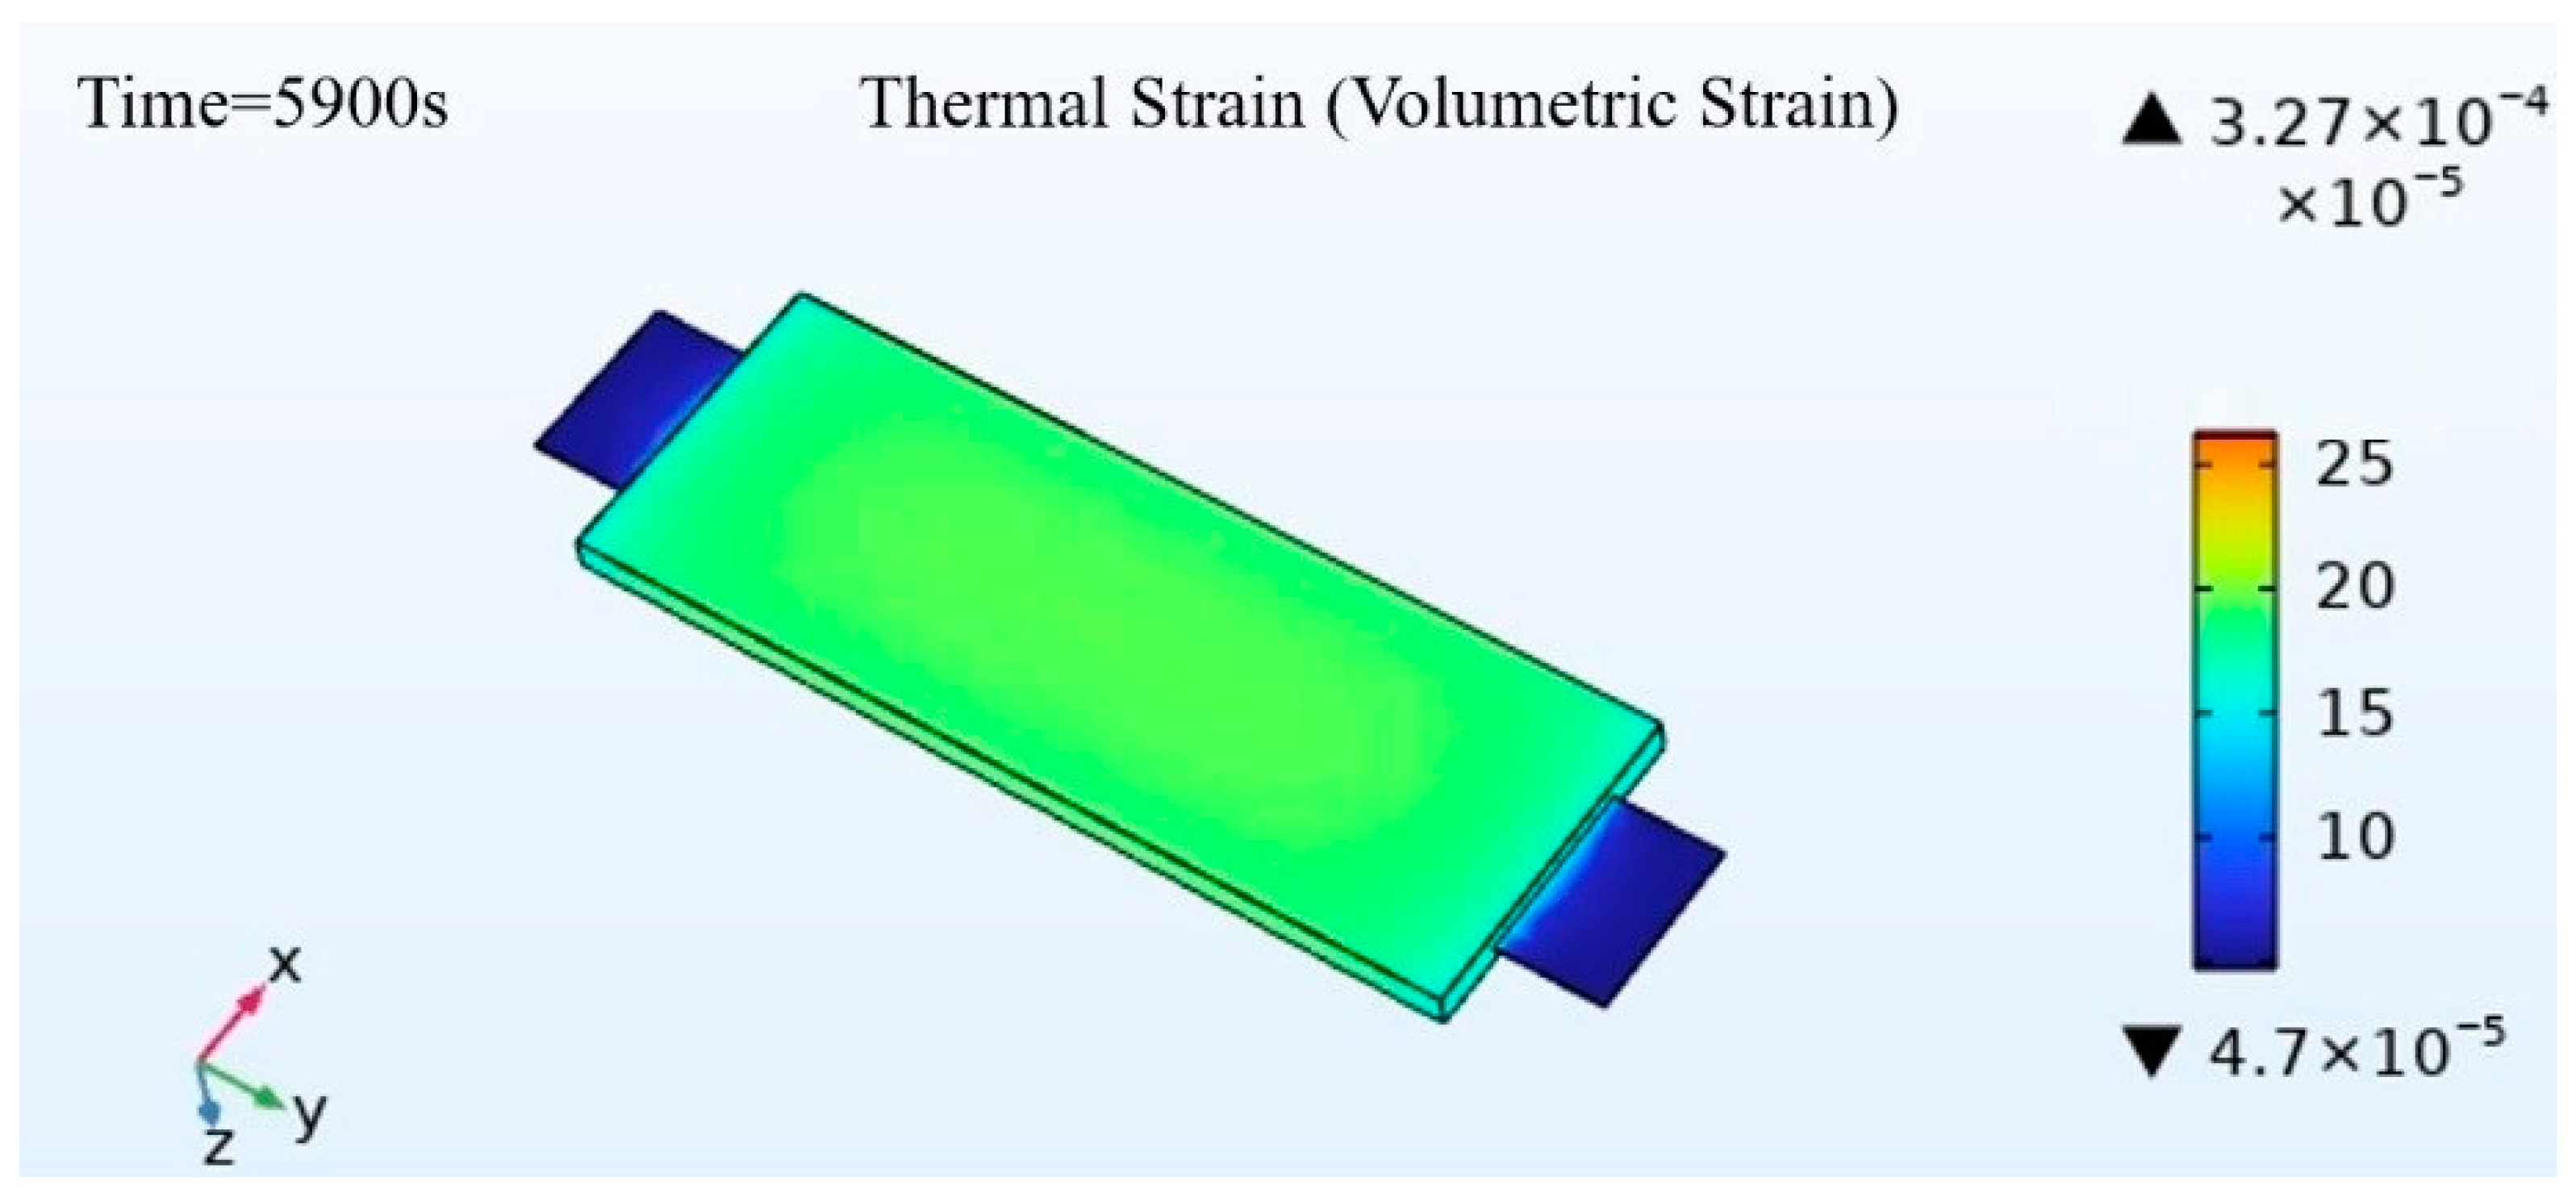
3.3. Force Model Analysis and Thermal Expansion Behavior

After adding the solid mechanics module, the overall computational load of the model will increase significantly. Therefore, considering the accuracy of both the electrochemical and thermal models, a 1 C charge/discharge rate is selected for the analysis of the force on the silicon-carbon anode particles and the overall thermal expansion of the battery, as shown in Figure 5 and Figure 6. The time steps are as follows: 0 s represents the start of charging, 500 s, 1000 s, and 2000 s are during the charging phase, 3100 s marks the rest phase, and 4500 s, 5000 s, and 5500 s are during the discharge phase.
For the anode particles during the charging process, lithium ions are embedded into the active anode particles. The tangential component of the diffusion-induced stress exerted on the particles shows tensile stress at the center of the particle and compressive stress at the surface. This is because the particle surface is in contact with the electrolyte or other particles, and the embedding of lithium ions from the surface of the particle causes tensile stress. The radial component of the diffusion-induced stress shows tensile stress, with the highest stress at the center of the particle, and the pressure gradually decreases along the radial direction of the particle, reaching zero at the surface.
During discharge, lithium ions de-intercalate from the anode active particles. The tangential component of the diffusion-induced stress on the particles shows compressive stress at the center and tensile stress at the surface. The radial component of the diffusion-induced stress shows compressive stress, with the highest pressure at the center, and similar to the charging process, the pressure gradually decreases radially, reaching zero at the surface.
As for the Von Mises stress experienced by the particles given in Figure 7, it increases gradually along the radial direction at the same moment, reaching a maximum of 0.35 GPa, which is still below the yield strength of silicon-carbon anodes. Therefore, the particles undergo elastic deformation without plastic deformation [13,14].
Figure 8 presents the thermal strain in the main body of the battery. For the overall thermal expansion of the battery, the maximum thermal strain occurs at the junction between the tab and the battery body, with the highest volumetric thermal expansion rate of up to 0.0327%. The compression between the tab and the battery body exacerbates the thermal strain. Excluding the tab-battery connection, the maximum thermal strain in the overall battery occurs at the center, with a volumetric thermal expansion rate of up to 0.0198%, decreasing outwardly, while the thermal expansion at the tab body is minimal, with a volumetric thermal expansion rate of only 0.0047%. Simulations and experiments observing no significant deformation of the battery during charge and discharge tests demonstrate that at a 1 C charge/discharge rate, the overall thermal expansion of the battery remains within a reasonable range.

4. Conclusions

This study presents a comprehensive numerical investigation of a semi-solid-state lithium-ion battery by developing an electromechanical-thermal model using COMSOL Multi-physics. Overall, the numerical results are reasonable and reliable despite the simplified sub-models used, and the model is verified to be capable of achieving both efficiency and accuracy. The key findings and conclusions are summarized as follows:
  • The electromechanical-thermal model developed was based on a P2D model, which was integrated with the solid heat transfer module and the solid mechanics module. The model was validated through constant current charge/discharge cycling experiments, and the simulation results demonstrated good agreement with the experimental data at low charge/discharge rates. Therefore, the model was found to enable a comprehensive evaluation of the battery’s electrochemical, thermal, and mechanical performance.
  • The electromechanical-thermal model developed in this study serves as an effective tool for simulating semi-solid-state lithium-ion batteries. The model accurately predicts the battery’s performance under various operating conditions, providing valuable guidance for battery design optimization and performance improvement. Future research could further explore the coupling effects of multiple physical fields within the battery and the impact of different material systems on battery performance to achieve more accurate model development and more comprehensive performance evaluation.

Author Contributions

Methodology, W.W.W.; Software, S.T.Z.; Formal analysis, X.T.X.; Resources, X.Y.L.; Data curation, H.S.Z. All authors have read and agreed to the published version of the manuscript.

Funding

This research was funded by Technical Innovation project of the Hainan Scientific Research Institutes (KYYSGY2024-006; KYYSGY2023-004).

Data Availability Statement

The original contributions presented in the study are included in the article, further inquiries can be directed to the corresponding author.

Conflicts of Interest

The authors declare no conflict of interest.

References

  1. Feng, Z.; Qiu, X.; Zhang, T.; Dai, Z.; Guo, X. Progress in the study of thermal safety of all-solid-state lithium batteries. Fine Chem. 2024, 5, 960–970. [Google Scholar]
  2. Yang, X.; Liu, S.; Zhou, W.; Huang, Q.; Zu, W.; Qu, S.; Li, J. Research on modeling techniques for lithium-ion batteries. Distrib. Energy 2021, 6, 77–82. [Google Scholar]
  3. Zhang, X.; Wang, Y. Modeling and simulation of the thermal characteristics of lithium-ion batteries. In Proceedings of the 23rd Chinese Symposium on System Simulation Technology and Its Applications (CCSSTA 23rd), Hefei, China, October 2022. [Google Scholar]
  4. Feng, Y.; Zheng, L.; Dai, Z.; Zhang, Z.; Du, G.; Wang, D. Progress in simulation models of lithium-ion batteries. Energy Storage Sci. Technol. 2019, 8 (Suppl. S1), 18–22. [Google Scholar]
  5. Sun, Z.; He, Y.; Chen, S.; Nie, L.; Huang, Y.; Liu, W. Electrochemical process simulation of all-solid-state lithium metal batteries under multi-physics coupling. J. Chin. Chem. Soc. 2021, 42, 1598–1609. [Google Scholar]
  6. Dai, W. Analysis of Diffusion Polarization and Diffusion Stress in lithium-Ion Batteries Based on Electrochemical-Mechanical Coupling Model. Master’s Thesis, Jiangsu University, Zhenjiang, China, 2020. [Google Scholar]
  7. Zhang, K. Thermal Characteristics Simulation of Lithium-Ion Batteries Based on Multilayer Structure and Multi-Physics Coupling. Master’s Thesis, Hunan University, Changsha, China, 2021. [Google Scholar]
  8. Mei, W.; Wang, Q.; Sun, J. Stress simulation of graphite particles during the charging process of lithium-ion batteries based on electrochemical-mechanical coupling model. Eng. Mech. 2020, 37 (Suppl. S1), 352–357. [Google Scholar]
  9. Doyle, M.; Fuller, T.F.; Newman, J. Modeling of galvanostatic charge and discharge of the lithium/polymer/insertion Cell. J. Electrochem. Soc. 1993, 140, 1526–1533. [Google Scholar] [CrossRef]
  10. Hong, Q. Simulation Study of Stress and Dendrite Growth Based on Solid Electrolyte Battery Model. Master’s Thesis, Huazhong University of Science and Technology, Wuhan, China, 2022. [Google Scholar]
  11. Reniers, J.M.; Mulder, G.; Howey, D.A. Review and Performance Comparison of Mechanical-Chemical Degradation Models for Lithium-Ion Batteries. J. Electrochem. Soc. 2019, 166, A3189–A3200. [Google Scholar] [CrossRef]
  12. Chen, Z.; Danilov, D.L.; Zhang, Q.; Jiang, M.; Zhou, J.; Eichel, R.A.; Notten, P. Modeling NCA/C6-Si battery ageing. Electrochim. Acta 2022, 430, 141077. [Google Scholar] [CrossRef]
  13. Chen, Y. Multiscale Force-Electrochemical Simulation Study of Silicon-Based Anode Lithium-Ion Batteries. Ph.D. Thesis, University of Chinese Academy of Sciences (Institute of Physics, Chinese Academy of Sciences), Beijing, China, 2022. [Google Scholar]
  14. Sethuraman, V.A.; Chon, M.J.; Shimshak, M.; Srinivasan, V.; Guduru, P.R. In situ measurements of stress evolution in silicon thin films during electrochemical lithiation and delithiation. J. Power Sources 2010, 195, 5062–5066. [Google Scholar] [CrossRef]
Figure 1. Schematic diagram of the tab in 3D view.
Energies 18 00844 g001
Figure 2. Experimental data for charge/discharge testing of the battery: (a) voltage vs. time; (b) temperature vs. time.
Energies 18 00844 g002
Figure 3. Comparison of charge/discharge voltage curves of the battery: (a) 0.5 C; (b) 1 C; (c) 1.5 C; (d) 2 C.
Energies 18 00844 g003aEnergies 18 00844 g003b
Figure 4. Comparison of charge/discharge temperature curves of the battery: (a) 0.5 C; (b) 1 C; (c) 1.5 C; (d) 2 C.
Energies 18 00844 g004aEnergies 18 00844 g004b
Figure 5. Tangential component of force of diffusion-induced strain.
Energies 18 00844 g005
Figure 6. Radial component of force of diffusion-induced strain.
Energies 18 00844 g006
Figure 7. Von Mises stresses.
Energies 18 00844 g007
Figure 8. Schematic diagram of thermal strain of the battery.
Energies 18 00844 g008
Table 1. Battery’s size and electrochemical parameters [10,11,12].
ParametersUnitNegative ElectrodeSeparatorPositive Electrode
Electrode thickness Lum521564.5
Active particle radius Rum10 (C)
6.5 (Si)
3.9
Active material volume fraction εs 0.5896 (C)
0.1383 (Si)
0.7635
Electrolyte volume fraction εɭ 0.27210.50.2365
Solid phase conductivity σsS/m1000 50
Electrolyte conductivity σɭS/m 7
Battery minimum state of charge SOCmin 0.0269 0.1709
Battery maximum state of charge SOCmax 0.98 0.88
Maximum lithium insertion concentration cs,maxmol/m330,778 (C)
165,177 (Si)
58,945
Initial lithium concentration c0mol/m32401 (C)
14,866 (Si)
50,987
Initial electrolyte salt concentration cɭ0mol/m3170017001700
Electrode electrolyte reference concentration cɭ,refmol/m31000 1000
Solid phase diffusion coefficient Dsm2/sEquation (1) (C)
3 × 10⁻¹⁴ (Si)
Equation (2)
Liquid phase diffusion coefficient Dɭm2/s 5.34 × 10⁻¹⁰
Exchange current reaction constant Km/s2 × 10−10 2 × 10⁻¹⁰
Gas constant RgJ/mol/K 8.314
Faraday constant FC/mol 96,486
Lithium-ion transfer coefficient t+ 0.363
Anode charge transfer coefficient αɑ 0.5 0.5
Cathode charge transfer coefficient αc 0.5 0.5
Reference temperature TrefK 293.15
Table 2. Current collector’s parameters.
ParametersUnitCathode Current CollectorCathode Current Collector
Current collector thickness Lum612
Conductivity σS/m5.998 × 1073.774 × 107
Table 3. Basic thermal parameters of the battery.
ParameterUnitValue
Average heat capacity at constant pressure CpJ/kg/K1600
Average density ρkg/m32600
Thermal conductivity along the X-axis KxW/m/K7.82
Thermal conductivity along the Y-axis KyW/m/K1.64
Thermal conductivity along the Z-axis KzW/m/K7.82
ParameterUnitValue
Convective heat transfer coefficient hW/m2/K23.5
Ambient temperature TeirK298.15
Table 4. Negative electrode active particles related parameters [8].
ParametersUnitSiC
Poisson’s ratio 0.280.3
Young’s modulus EGpa9015
Partial molar volume Ωm3/mol9 × 10−64.9 × 10⁻⁶
Table 5. Thermal expansion-related parameters [8].
ParametersUnitBattery Overall
Poisson’s ratio 0.27
Young’s modulus EGpa150
Coefficient of thermal expansion1/K3.2 × 10−6
Table 6. Basic electro-mechanical parameters of the battery.
Parameters (Unit)Value
Charging Cut-off Voltage (V)4.2
Discharging Cut-off Voltage (V)2.75
Nominal Battery Capacity (Ah)70 Ah (20 °C)
Battery Geometric Dimensions (mm) (excluding tabs)267.5 × 94.5 × 9.7
Tab Geometric Dimensions (mm)43 × 52 × 0.12
Disclaimer/Publisher’s Note: The statements, opinions and data contained in all publications are solely those of the individual author(s) and contributor(s) and not of MDPI and/or the editor(s). MDPI and/or the editor(s) disclaim responsibility for any injury to people or property resulting from any ideas, methods, instructions or products referred to in the content.

