1. Introduction
As the core component of photovoltaic power generation systems, photovoltaic arrays are frequently exposed to complex and variable outdoor conditions, making them susceptible to a multitude of faults. These faults not only diminish the efficiency of electricity generation but also pose significant risks to the safe operation of the entire system. Therefore, the development of effective diagnostic tools and methodologies for accurately identifying the types of faults that occur in photovoltaic arrays is of paramount importance. This research holds substantial practical significance as it enables swift and precise maintenance interventions, thereby enhancing the reliability and longevity of photovoltaic installations. Ultimately, this contributes to the overall sustainability and economic viability of renewable energy sources in the global transition towards clean energy [
1,
2,
3].
At present, there are four methods for diagnosing faults in photovoltaic arrays: physical detection [
4], mathematical modeling [
5], image detection [
6], and machine learning [
7]. Physical detection mainly involves detecting voltage, current, and other information through external devices. This method not only increases the complexity of the system but also increases the overall installation cost. The mathematical model mainly establishes a simulation model of the photovoltaic array and compares the actual operating situation with the predicted data of the model. This type of method is difficult to improve accuracy due to the complex operating environment of the photovoltaic array. Image detection mainly identifies and locates faults by analyzing image data of photovoltaic arrays. The accuracy of such methods largely depends on the precision of image sensors, which are easily affected by external environments and increase overall costs. With the rapid development of artificial intelligence technology, machine learning has also been widely applied in fault diagnosis of photovoltaic arrays [
8,
9]. This type of method uses machine learning classification methods to diagnose faults in photovoltaic arrays based on the relevant data information generated during their operation. Reference [
10] combines the improved sparrow search algorithm with extreme learning machine (ELM), which can effectively improve the fault diagnosis accuracy of ELM. Reference [
11] effectively solved the problem of initial parameter setting for fault diagnosis models by improving the Northern Eagle algorithm. Reference [
12] proposed the CatBoost fault diagnosis model for small sample photovoltaic array faults, effectively solving the problem of diagnosing small sample faults. Reference [
13] integrates the cascaded random forest algorithm with historical data to identify relevant faults in photovoltaic modules online. However, all the studies mentioned above input all the extracted features into the model, without considering the interference of features that have a small or negative impact on model diagnosis on the overall model, resulting in high complexity and running time of the model. Moreover, the above algorithms have many input parameters, which can easily lead to local optima and slow convergence speed.
In view of this, this article proposes a photovoltaic array fault diagnosis model based on the improved honey badger algorithm [
14,
15] (IHBA). Firstly, the current and power output characteristic curves of photovoltaic arrays under different states are analyzed, and the basic statistical characteristics, discrete statistical characteristics, and distribution statistical characteristics of the two output characteristic curves are extracted separately [
16,
17,
18]. Secondly, the feature vector set is ranked for importance using random forest (RF), and then input it into the support vector machine (SVM), long short-term memory (LSTM), and bidirectional long short-term memory (BiLSTM) neural networks [
19,
20] to obtain the optimal combination of base model and feature count. Then, the IHBA optimization algorithm is used to optimize the relevant hyperparameters in the optimal base model, solving the problem of setting hyperparameters in the optimal base model. Finally, through relevant comparative experiments, the effectiveness of the proposed model in photovoltaic array fault diagnosis was verified. Compared with the combined model WOA-BiLSTM and DBO-BiLSTM, the accuracy of IHBA-BiLSTM is increased by 2.76% and 2.45%, respectively, indicating that the selection of appropriate model parameters is helpful to further improve the performance of the model. Compared with HBA-BiLSTM, the accuracy rate is increased by 2.44%, which verifies the effectiveness of the optimization strategy and can effectively improve the diagnostic accuracy of the fault diagnosis model.
2. Feature Extraction of Photovoltaic Array Faults
2.1. Fault Simulation Model
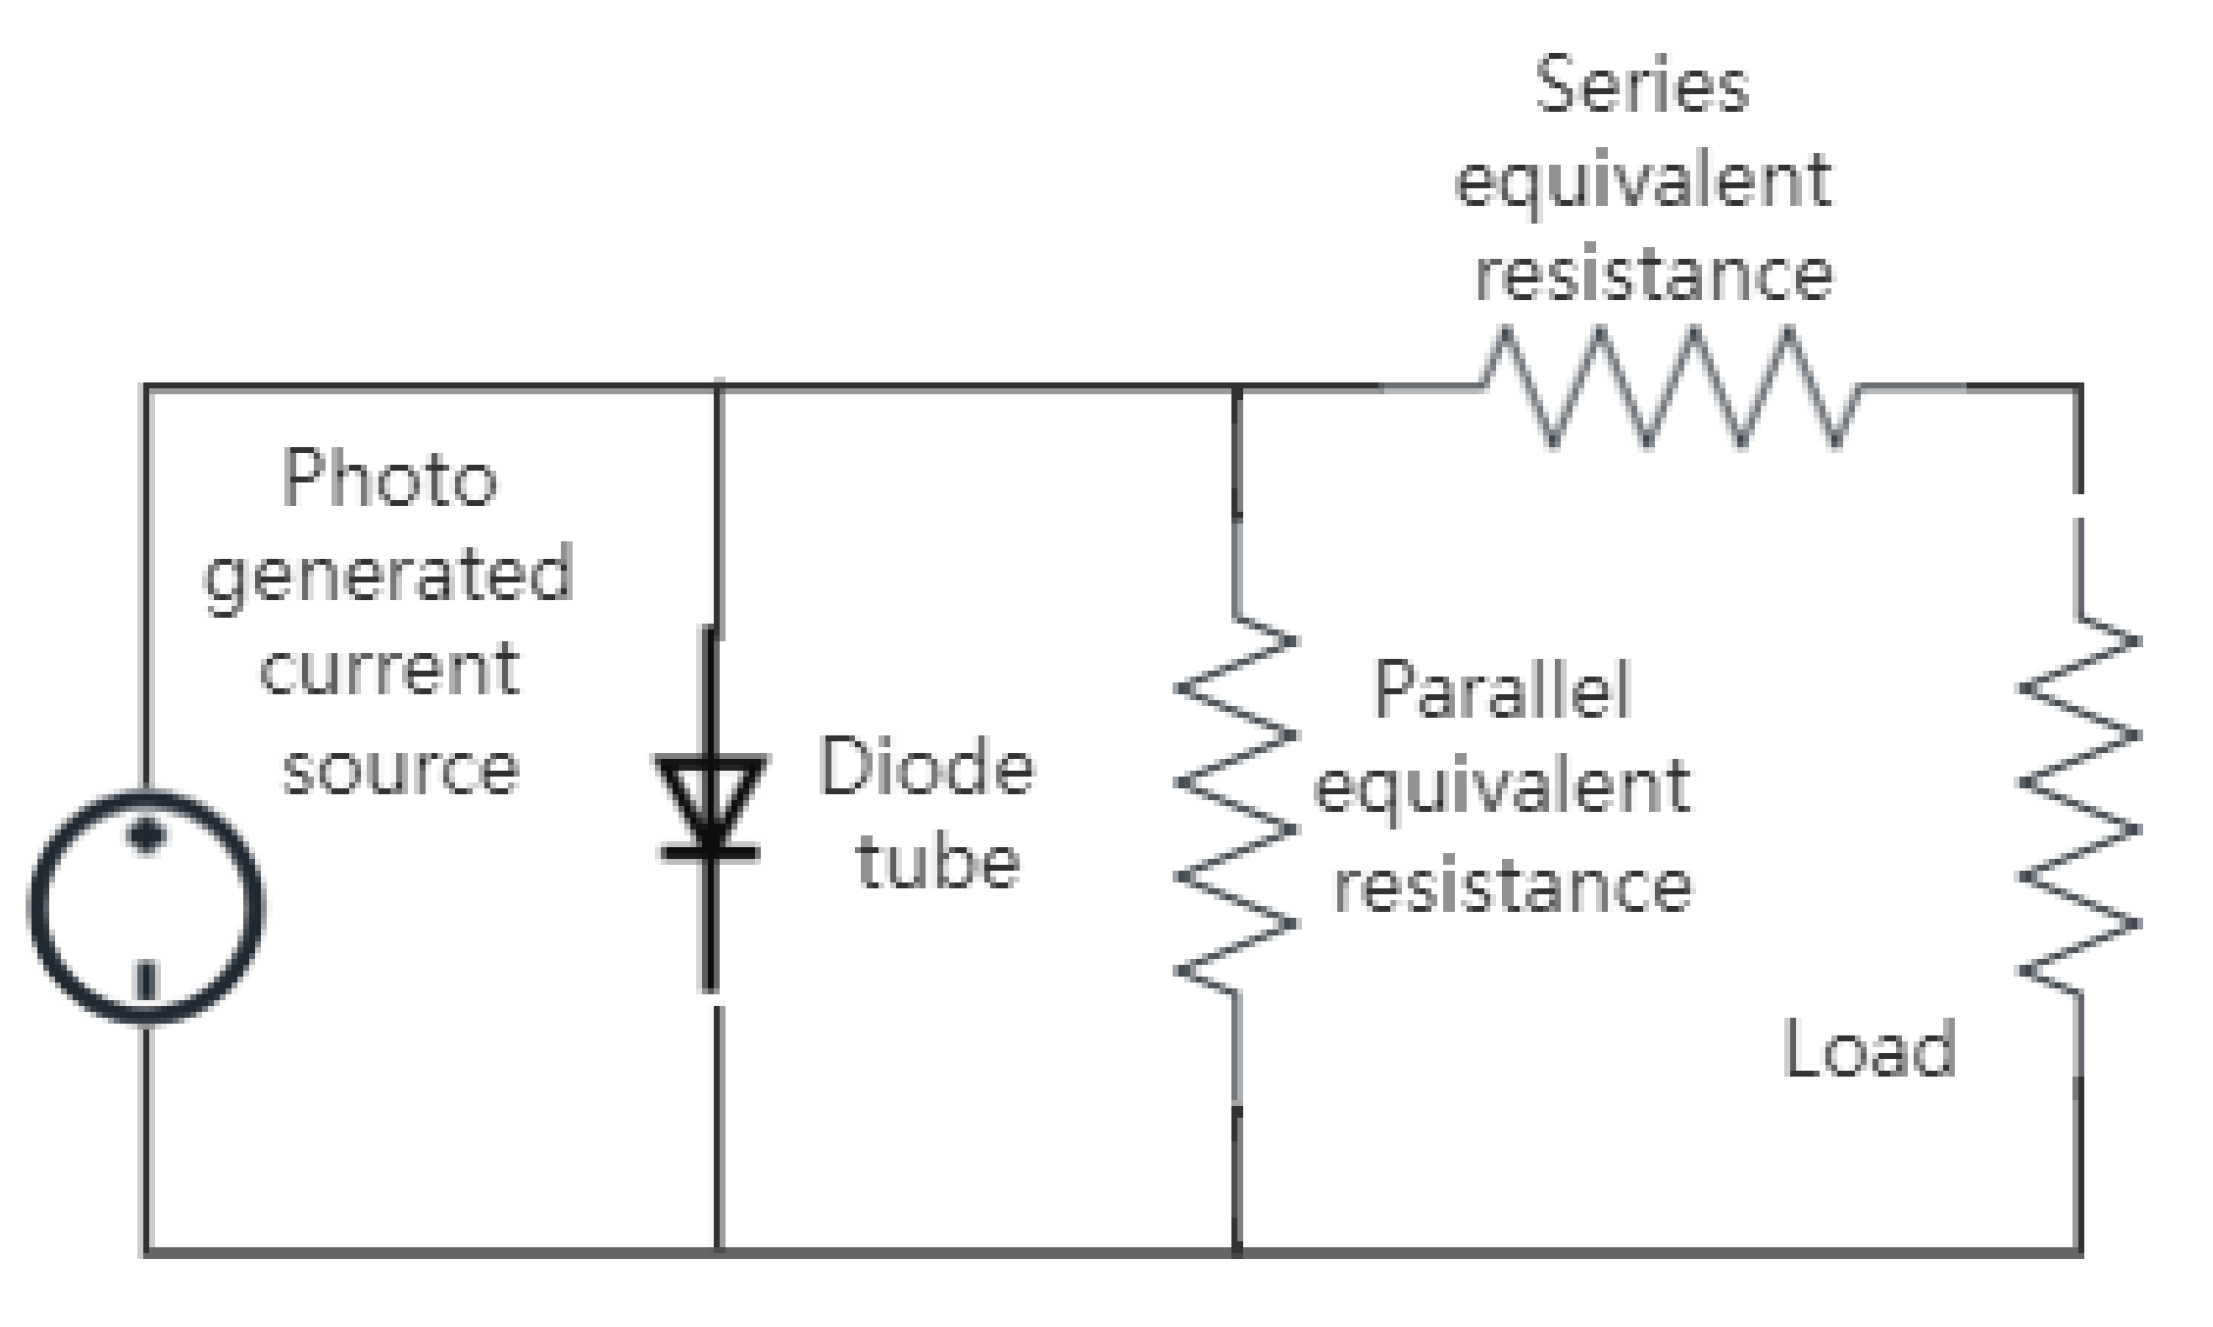
The basic principle of photovoltaic power generation is to utilize the photovoltaic effect. A single photovoltaic cell is commonly represented by a five-parameter model of a single diode circuit, which includes a photocurrent source, an equivalent diode, a series equivalent resistance, a parallel equivalent resistance, and an external load, as shown in
Figure 1.
According to the equivalent circuit of the photovoltaic cell and the characteristic equation of the diode, the current output of the photovoltaic cell can be obtained as shown in Formula (1).
where
represents the photocurrent;
represents the reverse saturation current of the diode;
represents the series equivalent resistance;
represents parallel equivalent resistance;
represents the output voltage;
represents the output current;
represents the influence factor of diodes;
represents the Boltzmann constant;
represents temperature; and
represents the electron charge constant.
The four common types of faults in photovoltaic arrays are open circuit faults, short circuit faults, local shielding faults, and aging faults. Therefore, this article constructs a 3 × 3 photovoltaic array simulation model based on the 1Soltech1STH-215-P model in MATLAB/Simulink environment, obtains the changes in various parameters under normal operating conditions and four common fault conditions, and conducts simulation analysis in different external environments to extract statistical features that can reflect the fault characteristics. The specific parameters of the photovoltaic array module are shown in
Table 1, and the 3 × 3 photovoltaic array simulation model built in MATLAB/Simulink is shown in
Figure 2.
Open-circuit faults generally refer to the phenomenon where a branch in the photovoltaic array becomes disconnected or broken, rendering it unable to produce power. In this study, an open-circuit fault is modeled by incorporating a branch in series with an infinite resistance.
Short-circuit faults typically occur due to the conduction of bypass diodes within the photovoltaic module, causing the parallel resistance of the photovoltaic module to approach zero and leading to a loss in output power. Here, short-circuit faults are simulated by creating short circuits across multiple photovoltaic modules within the array.
Aging failures usually result from the long-term operation of photovoltaic arrays, which can lead to abnormal aging over time, thereby reducing the output power of the photovoltaic modules. In this research, aging faults are simulated by introducing a branch series circuit into the photovoltaic array.
Partial shading refers to factors that diminish the solar energy acceptance of photovoltaic cells, such as cloud cover, foreign matter, or dust on the surface of the photovoltaic array, consequently decreasing the power generation efficiency of the array. In this work, partial shading is simulated by reducing the irradiance on a specific photovoltaic module.
2.2. Fault Feature Extraction
For the photovoltaic array under normal working conditions, the
curve and
curve are greatly affected by the external environmental factor’s temperature
and irradiance
. The
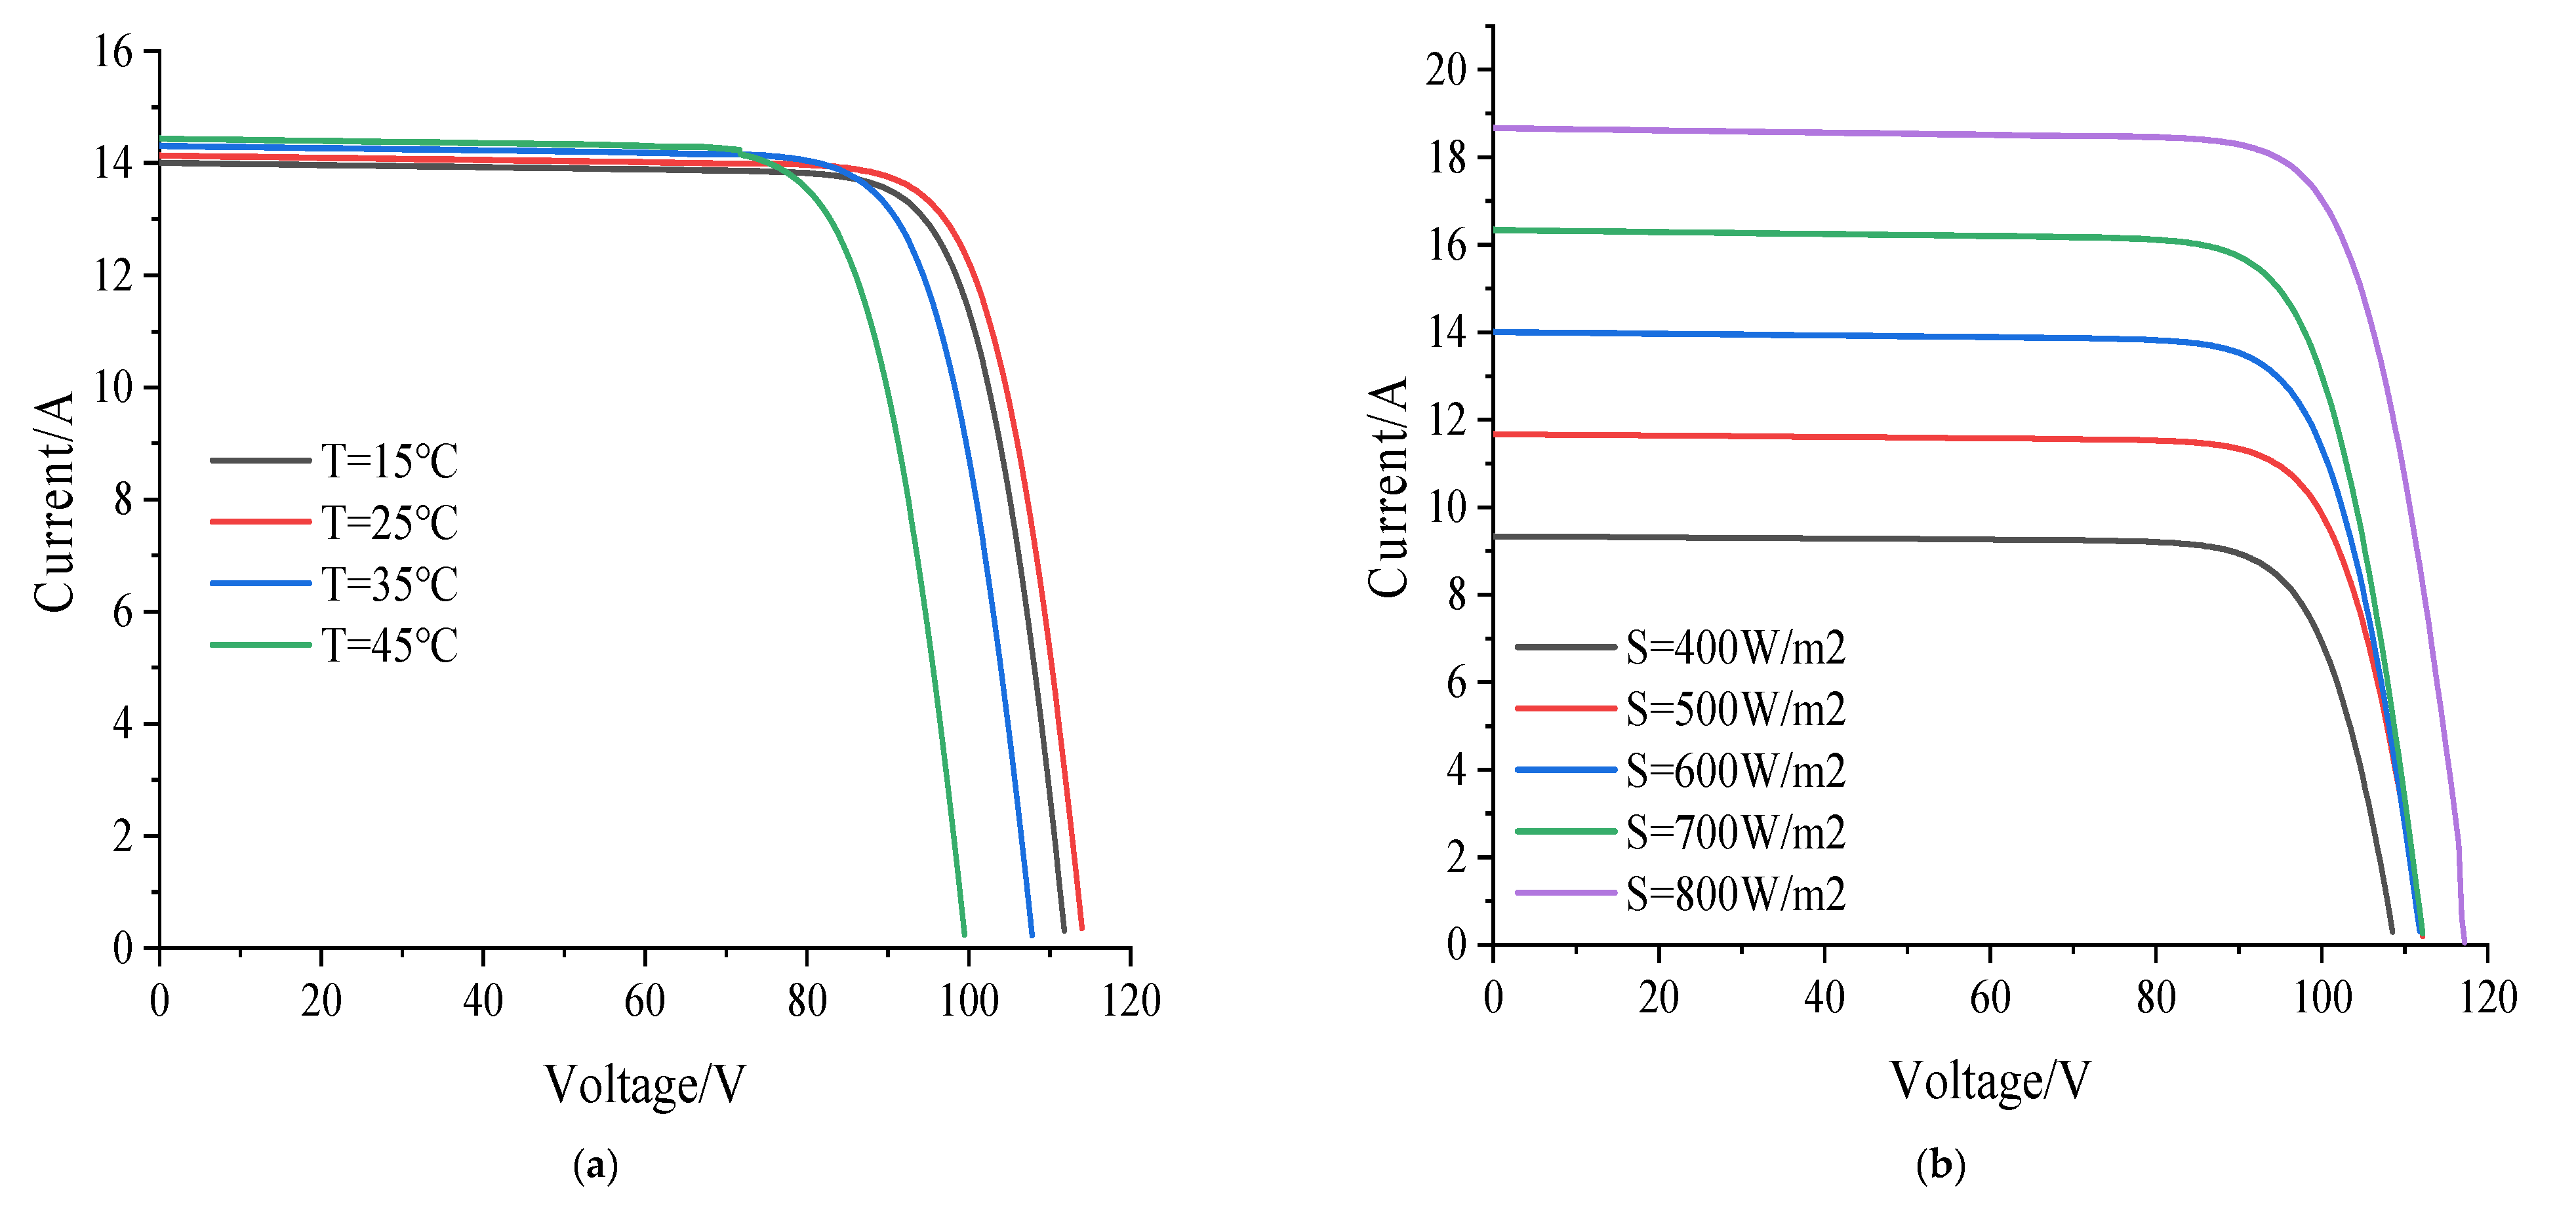
curve is shown in
Figure 3 and the
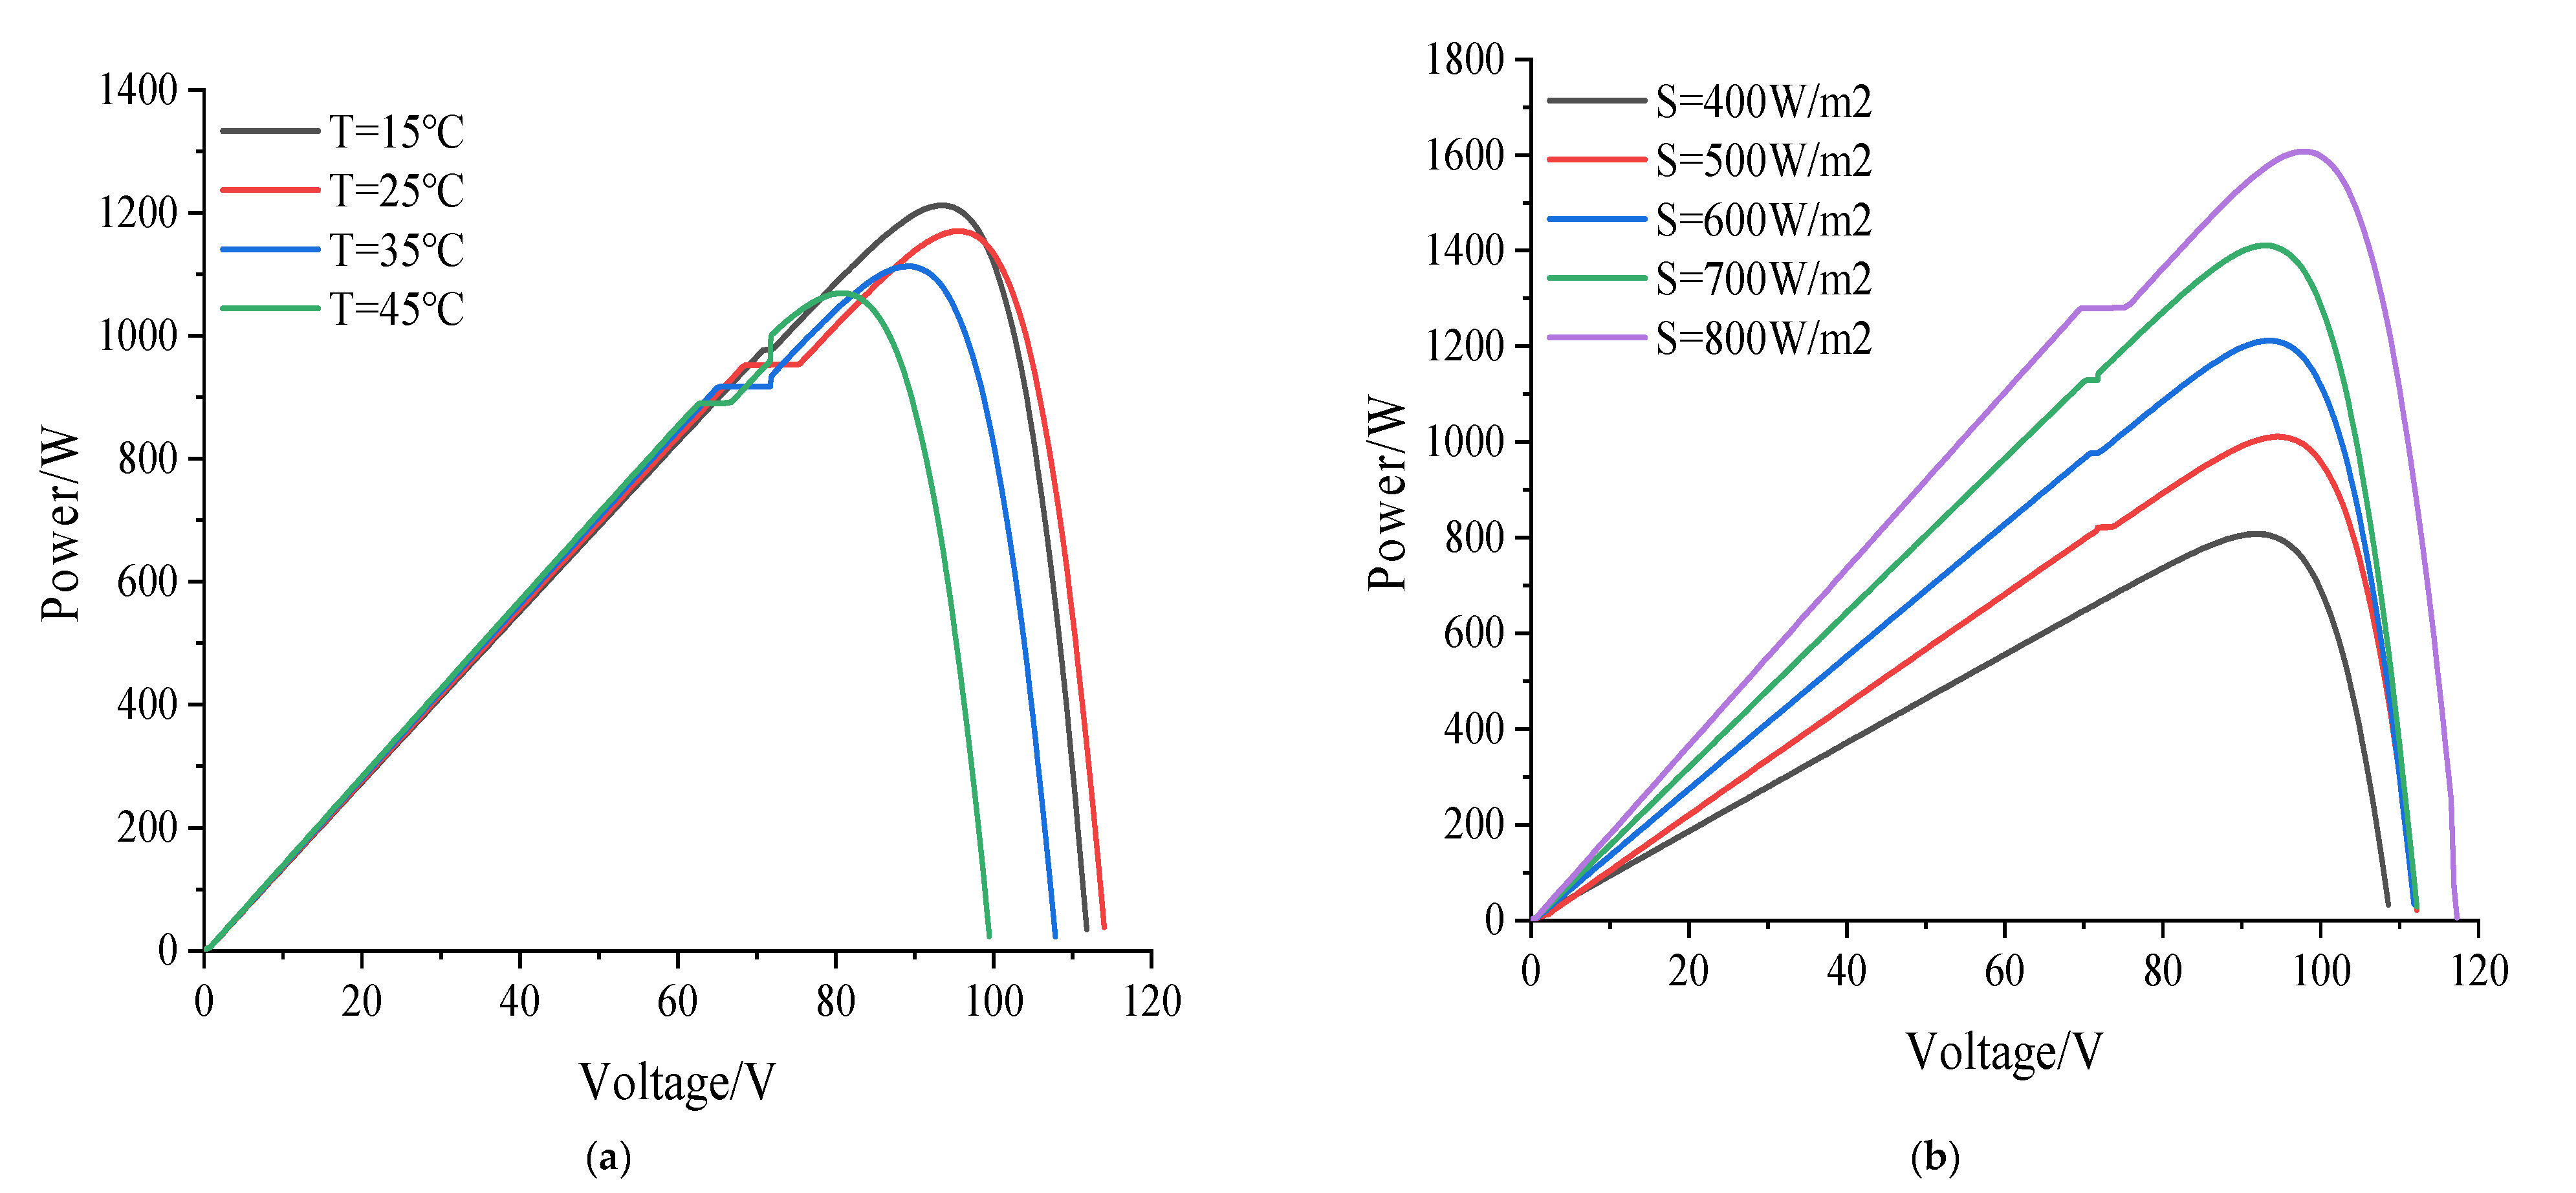
curve is shown in
Figure 4.
It can be seen from
Figure 3 and
Figure 4 that as the temperature increases, the short-circuit current of the photovoltaic array gradually increases, and the open-circuit voltage and maximum output power gradually decrease. With the increase in irradiance, the short-circuit current, open-circuit voltage, and maximum output power of the photovoltaic array gradually increase. The curves and curves under different fault types are shown in
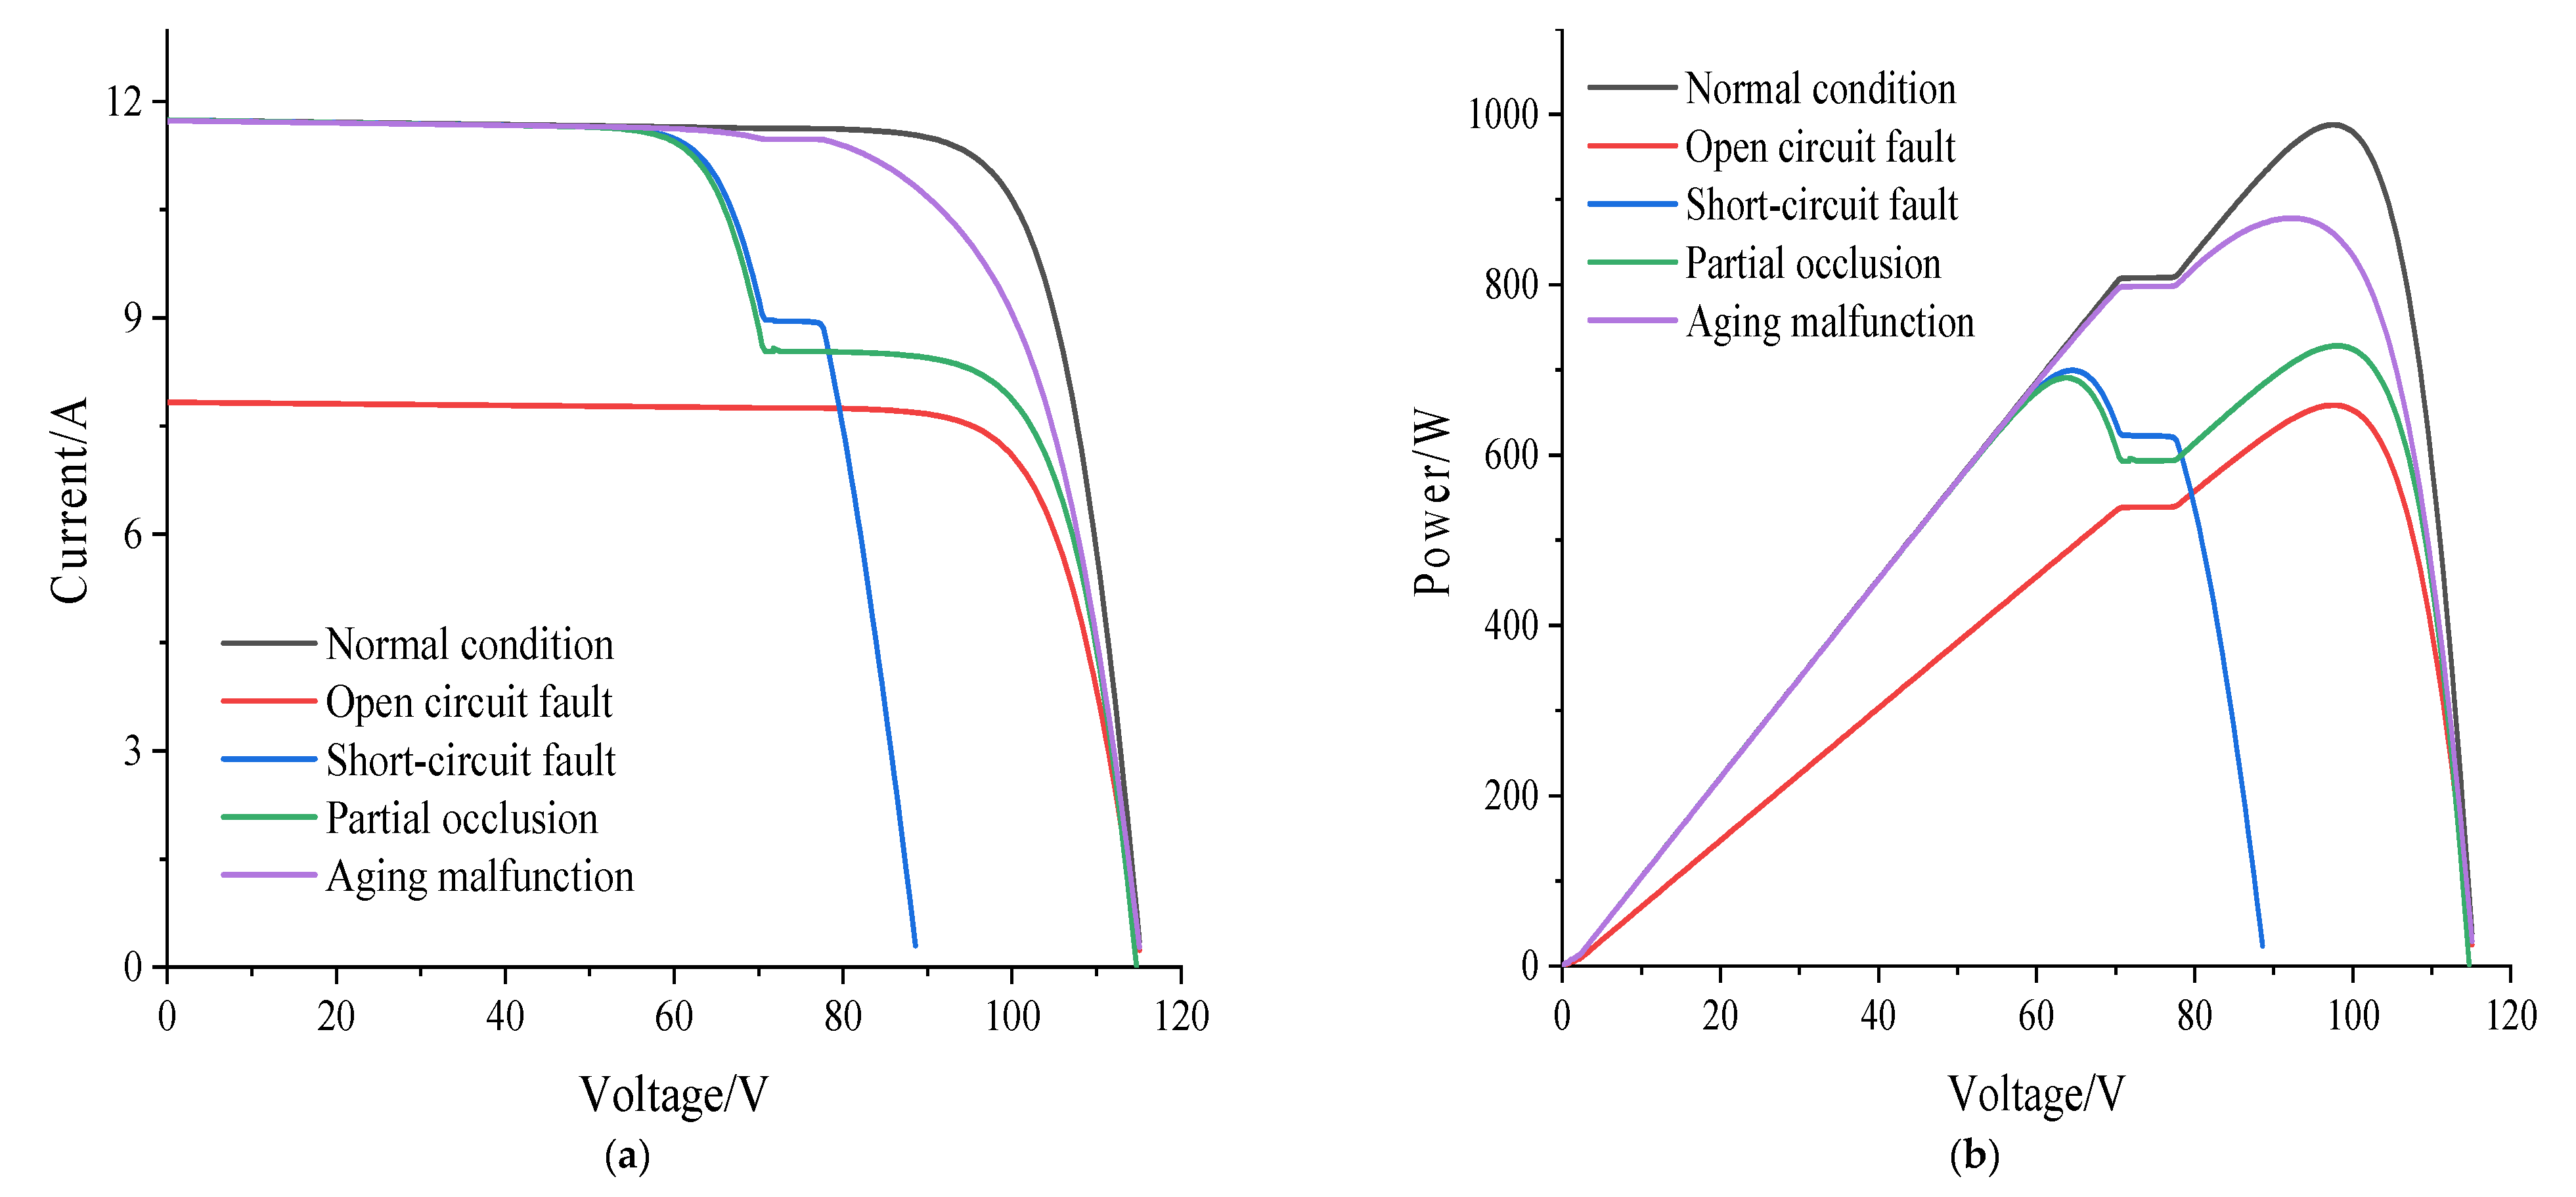
Figure 5.
From
Figure 5, the maximum power point current
and short-circuit current
decrease when the photovoltaic array has an open-circuit fault; when a short-circuit fault occurs in the photovoltaic array, the maximum power point voltage
and open circuit voltage
decrease. When the photovoltaic array has an aging fault, the maximum output power
decreases; when the PV array is partially obscured, the open-circuit voltage
and short-circuit current
are basically unchanged, and the maximum output power
, maximum power point voltage
and maximum power point current
change significantly.
Combined with
Figure 2,
Figure 3, and
Figure 4, the
curve and
curve of photovoltaic array are greatly affected by the temperature
and irradiance
of external environmental factors, whether it is in normal or fault conditions. Therefore, in this paper, the basic statistical characteristics, discrete statistical characteristics and distribution statistical characteristics of photovoltaic array
curves and
curves are, respectively, analyzed. Ten statistical indexes composed of three types of statistical characteristics of the two curves are used as the input vectors of the fault diagnosis model, and each index is described as shown in
Table 2.
3. Algorithm Principle
3.1. Random Forest Algorithm
RF is a classification algorithm that utilizes an ensemble of decision trees to train on samples and aggregate their predictions. It employs the Bagging technique, which involves generating multiple resamples with replacement from the original dataset and fitting a decision tree to each resampled subset. The final prediction is determined through a majority vote among the ensemble of trees. During this process, approximately one-third of the samples are left out, known as the Out-Of-Bag (OOB) samples. These OOB samples serve a dual purpose: they can be utilized to estimate the model’s error rate and to calculate the importance of each feature. This is performed by averaging the decrease in accuracy when a particular feature is perturbed, thereby deriving the feature’s importance index.
3.2. Honey Badger Optimization Algorithm
The honey badger algorithm (HBA) is proposed by Fatma A et al., which is derived from the mining behavior and honey collecting behavior of honey badgers looking for food.
(1) Population initialization
Randomly initialize the number and location of honey badgers within a set range, as shown in Formula (2):
where
is the random number between
;
is the position of the
-th individual of
candidate individuals;
and
is the upper and lower bounds of the search space, respectively.
(2) Define strength
The olfactory intensity of the badger was related to the odor intensity of the prey and the distance between the prey and the badger. The higher the odor intensity of the prey, the faster the badger moves, and vice versa, as shown in Formula (3):
where
is the odor intensity of the prey;
is the random number between
;
is the source intensity or prey concentration intensity;
is the distance between the prey and the current badger individual.
(3) Update density factor
The density factor
is used to ensure a smooth transition from exploration to exploitation of honey badgers and is updated using the method in Formula (4) to reduce the uncertainty caused by time-varying changes in the process of simulating honey badgers looking for food.
where
is the maximum number of iterations;
(generally default 2).
(4) Excavation stage
In the excavation stage, the badger performs actions like the shape of the heart line, and the heart-shaped motion can be simulated by Formula (5):
where
is the global optimal position of the honey badger in the current state;
(generally default 6) is the ability of honey badgers to obtain food;
,
,
is three random numbers between
;
is the sign of changing the search direction, as shown in Formula (6):
where
is the random number between
.
(5) Honey-harvesting stage
In the nectar collection stage, the behavior of the badger following the guide bird to find the hive can be simulated by Formula (7):
where
is the global optimal position of the updated badger;
,
, and
are expressed by Formula (6), Formula (4), and Formula (3), respectively;
is the random number between
.
3.3. Improved Honey Badger Algorithm
Aiming at the problem that the traditional honey badger optimization algorithm has slow convergence speed and is easy to fall into local optimal solution, the following improvements are made based on it:
(1) Tent chaotic mapping strategy
The original honey badger optimization algorithm arbitrarily obtains the initial solution, making it challenging to ensure that individuals uniformly cover the entire solution space. To address this issue, chaotic mapping strategies are frequently employed in optimization algorithms to disperse populations and mitigate aggregation. There are two primary types of chaotic maps: the Logistic chaotic map and the Tent chaotic map. The latter can generate a more uniform chaotic sequence with a faster convergence rate, as illustrated in Formula (8).
where
is the dimension of the individual in the sequence of the honey badger optimization algorithm;
is the random number between
.
(2) Improve control parameters
The
change in Formula (4) is smoother. Once the population reaches the local optimal state, it is difficult to maintain the diversity of the population, which leads to the deterioration of the optimization effect. In this regard, the control parameters under the condition of random disturbance are adopted, as shown in Formulas (9) and (10).
where
and
are the random number between
.
(3) Micro-hole imaging strategy
From Formulas (5) and (7), it is evident that the process of prey search by badgers is primarily guided by the current optimal individual. If this current optimal individual is merely a local optimum, the algorithm will converge prematurely and become trapped in a local solution. To address this issue, applying the pinhole imaging strategy dimension-by-dimension to the current optimal individual can not only eliminate the mutual interference between dimensions but also enhance the diversity of the current optimal individual. The one-dimensional mathematical model is expressed in Formula (11).
Formula (10) is extended to multi-dimensional space and applied to the current optimal individual according to the dimension. The specific Formula is shown in (12).
By setting the scale factor
, the pinhole imaging formula of the current optimal individual is shown in (13).
where
,
is the lower boundary and upper boundary of the current optimal individual in the first dimension, respectively;
is the corresponding value of the current optimal individual in the
dimension;
is the random number between
.
3.4. Basic Diagnostic Model
SVM is a supervised learning method based on statistical learning theory. Firstly, the sample space is transformed into a linearly separable space using a kernel function. Then, the maximum interval is used to find the segmentation line with the largest interval, maximizing the distance between different categories of data. Finally, regression analysis is established to classify and predict the selected samples.
LSTM is proposed based on recurrent neural network (RNN), which can effectively solve the problem of gradient vanishing or exploding in RNN when processing long time series. LSTM outperforms RNN in both convergence speed and performance when dealing with long time series problems. The overall structure of LSTM is roughly the same as RNN, with the biggest difference being that RNN does not have cell states, while LSTM remembers information through cell states and uses forget gates, input gates, and output gates to maintain and control information. LSTM usually uses the Sigmoid function as the activation function for the forget gate and input gate. The Sigmoid function can map the input information to the [0, 1] interval and make trade-offs between the input information. If the output is 0, it means discarding all information and output as 1, indicating the retention of all information.
BiLSTM is an optimization improvement of traditional LSTM. Its main feature is to increase the learning ability of neural networks for future information, thereby overcoming the deficiency of insufficient data information mining in unidirectional LSTM networks. Compared with traditional one-way LSTM, BiLSTM consists of a forward LSTM layer and a backward LSTM layer, which can learn forward and backward features of the input sequence. In this way, the model can not only be trained from input to output, but also from output to input, fully obtaining information about the past and future inputs, effectively improving the model’s dependency and enhancing its prediction accuracy.
4. Photovoltaic Array Fault Diagnosis Process
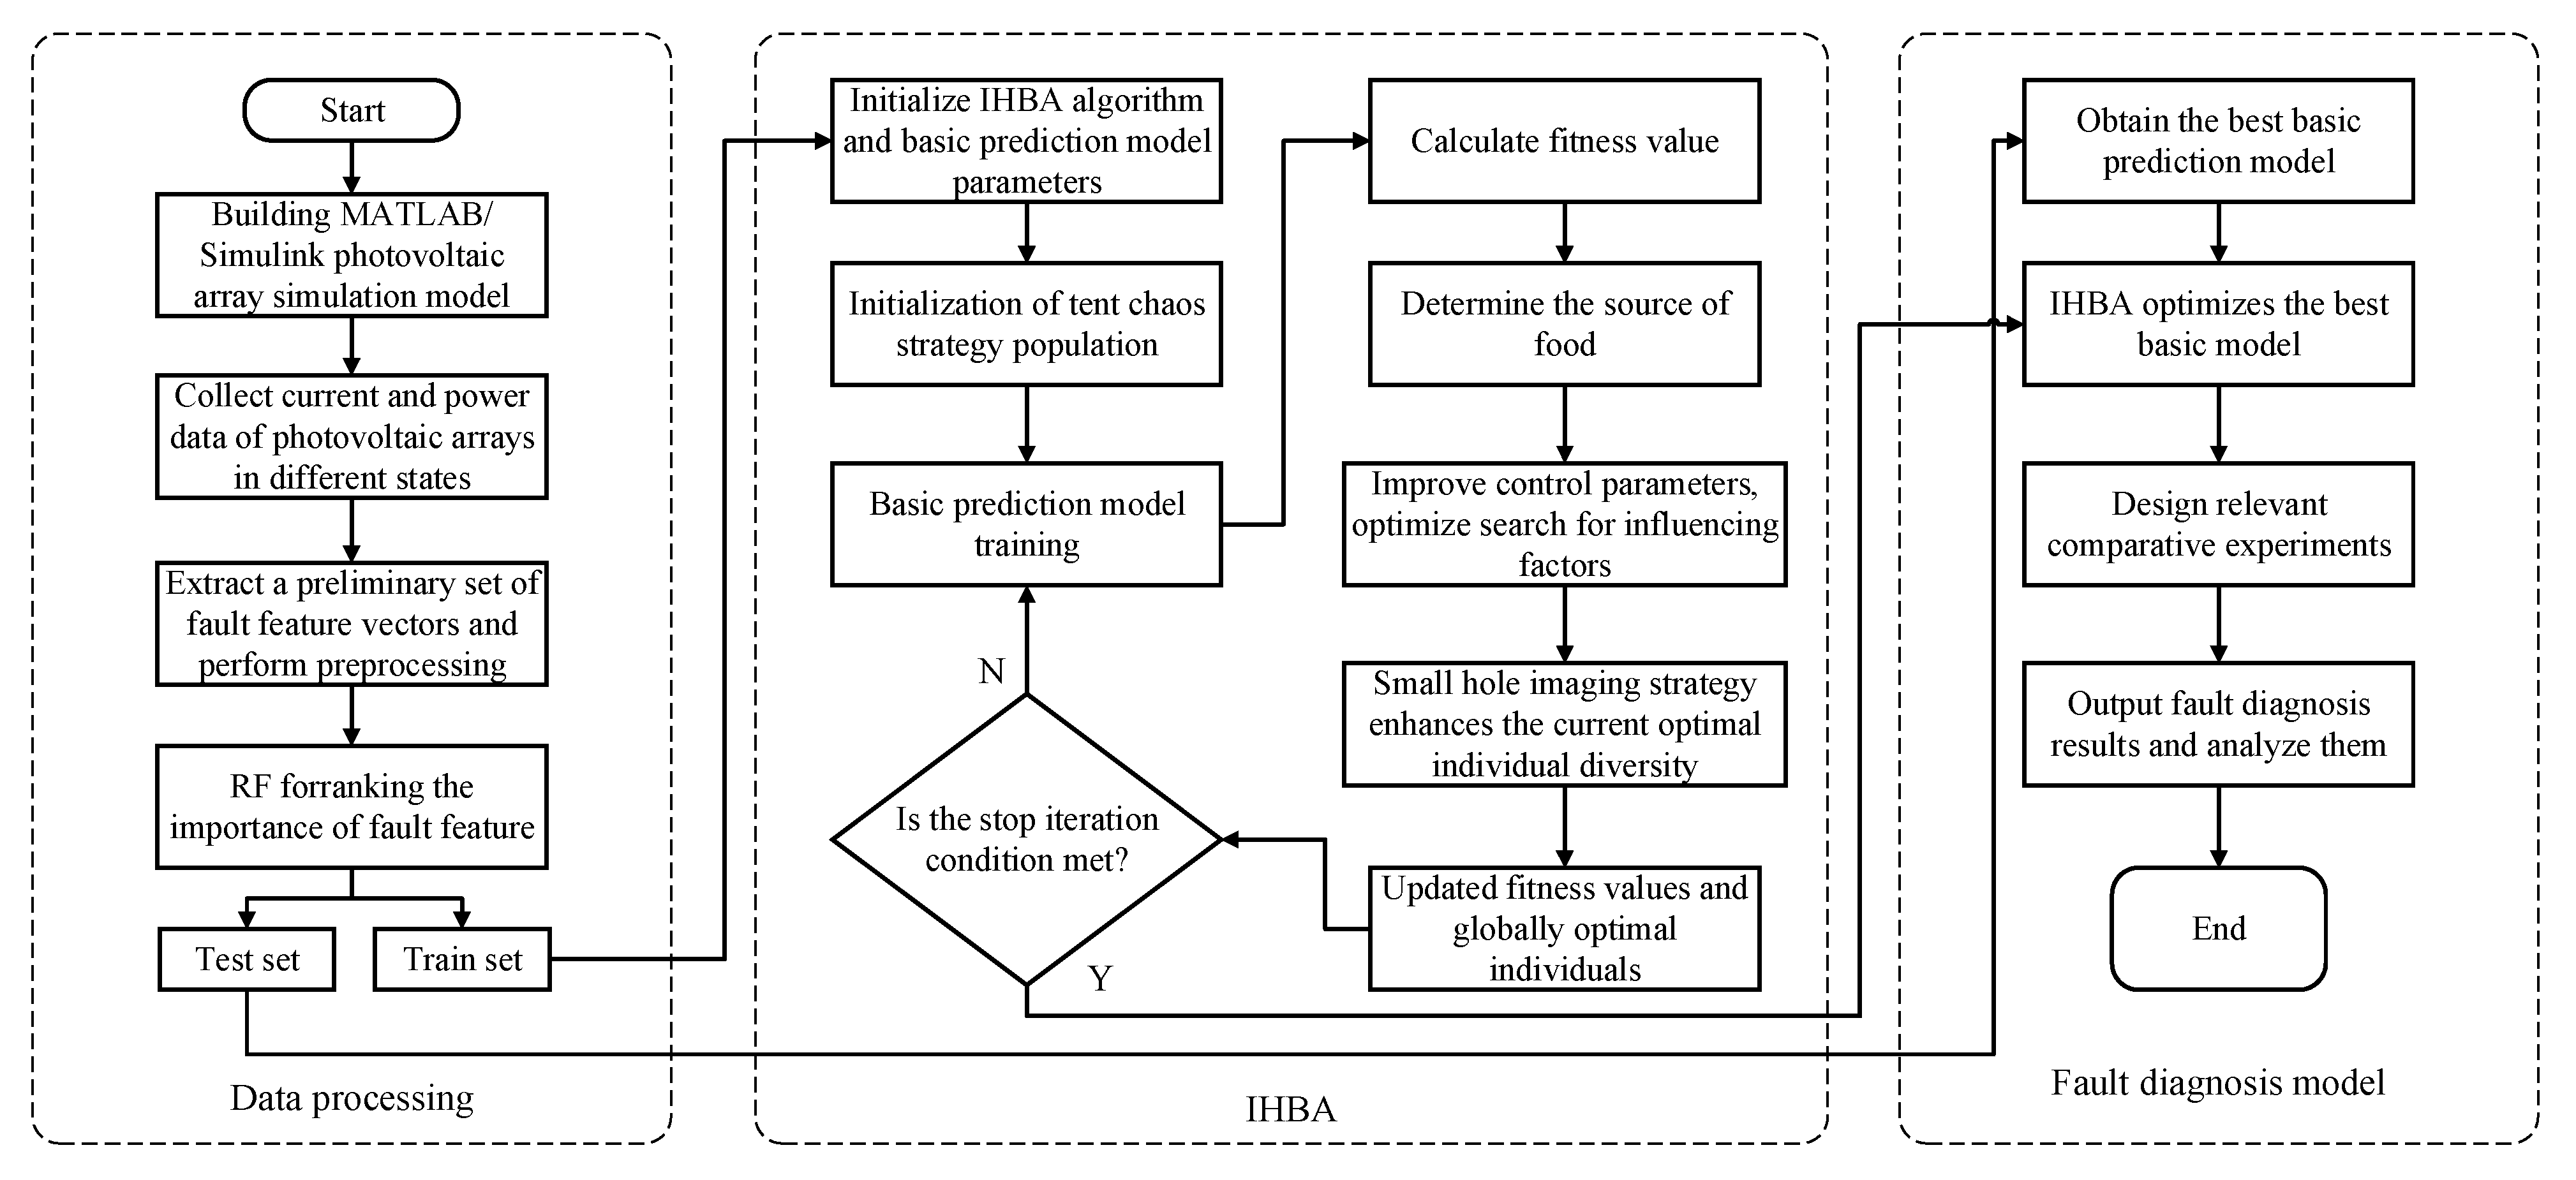
To improve the accuracy of photovoltaic array fault diagnosis, this paper proposes a photovoltaic array fault diagnosis method based on IHBA. The overall process is shown in
Figure 6, and the specific steps are as follows.
Step 1: Build a MATLAB / Simulink photovoltaic array simulation model and collect current and power data under different conditions;
Step 2: Extract 10-dimensional initial fault feature vector set from the collected current and power data and preprocess it. Divide the test set and training set;
Step 3: The random forest algorithm is used to calculate the feature importance of the relevant fault features in the initial fault feature vector set and sort them;
Step 4: Import the training set into the relevant model algorithm, initialize the relevant parameters of IHBA algorithm, SVM, LSTM, and BiLSTM;
Step 5: Initialize the population through the Tent chaotic strategy, train the above-mentioned basic prediction model, calculate the relevant fitness value, and determine the food source;
Step 6: The search factor is optimized by improving the control parameters, and the diversity of the current optimal individual is enhanced by the pinhole imaging strategy;
Step 7: determine whether the stopping condition is satisfied. If it is satisfied, the current optimal individual is output to obtain the hyperparameters of the best basic prediction model, otherwise step 5 is returned;
Step 8: Input the test set data into the IHBA optimization basic prediction model, design relevant comparative experiments, and analyze the diagnosis results.
5. Example Analysis
5.1. Data Acquisition and Preprocessing
In this paper, a 3 × 3 photovoltaic array is built by using MATLAB/Simulink simulation evaluation. The model simulation is carried out for normal working conditions, open circuit faults, short circuit faults, partial masking and aging faults. At the irradiance
W/m
2 and temperature
°C, the values are 20 W/m
2 and 3 °C, respectively. A total of 1155 sets of photovoltaic array operation data were collected. The ratio of test set and training set is 7:3, and the data information is shown in
Table 3.
5.2. Evaluating Indicator
In this paper, the commonly used accuracy rate is selected as the evaluation index to comprehensively and deeply evaluate the performance of the classification prediction model. The calculation formula is shown in (14).
where
is the accuracy of the classification prediction model;
is the number of positive samples predicted as positive samples;
is the number of positive samples predicted as negative samples;
is the number of negative samples predicted as positive samples;
is the number of negative samples predicted as negative samples.
5.3. Performance Test of Optimization Algorithm
To evaluate the performance of the IHBA optimization algorithm proposed in this paper, four benchmark functions are selected for testing. To ensure the reliability of the algorithm,
and
are unimodal test functions;
and
are multimodal test functions. The specific information of the four benchmark functions is shown in
Table 4.
The IHBA algorithm, dung beetle optimization (DBO), HBA, and whale optimization algorithm (WOA) are tested on four benchmark functions. The dimensions, upper and lower limits and optimal values of the four test functions are shown in
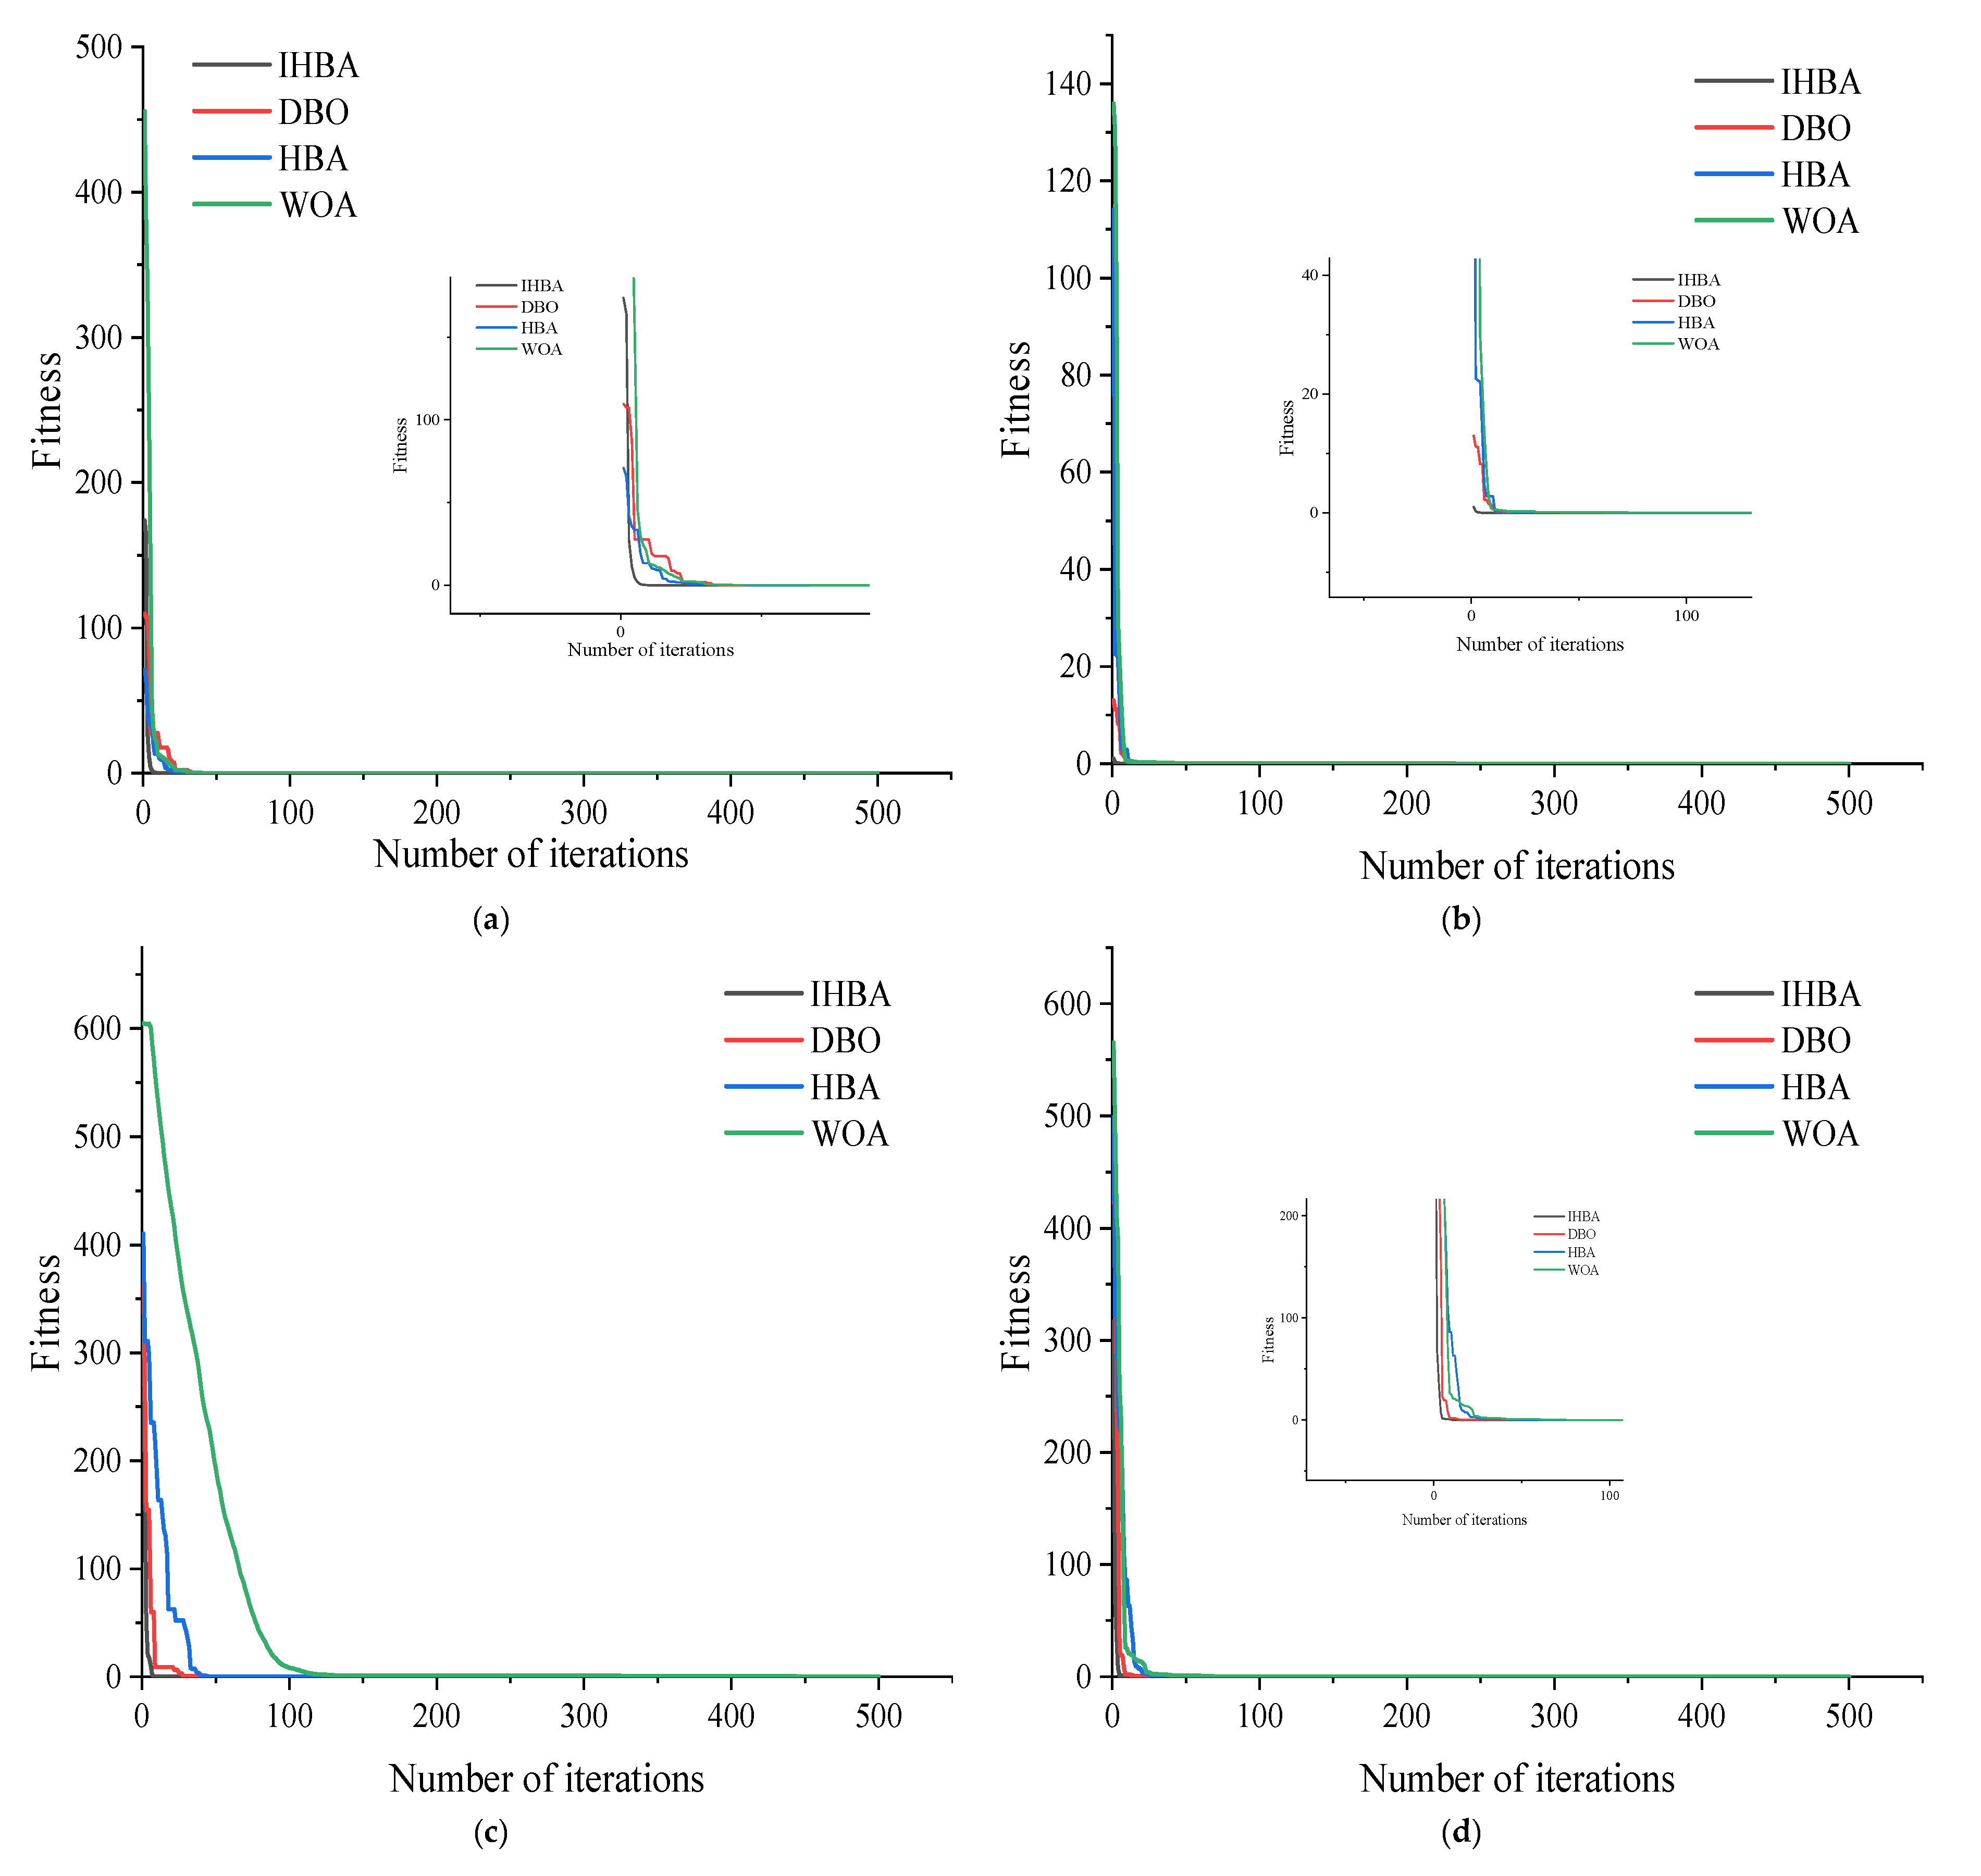
Table 4, and the number of iterations of each algorithm is 500. To reduce the contingency of the experiment, each algorithm performs 30 independent experiments on the four benchmark test functions, respectively, obtains the optimal value, average value and standard deviation of the function, respectively, and draws the convergence curve. The convergence curve of the test function is shown in
Figure 7, and the results of the test function are shown in
Table 5.
It can be seen from
Figure 6 that the IHBA proposed in this paper is superior to other optimization algorithms in terms of convergence speed and optimization effect, indicating that the improved strategy adopted by the IHBA algorithm can not only accelerate the convergence speed of the algorithm, but also improve the optimization efficiency. At the same time, it can be seen from
Table 5 that IHBA has the best and most stable effect on the four benchmark test functions, indicating that IHBA has significant optimization performance and stability.
5.4. RF Feature Selection and the Best Basic Model Determination
To eliminate the interference of redundant features on the overall fault diagnosis model, the RF feature selection is performed on the 10-dimensional initial fault feature vector set. To avoid the influence of contingency, the average method is used to determine the result. The ranking results are shown in
Table 6.
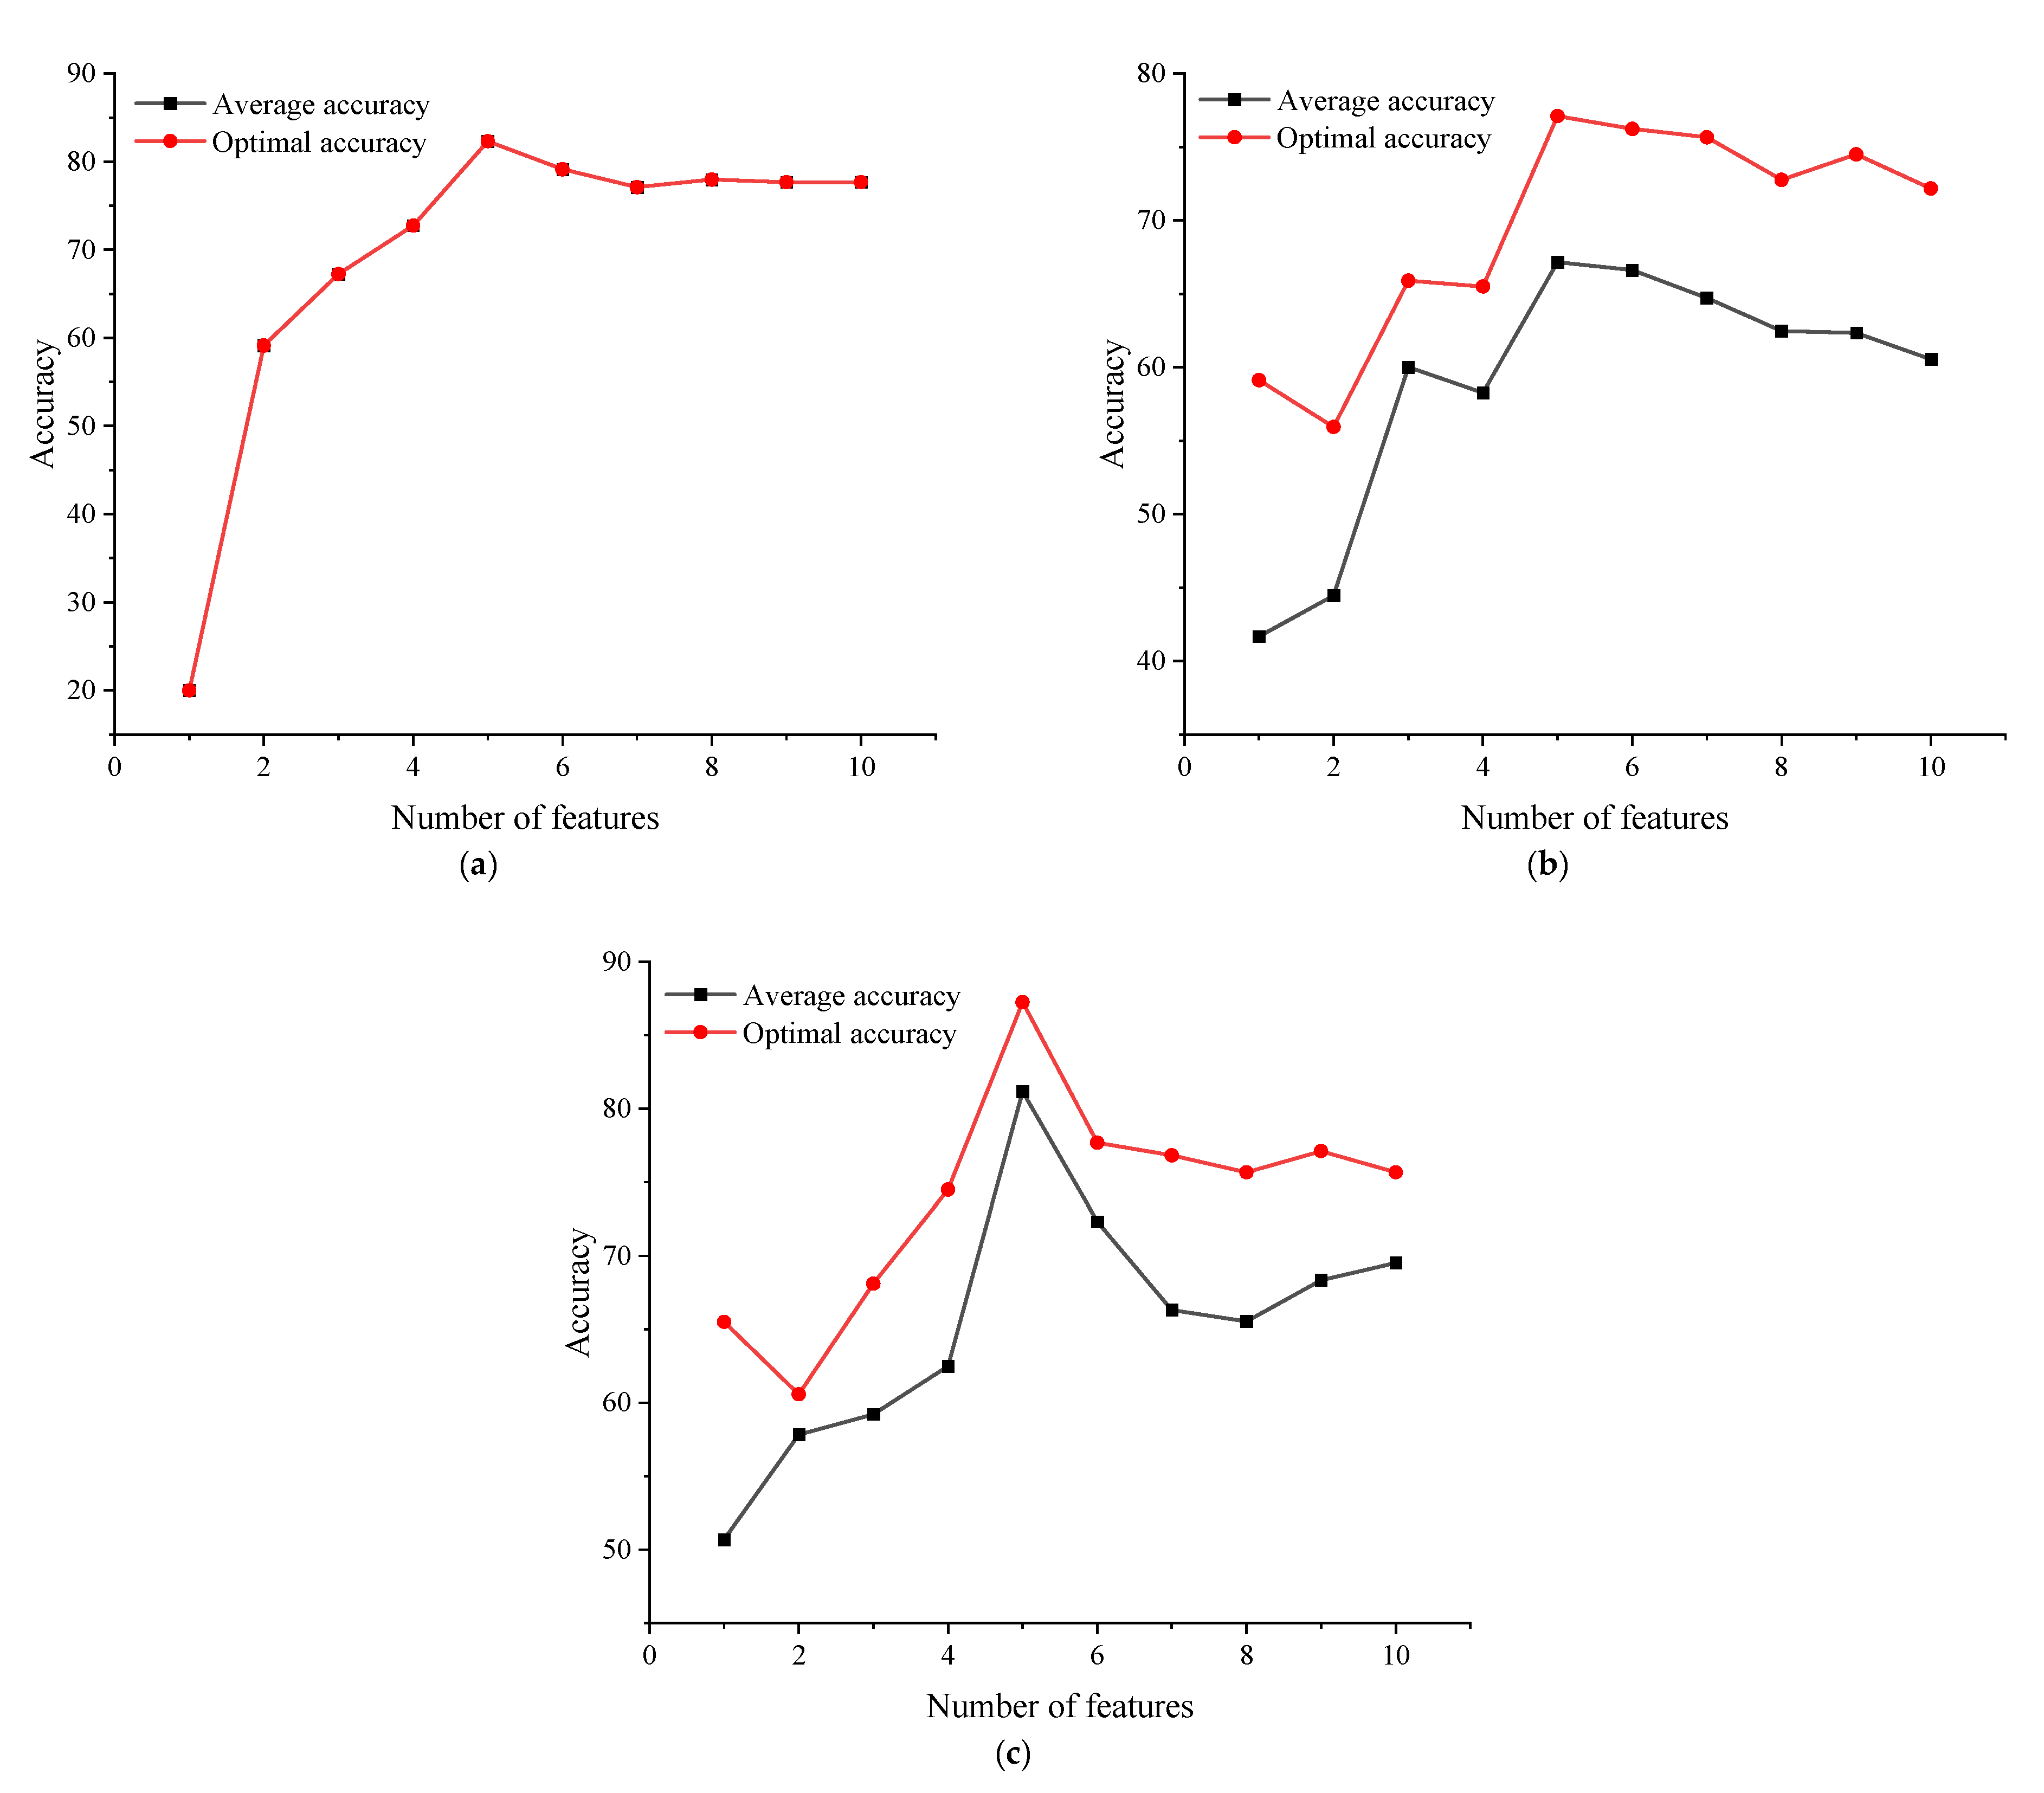
The above fault features are input into SVM, LSTM, and BiLSTM in turn according to the average importance of features. To eliminate the fluctuation of the basic prediction model, each feature is run 10 times, respectively, and the average accuracy and the best accuracy are obtained with the accuracy rate as the evaluation index. The accuracy results of the three basic models are shown in
Figure 8.
It can be seen from
Figure 8 that the optimal number of features of the three basic prediction models is 5. Among them, the basic prediction model SVM is stable as a whole, so the average accuracy curve and the optimal accuracy curve overlap, the highest is 82.3188%; the average accuracy of the basic prediction model LSTM is up to 67.16302%, and the optimal accuracy is up to 77.1014%. The average accuracy of the basic prediction model BiLSTM is 81.1585%, and the optimal accuracy is 87.2469%. The average accuracy of BiLSTM is roughly the same as that of SVM, but the optimal accuracy is about 5% higher. Therefore, the best basic prediction model is BiLSTM, and the best number of features is the first five.
5.5. Validation of Fault Diagnosis Model
To verify the effectiveness of IHBA in optimizing BiLSTM neural network, it is compared with DBO, HBA, and WOA, respectively. The iterative curve is shown in
Figure 9, and the parameter optimization results are shown in
Table 7.
It can be seen from
Figure 9 that on the optimized BiLSTM neural network, IHBA can find the minimum value faster and more accurately than HBA, and effectively jump out of the local optimal solution, which verifies the effectiveness of the improved strategy.
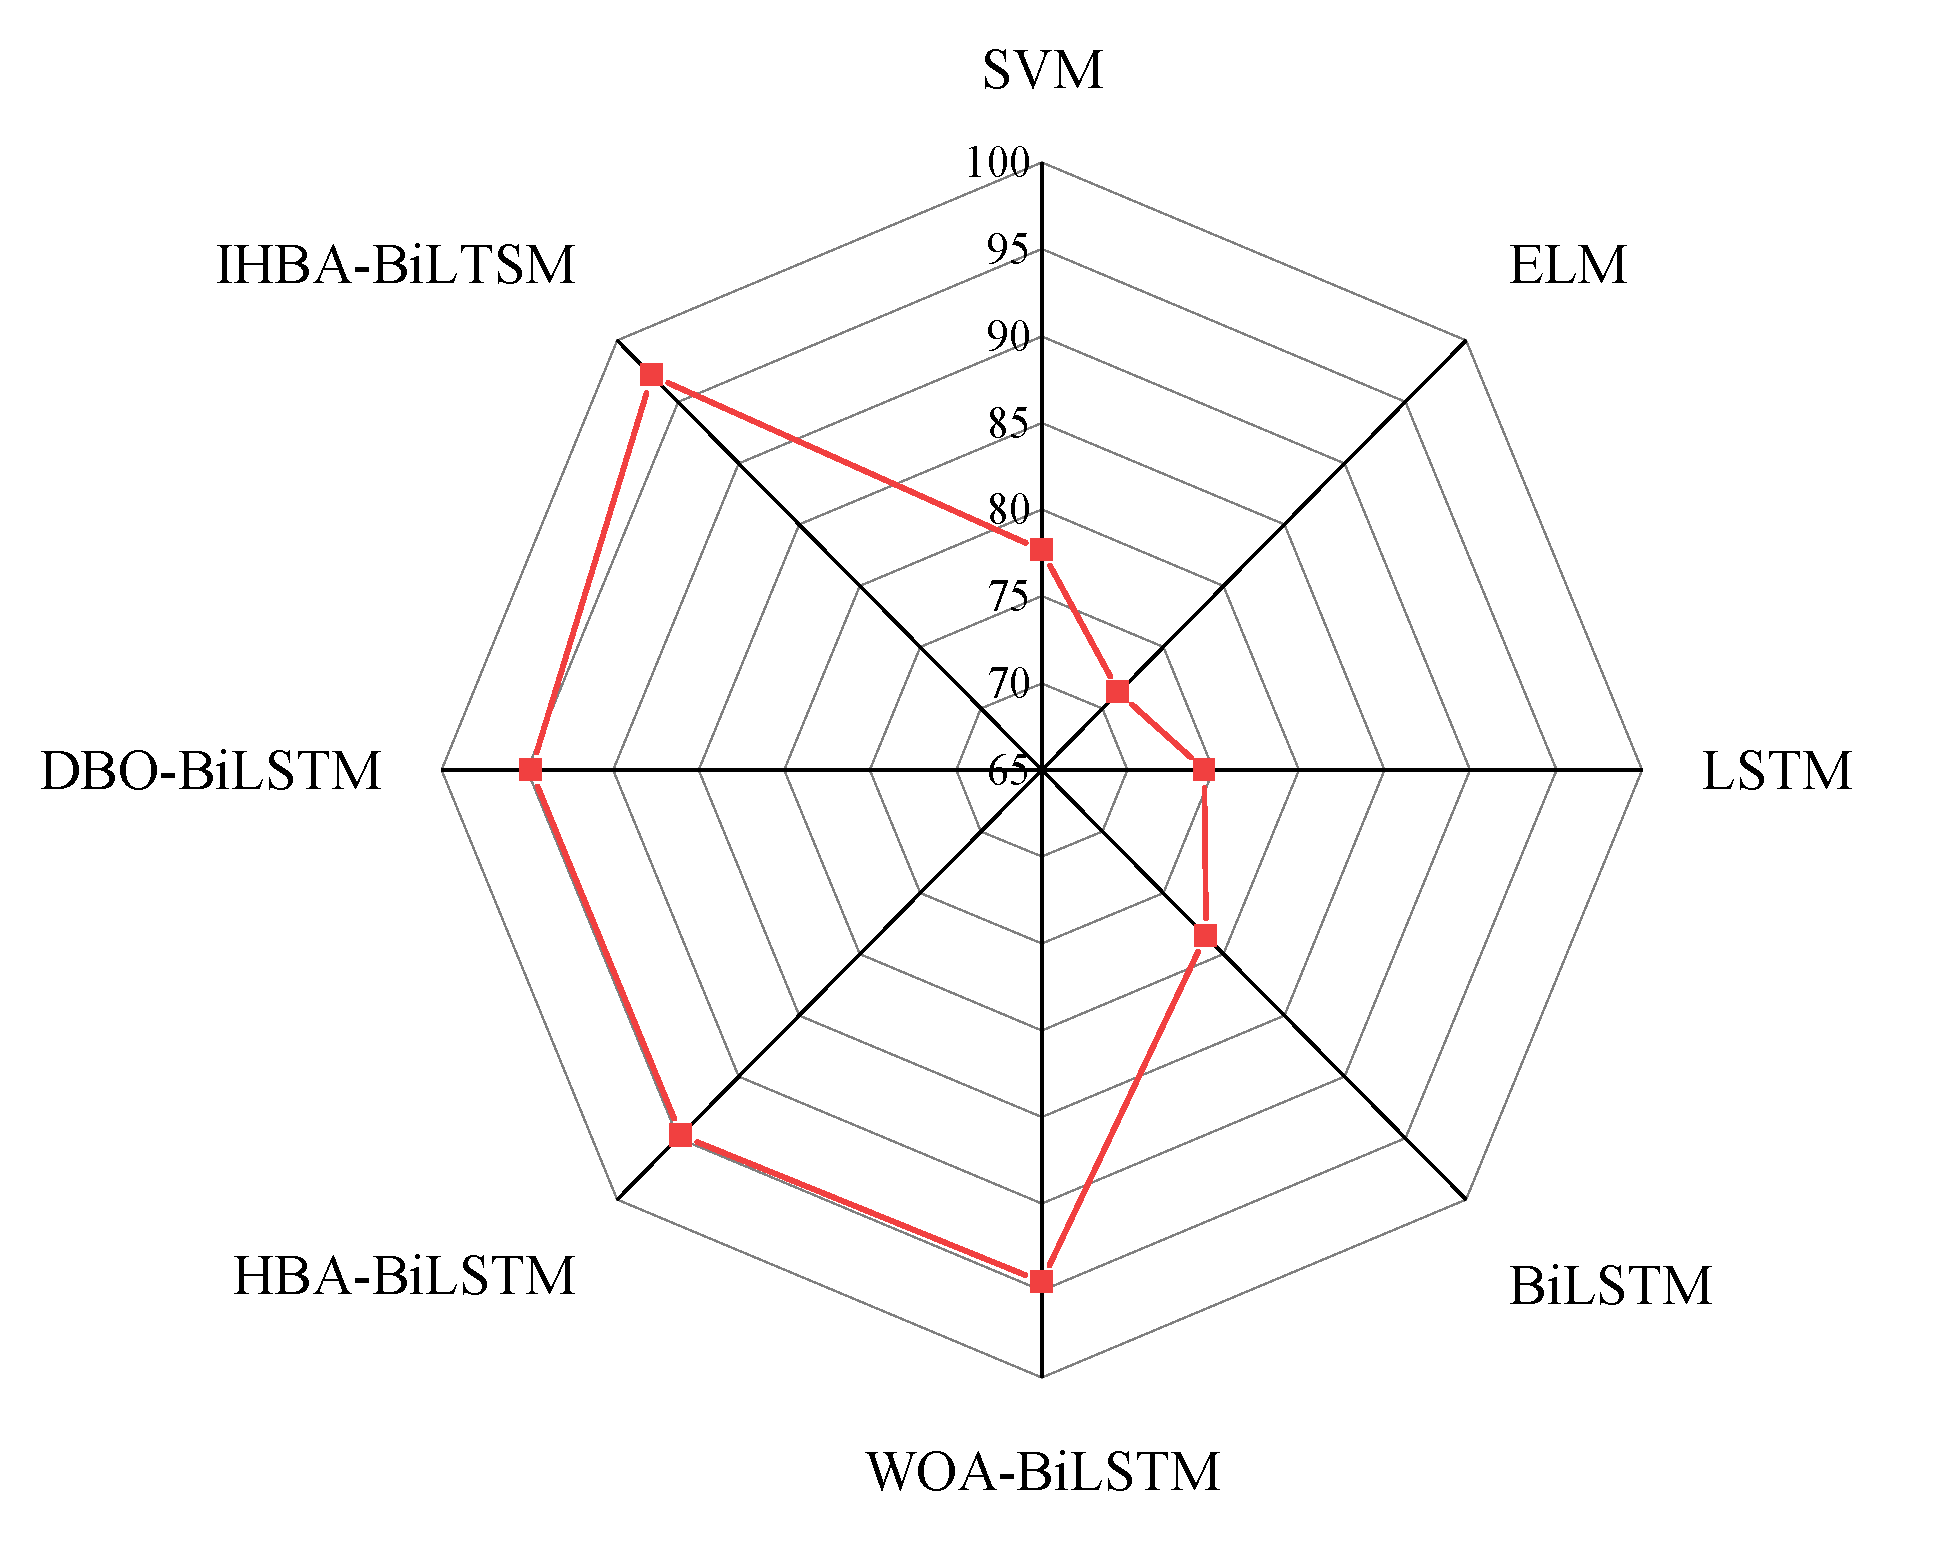
To verify the effectiveness of the proposed fault diagnosis model, the training samples are input into WOA-BiLSTM, HBA-BiLSTM, DBO-BiLSTM, and IHBA-BiLSTM for comparative analysis. The accuracy is shown in
Figure 10, and the specific results are shown in
Table 8.
It can be seen from
Figure 10 and
Table 8 that compared with the combined model WOA-BiLSTM and DBO-BiLSTM, the accuracy of IHBA-BiLSTM is increased by 2.76% and 2.45%, respectively, indicating that the selection of appropriate model parameters is helpful to further improve the performance of the model. Compared with HBA-BiLSTM, the accuracy rate is increased by 2.44%, which verifies the effectiveness of the optimization strategy and can effectively improve the diagnostic accuracy of the fault diagnosis model. The diagnostic results of different models are shown in
Table 9.
6. Conclusions
In this paper, a fault diagnosis method of photovoltaic array based on improved honey badger optimization algorithm is proposed, which effectively distinguishes the open circuit, short circuit, local shading and aging fault states of photovoltaic array. The following results are obtained:
(1) Based on the current and power output characteristic curves of photovoltaic array in different states, ten statistical indexes composed of three types of statistical characteristics of the two curves are extracted as the input vectors of the fault diagnosis model, which can effectively distinguish various fault types and improve the accuracy of fault diagnosis.
(2) The IHBA algorithm proposed in this paper is compared with the traditional DBO, HBA, and WOA algorithms on four benchmark test functions. The results show that the IHBA algorithm has better optimization performance, stability, and faster convergence speed, which verifies the effectiveness of the proposed improvement strategy.
(3) The feature selection and the best basic prediction model are judged by RF, which avoids the interference of redundant features to the prediction model and reduces the complexity of the model. The best basic prediction model is BiLSTM. Compared with all the input features, the model fault diagnosis accuracy is effectively improved.
(4) Compared with WOA-BiLSTM, HBA-BiLSTM, and DBO-BiLSTM models, this model can effectively distinguish fault types, and the overall fault diagnosis accuracy reaches 97.1014%, which is higher than other models.
After that, the work will study the diagnosis methods to distinguish different degrees of faults in the actual situation and design a more accurate diagnosis model to deal with more complex fault situations.
Author Contributions
Conceptualization, Z.G. and Y.F.; methodology, Z.G.; software, Z.G.; validation, Z.G., Y.F. and Y.C.; formal analysis, Z.G.; investigation, Z.G.; resources, Z.G.; data curation, Z.G.; writing—original draft preparation, Z.G.; writing—review and editing, Z.G.; visualization, Z.G.; supervision, Z.G.; project administration, Z.G. All authors have read and agreed to the published version of the manuscript.
Funding
This research was funded by Research on integrated modeling and high-precision solution method for shock and vibration characteristics of new sandwich filled composite thin-wall structures in Northeastern University. The APC was funded by the Northeastern University Research Project (External Cooperation).
Data Availability Statement
The original contributions presented in this study are included in the article. Further inquiries can be directed to the corresponding author.
Conflicts of Interest
The authors declare no conflict of interest.
Abbreviations
The following abbreviations are used in this manuscript:
| MDPI | Multidisciplinary Digital Publishing Institute |
| DOAJ | Directory of open access journals |
| TLA | Three letter acronym |
| LD | Linear dichroism |
| IHBA | Improved honey badger algorithm |
| ELM | Extreme learning machine |
| RF | Random forest |
| SVM | Support vector machine |
| LSTM | Long short-term memory |
| BiLSTM | Bidirectional long short-term memory |
| HBA | Honey badger algorithm |
| DBO | Dung beetle optimization |
| WOA | Whale optimization algorithm |
| OOB | Out of bag |
References
- Boussafa, A.; Rabeh, R.; Ferfra, M.; Chennoufi, K. Experimental test of optimizing maximum power point tracking performance in solar photovoltaic arrays based on backstepping control and optimized by genetic algorithm. Results Eng. 2024, 23, 102746. [Google Scholar] [CrossRef]
- Xu, A.; Ma, W.; Yang, W.; Li, M.; Tan, Y.; Zou, C.; Qiang, S. Study on the wind load and wind-induced interference effect of photovoltaic (PV) arrays on two-dimensional hillsides. Sol. Energy 2024, 278, 112790. [Google Scholar] [CrossRef]
- Shang, L.; Yan, P.; Zhang, J. Research on MPPT of photovoltaic array based on improved PSO algorithm. Transducer Microsyst. Technol. 2024, 43, 35–39. [Google Scholar]
- Wang, X.; Liu, B.; Sun, K.; Zhao, J.; Chen, L. A review of photovoltaic array fault diagnosis technology. Trans. China Electrotech. Soc. 2024, 39, 6526–6543. [Google Scholar]
- Zhang, J.; Liu, Y.; Li, Y.; Ding, K.; Feng, L.; Chen, X.; Chen, X.; Wu, J. A reinforcement learning based approach for on-line adaptive parameter extraction of photovoltaic array models. Energy Convers. Manag. 2020, 214, 112875. [Google Scholar] [CrossRef]
- Jiang, L.; Su, J.; Li, X.; Wang, H. Hot spot detection of photovoltaic array based on fusion of visible and infrared thermal images. Acta Energ. Solaris Sin. 2022, 43, 393–397. [Google Scholar]
- Li, G.; Duan, C.; Wu, S. Fault diagnosis of PV array based on semi-supervised machine learning. Power Syst. Technol. 2020, 44, 1908–1913. [Google Scholar]
- Lu, X.; Lin, Y.; Lin, P.; He, X.; Fang, G.; Cheng, S.; Chen, Z.; Wu, L. Efficient fault diagnosis approach for solar photovoltaic array using a convolutional neural network in combination of generative adversarial network under small dataset. Sol. Energy 2023, 253, 360–374. [Google Scholar] [CrossRef]
- Hao, J.; Zhan, H.; Xiao, C.; Pei, H.; Wang, L. A method of operation status evaluation and fault diagnosis for PV arrays in the scenario of digitalization. Energy Rep. 2024, 12, 3020–3033. [Google Scholar] [CrossRef]
- Zhao, J.; Wu, J.; Zhang, X.; Zhang, W.; Yao, S. Fault diagnosis of photovoltaic arrays based on sparrow search algorithm with firefly perturbation-extreme learning machine. Power Syst. Technol. 2023, 47, 1612–1625. [Google Scholar]
- Li, B.; Guo, Z.; Gao, P. Application of improved northern goshawk optimization algorithm in photovoltaic array. J. Electron. Meas. Instrum. 2023, 37, 131–139. [Google Scholar]
- Gu, C.; Xu, X.; Wang, M. CatBoost algorithm-based fault diagnosis method for photovoltaic arrays. Autom. Electr. Power Syst. 2023, 47, 105–114. [Google Scholar]
- Jin, Y.; Lu, Q.; Wang, Y.; Chang, S.; Chen, H.; Hu, L. Research on PV fault diagnosis model based on cascaded random forest. Acta Energ. Solaris Sin. 2021, 42, 358–362. [Google Scholar]
- Office, P.F. Erratum: Improving parameters estimation of fuel cell using honey badger optimization algorithm. Front. Energy Res. 2022, 10, 875332. [Google Scholar]
- Zhu, X.; Hu, Y.; Yu, Y.; Zeng, D.; Yang, J.; Carbone, G. Research on online optimization scheme and deployment of PMSM control parameters based on honey badger algorithm. Sci. Rep. 2024, 14, 26670. [Google Scholar] [CrossRef]
- Chen, Z.; Chen, Y.; Wu, L.; Cheng, S.; Lin, P. Deep residual network based fault detection and diagnosis of photovoltaic arrays using current-voltage curves and ambient conditions. Energy Convers. Manag. 2019, 198, 111793. [Google Scholar] [CrossRef]
- Mordedzi, B. Bases of power, leadership styles, and demographic profiles of undergraduate business students in Ghana. Int. J. Manag. Soc. Sci. 2015, 3, 1–13. [Google Scholar]
- Zhu, H.; Shi, Y.; Wang, H.; Lu, L. New feature extraction method for photovoltaic array output time series and its application in fault diagnosis. IEEE J. Photovolt. 2020, 10, 1133–1141. [Google Scholar] [CrossRef]
- Zhang, M.; Han, Y.; Wang, C.; Yang, P.; Wang, C.; Zalhaf, A.S. Ultra-short-term photovoltaic power prediction based on similar day clustering and temporal convolutional network with bidirectional long short-term memory model: A case study using DKASC data. Appl. Energy 2024, 375, 124085. [Google Scholar] [CrossRef]
- Pan, M.; Fu, C.; Cao, X.; Guan, W.; Liang, L.; Li, D.; Gu, J.; Tan, D.; Zhang, Z.; Man, X.; et al. An energy management strategy for fuel cell hybrid electric vehicle based on HHO-BiLSTM-TCN-self attention speed prediction. Energy 2024, 307, 132734. [Google Scholar] [CrossRef]
| Disclaimer/Publisher’s Note: The statements, opinions and data contained in all publications are solely those of the individual author(s) and contributor(s) and not of MDPI and/or the editor(s). MDPI and/or the editor(s) disclaim responsibility for any injury to people or property resulting from any ideas, methods, instructions or products referred to in the content. |
© 2025 by the authors. Licensee MDPI, Basel, Switzerland. This article is an open access article distributed under the terms and conditions of the Creative Commons Attribution (CC BY) license (https://creativecommons.org/licenses/by/4.0/).
