Abstract
This article presents findings from ongoing research on improving the efficiency of leaching salt caverns for brine production and creating storage spaces for gases or fuels. Previous studies of the authors highlighted the potential of modifying conventional technology by employing a high-pressure water jet to carve niches in salt rock. Current research aims to define precise niche parameters using innovative and enhanced Jet Cavern Technology (JCT). Our research identified improvements in leach efficiency across various configurations and quantities of niches. By analyzing three salt types—pink, spiz, and crystalline—it was demonstrated that creating a niche perpendicular to the well axis significantly reduces the time to achieve saturated brine by approximately 38%, particularly during the initial construction phase. Further adjustments in niche dimensions, spacing, or spatial positioning can improve cavern construction rates by up to 20% over standard methods. This study quantified the correlation between the advancement of the process and the rate of increase in the salt content in the brine. Accelerated brine saturation facilitates cavern construction and mitigates environmental concerns associated with the discharge of unsaturated brine. The adoption of this new technology is crucial for the expansion of renewable energy sources and the associated storage requirements.
1. Introduction
1.1. Large-Scale Energy Storage
Salt caverns present significant opportunities for large-scale energy storage, demonstrating proven efficiency across diverse applications. Nevertheless, it is imperative to meticulously address challenges, including environmental impacts, technical constraints, and safety considerations, to guarantee the efficient and secure utilization of salt caverns for energy storage purposes. Salt caverns are utilized for the storage of oil, while natural gas, hydrogen, and compressed air are predominantly stored in depleted gas reservoirs, salt caverns, and aquifers [1,2]. It is anticipated to play an increasingly critical role in the storage of various types of energy by the rising development of renewable energy and the goals of climate neutrality [3]. Among the various underground structures available, salt caverns are regarded as the most favorable option for energy storage, especially for gas, hydrogen, and compressed air [4,5]. This preference is attributed to their superior tightness and stability, minimizing cushion gas requirements, and enhanced operational flexibility. As the need for peak-shaving in renewable energy increases alongside the goals of carbon neutrality, salt caverns are anticipated to become increasingly vital for compressed air energy storage (CAES), large-scale hydrogen storage, and temporary carbon dioxide storage [6]. Some large-scale energy storage facilities include various schemes of underground reservoirs/structures, including salt caverns [7,8,9]. Accordingly, salt caverns usually have better mechanical stability and air tightness than other underground spaces. In addition, salt rock has little chemical reaction with other substances [10]. As a result, salt caverns have historically been used for many types of energy storage, including oil, petroleum products, natural gas, compressed air, carbon dioxide, and hydrogen [11]. The construction of salt caverns for energy storage should prioritize the maximization of salt layer utilization, enhancement of construction efficiency, and safety assurance. Furthermore, abandoned salt caverns from mining operations can be repurposed in conjunction with energy storage power stations to facilitate zero-carbon energy storage conversion, thereby promoting the sustainable utilization of previously disturbed environments [6,12]. Economic factors emphasize the critical need for advanced large-scale storage technologies, including the conversion of surplus energy into compressed air or hydrogen for subterranean storage, to effectively reconcile energy consumption with the variable output of renewable energy systems [1]. Effective brine management is imperative, especially in regions with limited disposal alternatives, and advancements in disposal techniques, such as deep aquifer injection, are instrumental in minimizing environmental impacts [13,14,15,16]. The biography provides specific numbers indicating the amount of energy stored depending on the type of gas or fuel. Compressed air energy storage (CAES) can store significant energy, with the Cheshire Basin potentially holding 2.53 TWh across 100 plants. Efficiency varies, with reported round-trip efficiencies between 54% and 72.3% [17,18]. Hydrogen storage in salt caverns shows promise, particularly in Western Australia, where 28,282 caverns could store about 14,697 PJ. In Germany, capacity ranges from 0 to 67 TWh, averaging 36.6 TWh. Challenges include hydrogen loss and leakage prevention [19,20,21]. Overall, salt caverns provide a robust solution for large-scale energy storage, which is essential for energy security and the transition to renewables, though they face geological and operational challenges [6].
Many critical criteria need to be addressed in order to implement responsible use of proper underground storage site facilities: geological, geothermal, geohazards, hydrodynamic, basin maturity, economic, societal, and environmental [22]. The idea and some risks of standard leaching technology are well developed in the literature [23,24,25,26,27,28].
To sum up, it should be stated that despite the relative abundance of articles on energy storage, there is a clear deficit of publications discussing the basic and very important issue of the technology of constructing underground storage chambers. The issues raised and published are focused primarily on the general issues of storing various energy sources in the context of environmental protection, interactions of stored products, safety, risk minimization, and economic efficiency. The special role of salt deposits is emphasized as the best location for storage caverns, next to depleted gas reservoirs and aquifers. The original results of the next stage of research on the innovative technology for the construction of salt caverns, presented below, at least partially fill the gap in this area, creating an increasing opportunity for both users and contractors to complement the results.
1.2. Standard Salt Cavern Leaching Technology and Its Modification with the JCT Method
The salt leaching method from the well is commonly used both for salt production and for the construction of underground storage caverns. This technology involves pumping the leaching medium (water) into the well, which causes the rock salt to dissolve, thus creating a void called a cavern. The salt dissolved in water turns into brine and is discharged into water reservoirs or sent for use by industrial chemical plants. Some results show [29] that under basically the same solution mining rate, the energy consumption of brine injection can decrease by 18.82%. If 0.49% of the solution extraction rate of the salt cavern can be sacrificed, energy consumption can be reduced by 7.40%.
One of the most important advantages of underground hydrogen or hydrocarbon storage facilities located in salt deposits is their enormous capacity (0.5 million m3/cavern available for use), which in practice requires a relatively long construction time (2 years or more) using the leaching/dissolving technique of the deposit accessed only by drilling. Therefore, increasing the leaching rate becomes very important for both the efficiency of the engineering process and the faster acquisition of new capacities for energy storage. One of the key parameters describing the leaching process of chambers is the concentration of the resulting brine and the maximum utilization of the salt deposit.
The standard technology of making caverns in a salt deposit begins with drilling a well reaching, for example, 1000 to 2000 m below the ground surface. Leaching begins at the deepest section of the well, when the contact area of the solvent (water and then brine) is very small and applies only to the internal, vertical surface of the well. Engineering practice and Equation (8) quoted in this article show that much faster leaching and, thus, faster extraction of saturated brine occurs when the solvent is in contact primarily with the horizontal surface of the bed, which does not exist in the standard solution in the first stage.
The main assumption of the modification of this technology is to increase the leaching surface area by creating niches on the side of the well just before the actual leaching begins. The method of creating niches in the rock salt deposit is based on the use of water jet cutting technology and is patented [30].
The innovative solution analyzed in this article consists in enabling access to the horizontal surface from the very beginning of the cavern construction process through quick (1–2 days) niche cutting (mechanical) with a high-pressure water jet (JCT), and only then the main leaching takes place, which leads to a more favorable and regular shape of the cavern. Therefore, JCT fulfills its role only at the stage of niche construction using the energy of a high-pressure water stream, and the details of the technology and its advantages are described in earlier articles by the authors [31,32].
Creating niches involves inserting a properly prepared set of drill strings into the well, equipped with a set of high-pressure nozzles enabling the creation of a stream of liquid with sufficiently high pressure, thanks to which it will be possible to cut niches perpendicular to the axis of the well. By rotating the drill string or the nozzles, the niches will have the shape of disks, the center of which will be the axis of the borehole. Once such niches have been created, leaching technologies are continued in a standard manner [33].
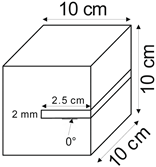
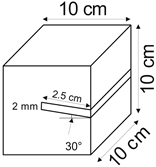
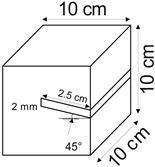
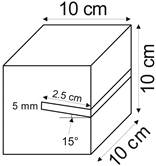
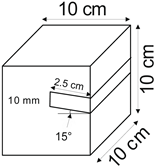
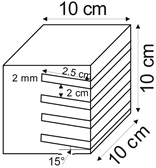
The proposed technology, hereinafter referred to as Jet Cavern Technology, Figure 1, consists of the following operations:
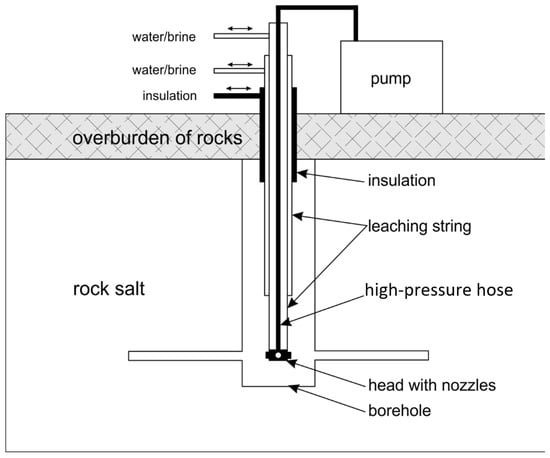
Figure 1.
Idea of cutting a niche in the wall of the well.
- Drilling a well;
- Lowering the drill string to the planned depth of the niche;
- Putting the cutting head in rotation;
- Starting the cutting stream;
- Cutting out a niche to meet the geometric parameters assumed in the design;
- Stopping the stream, pulling the drill string to the position of the next niche (in the case of making multiple niches);
- Repeating the cutting operation of the niche until the number of niches assumed in the project is completed;
- Pulling out the drill string;
- Lowering or relocation of leach pipes;
- Starting of standard cavern leaching.
The main difference between the standard cavern leaching technology and JCT is that the niches created create an additional surface of contact between water and the salt deposit, much larger than the surface area of the borehole side available at this stage of the technology. Such a significant increase in the area of the leached surface, especially in the roof part, which is usually leached faster than the side surface, will significantly increase the leaching progress of the salt cavern and, therefore, efficiency.
To implement Jet Cavern Technology, the following technical solutions are necessary:
- A set of nozzles for making niches (number, spacing, diameter, material, structure);
- The head on which the nozzles will be mounted and their connection to the leach pipes or drill string (material, structure, connection, strength parameters);
- A method to transfer the high pressure of leaching water (approximately from 100 to 300 MPa) from a pump located on the surface to a well at a depth of 300 to 1800 m through an appropriate drill string (material, structure, strength parameters);
- A method of connecting the drill string to the head (construction, strength parameters);
- Putting the head into rotation (construction).
According to the first experimental results of cutting the niche with high-pressure water jet [32], three key conclusions were drawn regarding the feasibility, role, and effectiveness of the niche in the leaching process:
- A stream of water, directed at an appropriate pressure value, effectively cuts a niche in the different salt rocks and potentially in the well in the salt deposit;
- Under technical conditions, a high-pressure water stream flowing in a water environment (brine with increasing concentration) loses some of its energy, weakening the rate of niche formation;
- When cutting salt rocks, in addition to the dissolution process, larger grains of structural samples (salt, anhydrite, etc.) are extracted, which may even support the niche-cutting process.
This article mainly concerns the next stage of development of the innovative technology called JCT (Jet Cavern Technology), whose new idea is based on an additional construction element, i.e., the niche, which may be cut perpendicularly to the well axis in the salt rock mass around the axis. The niche can effectively improve the rate of the construction of the salt cavern and the brine saturation created during the solution process. The final effectiveness of the new technology strongly depends on the niche parameters: heights, length, inclination, and location along the well (in case more than one niche is applied), which have been tested for different types of salt rock samples. The results obtained in laboratory tests meet the technological requirements at the TRL 4 and will be verified during the next industrial experiments.
2. Effectiveness of the Salt Leaching Process
2.1. Leaching Rate
The leaching rate (ω), understood as the speed at which the leached front moves deep into the salt wall, depends on the following [26,34,35,36]:
- Concentrations of the leaching medium;
- The angle of inclination of the leached salt wall;
- Temperatures of the leaching medium;
- A type of leached salt rock.
Since the second half of the 20th century, work has been carried out on the rate of leaching of salt rocks, and in particular on the influence of the above-mentioned parameters. The research conducted allowed us to describe the influence of the concentration of the leaching medium, the angle of inclination, and the temperature of the leaching medium relatively well using mathematical formulas. The variability of salt rocks, even within one layer, means that the influence of the salt type on the leaching rate should be empirically checked under laboratory conditions. Such laboratory tests include the determination of leaching coefficients (top and side) under static conditions (no water flow in the tested sample).
The rate of leaching with clean water is defined as the leaching coefficient (k) and is determined in the laboratory according to the following formula:
where
k = ∆V/S∆t = ∆M/(ρS∆t), in [m/s] or [mm/h]
V—loss of volume [m3];
M—loss of mass [kg];
T—leaching period [s];
S—area of leached surface [m2];
ρ—salt density [kg/m3].
The value of the coefficient (k) depends on the angle of inclination of the salt wall, so in practice, its determination comes down to measuring its value for the vertical wall (side leaching) and the horizontal wall (roof leaching). The angle of inclination of the salt wall is determined relative to the horizontal one and is as follows:
0°—for the flat bottom of the cavern;
90°—for the vertical wallside of the cavern;
180°—for the flat roof of the cavern.
The mechanism of roof leaching is assumed to be different from that of side leaching, and at intermediate angles, both mechanisms contribute. In roof leaching, the entire available surface has equal contact with the leaching medium, which makes the process uniform, where dissolved salt and insoluble parts fall to the bottom by gravity. During side leaching, the salt dissolved in the upper part of the leached surface flows down, reducing the effectiveness of salt dissolution (the lower part of the surface practically does not leach). To fully determine the leaching rate, the value of the limiting angle of inclination is also determined, below which the insoluble parts settle on the wall, preventing the brine from mixing and thus blocking further dissolution of the wall.
2.2. Basic Kinetic and Diffusion Solution Formulas
There are various formulas that describe the rate of the leaching process. According to kinetic theory, the rate of salt ions passing from the crystalline form to the solution depends on the unsaturation of the solution and the properties of the dissolved rock, but does not depend on the angle of inclination of the dissolved surface [36].
where
j—flow rate of the dissolved mass [kg/m2h];
K—kinetic constant [m/s];
CN—saturation concentration [kg/m3];
Ca—concentration of saturation on the leached surface [kg/m3].
Laboratory studies have clearly shown the influence of the angle of inclination of the leached surface. This has led to the development of a theory according to which chemical kinetics is so fast that a layer of saturated solution is formed at the dissolving surface and the dissolution rate depends on the speed at which the dissolved ions pass through this layer of saturated solution due to diffusion. The dissolution rate, taking into account the diffusion process, is described by the following Nernst–Brunner (or Noyes–Whitney) formula:
where
j = D/δ (CN − Ca)
j—flow rate of dissolved mass [kg/m2h];
D—diffusion constant [m2/s];
δ—thickness of diffusion layer [m];
CN—concentration of saturation [kg/m3];
Ca—concentration of solution outside the diffusion layer [kg/m3].
According to the diffusion theory, the dissolution rate should not depend on the type of salt but should be the same for all rock salts. In reality, however, this relationship is observed, despite the fact that studies have shown that the dissolution kinematics are not that fast [36]. In summary, the leaching rate is influenced by both the dissolution kinetics and diffusion through the turbulent boundary layer.
The leaching rate according to [34,35] is expressed as a function of concentration, diffusion, viscosity, and height of the dissolving surface. It does not take into account the dependence on salt type or temperature, according to the following modified formula:
where
j—average dissolved mass flow rate [g/cm2s];
D—diffusion constant [cm2/s];
v—kinematic viscosity of solution [cm2/s];
Ψ—inclination angle;
Z—height of dissolved surface [cm];
CN—concentration of saturation [mole/liter];
C—concentration of solution saturation [mole/liter].
The leaching rate with an empirical formula taking into account the temperature and density of the medium is described also with the following formula [35]:
where
a—empirical coefficient = 0.02925;
b—empirical index = 1.3;
T—temperature [°F];
T0—reference temperature [75 °F];
Ρ—brine density [g/cm3];
ρN—density of saturated brine [g/cm3] = 1.2019 [g/cm3];
ρw—density of water [g/cm3] = 1.0000 [g/cm3];
ω0—leaching rate in reference temperature [cm/s].
Based on the results of leaching tests, the following formula was developed for the relationship between the leaching rate depending on the concentration of the leaching medium, the angle of inclination of the salt wallside, and the temperature [37]:
After taking into account that
α = 1.5,
β = 0.0262,
and
T0 = 20 °C,
and transforming the formula, we obtain the following relationship:
where
ω—leaching rate at reference temperature [mm/h];
α—exponent from the interval <1.2>;
β—temperature coefficient [1/°C];
T—temperature of the dissolving medium [°C];
T0—reference temperature [°C];
k(Ψ)—leaching rate coefficient depending on the angle of inclination of the leached surface [mm/h];
CN—concentration of saturation [kg/m3];
C—concentration of solution [kg/m3];
kh, kv—leaching coefficient in horizontal and vertical directions [mm/h].
The relationships presented above show that the leaching rate depends on the concentration, angle of inclination, temperature, and type of salt, both in the kinetic and diffusion theory. Although, for obvious reasons, the results of the leaching rate calculations based on the discussed formulas are not fully consistent, they clearly indicate those factors that play the most important role.
2.3. Leaching Progress
An important property of the leaching process that enables comparative analyses is the leaching progress, which is often incorrectly used interchangeably with the leaching rate. The leaching rate is a constant value and has a velocity dimension; in practice, it is given in [mm/h], another property of salt that determines leaching is the mass leaching rate described by the following formula:
where
∆M—loss of mass;
∆t—leaching time.
Or, when related to the unit area of the leached surface, we obtain a constant mass coefficient km, for the purposes of this work called the leaching progress, as follows:
where S is the area of the leaching surface.
The leaching progress (km) depends on:
- Leaching rate,
- Type of leached salt,
- Size of leached surface area.
In modern salt mining, the roof (kv) and side (kh) leaching coefficients are most often used to describe the parameters of the salt deposit because they are characteristic of a given salt type and are sufficient for calculations and simulations of the leaching process.
For a comparative analysis of the influence of niches on the leaching process, the leaching rate and the mass coefficient km (leaching progress), which depends mainly on the leached surface area, were used.
3. Laboratory Experiments on the Influence of Niche Parameters on Leaching Efficiency
Studies of the leaching process of salt rocks have been conducted since the middle of the last century, but they focus primarily on determining the influence of the concentration of the leaching medium, the angle of the leached surface, the temperature, or the type of salt on the efficiency of the standard leaching process. A detailed review of the theories functioning in the world regarding the leaching process is presented in many scientific publications [36].
The results of our research on the influence of various parameters of a specially made niche, its configuration, and the size of the contact surface area of the leaching agent with the salt-leached surface on the efficiency of the leaching process are discussed below. For analogous conditions and types of salt, the effects of leaching were compared according to the standard, commonly used worldwide technology with the proposed modification, hereinafter referred to as the Jet Cavern Technology (JCT), in which an additional contact surface of the leaching medium with the salt rock is obtained [30,32].
3.1. Macroscopic Characterization of Salt Rock Samples Used for the Leaching Tests
Due to the frequent diversity of salt types and properties in the lithological profile of potential caverns, three different types of rock salt were used for laboratory tests, Figure 2: pink, crystal, and spiz salt (green), collected from deposits in the Kłodawa Mine (pink) and Wieliczka Mine (crystal and spiz).
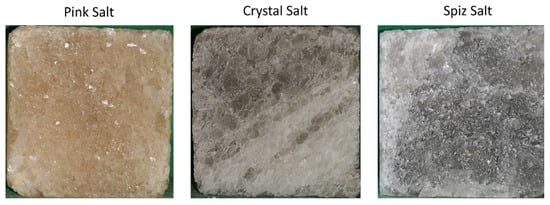
Figure 2.
Types of salt samples tested in the laboratory.
In the tests, pink salt is a salt with relatively favorable parameters for the construction of storage caverns, i.e., homogeneous, fine-crystalline salt with a high NaCl content and a small number of impurities. Spiz and crystal salt allow for determining the effect of crystal structure on the process of niche leaching.
Pink salt has a fine, medium, and coarse-crystalline structure, which is attributed to its iron content. It is characterized by a high NaCl content. Fine- and medium-grained salts have small amounts of impurities, mainly anhydrite sand. Coarse-grained salts are intergrown with anhydrite and clay substance inserts and fine-grained salt laminae. The prepared cubic samples with an edge of 10 cm had a compact, fine and coarse-crystalline structure, with crystals of 1 mm to several millimeters in size, with a small amount of clay substance in the form of anhydrite sand. Anhydrite laminae were present in the salt rock sample.
Crystal salt is large-crystalline with intergrowths of laminated claystone with anhydrite [38]. It is characterized by a very high NaCl content (even over 99%) and high purity, contaminated mainly with anhydrite sand. The structure of the sample is compact, coarsely crystalline, with crystals up to a dozen or so millimeters in size, with a small amount of clay substance in the form of anhydrite sand, with lamination of white, fine-grained salt.
Spiz salt (green) is a laminated, coarse-crystalline, and interbedded mineral salt interbedded with several centimeter-thick inserts of fine-grained white salt. It is characterized by a high NaCl content (approx. 95% on average) and occurs in the form of isolated lumps, which create lenticular deposits with a thickness of approx. 20 m [38]. The prepared samples were gray, compact, medium- and coarse-crystalline, with crystals of a few micrometers in size and a small amount of clay substance and anhydrite sand.
3.2. Preparation of Salt Samples for Leaching
Selected cubic samples of each type of salt described above were divided into the following two groups:
- Reference samples, reflecting leaching parameters according to standard technology;
- Modified samples, with niches made according to the idea of leaching using the new technology.
Before leaching the reference samples, six of each type of salt, the following measurements were performed to determine the following characteristics and parameters of the samples:
- Accurate, real geometric dimensions;
- The mass of each sample with an accuracy of 0.1 g;
- Scan and photographs of all surfaces of each sample;
- In each sample, the walls intended for leaching were isolated by isolating the remaining walls (not intended for leaching) with wax.
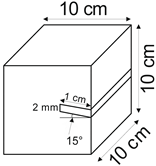
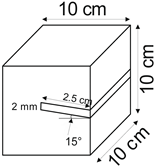
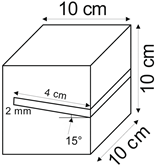
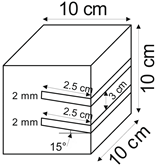
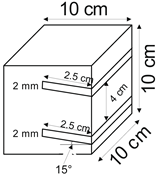
A similar preparatory process was involved with modified samples, but in this case, 42 cubic samples were made from blocks of each type of salt. Moreover, on one of the surfaces of each modified sample, niches with different heights, ranges, angles of inclination, spacing, and numbers were made.
All samples were qualified for testing, although in two samples (no. 27 and 30), the majority was anhydrite and not rock salt, which can be used to determine the impact of this factor on mining practice.
3.3. Laboratory Stand for Leaching Tests
A test stand was built to test the rate and progress of leaching of individual samples in laboratory conditions, Figure 3.
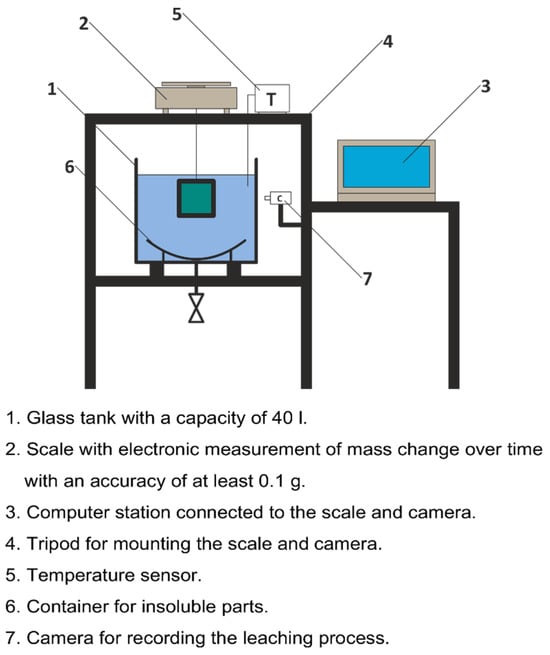
Figure 3.
Laboratory stand for test leaching.
The sample, suspended under the scale on a rigid holder, is immersed in a container with water at a temperature of 20 °C and a volume of 40 L. The leaching process takes 3 h. Comparing the mass of the sample before immersing it in water and after the specified leaching period allows for the determination of specific leaching parameters expressed by the following:
- Progress of leaching;
- Rate of leaching;
- Salt density;
- Number of insoluble parts.
The test cycle of each sample involves allowing the leaching process for a specified period of time. Initial tests were carried out in 3 h cycles, but during the tests, it turned out that this time was too long because pitting and leaching, resulting from the heterogeneity of the salt structure (falling out of larger grains and a significant immediate loss of mass), reached too large sizes in a short time, disturbing the ability to isolate the impact of leaching and making it impossible to perform a comparative analysis. Therefore, after 36 tests, the leaching period was shortened to 1 h.
After reaching the fixed leaching time, the sample was removed from the tank, and the following process was followed:
- The leached surface was photographed;
- The mass of the sample was determined and dried for at least 24 h;
- Additionally, insoluble parts were collected and dried at 50 °C for 3 h;
- The dry sample and insoluble parts were weighed with an accuracy of 0.1 g;
- The wax was removed from the sample, and the sample was weighed again;
- The samples were photographed again.
Forty-eight samples were made from one block of a specific type of salt. For each type of salt, a reference series was prepared consisting of six samples and 14 series, three samples each with different parameters of the niches, including range (depth), angle of inclination, height, number of niches, and spacing (distance between niches), Table 1.

Table 1.
Parameters of the samples tested in the laboratory.
In the case of modified salt rock samples with niches, it is assumed that leaching will occur on the side surface of the sample and on the ceiling (roof) and side surfaces of the niches. The floor surfaces of the niches will not be leached.
3.4. Procedure of Leaching Tests of Modified Samples with Various Niche Configurations
After controlled leaching of salt samples fully immersed in water, the following basic process parameters were determined:
- Bulk density of rock salt (before leaching), ρs [kg/m3];
- Value of insoluble parts, Vi [%];
- Leaching progress, Lp [g/(h·cm2)];
- Leaching rate, Lr [mm/h].
For a detailed comparative analysis of the impact of niches on the leaching process, appropriately prepared laboratory samples were selected, taking into account the individually determined salt density, the number of insoluble parts, and the macroscopic evaluation of samples after leaching.
3.4.1. Quality and Selection of the Laboratory Samples for Testing
The main rock formation mineral in leached rock salt samples is halite, with a bulk density of 2168 [kg/m3]. Each rock salt contains admixtures, which may be accessory minerals or non-salt minerals, most often clay minerals [26]. For this reason, samples whose density would not be in the range of 2060–2276 [kg/m3] or the number of insoluble parts would be greater than 5% were assumed not to be included in the comparative analysis. According to these criteria, samples no. 27 and 30 were not included.
3.4.2. Macroscopic Assessment of Samples After Leaching
After leaching, all surface samples were subjected to macroscopic assessment. Samples that had defects, chipped grains, cracks, or depressions, Figure 4, which disturbed the uniform movement of the surface in the direction perpendicular to it during leaching, were rejected.
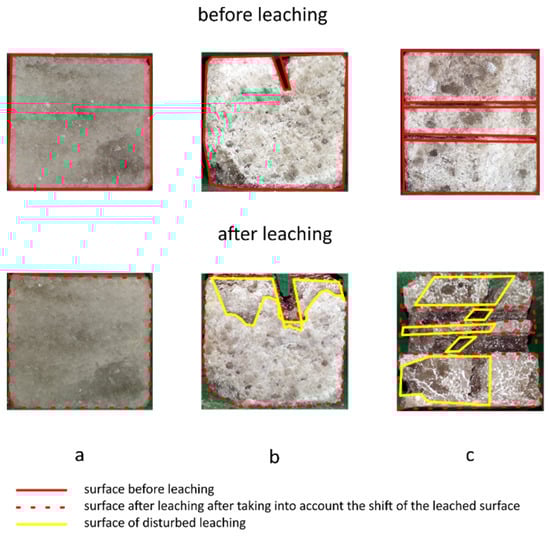
Figure 4.
Examples of macroscopic evaluation of salt samples: (a) 3 pt., (b) 2 pt., and (c) 1 pt.
The remaining surfaces did not have to meet the same requirements as the leached surfaces because they were protected with wax.
For samples with intact structure, that is, without cracks, fissures, or interlayers of other rocks (e.g., anhydrite), the leached surface and other surfaces should retain the same shape, Figure 4a, and the size minus the shift of the leached plane. All shape deviations found after the end of leaching and removal of wax from all surfaces of the samples, i.e., pits, transverse leaching, leaching, Figure 4b,c, resulting from leaks in the wax insulation, etc., were taken into account and assessed according to the following developed point scale:
- 0 pt.—leaching and pitting cover over 50% of the remaining sample surface;
- 1 pt.—leaching and pitting cover from 25% to 50% of the remaining sample surface;
- 2 pt.—leaching and pitting cover less than 25% of the remaining sample surface;
- 3 pt.—no visible leaching, pitting, etc.
Based on the above scale, the suitability of the sample for further analyses was determined due to its homogeneity of structure.
3.4.3. Criteria for the Suitability of the Sample for Analysis After the Leaching Process
The following criteria were introduced to classify the condition of the sample after leaching:
- Perfect sample—a sample with no pitting or leaching on any of its surfaces. The sum of the points for all sample surfaces is 18. The leaching results of these tests can be used to perform further analyses.
- Representative sample—a sample where pitting and leaching do not exceed 25% for all surfaces. The sum of points for all sample surfaces is in the range of 14–17. The leaching results of these tests can be used to perform further analyses.
- Insufficient sample—a sample where pitting and leaching do not fall within the range of 25–50% for all planes. The sum of points for all sample surfaces is in the range of 6–13. The leaching results of these tests cannot be used for further analysis.
- Damaged sample—a sample where, during leaching, the pitting and leaching exceeded 50% for all surfaces and thus resulted in the destruction of the sample. The sum of the points for all sample surfaces is less than five. The leaching results of these tests cannot be used for further analysis. According to the above criteria, 12 samples were eliminated.
3.4.4. Rejected Test Samples
Based on the classification of samples, after leaching tests of 144 samples, 130 samples were qualified for comparative analysis, which constitutes 90% of the research material. Samples for a given type of salt were made from one block of salt to ensure homogeneous research material. The following samples that differed significantly from the rest were eliminated from the research series:
- For pink salt, samples 3 and 46 were characterized by a very large mass loss, almost 20% greater than the other samples, and sample 48 had a very high density;
- For crystal salt, sample 49 was characterized by the largest weight loss, which was caused by a crack in the leached surface, while sample 50 had the smallest weight loss;
- For spiz salt, sample 99 was characterized by the largest mass loss, while sample 97 had the smallest mass loss.
Table 2 shows the basic leaching effects of the tested salt samples.
Table 2.
Basic leaching effects of the tested salt samples.
4. Leaching Rate and Progress Analysis for Standard Samples and with Niches
In standard technology, the leaching rate is determined depending on the angle of inclination of the leached surface. In this case, to determine the leaching coefficient, tests are performed for the vertical position of the surface (roof leaching) and horizontal position (side leaching), Figure 5a,b, where the positions of the samples and the directions of movement of the leached surfaces are shown.
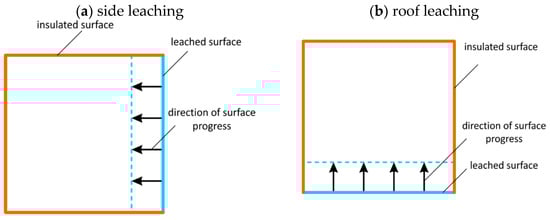
Figure 5.
Sample position and progress direction of the surfaces in the case of side (a) and roof leaching (b).
In the initial phase of standard well leaching, only the side walls of the well are leached.
Creating niches in the side of the well significantly changes the course of the leaching process, which means that side leaching turns into roof-side leaching. The side of the opening and the side surface of the niche will be leached in the horizontal system, while the roof surface of the niche will be leached in the vertical system. The bottom of the niche will not leach at all, Figure 6.
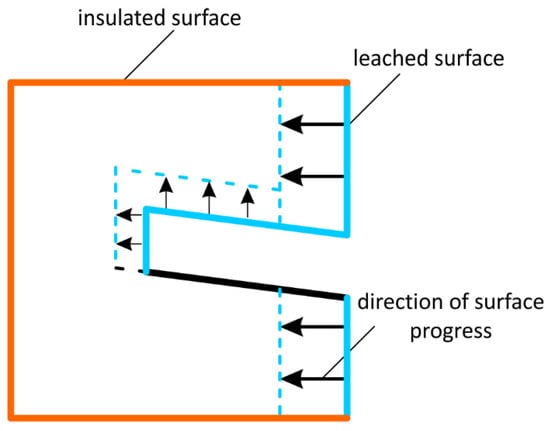
Figure 6.
Sample position and progress directions of the surfaces in the case of leaching of the samples with the niches.
The leaching rates of samples with niches determined in laboratory tests are the result of the side and roof leaching coefficients. The higher the leaching rate than that determined for the reference series, the greater the impact a given parameter has on the leaching of the roof. This influence quantitatively determines the progress of leaching and mass loss (the leaching time and leaching area of the samples are similar).
The analysis of individual factors that influence the leaching effect is presented in the following chapters.
4.1. Influence of Niche Parameters on Leaching Efficiency
4.1.1. Niche Range
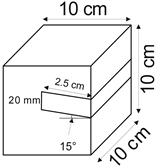
The influence of niche extent on the leaching process was determined for the following values: 10 mm, 25 mm, and 40 mm.
The loss of salt in subsequent leached series (expressed in salt content in brine, Sc [g]) of samples for all types of salt is greater compared to the reference series, Table 3, Figure 7. However, after taking into account the rate and progress of leaching, only the pink salt and spiz salt have values greater than the reference series, Figure 8. Series II and III of crystal salts have leaching progress and a rate similar to the reference series, indicating a lack of leaching of the ceiling surface of the niches due to the presence of air in the niches.
Table 3.
Results of basic leaching parameters in relation to the range of niches.
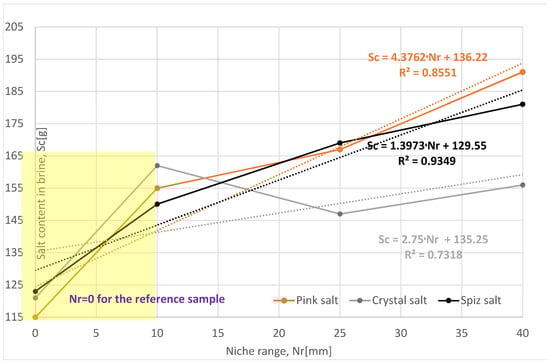
Figure 7.
Change in salt content in brine depending on the range of the niche. The dotted trend lines on the chart are described by equations. Immediate niche effect marked with yellow box.
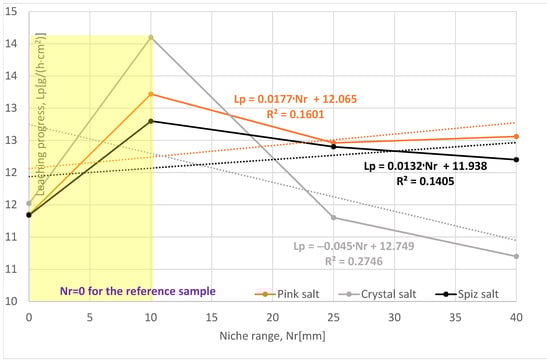
Figure 8.
Change in leaching progress depending on the range of the niche. The dotted trend lines on the chart are described by equations. Immediate niche effect marked with yellow box.
For pink and spiz salt, we observed an increase in the average salt loss in subsequent series, with almost the same leaching rate. When comparing leaching progress in individual series, it should be stated that the greatest is for the series with the smallest reach of 10 mm. This situation is caused, as in the case of crystal salt, by the presence of air in the niche, which blocks the possibility of leaching of the ceiling surface, and this phenomenon is more intense the larger the range of the niche.
Of all the series examined, the most representative is Series I, with a range of 10 mm, where all three analyzed parameters have similar values. Compared to the reference series, the leaching progress is greater, as follows:
- For pink salt by 16%;
- For crystal salt by 22%;
- For spiz salt by 13%.
To sum up, it should be stated that a larger range of niches has a positive effect on the leaching process; unfortunately, in laboratory conditions, due to the presence of air in the niches, the results for Series II and III are underestimated. In fact, during the leaching of the cavern, due to the pressure and turbulent flow in the niche, there is no possibility for the air to have any effect on the leaching process.
4.1.2. Angle of Inclination of the Niche
The influence of the niche inclination angle on the leaching process was determined for the following values: 0°, 15°, 30°, and 45°.
The salt loss in the subsequent leached series of samples for all types of salt is greater compared to the reference series, Table 4, Figure 9. The results obtained from the salt loss measurements do not show a clear relationship, mainly due to the severely damaged structure of the samples (especially the Series IV and VI crystal salt) and the presence of air in the niche during leaching.
Table 4.
Results of basic leaching parameters in relation to the angle of the niches.
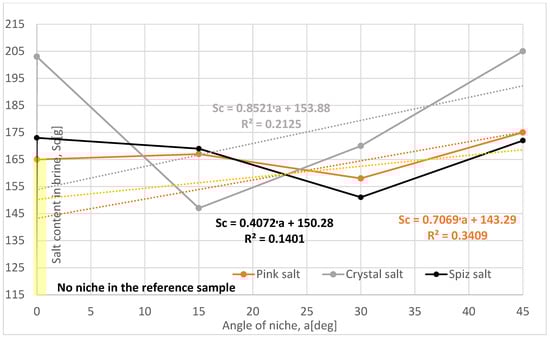
Figure 9.
Change in salt content in brine depending on the angle of the niche. The dotted trend lines on the chart are described by equations. Immediate niche effect marked with yellow box.
The leaching rate and progress for pink and spiz salt have values higher than the reference series, Figure 10. The change in the leaching rate between the series and the types of these two salts is not significant, especially considering that as many as three samples of pink salt were not included in the analysis due to the low macroscopic evaluation after leaching and the spiz salt samples contained air in the niche. This allows us to conclude that the results of Series II and IV are probably underestimated.
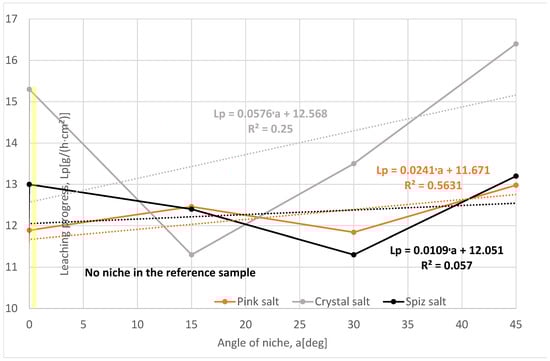
Figure 10.
Change in leaching progress depending on the angle of the niches. The dotted trend lines on the chart are described by equations. Immediate niche effect marked with yellow box.
Series IV and VI of crystal salt have the highest leaching rates, but this is due to the damaged structure of the samples, while Series II of this salt has the lowest leaching rate, even lower than the reference series, which proves the lack of leaching of the ceiling surface of the niche due to the presence of air in the niches.
Upon comparing the progress of leaching in individual series, it should be stated that it is the largest for the series with the highest angle of inclination of the niche of 45°. In the case of crystal salt, the highest value of the progress of leaching is derived from the severely damaged structure of the samples and the visible cracks and pits during leaching. In the case of pink and spiz salt, the progress values for the series with smaller angles are underestimated.
As in the case of the analysis of the scope of the niches, the test results were significantly influenced by the presence of air in the niche, which blocked the possibility of leaching of the ceiling surface, and this phenomenon is more intense with increasing angle of inclination of the niche.
In summary, it should be stated that the angle of inclination has a positive effect on the leaching process, but only to a certain extent. This is because by increasing the angle, we reduce the ceiling surface of the niche, and thus, the ratio of the ceiling coefficient to the side coefficient is smaller.
Unfortunately, under laboratory conditions, due to the presence of air in the niches, the results for Series II and V are underestimated. In fact, during the leaching of the cavern, due to the pressure and turbulent flow in the niche, there is no possibility that the air has any effect on the leaching process.
4.1.3. Niche Height
The influence of niche height on the leaching process was determined for the following values: 2 mm, 5 mm, 10 mm, and 20 mm.
The salt loss in the subsequent leached series of samples for all types of salt is greater compared to the reference series, Table 5, Figure 11. From the results obtained, the following relationship can be determined: as the height of the niche increases, the loss of salt increases. Only Series VIII of pink salt and Series VII of spiz salt deviate from this relationship, which is influenced by the presence of air in the niche.
Table 5.
Results of basic leaching parameters in relation to the height of niches.
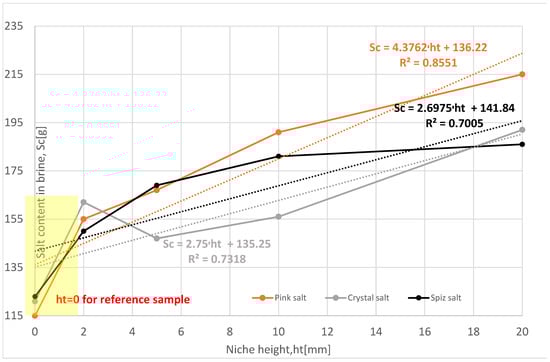
Figure 11.
Change in salt content in brine depending on the height of the niche. The dotted trend lines on the chart are described by equations. Immediate niche effect marked with yellow box.
The leaching rates and progress for all three types of salt have values higher than the reference series, Figure 12. The exception is Series II crystal salt, where the leaching was influenced by the air in the niche.
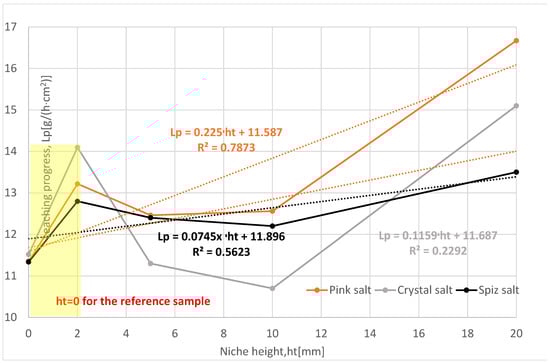
Figure 12.
Change in leaching progress depending on the height of the niches. The dotted trend lines on the chart are described by equations. Immediate niche effect marked with yellow box.
Comparing the leaching progress in individual series, it should be stated that the progress increases with the height of the niche and is greatest for the series with the highest niche height of 20 mm. These results support the assumption that in niches of higher height, leaching will take place faster because the movement of brine in the niche is freer.
In the studies on niche heights, the presence of air in the niche influenced the results to a much lesser extent; this was most visible for the series with the smallest niche heights, i.e., 2 mm.
Of all the series examined, the most representative is Series IX, with a niche height of 20 mm, where the influence of salt structure and complications during leaching (cracking of samples, wax leakage, etc.) is the smallest. Compared to the reference series, the leaching progress is greater, as follows:
- For pink salt by 47%;
- For crystal salt by 31%;
- For spiz salt by 19%.
To sum up, it should be said that the height of the niche significantly affects the leaching process. This is due to the fact that the exchange of water in the niche is significantly facilitated, which does not prevent the brine concentration from increasing in practice, and thus causes a decrease in the rate and progress of leaching.
4.1.4. Niche Count
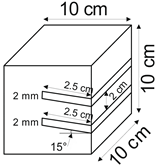
The influence of the number of niches on the leaching process was determined for the following values: one, two, three, and four niches.
The loss of salt in subsequent leached series of samples for all types of salt is much greater compared to the reference series, Table 6, Figure 13. Analyzing the results, it can be concluded that increasing the number of niches significantly increases salt loss, provided that the niches are spaced appropriately from each other.
Table 6.
Results of basic leaching parameters in relation to the niche count.
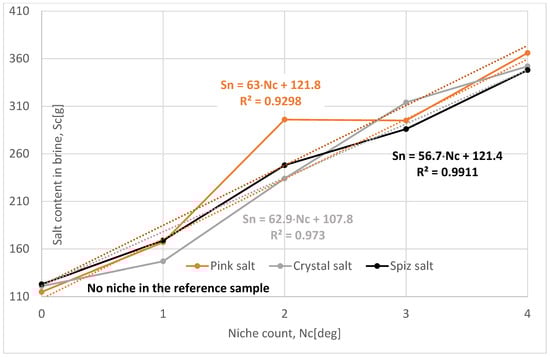
Figure 13.
Change in salt content in brine depending on the niche count. The dotted trend lines on the chart are described by equations.
The leaching rates and progress for all three types of salt have values higher than the reference series, Figure 14. The exception is Series II crystal salt, where the leaching was influenced by the air in the niche. In all series, especially in Series X and XI, the results may be underestimated due to the large number of samples omitted from the analysis due to the macroscopic description after leaching. However, this does not change the fact that increasing the number of niches will significantly increase the speed and progress of leaching.
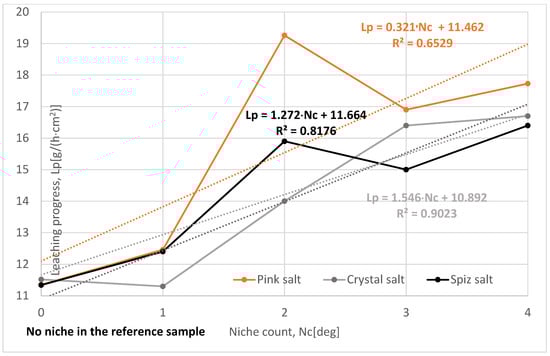
Figure 14.
Change in leaching progress depending on the niche count. The dotted trend lines on the chart are described by equations.
Of all the series examined, the most representative is Series XII—with the number of niches four—where the influence of salt structure and complications during leaching (cracking of samples, wax leakage, etc.) is the smallest. Compared to the reference series, the leaching progress is greater, as follows:
- For pink salt by 56%;
- For crystal salt by 45%;
- For spiz salt by 45%.
To sum up, one can say that the number of niches significantly affects the leaching process, provided that they are not located too close to each other. Connecting niches during leaching will significantly reduce the roof leaching surface, resulting in a smaller ratio of the roof-to-side coefficient and, consequently, a lower leaching speed and progress.
In the case of an increased number of niches, air had no effect on reducing the leaching intensity.
4.1.5. Niche Interval
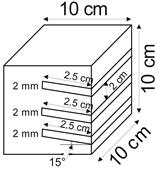
The following niche location intervals were adopted in this research: 0 mm, 20 mm, 30 mm, and 40 mm.
The loss of salt (increase in salt in the brine) in subsequent leached series of samples for all types of salt is greater compared to the reference series, Table 7, Figure 15. The salt loss for Series X, XIII, and XIV is also greater than for Series II. This is due to the fact that only one niche was made in Series II samples.
Table 7.
Results of basic leaching parameters in relation to the niche interval.
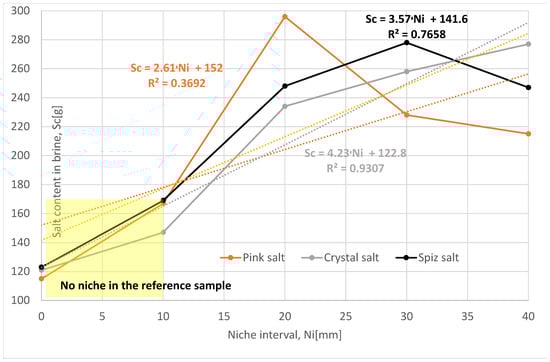
Figure 15.
Change in salt content in brine depending on the interval of niches. The dotted trend lines on the chart are described by equations. Immediate niche effect marked with yellow box.
The rate and progress of leaching for all series with two niches should be similar to each other because, during leaching, the niches did not connect. Spiz salt came closest to this assumption, Figure 16. Pink and crystal salt, and in particular the samples from the X series, differ significantly, which is due to the fact that the samples in this series had a damaged internal structure (cracks, anhydrite layers).
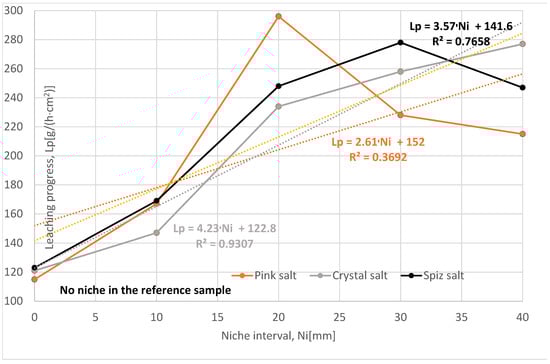
Figure 16.
Change in leaching progress depending on the interval of niches. The dotted trend lines on the chart are described by equations.
Of all the series examined, the most representative is the Series XIV, with a spacing of 40 mm, where the influence of salt structure and complications during leaching (cracking of samples, wax leakage, etc.) is the smallest. Compared to the reference series, the leaching progress is greater, as follows:
- For pink salt by 28%;
- For crystal salt by 54%;
- For spiz salt by 38%.
To sum up, it should be said that the spacing of the niches has a positive effect on the leaching process, provided that they are sufficiently far apart.
5. Discussion of Results
Of the five analyzed niche parameters, i.e., range, angle of inclination, height, number, and spacing of niches, it appears that the parameters that most influence the speed and progress of leaching are the height and range of niche and, to a lesser extent, the angle of inclination. The number and spacing of niches, if properly selected, will significantly improve the leaching process, but if the number of niches is too large or the distance between them is too small, the effect will gradually decrease.
All the series of samples examined to determine the effect of niche range are characterized by a two-stage rate of increase in the salt mass content in the brine (Sc). The first stage (depicted in the yellow box in Figure 7 and Figure 8), i.e., the beginning of leaching of a sample with a single niche with a range of 10 mm shows a clear upsurge of the rate of increase in the Sc value by values from 22% to 35%, Table 3, compared to the reference sample. With the consecutive increase in the niche range, i.e., in the second stages, there is a further increase in the Sc value, but at a slightly reduced rate, reaching increasingly higher values ranging from 47% to 66% compared to the reference sample. The crystal salt sample is not representative due to the formation of an airlock in the niche (as explained earlier in the text).
According to Table 4 and Figure 9 and Figure 10, no clear trend was observed in the changes in the angle of the niche in the increase in salt quantity in the brine and the progress of leaching in relation to height.
The examination results of the impact of the height of niches on salt content in the brine are visible and have a clear ascending trend, Table 5 and Figure 11 and Figure 12.
A larger height of the niche means a greater content of salt in the brine as well as the leaching progress. In the yellow box in Figure 11, one can observe the first increment of 22% to 35% in dependence on the type of salt. Thereafter, there is a consecutive increase in salt content, but rather in an exponential way, with a decreasing rate for higher niches, finally up to ΔSc, achieving values between 51% and 87%.
The maximum number of niches made for research purposes was four, Table 6, Figure 13 and Figure 14. In this case, there is a noticeable constant (almost linear) and high increase in the basic indicators of the leaching process, both ΔS and ΔLp, respectively, from 45% to about 200%, compared to the reference samples.
The effectiveness of salt leaching in the JCT methods depends also on distances between the individual niches along the borehole, according to data in Table 7 and Figure 15 and Figure 16. Higher intervals make the leaching process easier and more effective.
Of the three types of salt used in this study, for all, the rate and progress of leaching for the representative samples were almost identical. Our research shows that it is not the type of salt but its condition that is crucial for the leaching process in a system with niches. As it turned out, crystal salt samples were the most damaged (cracks, interlayers, etc.), which significantly increased the progress and rate of leaching. When the samples were in a similar condition, the differences between individual salts were relatively small.
Figure 17 shows examples of uncontrolled sample leaching, which was the direct reason for modifying the research methodology by shortening the leaching period from three to one hour.
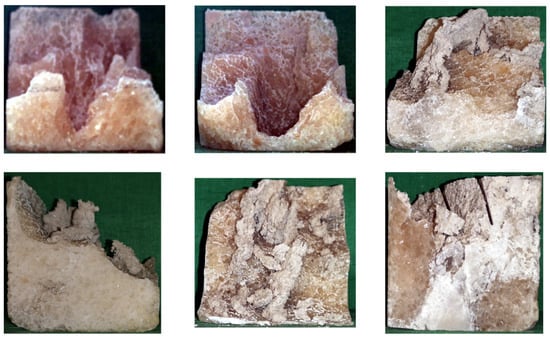
Figure 17.
Examples of results of uncontrolled leaching.
During the cavern leaching process, brine is produced, the concentration of which depends on the amount of injected water, temperature, leaching cycle, size of the leached surface, and type of salt. According to the industry standard [39], the sodium chloride concentration for saturated brine cannot be less than 305 g/dm3 for Zechstein rock salt deposits. Brine with a concentration below the mentioned limit is called semi-brine.
Creating niches causes a faster increase in the concentration of the obtained semi-brine compared to a standard notch. In the first 30 days, the increase is approximately 34% for one niche and 54% for two niches.
The successful results from innovative technology, verified in laboratory conditions, after industrial upscaling in the future, indicate a promising prospect. In thin salt deposits, small-volume caverns with a more advantageous shape of their lower part can be made. As a result, a larger active storage capacity is obtained. This is all the more important because the economy has increasingly switched to renewable energy sources related to, among others, the need to store hydrogen. Work on hydrogen storage technology in salt caverns has been carried out in Poland and around the world for several decades [2,27]. Hydrogen storage caverns can be built in many locations in Poland, but the most promising area is the Baltic region. In this region, there is an extensive salt layer of varying thickness and numerous wind farms. Natural gas storage caverns are located in this seam. Due to the high density of hydrogen storage, such storage caverns can be built as single ones. The use of niche-cutting technology will increase the total volume of the caverns, which, in the case of small storage caverns, will allow for a significant increase in the active storage capacity.
6. Conclusions
The analyzed leaching method, called Jet Cavern Technology (JCT) by the authors, meets the increasing demand for storage space for hydrocarbons or hydrogen related to the intensive development of renewable energy and the need to support it. In this respect, actions are taken to improve the conditions and efficiency of storage techniques.
The performed research confirms the possibility of modifying the previously used technologies for constructing underground caverns by drilling the salt deposit. The proposed JCT method allows both to accelerate the pace of obtaining the designed cavern and obtain its more favorable shape from the point of view of its expected long-term use.
The research carried out, taking into account the geometric parameters and configurations of the niches, shows the following:
- Niches made in each sample tested increased the rate and progress of leaching.
- The height and range of a single niche significantly improve the leaching process. A larger range significantly increases the leachable surface, while in high and sloping niches, there is a better outflow of the resulting brine.
- Increasing the number of niches has the most beneficial effect on the entire leaching process.
- When creating more than two niches, their spacing is critical. Their proximity to each other, over time, reduces their positive impact on the leaching process.
- A single niche should be designed in the lower zone of the cavern to maximize its advantages.
- The current results of laboratory tests on leaching of leaching caverns using the Jet Cavern Technology method allow the conclusion that the proposed method is a solution that can significantly reduce the time and costs of building storage facilities.
- If it is not possible to discharge the produced semi-brine, the use of the JCT method may improve the so-called leaching in a closed circuit (e.g., serial connection of caverns for saturation) by shortening the time to obtain saturated brine without the need to saturate it in other caverns and by shortening the cutting stage by more than 30% of the standard time.
The execution time of a standard cut, depending on the planned maximum diameter of the cavern, can be up to 9 months, which constitutes up to 35% of the entire cavern leaching time.
Author Contributions
Conceptualization, W.K.; methodology, M.C. and W.K.; validation, M.C., data analysis, W.K. and M.C., investigation, M.C.; writing—original draft preparation, W.K. and M.C., visualization M.C., W.K. supervision. All authors have read and agreed to the published version of the manuscript.
Funding
This article was financed by a subsidy: AGH University of Krakow, Faculty of Civil Engineering and Resource Management, Krakow, Poland, No. 16.16.100.215.
Data Availability Statement
The original contributions presented in the study are included in the article, further inquiries can be directed to the corresponding author.
Acknowledgments
The authors would like to thank the Wieliczka Salt Mine and the Kłodawa Salt Mine for allowing the collection of rock salt samples for laboratory tests.
Conflicts of Interest
Author Mariusz Chromik was employed by the company CHEMKOP sp. z o.o. The remaining authors declare that the research was conducted in the absence of any commercial or financial relationships that could be construed as a potential conflict of interest.
References
- Honório, H.T.; Hajibeygi, H. Three-dimensional multi-physics simulation and sensitivity analysis of cyclic energy storage in salt caverns. Int. J. Hydrogen Energy 2024, 94, 1389–1405. [Google Scholar] [CrossRef]
- Tarkowski, R. Underground hydrogen storage: Characteristics and prospects. Renew. Sustain. Energy Rev. 2019, 105, 86–94. [Google Scholar] [CrossRef]
- Zhao, H.; Hao, X. Risk assessment of zero-carbon salt cavern compressed air energy storage power station. J. Clean. Prod. 2024, 468, 143002. [Google Scholar] [CrossRef]
- Fibbi, G.; Del Soldato, M.; Fanti, R. Review of the Monitoring Applications Involved in the Underground Storage of Natural Gas and CO2. Energies 2022, 16, 12. [Google Scholar] [CrossRef]
- Wei, L.; Jie, C.; Deyi, J.; Xilin, S.; Yinping, L.; Daemen, J.J.K.; Chunhe, Y. Tightness and suitability evaluation of abandoned salt caverns served as hydrocarbon energies storage under adverse geological conditions (AGC). Appl. Energy 2016, 178, 703–720. [Google Scholar] [CrossRef]
- Liu, W.; Li, Q.; Yang, C.; Shi, X.; Wan, J.; Jurado, M.J.; Li, Y.; Jiang, D.; Chen, J.; Qiao, W.; et al. The role of underground salt caverns for large-scale energy storage: A review and prospects. Energy Storage Mater. 2023, 63, 103045. [Google Scholar] [CrossRef]
- Mouli-Castillo, J.; Wilkinson, M.; Mignard, D.; McDermott, C.; Haszeldine, R.S.; Shipton, Z.K. Inter-seasonal compressed-air energy storage using saline aquifers. Nat. Energy 2019, 4, 131–139. [Google Scholar] [CrossRef]
- Teatini, P.; Castelletto, N.; Ferronato, M.; Gambolati, G.; Janna, C.; Cairo, E.; Marzorati, D.; Colombo, D.; Ferretti, A.; Bagliani, A.; et al. Geomechanical response to seasonal gas storage in depleted reservoirs: A case study in the Po River basin, Italy. J. Geophys. Res. Earth Surf. 2011, 116. [Google Scholar] [CrossRef]
- Yang, C.; Wang, T.; Li, Y.; Yang, H.; Li, J.; Qu, D.; Xu, B.; Yang, Y.; Daemen, J.J.K. Feasibility analysis of using abandoned salt caverns for large-scale underground energy storage in China. Appl. Energy 2015, 137, 467–481. [Google Scholar] [CrossRef]
- Tan, Q.; You, L.; Kang, Y.; Zhang, X.; Meng, S. Changes in pore structures and porosity-permeability evolution of saline-lacustrine carbonate reservoir triggered by fresh water-rock reaction. J. Hydrol. 2020, 580, 124375. [Google Scholar] [CrossRef]
- Thoms, R.L.; Gehle, R.M. A Brief History of Salt Cavern Use; AGM: College Station, TX, USA, 2017. [Google Scholar]
- Wan, J.; Meng, T.; Li, J.; Liu, W. Energy storage salt cavern construction and evaluation technology. Adv. Geo-Energy Res. 2023, 9, 141–145. [Google Scholar] [CrossRef]
- Hosseini, Z.; Collins, D.; Shumila, V.; Trifu, C.I.; Pinnock, I. Induced Microseismic Monitoring in Salt Caverns. In Proceedings of the 49th U.S. Rock Mechanics/Geomechanics Symposium 2015, San Francisco, CA, USA, 28 June–1 July 2015. [Google Scholar]
- Kruk-Dowgiałło, L.; Nowacki, J.; Opioła, R. Brine discharge to the puck bay—A real problem for future investments. Geochem. Mineral. Petrol. 2009, 57, 774–776. [Google Scholar]
- Trifu, C.I.; Shumila, V. Microseismic Monitoring of a Controlled Collapse at Ocnele Mari, Romania. In Proceedings of the 42nd U.S. Rock Mechanics Symposium (USRMS), San Francisco, CA, USA, 29 June 2008. [Google Scholar]
- Zemke, J.; Stöwer, M.; Borgmeier, M. Injection of Brine from Cavern Leaching into Deep Saline Aquifers: Long-Term Experiences in Modeling and Reservoir Survey. Dev. Water Sci. 2005, 52, 403–412. [Google Scholar] [CrossRef]
- Aftab, A.; Hassanpouryouzband, A.; Naderi, H.; Xie, Q.; Sarmadivaleh, M. Quantifying onshore salt deposits and their potential for hydrogen energy storage in Australia. J. Energy Storage 2023, 65, 107252. [Google Scholar] [CrossRef]
- Dooner, M.; Wang, J. Potential Exergy Storage Capacity of Salt Caverns in the Cheshire Basin Using Adiabatic Compressed Air Energy Storage. Entropy 2019, 21, 1065. [Google Scholar] [CrossRef]
- Dopffel, N.; An-Stepec, B.A.; Bombach, P.; Wagner, M.; Passaris, E. Microbial life in salt caverns and their influence on H2 storage—Current knowledge and open questions. Int. J. Hydrogen Energy 2024, 58, 1478–1485. [Google Scholar] [CrossRef]
- Kondziella, H.; Specht, K.; Lerch, P.; Scheller, F.; Bruckner, T. The techno-economic potential of large-scale hydrogen storage in Germany for a climate-neutral energy system. Renew. Sustain. Energy Rev. 2023, 182, 113430. [Google Scholar] [CrossRef]
- Zhang, Z.; Liu, W.; Guo, Q.; Duan, X.; Li, Y.; Wang, T. Tightness evaluation and countermeasures for hydrogen storage salt cavern contains various lithological interlayers. J. Energy Storage 2022, 50, 104454. [Google Scholar] [CrossRef]
- Aminu, M.D.; Nabavi, S.A.; Rochelle, C.A.; Manovic, V. A review of developments in carbon dioxide storage. Appl. Energy 2017, 208, 1389–1419. [Google Scholar] [CrossRef]
- Charnavel, Y.; Buissard, H.; Hertz, E. Variation of Salt Dissolution Rate with Temperature–Experimental Procedure and First Results; SMRI Technical Conference Paper; Brussels, 2006. Available online: https://smri.memberclicks.net/assets/docs/Abstracts/2006/Fall/MP2006F_Charnavel.pdf (accessed on 5 February 2025).
- Cyran, K.; Toboła, T.; Kamiński, P. Experimental study on mechanically driven migration of fluids in rock salt. Eng. Geol. 2023, 313, 106975. [Google Scholar] [CrossRef]
- Dong, S.; Fang, T.; Wan, J.; Hu, X.; Li, J.; Liu, H.; Li, D.; Qiao, S. Study on the Effect of the Water Injection Rate on the Cavern Leaching Strings of Salt Cavern Gas Storages. Energies 2022, 16, 344. [Google Scholar] [CrossRef]
- Kunstman, A.; Poborska-Młynarska, K.; Urbańczyk, K. Zarys Otworowego Ługownictwa Solnego Aktualne Kierunki Rozwoju; Wydawnictwa AGH: Krakow, Poland, 2002. [Google Scholar]
- Lankof, L.; Polański, K.; Ślizowski, J.; Tomaszewska, B. Possibility of energy storage in salt caverns. AGH Drill. Oil Gas 2016, 33, 405. [Google Scholar] [CrossRef]
- Tajduś, K.; Sroka, A.; Misa, R.; Tajduś, A.; Meyer, S. Surface Deformations Caused by the Convergence of Large Underground Gas Storage Facilities. Energies 2021, 14, 402. [Google Scholar] [CrossRef]
- Liao, Y.; Wang, T.; Ren, Z.; Wang, D.; Sun, W.; Sun, P.; Li, J.; Zou, X. Multi-well combined solution mining for salt cavern energy storages and its displacement optimization. Energy 2024, 288, 129792. [Google Scholar] [CrossRef]
- Korzeniowski, W.; Chromik, M. The Method of Borehole Leaching of Caverns, Especially in the Rock Salt Deposit; Int.Cl.: E21B 43/28(2006.01).—Polska.—Opis patentowy; PL240604B1; Udziel. 2022-02-17; Opubl. 2022-05-09.—Zgłosz. nr P.427305 z dn. 2018-10-01.—Int.Cl.: E21B 43/28(2006.01).—Polska.—Opis patentowy; PL240604B1; Udziel. 2022-02-17; Opubl. 2022-05-09.—Zgłosz. nr P.427305 z dn. 2018-10-01; Akademia Górniczo-Hutnicza im Stanisława Staszica w Krakowie: Krakow, Poland, 2022. [Google Scholar]
- Chromik, M.; Korzeniowski, W. A Method to Increase the Leaching Progress of Salt Caverns with the Use of the Hydro-Jet Technique. Energies 2021, 14, 5833. [Google Scholar] [CrossRef]
- Korzeniowski, W.; Poborska-Młynarska, K.; Skrzypkowski, K.; Zagórski, K.; Chromik, M. Cutting niches in rock salt by means of a high-pressure water jet in order to accelerate the leaching of storage caverns for hydrogen or hydrocarbons. Energies 2020, 13, 1911. [Google Scholar] [CrossRef]
- Chromik, M. Metoda Zwiększenia Postepu Ługowania Kawern Solnych z Wykorzystaniem Strumieniowego Urabiania Skał. Ph.D. Thesis, AGH University of Kraków, Krakow, Poland, 2023. [Google Scholar]
- Durie, R.W.; Jessen, F.W. Mechanism of the Dissolution of Salt in the Formation of Underground Salt Cavities. Soc. Pet. Eng. J. 1964, 4, 183–190. [Google Scholar] [CrossRef]
- Saberian, A. A Dissolution/Temperature Relation for Vertical Salt Surfaces Dissolved in Saline Solutions; Research Project Report to the Solution Mining Research Institute; Solution Mining Research Institute: Clifton Park, NY, USA, 1983. [Google Scholar]
- Urbańczyk, K. Physical and mathematical description of leaching process (Salt cavern leaching process p. II). Przegląd Solny Salt Rev. 2017, 13, 47–66. [Google Scholar]
- Urbańczyk, K. Szybkość ługowania soli kamiennej w funkcji stężenia roztworu ługującego, kąta nachylenia ługowanej powierzchni i temperatury procesu. Górnictwo 1990, 14, 25–39. [Google Scholar]
- Bukowski, K. Porównanie badeńskiej serii solonośnej z Wieliczki i Bochni w świetle nowych danych. In Analiza Basenu Trzeciorzedowego Przedkarpacia; Prace Państwowego Instytutu Geologicznego: Warsaw, Poland, 1999; p. 168. [Google Scholar]
- Norma Branżowa BN-86-6011-07; Produkty Nieorganiczne-Solanka. OBRGSChem, Wydawnictwa Normalizacyjne “ALFA-WERO”: Warszawa, Poland, 1987.
Disclaimer/Publisher’s Note: The statements, opinions and data contained in all publications are solely those of the individual author(s) and contributor(s) and not of MDPI and/or the editor(s). MDPI and/or the editor(s) disclaim responsibility for any injury to people or property resulting from any ideas, methods, instructions or products referred to in the content. |
© 2025 by the authors. Licensee MDPI, Basel, Switzerland. This article is an open access article distributed under the terms and conditions of the Creative Commons Attribution (CC BY) license (https://creativecommons.org/licenses/by/4.0/).