1. Introduction
1.1. Policy Background
The proportion of road transport within the EU’s overall freight transport performance reached its highest level at 25.3%, in 2023 [
1]. Due to the extensive use of vehicles, it is a key contributor to fuel consumption and greenhouse gas (GHG) emissions among transport sectors. Heavy-duty vehicles (HDVs), such as trucks and lorries, are estimated to account for over 25% of road transport CO
2 emissions in the European Union, despite representing only a small fraction of the vehicles on the road [
2]. HDVs cover the main mode of freight transport, whose absolute volume on Europe’s roads has increased by almost two thirds in the last three decades [
3]. Due to the rising cost of fuel and increasing urgency of climate action, improving the fuel efficiency of these vehicles is both an economic necessity and an environmental obligation.
To address this challenge, numerous countries have adopted strategies that combine regulatory frameworks, fiscal incentives, and support for innovation aimed at reducing emissions from HDVs. In the European Union, under Regulation (EU) 2019/1242, truck manufacturers are mandated to reduce the average CO
2 emissions of new heavy-duty vehicles by 15% by 2025 and 30% by 2030, relative to a 2019 baseline [
4]. These reductions are part of the European Green Deal promoted to achieve climate neutrality by 2050.
1.2. Technical Background
Achieving CO
2 emission reduction targets requires both technological innovation and engine control optimization. From the engineering side, this includes hybridization and the use of low-carbon fuels. Operationally, it is equally important to optimize fuel consumption through route planning [
5,
6], driver behavior analysis [
7,
8], and fuel quality enhancements is equally important [
9,
10].
In the short term, the use of performance-enhancing additives into conventional fuels represents a practical strategy to achieve immediate reductions in fuel consumption and greenhouse gas emissions from existing vehicle fleets. This approach is particularly promising for older vehicles that have accumulated high mileage and may suffer from reduced performance due to inadequate maintenance. Performance additive packages are different from basic additive blends used to meet fuel specifications; they are engineered to optimize engine operation. These typically include deposit control additives (DCAs), corrosion inhibitors, demulsifiers, and sometimes additional agents like friction modifiers or antifoams.
DCAs are especially critical, as they mitigate the formation of deposits on fuel system components, such as injector nozzles and intake valves, common issues in both port-fuel and direct-injection engines. By maintaining cleaner injectors and combustion surfaces, DCAs help lower emissions of carbon monoxide, unburned hydrocarbons, and particulate matter, while also contributing to improved fuel economy [
11,
12].
At the same time, recent advances in telematics and data analytics have opened new avenues for monitoring and analyzing the performance of commercial fleets in real-world conditions. The integration of high-resolution sensor data, such as that provided by on-board diagnostic systems (OBD), Global Navigation Satellite Systems (GNSS), and inertial measurement units (IMU), allows for a detailed and continuous understanding of vehicle operation and fuel consumption patterns. These technologies enable fleet managers and researchers to go beyond laboratory testing, capturing the variability of real-world driving conditions and identifying areas for efficiency improvement.
Prior studies have demonstrated that leveraging data-driven approaches, including artificial intelligence and machine learning techniques, can reveal complex interactions between operational parameters and fuel efficiency [
13,
14,
15,
16].
A recent study proposed a data-driven approach using artificial neural networks (ANN) to predict the average fuel consumption of cloud-connected heavy-duty trucks, focusing on a minimal set of predictors independent of driving behavior, specifically vehicle weight and road grade [
17]. The model achieved high accuracy (R
2 = 0.96 with full inputs, >0.8 with reduced inputs), demonstrating the potential of simplified telematics data for reliable fuel consumption modeling and emission reduction in heavy-duty vehicles.
Katreddi et al. [
18] demonstrated the effectiveness of artificial neural networks in predicting total and instantaneous fuel consumption of heavy-duty trucks using a limited set of dynamic parameters, namely engine load, engine speed, and vehicle speed. Trained on real-world data collected at 1 Hz during on-road testing with portable emissions monitoring systems, the ANN outperformed traditional models like linear regression and random forest, showing higher accuracy and lower RMSE. Leveraging real-world telematics data from a fleet of 96 heavy-duty vehicles, Carol et al. [
19] demonstrated that high-fidelity vehicle models can be developed for simulation-based energy efficiency evaluations, even when the data are sparse and irregularly sampled. Through custom algorithms, key parameters and representative drive cycles were extracted to simulate real-world operating conditions and assess the impact of various design and operational factors on fuel consumption. This approach enables cost-effective virtual testing and optimization of vehicle systems without the need for extensive physical prototyping or expensive field data collection.
In parallel with technical solutions aimed at reducing emissions, such as fuel formulation improvements and performance-enhancing additives there is growing emphasis on how vehicles are used, maintained, and managed throughout their operational life. This has led to an increasing focus on the monitoring of fuel consumption at the fleet level, not only as a prerequisite for building predictive models, but also as a standalone strategy for improving efficiency and informing decision-making. Unlike controlled test conditions, fleet-level monitoring reflects the true impact of factors such as route topology, vehicle load, driving behavior, and environmental conditions, offering a comprehensive view of energy performance.
Such data does not necessarily need to feed into complex machine learning models to be valuable. In fact, many operators now rely on basic analytics dashboards to track fuel economy trends, benchmark performance between vehicles, and identify operational inefficiencies, such as excessive idling or aggressive driving, that can be corrected through driver coaching or maintenance interventions.
A clear example is reported in [
20], in which the authors conducted a case study on a Norwegian heavy-duty transport company using data from the Dynafleet fleet management system to identify key factors influencing fuel consumption. Through multivariate regression and elasticity analysis, they showed that while infrastructure and vehicle-related factors have a stronger impact on narrow, mountainous routes, driving behavior still plays a significant role. Their findings highlight how fleet management data can support more fuel-efficient operations by informing both vehicle selection and driving practices.
1.3. Research Gap
Despite these promising developments and the widespread availability of advanced telematics and premium fuel formulations, the literature still lacks systematic, fleet-scale evaluations of the effect of diesel additive packages on actual fuel consumption under real-world operational conditions for Euro VI heavy-duty vehicles.
The present study addresses this gap by providing, to our knowledge, the first comprehensive analysis of fuel consumption behavior in a homogeneous Euro VI N3 truck fleet, monitored through high-resolution telematics in a long-term, real-use scenario, and directly quantifying the aggregate impact of commercial performance fuel additives at both vehicle and fleet levels. The integration of large-scale field data, matched by route and season, with operationally relevant filtering and uncertainty analysis, represents a unique contribution to both the academic and applied literature on fuel efficiency solutions for HDVs. Moreover, as reported by [
21], although advanced fleet management systems are widely used in third-party logistics companies, their potential to improve transport energy efficiency remains underutilized due to limited strategic understanding.
2. Test Fleet
The data collection was carried out on a fleet of five heavy-duty road tractors (vehicle category N3, gross vehicle weight > 12 tons), all compliant with Euro 6 emission standards and equipped with tanker semi-trailers. The vehicles were operated by a transport company specialized in fuel delivery, meaning that the trips recorded in the dataset involve movements between points of interest (e.g., refineries, depots, gas stations) with the tanker either loaded (transporting fuel) or empty (return trips or repositioning). This aspect should be kept in mind during data analysis, as it influences driving patterns, fuel consumption, and emissions. The vehicles were of the same make and model, (Volvo FHD13K460, Volvo Trucks, Gothenburg, Sweden), with an engine displacement of 12,777 cm
3. The fleet was selected based on the availability of operational vehicles and their representativeness within the national context of the Italian and European heavy-duty transport sector. To assess representativeness, data from the 2023 edition of the Annual Report on the Italian Vehicle Fleet published by the Automobile Club of Italy (ACI) [
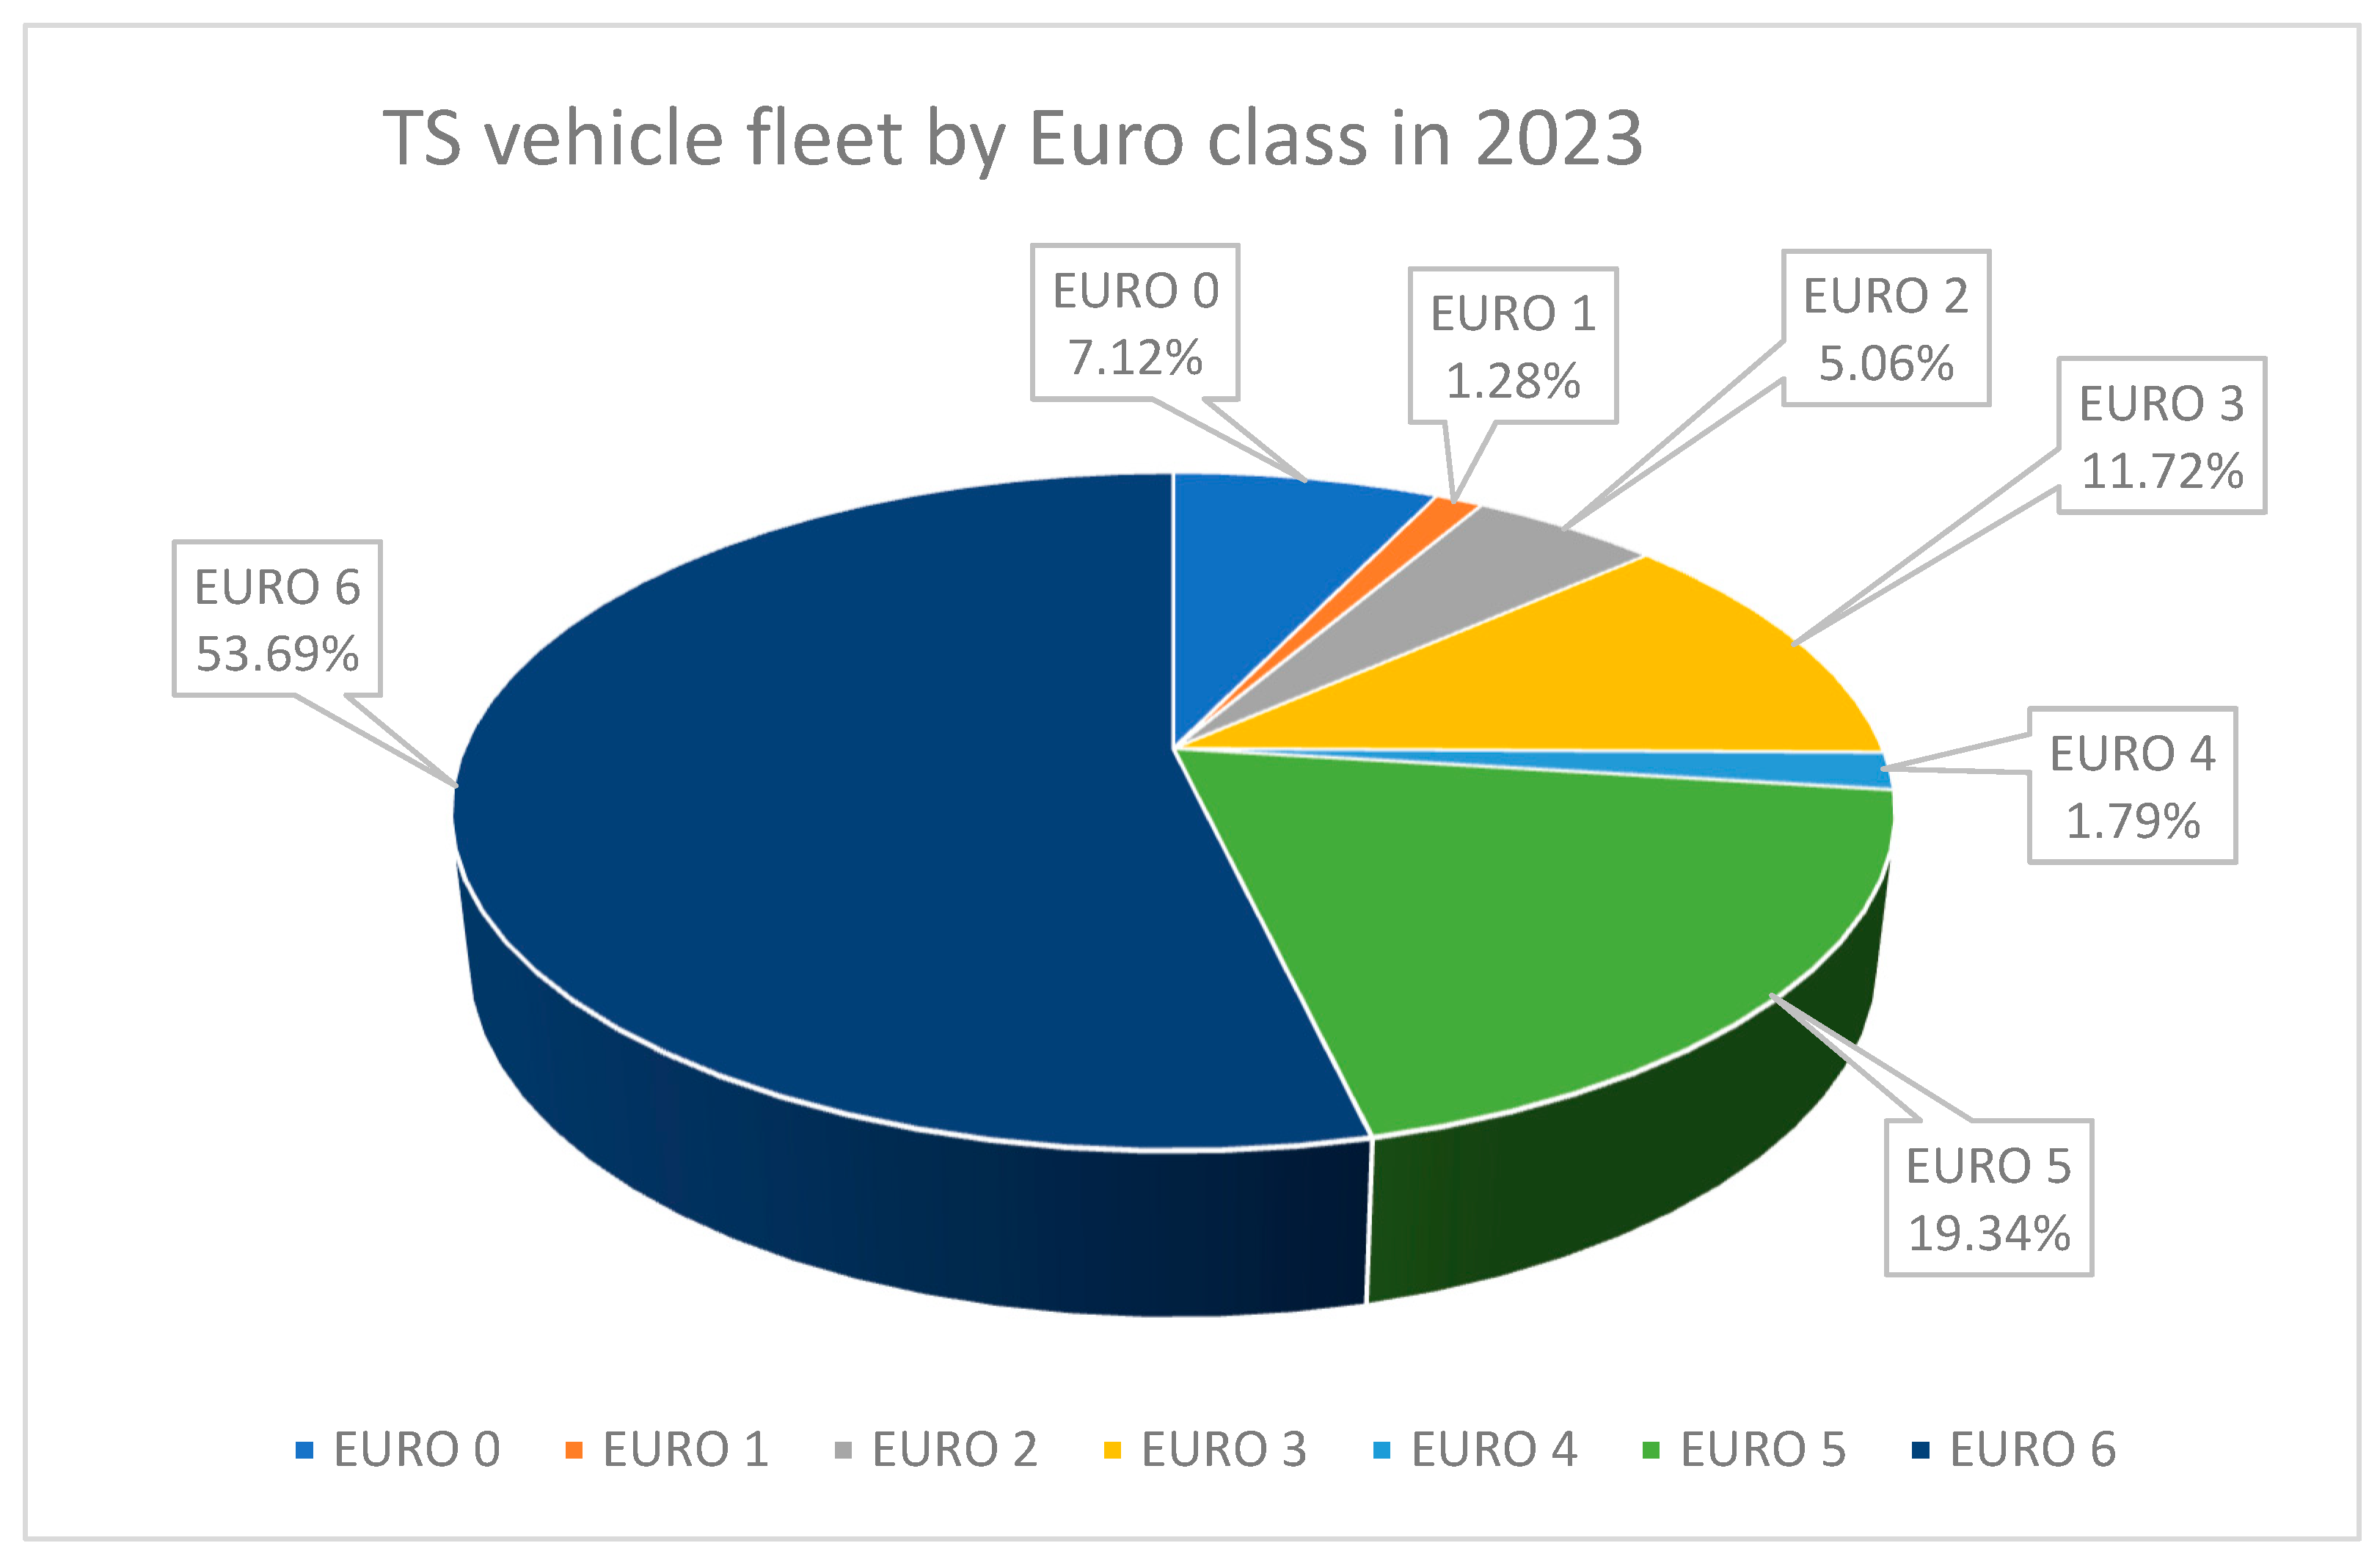
22] were examined. As of December 2023, a total of approximately 221,000 road tractors were in circulation in Italy, 53.7% of which were Euro 6 (see
Figure 1). This trend is consistent at the European Union scale, where recent ACEA modeling indicates that almost 58% of all circulating heavy-duty trucks, including N3 tractors, are Euro VI compliant as of 2025, confirming that Euro VI standards now dominate the EU truck fleet and further supporting the policy relevance of results for the broader European context [
23].
While the ACI report does not provide model-specific information, it does include data by manufacturer (
Table 1). Based on this, Volvo vehicles accounted for 11.9% of the entire national road tractor fleet. For the 2019–2020 registration period, which matches the production years of the vehicles monitored in this study, the share increases to 13.2%.
The decision to focus on a homogeneous and well-characterized vehicle group enhances internal consistency and facilitates a reliable comparison between fuels. At the same time, the alignment of the selected fleet with a substantial and representative portion of the national vehicle stock supports the broader relevance of the findings. This ensures that the outcomes of the analysis, particularly in terms of fuel consumption behavior, can reasonably be extended to similar operational contexts within the Italian heavy-duty transport sector.
3. Fuels and Additive Package
The reference diesel fuel used was EN 590 diesel containing 6–7% FAME. In the first phase of monitoring campaign, the trucks were fueled with reference diesel for a period of 10 months, during which they accumulated an average mileage of approximately 50,000 km. Refueling took place at service stations located along the motorway network.
In the second phase, the same trucks were fueled with diesel containing a performance-improver additive package, available at service stations operated by another brand also present on the motorway network. The additive package includes: (i) Deposit Control Additives, (ii) a cetane number improver (CNI), (iii) a demulsifier, (iv) polymers with anticorrosion action, and (v) a marker. DCAs help prevent and remove deposits on injector nozzles, restoring optimal spray pattern and atomization, which improve mixture preparation and reduce brake specific fuel consumption (BSFC). The CNI reduces ignition delay period and increases the burning rate [
24], thereby improving cold-start performance and mitigating combustion noise [
25], thus supporting more complete and timely combustion with associated benefits for fuel economy and tailpipe CO
2. The demulsifier improves water separation in the fuel system, and corrosion inhibitors protect wetted components, favoring consistent injector performance over time. The dosing level is in the order of a few ppm and the finished fuel remains fully compliant with EN 590. Prior laboratory chassis dynamometer testing on light-duty and commercial vehicles with the same additive family reported fuel economy benefits under controlled conditions, motivating the present real-world fleet assessment [
9]. On that occasion, an independent inspection company was commissioned to blend the additive package into a sample of EN 590 diesel and certify both the doping process and the fuel properties, with and without additives.
4. Fleet Monitoring System
This study involved monitoring fuel consumption and route tracking for a fleet of heavy-duty road tractors using a GPS-based data acquisition system interfaced with the engine control unit via the OBD port.
In particular, the data acquisition and monitoring system was implemented using the Masternaut platform [
26], which employs an On-Board Unit (OBU) installed on each vehicle. The OBU is connected to the Masternaut Connect service via a General Packet Radio Service (GPRS) link, allowing data transmission and processing. Data acquisition relies on two main sources: CAN Network (Controller Area Network), for accessing operational parameters directly from the vehicle’s electronic control unit, and a GPS System for real-time vehicle geolocation. While the OBU continuously receives data from the vehicle’s internal systems, the logging and storage of information occur only when specific conditions are met. In the dataset used for this study, data recording is triggered by engine running. As a result, each record corresponds to a discrete trip, defined as the interval between a vehicle start and shutdown event, and includes aggregated information over that duration.
The resulting dataset follows a structured format which facilitates systematic data processing and analysis. Each trip record includes the start and end coordinates, trip duration, distance traveled, average speed, and total fuel consumed, enabling a comprehensive evaluation of vehicle operation under real-world conditions.
The event-driven nature of the data acquisition system offers several practical advantages, such as reduced data volume and minimal storage requirements, making it suitable for long-term fleet monitoring over extended geographical ranges.
However, the absence of continuous high-frequency sampling (e.g., 1 Hz or higher) introduces certain limitations. Since the available data represent aggregate values over entire trips or specific events rather than instantaneous time-series, fine-grained analyses, such as transient fuel consumption dynamics, real-time engine load variations, or driver behavior classification over short time intervals, are not feasible. This affects the ability to develop highly time-resolved consumption models, detect micro-events (e.g., short stops, gear-shifting behavior) or reconstruct detailed speed or load profiles.
Nevertheless, the dataset remains highly valuable for large-scale, real-world analyses of fuel consumption, enabling statistical comparisons across vehicle configurations, fuel types, and driving conditions, estimation of fuel efficiency trends over time or route-level consumption analysis and eco-driving assessments.
To ensure consistency and reduce data variability, the analysis was based on homogeneous data groups classified according to vehicle ID, time period, and average speed. This approach enabled the construction of two comparable datasets, corresponding, respectively, to the use of conventional fuel and the use of the fuel with additives. To further minimize seasonal effects, data collection was constrained to the same time window across two consecutive years. Data acquisition with conventional diesel fuel is referred to September 2022–June 2023 period. Then, all the trucks start to use fuel with additives and the dataset for the fuel with additives is referred to September 2023–June 2024.
5. Data Analysis
The effect of the fuel with additives was evaluated by analyzing the HDVs fuel consumption and kinematic data acquired following the procedure outlined in the previous section. This section presents the analytical adopted methods and the obtained results. The analysis begins with a global assessment across the entire vehicle fleet and progressively narrows down to a more detailed investigation conducted at the level of individual vehicles.
5.1. Global Analysis of HDVs Fuel Consumption
The first step in evaluating the quality and consistency of the collected dataset involved comparing the routes traveled by the fleet using reference fuel and fuel with additives across the two monitored time periods. This comparison was carried out in terms of both geographical coverage and cumulative traveled distance.
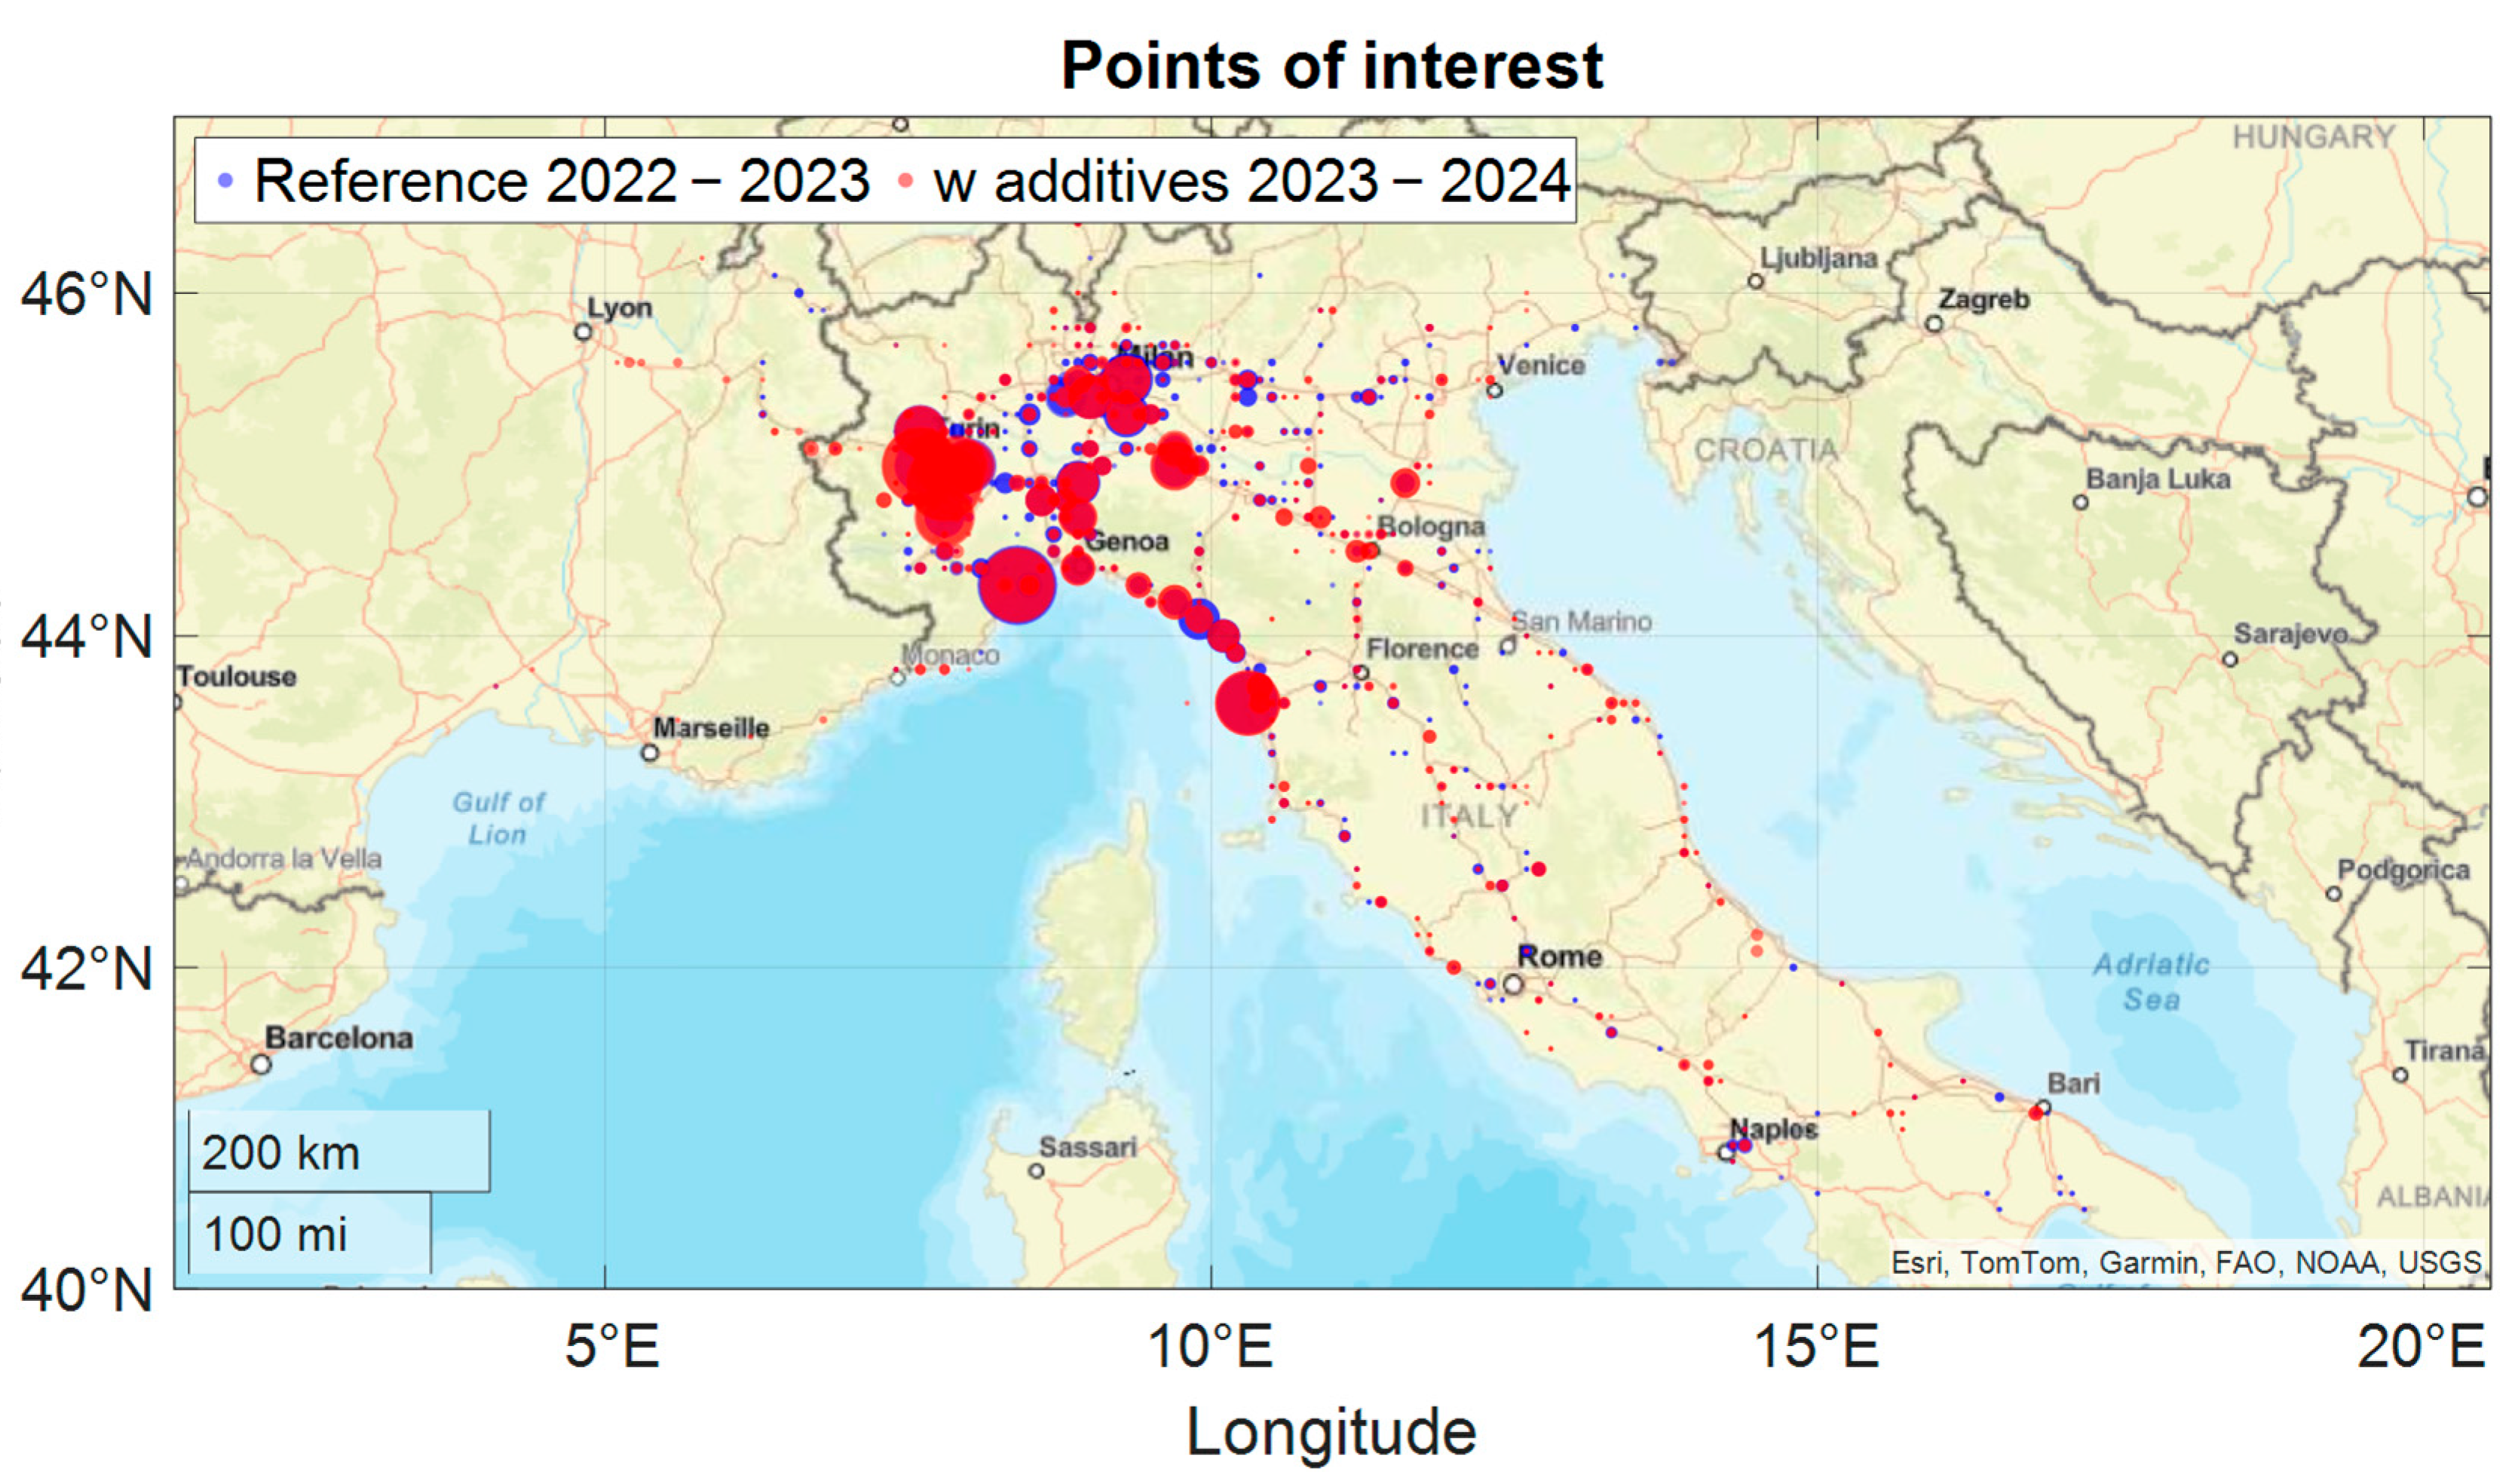
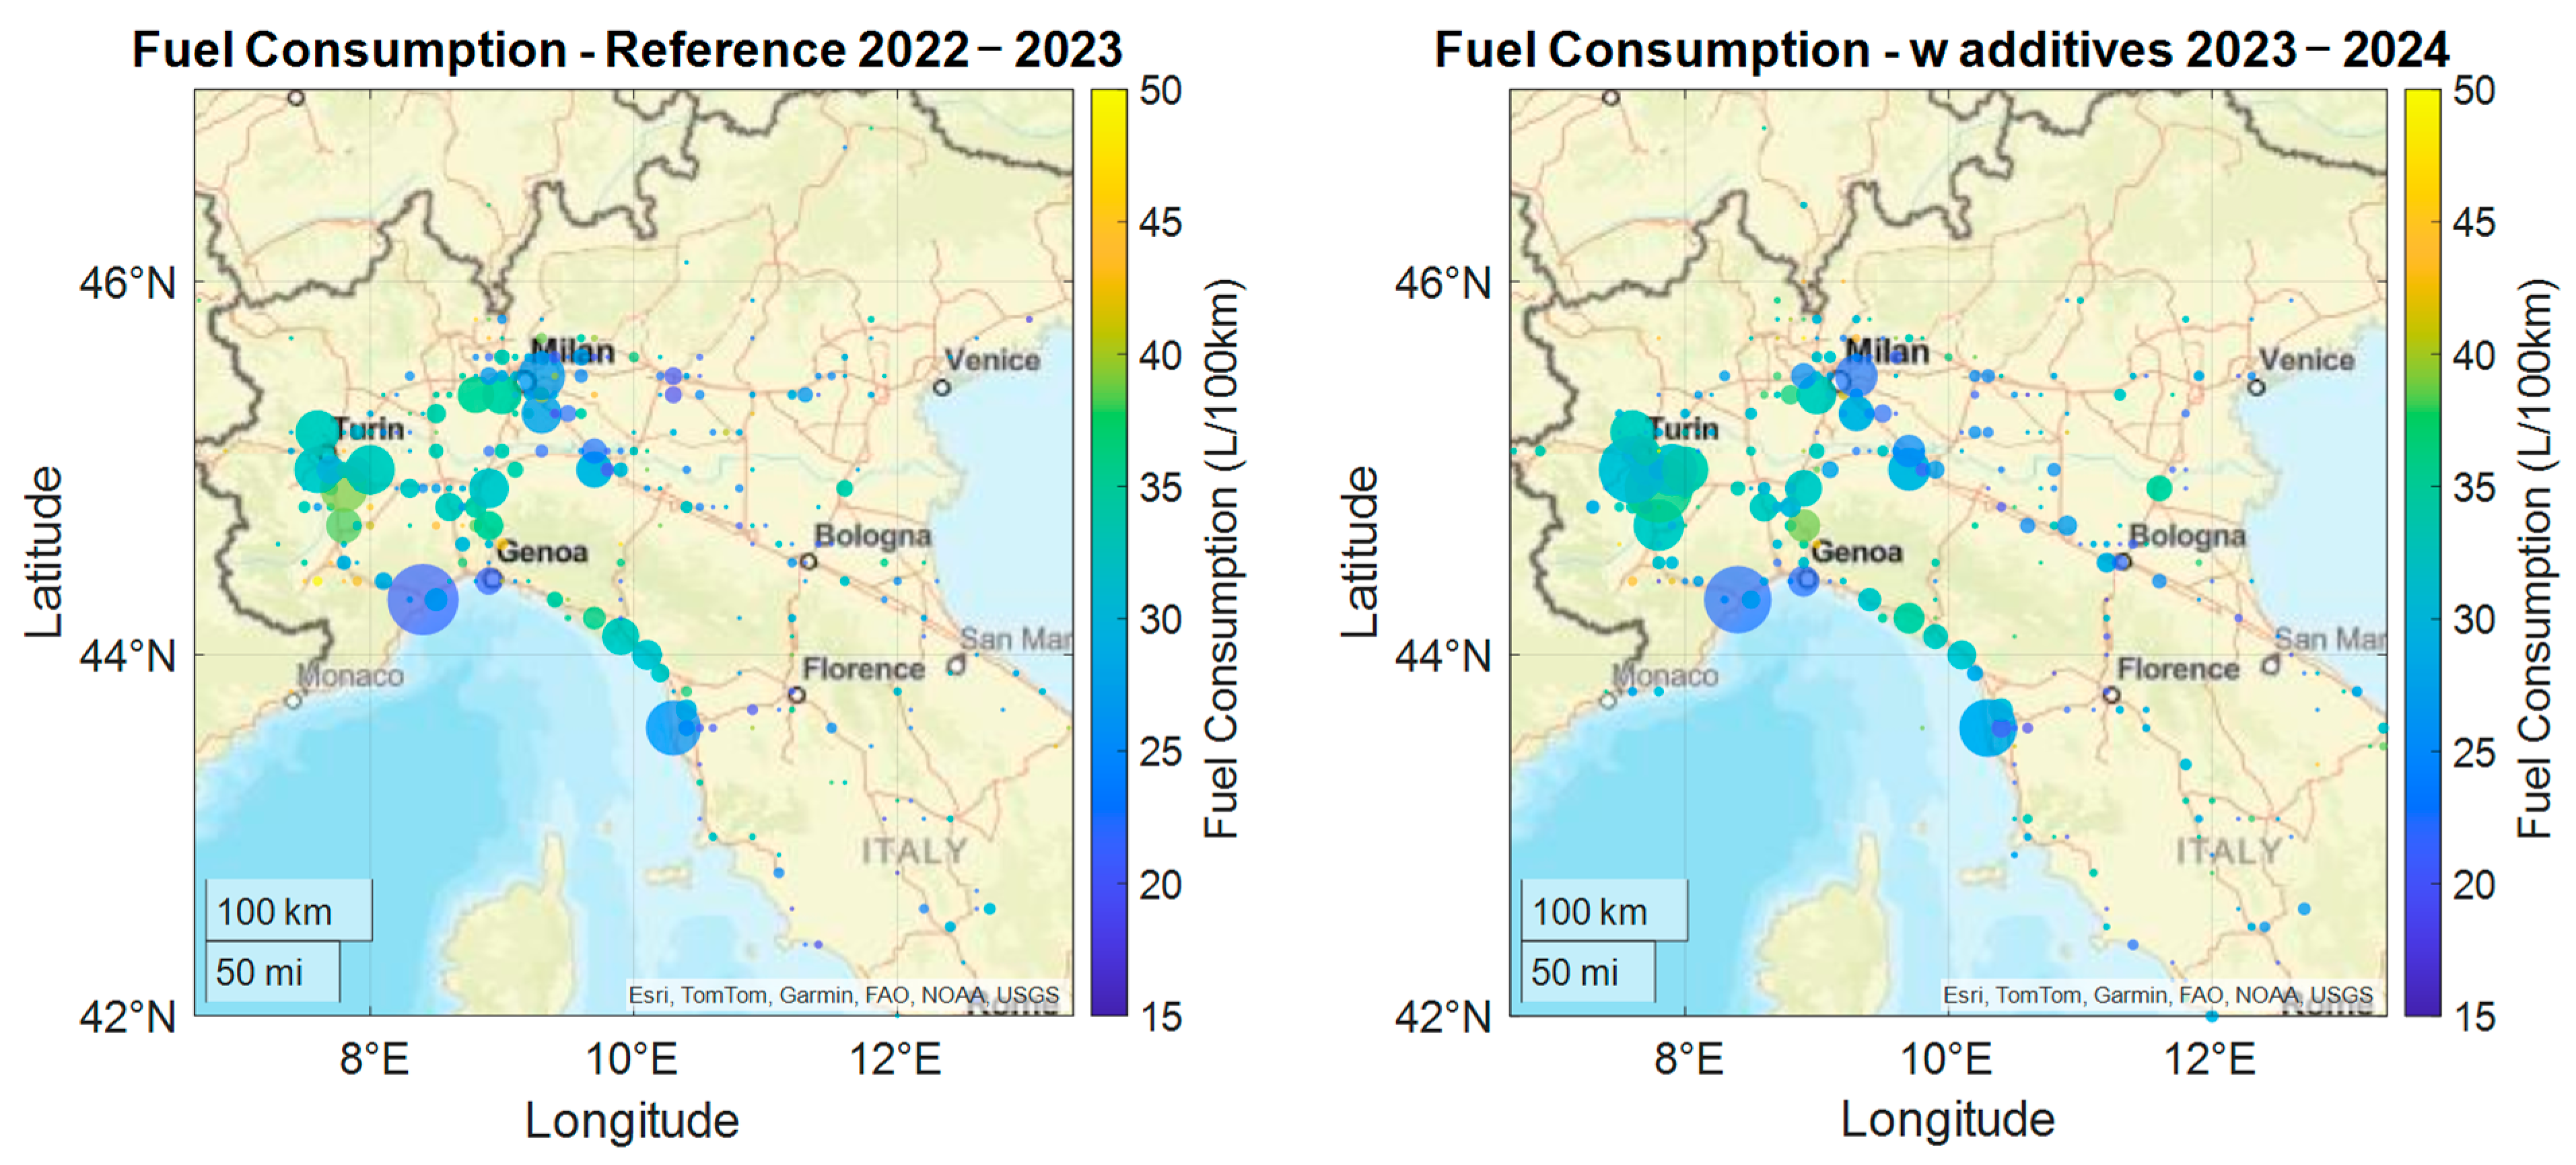
Figure 2 graphically illustrates the key locations reached by the fleet during the two periods under investigation, identified through their GPS coordinates. The size of each marker is proportional to the number of trips that originated from the corresponding GPS location. A noticeable clustering of departure points can be observed primarily in Northern Italy, particularly in the area between Milan (45°46′, 9°18′) and Turin (45°04′, 7°40′), as well as along the Tyrrhenian coast, for both fuel types. Major operational hubs were consistently located in the cities of Livorno (43°32′, 10°18′), Genoa (44°27′, 8°43′), Turin, and Milan.
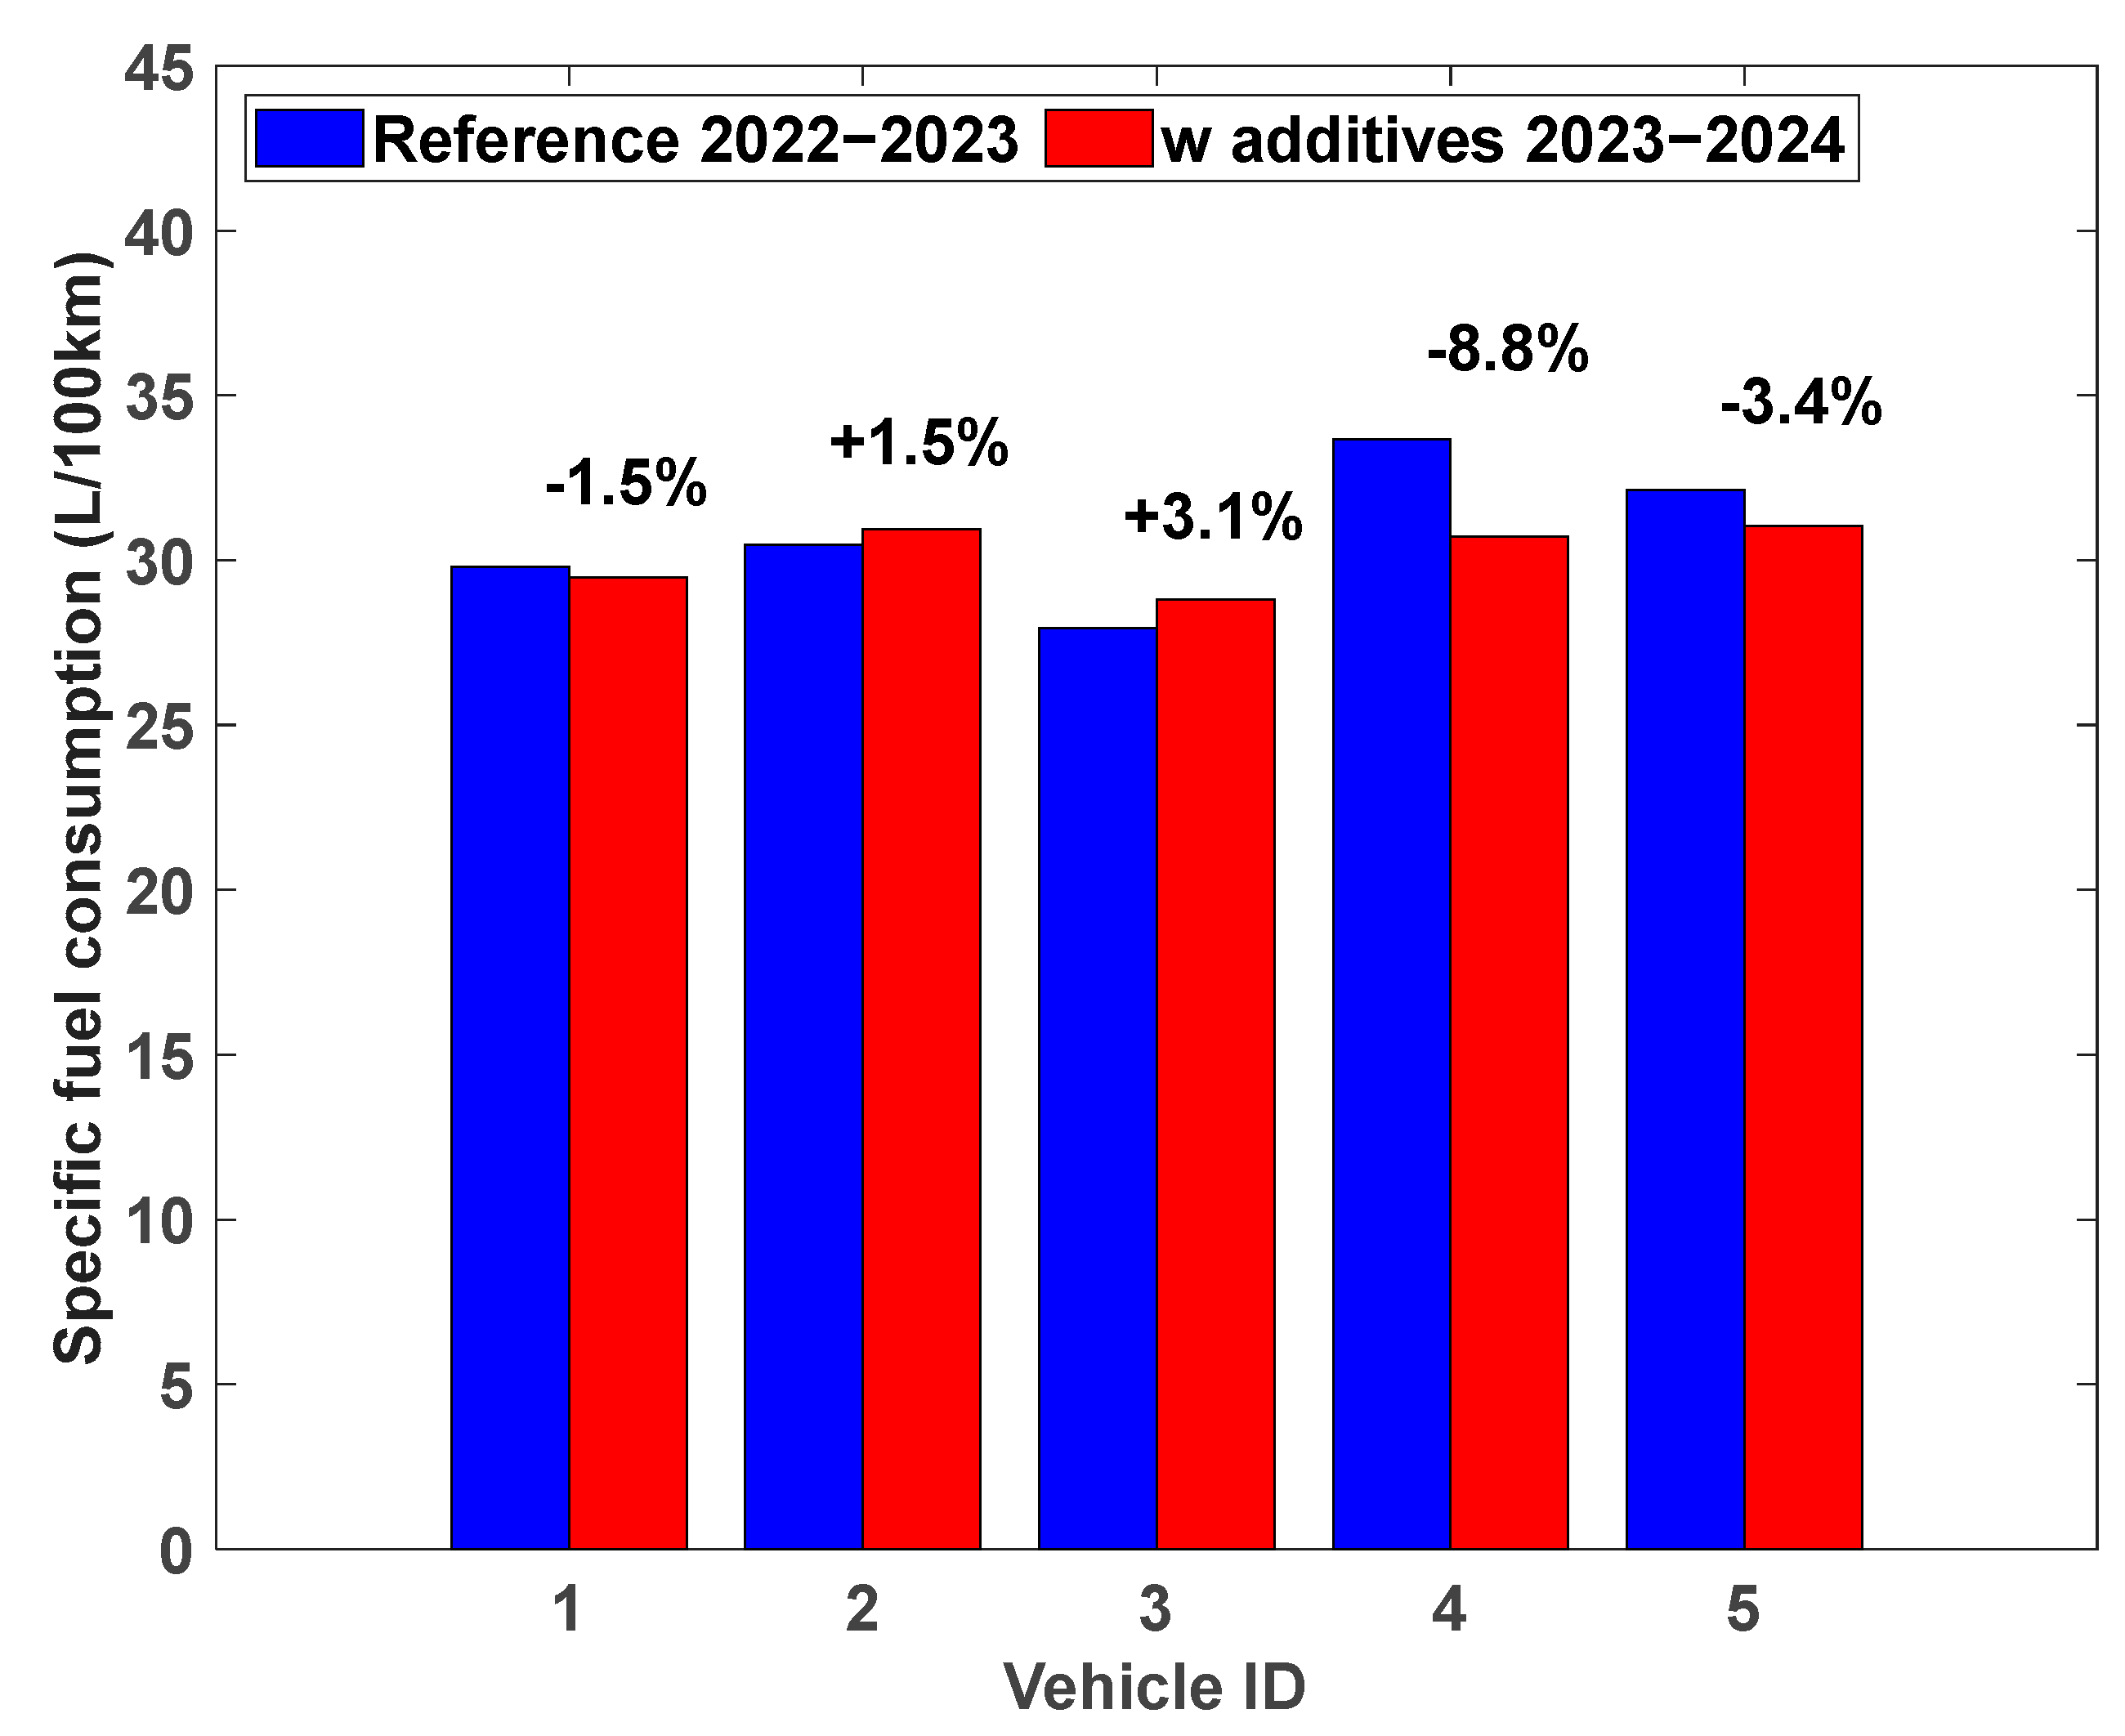
Table 2 summarizes the aggregated fuel consumption data recorded across the entire vehicle fleet during the 2022–2023 monitoring period (reference fuel) and the 2023–2024 period (fuel with additives). The initial comparison between the two datasets confirms their overall comparability, despite a 23% difference in the total distance traveled by the fleet during the two monitoring periods. A first direct analysis of the raw data indicates a fuel consumption reduction of 1.1% when using the fuel with additives. To better understand how this improvement is distributed across the fleet,
Figure 3 presents the average fuel consumption per vehicle.
The results appear heterogeneous: three out of five vehicles show a reduction in fuel consumption, while two vehicles show an increase. The highest reduction, 8.8%, was observed for vehicle #4. Conversely, vehicles #2 and #3 recorded increases in fuel consumption of 1.5% and 3.1%, respectively. These discrepancies highlight the need for a more detailed analysis to identify and exclude outliers and clarify the underlying causes of consumption variability.
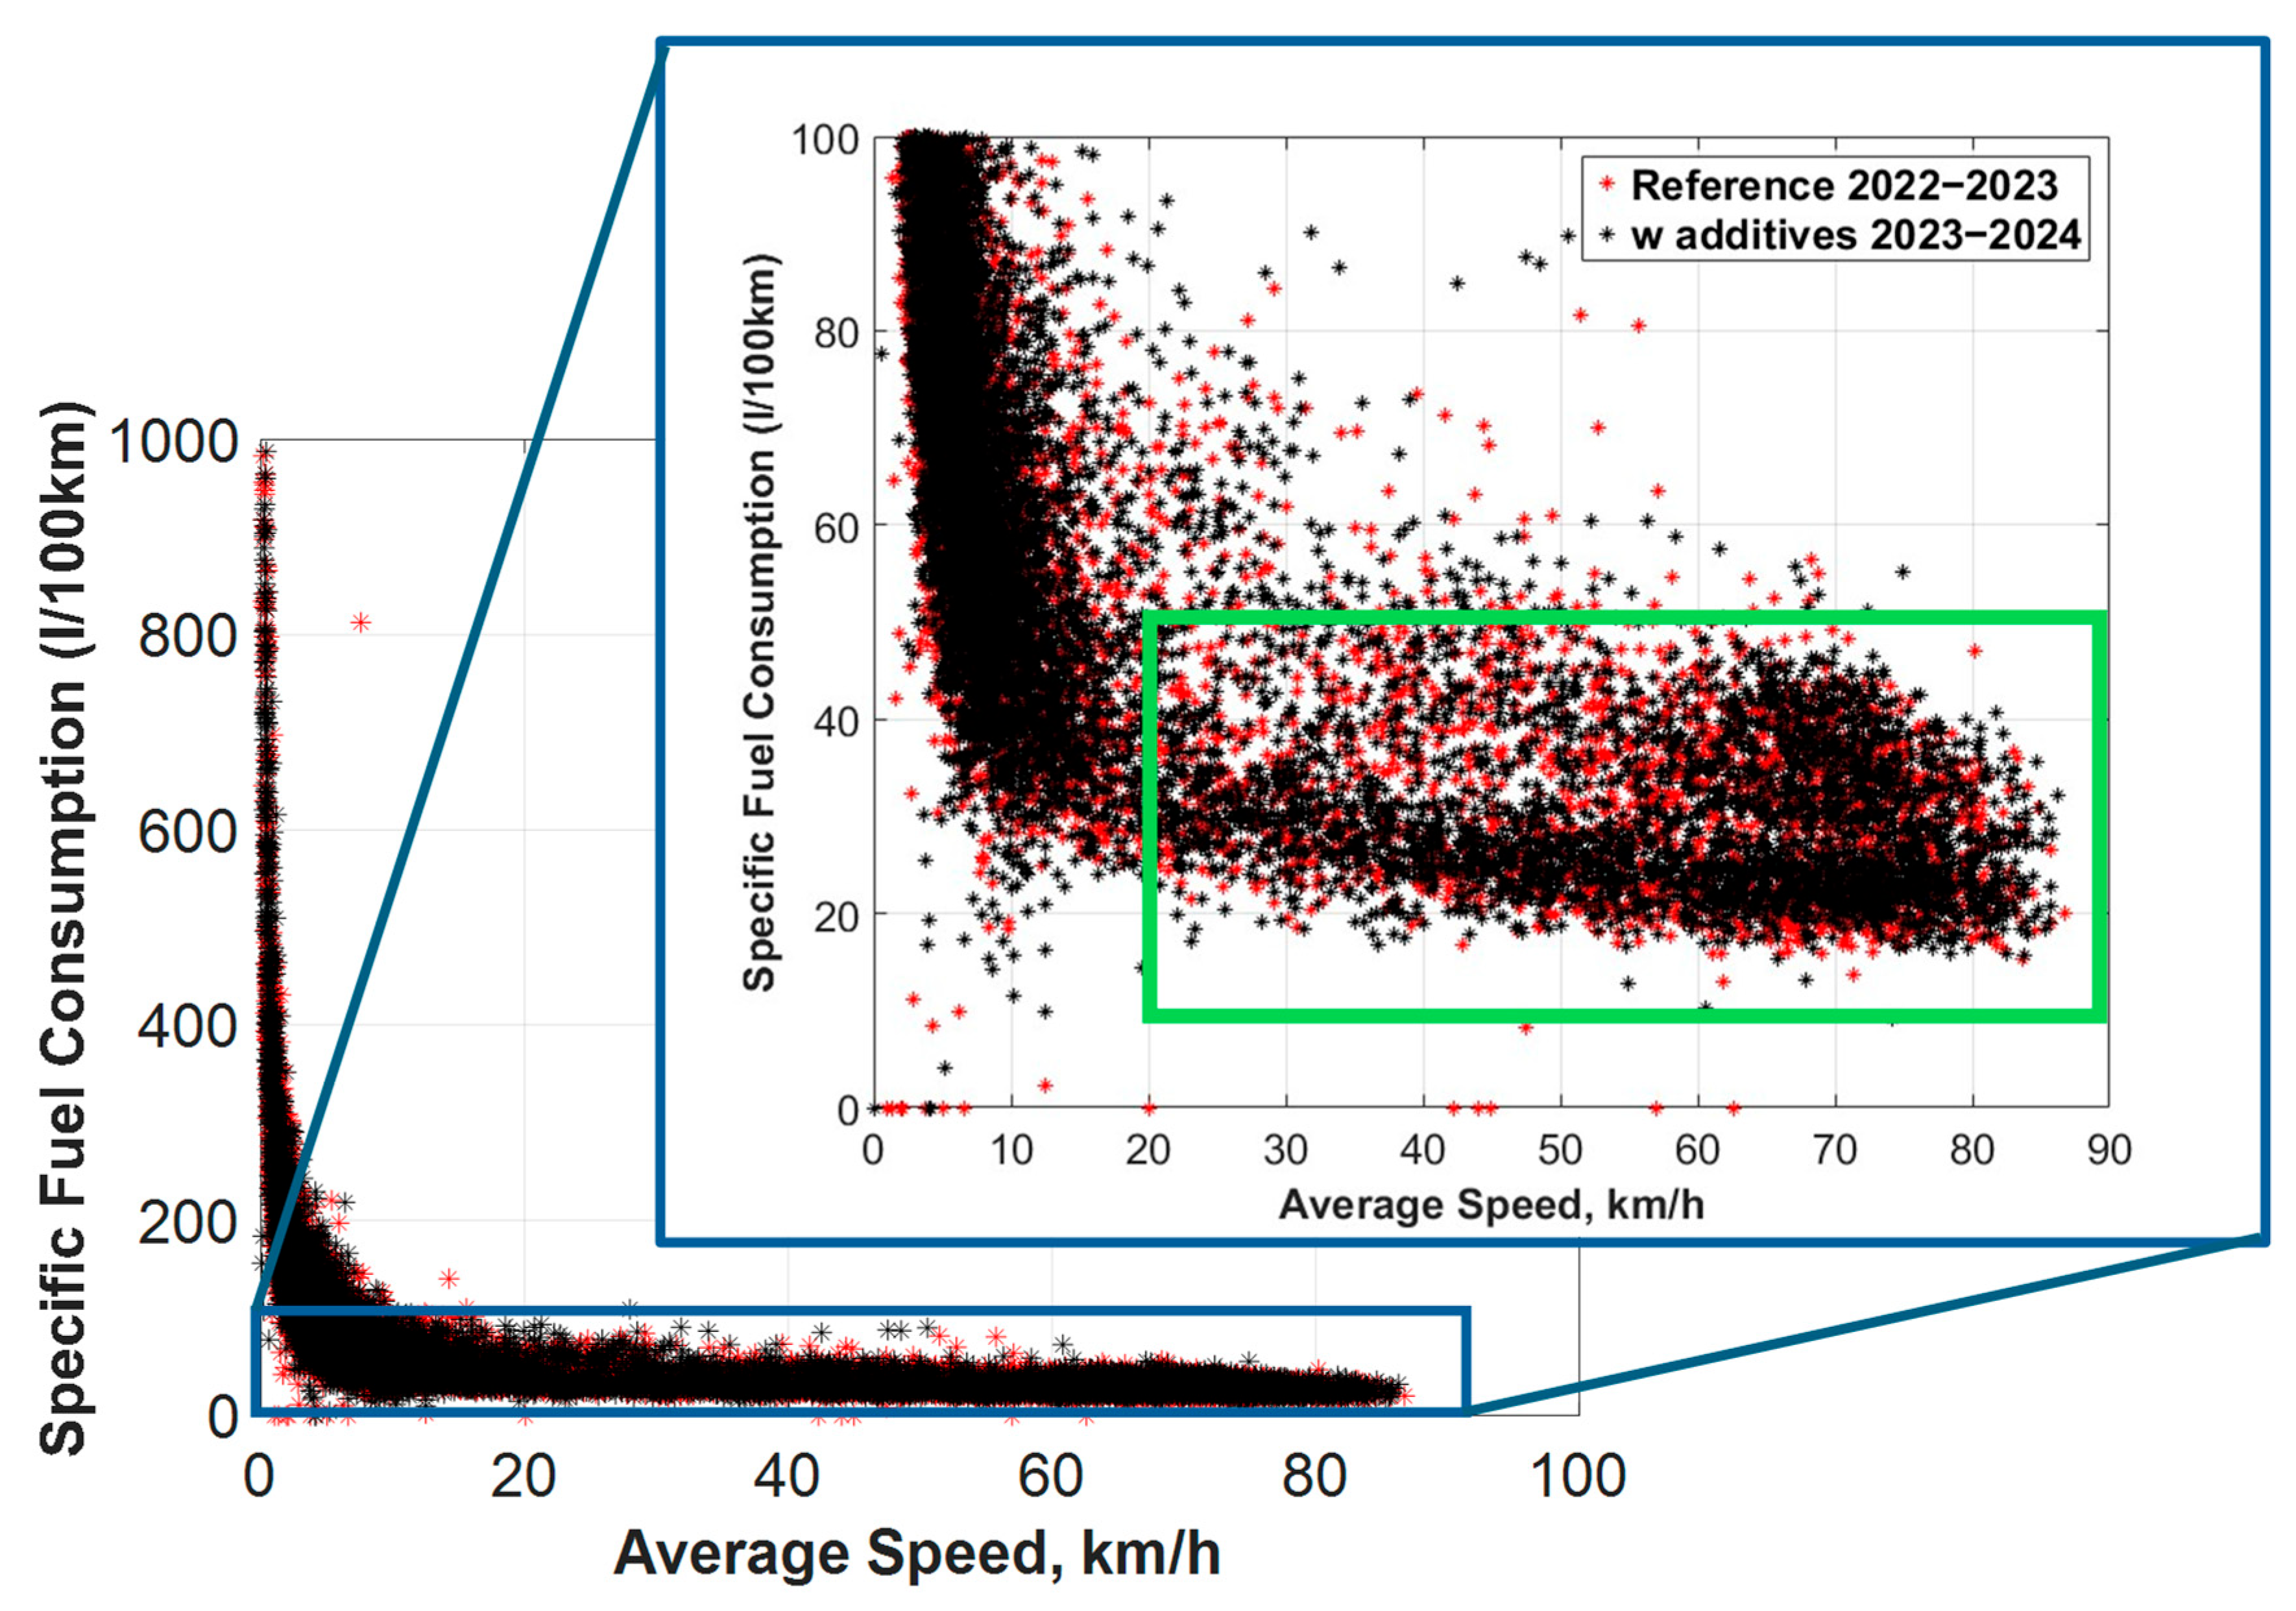
An initial insight is provided by the distribution of fuel consumption as a function of the average speed per trip across the entire fleet, shown in
Figure 4. As expected, fuel consumption tends to increase as average speed decreases. However, the asymptotic rise in consumption at low speeds suggests a significant estimation error in that range [
27]. This can be attributed to driving events with limited statistical significance, such as parking maneuvers, heavy traffic conditions, or data acquisition inaccuracies. At higher speeds, consumption trends become more stable and less variable. To improve the quality of the dataset and exclude non-representative trips related to stop-and-go traffic, measuring noise, or short driving segments, the following filtering criteria were applied. As expected, fuel consumption increases as average speed decreases. However, the asymptotic rise in consumption at low speeds suggests a significant estimation error in that range [
27]. This can be attributed to driving events with limited statistical significance, such as parking maneuvers, heavy traffic conditions, or data acquisition inaccuracies. At higher speeds, consumption trends become more stable and less variable. To improve the quality of the dataset and exclude non-representative trips related to stop-and-go traffic, measuring noise, or short driving segments, the following filtering criteria were applied:
Minimum distance traveled: 10 km.
Minimum average speed: 20 km/h.
Minimum fuel consumption: 10 L/100 km.
Maximum fuel consumption: 50 L/100 km.
These filters define the region enclosed by the green rectangle in
Figure 4, which represents the subset of data deemed suitable for subsequent analyses.
The application of specific data filters is crucial for enhancing the reliability and accuracy of fuel consumption analyses, particularly when dealing with real-world driving data that may contain noise and outliers. In fact, short trips are often dominated by transient behaviors such as frequent stops, idling, and low-speed maneuvers, which can introduce significant variability in fuel consumption measurements. By excluding trips shorter than 10 km, the analysis focuses on journeys that are more representative of typical driving conditions, thereby reducing the influence of anomalous data points. Similarly, extremely low or high fuel consumption values are often the result of measurement errors, atypical operating conditions, or anomalous behaviors that fall outside the scope of standard vehicle operation. The maximum fuel consumption threshold of 50 L/100 km is consistent with the values provided by the COPERT vehicle emission estimation model for Euro VI heavy-duty vehicles [
28]. By constraining the analysis to this range, the study minimizes the impact of such anomalies, leading to more accurate and generalizable findings. The filtered fuel consumption data are summarized in
Table 3. The difference in total distance traveled by the fleet between the two monitored periods amounts to 16.3% (lower distance traveled with base fuel), confirming that the two datasets remain sufficiently comparable for analysis. Within this framework, the fuel with additives confirms a reduction in overall fuel consumption of 1%. This reduction is distributed across individual vehicles, as shown in
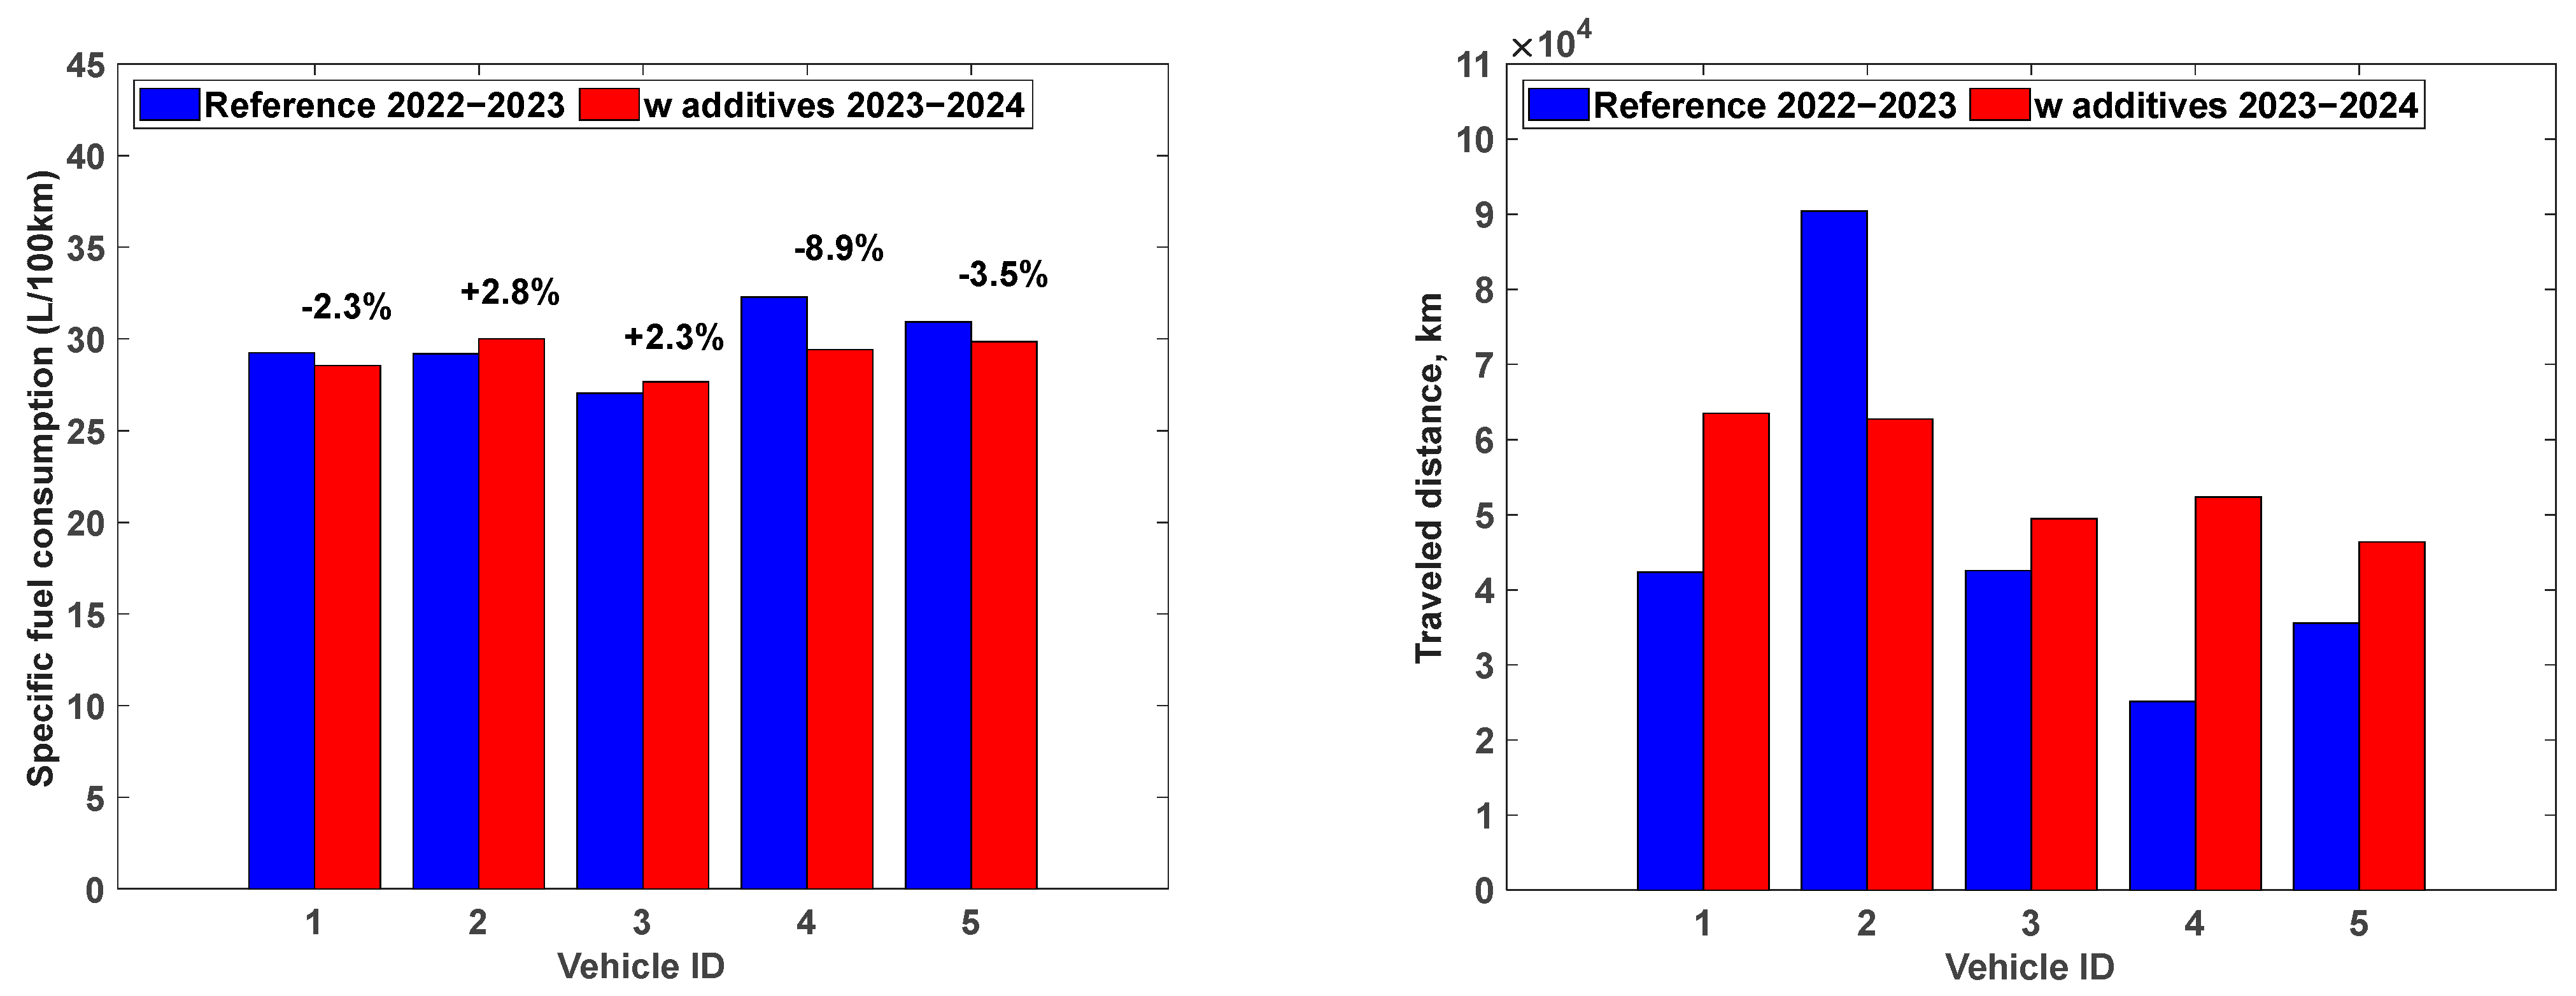
Figure 5 (left). Notably, vehicles #2 and #3 exhibited a slight increase in fuel consumption of +2.8% and +2.3%, respectively (compared to +1.5% and +3.1% prior to filtering). Additionally, with the exception of vehicle #2, all vehicles running on fuel with additives covered a longer total distance compared to the same vehicles using the baseline fuel. This indicates a degree of heterogeneity in the dataset, as illustrated in
Figure 5 (right). To quantify the relative variability in fuel consumption across vehicles, the Coefficient of Variation (CoV) for each vehicle is reported in
Table 4. It should be emphasized that all five vehicles in the study are identical in make, model, age, and configuration, and were purchased simultaneously. Therefore, the observed per-vehicle differences in fuel consumption cannot be attributed to technical heterogeneity. The residual variability likely arises from operational factors including variations in routes, trip frequency, driver assignments, payload (not precisely recorded), and random external influences. As shown in the following, trip-level and route-specific filtering, as well as aggregation at the fleet level, are essential to reduce such noise and obtaining robust, generalizable insights.
5.2. Trips Clustering and Recurring Routes
To support a meaningful comparison of fuel consumption between the two monitoring periods, the filtered dataset was analyzed to identify recurrent origin–destination routes and evaluate the corresponding average fuel consumption under both fuel conditions. As a preliminary step, the geographic endpoints of all recorded trips were visualized using a scatter plot (
Figure 6). Each marker on the plot represents a trip destination, with its size proportional to the number of trips ending at that location and its color indicating the mean fuel consumption. The left panel refers to the Reference fuel, while the right panel shows data for the fuel with additives. This visualization highlighted the most frequently visited locations, namely Livorno, Milan, Turin, and Vado Ligure, a small city west of Genoa.
These cities were selected as starting points for identifying the most recurrent trips. For each selected starting point, all trips departing from that location were isolated. Among the various destinations reached from each origin, the one occurring most frequently was chosen as the representative endpoint of a recurrent route. Once the most frequent origin–destination pair was defined, a filtering step was applied to extract only those trips that followed this route pattern. To ensure data consistency, only trips that were part of the same day and carried out by the same vehicle were considered. Specifically, for each day in which a vehicle departed from the selected origin, all trips performed by that vehicle from the moment of departure until the end of its route that day were grouped together. This grouping allowed for the reconstruction of complete daily journeys along the recurrent route. The final dataset consisted of aggregated trips between a defined origin and destination, each representing a full operational cycle over a single day. For each of these grouped trips, total traveled distance, total consumed fuel, driving time, and average speed were computed. This method enabled a detailed and consistent comparison of the same route under two different fuel conditions (reference vs. with additives), eliminating variability due to route changes or partial trips.
This approach enabled the identification of recurring trips, which are listed in
Table 5. For each route, the average specific fuel consumption was computed, while COV and the number of available samples are reported in
Table 6. Several insights can be drawn from the data. In Vado Ligure, a depot is located where trucks typically load their tanks. This is supported by the data corresponding to trips originating from Vado Ligure (specifically, Vado Ligure–Cisliano and Vado Ligure–Villastellone), both of which show high fuel consumption values, indicative of loaded journeys. Conversely, the return trips (Cisliano–Vado Ligure and Villastellone–Vado Ligure) exhibit lower fuel consumption, suggesting that the trucks were empty when heading back to the depot. Notably, the trips associated with loaded conditions show the largest improvements in fuel efficiency, up to −5.1% in the case of Vado Ligure–Villastellone, highlighting enhanced engine performance under high-load operating conditions. Unfortunately, engine speed data were not available due to limitations of the data logging system. The Villastellone–Vado Ligure trip shows a slight increase (+1.89%) in fuel consumption with fuel with additives, which contrasts with the general trend. This could be due to variability in driving conditions, differences in payload or statistical noise. Generally, most trips show moderate improvements (−1.6% to −3.4%), with the best result (−5.1%) in the highest-consumption route (Vado Ligure–Villastellone). Notably, the same trip with additives represents a clear example of the high variability inherent in the data, in fact the CoV reaches 15%. Route-level findings indicate larger benefits under high-load conditions, consistent with injector cleanliness effects that improve atomization at higher fueling rates and with a reduced ignition delay due to increased cetane number. These mechanisms provide a coherent explanation for the observed pattern of savings across routes and operating states, while the trip-level CoV analysis clarifies that operational dispersion (payload, traffic, route profile) remains the dominant source of variability in real-world service.
5.3. Temporal Analysis
Monthly trends in specific fuel consumption and traveled distance per vehicle are presented in
Table 7 and
Table 8, respectively.
Table 7 reports the average fuel consumption (L/100 km) for each vehicle, comparing the Reference period (2022–2023) to the fuel with additives period (2023–2024), while
Table 8 details the corresponding monthly driven distances. It is noteworthy that, except for Vehicle #2, none of the trucks were in operation from January through March 2023, resulting in incomplete data for that interval.
A review of
Table 7 reveals a general tendency toward lower consumption when using fuel with additives. Notable decreases include −7.2% for Vehicle #1 in May and −6.8% in November, as well as −5.8% for Vehicle #1 in December. Vehicle #3 shows modest savings (–1.1% in May) and severe increases in October, November and April. However, the differences in traveled distance in these months are high (+234% in April), making the comparison not significant. Vehicle #4 and Vehicle #5 also benefit by up to −12.7% (April) and −4.8% (June), respectively. Vehicle #2 exhibits occasional increases in consumption too, most markedly +12.0% in June, reflecting differences in its operational profile or load conditions during the fuel with additives monitoring period.
Table 8 indicates that the total driven distance per month varies substantially between the two periods, with an average fleet-wide difference of 14.7%. For example, Vehicle #1 covered 7272 km in December 2022 but only 4956 km in December 2023 (–32%), whereas Vehicle #2 increased its mileage by +33% in February under the fuel with additives. These distance fluctuations can impact consumption comparisons: for instance, Vehicle #1’s +30% increase in June distance corresponds to a −4.4% change in consumption, suggesting consistent efficiency gains even under higher utilization. Conversely, large reductions in mileage (e.g., Vehicle #5’s −51% in December) may amplify random variations in consumption metrics.
Overall, the temporal analysis confirms that the fuel with additives fuel generally delivers fuel efficiency improvements across a variety of operating conditions. The magnitude of these gains, however, is influenced by each vehicle’s usage pattern—both in terms of mileage and load—and by the presence of data gaps in certain months.
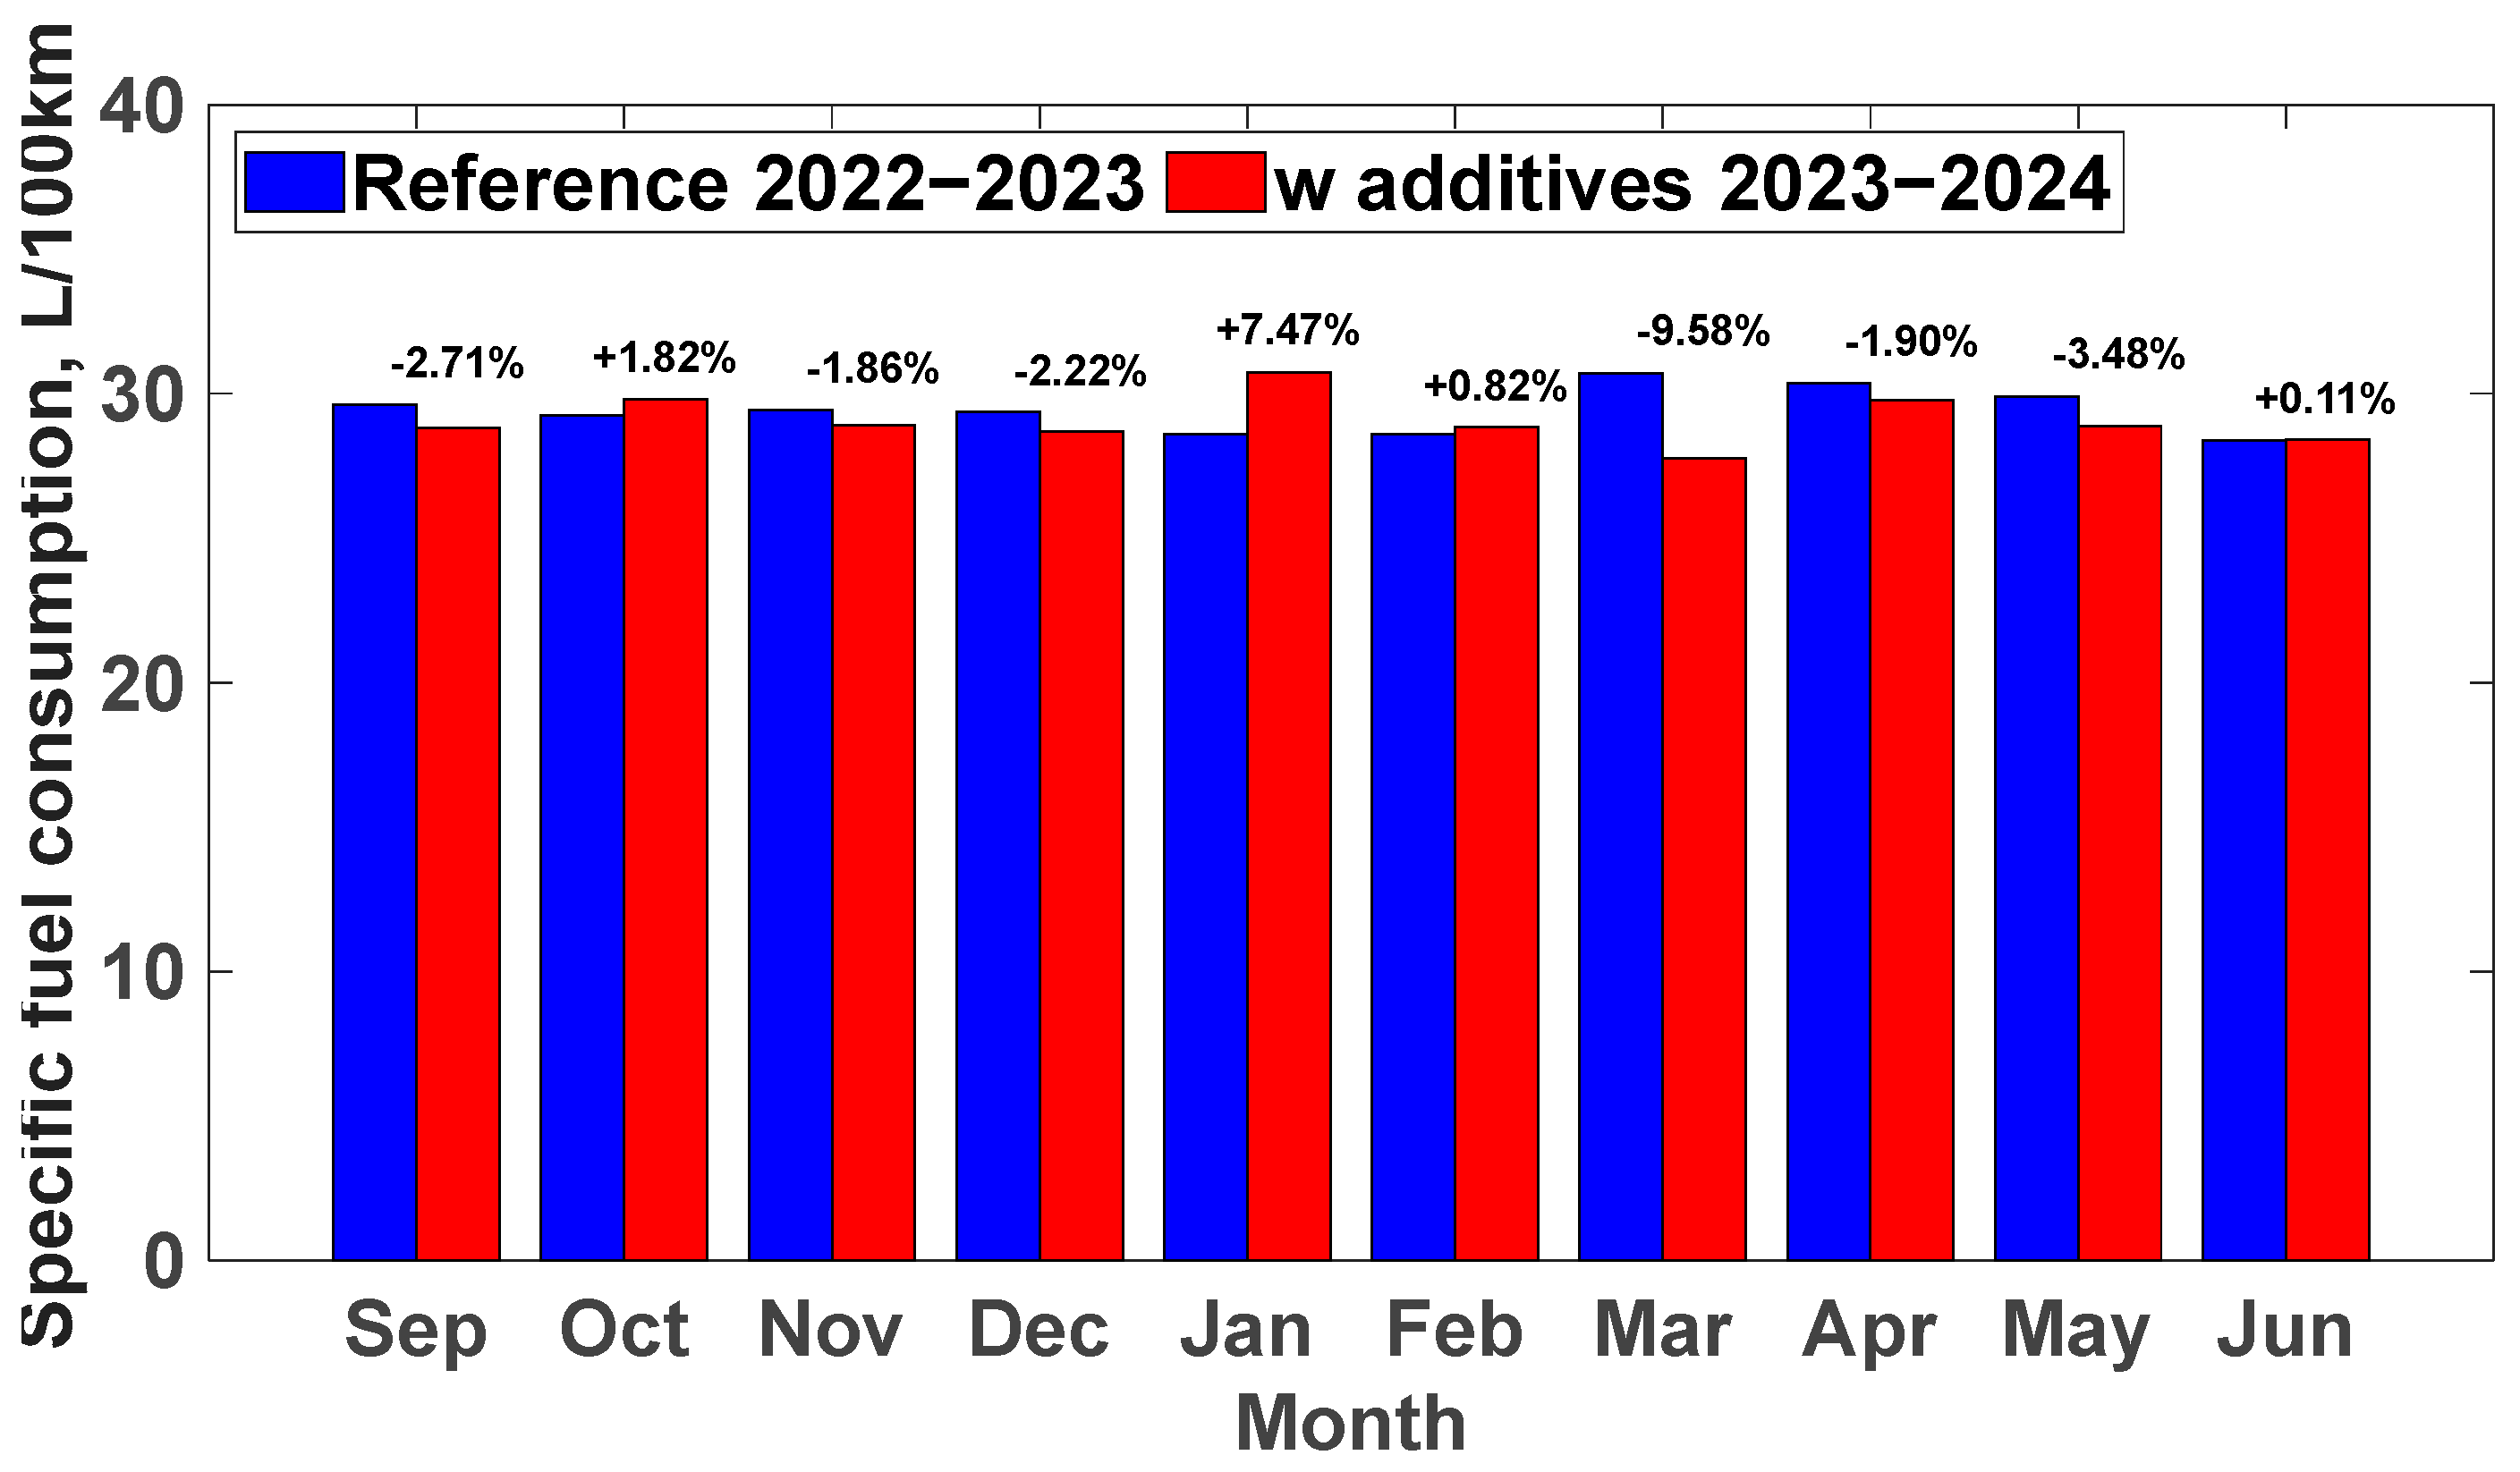
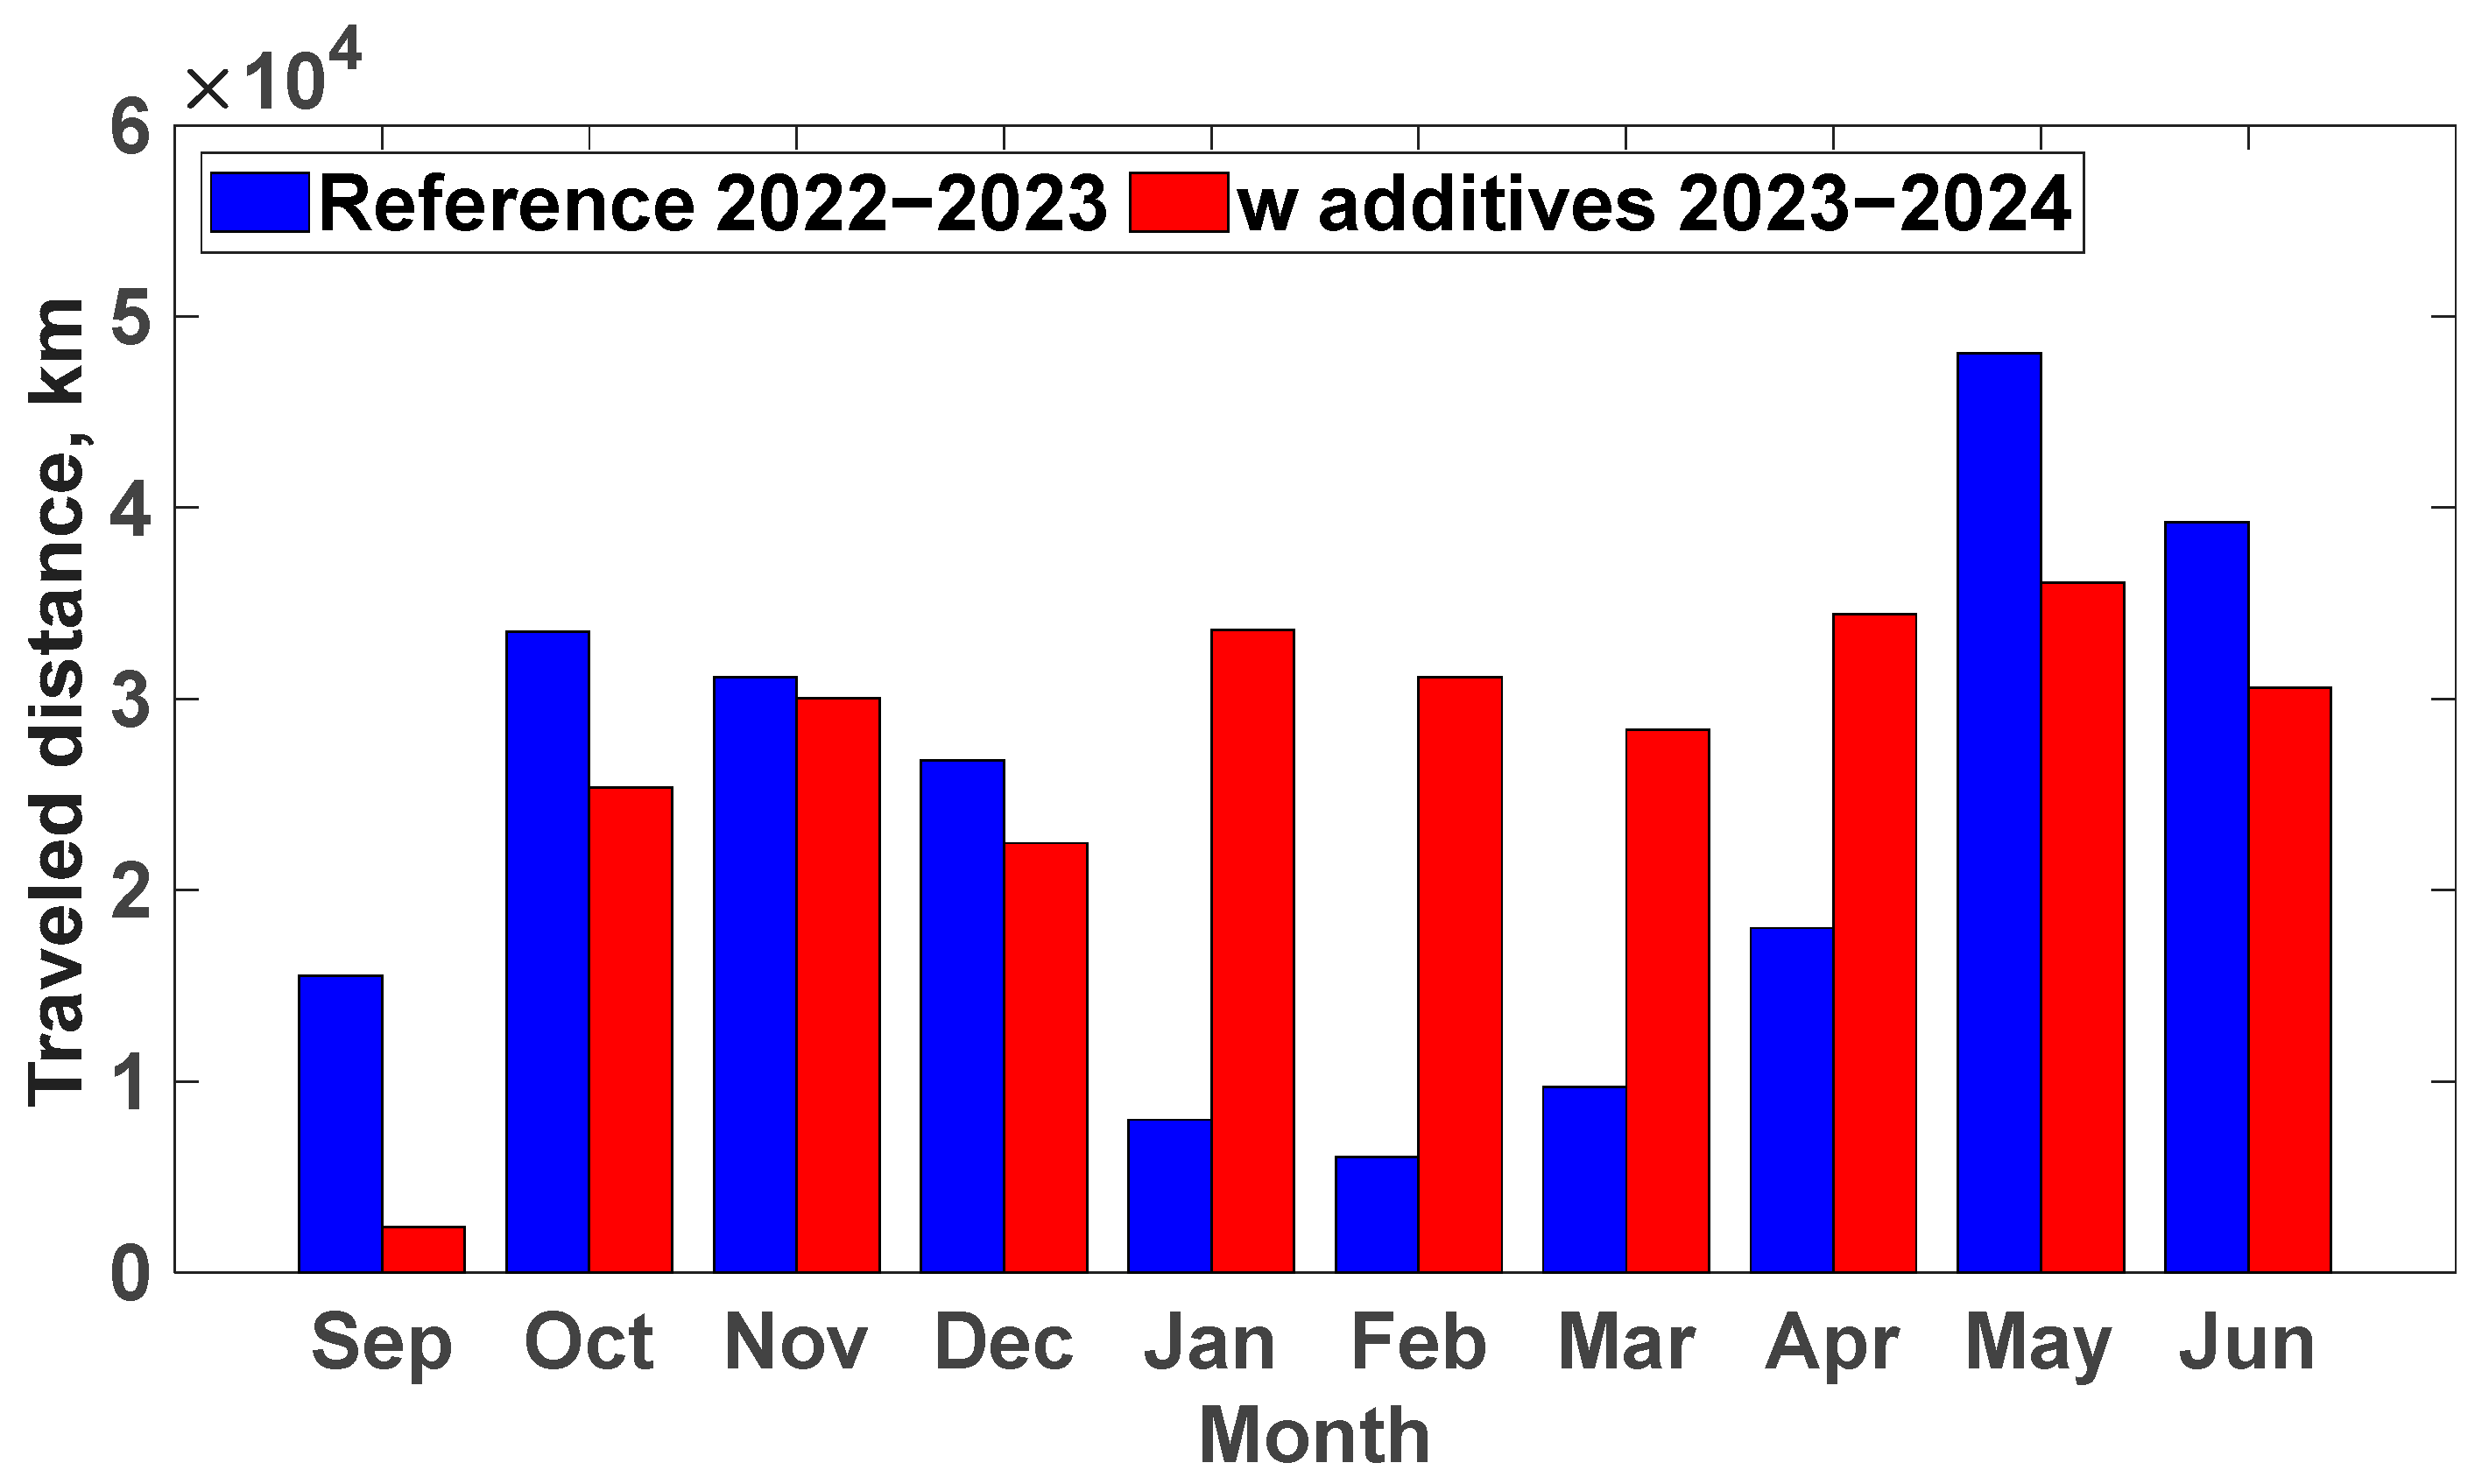
To reduce the heterogeneity inherent in individual vehicle samples and enable a clearer assessment of fuel performance, the monthly consumption and mileage data were aggregated at the fleet level. This consolidation allowed for the identification of overall trends while minimizing the influence of vehicle-specific variability. The resulting fleet-wide data, organized on a temporal basis, are illustrated in
Figure 7 and
Figure 8. It is evident that fluctuations in fuel consumption gains are greatly reduced. The most significant are in January (+7.47%) and March (−9.58%). However, considering the huge differences in mileage, data collected in September, January, February and March are not representative of the general trend.
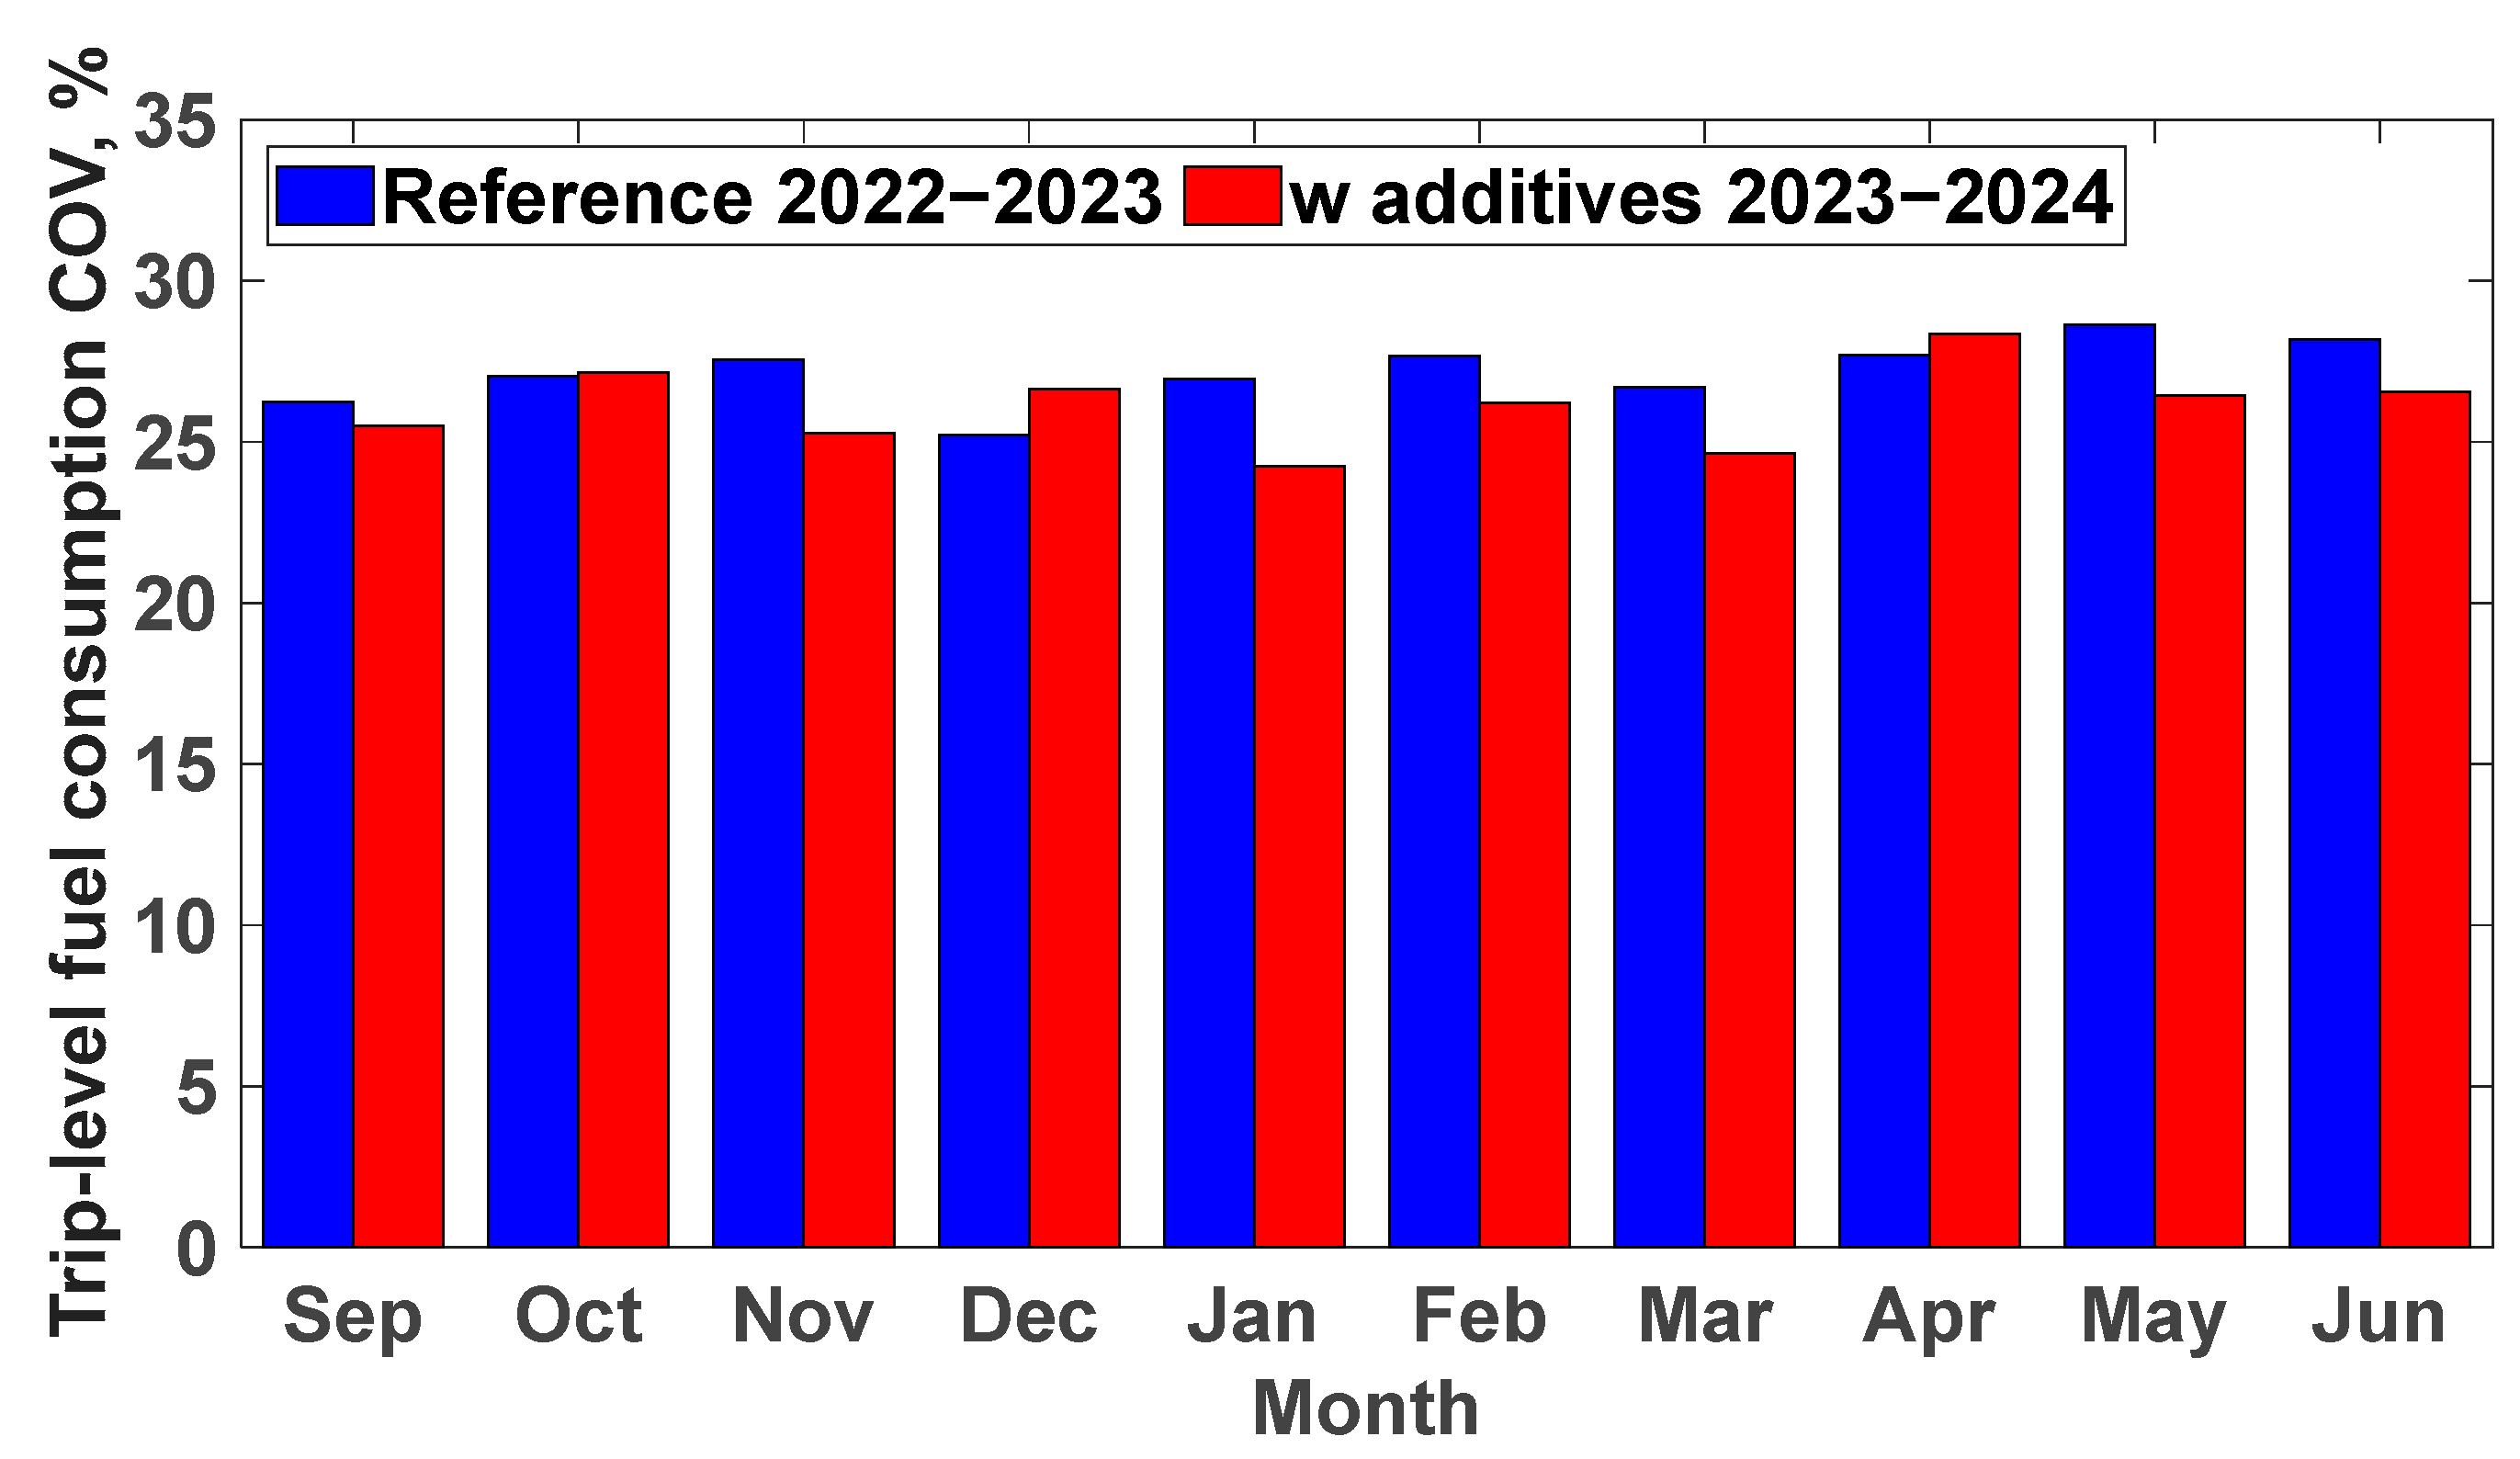
Figure 9 presents the CoV of the specific fuel consumption calculated from all trips performed by the fleet members in each month. The CoV values confirm significant variability in trip-level fuel consumption, with monthly averages ranging approximately from 25% to 29% during the baseline period and 24% to 28% during the second one. This metric captures the large monthly dispersion in trip-level consumption arising from differing driving conditions, payloads, route profiles, and operational contexts. These differences introduce substantial variability, which can hinder a consistent evaluation of fuel performance when data are considered on a per-vehicle basis. Therefore, a global analytical approach, based on aggregated fleet-level data, proves to be more robust and meaningful, as it effectively reduces sample variability and enhances the reliability of the comparative assessment between the two fuels.
6. Impact on CO2 Emissions: An Italian and European Scenario
Across Europe, millions of heavy-duty vehicles are currently in operation. In 2023, more than 4.0 million goods vehicles (>3.5 tons) were registered within the EU, with Poland (18%), Germany (14.2%), France (10.2%), and Spain (9.5%) accounting for the largest shares [
29]. The International Road Transport Union (IRU) estimates a total fleet of approximately 6.75 million trucks in Europe (classes N2 and N3) [
30]. Including non-EU countries like the United Kingdom, which has about 625,800 heavy goods vehicles (HGVs), the European heavy-duty fleet likely exceeds 7–8 million units [
31].
The average age of HDVs in the EU is notably high, (between 13.9 and 14.1 years), making them the oldest vehicle category in the European transport sector. Countries like Greece exhibit the oldest fleets (average of 23 years), whereas Austria and Luxembourg have the newest (6.7 and 7.6 years, respectively). The substantial presence of aging trucks, typically less fuel-efficient and more prone to internal deposit formation, presents a strong opportunity for performance restoration via premium diesel fuels. However, data from Eurostat show that 60% of the EU’s total freight activity (in ton-kilometers) is still performed by trucks aged 5 years or less, highlighting a dual challenge: improving fuel efficiency in the aging fleet while preserving optimal performance in newer, high-utilization vehicles [
29].
Premium diesel fuels can address both needs simultaneously offering advanced cleaning and protective properties. Their use not only restores performance in older engines but also helps maintain optimal combustion efficiency in newer models, offering a system-wide strategy for fleet optimization.
Several major European markets already offer premium diesel fuels for HDVs. In Italy, IP (Gruppo API) markets Optimo Diesel [
32]. Shell V-Power Diesel [
33] and BP Ultimate Diesel with ACTIVE technology are available across multiple countries and also target heavy-duty applications [
34]. Repsol launched Nexa, a 100% renewable premium diesel, in Spain in late 2024, specifically designed for fleet use [
35]. In Germany, Aral Ultimate (by BP) is widely distributed [
36], alongside growing availability of HVO biodiesel alternatives. In France, Total Excellium represents a similar high-performance offering [
37]. There is no exhaustive public data on the exact volumes sold of these products.
To assess the impact of widespread adoption, consider a scenario where all 6.75 million HDVs in the EU reduce fuel consumption by 1% due to consistent use of premium diesel. Assuming each truck drives approximately 100,000 km/year with an average fuel consumption of 30 L/100 km (as reported in the previous section), this results in a per-vehicle annual consumption of ~30,000 L. The total fleet would then consume ~202 billion liters of diesel per year. A 1% reduction equals savings of 2.02 billion liters. Given that each liter of diesel emits approximately 2.6 kg of CO
2, this translates to roughly 5.25 million tons of CO
2 avoided annually [
38]. Even under a more conservative assumption of only 1 million HDVs adopting premium diesel, the avoided emissions would still amount to nearly 0.8 million tons of CO
2. These figures underscore the large-scale environmental benefit that even marginal efficiency gains can generate when applied across an entire sector.
The benefits of adopting premium diesel fuels extend well beyond environmental considerations. In fact, they deliver significant economic returns for fleet operators. Improved combustion efficiency translates into substantial cost savings, particularly in a sector where operating margins are increasingly pressured by rising energy prices. Moreover, the detergency and protective properties of premium fuels help prevent deposit formation on critical engine components, reducing the frequency of unplanned maintenance and extending engine lifespan. These operational improvements contribute not only to lower total cost of ownership but also to enhanced vehicle availability and productivity. Importantly, the cost of blending commercial detergent and cleaning additive packages into diesel typically ranges from only €0.03 to €0.05 per liter, representing roughly 2–4% of average wholesale diesel prices in Europe. The realized fuel economy benefit depends on vehicle condition: older, high-mileage trucks or those with substantial injector fouling experience the largest gains, while well-maintained fleets demonstrate more modest but still positive returns. Maintenance savings due to reduced injector fouling and extended service intervals may also accrue. Although a full, vehicle-specific cost–benefit analysis falls beyond the scope of this telematics-based study, the marginal additive cost is negligible compared to potential fuel and maintenance savings, confirming its practical feasibility for most fleets.
7. Conclusions
In the European context of accelerating CO2 emission reductions from the heavy-duty vehicle sector, this study proposed a detailed analytical methodology to assess the effect of performance fuel additives on fuel consumption optimization. The experimental campaign was conducted on a fleet of five Euro 6-compliant heavy-duty road tractors (vehicle category N3, gross vehicle weight > 12 tons), all equipped with tanker semi-trailers and operating under typical long-haul conditions. During the first phase, lasting ten months, the vehicles were fueled with standard EN 590 diesel containing 6–7% FAME. In the second phase, the same fleet operated under comparable conditions using a commercially available diesel fuel containing a proprietary additive performance package. Fuel consumption and vehicle activity were monitored using a GPS-based tracking system interfaced with the engine control unit via the OBD port and integrated with the Masternaut platform. The system enabled real-time data acquisition through a GPRS connection, providing access to detailed information on fuel use and route profiles. A preliminary analysis of the raw dataset showed an average reduction in fuel consumption of approximately 1.1% with the use of the fuel with additives. To ensure data quality and remove bias from short, irregular, or stop-and-go trips, several filtering strategies were applied, setting thresholds on minimum trip length, average speed, and fuel usage. The refined dataset confirmed a consistent average reduction in fuel consumption of 1%.
To further validate the comparison between fuels, the analysis focused on identifying and isolating recurrent origin–destination routes. For each starting point, all trips were grouped by destination, and the most frequently occurring route was selected as a representative sample. Notably, trips involving loaded conditions exhibited the most significant improvements, with fuel savings reaching up to 5.1% on the Vado Ligure–Villastellone route. Conversely, a minor increase in fuel consumption (+1.89%) was observed on the reverse route (Villastellone–Vado Ligure), possibly due to unaccounted variations in driving conditions, payload, or measurement noise. In general, most matched trips showed moderate yet consistent improvements in fuel efficiency, ranging from −1.6% to −3.4%, particularly under high-consumption scenarios. The temporal analysis of monthly fuel consumption and traveled distance per vehicle further supports the positive impact of fuels with additives across various operating conditions. However, the magnitude of observed benefits was found to be influenced by vehicle usage patterns, total mileage, and occasional data gaps in certain periods. Overall, a global, aggregated analytical approach at the fleet level proved more robust and reliable than disaggregated comparisons, as it minimized variability and enhanced the consistency of the results.
To assess the broader implications of these findings, a European-scale scenario was considered. If the entire EU HDV fleet, estimated at approximately 6.75 million vehicles, achieved a 1% reduction in fuel consumption through the widespread use of performance diesel fuels, the resulting savings would amount to over 2 billion liters of diesel per year. Given an average emission factor of 2.7 kg of CO2 per liter of diesel, this reduction would correspond to nearly 5.25 million tons of CO2 avoided annually. Even under a more conservative scenario, in which only 1 million vehicles adopted premium diesel, the emissions avoided would still approach 0.8 million tons of CO2. These results demonstrate how small improvements in fuel efficiency, when applied across a large and active fleet, can yield substantial environmental benefits.
Importantly, the advantages of premium diesel fuels are not limited to environmental impact. Economic and operational benefits also emerge. Reduced fuel consumption lowers operating costs, an especially valuable gain in a sector subject to tight margins and rising fuel prices. Furthermore, the cleaning and protective properties of fuel additives can help reduce injector fouling, extend engine life, minimize unscheduled maintenance, and preserve optimal engine performance. These co-benefits are particularly relevant given the current composition of the European HDV fleet, where the average vehicle age exceeds 13.9 years, and diesel-powered trucks still account for over 95% of new registrations.
In conclusion, while the long-term goal remains the widespread adoption of zero-emission vehicles, premium fuels with additives offer a practical, readily deployable solution to enhance fuel efficiency and reduce CO2 emissions in the short-to-medium term. As such, they represent a valuable bridge technology to support the decarbonization of road freight transport during the ongoing energy transition.
