Article

Unsupervised Profiling of Operator Macro-Behaviour in the Italian Ancillary Service Market via Stability-Driven k-Means

by
Mahmood Hosseini Imani
* and
Atefeh Khalili Param
Department of Energy, Politecnico di Torino, 10129 Torino, Italy
*
Author to whom correspondence should be addressed.
Energies 2025, 18(20), 5446; https://doi.org/10.3390/en18205446
Submission received: 15 September 2025 / Revised: 9 October 2025 / Accepted: 11 October 2025 / Published: 15 October 2025
(This article belongs to the Special Issue Policy and Economic Analysis of Energy Systems: 2nd Edition)

Abstract

The transition toward sustainability in the electric power sector, driven by increasingly renewable integration, has amplified the need to understand complex market dynamics. This study addresses a critical gap in the existing literature by presenting a systematic and reproducible methodology for profiling generating-unit operators’ macro-behaviour in the Italian Ancillary Services market (MSD). Focusing on the Northern zone (NORD) during the pivotal period of 2022–2024, a stability-driven k-means clustering framework is applied to a dataset of capacity-normalized features from the day-ahead market (MGP), intraday market (MI), and MSD. The number of clusters is determined using the Gap Statistic with a 1-SE criterion and validated with bootstrap stability (Adjusted Rand Index), resulting in a robust and reproducible 13-group taxonomy. The use of up-to-date data (2022–2024) enabled a unique investigation into post-2021 market phenomena, including the effects of geopolitical events and extreme price volatility. The findings reveal clear operator-coherent archetypes ranging from units that mainly trade in the day-ahead market to specialists that monetize flexibility in the MSD. The analysis further highlights the dominance of thermoelectric and dispatchable hydro technologies in providing ancillary services, while illustrating varying degrees of responsiveness to price signals. The proposed taxonomy offers regulators and policymakers a practical tool to identify inefficiencies, monitor concentration risks, and inform future market design and policy decisions.

1. Introduction

The electric power sector is undergoing a profound transition toward sustainability, marked by the rapid integration of renewable energy resources and increased market complexity. Rising shares of non-programmable renewable generation, distributed energy resources, and the progressive decommissioning of conventional thermal fleets have amplified the need for flexibility to maintain real-time system balance. In parallel, many countries have reformed their power markets to accommodate new participants and technologies, making balancing operations more dynamic and multifaceted [1,2]. In the Italian market design, bulk energy is cleared day-ahead (MGP), imbalances are re-optimized intraday (MI), and system security is ensured through the Ancillary Services Market (Mercato per il Servizio di Dispacciamento, MSD) [3]. The MSD is operated by the Transmission System Operator (TSO) Terna, and it is characterized by unique features such as compulsory participation for qualified units and the absence of a simple merit-order dispatch. This evolving context underscores the importance of understanding how generation operators adapt their bidding behaviour across multiple market sessions, especially in the face of new operational challenges and opportunities brought by the energy transition.
In liberalized electricity markets, each production unit (PU) engages in strategic bidding across sequential markets, forming an overall behavioural profile or macro-behaviour in contrast to centralized dispatch systems. The term, macro-behaviour, of PUs refers to their aggregate bidding and operating patterns across market sessions over time. Essentially, how a unit or operator manages its offers in the day-ahead, intra-day, and ancillary services markets as a cohesive strategy. Rather than examining individual bids in isolation, analyzing macro-behaviour entails capturing broad tendencies such as preferred price levels, volumes offered or withheld, and responsiveness to varying market conditions. Understanding these holistic patterns is increasingly relevant as systems integrate more intermittent resources and as market rules evolve to reward flexibility.
Early studies of operator behaviour in liberalized markets often concentrated on narrow aspects or single markets. Internationally, researchers have explored topics ranging from strategic bid optimization to market power monitoring, often focusing on day-ahead energy auctions or single-region case studies [4,5,6,7,8,9]. In the Italian context, the Ancillary Services Market has attracted growing analytical attention due to its critical role and complexity. In [10], the author examined a dispatching procedure where Terna (Italian TSO) activates reserves in advance that may ultimately go unused, known as the “opposite call”. This thesis identified conditions under which such costly reserve activation occurs, highlighting challenges in forecasting real-time needs. Another study analyzed the variability in offer curves of two major operators in Northern Italy, leveraging a novel multidimensional data analysis tool to capture how their bids shifted over time [11]. On the forecasting side, ref. [12] compared machine-learning classifiers for predicting MSD dispatch outcomes (acceptance of “Step 1” balancing offers), finding that data-driven models can modestly anticipate TSO decisions. These works each addressed a single facet of operator behaviour, from a particular contingency to the predictive modelling of bid acceptance.
More recently, comprehensive approaches have emerged to characterize PU’s behaviour across markets. In this regard, ref. [13] presented the first wide-ranging analysis of Italian electricity market participation, by assembling multi-year data (2017–2019) and studying their macro-behaviour across the MGP, MI, and MSD simultaneously. An important feature of that analysis was the use of capacity-normalized metrics to enable fair comparisons between large and small units. This approach revealed significant diversity in bidding strategies. Such variations imply that not all eligible units pursue fully competitive or profit-maximizing tactics in the ancillary market at all times. For instance, a behaviour the author described as “surprising” and potentially sub-optimal, in one cluster, a major operator’s units were found to use identical hourly offer prices for almost entire days regardless of changing MGP prices, reflecting simplified heuristics or operational constraints rather than dynamic price optimization. Identifying such patterns requires robust, data-driven techniques capable of clustering similar strategy profiles while accounting for the multi-market context.
One promising approach to disentangle this complexity is to apply unsupervised clustering to operators’ multi-market performance indicators. Clustering helps group production units with analogous behaviour, creating a taxonomy of strategy models (e.g., “price-sensitive flexible generators” vs. “baseline providers”). Various clustering methodologies have been employed in power market analysis [14,15,16,17]. Hierarchical clustering with custom distance measures has been used, for instance, to group electricity supply curve shapes, and density-based methods can identify unusual bidding patterns as anomalies. Nonetheless, the k-means algorithm (Lloyd’s iterative partitioning method) remains one of the most popular tools due to its simplicity and interpretability. In the context of Italian markets, ref. [13] adopted k-means to segment units by macro-behaviour, but with important domain-specific adaptations. It means that all features were scaled per MW capacity, and the initial k-means results were refined via expert interpretation, i.e., examining each cluster’s bid profiles, technology mix, and operator identity to ensure the clusters were meaningful. This highlights a general point in the literature in which standard k-means might need enhancements to capture the nuances of electricity market data. Researchers have proposed adaptations such as stability-driven clustering to run the algorithm multiple times or with perturbations to verify cluster consistency [18,19].
Despite these advances, key gaps remain in the literature. No published study, to the best of our knowledge, has yet provided a reproducible clustering framework that spans multiple market sessions with up-to-date (post-2021) data for the Italian MSD. Previous analyses of operator behaviour in Italy either cover periods before major recent developments (e.g., before 2022’s extreme price volatility and policy updates) or focus on a single market in isolation. Crucially, the combination of capacity-normalized cross-market features and cluster stability assessment has not been systematically explored. This means that, to date, policymakers and researchers lack a robust taxonomy of bidding strategies that are validated on the most recent market conditions. In this regard, the analysis focuses on 2022–2024 to ensure consistency with the most recent regulatory regime, to account for the exceptional price volatility and policy updates of 2022. In summary, there is an evident need for an updated, transparent methodology to characterize PU macro-behaviour across the MGP, MI, and MSD.
To address the above gap, this paper proposes a comprehensive analysis of operator macro-behaviour in Italy’s NORD zone across the MGP, MI, and MSD (particularly focused on the Ancillary Services Market) for the years 2022–2024. The main contributions of this work are as follows:
  • Utilizing a Stability-Driven Clustering Framework as an unsupervised clustering methodology, to ensure that the identified groupings of production units are consistent and not artefacts of random seed selection.
  • Constructing an up-to-date dataset using capacity-normalized cross-market features.
  • Empirical taxonomy of bidding behaviours under recent market conditions (2022–2024) and interpreting each cluster with unit technology and ownership.
  • Covering the NORD, as the country’s largest market area, representing about two-thirds of national demand and hosting most of the large thermal and hydro plants that dominate MSD participation.
  • Insights into market design and transparency by comparing cluster profiles, shedding light on the diversity of bidding strategies and highlighting potential inefficiencies or opacities in the current market structure.
The remainder of this paper is organized as follows. Section 2 provides an introduction to the Italian electricity market and figures related to the market dynamics. Section 3 describes the data sources and data collection steps, including the extraction of cross-market variables and the capacity normalization procedure. Section 4 presents the stability-driven k-means clustering methodology. Section 5 discusses the implications of the results, examining how the clusters relate to known market behaviours. Finally, Section 6 concludes the paper, summarizing the insights and suggesting directions for future research and market policy improvements.

2. Italian Electricity Market

Italy’s day-ahead market (MGP—Mercato del Giorno Prima) is a zonal, uniform-price auction where most electricity is traded for delivery the next day, yielding zonal market prices and the PUN (Prezzo Unico Nazionale) as the reference national single price [3,20]. After the MGP closes, the intraday market (MI—Mercato Infragiornaliero) allows participants to adjust positions in multiple sessions (and, since 2022, continuous trading via XBID coupling) to handle forecast changes on the delivery day [3]. Finally, the Ancillary Services Market (MSD—Mercato per il Servizio di Dispacciamento) is managed by the TSO (Terna) to procure reserves, resolve grid constraints, and balance the system in real time. The MSD is split into a scheduling phase (ex-ante MSD) for congestion management and reserve procurement, and a real-time balancing phase (the MB market) [3,21]. Unlike the MGP/MI, which produce uniform zonal prices, the MSD is a pay-as-bid mechanism., i.e., each accepted offer (OFF: upward to increase generation or BID: downward to reduce generation) is paid its offer price, so there is no single clearing price [22]. This sequential MGP → MI → MSD design has been the backbone of Italy’s spot electricity market (MPE), ensuring that bulk energy trading occurs first, then fine-tuning via intraday, and finally system security via dispatching services. MSD actions are carried out on qualified production units, with Terna accepting the least-cost offers needed to maintain balance and reserve margins (e.g., FRR, RR) across Italy’s zones.
The Italian day-ahead market (MGP) traded between 278 and 289 TWh annually in 2022–2024, stabilizing around 284 TWh in 2024. The average PUN in 2022 surged to 303.95 €/MWh, by far the highest on record, driven by the gas crisis. The PUN’s coefficient of variation, which had spiked in 2022, dropped back to single digits by 2023. These trends reflect the post-crisis drop in gas (PSV gas fell to ~36 €/MWh in 2024) [23].
In the MSD, the total dispatch cost spiked in 2022 due to extreme fuel prices, even as Terna procured far less balancing energy than in prior years. In 2022, Terna activated only about 5.5 TWh of balancing energy (sum of upward and downward regulations) over the year [24]. Consequently, 2022 MSD costs rose to an estimated €1.3 billion (covering congestion management, reserve procurement, and energy balancing), up dramatically from pre-crisis levels. In 2023, dispatching costs and prices started to ease alongside falling gas prices. By late 2024, the MSD upward vs. downward price differential was hovering around 100–110 €/MWh [25] (down from 2022’s 237 €/MWh). By 2024, dispatch costs were trending back down toward pre-crisis levels, with improved renewables forecasting, new grid investments, and market reforms (e.g., the capacity market and faster gate closures) all contributing to a more efficient MSD.
The NORD market(covering northern Italy) is the country’s largest in both demand and generation. In 2022, approximately 196 TWh of electricity demand was cleared in the NORD, roughly 68% of national consumption, reflecting the heavy industrial and population load in the North. MGP prices in the NORD have historically been slightly lower than in southern zones (due to surplus local generation and import capacity) [26]. However, in 2022 this pattern flipped. The NORD experienced some of the highest zonal prices in the country, because severe hydroelectric deficit and grid constraints led to expensive generation in the North setting the price in many hours [27]. On the MSD, the NORD (along with adjacent Centro-Nord) consistently sees the highest participation and activation of balancing resources. Most large thermal plants that provide upward reserve are located in the North, and many grid congestion issues (especially during high north-to-south flow) are managed through NORD dispatch [28]. In 2022, for example, the North and Centre-North zones were the focus of Terna’s balancing actions, given the need to compensate for lost hydro and to import power across the Alps [24]. Thus, the NORD likely incurred a disproportionately large share of the MSD costs in 2022–2024, e.g., activating pricey gas units in the NORD for upward regulation during tight hours. The participation intensity in the NORD is high, virtually all major power plants in the zone are enrolled in the MSD, and new entrants (like aggregated demand response) are starting to appear.
During the 2022–2024 study period, Italy’s electricity market experienced several important events:
Capacity market implementation (2022), ARERA’s Resolution 566/2021/R/eel introduced a capacity fee effective 1 January 2022, and the first significant capacity auction occurred on 21 February 2022 [29].
UVAM rule revisions (2023), ARERA’s Resolution 366/2023/R/eel, adopted on 3 August 2023 and effective 1 November 2023, overhauled the UVAM pilot programme by removing reliability-test limits, restructuring products, indexing strike prices to the day-ahead market, and coordinating with other ancillary-service pilots [30].
Gas price spike (2022, European gas prices spiked dramatically twice during 2022). Early March saw record day-ahead electricity prices in Italy due to TTF futures exceeding €345/MWh, while 26 August 2022 marked the highest settlement price of TTF futures at €339.20/MWh [31].
These dates provide a timeline of the major market events that influenced Italian power prices and market rules during 2022–2024.
Figure 1 shows the hourly zonal price in the NORD market (€/MWh) from 2022 to 2024, highlighting the extreme volatility observed during 2022 due to the gas crisis. After mid-2023, prices stabilized at lower levels, with visible structural breaks aligned with the launch of the capacity market, the gas price peak, and the UVAM rule revision.
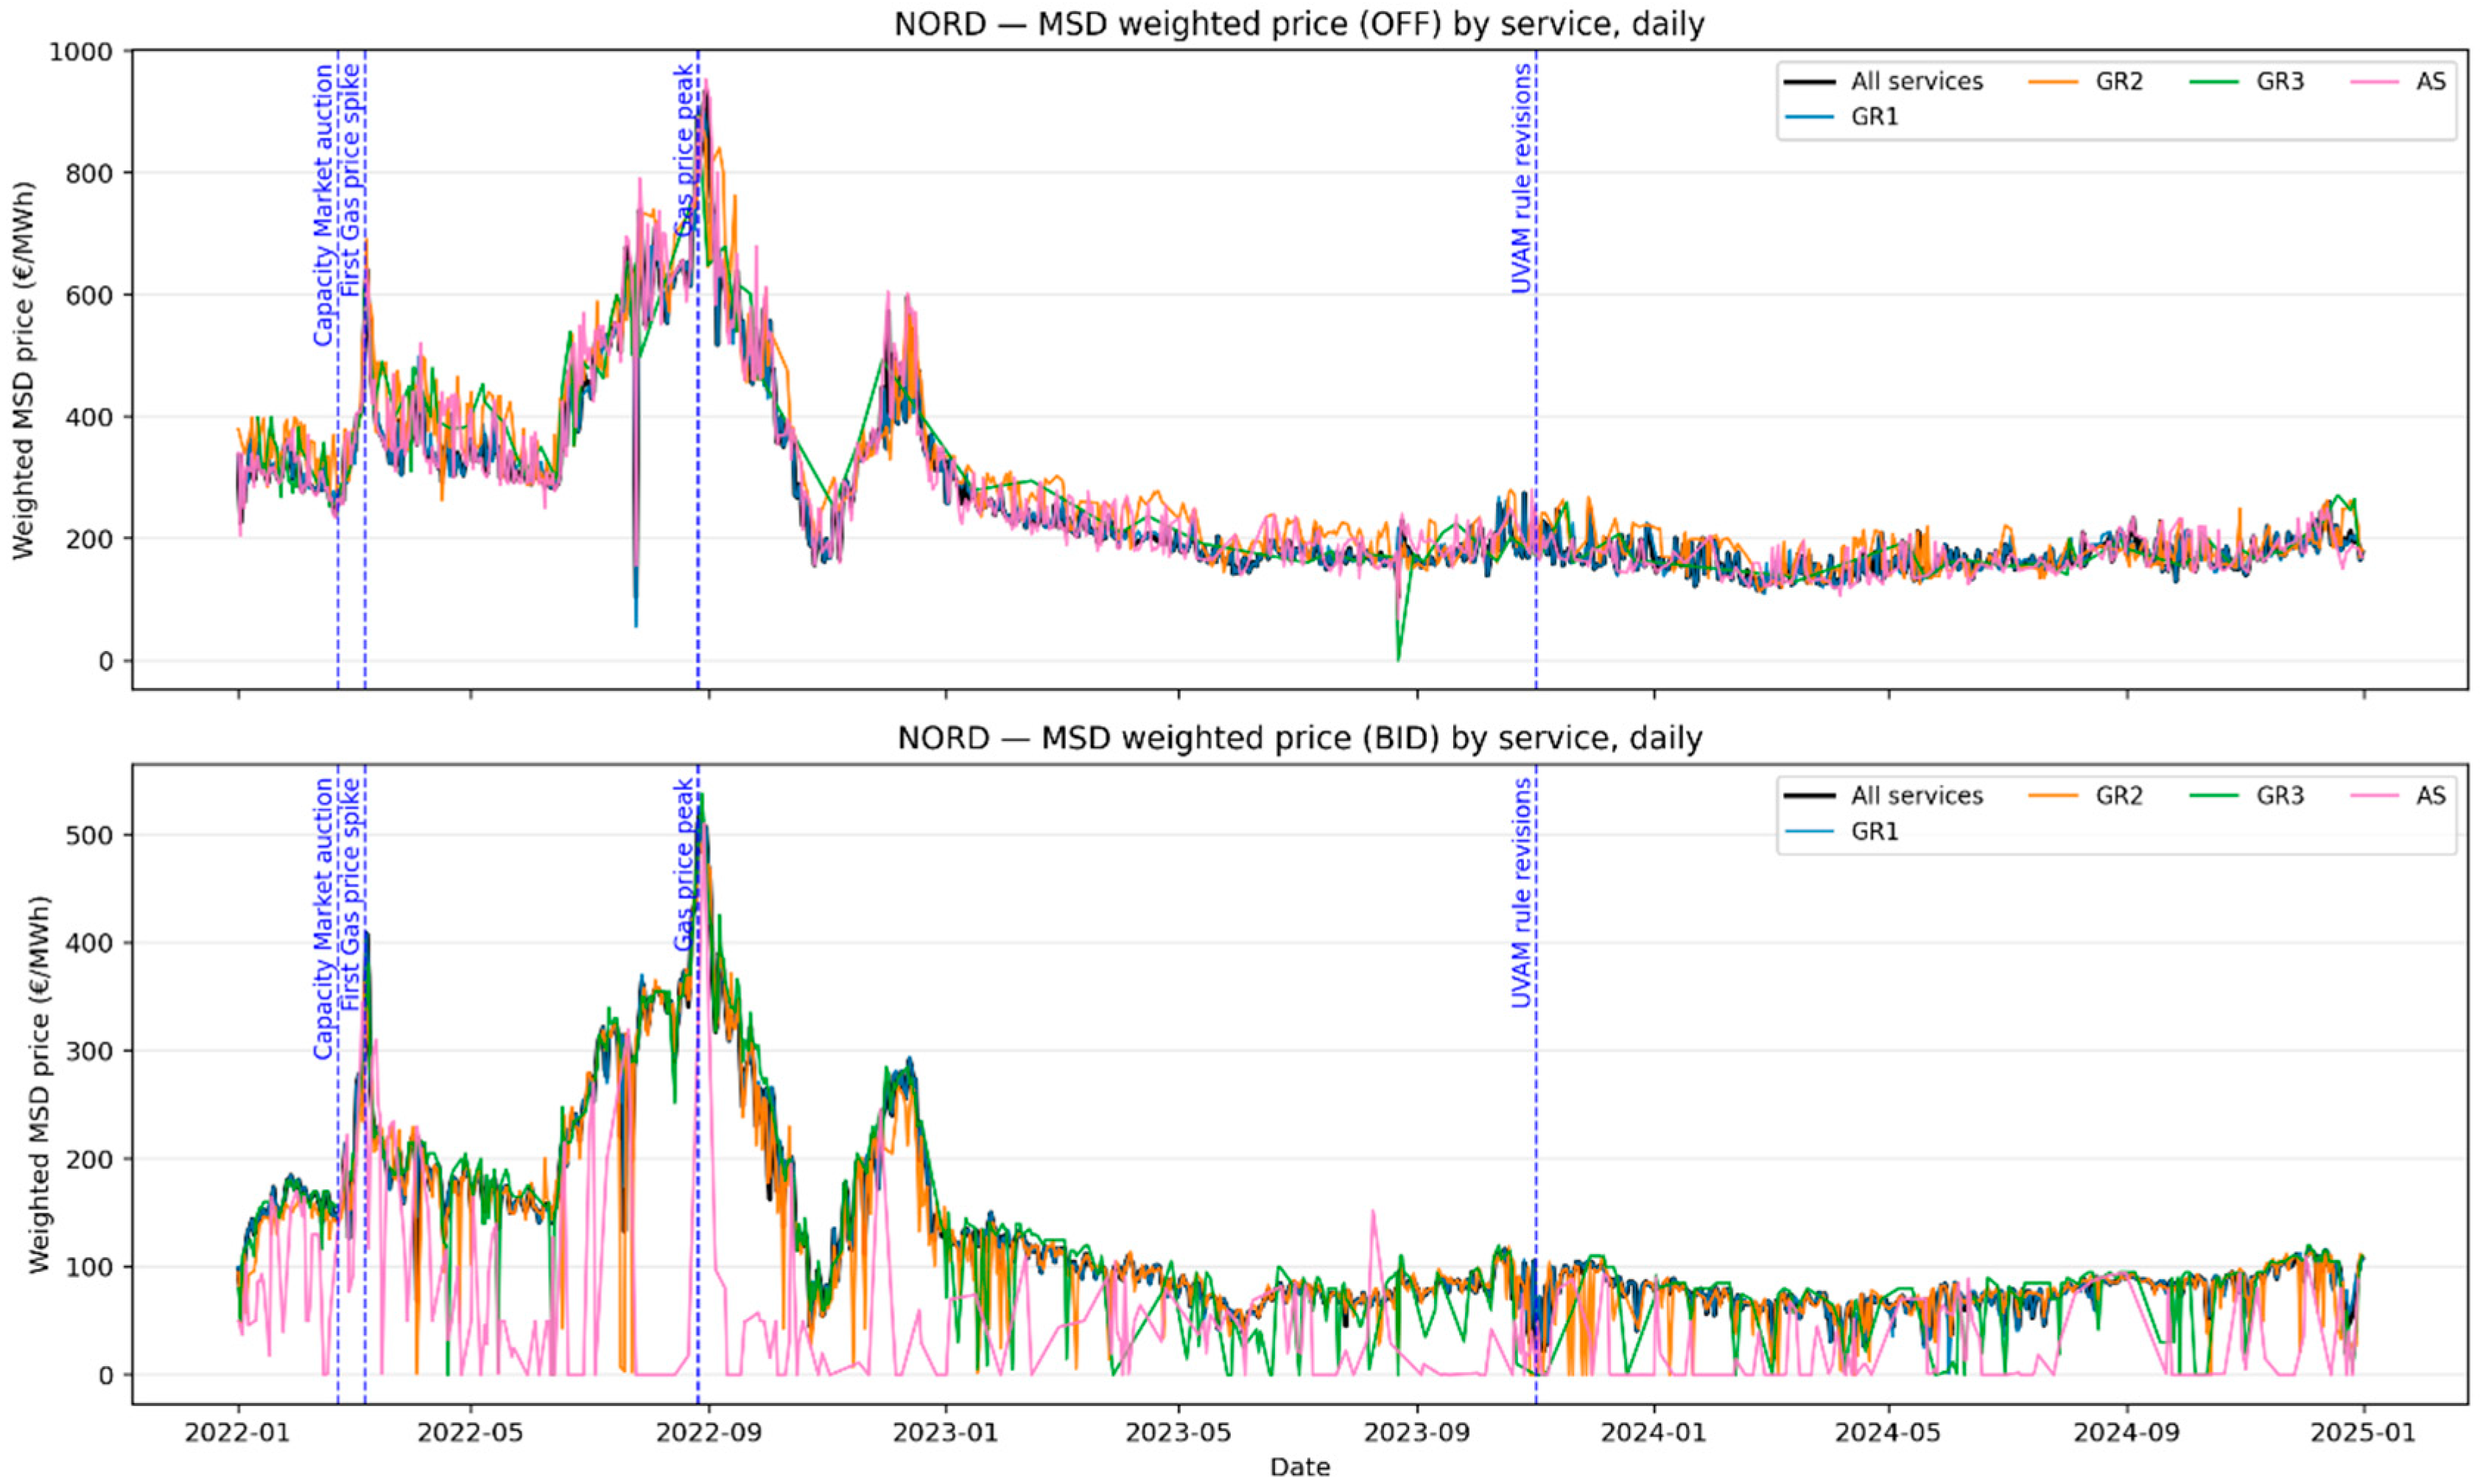
Figure 2 illustrates the evolution of daily weighted MSD prices (OFF and BID) in the NORD during 2022–2024. The detailed methodology for calculating the weighted MSD price is provided in [21]. The dynamics closely mirror the extraordinary volatility of 2022: prices surged following the gas price shock, peaking at historically high levels before gradually normalizing. The subsequent regulatory interventions (capacity market activation, UVAM rule revisions) coincide with a stabilization phase, as prices return to a narrower band consistent with declining fuel costs and improved system efficiency. The events therefore mark distinct breaks in MSD price trajectories, from crisis-driven spikes to progressively calmer market conditions.

3. Data Collection

3.1. Market Variables: MGP, MI, and MSD

As mentioned earlier, the Italian electricity market is characterized by three interlinked markets, the MGP, MI, and MSD. Since the ultimate focus of this study is on the bidding behaviour within the MSD, it was necessary to retrieve and process data from all three markets due to their intrinsic interdependence. The TSO in Italy relies on the outcomes of the MGP and MI when activating resources in the MSD, making their combined analysis essential.
Data for the three markets were obtained from the GME database [3]. For the reference period, three datasets were assembled for each market type, ensuring comparability across the Northern zone (NORD) and across years.
To summarize the essential information contained in each bid, a set of standardized variables was extracted. Table 1 provides an overview of the key variables common to the MGP, MI, and MSD [3].
In the MSD, two additional variables are relevant:
  • SCOPE, describing the type of service (AS, GR1, GR2, GR3, GR4), distinguishing whether the unit is starting up or increasing output in steps (Table 2).
  • ADJ_PRICE, a corrected price applied by Terna to ensure compliance with market constraints.

3.2. Production Units’ Selection and Features

3.2.1. Selection of Units

The scope of the study is restricted to the Italian NORD bidding zone, which includes regions such as Lombardia, Veneto, Emilia-Romagna, and Piemonte. This area represents the largest share of Italian demand and supply and therefore plays a dominant role in MSD outcomes.
Based on the retrieved data on MSD from GME, for the period 2022–2024, the number of active units in the MSD showed variation: 371 in 2022, 280 in 2023, and 402 in 2024. By the end of the triennium, a total of 268 distinct PUs were identified as active in the NORD. Compared with the MGP, participation is smaller because the MSD requires enablement. Sub-10 MW units typically enter only through aggregation (UVAM) with at least 1 MW of combined capacity, so many small generators are not present individually [32].
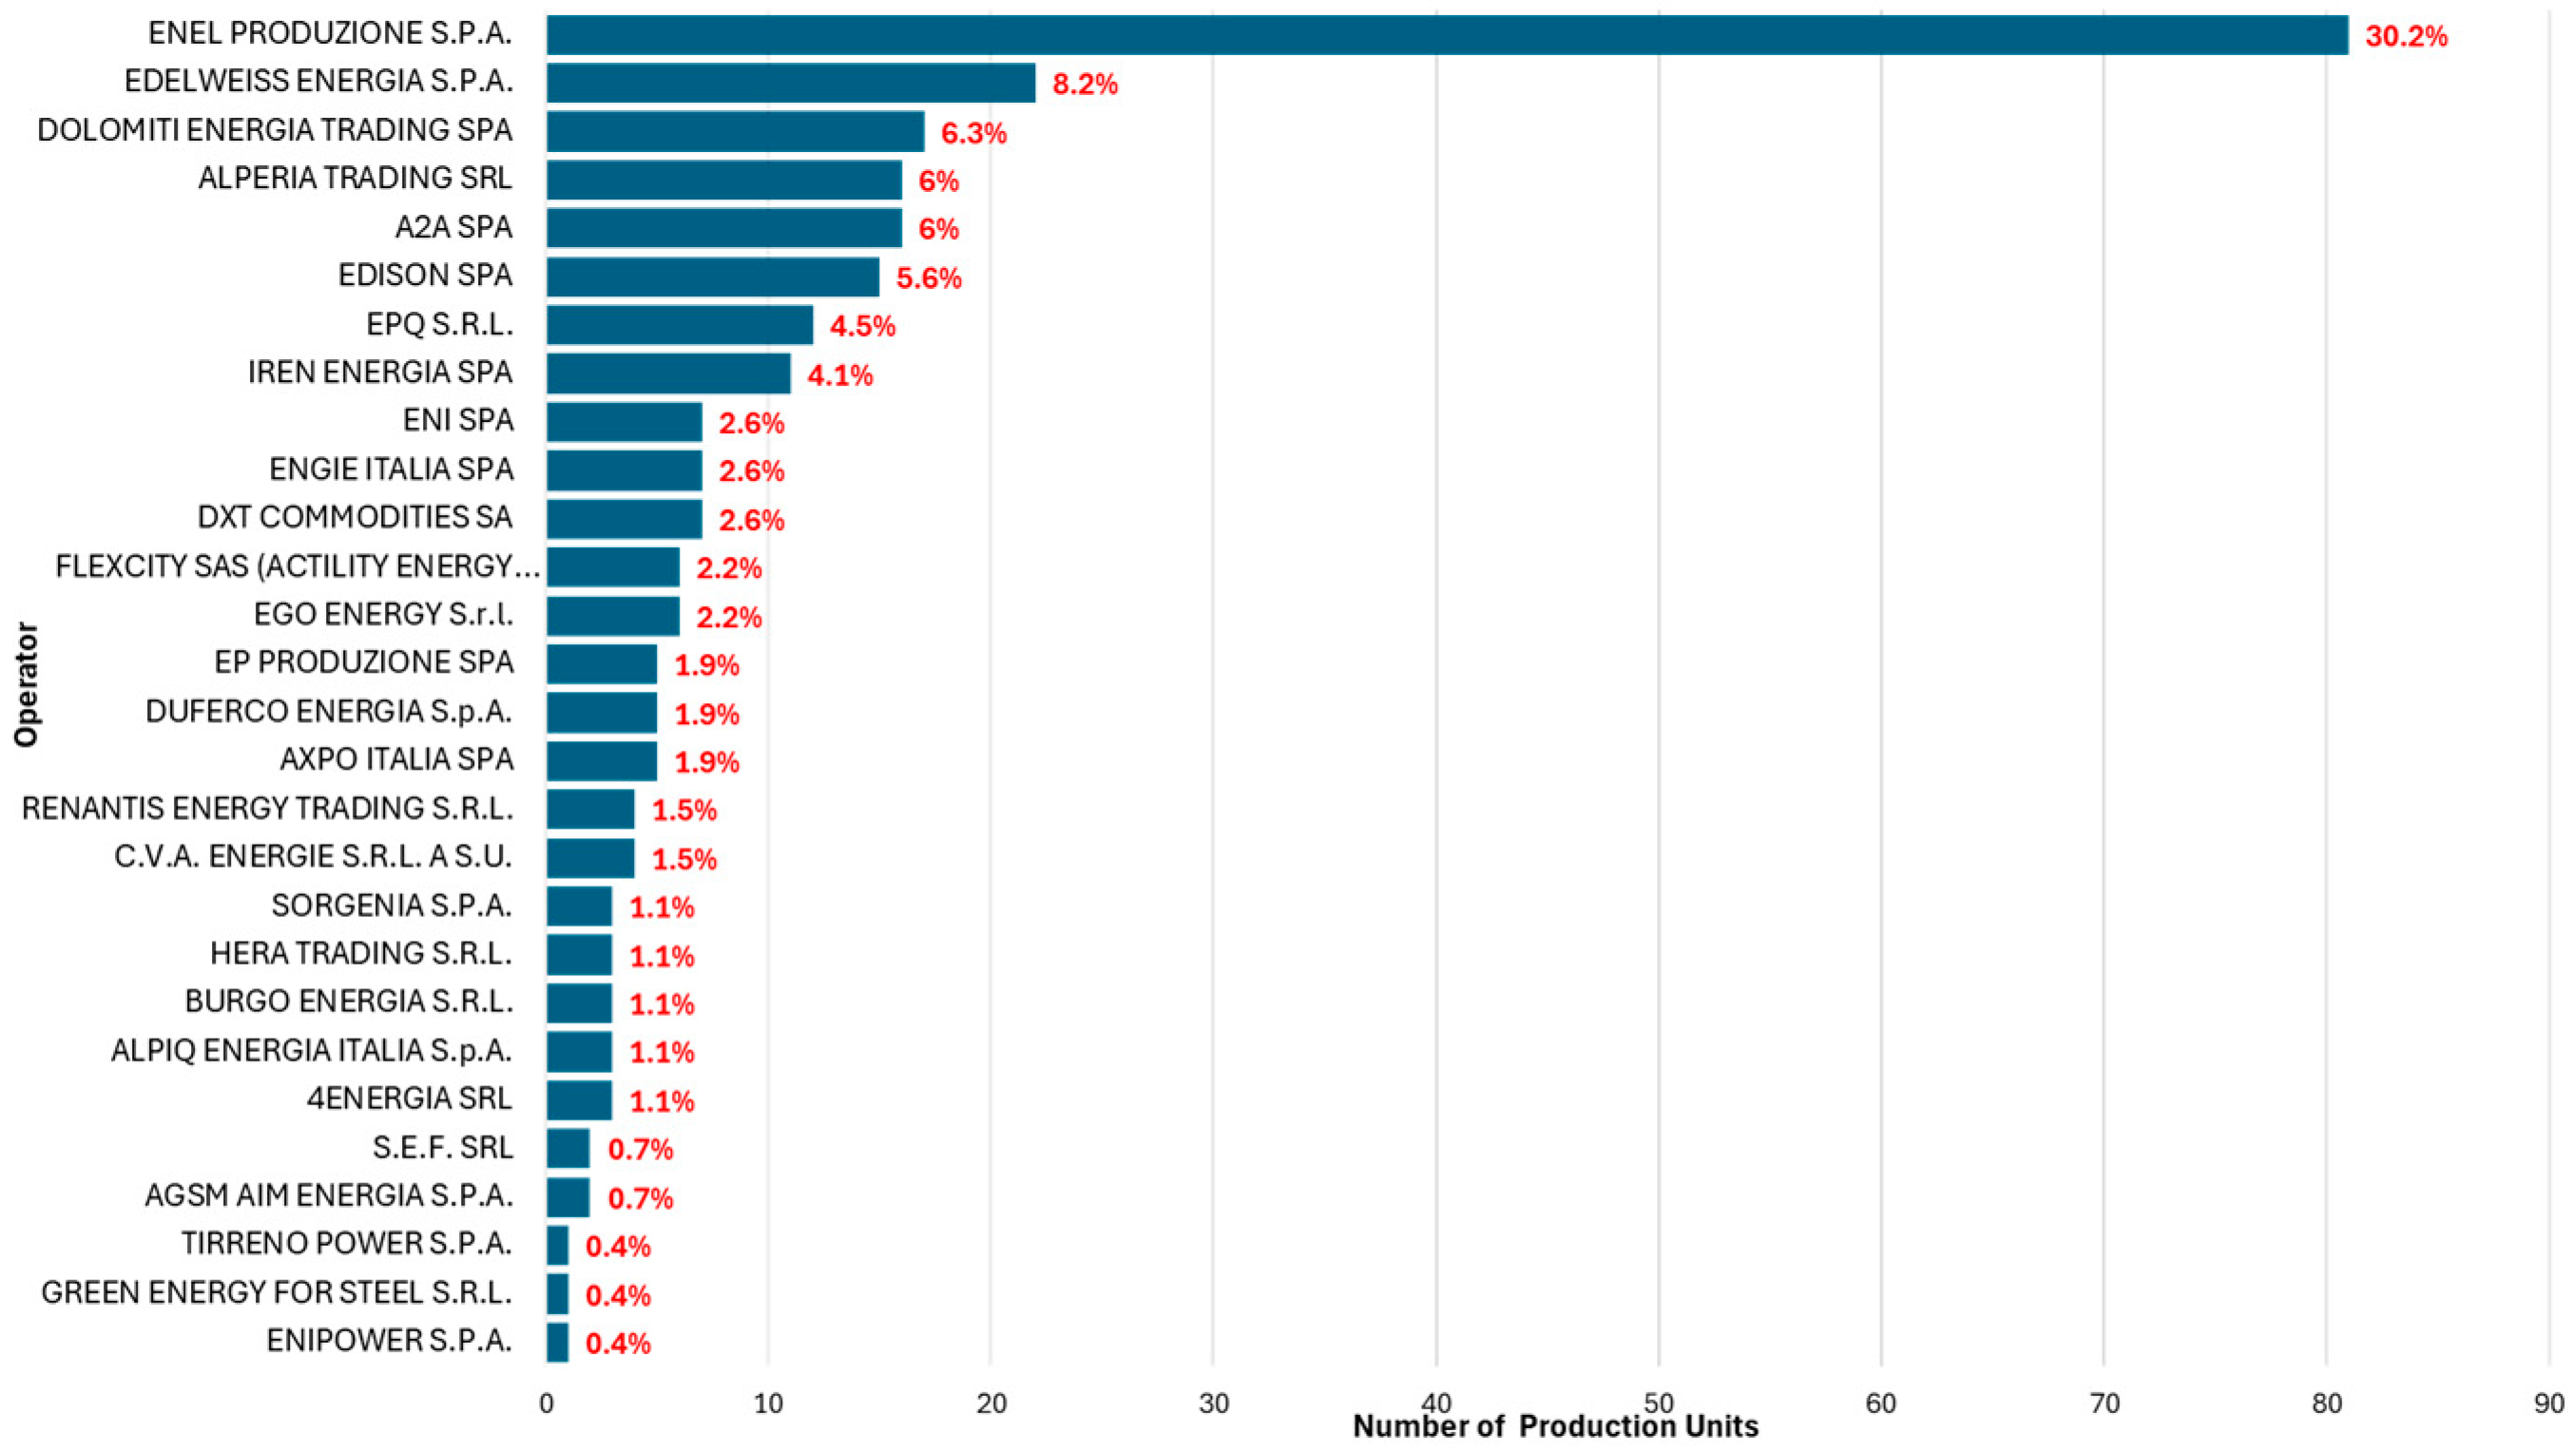
Figure 3 shows the distribution of PUs across operators in the NORD. ENEL Produzione dominates the market, accounting for 30.2% of all units, followed by Edelweiss Energia (8.2%), Dolomiti Energia Trading (6.3%), and Alperia Trading (6%). The concentration highlights ENEL’s pivotal role as a market leader, while the remaining operators hold smaller, fragmented shares.
Figure 4 depicts the breakdown of units by technology. Internal combustion engines (Motore Endotermico) represent the majority at 52.6%, followed by combined-cycle gas turbines (Ciclo Combinato, 18.7%), hydro with reservoir storage (Serbatoio, 12.7%), run-of-river hydro (Idrico Fluente, 7.1%), and basin hydro (Bacino, 6.3%). Less common are cascaded hydro schemes (Asta Idroelettrica), pure pumped-storage (Puro), and pumped-storage cascades (Asta Idroelettrica Pompaggio).
Detailed information on the PUs’ technology, energy source, installed capacity, and voltage level was compiled from the ENTSO-E Transparency Platform [33], Terna [34,35], academic theses [13,36,37], and publicly available datasets [38]. These features are listed in Table 3. It is necessary to mention that across our sources, the labels Tradizionale and Motore Endotermico are used inconsistently. In some datasets Tradizionale is an umbrella for non-CCGT thermoelectric units (legacy steam/boiler-turbine sets and reciprocating engines), while others explicitly tag reciprocating-engine plants as Motore Endotermico. Because our analysis targets market behaviour for dispatchable non-CCGT thermoelectric units rather than cycle-specific engineering differences, we harmonize these two labels and report them under a single class, Motore Endotermico. By contrast, Ciclo Combinato (CCGT) is treated as a separate technology throughout the study, and all hydro sub-types remain unchanged.

3.2.2. Structural Characteristics

Each PU was characterized using technical and structural variables. These features are listed in Table 3.
In the absence of verified nameplate data for some PUs, this study approximates installed capacity using each unit’s maximum observed QUANTITY_NO across the MGP, MI, and MSD. We assume that rational bidders do not offer above physical capability.

3.2.3. Customized Indicators

To enable a meaningful comparison across heterogeneous units, new aggregated indicators are introduced as follows.
  • PROD_TOTAL (Total production): Total electricity delivered ([MWh]) during the reference period, summing accepted bids.
  • REV_MGP (Revenue MGP): Income from accepted MGP “OFF” bids, i.e., a c c e p t e d   q u a n t i t y   × z o n a l   p r i c e
  • REV_MI (Revenue MI): Income from accepted MI “OFF” bids.
  • EXP_MI (Expenditure MI): Costs associated with MI “BID” offers.
  • REV_MSD (Revenue MSD): Gains from accepted MSD “OFF” bids, i.e., a c c e p t e d   q u a n t i t y   × a d j u s t e d   p r i c e s
  • EXP_MSD (Expenditure MSD): Costs linked to accepted MSD “BID” offers.
  • EOH: Equivalent Operating Hours measured in hours [h] and indicates how many full-load hours the unit effectively produced.
These indicators allow for an integrated economic and operational profile of each PU. By normalizing revenues and expenditures against installed capacity, the case study ensured comparability between large-scale CCGTs and smaller hydro or renewable assets.

3.2.4. Technology and Operator Profiles

Building on the customized indicators, this subsection explores how production volumes and different technologies translate into revenues, highlighting efficiency and market participation differences across units.
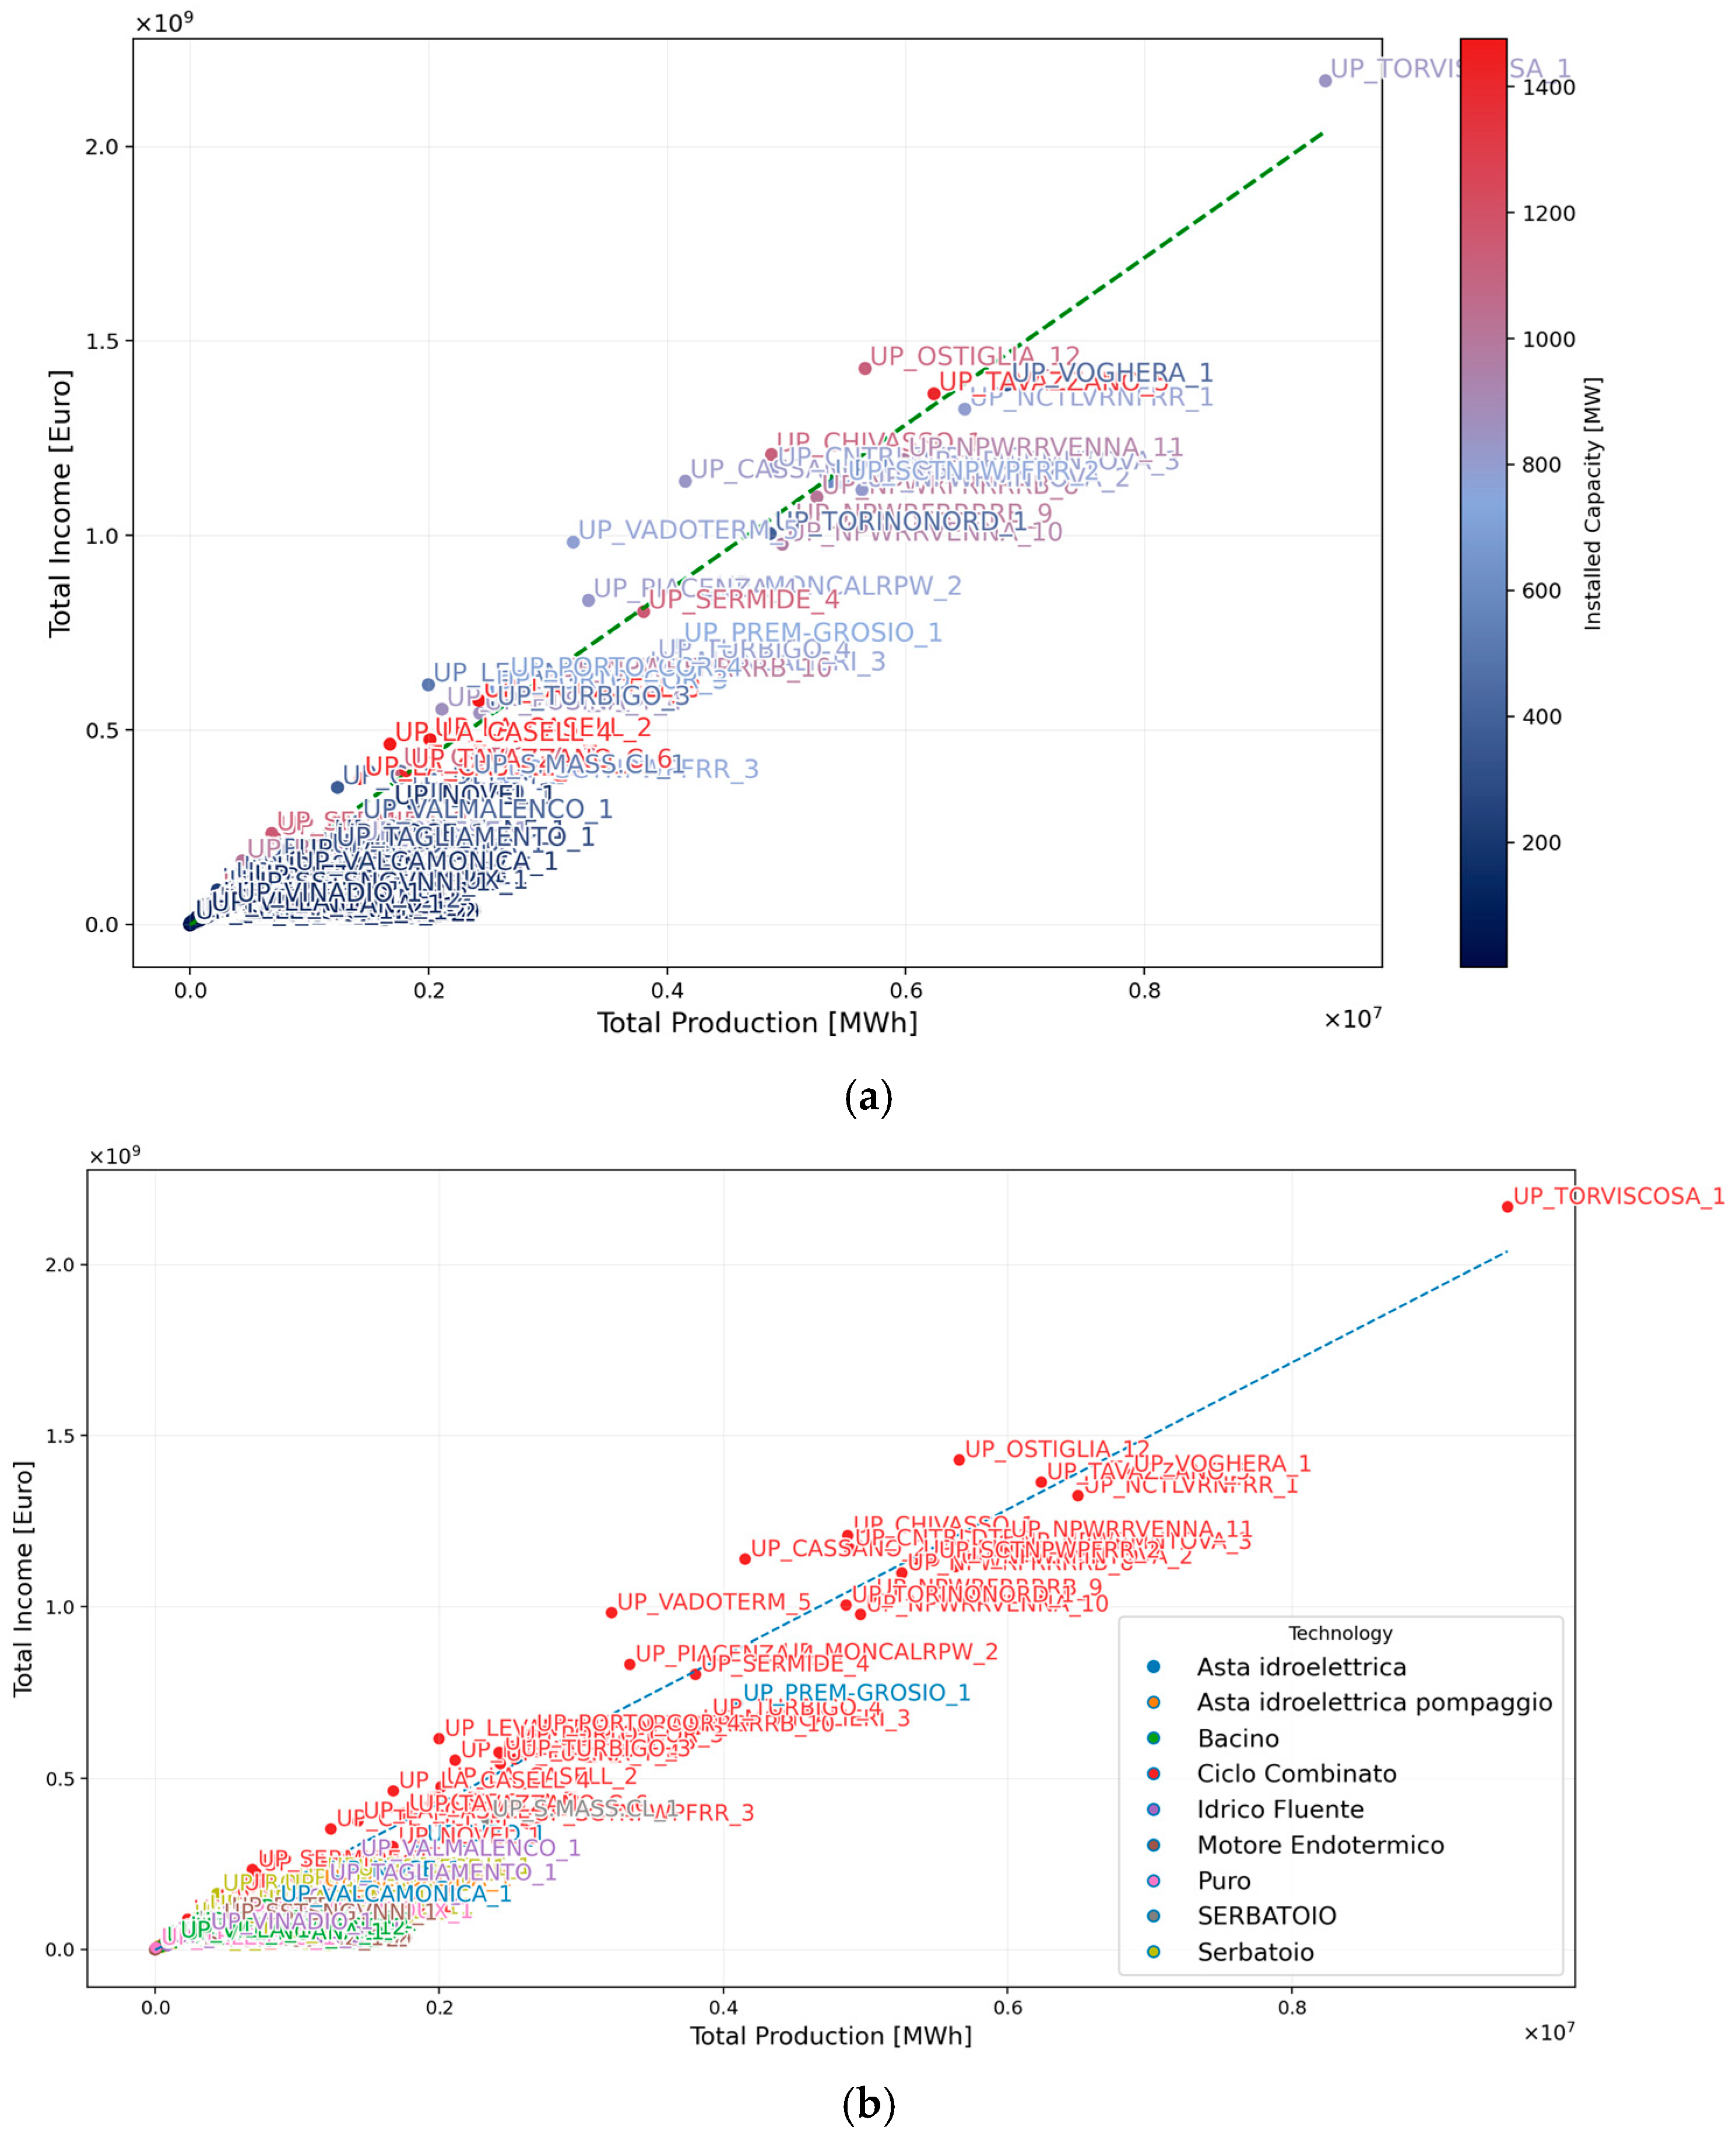
Figure 5a shows a strong linear link between total production and gross revenues in 2022–2024, with most units clustering tightly around the fitted line. This means that income grows roughly in proportion to energy produced. The slope of the line is the average price earned per MWh over the period. Several large gas units (e.g., UP_TAVAZZANO_5, UP_VOGHERA_1, and UP_OSTIGLIA_12) are above the line. They likely ran more during high-price hours and were accepted more often for upward regulation. UP_TORVISCOSA_1 is a clear upper-right outlier, with a very high output and higher-than-average income per MWh. Many small and medium hydro units (darker blue) fall below the line. They often produce in lower-price hours, face seasonal water limits, and have fewer chances to sell upward flexibility.
Figure 5b shows that thermoelectric units (Ciclo Combinato, Motore Endotermico) dominate the high-production, high-income range, benefiting from scale and frequent MSD participation. Hydroelectric families (Bacino, Serbatoio, and Idrico Fluente) cluster in the lower-left, reflecting fewer operating hours and tighter physical constraints. Pumped-storage (Puro) stands out with limited net production but non-negligible revenues, consistent with reserve and arbitrage roles.
EOH provides a normalized measure of how intensively a production unit operates relative to its installed capacity. As presented in Equation (1), it expresses the number of hours a plant would need to run continuously at full nominal power to generate the same total energy actually produced over a given period.
E O H i = E i P i i n s t
where
  • E i = total net energy produced by unit i over the period [MWh];
  • P i i n s t = Installed capacity of unit i [MW].
Figure 6 shows the structural drivers of market outcomes in the NORD. Figure 6a highlights a positive yet dispersed link between installed capacity and total income. While large plants tend to earn higher revenues, units of similar size (≈700–1100 MW) often diverge widely in outcomes, underlining the role of dispatch profiles and bidding strategies rather than capacity alone. Smaller units, though technically eligible for MSD, typically achieve modest revenues, reflecting operational limits and conservative bidding. Capacity sets the potential ceiling, but realized income depends on market behaviour.
On the other hand, Figure 6b plots each unit’s Equivalent Operating Hours (EOH) against the detrended income per unit of energy (€/MWh), revealing clear technological distinctions. Each panel corresponds to a specific technology category: Hydro Pumped Storage, Hydro Dispatchable, Renewable, and Thermoelectric.
The horizontal dashed line represents the mean income value across all production units (≈215 €/MWh), providing a common reference for comparison. Marker sizes are proportional to the installed capacity of each unit, emphasizing the contribution of larger plants.
Thermoelectric plants dominate the high-EOH region, with most clustering tightly around the mean value of ~215 €/MWh. Their long operating schedules anchor them to system-wide day-ahead prices, resulting in relatively uniform revenues per MWh. Hydro Pumped Storage lies at the opposite end with very low EOH but strikingly high €/MWh outliers, reflecting their role as peaking and reserve providers. Hydro Dispatchable and Renewables occupy the low-to-mid EOH range, with unit revenues generally lower, constrained by hydrology, intermittency, and more opportunistic bidding. At the distribution’s right tail, several near-baseload thermoelectric units achieve 15,000–18,000 h over three years (≈60–70% utilization).

4. Clustering Methodology

This section outlines a data-driven and statistically defensible procedure for choosing the number of clusters, K , while introducing the clustering task itself. NORD PUs are grouped into homogeneous classes using unsupervised learning on structural characteristics and market-based indicators, including technology and size, EOH, and per-MW measures of market activity such as MGP revenues, MI adjustments, and MSD BID and OFF acceptance and prices.
Selecting K requires care because the within-cluster dispersion minimized by k-means decreases monotonically as K grows, making naive “elbow” inspection prone to overfitting. To mitigate this risk and ensure interpretability, the choice of K combines a goodness-of-fit metric with a reproducibility check, specifically the Gap Statistic with the 1-SE rule [39,40,41] and a bootstrap stability assessment based on the Adjusted Rand Index (ARI) [42,43,44].

4.1. Problem Setup

Observations x i i = 1 n R p are clustered with k-means by minimizing the within-cluster sum of squares (WCSS)
C ^ k = arg m i n c 1 , , c k W k ,                       W k = j = 1 k i C j x i μ j 2 2
where μ j = 1 C j i C j x i is the centroid of cluster j . Because W k is nonincreasing k , a principled model-selection rule is required.

4.2. Gap Statistics with the 1-SE Rule

For each candidate, k K , B reference datasets x i * ( b ) are drawn uniformly over the axis-aligned bounding box of the standardized data [39,40,41]. The Gap statistics are
G a p k = 1 B b = 1 B log W k * ( b ) log W k
with W k * ( b ) the WCSS for b -th reference dataset clustered into k groups. A standard-error adjustment
s k = 1 + 1 B   s d   ( log W k * ( b ) b = 1 B )
quantifies Monte-Carlo uncertainty. The one-standard-error (1-SE) rule selects the smallest k satisfying
G a p k   G a p k + 1 s k + 1
This rule favours parsimony while guarding against spurious improvements at large k .
Where x i is observation; p is number of standardized features; C j is membership set of clusters j ; W k is within-cluster dispersion; B is number of reference draws; and s k is the standard-error envelope for the Gap statistic.

4.3. Bootstrap Stability via Adjusted Rand Index

Reproducibility is assessed by bootstrap subsampling. For each k K draw B b o o t subsamples of size m = p n without replacement (resampling fraction p ( 0 ,   1 ) , e.g., p = 0.8 ). Fit k-means on each subsample to obtain labels l ( b ) and compare with the full-sample labels l ^ using the Adjusted Rand Index (ARI) [42,43,44].
A R I l ^ , l ( b ) = r , s ( n r s 2 ) r a r 2 s b s 2 n 2 1 2 r a r 2 s b s 2 r a r 2 s b s 2 n 2
where n r s forms the contingency table between l ^ and l ( b ) , with a r = s n r s and b s = r n r s .
Stability for a given k is summarized by the median ARI and its interquartile range (IQR) across bootstraps; a solution is regarded as reproducible when the median ARI exceeds a threshold τ (e.g., τ = 0.85 ) and the IQR is narrow.
p is resampling fraction; B b o o t is number of bootstrap runs; l ( b ) is labels on the b -th subsample; l ^ is full-sample labels; and ARI chance-corrected agreement in 1 ,   1 .

4.4. Final Decision Rule and Visualization

The final number of clusters is chosen as
K * = min k K : G a p k G a p k + 1 s k + 1   a n d   m e d i a n   A R I ( k ) τ
with ties resolved in favour of smaller a ARI and IQR and clearer interpretability in downstream analysis. The accompanying figure reports, for each k , the Gap curve with its ± 1   SE envelope and the bootstrap stability curve showing the median ARI with its IQR band; vertical guides indicate the k values meeting each rule. This combined criterion yields a parsimonious and reproducible K * without appealing to case-specific outcomes.
All features are standardized before clustering. k-means is run with multiple random initializations and a fixed seed for reproducibility. The Gap reference is uniform over the data bounding box. Bootstrap labels are compared to the full-sample fit after aligning cluster indices by maximum-overlap matching.

5. Results and Discussion

To ensure that the clustering captures the macro-behaviour of active PUs, we applied a conservative pre-filter and excluded all units whose market and production aggregates were identically zero over 2022–2024, i.e., those with “Total production”, “Revenue MGP”, “Revenue MI”, “Expenditure MI”, “Revenue MSD”, or “Expenditure MSD” equal to zero. Such units did not record any accepted offers for the MGP, MI, or MSD during the study window, and are therefore non-informative for behavioural clustering. After this quality screen, the analytical sample comprises 127 PUs (from 268 initially), focusing the analysis on units with observable market activity while improving comparability and numerical stability.

5.1. Choosing the Number of Clusters with Gap Statistic and Bootstrap Stability

Following the procedure described in Section 4, the number of clusters was chosen with two tests that complement each other, the Gap statistic with the 1-SE rule, and a bootstrap stability check based on the Adjusted Rand Index.
Figure 7 shows the outcomes. In the left panel, the Gap curve rises with K, and the dashed line marks the 1-SE choice at K = 13, which is the smallest value whose fit is statistically indistinguishable from the best. In the right panel, the bootstrap curve reports the median ARI across resamples with its interquartile band; stability is highest around K = 14 and remains above the 0.85 benchmark. Taken together, the evidence points to a tight 13–14 window. To remain concise while keeping high reproducibility, in this study we choose K = 13 to classify the production units.
Detailed results of the selection diagnostics for the number of clusters are reported in Table A1 (Appendix A). For each candidate K (2–30), the table provides the Gap statistic (GAP) with its standard error (S_K) and within-cluster dispersion (Wk), together with bootstrap stability indicators: MEDIAN_ARI and its interquartile range (Q25_ARI, Q75_ARI).
The clusters split the PUs into clearly different bidding “styles”. Several groups are energy-oriented, with high EOH and MGP income (e.g., C7, C8, C9, C10), while others are reserve-oriented, showing pronounced activity on the MSD, often asymmetric between BID (upward) and OFF (downward) (notably C4, C11, C12). MI-heavy units (C3, C7) look very different from MSD-driven units (C4, C11–C12) even when revenues per MW are comparable.
The 13-cluster map reveals a structured market ecology: (i) energy-dominant CCGTs with steady MSD (C7–C10), (ii) MSD-specialists (C4 upward; C11–C12 downward), (iii) MI-arbitrageurs (C3), and (iv) hydro fleets with simple, homogeneous offers and sporadic acceptance (C1/C5/C9).
A summary of the main features characterizing all thirteen clusters is reported in Table A2 and Table A3 in Appendix A.
To extend the interpretation, the following analysis concentrates on three clusters (C4, C8, and C12), whose macro-behaviour is the most distinctive and interpretable within the thirteen-group partition, providing a clearer lens on operator strategies and technology-driven bidding practices.

5.2. Selected Clusters’ Features

The analysis concentrates on three clusters (C4, C8, and C12).
  • Cluster 4: mixes pumped-storage hydro with large CCGTs and shows a distinctive energy-market posture with strong price tracking in OFF and defensive BID during scarcity periods.
  • Cluster 8: collapses to a single ENGIE CCGT at Voghera, a stable, near-baseload unit that reveals clean MSD pricing rules and sharp asymmetry between downward and upward actions.
  • Cluster 12: aggregates reservoir and pumped-storage hydro with low EOH and persistent OFF premia (i.e., extra amounts added on top of a benchmark price) aligned with water-value management.
Together, these clusters cover the principal strategic regimes observed from 2022 to 2024, provide clear operator-coherent tactics, and support granular discussion of unit-level bidding behaviour.

5.2.1. Cluster 4

Figure 8 shows hourly upward (OFF) offer prices of the six units in Cluster 4, including UP_SERMIDE_3&4 and UP_CHIVASSO_2 operated by A2A, UP_AZOTATI_5 operated by Edison, and pumped-storage UP_S.FIORANO_1 and UP_RONCOVALG_1 operated by ENEL, overlaid with the zonal day ahead market prices in the NORD from 2022 to 2024.
OFF (upward) prices align closely with the MGP, with consistent positive adders that reflect start/stop costs, ramp constraints, and opportunity costs (fuel, emissions, and foregone pumping). The tightest co-movement appears again in mid-2022. As the MGP surges, OFF prices for all six units scale up (300–1000 €/MWh peaks), a pattern consistent with merit-order scarcity and a cost-plus strategy where the adder tracks variable cost and risk premia. Through 2023, the curves deflate to 150–300 €/MWh bands, then gradually firm during 2024 as the MGP rises. Two structural differences stand out. (i) The ENEL pumped-storage units show visibly higher OFF mark-ups in late-summer 2022 and again in Q4-2024. That is consistent with a water-value regime, when the expected value of water is high (dry weeks, valuable pumping windows, and transmission congestion), hydro plants price upward activation above CCGTs to preserve flexibility for later arbitrage. (ii) A2A’s CCGTs (Sermide 3–4; Chivasso 2) present very similar OFF shapes with extended plateaus. Operator-coherent tactics where daily blocks are set and only occasionally updated intraday. Edison’s Azotati (smaller CCGT) shows more hour-level variability and, in 2024, a persistent premium over the MGP, consistent with a plant running with tighter ramp constraints and higher marginal cost. Across the cluster, the OFF series remain mostly above MGP in 2023–2024. It means that when system conditions are normal, Terna accepts the cheapest upward stack first, so plants price just high enough to be called in scarcity but not in normal hours. Prior evidence for 2017–2019 reported this same “OFF-follows-MGP-plus-adder” motif for thermoelectric fleets, whereas hydro shows stronger seasonality and operator-specific water-value plateaus [13].
Considering BID and OFF prices, in 2022, extreme MGP volatility raised both opportunity costs and scarcity premia; all six units therefore “shadow” the MGP in both directions. In calmer 2023–2024 conditions, operators reverted to menus and cost-plus mark-ups. OFF remains coupled to the MGP (plus a unit-specific adder), while BID becomes templated or zero because curtailment is either not needed (MI already re-optimized) or not profitable. Hydro deviates when water value considerations dominate (plateaus and seasonal steps), while CCGTs deviate when operator policies (maintenance, risk limits, and bilateral positions) set floors/ceilings.
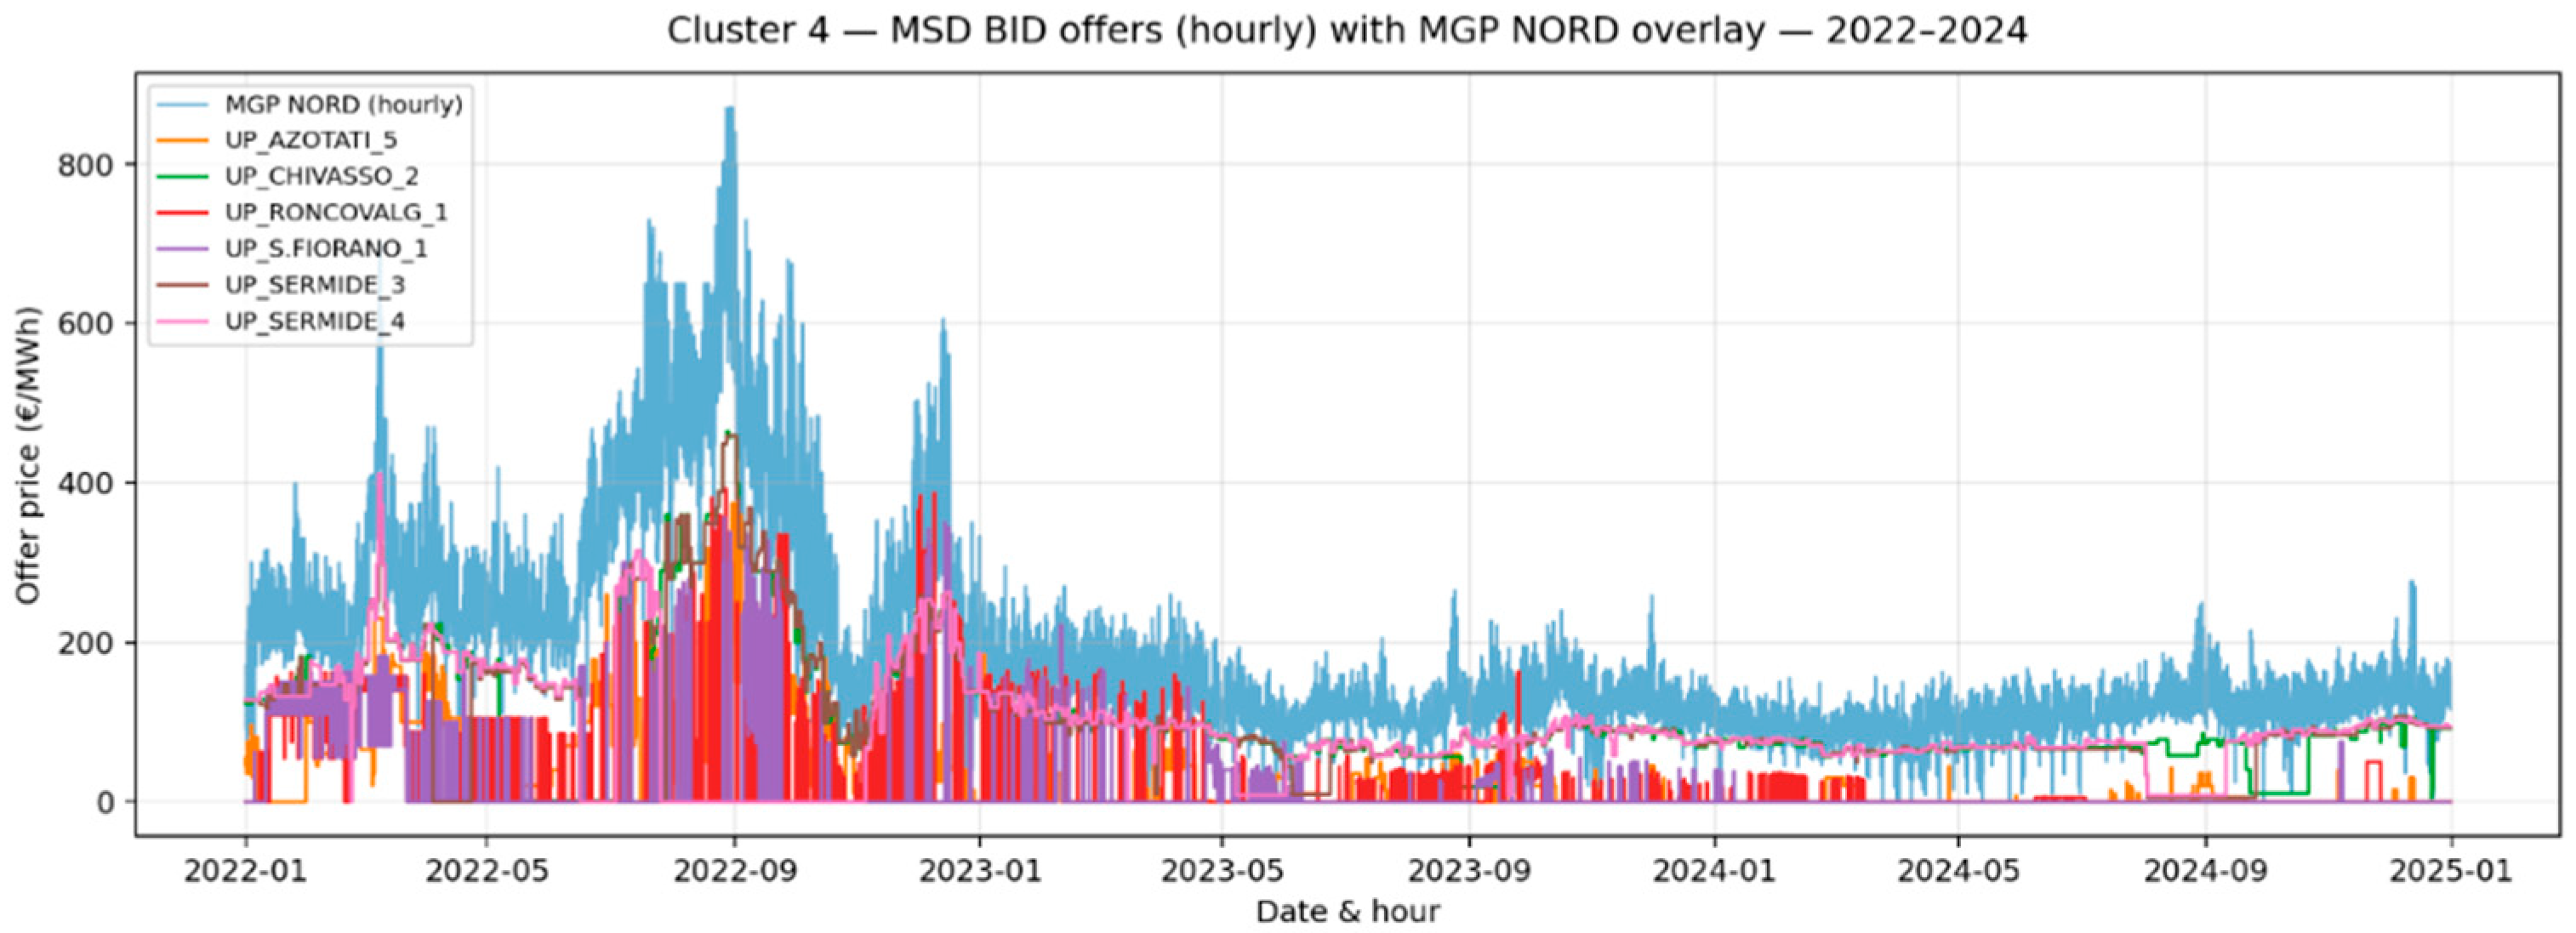
Figure 9 shows hourly BID offer prices (downward regulation) for six units in Cluster 4.
The BID curves show three regimes. First, during 2022, all series rise and fall with the NORD MGP price but with a depressed level (typical 50–300 €/MWh) and intermittent zeros. This “shadow-pricing below MGP” is the hallmark of CCGTs willing to pay to unwind day-ahead commitments (or hedge fuel risk) if system conditions justify curtailment. The shadowing is tightest around Aug–Oct 2022 when the MGP peaks (~800–900 €/MWh), and BID quotes for the CCGTs briefly approach 200–400 €/MWh, indicating high opportunity costs of turning down. Pumped-storage BID quotes, by contrast, oscillate between small positive values and zeros. These units are seldom scheduled as must-run, so asking to reduce production is either irrelevant (zero) or priced modestly; their value proposition is in OFF (upregulation) and energy arbitrage. Second, in 2023 the whole stack de-levels as gas prices collapse. BID offers revert to 0–120 €/MWh most hours, with long plateaus (i.e., extra amounts added on top of a benchmark price) and “menu prices” (e.g., rounded steps at 50, 75, and 100 €/MWh), a telltale sign of rule-based or cost-plus settings rather than hour-by-hour optimization. Third, from mid-2024, mild re-inflation of the MGP (150–220 €/MWh) lifts BID quotes moderately for all units. Across the period, occasional zeros (especially in Chivasso/Sermide) signal hours when the unit prefers not to be curtailed via the MSD (e.g., because the prior-market position is flat or because downward is operationally constrained); in operator playbooks documented for earlier years, these daily constants and zero plates were widespread for ENEL hydro and common at A2A CCGTs during maintenance or when MI already optimized the schedule.
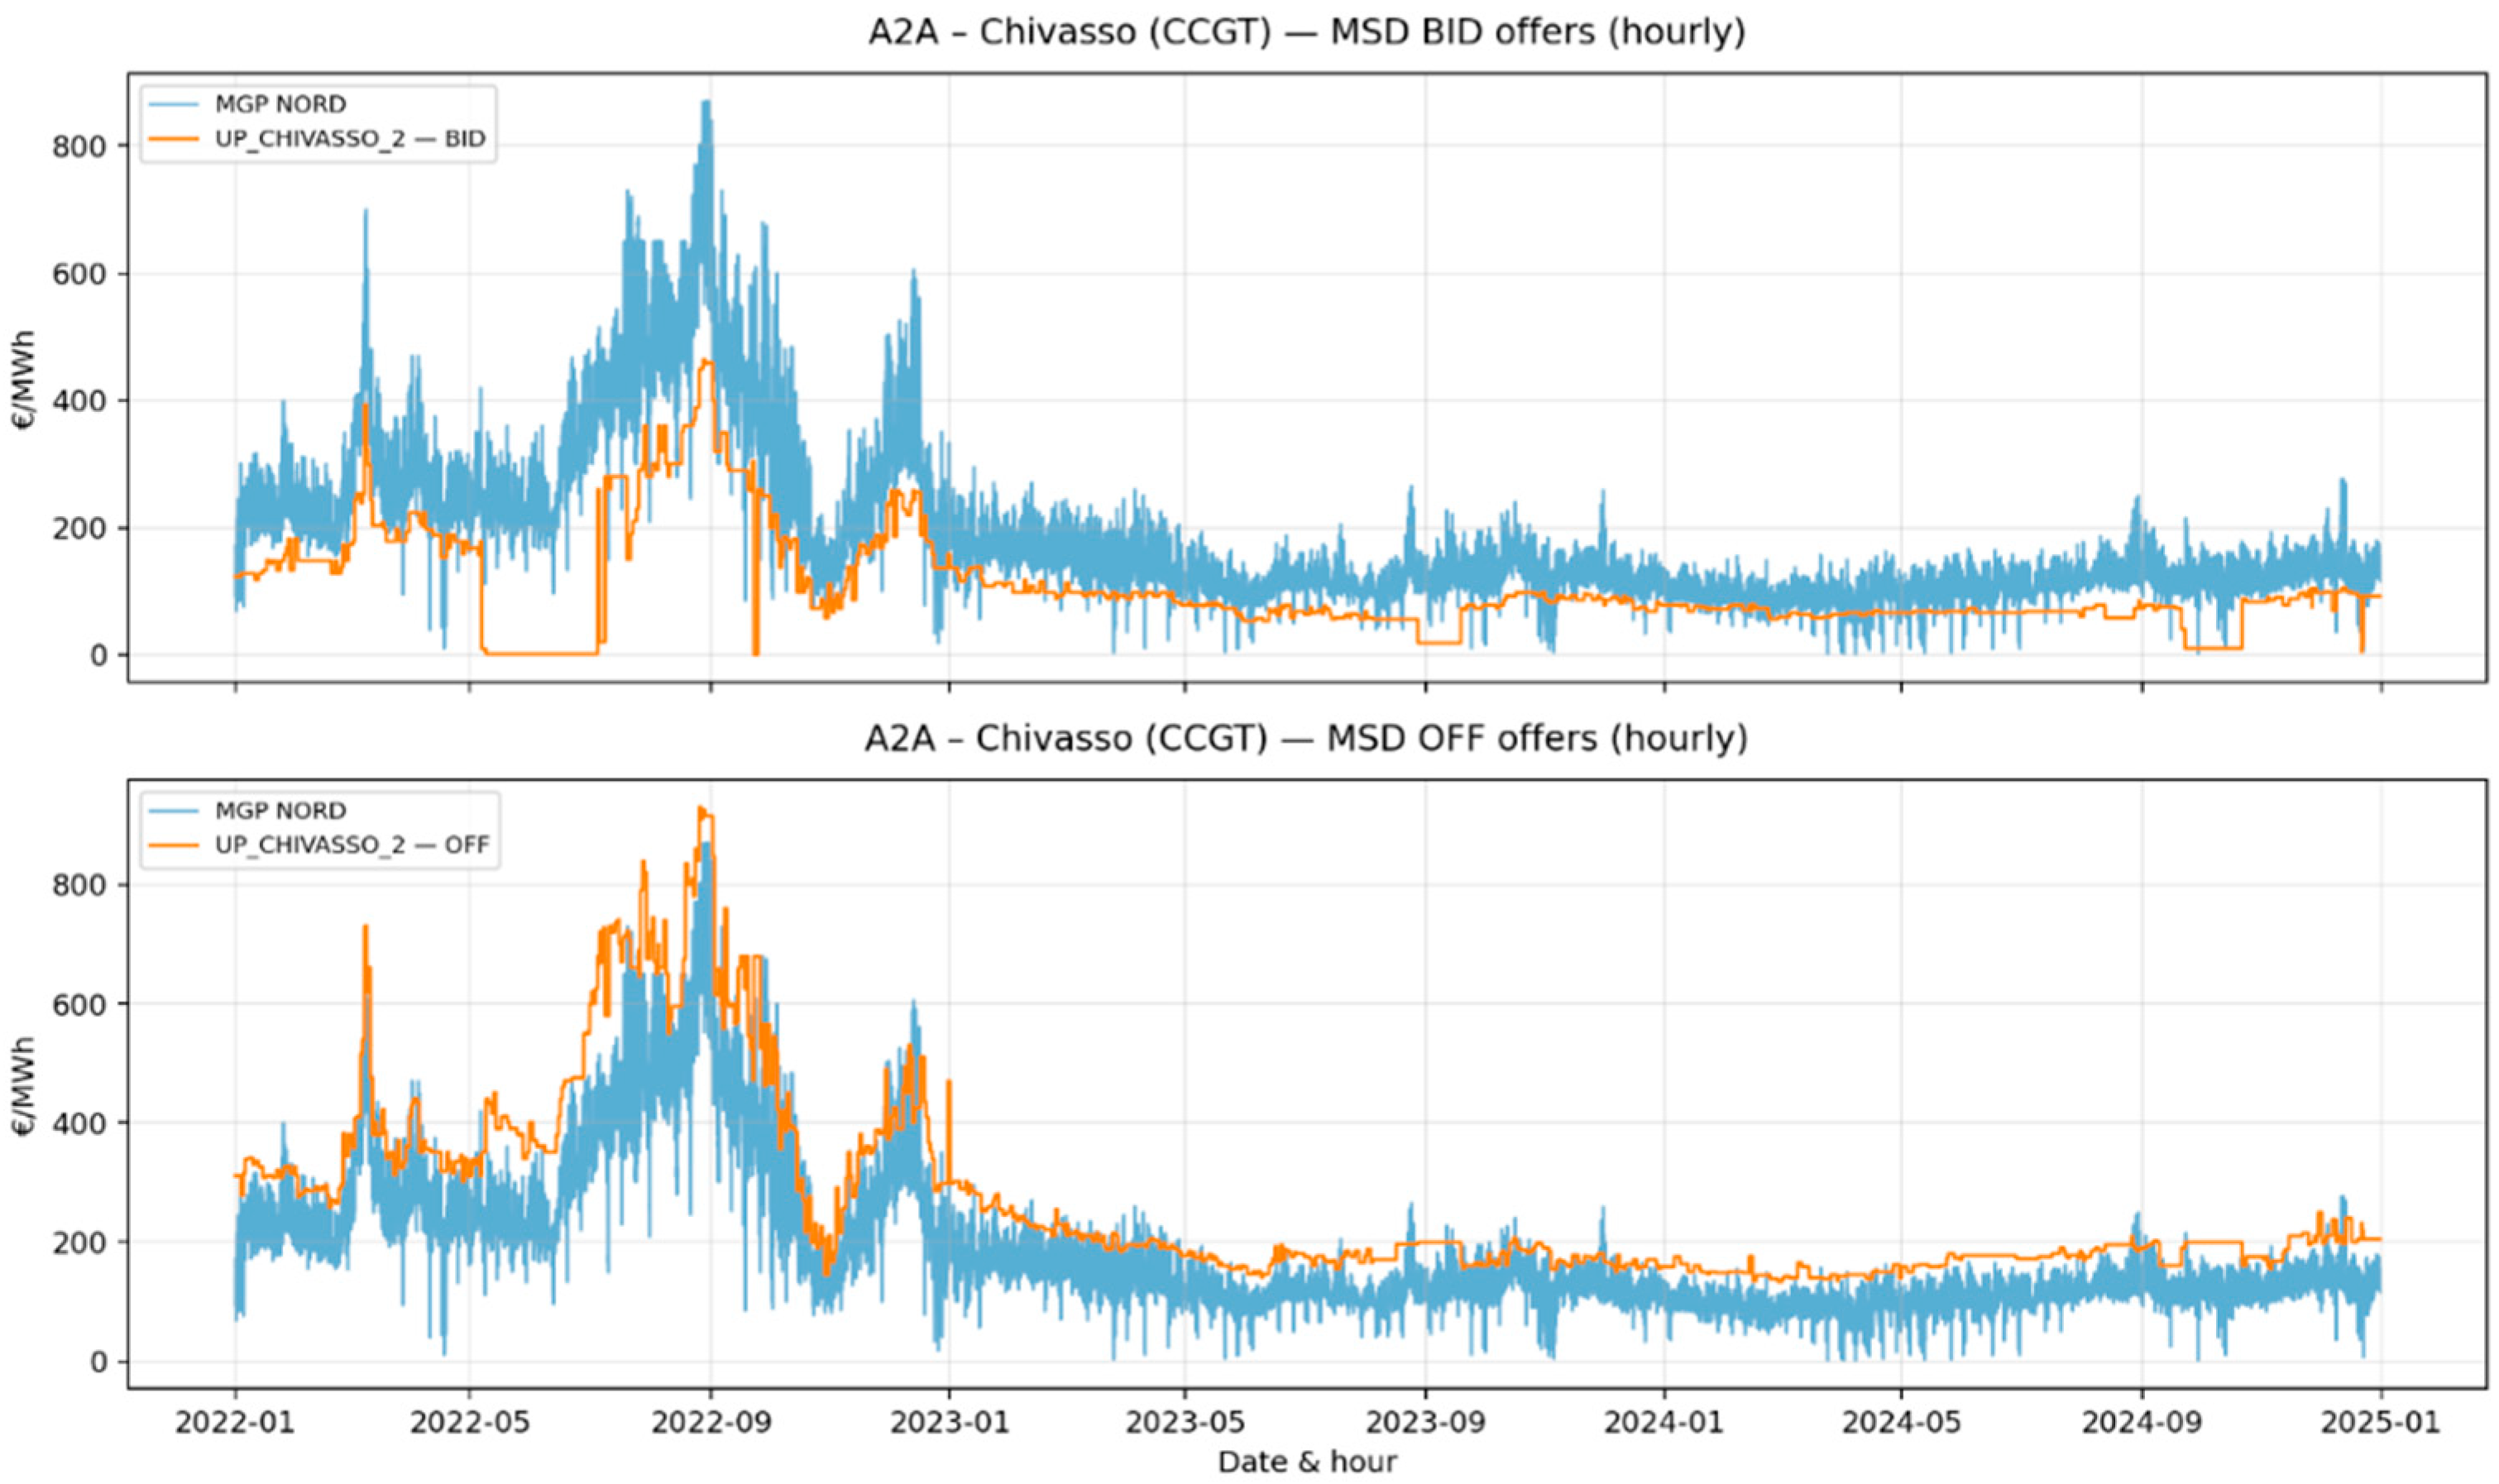
In Figure 10, Chivasso’s BID curve can be read as regime-based pricing which switches between a few stable patterns or “regimes” each with its own pricing rule. In 2022, BID prices rose with the MGP and showed brief peaks at the morning and evening demand hours, indicating the unit asks for higher compensation to cut output when the lost revenue from not selling power would be large. The closeness of OFF to the MGP and the scarcity of extreme outliers suggest a cost-plus strategy with a thin risk premium and strong dependence on fuel costs; it is not “bid-to-be-rejected” behaviour. Zeros or near-zeros appear in BID but not in OFF, underlining that upward reserve is part of the unit’s revenue stack, whereas downward curtailment is optional and mainly opportunistic. The hour-of-day profile (spikes around system peaks) fits the classic CCGT role in balancing.
As Figure 11 depicts, Sermide’s twin units exhibit operator-coherent behaviour. Two Pus almost overlap in both directions, confirming common templates and shared plant constraints. In 2022, stepped BID values with prolonged zeros, textbook “do-not-curtail unless cheap” signalling after the MI has already cleaned the schedule. The persistence of plateaus (entire weeks at nearly identical OFF values) indicates a daily/weekly menu set by a dispatch desk rather than hour-by-hour algorithmic repricing; updates happen around fuel renegotiations, maintenance windows, and seasonal efficiency shifts. Short-lived spikes above the MGP trend correspond to scarcity hours (high residual load or network constraints) when upward flexibility commands a premium; such episodes are more frequent in late-summer and early winter evenings. The micro-behaviour is consistent with A2A’s broader cluster footprint (high OFF revenues and modest BID activity). In summary, Sermide monetizes flexibility-up while treating flexibility-down as a secondary, template-driven tool.
Azotati’s BID series (Figure 12) is the sparsest in the cluster and shows the largest share of zeros, notably in 2023–2024, when non-zero, values are generally below 120 €/MWh except during 2022’s stress months. This says the unit rarely pays to be curtailed unless the opportunity cost is extreme. OFF prices, by contrast, sit consistently above the MGP with a visible unit-specific adder. During late-summer 2022 they crested around 900–1100 €/MWh, and even in 2023 they remained ~50–80 €/MWh above the MGP most hours. Two factors can rationalize this persistent premium: (i) smaller turbine size and tighter ramping/efficiency envelope than 800 MW class plants (higher marginal cost and larger start cost share per MWh at low dispatch), and (ii) a risk-aware offer policy that prices network congestion/redispatch risk into OFF. The curve also shows rounded steps and week-long plateaus. It shows the evidence of a menu updated periodically, not continuously. When the MGP dips toward 100–150 €/MWh (spring–summer 2023), Azotati’s OFF holds closer to 170–220 €/MWh, which makes the unit callable only in genuine scarcity. Such stance aligns with earlier findings that not all large operators homogenize tactics across plants: some portfolios (e.g., Edison) exhibit plant-specific MSD strategies. Here, Azotati acts as an upward-only flexibility provider with guarded pricing, while keeping BID lightweight.
Figure 13 depicts the BID and OFF of ENEL hydro-pumped storage. The hydro pair behaves differently from the CCGTs, in line with storage economics. OFF bids track the MGP closely but with seasonal water-value premia. The mark-up swelled in late-summer/early autumn 2022 and again in Q3–Q4 2024 (when the value of retained water was high and pumping windows were precious), and it shrunk in wet spring periods. The two units often show multi-week plateaus at identical OFF prices, which is a signature of water-value tables being set discretely (monthly/seasonally) rather than hour-by-hour. Regarding the BID behaviour, many near-zeros (there is little point in paying to reduce output if the unit is not must-run) are interrupted by modest positives when the plant is actually generating and wishes to avoid further downward moves that would impair reservoir management. The combination (templated and seasonally stepped prices) of strong co-movement with the MGP and a bias to OFF, matches well-documented ENEL hydro playbooks which are common tactics shared across units, higher reliance on MI/MGP to shape energy, and MSD used to monetize the flexible upward response when systemic value is high.
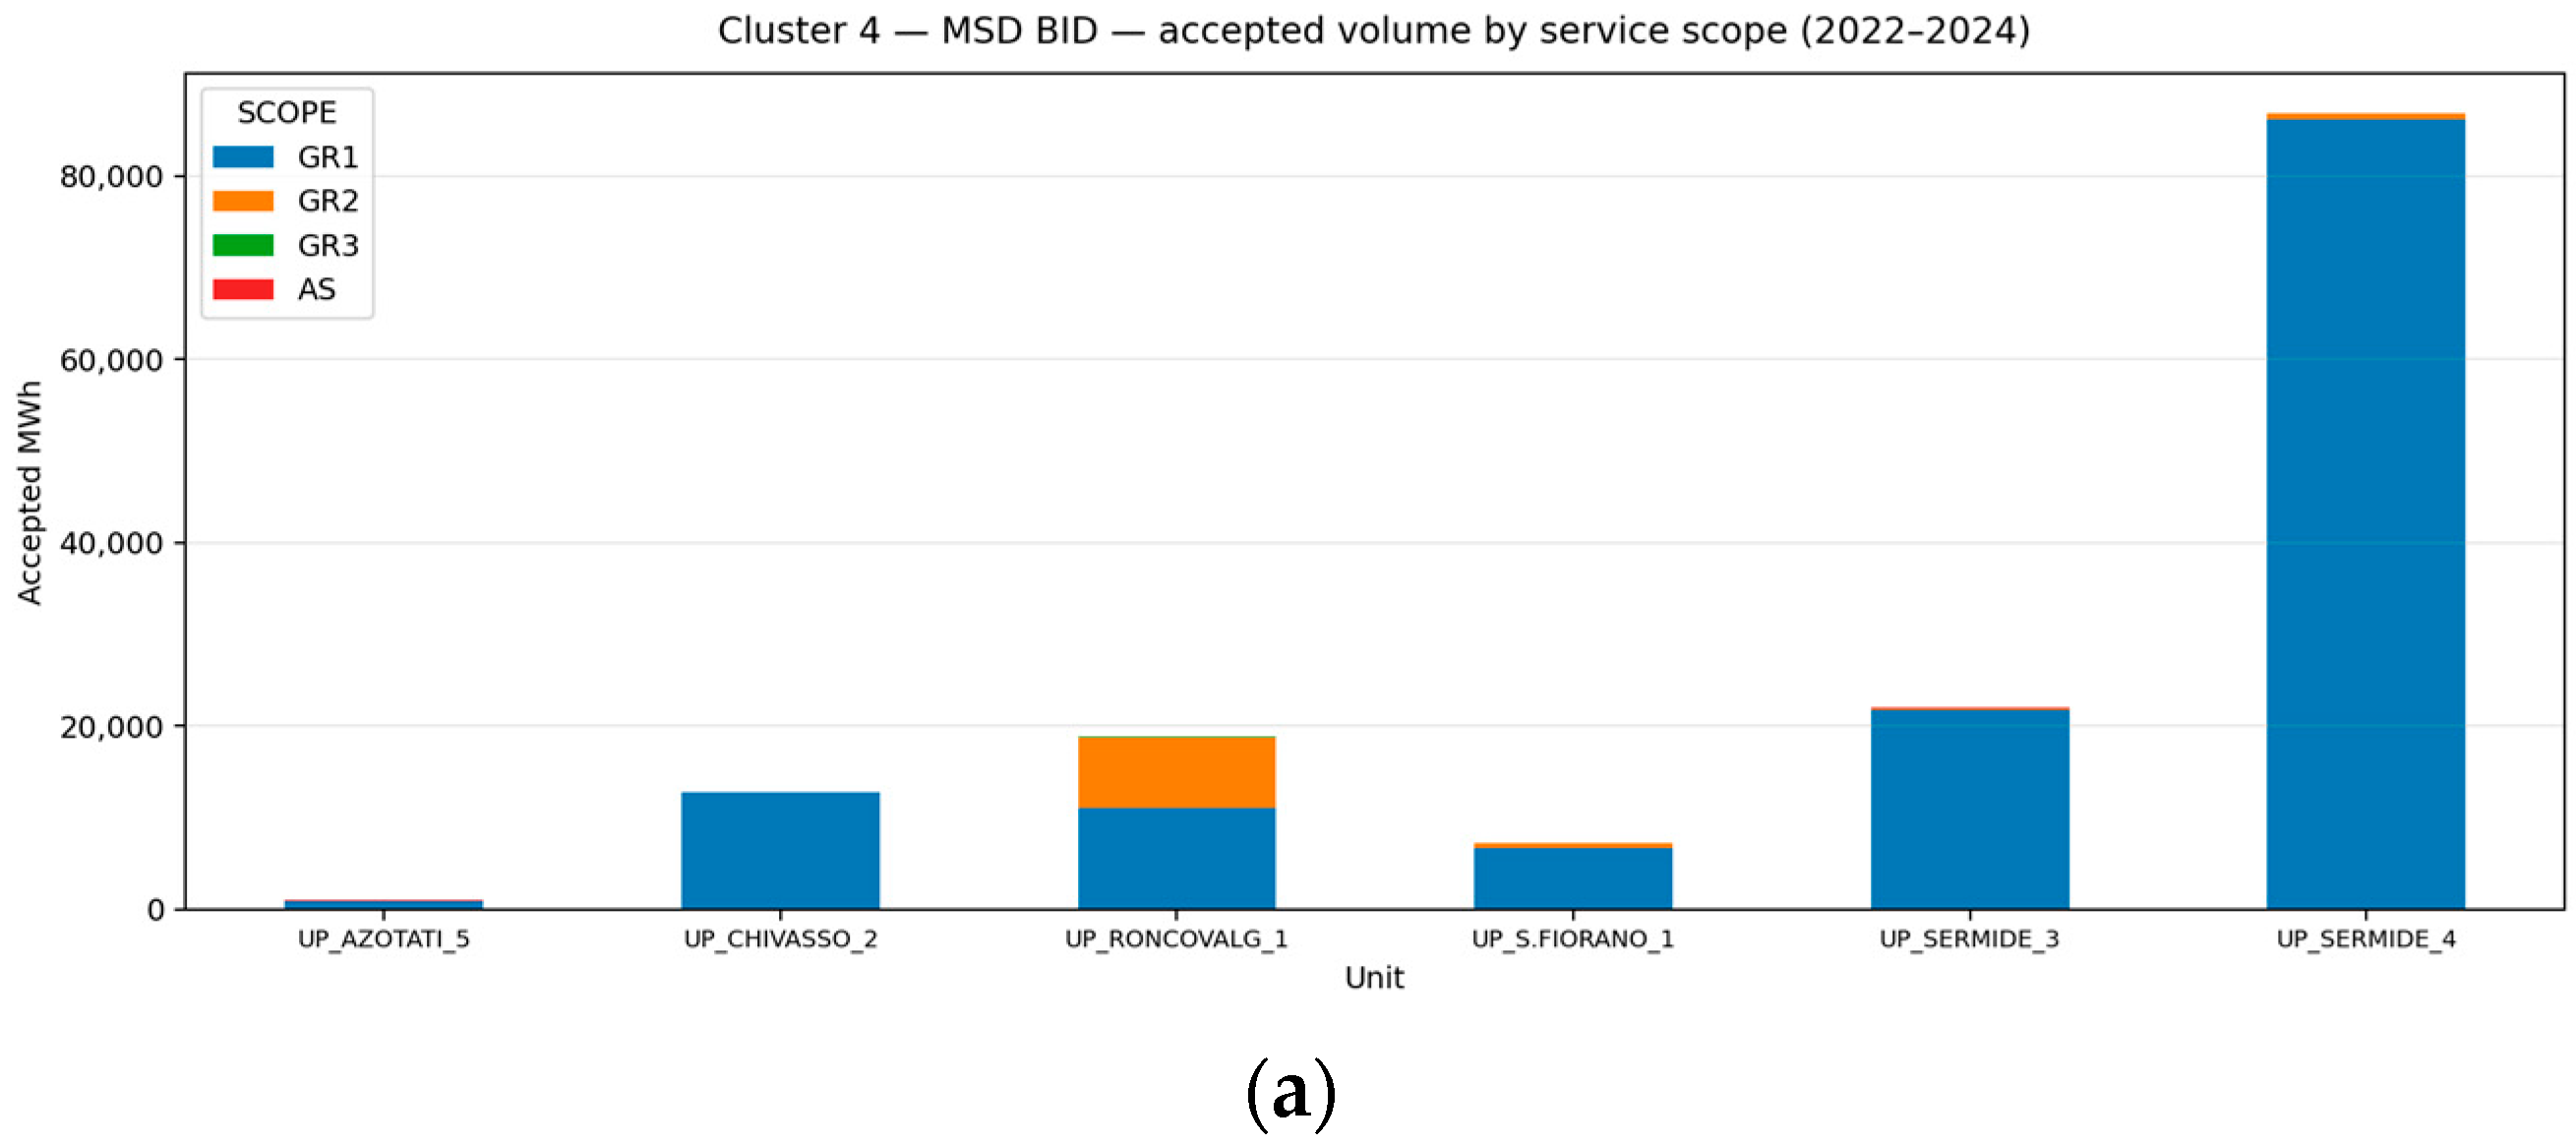
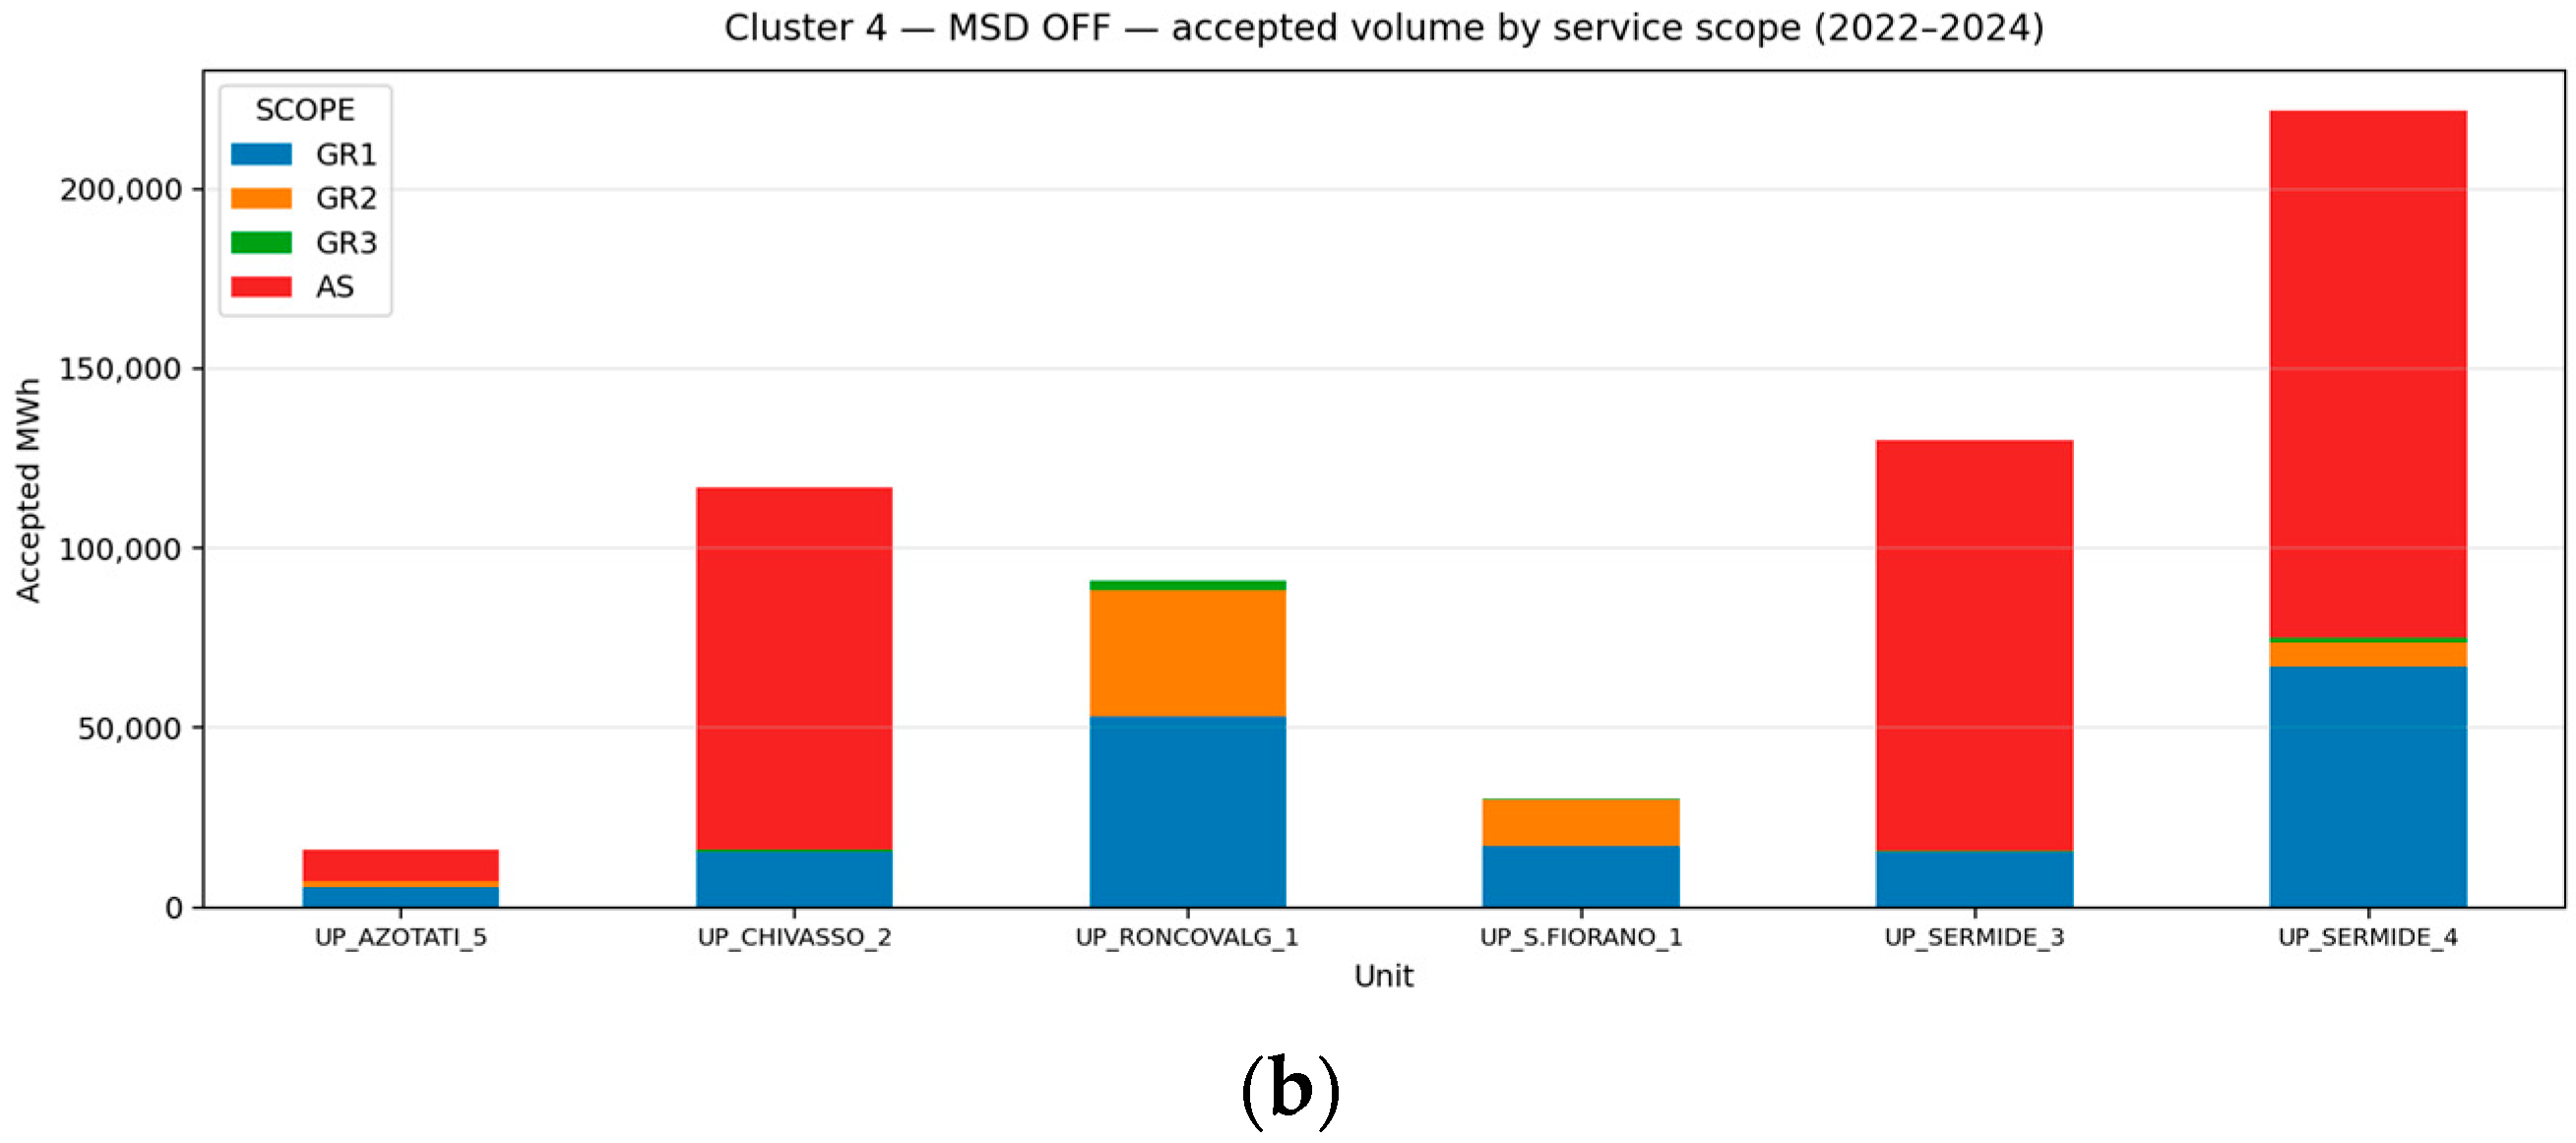
Here, (Figure 14) we split accepted MSD volumes by service scope. Detailed information of each scope has been described in Table 2. In Figure 14a, BID (downward regulation) accepted volumes are modest and concentrated in GR1 for every unit, indicating that these PUs are rarely asked to shut down but often provide small downward trims when online. AS–BID (full switch-off) is negligible except for a very small contribution at UP_SERMIDE_3, consistent with thermal units being kept available and adjusted mainly through first-step curtailments. The only clear multi-step pattern appears at UP_RONCOVALG_1, where GR2 adds a visible slice to GR1, evidence that this unit sometimes delivers deeper downward redispatch once the first step is taken. On the other hand, in Figure 14b, OFF (upward regulation) upward activation dominates the cluster, with much larger totals. UP_SERMIDE_4 and UP_SERMIDE_3 show very large AS–OFF shares, meaning they are frequently started from cold to supply energy during tight conditions, behaviour typical of peaking/redispatch roles and consistent with the high-price months of 2022 and the evening ramps of 2023–2024. UP_CHIVASSO_2 also shows a strong AS component, while UP_RONCOVALG_1 is skewed to GR1–GR2 rather than AS, suggesting it was often already online and provided incremental upward steps rather than starts. UP_S.FIORANO_1 contributes smaller volumes but with a clear AS bias, consistent with opportunistic starts. Overall, the cluster’s common trait is energy-oriented upward flexibility, large OFF acceptances, many of them as start-ups, and comparatively little downward redispatch beyond the first step.

5.2.2. Cluster 8

Cluster 8 collapses to a single production unit, ENGIE’s CCGT at Voghera (UP_VOGHERA_1), because the unit is unusually active/remunerated per MW, separate from the rest clusters. In our data, Voghera posts extremely high Equivalent Operating Hours (≈17,974 h over 2022–2024, i.e., ~68% of the theoretical 26,280 h), together with a very large per-MW income concentrated in the MGP (total income ≈ €3.64 M/MW; MGP_OFF ≈ €3.82 M/MW; MI_OFF ≈ €0.25 M/MW). That “always-on” profile is characteristic of baseload CCGTs that clear day-ahead routinely and then fine-tune around that schedule on the MSD, and it is exactly the kind of pattern that prior work on the Italian ancillary market found when isolating thermoelectric units active on BID in the MSD (a set that explicitly included Voghera).
Figure 15 illustrates the hourly evolution of bid (downward) and offer (upward) prices for a specific unit (UP_VOGHERA_1) within Cluster 8, overlaid with the hourly NORD MGP from 2022 to 2024. These two subplots, (a) BID and (b) OFF, reveal the distinct but interconnected pricing strategies of the unit. The analysis of these time series shows a significant regime change driven by market conditions, particularly the gas price shock of 2022. In the subplot (Figure 15a), BID prices display a wide range in 2022, with recurrent spikes well above 300 €/MWh and occasional peaks beyond 500 €/MWh. These coincide with the gas price shock and high scarcity premia in the northern zone. Such values are not random outliers but correspond to system stress episodes where the opportunity cost of downregulation is elevated. From 2023 onward, BID prices compress into a narrower 50–150 €/MWh band, reflecting lower fuel input costs, reduced scarcity, and the stabilization of operator expectations. The presence of extended flat stretches and rounded figures suggests menu-based bidding, where operators reuse a limited set of premia over time instead of continuously adjusting to marginal cost. Roughly 12% of BID prices are zero, pointing to a must-run or quasi-baseload configuration; in many hours, the unit is indifferent or even favourable to being curtailed, provided thermal management or ramping constraints are satisfied. This coherence with plant operation underscores the role of BID as a hedge against costly minimum-load operations rather than a pure market signal. Subplot (b), Figure 15b, shows the corresponding OFF offers, which are consistently higher than BID, as expected. The operator applies an average premium of around 130 €/MWh above the BID level, reflecting fuel, emissions, and start-up costs associated with upward activation. The intraday profile is also telling: OFF bids escalate into the evening peak (hours 19–20) when upward flexibility is most valuable, then soften overnight, indicating cost-reflective yet strategically placed offers. Unlike BID, OFF never falls to zero, consistent with the positive marginal cost of providing upward energy for a thermal unit.
Taken together, the BID and OFF curves confirm an operator-coherent approach; both sides of flexibility are priced relative to MGP with stable premia, adjusted during stress events, and structured around a pragmatic menu of repeated values. The correlation between BID and OFF (~0.85) indicates a single underlying driver: the opportunity cost of capacity allocation under thermal and ramping constraints. The cluster exemplifies a CCGT unit that monetises flexibility by shadowing market prices, hedging curtailment risk with low or zero BID offers, and capturing scarcity rents with elevated OFF prices during tight system conditions.
The heatmaps in Figure 16 report the hour-of-day acceptance rate in the MSD over 2022–2024. Downward services (BID, Figure 16a) are frequent for this unit, with acceptance peaking around the morning shoulder (≈08–10) and evening shoulder (≈19–22) where rates reach 10–12% of submitted hours, and dipping to a few percent in the small-hours and early afternoon. Upward services (OFF, Figure 16b) are much rarer, ≤3% on average, with a few brighter bands around early morning (≈03–05) and early afternoon (≈13–15). The colour-scale difference between the two panels underlines the asymmetry that the plant is accepted far more often to reduce output than to increase it.
Voghera’s technology (CCGT) and market stance explain why it stands alone in this cluster and why the two panels differ. The unit posts very high Equivalent Operating Hours and clears the day-ahead market most of the time; when the system later has a surplus (night/late-evening valleys or PV-heavy early afternoons), the TSO finds it efficient to curtail the running CCGT, hence the broader, warmer bands in the BID panel. By contrast, OFF acceptance is episodic and concentrated in ramp-up windows (e.g., early morning and, at times, the post-lunch period) when thermal flexibility is needed to cover load rebounds or renewable dips.
Figure 17a shows the MSD BID energy accepted from UP_VOGHERA_1, split by scope. The accepted energy is overwhelmingly concentrated in GR1 (down-step), about 0.53–0.54 TWh over 2022–2024, with only thin layers in GR2 and GR3; AS (shout down) is negligible. This composition indicates that the plant was already online for most BID activations and that the TSO primarily asked for the first reduction step from its current schedule, rarely moving to deeper curtailments and requesting a full shutdown through the ancillary market.
Figure 17b reports the MSD OFF direction. GR1 dominates, about 138–139 GWh, with modest volumes in GR2 and a small AS layer, while higher steps are virtually absent. This asymmetry between BID and OFF is consistent with a high-utilization CCGT that clears the day-ahead market and runs close to baseload. The system most often needs a single step of downward regulation from an already-running unit, while upward activations are fewer and limited, and starts via the MSD are rare because commitment is decided in the MGP/MI.

5.2.3. Cluster 12

Cluster 12 brings together thirteen production units. This cluster is dominated by hydro plants. At cluster scale, the BID curves (Figure 18a) reveal a clear hydro-dominant tactic that prioritizes water value and positions the MSD only as a balancing outlet. During most of 2023 and 2024, several units maintained BID prices close to zero, reflecting a strategy to avoid reducing generation once their output had already been committed in the MGP or MI. Flat zero stretches match the operator-coherent playbook documented for dispatchable hydro where identical or nearly identical BID values are replicated to keep them out of the MSD unless there is a system- or resource-related reason to do otherwise. During August and September 2022, the cluster shows frequent BID spikes. These spikes coincide with the European gas shock and with low Alpine reservoirs, which raised the opportunity cost of water. In that regime, operators opportunistically increased BID prices to make downward redispatch unlikely and to preserve storage for later hours with higher spreads, a behaviour that previous studies linked to the seasonal water reservoir troughs and to MI scheduling choices made just before the MSD [13]. The stepped shapes and long plateaus at rounded values such as 50, 100, and 150 euro per MWh suggest menu pricing rather than continuous optimization, again a signature often observed for hydro fleets managed centrally. Brief returns to zero within those high months typically occur during night hours, when day-ahead prices are very low and the unit’s intra-day programme is flat (often zero), so there is limited foregone value in being curtailed.
OFF prices in panel b of Figure 18 track the zonal MGP price with a visible premium that compresses through the sample. During the 2022 peak, the cluster’s median OFF stayed between 400 and 800 €/MWh, while the MGP ranged from about 300 to 700 €/MWh. The wide vertical bars between August and October 2022 are not random. They reflect water scarcity and high thermal marginal costs that make upward redispatch attractive, so operators bid high but still within the acceptance range because system needs are acute. In 2024, several units show long flat stretches of 180–250 €/MWh, reflecting cost-plus levels based on turbine efficiency and pumping losses, and the use of seasonal baseline prices that are updated only a few times a year. Where OFF rises above the MGP by several hundred €/MWh during short bursts, those hours usually correspond to MI profiles with zero programmed output and therefore require start-up or head re-positioning, a pattern to the way hydro fleets anchor OFF bids to MI schedules and shift them upward when the unit would have to start only for the MSD.
In BID (Figure 19a), CNTRLNTRNO_11, FONTANA_B_1, LANA_1, and the two SLUDGLRENZA units, as in the Alperia subset, show coordinated, reservoir-aware bidding that became more price-responsive after 2022. This subset displays long zero corridors across 2023 and 2024 with occasional rises to 50 to 120 euro per MWh in late summer afternoons. These rises are concentrated in the second half of August and the first half of September, exactly when head levels trend lower and inflows weaken. The choice to lift BID prices at those hours is consistent with water preservation and with the operator’s interest in monetising flexibility in the MI or the evening MGP peak rather than accepting downward redispatch in the MSD. The repeated use of the same bid values across different plants suggests a centralized bidding rule rather than plant-by-plant optimization, consistent with the menu-pricing approach often used by hydro fleets managing several stations in the same basin. In early 2022, there were scattered BID quotes around 150 to 300 euro per MWh. Those correspond to the gas shock period when the opportunity value of a cubic metre of water was unusually high, and curtailment became very costly.
OFF for the same group (Figure 19b) closely shadows the zonal reference with a small positive markup that contracts over time. During August to October 2022 the markup frequently reached 200 to 300 euro per MWh and peaked near 900 to 1000 for a few hours when the MGP touched the 600 to 700 range. This shows tight-market premiums and a readiness to provide upward regulation when the reservoir chain is operating at high head. Through 2023, the curves settle around 150 to 250 in line with the fall in thermal marginal costs. The sharp vertical excursions that appear for a single unit are rare start-cost passes rather than routine behaviour. They occur when the MI profile is flat, and the unit would have to spin up solely for the MSD. The clustering of all five units around the same OFF levels on most days points to operator-coherent tactics and confirms that reservoir dispatch is coordinated across the chain rather than optimized plant by plant.
The production unit with the unit code of UP_TAGLIAMENTO_1 is an outlier inside Cluster 12 and illustrates a regime-based strategy. As demonstrated in Figure 20a, BID activity is minimal from mid-2022 to late-2024, with long stretches at or near zero and only occasional bursts above 50 €/MWh. This behaviour fits a run-of-river or seasonally constrained reservoir, where downward flexibility is limited and the operator prefers to preserve water for markets that pay for volume rather than accept buybacks in the MSD. Short ramps in April–May and September 2022 push BID values to around 100–110 €/MWh, coinciding with dry spells and price spikes. These lifts discourage curtailment and reflect the water-value logic observed in other hydro fleets during reservoir troughs and volatile MGP conditions. Another clear trait is the near-binary profile of the series; it alternates between zero and a rounded menu price for weeks at a time, showing that many hydro units leave BID unchanged for long periods and adjust it only a few times per season.
As Figure 20b shows, OFF behaves very differently. Through the summer of 2022 it rose with the MGP and often sat 100 to 250 euro per MWh above it with several days near 900 to 1000 while the MGP oscillated around 600 to 700. After the 2023 normalization, OFF gradually declined to 150 to 220 and ends 2024 with a mild upward drift that mirrors the winter recovery in the MGP. The curve contains several evening-peak bumps and weekend flattening that reveal a deliberate arbitrage of within-day spreads. When MI schedules leave the unit at zero, the OFF curve briefly steps up by 50 to 100 which reads as a premium for start and foregone flexibility. Overall, the unit exhibits a conservative downward posture and an active upward posture which is typical for hydro plants that monetise flexibility during high-price hours and avoid curtailment when water is scarce.
Valtellina/Adda chain groups four hydropower units located along the Adda river in the Valtellina valley (Lombardy); UP_DOSSI_1, UP_TALAMONA_2, UP_VALMALENCO_1 (all ENEL PRODUZIONE S.p.A.), and UP_VILLA_1 (IREN ENERGIA S.p.A.), whose water inflows and storage are hydraulically linked [45]. In this regard, the Valtellina and Adda chain shows the clearest example of basin-level coordination with technology-driven asymmetry between BID and OFF.
In BID (Figure 21a), the four units post different values and timings through 2022. During the August to September price shock, the series ramped to 200 to 350 with day-time plateaus and frequent evening returns near zero. From early 2023 onward they reverted to minimal BID activity (except for UP_DOSSI_1), often at zero for months. The explanation is consistent with the operator’s water-value calculus. In 2022, curtailment was very expensive relative to keeping energy for later hours or later weeks, so BID quotes were raised to avoid acceptance. Once spreads compressed, the same units returned to a low and flat BID stance. The long, integer-valued steps visible across all four plant stations suggest a small set of menu prices decided centrally by the chain. That is aligned with the broader evidence that hydro portfolios tend to replicate simple MSD rules across plants of the same basin and update them only a few times per year.
OFF curves exhibit much richer dynamics and a near one-for-one tracking of the MGP with a stable premium. During late summer 2022, all four units peaked around 800 to 1000 when the MGP surged. The premium then compressed to roughly 30 to 80 through 2023 and 2024. The lines for VALMALENCO_1 and VILLA_1 showed slightly higher markups during evening hours which is consistent with the higher head and better ramping capability of those reservoirs. Occasional narrow spikes appear for individual stations and typically align with hours where MI-scheduled production is zero; these spikes represent a start-cost adder to avoid cycling and match the rationale previously documented for ENEL hydro where OFF bids jump when MI profiles are flat. The cluster’s macro-behaviour therefore combines conservative, low-engagement BID with price-following OFF. This approach ensures steady income, earns money from flexibility when the market demands it, and aligns with the typical way hydro units operate in the MSD, where upward regulation is the primary source of revenue and downward regulation serves a protective function.
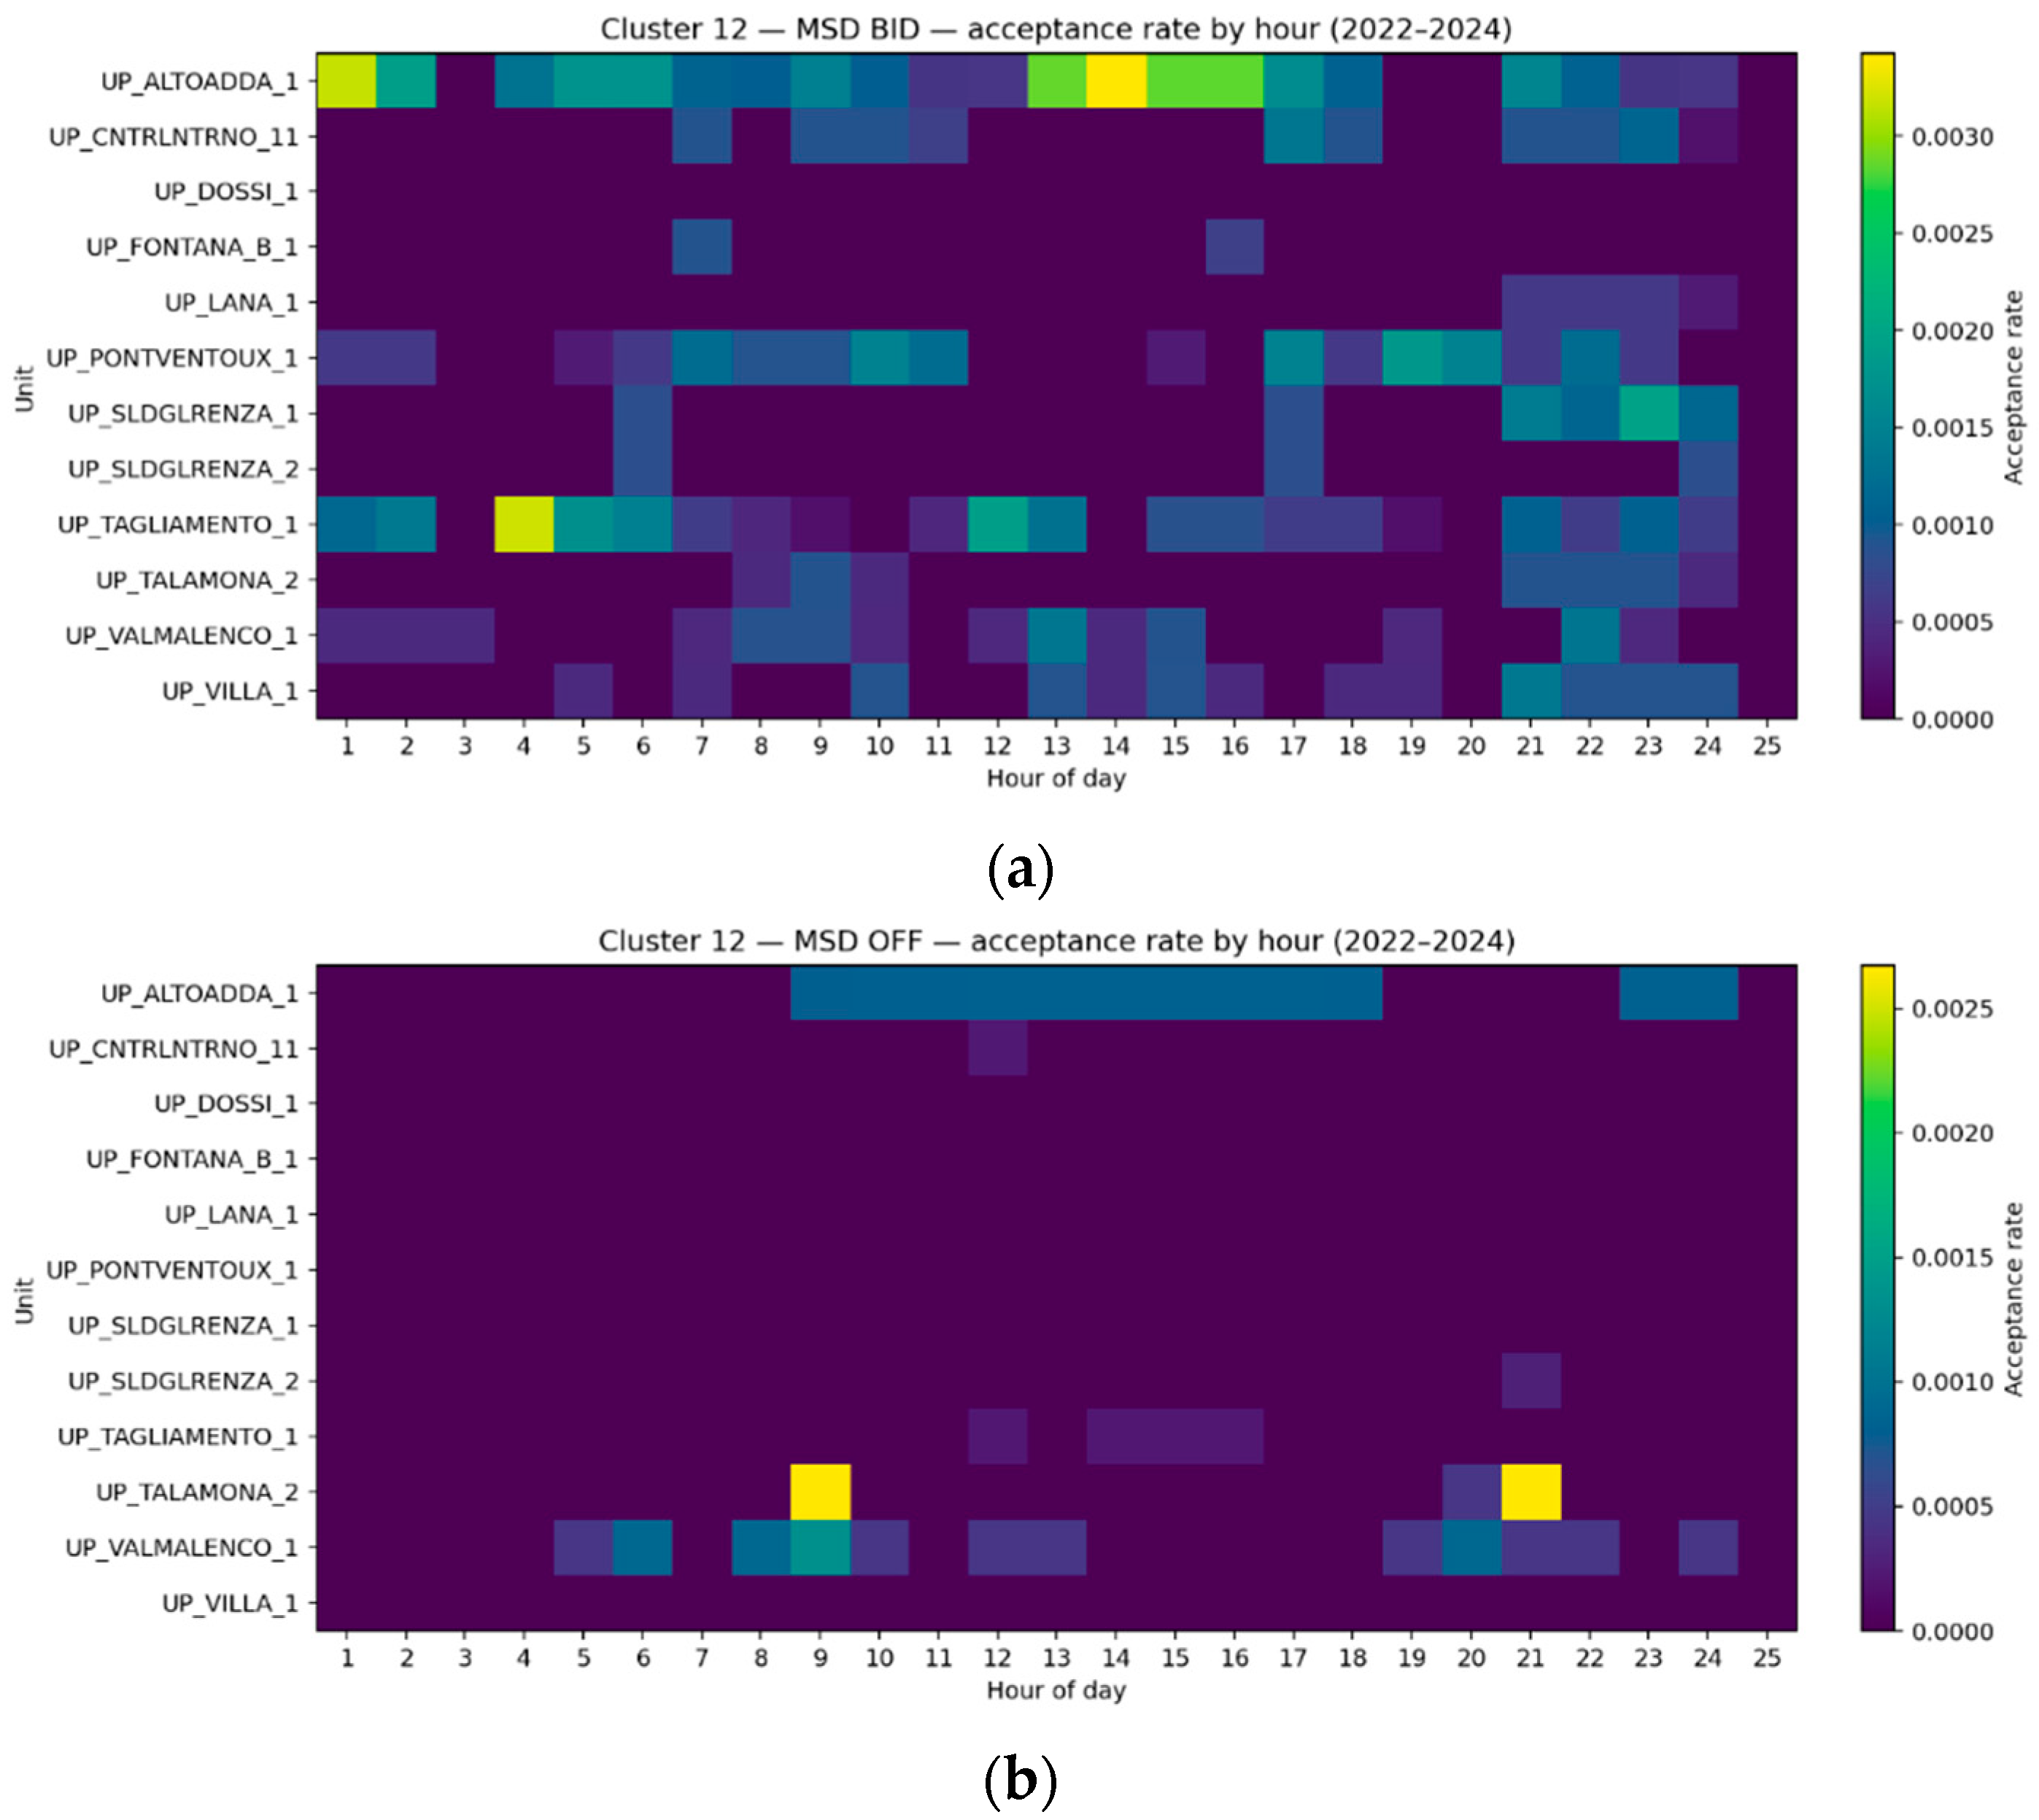
Across Cluster 12, the BID acceptance heatmap in Figure 22a shows that activations are rare, peaks are only about 0.3% of hours of all hourly observations, but the little acceptance that does occur falls in very specific parts of the day. The pumped-storage unit UP_ALTOADDA_1 has the clearest signature, with faint bands in the early night/early morning (≈01–02) and, more markedly, early afternoon (≈13–16), plus occasional calls around 21–22. UP_SLDGLRENZA_1/_2 and UP_VALMALENCO_1 show scattered, low-intensity pixels mostly at mid-day and evening.
According to Figure 22b, the OFF acceptance heatmap flips the daytime pattern. Acceptance concentrates in the morning ramp (≈08–10) and the evening peak (≈20–22), again with low absolute frequencies (≤0.27–0.30%) but with a stable hour-of-day footprint. UP_TALAMONA_2 shows the most pronounced pixels at h09 and h21; UP_VALMALENCO_1 exhibits repeated bands at h05–06, h08–10, h12–13, and h19–22; UP_TAGLIAMENTO_1 cluster around h12–17; and UP_ALTOADDA_1 provides a broader, faint plateau from h09 to h19 plus h23–24. This timing matches system economics. As the zonal price rises during ramps and evening peaks, the opportunity cost of releasing water is higher and the system’s marginal value of upward flexibility increases, so hydro OFF bids are accepted in those hours. Overall, Cluster 12 behaves like classic flex-hydro which BID near the net-load trough and OFF on the ramps, driven by water value, reservoir state, and the ability of pumped storage to switch direction on short notice.
Figure 23a shows widespread downward activations in this hydro cluster, mostly concentrated in UP_TAGLIAMENTO_1 (≈2.7 GWh, largely AS, reflecting frequent full shutdowns in low-load/oversupply hours) and UP_ALTOADDA_1 (≈2.3 GWh, mainly GR1 with GR2, indicating frequent online operation with successive trims). UP_PONTVENTOUX_1 contributes ≈ 1.5 GWh via GR2 (deep cuts from operating point), while UP_VALMALENCO_1 (≈1.1 GWh) mix AS with GR1–GR2. Other units (e.g., UP_CNTRLNTRNO_11, UP_FONTANA_B_1, and UP_LANA_1) show marginal volumes, consistent with limited operation and hydraulic constraints.
On the other hand, Figure 23b shows a more selective upward pattern. Almost all accepted OFF energy is GR1 and concentrated in UP_ALTOADDA_1 (≈2.1–2.2 GWh), reflecting quick ramps from synchronized status rather than cold starts (AS is near-zero). Minor contributions (~0.1 GWh each) come from UP_TAGLIAMENTO_1 and UP_VALMALENCO_1 in AS. The contrast between panels aligns with hydro operating economics. Which means that curtailments (BID) are frequently used to absorb surplus energy or respect water-management constraints across the cascade, hence sizable AS and deeper GR steps for several units. Upward activations are rarer and, when they occur, are delivered as incremental ramps from already-online units, which keeps start-up costs low and preserves reservoir targets.

6. Conclusions and Future Work

This study presented an unsupervised, stability-driven methodology for profiling production unit operator’s macro-behaviour in Italy’s Ancillary Services Market, focusing on the NORD, utilizing up-to-date data. By leveraging capacity-normalized cross-market features from the MGP, MI, and MSD, the research addressed a critical gap in understanding how production units adapt their bidding strategies. The approach employed a principled rule for selecting the optimal number of clusters (Gap Statistic with the 1-SE criterion), validated by a bootstrap Adjusted Rand Index, resulting in a robust and reproducible 13-group taxonomy that is resilient to sampling noise and random initializations. The use of Equivalent Operating Hours (EOH) and per-MW income metrics proved essential for comparing the diverse technologies on a common scale.
The resulting taxonomy revealed a clear and empirically validated range of operator behaviours and coherent “templates”. These archetypes include units that operate mainly in the day-ahead market (MGP) and engage with MSD only sporadically. Others monetise flexibility via targeted upward redispatch, and coordinated “reservoir chains” show behaviour driven by the value of water. The analysis found that energy-oriented CCGTs closely track the MGP, while ancillary-oriented portfolios (e.g., pumped-storage, reservoirs) primarily earn via for upward regulation in the MSD. The findings highlight the dominance of thermoelectric and dispatchable hydro technologies in providing ancillary services and shed light on varying degrees of responsiveness to market price signals.
Understanding these behaviours is paramount for TSOs, market regulators, and policymakers, as it provides a robust foundation for identifying potential inefficiencies, assessing market concentration risks, and designing more resilient balancing mechanisms. The use of up-to-date data is crucial in this context, as it provides a unique opportunity to investigate post-2021 market phenomena, including the effects of geopolitical events and extreme price volatility. This granular analysis is necessitated by the power sector’s profound transition toward sustainability and increasing market complexity. The research offers a valuable tool for market monitoring and for informing future policy decisions aimed at fostering competition and improving market transparency. Beyond monitoring, the clustering framework has direct implications for market design and regulatory mechanisms. By distinguishing operator archetypes, regulators can evaluate whether current reserve requirements adequately reflect the diversity of flexibility providers and adjust procurement schemes accordingly. Insights into the concentration of upward or downward flexibility within specific clusters can inform bidding zone reviews and congestion management strategies, while the identification of emerging demand response or storage-based clusters offers guidance for calibrating UVAM and capacity market rules. Finally, the taxonomy provides a reference point for assessing how new policy interventions, such as renewable integration targets or flexibility incentives, translate into observable operator behaviour, thus enhancing the alignment between regulatory objectives and actual market outcomes.
For future work, this methodology can be extended to analyze other Italian market zones to create a national taxonomy of operator behaviours and identify any inter-zonal strategic differences. Furthermore, a logical next step is to integrate a predictive component into this framework. This could involve developing models to forecast the need for each ancillary service, across all scopes and for every hour and zone in Italy, which would be of immense value to both the TSO for operational planning and to market participants for strategic bidding.

Author Contributions

Conceptualization, M.H.I.; Methodology, M.H.I.; Software, M.H.I. and A.K.P.; Validation, M.H.I.; Formal Analysis, M.H.I.; Resources, M.H.I. and A.K.P.; Data Curation, M.H.I. and A.K.P.; Writing—Original Draft, M.H.I. and A.K.P.; Writing—Review and Editing, M.H.I.; Visualization, M.H.I.; Supervision, M.H.I. All authors have read and agreed to the published version of the manuscript.

Funding

This research received no external funding.

Data Availability Statement

Data for three markets (MGP, MI, and MSD) were obtained from the GME database [3]. For the reference period, three datasets were assembled for each market type, ensuring comparability across the North zone (NORD) and across years. Detailed information on the PUs’ technology, energy source, installed capacity, and voltage level was compiled from ENTSO-E Transparency Platform [33], Terna [34,35], academic theses [13,36,37], and publicly available datasets [38]. Data will be made available on request.

Conflicts of Interest

The authors declare no conflict of interest.

Appendix A. Supplementary Results

Table A1. Selection diagnostics for the number of clusters (K).
KGAPS_KWKMEDIAN_ARIQ25_ARIQ75_ARI
21.23210.0316643.38100.92020.84410.9601
31.33760.0347515.46050.55880.51580.7495
41.47620.0317409.25920.82960.67440.9439
51.57950.0338339.26020.84920.72510.9195
61.71200.0333277.44030.92370.85630.9586
71.78060.0339241.78710.70520.64860.7667
81.87920.0387208.60440.74660.63070.8392
91.96470.0347180.31320.53750.47700.7431
102.06110.0293156.90040.76430.70590.8346
112.11360.0366141.63420.79130.69400.8561
122.16470.0403129.15250.83580.77850.8739
132.21050.0340117.96990.86750.79760.9164
142.24120.0318110.38910.85720.80000.9103
152.24110.0379106.43040.76730.74270.8147
162.27410.040099.68390.79970.69860.8315
172.32020.036991.84620.81390.74440.8860
182.33210.039787.35460.74940.65790.8553
192.37190.037880.97280.73200.56750.8188
202.39970.036576.92860.68820.58850.7756
212.41920.037072.56180.62420.58230.7045
222.45550.035267.28870.60840.57160.7123
232.48390.035264.13590.57080.51000.6761
242.53710.039259.04760.65680.59500.6962
252.55690.035456.40490.67130.60470.7096
262.57100.042253.91800.69080.59140.7389
272.62040.044049.72310.66170.58860.7371
282.64300.039647.22990.70800.61070.7866
292.68270.041644.31460.63640.59100.7025
302.71440.042141.86840.69160.63040.7970
Table A2. Production units for the 13 clusters (NORD, 2022–2024).
CLUSTERUNIT_REFERENCE
C0UP_BORGO_TRE_1, UP_CAORIA_1, UP_CAVILLA_1, UP_CLHRCSLGNO_1, UP_CNTRLDTRNL_1, UP_LASA_ME_1, UP_NOCE_1, UP_NOVE_1, UP_RETE_2_1, UP_SANGIACOMO_1, UP_SCTNPWPFRR_2, UP_TURBIGO_3, UP_VALCAMONICA_1, UP_VERZUOLO_2
C1UP_ANDONNO_C_1, UP_CASTELDEL_1, UP_CHIEVOLIS_2, UP_CMPLCCIOLI_2, UP_DEVERO_3, UP_FADALTO_1, UP_FUSINA_T_3, UP_FUSINA_T_4, UP_GEROLA_1, UP_LEVANTE_3, UP_MONCALIERI_3, UP_NPWRFRRRRB_10, UP_PANTANO_D_1, UP_PELOS_1, UP_PONTE_1, UP_PORTO_COR_3, UP_PORTO_COR_4, UP_ROVESCA_1, UP_S.FLORI.A_1, UP_S.MASS.CL_1, UP_SCTNPWPFRR_3, UP_SFLORIANO_2, UP_SOSPIROLO_1, UP_SSTSNGVNNI_1, UP_VINADIO_1.
C2UP_CETSERVOLA_1, UP_CURON_ME_1, UP_GRESSONEY_1, UP_MAEN_5, UP_VALPELLIN_1
C3UP_NCTLVRNFRR_1, UP_OSTIGLIA_12, UP_VADOTERM_5
C4UP_AZOTATI_5; UP_CHIVASSO_2; UP_RONCOVALG_1; UP_S.FIORANO_1; UP_SERMIDE_3; UP_SERMIDE_4.
C5UP_ACTV_1, UP_BARGI_CEN_1, UP_CARONA_1, UP_CHIESE_1, UP_CNTRLDCGNR_46, UP_DUINO_1, UP_EDOLO_1, UP_ETQCHIOTAS_1, UP_ETQ_ROVINA_1, UP_GARGNANO_1, UP_LA_CASELL_1, UP_LA_CASELL_2, UP_LA_CASELL_3, UP_LA_CASELL_4, UP_M._CIAPEL_1, UP_MASOCORON_1, UP_MONFALCO_1, UP_MONFALCO_2, UP_OSTIGLIA_3, UP_PERRERES_1, UP_RIVADEL_3, UP_SOVERZENE_2, UP_SSTSNGVNN2_1, UP_TAVAZZANO_C_6, UP_TELESSIO_1, UP_ULTIMO_1, UP_VAL_NOANA_1
C6UP_GRAVEDONA_1; UP_S.PANCRAZ_1; UP_SOVERZENE_1
C7UP_MOLINE_1; UP_NOVEL_1; UP_TORINONORD_1; UP_TORVISCOSA_1
C8UP_VOGHERA_1
C9UP_ARSIE_1; UP_BATTIGGIO_1; UP_BRUNICO_M_1; UP_CENCENIGH_1; UP_LAPPAGO_1; UP_LIRO_1; UP_ROSONE_1; UP_SND_ALBAN_1; UP_SND_CAMPO_1
C10UP_CASSANO_2, UP_CHIVASSO_1, UP_CTE_DEL_M_2, UP_LEINI_1, UP_MONCALRPW_2, UP_NPWRFRRRRB_8, UP_NPWRFRRRRB_9, UP_NPWRMNTOVA_2, UP_NPWRMNTOVA_3, UP_NPWRRVENNA_10, UP_NPWRRVENNA_11, UP_PIACENZA_4, UP_TAVAZZANO_5, UP_TURBIGO_4.
C11UP_MORASCO_1; UP_SFRNGNRZNE_2; UP_VENAUS_1
C12UP_ALTOADDA_1; UP_CNTRLNTRNO_11; UP_DOSSI_1; UP_FONTANA_B_1; UP_LANA_1; UP_PONTVENTOUX_1; UP_PREM-GROSIO_1; UP_SLDGLRENZA_1; UP_SLDGLRENZA_2; UP_TAGLIAMENTO_1; UP_TALAMONA_2; UP_VALMALENCO_1; UP_VILLA_1
The following section provides a concise description of the key features of each identified cluster. These summaries highlight the main technologies, operating hours, revenue composition, and market participation strategies that define the macro-behaviour of the grouped units. For reference, a structured overview of the same characteristics is also reported in Table A3.
Cluster 0: Mixed CCGTs, engines, and hydro reservoirs with mid-to-high utilization (6–10.7 k h). Revenues mainly from the day-ahead market, hydro units active in intraday fine-tuning, and selective ancillary service participation. A few thermoelectric plants contribute upward and downward MSD flexibility. Overall, stable MGP-centric earners with occasional MSD interventions, not specialized peakers.
Cluster 1: Reservoir hydro, run-of-river plants, and several thermoelectric units, including coal and CCGTs. Medium–high operating hours, solid MGP revenues, limited intraday, and minor MSD participation. Some thermoelectric plants offer downward bids, but overall the group represents “baseline producers” reliant on scheduled production, with ancillary services playing a secondary role.
Cluster 2: Hydro reservoirs and one CCGT with moderate–high operating hours (2.6–8.4 k h). Revenues concentrated in the day-ahead market, complemented by intraday adjustments, especially in reservoirs. Ancillary services play a negligible role. Common trait: steady generation, tactical intraday flexibility, and minimal reliance on the MSD, aligning with an energy-oriented strategy rather than balancing specialization.
Cluster 3: Large CCGTs with high utilization (4 k–8 k h), strong day-ahead revenues, and distinct intraday downward bidding activity (MI_BID far above average). Ancillary service engagement is present but not defining. They act as flexible baseload plants that refine schedules intraday, offering tactical rather than structural MSD participation.
Cluster 4: Flexible peaks: pumped-storage hydro and thermoelectric CCGTs with low operating hours but high revenues per MW. Strongly active in ancillary services, combining frequent upward (MSD_OFF) and downward (MSD_BID) redispatch. Limited intraday use. Their profitability derives from monetizing flexibility during system needs rather than continuous energy production.
Cluster 5: Low-duty pumped-storage, reservoirs, and peaking thermoelectric units. Revenues are limited in the MGP and MI but strongly positive in ancillary services, especially upward redispatch (MSD_OFF). Operating hours are very low, confirming their role as contingency providers. The group embodies “ancillary-driven” plants that operate sparingly yet contribute crucial upward flexibility.
Cluster 6: Three hydro units with high utilization and strong day-ahead revenues. Distinctive signature: very high intraday upward offers (MI_OFF), complemented by moderate downward bids. Ancillary service participation is minor. These plants represent “very active hydro,” responding continuously to intraday conditions while sustaining long operational schedules.
Cluster 7: Reservoir hydro and CCGTs with very high operating hours (>11 k h) and above-average income. Revenues are concentrated in the day-ahead and intraday markets, particularly intraday upward offers (MI_OFF). Ancillary service activity is marginal. This cluster represents baseload-like units that maintains near-continuous production and optimize dispatch through intraday trading.
Cluster 8: ENGIE’s Voghera CCGT, isolated for its extreme profile: very high utilization (~18 k h), dominant day-ahead revenues, and frequent downward redispatch (MSD_BID), with some upward MSD activity. A baseload unit that consistently clears the day-ahead market but provides balancing flexibility when required.
Cluster 9: High-running hydro units (6.3–9.7 k h) with strong day-ahead revenues and consistent ancillary activity in both upward and downward redispatch. Intraday participation is modest. These plants act as “baseload hydro,” reliably producing energy and complementing it with regular MSD contributions.
Cluster 10: Large CCGTs from multiple operators, running many hours with solid day-ahead and intraday revenues. Ancillary service participation is lower than average, though present in some units. They represent “workhorse CCGTs”: continuously active plants optimized for efficiency and steady earnings, with limited reliance on MSD flexibility.
Cluster 11: Reservoir hydro plants operated as peakers. Very low operating hours (~1–1.5 k h), modest day-ahead and intraday income, but strong ancillary revenues, especially upward redispatch. They monetize flexibility rather than continuous generation, stepping in during scarcity periods.
Cluster 12: Reservoir and pumped-storage hydro plants with low annual output but very high upward redispatch revenues (MSD_OFF). Day-ahead and intraday participation is limited. These are “flex-hydro” units: plants that strategically withhold energy in normal hours and monetize flexibility during system stress.
Table A3. Macro-behaviour summary of the 13 clusters (NORD, 2022–2024).
CLUSTERCOMPOSITION (TECH/EXAMPLES)UTILIZATION (EOH)MSD SIGNATURENOTES
C0Mixed CCGT/ICE (AGSM/HERA/Sorgenia/SEF/Iren/Burgo) + dispatchable hydro (ENEL/Dolomiti/Alperia/Edison).High–very high (~6–10.7 k h).Selective; a few thermos with strong OFF (e.g., CLHRCSLGNO_1, VERZUOLO_2); some with both BID/OFF (CNTRLDTRNL_1, SCTNPWPFRR_2).Balanced “MGP workhorses” with targeted MSD, not MSD-specialists.
C1Mostly dispatchable hydro (ENEL/Alperia/Dolomiti) + some CCGT (Moncalieri/Porto Corsini/Levante) + two Fusina coal.Mid (~3–7 k h).Low overall; pockets of BID (PORTO_COR_3–4, MONCALIERI_3).“Baseline producers”: scheduled output, occasional ancillary actions.
C2Hydro-dominated (CVA reservoirs + Alperia RoR) + one CCGT (self-producer).Mid–high (≈2.6–8.4 k h).Minimal/sporadic.Energy-oriented assets using MI for fine-tuning; not MSD providers.
C3Large CCGTs (EP/Tirreno Power etc.).Mid–high (≈4–8 k h).Around average (no extreme MSD).“MI-arbitrageurs”: agile downward flexibility Via MI, MSD secondary.
C4Peaking mix: ENEL pumped-storage (RONCOVALG_1, S.FIORANO_1) + A2A/Edison CCGTs (CHIVASSO_2, SERMIDE_3–4, AZOTATI_5).Low (hundreds–few thousand h).Very high: BID extreme; OFF high-frequent redispatch both ways.Flexibility monetizers in the MSD (pumped-storage + peaking CCGTs).
C5Pumped-storage/reservoir hydro (ENEL and others) + peaking CCGT/coal + some small reservoirs.Low (many <1.5 k h; some small hydro 1–3 k h).Strong OFF (upward); BID slightly below avg.“Ancillary-driven peaks”: earn mainly via MSD OFF activations.
C6Three dispatchable hydro: GRAVEDONA_1 (RoR), S.PANCRAZ_1, SOVERZENE_1.High (well above avg).Slightly below avg.“Very active hydro”: sustained output + systematic intraday upward offers.
C7One small reservoir hydro (MOLINE_1) + three CCGTs (NOVEL_1, TORINONORD_1, TORVISCOSA_1).Very high.Slightly below avg.“Energy-market maximizers”: long running hours, intraday optimization; MSD limited.
C8Singleton ENGIE CCGT VOGHERA_1.Very high (~18 k h).High BID (frequent downward redispatch) + notable OFF.Baseload CCGT flexing around schedule Via MSD (especially downward).
C9Nine dispatchable hydro (mix RoR/reservoir; ENEL/A2A/Edison/Alperia/IREN).High (~6.3–9.7 k h).Regular OFF and BID acceptances.“Baseload hydro with flexibility”: steady energy + non-trivial MSD services.
C10Fleet of large CCGTs (ENI/A2A/EP/IREN/ENGIE).High (centroid z ≈ +0.86).Below avg BID/OFF.“Workhorse CCGTs”: continuous operation, MI for adjustments, limited MSD.
C11ENEL reservoirs: MORASCO_1, SFRNGNRZNE_2, VENAUS_1.Low (~1.1–1.5 k h).High OFF, BID also +.Reservoir hydro peakers: flexibility revenues dominate over energy volume.
C12Hydro mix with two pumped-storage (ALTOADDA_1, PONTVENTOUX_1) + reservoirs/RoR.Low; income low.Very high OFF (largest + among features); BID~neutral.“Flex-hydro”: limited annual energy, strong value in upward MSD redispatch.
Legend (EOH): low < 3 k h · mid 3–7 k h · high 7–10 k h · very high > 10 k h (over 2022–2024).

References

  1. Lei, X.; Zhong, J.; Chen, Y.; Shao, Z.; Jian, L. Grid Integration of Electric Vehicles within Electricity and Carbon Markets: A Comprehensive Overview. eTransportation 2025, 25, 100435. [Google Scholar] [CrossRef]
  2. Wang, B.; Xu, X.; Li, G.; Fan, H.; Qiao, N.; Chen, H.; Liu, D.; Ma, T. A study of electricity sales offer strategies applicable to the participation of multi-energy generators in short-and medium-term markets. Sustain. Energy Grids Netw. 2024, 40, 101553. [Google Scholar] [CrossRef]
  3. GME—Gestore dei Mercati Energetici. Available online: https://www.mercatoelettrico.org/EN/ (accessed on 20 August 2025).
  4. Cheng, L.; Huang, P.; Zou, T.; Zhang, M.; Peng, P.; Lu, W. Evolutionary game-theoretical approaches for long-term strategic bidding among diverse stakeholders in large-scale and local power markets: Basic concept, modelling review, and future vision. Int. J. Electr. Power Energy Syst. 2025, 166, 110589. [Google Scholar] [CrossRef]
  5. Huang, C.; Li, K.; Zhang, N. Strategic joint bidding and pricing of load aggregators in day-ahead demand response market. Appl. Energy 2025, 377, 124552. [Google Scholar] [CrossRef]
  6. Sousa, V.; Algarvio, H. Strategic Bidding to Increase the Market Value of Variable Renewable Generators in Electricity Markets. Energies 2025, 18, 1586. [Google Scholar] [CrossRef]
  7. Roldan-Fernandez, J.M.; Serrano-Gonzalez, J.; Gonzalez-Rodriguez, A.G.; Burgos-Payan, M.; Riquelme-Santos, J.M. The effect of hydropower bidding strategy on the iberian day-ahead electricity market. Energy Strateg. Rev. 2024, 55, 101517. [Google Scholar] [CrossRef]
  8. Andreotti, D.; Spiller, M.; Scrocca, A.; Bovera, F.; Rancilio, G. Modeling and Analysis of BESS Operations in Electricity Markets: Prediction and Strategies for Day-Ahead and Continuous Intra-Day Markets. Sustainability 2024, 16, 7940. [Google Scholar] [CrossRef]
  9. Jiang, Y.; Dong, J.; Huang, H. Optimal bidding strategy for the price-maker virtual power plant in the day-ahead market based on multi-agent twin delayed deep deterministic policy gradient algorithm. Energy 2024, 306, 132388. [Google Scholar] [CrossRef]
  10. Innocenti, P. Statistical Models and Algorithms for the Analysis of the Electricity Market and the Economic Dispatch Service. Master’s Thesis, Politecnico di Milano, Milan, Italy, 2020. [Google Scholar]
  11. Marchionni, V. TAJIVE: A New Tool for Integrative Analysis of Multidimensional Data. Application to the Italian Energy Market. Master’s Thesis, Politecnico di Milano, Milan, Italy, 2019. [Google Scholar]
  12. Bovera, F.; Blaco, A.; Rancilio, G.; Delfanti, M. Assessing the accuracy of different machine learning classification algorithms in forecasting results of Italian ancillary services market. In Proceedings of the 2019 16th International Conference on the European Energy Market (EEM), Ljubljana, Slovenia, 18–20 September 2019; IEEE: Piscataway, NJ, USA, 2019; pp. 1–5. [Google Scholar]
  13. Pasotti, A. Prediction and Interpretation of Bids in the Italian Electricity Market for Ancillary Services. Master’s Thesis, Politecnico di Milano, Milan, Italy, 2020. [Google Scholar]
  14. Imani, M.H.; Bompard, E.; Colella, P.; Huang, T. Data analytics in the electricity market: A systematic literature review. Energy Syst. 2023, 16, 1–35. [Google Scholar] [CrossRef]
  15. Huang, L.; Shan, M.; Weng, L.; Meng, L. Graph Convolutional Spectral Clustering for Electricity Market Data Clustering. Appl. Sci. 2024, 14, 5263. [Google Scholar] [CrossRef]
  16. Imani, M.H.; Andani, M.T.; Andani, H.T. Clustering of electricity price: An application to the Italian electricity market. In Proceedings of the 2023 IEEE Texas Power and Energy Conference (TPEC), College Station, TX, USA, 13–14 February 2023; IEEE: Piscataway, NJ, USA, 2023; pp. 1–6. [Google Scholar]
  17. Shahcheraghian, A.; Ilinca, A.; Sommerfeldt, N. K-means and agglomerative clustering for source-load mapping in distributed district heating planning. Energy Convers. Manag. X 2025, 25, 100860. [Google Scholar] [CrossRef]
  18. Jalooli, A.; Marefat, A. Cluster stability-driven optimization for enhanced routing in heterogeneous vehicular networks. Veh. Commun. 2024, 47, 100745. [Google Scholar] [CrossRef]
  19. Chang, A.; Tang, T.M.; Zikry, T.M.; Allen, G.I. Unsupervised Machine Learning for Scientific Discovery: Workflow and Best Practices. arXiv 2025, arXiv:2506.04553. [Google Scholar] [CrossRef]
  20. Imani, M.H.; Bompard, E.; Colella, P.; Huang, T. Predictive methods of electricity price: An application to the Italian electricity market. In Proceedings of the 2020 IEEE International Conference on Environment and Electrical Engineering and 2020 IEEE Industrial and Commercial Power Systems Europe (EEEIC/I&CPS Europe), Madrid, Spain, 9–12 June 2020; IEEE: Piscataway, NJ, USA, 2020; pp. 1–6. [Google Scholar]
  21. Imani, M.H.; Bompard, E.; Colella, P.; Huang, T. Impacts of the COVID-19 pandemic on the Italian electricity demand and markets. CSEE J. Power Energy Syst. 2022, 9, 824–827. [Google Scholar]
  22. Il Mercato per il Servizio di Dispacciamento. Available online: https://www.rse-web.it/wp-content/uploads/2024/03/05_MSD-MB.pdf (accessed on 26 July 2025).
  23. Il Mercato Europeo del Gas Nell’inverno ‘24/’25. Available online: www.mercatoelettrico.org/Portals/0/Documents/Newsletter/20250117Newsletter.pdf (accessed on 26 July 2025).
  24. Relazione 2022 Incentivo per la Riduzione dei Costi di Dispacciamento. Available online: https://download.terna.it/terna/Relazione_2022_costi_di_dispacciamento_8db9a8865e2ab99.pdf (accessed on 12 July 2025).
  25. Rapporto Mensile sul Sistema Elettrico Novembre. 2024. Available online: https://download.terna.it/terna/Rapporto_Mensile_Novembre_24_8dd2029e68c7c67.pdf (accessed on 22 July 2025).
  26. Petrolio: Da Mercato Globale a Mercato Frammentato? Available online: https://www.mercatoelettrico.org/Portals/0/Documents/Newsletter/20230117Newsletter.pdf (accessed on 24 July 2025).
  27. Il Mercato del Giorno Prima (MGP). Available online: www.rse-web.it/wp-content/uploads/2024/02/02_MGP.pdf (accessed on 17 July 2025).
  28. Hosseini Imani, M. Empirical Analysis of Inter-Zonal Congestion in the Italian Electricity Market Using Multinomial Logistic Regression. Energies 2024, 17, 5901. [Google Scholar] [CrossRef]
  29. Context Analysis and Business Model. Available online: https://reports.gruppoacea.it/2022/en/sustainability/corporate-identity/group-profile/context-analysis-and-business-model (accessed on 22 July 2025).
  30. Approvazione Delle Modifiche, Predisposte da Terna s.p.a., al Progetto Pilota per la Partecipazione di Unità Virtuali Miste al Mercato per il Servizio di Dispacciamento (msd), ai Sensi Della Deliberazione Dell’autorità 300/2017/r/ee. Available online: https://www.arera.it/fileadmin/allegati/docs/23/366-23.pdf (accessed on 25 June 2025).
  31. Price Records in European Energy Markets After the Russian Invasion of Ukraine. Available online: https://aleasoft.com/price-records-european-energy-markets-russian-invasion-ukraine (accessed on 21 June 2025).
  32. Regolamento Recante le Modalità per la Creazione, Qualificazione e Gestione di Unita’ Virtuali Abilitate Miste (Uvam) al Mercato dei Servizi di Dispacciamento-Regolamento msd Uvam. Available online: https://www.terna.it/DesktopModules/AdactoBackend/API/directdownload/get?file=Regolamento_UVAM_MSD_8d803bd91884d36.pdf (accessed on 21 June 2025).
  33. ENTSO-E. Available online: https://www.entsoe.eu/ (accessed on 22 July 2025).
  34. UP Rilevanti Inferiori a 100MW. Available online: https://download.terna.it/terna/0000/0216/19.XLS (accessed on 1 August 2025).
  35. Qualità del Servizio di Trasmissione—Elenco dei Siti di Utenti Consumatori ed Utenti Produttori Direttamente Connessi Alla rete di Trasmissione Nazionale al 31.12.2021. 2021. Available online: https://download.terna.it/terna/PUNTI DI CONNESSIONE DIR CONNESSI RTN UFFICIALE al 31.12.2021_8da34c53fa3fb41.pdf (accessed on 16 July 2025).
  36. Colbalchini, R. Development of a Visualization and Analysis Tool for Public Domain Data of the Italian Electric Power Market. Master’s Thesis, Politecnico di Milano, Milan, Italy, 2014. [Google Scholar]
  37. Vannoni, A. Flexible Heat and Power Generation: Market Opportunities for Combined Cycle Gas Turbines and Heat Pumps Coupling. Master’s Thesis, Università Degli Studi di Genova, Genoa, Italy, 2022. [Google Scholar]
  38. Database NORD Italy. Available online: https://prod-dcd-datasets-public-files-eu-west-1.s3.eu-west-1.amazonaws.com/67579c18-90db-4cff-b83a-47bd3a6fc3d1 (accessed on 1 August 2025).
  39. Sagala, N.T.M.; Gunawan, A.A.S. Discovering the optimal number of crime cluster using elbow, silhouette, gap statistics, and nbclust methods. ComTech Comput. Math. Eng. Appl. 2022, 13, 1–10. [Google Scholar] [CrossRef]
  40. Yang, J.; Lee, J.-Y.; Choi, M.; Joo, Y. A new approach to determine the optimal number of clusters based on the gap statistic. In Proceedings of the International Conference on Machine Learning for Networking, Paris, France, 3–5 December 2019; Springer Nature: Cham, Switzerland, 2019; pp. 227–239. [Google Scholar]
  41. Khan, I.K.; Daud, H.; Zainuddin, N.; Sokkalingam, R. Standardizing reference data in gap statistic for selection optimal number of cluster in K-means algorithm. Alexandria Eng. J. 2025, 118, 246–260. [Google Scholar] [CrossRef]
  42. Yu, H.; Chapman, B.; Di Florio, A.; Eischen, E.; Gotz, D.; Jacob, M.; Blair, R.H. Bootstrapping estimates of stability for clusters, observations and model selection. Comput. Stat. 2019, 34, 349–372. [Google Scholar] [CrossRef]
  43. Gana Dresen, I.M.; Boes, T.; Huesing, J.; Neuhaeuser, M.; Joeckel, K.-H. New resampling method for evaluating stability of clusters. BMC Bioinform. 2008, 9, 42. [Google Scholar] [CrossRef] [PubMed]
  44. Mucha, H.-J.; Bartel, H.-G. Validation of k-means clustering: Why is bootstrapping better than subsampling. Arch. Data Sci. Ser. A 2017, 2, 1–14. [Google Scholar]
  45. Ydroelectric Power Plant on the Adda River—Alta Valtellina. Available online: https://www.salvettigraneroli.com/en/news/hydroelectric-power-plant-on-the-adda-river-alta-valtellina/?rootAlbumId=-1&=1188===&article-detail=4696 (accessed on 25 August 2025).
Figure 1. Hourly zonal prices in the NORD market (€/MWh) during 2022–2024, with key policy and price-shock events annotated.
Energies 18 05446 g001
Figure 2. Daily weighted MSD prices (OFF and BID) in the NORD, 2022–2024. Vertical dashed lines indicate major policy and market events.
Energies 18 05446 g002
Figure 3. Share of production units by operator in the NORD (percentage of total); 2022–2024.
Energies 18 05446 g003
Figure 4. Share of production units by technology in the NORD (percentage of total); 2022–2024.
Energies 18 05446 g004
Figure 5. Total production vs. total income, according to (a) Active PUs in 2022, 2023, and 2024 (NORD), installed capacity vs. total income, (b) ACTIVE PUs in 2022, 2023, and 2024 (NORD); visualizing total production, income, and technology.
Energies 18 05446 g005
Figure 6. Structural drivers of market outcomes in 2022–2024 (NORD). (a) Installed capacity vs. total income. (b) EOH.
Energies 18 05446 g006
Figure 7. Choosing the number of clusters. (a): Gap statistic (points/line) with ±1 SE envelope (shaded). The 1-SE choice is K = 13 (orange dashed). (b): Bootstrap stability curve; the line shows the median Adjusted Rand Index across resamples.
Energies 18 05446 g007
Figure 8. Cluster 4; hourly MSD OFF offers: upward pricing shadows MGP plus technology-/operator-specific adders.
Energies 18 05446 g008
Figure 9. Cluster 4; hourly MSD BID offers: downward pricing shadows the NORD MGP in 2022, then reverts to rounded plateaus in 2023–2024.
Energies 18 05446 g009
Figure 10. A2A-Chivasso: regime-based BID, cost-plus OFF tightly coupled to the NORD MGP.
Energies 18 05446 g010
Figure 11. A2A-Sermide: twin-unit, operator-coherent menus; templated BID, competitive OFF.
Energies 18 05446 g011
Figure 12. Edison-Azotati: sparse BID, upward-only stance with persistent OFF premia over MGP.
Energies 18 05446 g012
Figure 13. ENEL-pumped storage: seasonally stepped OFF (water-value) and sparse BID; OFF follows MGP with a storage premium.
Energies 18 05446 g013
Figure 14. Accepted MSD volumes by service scope for Cluster 4 units (2022–2024). Panel (a): BID (downward) activations. Panel (b): OFF (upward) activations.
Energies 18 05446 g014aEnergies 18 05446 g014b
Figure 15. MSD offers from UP_VOGHERA_1 (2022–2024) with an MGP NORD overlay: (a) BID and (b) OFF.
Energies 18 05446 g015
Figure 16. Cluster 8; heatmap of MSD BID (a) and MSD OFF (b) acceptance rate by hour (2022–2024).
Energies 18 05446 g016
Figure 17. Cluster 8; (a) MSD BID accepted volumes and (b) MSD OFF accepted volumes by scope and unit (2022–2024).
Energies 18 05446 g017
Figure 18. Hourly MSD offers vs. NORD price (a) BID, (b) OFF; hydro-dominant units show muted BID and price-tracking OFF, 2022–2024.
Energies 18 05446 g018
Figure 19. Alperia reservoirs (Cluster 12): (a) BID, (b) OFF; hourly MSD BID/OFF offers vs. NORD price, 2022–2024.
Energies 18 05446 g019
Figure 20. UP_TAGLIAMENTO_1; (a) MSD BID, (b) MSD OFF; hourly offers versus the MGP NORD (2022–2024).
Energies 18 05446 g020
Figure 21. Valtellina/Adda chain (ENEL Produzione & IREN): (a) hourly MSD BID and (b) hourly MSD OFF offer prices (2022–2024) with MGP NORD overlay.
Energies 18 05446 g021
Figure 22. Cluster 12; heatmap of MSD BID (a) and MSD OFF (b) acceptance rate by hour (2022–2024).
Energies 18 05446 g022
Figure 23. Cluster 12; (a) MSD BID accepted volumes and (b) MSD OFF accepted volumes by scope and unit (2022–2024).
Energies 18 05446 g023
Table 1. Core market variables across the MGP, MI, and MSD.
VARIABLEDESCRIPTION
DATECalendar date of the bid (YYYYMMDD).
HOURHour of the bid (1 = 00:00–00:59).
UNIT_REFERENCEUnique code identifying the Production Unit (PU).
OPERATORCompany owning the PU, or “Bilateral” for private agreements (MGP only).
PURPOSEDirection of the bid: “OFF” (sell/inject energy) or “BID” (buy/decrease injection).
STATUSIndicates whether the bid was accepted (ACC) or rejected (REJ).
QUANTITYAmount of energy offered [MWh].
ADJ_QUANTITYQuantity corrected by the TSO for system security [MWh].
AWARDED_QTYFinal amount of energy remunerated after acceptance [MWh].
PRICEInitial bid price [€/MWh].
AWARDED_PRICERemunerated price for accepted bids [€/MWh].
GRID_POINT_IDIdentifier of the exchange point (Grid Supply Point).
Table 2. MSD SCOPE (purpose of offer).
SCOPEDEFINITIONOFF (UPWARD)BID (DOWNWARD)DEPENDENCY
ASMinimum/Shut-down blockStart from off and inject at minimum stable outputShut-down request: reduce injection to zeroBase block; GR steps can be stacked above it
GR1Step 1First increment while onlineFirst decrement while onlineFirst step; no prior GR needed
GR2Step 2Second incrementSecond decrementOnly if GR1 accepted
GR3Step 3Third incrementThird decrementOnly if GR2 accepted
GR4Step 4Fourth incrementFourth decrementOnly if GR3 accepted
Table 3. List of structural characteristics.
FEATURESDESCRIPTION
ENERGY SOURCEHydro dispatchable (Idroelettrica dispacciabile), Hydro pumped-storage (Idroelettrica da pompaggio), Thermal (Termoelettrica), Renewable (Rinnovabile)
TECHNOLOGYFor hydro plants—Bacino (reservoir), Serbatoio (artificial reservoir), Puro (pure run-of-river), Asta Idroelettrica (river stretch). For thermal—Ciclo combinato (combined cycle CCGT) or Tradizionale (steam). For renewable—Idrico fluente (run-of-river without reservoir), onshore vs. offshore wind.
INSTALLED CAPACITYNominal production capacity [MW].
GRID VOLTAGEVoltage level of the transmission connection [V].
Disclaimer/Publisher’s Note: The statements, opinions and data contained in all publications are solely those of the individual author(s) and contributor(s) and not of MDPI and/or the editor(s). MDPI and/or the editor(s) disclaim responsibility for any injury to people or property resulting from any ideas, methods, instructions or products referred to in the content.