Abstract
To reduce the renewable energy waste and carbon emissions predicted for the current expansion plan, this study proposes a hierarchical collaborative optimization model for the planning of generation and transmission expansion plan in cross-regional power systems considering energy storage and load transfer. In the upper layer, the upper limit of expansion is determined according to China’s current policy and expansion plan for the power system. This level completes the annual power expansion plan and provides scale data of power generation facilities and supporting infrastructures for the lower level. The lower layer is the operation level, which simulates the operation of the power system throughout the year. To find the defects of the current plan and provide an optimization scheme, the optimization model is used to analyze China’s power system in 2030. The utilization of renewable energy and power facilities is analyzed, along with the carbon emissions. An improved power expansion plan that comprehensively considers energy storage, transmission and load transfer for China’s carbon peak is proposed. The proposed scheme increases the utilization rate of renewable energy to 97.058%, reduces CO2 emissions by 224 million tons, and reduces the installed capacity of thermal power by about 18.686 million kilowatts, verifying the effectiveness of the scheme.
1. Introduction
The low-carbon transformation for the power sector is crucial to achieving China’s 2030 carbon peak and 2060 carbon neutrality targets, because the carbon emissions of the power sector account for more than 40% of China’s total carbon emissions [1].
However, China’s power system is facing dual challenges, including increases in power demand, due to rapid economic development and transformation of energy electrification, and the need for low-carbon transformation of the energy structure to help mitigate the climate change. Considering the significant differences in carbon emission intensity between various power generation technologies, increasing the proportion of renewable energy installed capacity is generally considered to be an effective method for the low-carbon transformation of power systems [2,3,4,5]. However, the rapid growth of renewable energy installed capacity has introduced new problems to power system planning. The uncertainty of renewable energy and the seasonal characteristics of output challenge the stable operation of power systems [6]. Additionally, radical renewable energy expansion has led to the problem of significant renewable energy waste [7]. Therefore, planning the expansion of the power system for efficiency, stability, low costs and reduced carbon emissions has become a research hotspot.
Our current goal is to achieve peak carbon emissions by 2030 by expanding the power system. This involves planning power plant siting and capacity allocation, optimizing designs for power transmission line, particularly long-distance transmission expansion schemes, and incorporating large-scale energy storage facilities to address the intermittency of renewable energy sources. These measures will ensure stable and continuous power supply, making capacity allocation planning and optimization integral components of power system design. Given that China’s renewable energy generation is currently concentrated in the northwest while industrial activity is primarily located in the eastern regions, exploring whether load shifting can reduce overall societal carbon emissions and yield greater economic benefits is an urgent issue requiring investigation.
The research on power system expansion planning initially focused on the use of different planning models to achieve low-carbon transformation by constructing appropriate power generation combinations. Ref. [8] investigated the low-carbon transformation of China’s power system through 2035 using a multi-stage mixed-integer linear programming power generation planning model. Ref. [9] established an integrated planning model composed of a multi-regression model and a linear planning model and given the combination of the renewable energy combined standards.
In terms of energy storage factors, ref. [10] proposed grid absorptive ability is critical for the development of renewable energy sources like solar and wind power generation. In addition, energy storage can effectively improve the utilization rate of wind and solar energy while reducing the cost of power generation [11]. The complementary configuration of energy storage is conducive to the integration of wind and solar energy resources and effectively reduces the abandonment of electricity and load loss [12]. Improvement in the deployment location of the energy storage system can improve power flow distribution, alleviate transmission congestion and delay the investment of new equipment [13]. Energy storage is essential to achieve complete decarbonization of the power system [14].
Furthermore, the low-carbon transformation of the power system faces great challenges due to regional differences. There is a large geographical difference between the power generation center and the load demand center [15]. Researchers have tried to solve this problem from two aspects: transmission expansion and load adjustment. Extensive inter-provincial power transmission can address the imbalance between energy resources and power loads of renewable energy in a cost-effective manner [16]. In addition, cross-regional transmission can promote renewable energy transactions [17,18], leading to significant environmental and health benefits [19], and effectively improving the consumption rate of renewable energy [20] and enhancing the peak shaving performance [21] in power generation systems with high renewable energy grid integration.
Under the constraints of carbon emission policies, the development of renewable energy will attract the transfer of energy-intensive industries. Refs. [22,23] carried out integrated modeling framework analysis, and found that the allocation of more carbon emission quotas to developing regions and the implementation of regionally carbon emission reduction constraint policies can achieve industrial space transfer. If the goal is for high energy consumption industries to reach their carbon peak by 2030, industrial transfer is also an important method [24].
Power capacity, energy storage configuration, transmission line planning, and load transfer all significantly impact the results of power system planning optimization. Ref. [25] have found that even if the power grid is rich in interconnection, the huge demand for battery energy storage still exists. Reasonable placement of energy storage equipment is also helpful to alleviate congestion problems during transmission [26].
However, the current research rarely takes multiple factors into account at the same time, and analysis of the influence of different load factors on power system expansion is lacking. The impact of regional load transfer on power systems remains unclear, and there is a lack of evaluation regarding the outcomes of current policy planning. This can lead to resource wastage and may even exacerbate imbalances in resource allocation [27,28]. Therefore, it is necessary to conduct research to evaluate the outcomes of power system expansion planning, analyze them, and optimize the results.
The main work of the article includes:
Section 2 introduces the establishment and structure of the model. A hierarchical collaborative power system expansion planning model was developed, incorporating long- and short-term energy storage, cross-regional power transmission, and regional load differences. The upper layer of the model represents the expansion phase, generating expansion planning results. The lower layer represents the operational phase within the year, simulating the system’s operation throughout the year and verifying the validity of the planning results.
Section 3 simulates the expansion plan and operational aspects of China’s power system in 2030. This chapter analyzes renewable energy waste, the utilization of energy storage, the utilization of transmission and regional differences and provides an optimization scheme.
Section 4 analyzes the effects of energy storage, power transmission and load transfer and provides an improved power expansion plan that comprehensively considers these factors. The proposed scheme increases the utilization rate of renewable energy, reduces carbon emissions and reduces the installed capacity of thermal power.
Section 5 presents the conclusions.
The main contributions of this study are as follows:
This paper establishes a multi-objective power system expansion planning and operation model that simultaneously considers long-term and short-term energy storage, cross-regional transmission, and load shifting. Beyond reducing expansion and operational costs, the model effectively lowers carbon emissions and minimizes renewable energy curtailment.
This model was applied to simulate China’s 2030 power system expansion plan under current policies. The proposed optimization scheme reduced carbon emissions by 5.61%, significantly decreased renewable energy curtailment, and lowered the required thermal power generation capacity.
This paper presents a framework for addressing multi-factor power system expansion planning. A baseline scenario is constructed based on existing policy plans, and its operational performance is analyzed. The impact of various factors on the power system is examined, and multiple factors are integrated into indicators for joint optimization. This model can be readily adapted to analyze power systems in other countries by modifying the constraints. Currently, the transition to clean power systems is a shared global challenge, with many nations having made corresponding commitments to achieve peak carbon emissions or carbon neutrality. Our research framework and model can assist other countries in evaluating and improving their power system expansion plans.
2. Model Structure and Scheme Design
China’s current power grid is divided into eight regional power grids: Northeast China, North China, Central China, East China, Southern Power Grid, Northwest Power Grid, Southwest Power Grid and Tibet. Among these power grids, the Tibet power grid is relatively independent. Compared with the other power grids, its load demand is almost negligible. Therefore, Tibet is not considered in this model.
In order to reflect the law of resource allocation in the model, provinces or regions with similar climates, industrial structures, natural resource characteristics, and load characteristics were selected and divided into eight regions. Table 1 presents the provinces/regions in each region.

Table 1.
Division of power grid regions.
To consider the power balance of the power system at different time scales, the hourly variation in power generation and load demand of the power system over 1 year was modeled. To reduce the burden of calculation and data collection without losing seasonal fluctuation characteristics, typical working days and rest days are selected from each month for simulation.
In order to analyze the influence of different influencing factors on the model results, a basic planning model was first established according to the existing power system development plans of China’s power grid and various regions. The planning model consists of two stages, as shown in Figure 1. The first stage involves annual investment planning and determining the total power generation for infrastructure expansion, considering power generation, transmission and energy storage within the system. The second stage is the operation scheduling stage of hourly simulation of power system operation over one year.
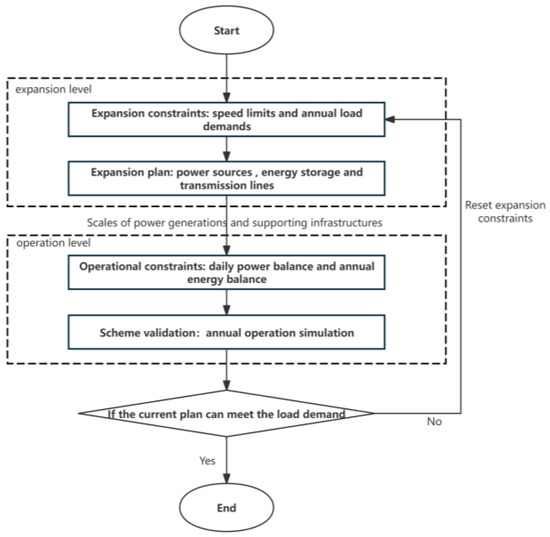
Figure 1.
Flow chart of planning model.
2.1. Objective Function
The objective function is to minimize the annual cost, including expansion cost, operation cost, green certificate cost, carbon transaction cost and renewable energy waste penalty cost.
Formula (1) represents the total cost of power system expansion and operation and maintenance, derived as the sum of Formulas (2) to (6). Formula (2) accounts for expansion investment costs for power generation facilities, energy storage devices, and transmission lines; Formula (3) covers power generation operation and maintenance costs; Formula (4) reflects green certificate transaction costs; Formula (5) encompasses renewable energy curtailment penalty costs; and Formula (6) represents carbon trading costs. Here is the annual expansion cost, including the annual expansion cost of thermal power, photovoltaic, wind power, hydropower, nuclear power, energy storage, and transmission. is the operation cost, including the fuel cost of thermal power generation and the maintenance and operation cost of the remaining power generation modes; is the cost of green certificates, is the price of a single green certificate, is the influence parameter of power prediction, is the number of green certificates required, and is the number of green certificates that can be generated based on the expected power generation planning. The current quota target power is determined by the completion of the historical quota. The number of green certificates required is determined according to the quota target power, and the number of green certificates generated by green electricity is calculated according to the power generation planning. is the penalty cost of renewable energy waste, and is the penalty factor. Because renewable energy participates in green certificate transactions, when renewable energy abandonment occurs, the corresponding green certificate transactions income needs to be deducted. In addition, regions that fail to fulfil sufficient renewable energy consumption responsibilities must also face corresponding penalties.
Because the carbon emissions of renewable energy power generation in the power generation process are negligible compared to those of thermal power generation, the model considers that carbon emissions only come from thermal power generation.
Formula (7) represents the carbon quota, formulated according to the ‘National Carbon Emission Trading Power Generation Industry Quota and Allocation Plan for 2023 and 2024’ [29]. The carbon quota is further reduced in accordance with the carbon quota change trend observed in the previous years’ plans. Here, is the carbon quota; is the unit power generation; is the power generation reference value of the unit; is the heat supply of the unit; is the heat supply reference value of the unit.
2.2. Expansion Planning Stage
2.2.1. Expansion Constraints
In this model, five power generation modes are considered: thermal, wind, photovoltaic, hydropower and nuclear power generation.
In this study, thermal power generation is considered a flexible power generation method, that can freely adjust the output. Wind, photovoltaic and hydropower generation are classified as renewable energy power generation methods, participating in green certificate transactions. Due to its special nature, nuclear power generation must produce electricity according to a fixed plan. Nuclear power generation was considered to operate with the same number of power generation hours in previous years.
Formula (8) represents the constraint on the construction rate of thermal power generation capacity. Formula (9) represents the constraint on the construction rate of short-term energy storage. Formula (10) represents the constraint on the construction rate of long-term energy storage. Formula (11) represents the constraint on the construction rate of transmission lines. Here is the number of regions, , , and are the installed capacities of power generation facilities, short-term energy storage and long-term energy storage in region , respectively; , , and are the minimum of construction limits for power generation facilities, short-term energy storage and long-term energy storage policy planning in the region, respectively; , , and are the maximum construction rate limits for power generation facilities, short-term energy storage, and long-term energy storage determined by the fastest construction rate and policy planning over the years. is the transmission line capacity between the i and j regions.
The power generation data, the installed capacity of each power generation technology, and the load demand of each region were sourced from the China Energy Statistics Yearbook [1], and the China Electricity Statistics Yearbook [30]. The parameters of related power generation technologies were sourced from the announcements by China Electricity Union and related research [31,32,33].
2.2.2. Annual Load Demand
According to the Annual Development Report of China’s Electric Power Construction Industry 2024, the terminal electrification rate of various industries in China is still in the rapid growth stage, so the rigid demand for load will still increase in the short term. Therefore, this study assumes that the load will increase at the 2024 rate of approximately 6.8% until 2026 and then increase at the average growth rate projected in China’s plan (approximately 4.5%) until 2030.
Formula (12) represents the annual power generation balance constraint. Formula (13) represents the total annual power generation. Here is the annual power generation for region ; is the annual load of region ; is the reserve capacity coefficient; represent the annual thermal power generation, annual photovoltaic power generation, annual wind power generation, annual hydropower, and annual nuclear power in region .
2.3. Operating Simulation Stage
2.3.1. Annual Load Balance
Formula (14) represents the intraday power balance constraint. Formula (15) represents the total intraday power generation. Here, is the hourly power generation in region ; are the hourly charging and discharging power of short-term energy storage in region ; represent the hourly charging and discharging power of long-term energy storage in region . represent the hourly power flowing in and out through the transmission in region i.
The typical daily load curves for each province were sourced from the State Council, relevant data announcements from the National Energy Administration, and local statistical offices.
2.3.2. Limit Constraint of Power Generation Output
The maximum power outputs of photovoltaic, wind, and hydropower generation are constrained by their seasonal and intraday output curves.
Formula (16) represents the output constraint for photovoltaic power generation. Formula (17) represents the output constraint for wind power generation. Formula (18) represents the output constraint for hydroelectric power generation. Here, represents the output parameter of photovoltaic power generation in a day, represents the output parameter of wind power in a day, and is the output parameter of hydropower in a day.
Formula (19) represents the output limit of thermal power. Formula (20) represents the fluctuation limit of output rise and fall.
Here and are the upper and lower limit coefficients of thermal power output. represents the limit coefficient of change in thermal power output.
2.3.3. Energy Storage Operation Constraints
The characteristics of wind energy and photovoltaic power generation show obvious seasonal and intraday changes, which are not consistent with the load fluctuations. Therefore, it is necessary to develop an energy storage system that promotes the consumption of renewable energy. In recent years, long-term energy storage technologies, such as pumped hydro storage (PHS), hydrogen-based energy, and compressed air energy storage have attracted increasing attention. By 2025, the combined installed and under-construction capacity of pumped storage is expected to reach more than 120 million kilowatt hours [34]. Considering that the model performs a one-year long operation simulation, it is necessary to distinguish long-term and short-term energy storage. Given that long-term energy storage technologies, except for pumped storage, have not been widely implemented in China [30], this study considered only pumped storage as the long-term energy storage method.
The ratio of the maximum discharge power of short-term and long-term energy storage to the energy storage capacity, hereinafter referred to as the power/capacity ratio, is also different for different energy storage methods. The power/capacity ratio of short-term battery energy storage is usually approximately 1/6. Owing to different equipment, the power/capacity ratio of the pumped storage is between 1/100 and 1/20 [31,32].
The intraday charge balance constraints for short-term energy storage are as follows:
Formula (21) describes the charging and discharging process. Formula (22) represents the battery’s charge balance. Formula (23) represents the charging and discharging power limitation. Formula (24) represents the capacity limitation. Here, is the short-term energy storage capacity of the region at time , is the charging and discharging efficiency of short-term energy storage, is the initial power ratio of short-term energy storage, and is the maximum charging and discharging power of the region’s short-term energy storage.
The annual balance constraints of long-term energy storage are as follows:
Formula (25) represents the charging and discharging process. Formula (26) represents the conservation of energy state at the beginning and end of the year for long-term energy storage. Formula (27) represents the charging and discharging power limit. Formula (28) represents the capacity limitation, where is the long-term energy storage capacity at hour time in region , is the charging and discharging efficiency of long-term energy storage, is the initial power ratio of long-term energy storage, and is the maximum charging and discharging power in the -region’s long-term energy storage.
2.3.4. Transmission Constraints
Because the number of international power transmissions is relatively low compared with the domestic power demand, they are disregarded.
At present, China’s cross-provincial transmission projects under construction are mainly 800 KV lines. Therefore, the model sets the transmission line voltage to 800 KV and considers only DC power flow.
We assumed that all generators and loads are located at the center of each region. Because each region is regarded as a bus in the power flow model, we considered only the connection line between two adjacent regions. We assumed that each connection line terminates at the centers of the two regions it connects. Assuming that all the connection lines connecting the same two nodes have the same voltage, resistance and capacity, the loss of cross-regional power transmission is only positively correlated with the transmission distance.
The loss data of inter-area transmission comes from the line loss rate of transmission lines in the same interval and the line loss rate of each regional power grid.
Formula (29) represents the node injection power. Formula (30) represents the node power balance. Formula (31) represents the transmission line capacity constraint. Here, is the node injection power of node at time , denotes that node is the adjacent node of node and is the mutual susceptance between node and . is the voltage phase difference between node and node ; is the branch reactance, is the power injected by node to node at time , and and are the upper and lower limits of the power flow allowed on the line.
2.3.5. Rotary Standby Constraint
As more renewable energy power generation is incorporated into the grid, the grid must reserve a certain amount of spinning reserve capacity. Thermal power generation and energy storage systems can jointly provide the spinning reserve capacity of the system.
Formula (32) represents the rotating reserve capacity, and Formula (33) represents the rotating reserve capacity constraint.
3. Analysis of Basic Scenario
This study first analyzes the 2030 base scenario from the perspective of carbon emissions. According to the commitment made at the 2020 Paris Climate Summit, China’s carbon dioxide emissions per unit of GDP by 2030 will be 65% lower than those in 2005. Based on the 14th Five-Year Plan and China’s 2025 government work report, the GDP growth rate is set at 5%, and the proportion of carbon emissions from the power industry remains at its current value. Under these assumptions, the allowed carbon emissions from the power industry will be 5.612 109 tCO2 by 2030. In this study, the total carbon emissions in 2030 under the base scenario are 5.346 109 tCO2, which is lower than the index requirement. This indicates that the power industry can achieve its carbon peak under the base scenario.
3.1. Utilization of Renewable Energy
Figure 2 shows the peak period of renewable energy waste is October, November, and March, the unique factor of this period is the heating demand, which keeps the thermal power generation at a certain level. However, compared with the same heating demand in December, January, and February, the renewable energy abandonment rate is higher during these months.
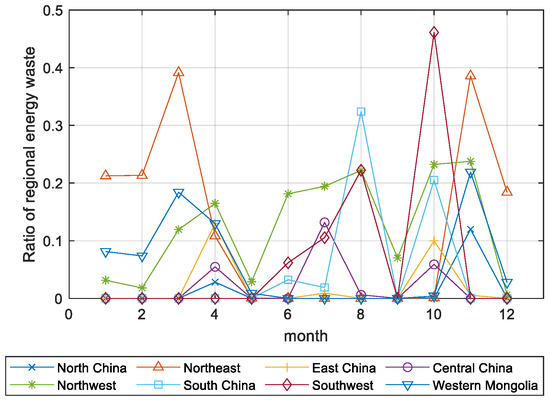
Figure 2.
Ratio of regional renewable energy waste.
To analyze the reasons for this, the renewable energy abandonment rate and output curves of the Northwest Power Grid, which as Figure 3 shows has the highest renewable energy abandonment, are compared. Figure 4 shows that the renewable energy output in October, November, and March was higher than that in December, January, and February. In addition, Figure 5 shows that the loads in December and January were also higher than those in October and November in most regions. Therefore, the combined effect of increased power generation and lower load demand leads to increased renewable energy waste in October, November, and March.
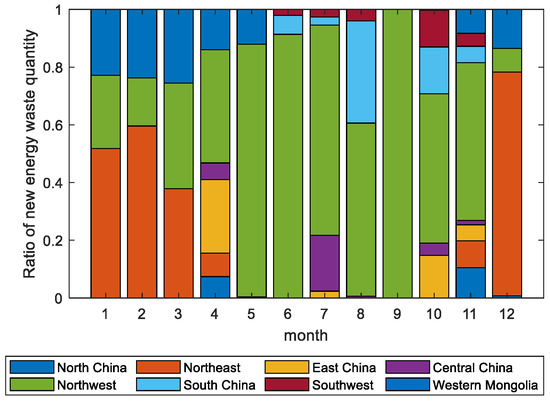
Figure 3.
Ratio of each region’s renewable energy waste.
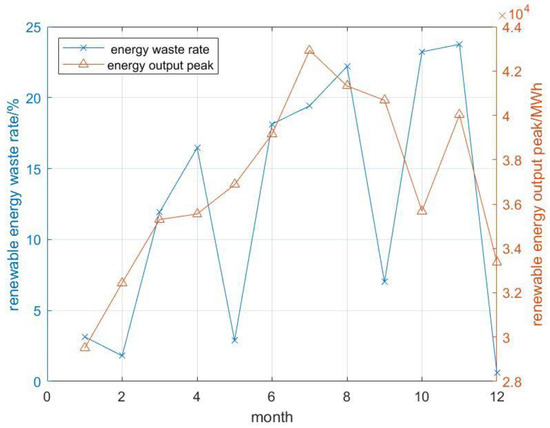
Figure 4.
Renewable energy waste rate and output in each month.
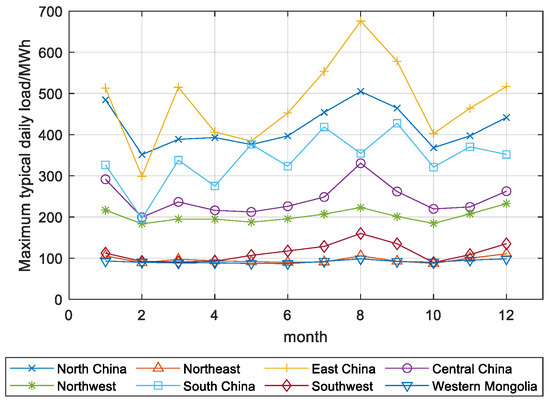
Figure 5.
Maximum typical daily load in each month.
Regarding renewable energy waste in summer (June, July, and August), as shown in Figure 3, the main sources of renewable energy abandonment in June and August are the Northwest Power Grid and the Southwest Power Grid. Renewable energy abandonment in July mainly comes from the Northwest Power Grid and the Central China Power Grid. Therefore, the output curve of renewable energy power generation, typical daily power load, transmission capacity of the transmission channels for the corresponding month, and peak thermal power generation in these three regions are analyzed.
Figure 6 shows that in June and August, the peak value of thermal power generation in the Northwest Power Grid and the Southwest Power Grid was less than 10% of the total installed capacity, indicating that renewable energy power generation alone can meet the demand for electricity in these two regions. Figure 7 shows that, the ratio of external electricity to transmission capacity in these two regions also exceeded 80% during peak periods. In July, the Northwest Power Grid experienced conditions similar to those in June and August, while the Central China Power Grid showed a different situation. Figure 8 shows that, in July, the load curve and renewable energy output curve of the Central China Power Grid shower a higher peak thermal power generation and lower utilization rate of transmission channels. This indicates that the renewable energy waste in the Central China Power Grid is because the peak renewable energy output does not completely coincide with the peak load.
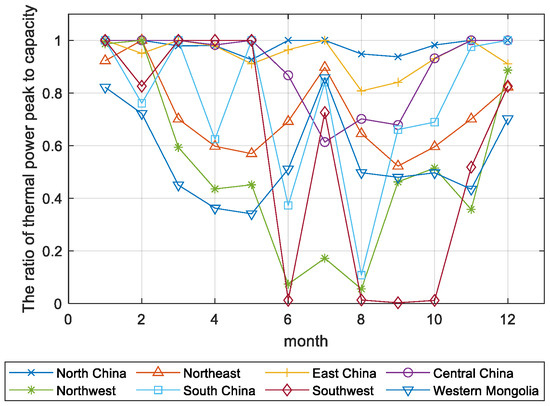
Figure 6.
Ratios of peak thermal power output to installed capacity.
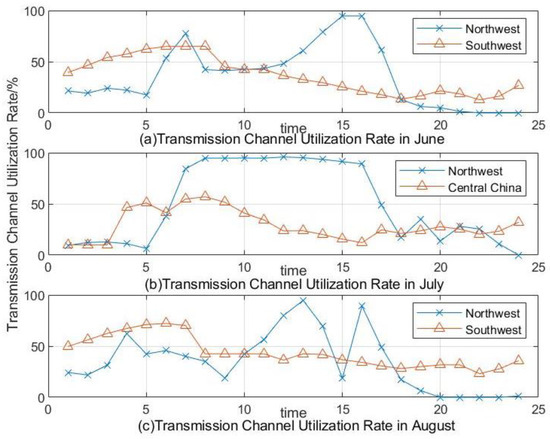
Figure 7.
Transmission channel utilization rates in June, July, and August.
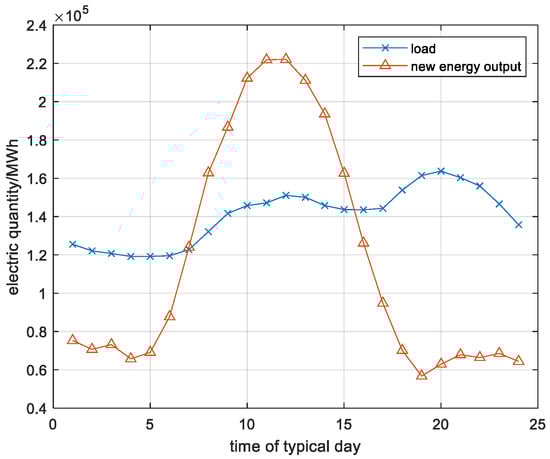
Figure 8.
The power load and renewable energy output curve of Central China in July.
It can be concluded that, because of the higher renewable energy output in summer, the renewable energy bases produce a large amount of renewable energy, but the local electricity demands are relatively small, and the external transmission channels are insufficient, resulting in renewable energy waste.
3.2. Utilization of Energy Storage
Figure 9 shows that, in winter, the ratio of maximum energy stored to the installed capacity of the energy storage capacity exceeds 80% in all regions. In addition to the peak shaving effect, long-term energy storage helps store excess power during the months with more renewable energy waste.
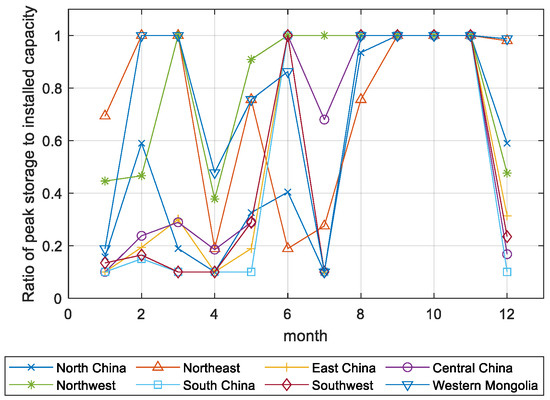
Figure 9.
Ratios of maximum energy stored to installed capacity.
3.3. Utilization of Transmission Lines
The transmission lines are adequately utilized in the model. Figure 10 shows the amount of transmission between regions. Most transmission lines operate for over 5000 h annually, and all of them reach their maximum transmission capacity when demand is high. Therefore, it is necessary to expand the transmission lines to meet the demand for inter-provincial power dispatching.
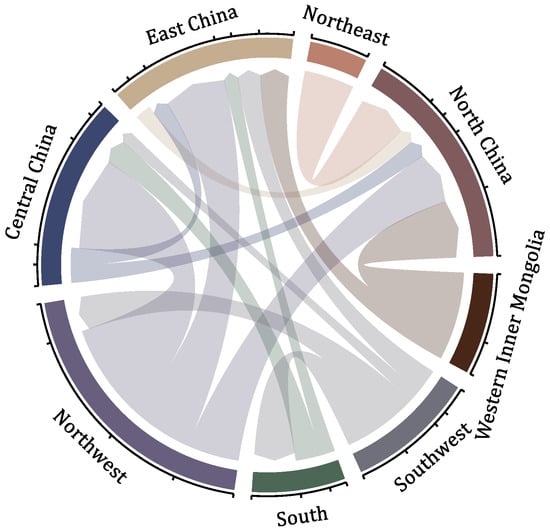
Figure 10.
The transmission capacity between regions.
3.4. Regional Differences
There are obvious regional differences in the amount of renewable energy waste: areas with more renewable energy power generation and lower load have significantly more renewable energy waste. In the Northwest Power Grid area, which has the largest amount of waste, the highest daily renewable energy waste rate can reach 20%. In May, June, and September, when the average renewable energy waste rate in the country is low, almost all renewable energy waste in the country is concentrated in the Northwest Power Grid. Therefore, load transfer is necessary to improve regional differences.
4. Discussion
After completing the simulation of the basic scenario, this study optimized the scheme from three perspectives: energy storage, transmission, and load.
4.1. Energy Storage Adjustment Scenario
To reflect the different effects of short-term and long-term energy storage on the model results, only short-term energy storage expansion and long-term energy storage expansion were carried out at the same expansion cost. The results are as follows:
Figure 11 shows that with increased energy storage, renewable energy waste, carbon emissions, and annual operation and maintenance costs are reduced. However, due to the currently high cost of energy storage construction, the carbon price, green certificate price, and provincial renewable energy consumption penalties in accordance with the current policy are not enough to offset the cost of energy storage expansion. Additionally, since not every month experiences significant renewable energy waste, the total annual cost remains higher relative to the basic scenario.
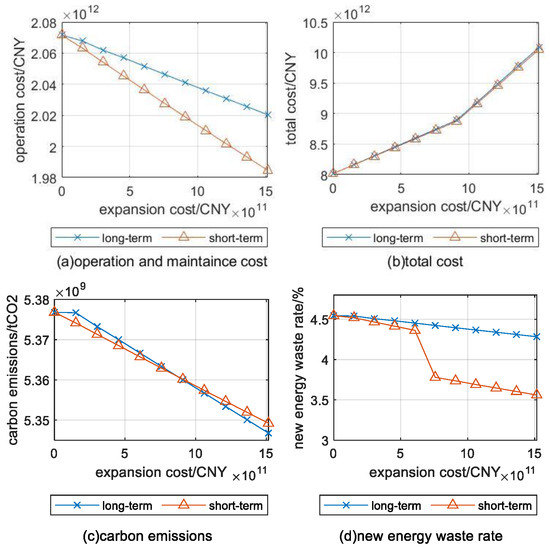
Figure 11.
Results of long-term and short-term energy storage expansion.
In terms of carbon emissions, when the expansion scale is small, long-term energy storage performs worse than short-term energy storage. When the scale is larger, the opposite effect occurs. In terms of operation and maintenance costs and reduction of renewable energy waste, short-term energy storage is better than long-term energy storage at the same cost. This is because short-term energy storage needs to maintain intraday charge conservation. In some cases, renewable power alone cannot satisfy charge conservation, and additional thermal power generation is needed. Taking the Northwest Power Grid, which has the largest energy storage expansion, as an example, the thermal power output at 21 o’clock on a typical spring day changes with adjustments, as shown in Figure 12.
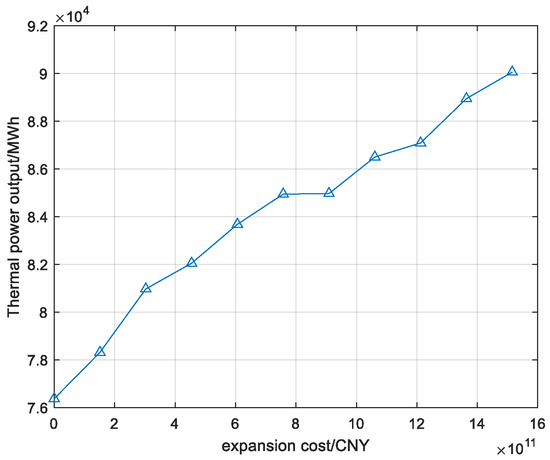
Figure 12.
Thermal power output of a typical day at 21 o’clock in spring.
Due to the low energy density of a pumped storage power station (0.3 kWh/m3), the role of long-term energy storage in the model is mainly reflected in the monthly and quarterly scheduling of surplus renewable energy, which can only play an auxiliary role in peak shaving. Its effectiveness in reducing operation and maintenance costs and renewable energy waste is significantly worse than that of short-term energy storage.
At present, the technology development of long-term energy storage is still in progress. Reduced costs, effective solutions in the dry season, and an improved role in peak shaving are expected for long-term energy storage. In the basic scenario of the model, the cost and power/capacity ratio of long-term energy storage were adjusted. It was found that when the efficiency remains at 75%, reducing the cost to 60%, and increasing the power/capacity ratio to about 1/10 allows long-term energy storage can replace short-term energy storage at the same expansion cost. It can also reduce renewable energy waste by about 8%, as well as operation and maintenance costs and carbon emissions by about 3% throughout the year.
4.2. Transmission Adjustment Scenario
In all regions, the Northwest Power Grid, the Northeast Power Grid, and the Western Inner Mongolia Power Grid are the main sources of renewable energy waste. The main strategy is to increase the transmission channels from these three areas to areas with a high utilization rate of renewable energy. The scale of the channel expansion is determined by the peak power abandonment in the three areas.
Figure 13 shows that with transmission expansion, the total operation and maintenance costs, carbon emissions, and annual renewable energy waste rates decrease. However, the reduction rates gradually slow down, and the annual renewable energy waste rate stops decreasing after reaching a certain level. Meanwhile, the total cost continues to increase gradually.
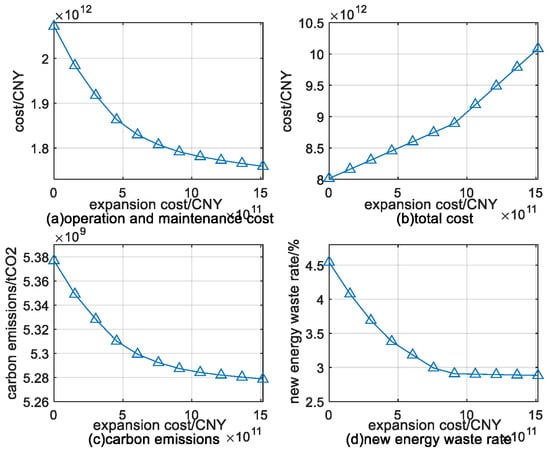
Figure 13.
Results of transmission expansion.
This is because during months when the total power generation of renewable energy is high or the scale of thermal power generation is high due to heating demand, renewable energy waste is common in many regions. Although transmission expansion alone can meet peak demand, the effectiveness of reducing renewable energy waste will gradually decrease. Figure 14 shows that, in November, there was a widespread phenomenon of renewable energy waste in various regions. The amount of renewable energy waste on a typical day decreased briefly with increased expansion but then remained almost unchanged.
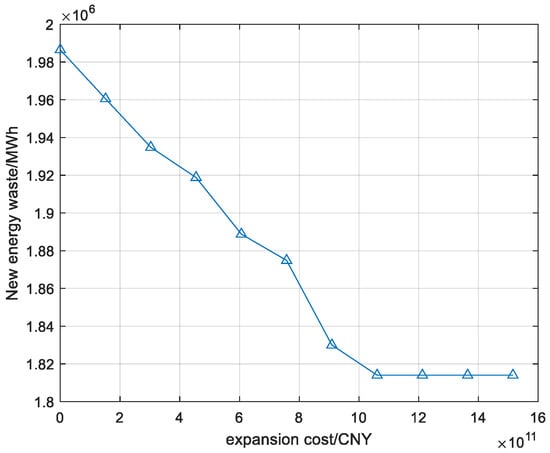
Figure 14.
Renewable energy waste in November.
However, Figure 15 shows that, in months with less renewable energy waste or more concentrated renewable energy waste, such as January, the amount of renewable energy waste becomes negligible after several rounds of expansion. Such months no longer contribute to the overall change with an increase in expansion costs.
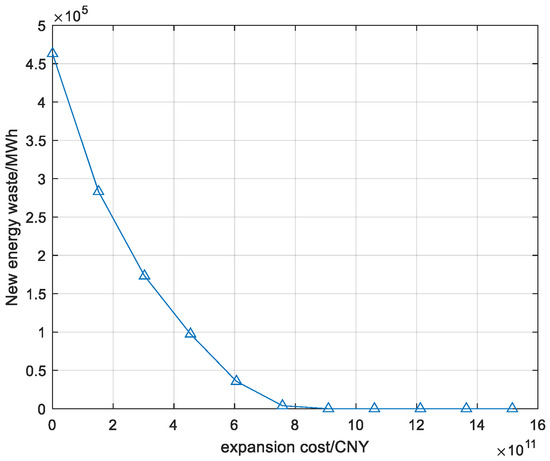
Figure 15.
Renewable energy waste in January.
4.3. Load Adjustment Scenario
Based on the principle of proximity and considering local development, the load from certain high energy-consuming industries (non-ferrous metal smelting and ferrous metal smelting) is transferred to the Northwest Power Grid, which has a high renewable energy waste rate and has renewable energy waste in most months. The proportion of load transfer is determined according to the proportion of waste.
The cost of load transfer and its economic benefits are not within the scope of this study; only its impact on system operating costs is considered.
Figure 16 shows that, with the increase in load transfer, the total operation and maintenance costs and the renewable energy waste gradually decrease. The carbon emission increases first and then decreases. When the transfer amount reaches 90 billion kilowatt hours, the operation and maintenance costs and the renewable energy waste rate decrease at the highest speed. The carbon emission reduction rate is also the highest. The amount of load transferred is also moderate, making it reasonable for actual implementation. Therefore, a load transfer amount of 90 billion kilowatt hours was selected as the load state for the model’s comprehensive optimization.
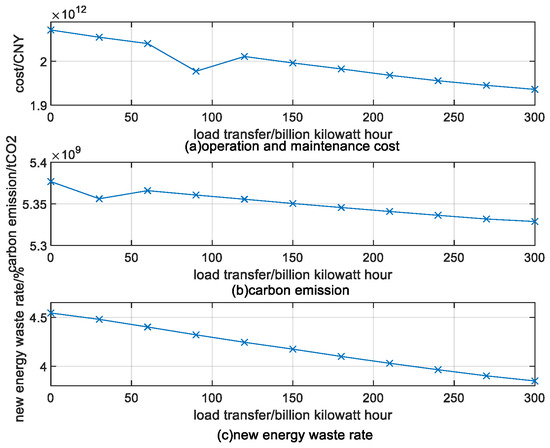
Figure 16.
Results of load adjustment.
4.4. Comprehensive Factor Optimization
By analyzing the benefits of energy storage and transmission, although the comprehensive effect of transmission increase in the whole year is better than that of increasing energy storage, but in some months, the situation is reverse. This is because the difference between renewable energy power generation and load demand in these months is significant, and renewable energy is wasted in most areas. Only increasing transmission is not enough to significantly improve the utilization rate of renewable energy, and increasing transmission also increases the loss of transmission. In addition, the construction of cross-regional transmission lines is far more complex than the construction of energy storage in a single area. However, relying solely on energy storage improvement schemes results in poor benefits and increased carbon emissions. Therefore, it is necessary to comprehensively consider various factors to optimize the scheme.
Under the optimal scenario of load adjustment, the overall optimization of the system is carried out by considering the two methods of energy storage expansion and transmission expansion, and the total cost, maintenance cost, carbon emissions and renewable energy abandonment rate. Figure 17 follows the results of optimization.
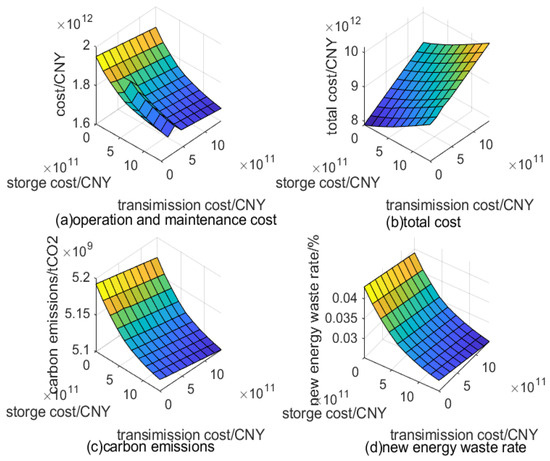
Figure 17.
Results of collaborative optimization.
To determine the optimal results, the total cost, annual carbon emissions, and annual renewable energy waste rate were selected as evaluation indicators. According to the current policy and studies [11,35,36], the order of importance of the three indicators is as follows: annual carbon emissions > annual renewable energy waste rate > total cost. After determining the importance ranking, the AHP analytic hierarchy process was used to determine the weight, and the data of the three indicators were standardized for analysis to obtain the optimal solution.
The renewable energy waste rate in the country during each month, following optimization, is shown in the following figure. Figure 18 shows that, after optimization, except for August (7.77%) and November (9.52%), the renewable energy waste rates in the remaining months are below 5%.
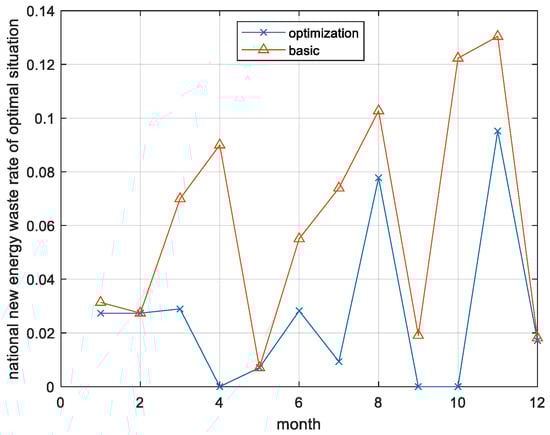
Figure 18.
Comparison of renewable energy waste rate.
Figure 19 shows the amount of renewable energy waste and the rate of renewable energy waste in each region in August and November.
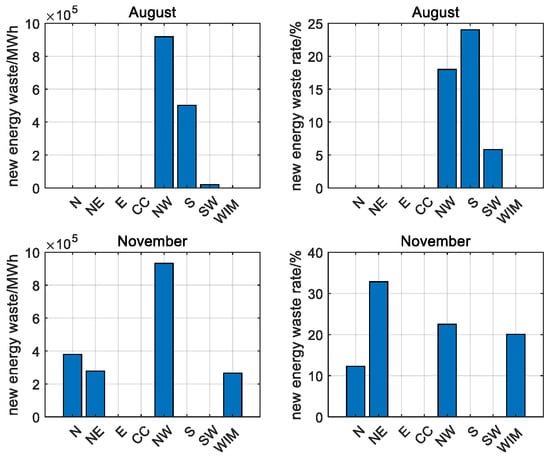
Figure 19.
Renewable energy waste in August and November.
At the same cost level, the synergistic expansion of energy storage and transmission yields significantly better results than the expansion of either component alone. Among the regions, the Northwest Power Grid has the highest amount of renewable energy waste.
The curtailment of renewable energy in August primarily occurred in the Northwest Grid and Southern Grid. This was due to the mismatch between the peak output of local renewable energy sources and local electricity demand during the summer, highlighting significant regional differences. However, due to factors such as cost and current technical limitations, green certificate prices, the benefits of further promoting consumption in comprehensive benefits are not high.
Renewable energy curtailment in November was concentrated in northern China, excluding the Northwest Grid. This occurred because electric heating is widely used in northern China, thermal power plants maintain high output levels throughout November, and the region experiences abundant wind resources coupled with insufficient pumped-storage capacity, making it difficult to absorb excess renewable power generation. This leads to widespread curtailment of renewable energy.
The ratio of peak thermal power generation to the installed capacity of the Northwest Power Grid, Southwest Power Grid, and West Inner Mongolia Power Grid is lower than 95% for the whole year, so the installed capacity of thermal power generation in these three regions can be reduced to further reduce the expansion cost and promote the transformation of the power structure.
After optimization and adjustment, the overall situation in 2030 is predicted in Table 2.
Table 2.
The comparison of the basic scenario and the optimization results.
After optimization according to this model, the proportion of carbon emissions in the power generation industry is 36.5%, and the consumption rate of renewable energy is 97.058%, indicating that the method effectively reduces carbon emissions and improves the consumption rate of renewable energy.
5. Conclusions
This study presents a hierarchical collaborative optimization model for the generation and transmission expansion planning of cross-regional power systems considering energy storage and load transfer. The model was applied to the 2030 power system carbon peak expansion plan, and through analysis of various influencing factors of power system expansion, a reasonable optimization method is provided. The results of this study can be summarized as follows:
The influences of energy storage, trans-regional transmission, and load transfer on power system operation were analyzed. This study found that energy storage helps to alleviate the uneven distribution of renewable energy over time and is more effective in the context of widespread renewable energy waste in various regions. However, excessive energy storage expansion may lead to additional demand for thermal power generation. The expansion of transmission and load transfer helps to alleviate the spatial mismatch between renewable energy output and load demand and is more effective in the case of concentrated renewable energy waste.
This study compared the different effects of long-term energy storage and short-term energy storage on the power system. If long-term energy storage efficiency is maintained at 75%, the cost is reduced to 65% of the present price and the power/capacity ratio is increased to about 1/10. Long-term energy storage can replace the role of short-term energy storage at the same expansion cost. It can also reduce renewable energy waste by about 5%, as well as operation and maintenance costs and carbon emissions by about 2% throughout the year.
A power system expansion planning method considering energy storage, cross-regional transmission, and load transfer is proposed. Compared with the method considering a single factor, the proposed method is more effective in reducing carbon emissions and improving renewable energy consumption. The results of this study show that the proposed optimal scheme reduces carbon emissions by 5.61% compared with the base scenario, reduces the amount of renewable energy waste by billions of kilowatt hours, and reduces the installed capacity of thermal power by about 18.686 million kW.
Author Contributions
Conceptualization, Methodology, Writing—original draft, Z.Z.; Supervision, Writing—reviewing and editing, C.L.; Software, Z.W.; Investigation, T.Z.; Data curation, X.C. All authors have read and agreed to the published version of the manuscript.
Funding
This research was funded by the National Natural Science Foundation (NNSF) of China (Grant 51307074).
Data Availability Statement
The data presented in this study are available on request from the corresponding author due to the data are part of an ongoing study.
Conflicts of Interest
The authors declare no conflicts of interest.
Nomenclature
The following abbreviations are used in this manuscript:
| Acronyms | |
| WIM | West Inner Mongolia |
| Indices | |
| Power grid regions | |
| node is the adjacent node of node | |
| Variables | |
| Total cost | |
| Annual expansion cost | |
| Operation and maintenance cost | |
| Cost of green certificates | |
| The number of green certificates required | |
| Number of green certificates | |
| Penalty cost of renewable energy waste | |
| Carbon quota | |
| Carbon transaction cost | |
| Carbon emission of thermal power generation | |
| Power generating capacity | |
| Heat supply of the unit | |
| Installed capacity of power generation facilities | |
| Installed capacity of short-term/long-term energy storage | |
| Transmission line capacity between and regions | |
| Annual power generation | |
| Annual load | |
| Annual thermal power generation power | |
| Annual photovoltaic power generation power | |
| Annual wind power generation power | |
| initial power ratio of the short-term/long-term energy storage | |
| Charging/discharging power of short-term energy storage | |
| Charging/discharging power of long-term energy storage | |
| Power flowing in/out through the transmission | |
| Short-term energy storage capacity | |
| Maximum charging and discharging power of short-term/long-term energy storage | |
| Node injection power of node at time | |
| Voltage phase difference between node and node | |
| Power injected by node i to node j | |
| Upper and lower limits of power flow | |
| Branch reactance | |
| Hourly power generation in region | |
| Annual hydropower power | |
| Annual nuclear power | |
| Parameters | |
| price of a single green certificate | |
| influence parameter of power prediction | |
| penalty factor | |
| carbon transaction price | |
| power generation reference value | |
| heat supply reference value | |
| Lower/upper limit of the construction speed | |
| output parameter of photovoltaic power | |
| output parameter of wind power | |
| upper/lower limit coefficients of thermal power output | |
| limit coefficient of thermal power output change | |
| charging and discharging efficiency of the short-term/long-term energy storage | |
References
- Department of Energy Statistics, National Bureau of Statistics. China Energy Statistics Yearbook (2023); China Statistical Publishing House: Beijing, China, 2024.
- He, L.; Li, X.; Cui, Q.; Guan, B.; Li, M.; Chen, H. Decarbonization pathways to subregional carbon neutrality in China based on the top-down multi-regional CGE model: A study of Guangxi. Energy 2024, 294, 130846. [Google Scholar] [CrossRef]
- Kabirifar, M.; Fotuhi-Firuzabad, M.; Moeini-Aghtaie, M.; Pourghaderi, N.; Dehghanian, P. A Bi-Level Framework for Expansion Planning in Active Power Distribution Networks. IEEE Trans. Power Syst. 2022, 37, 2639–2654. [Google Scholar] [CrossRef]
- Xie, B.-C.; Wang, Q.-Y.; Tang, Q.; Zhang, S. What is China’s efficient power generation portfolio under carbon neutrality target? An empirical analysis considering flexibility and system cost. J. Environ. Manag. 2024, 355, 120311. [Google Scholar] [CrossRef] [PubMed]
- Wei, Z.; Yang, L.; Chen, S.; Ma, Z.; Zang, H.; Fei, Y. A multi-stage planning model for transitioning to low-carbon integrated electric power and natural gas systems. Energy 2022, 254, 124361. [Google Scholar] [CrossRef]
- Zhang, N.; Jiang, H.; Du, E.; Zhuo, Z.; Wang, P.; Wang, Z.; Zhang, Y. An Efficient Power System Planning Model Considering Year-Round Hourly Operation Simulation. IEEE Trans. Power Syst. 2022, 37, 4925–4935. [Google Scholar] [CrossRef]
- Dhaliwal, N.K.; Bouffard, F.; O’Malley, M.J. A Fast Flexibility-Driven Generation Portfolio Planning Method for Sustainable Power Systems. IEEE Trans. Sustain. Energy 2021, 12, 368–377. [Google Scholar] [CrossRef]
- Yuan, K.; Zhang, T.; Xie, X.; Du, S.; Xue, X.; Abdul-Manan, A.F.N.; Huang, Z. Exploration of low-cost green transition opportunities for China’s power system under dual carbon goals. J. Clean. Prod. 2023, 414, 137590. [Google Scholar] [CrossRef]
- Fan, J.-L.; Wang, J.-X.; Hu, J.-W.; Wang, Y.; Zhang, X. Optimization of China’s provincial renewable energy installation plan for the 13th five-year plan based on renewable portfolio standards. Appl. Energy 2019, 254, 113757. [Google Scholar] [CrossRef]
- Hernández-Romero, I.M.; Barajas-Villarruel, L.R.; Flores-Tlacuahuac, A.; Fuentes-Cortes, L.F.; Rico-Ramirez, V. Strategic planning for sustainable electric system operations: Integrating renewables and energy storage. Comput. Chem. Eng. 2023, 177, 108312. [Google Scholar] [CrossRef]
- Xie, B.-C.; Zhang, R.-Y.; Chen, X.-P. China’s optimal development pathway of intermittent renewable power towards carbon neutrality. J. Clean. Prod. 2023, 406, 136903. [Google Scholar] [CrossRef]
- He, Z.; Liu, C.; Wang, Y.; Wang, X.; Man, Y. Optimal operation of wind-solar-thermal collaborative power system considering carbon trading and energy storage. Appl. Energy 2023, 352, 121993. [Google Scholar] [CrossRef]
- Tian, Y.; Chang, J.; Wang, Y.; Wang, X.; Meng, X.; Guo, A. The capacity planning method for a hydro-wind-PV-battery complementary system considering the characteristics of multi-energy integration into power grid. J. Clean. Prod. 2024, 446, 141292. [Google Scholar] [CrossRef]
- Wu, Y.; Fang, J.; Ai, X.; Xue, X.; Cui, S.; Chen, X.; Wen, J. Robust co-planning of AC/DC transmission network and energy storage considering uncertainty of renewable energy. Appl. Energy 2023, 339, 120933. [Google Scholar] [CrossRef]
- Auguadra, M.; Ribó-Pérez, D.; Gómez-Navarro, T. Planning the deployment of energy storage systems to integrate high shares of renewables: The Spain case study. Energy 2023, 264, 126275. [Google Scholar] [CrossRef]
- Wu, F.; Huang, N.; Liu, G.; Niu, L.; Qiao, Z. Pathway optimization of China’s carbon emission reduction and its provincial allocation under temperature control threshold. J. Environ. Manag. 2020, 271, 111034. [Google Scholar] [CrossRef]
- Zhou, X.; Zhou, D.; Ding, H.; Zhao, S.; Wang, Q. Low-carbon transition of China’s provincial power sector under renewable portfolio standards and carbon cap. Energy 2023, 283, 129135. [Google Scholar] [CrossRef]
- Tan, X.; Lin, S.; Liu, Y.-L.; Xie, B.-C. Has the inter-regional transmission grid promoted clean power development? A quantitative assessment on China’s electricity sector. J. Clean. Prod. 2020, 269, 122370. [Google Scholar] [CrossRef]
- Guo, Z.; Ma, L.; Liu, P.; Jones, I.; Li, Z. A multi-regional modelling and optimization approach to China’s power generation and transmission planning. Energy 2016, 116, 1348–1359. [Google Scholar] [CrossRef]
- Li, Y.; Yi, B.-W.; Wang, Y. Can ultra-high voltage power transmission bring environmental and health benefits? An assessment in China. J. Clean. Prod. 2020, 276, 124296. [Google Scholar] [CrossRef]
- Deng, X.; Lv, T.; Xu, J.; Hou, X.; Liu, F. Assessing the integration effect of inter-regional transmission on variable power generation under renewable energy consumption policy in China. Energy Policy 2022, 170, 113219. [Google Scholar] [CrossRef]
- Wang, J.; Zhao, Z.; Zhou, J.; Cheng, C.; Su, H. Developing operating rules for a hydro–wind–solar hybrid system considering peak-shaving demands. Appl. Energy 2024, 360, 122762. [Google Scholar] [CrossRef]
- Zhang, Q.; Lin, B. What does clean energy attract? Evidence from the transfer structure of energy-intensive projects in China. Renew. Energy 2024, 228, 120642. [Google Scholar] [CrossRef]
- Qi, Y.; Ma, X.; Xie, Y.; Wang, W.; Wang, J. Uncovering the key mechanisms of differentiated carbon neutrality policy on cross-regional transfer of high-carbon industries in China. J. Clean. Prod. 2023, 418, 137918. [Google Scholar] [CrossRef]
- Cao, Y.; Guo, L.; Qu, Y.; Wang, L. Possibility and pathways of China’s nonferrous metals industry to achieve its carbon peak target before 2030: A new integrated dynamic forecasting model. Energy 2024, 306, 132386. [Google Scholar] [CrossRef]
- Li, S.; Zhang, T.; Niu, L.; Yue, Q. Analysis of the development scenarios and greenhouse gas (GHG) emissions in China’s aluminum industry till 2030. J. Clean. Prod. 2021, 290, 125859. [Google Scholar] [CrossRef]
- Liu, H.; Brown, T.; Andresen, G.B.; Schlachtberger, D.P.; Greiner, M. The role of hydro power, storage and transmission in the decarbonization of the Chinese power system. Appl. Energy 2019, 239, 1308–1321. [Google Scholar] [CrossRef]
- Feng, P.; Zeng, P.; Tang, Z.; Zhou, X.; Zhu, Y. A distributionally collaborated planning of energy storage, transmission and distribution systems considering long- and short-term energy storage characteristics. J. Energy Storage 2025, 120, 116396. [Google Scholar] [CrossRef]
- Ministry of Ecology and Environment of the People ‘s Republic of China. The Total Quota and Allocation Scheme of the National Carbon Emission Trading Power Generation Industry in 2024. Available online: https://www.mee.gov.cn/xxgk2018/xxgk/xxgk03/202410/t20241021_1089750.html (accessed on 23 November 2024).
- Editorial Committee of China Electric Power Yearbook. China Electric Power Statistics Yearbook (2023); China Electric Power Press: Tengzhou, China, 2024. [Google Scholar]
- Mallapragada, D.S.; Sepulveda, N.A.; Jenkins, J.D. Long-run system value of battery energy storage in future grids with increasing wind and solar generation. Appl. Energy 2020, 275, 115390. [Google Scholar] [CrossRef]
- Mostafa, M.H.; Abdel Aleem, S.H.E.; Ali, S.G.; Ali, Z.M.; Abdelaziz, A.Y. Techno-economic assessment of energy storage systems using annualized life cycle cost of storage (LCCOS) and levelized cost of energy (LCOE) metrics. J. Energy Storage 2020, 29, 101345. [Google Scholar] [CrossRef]
- Chen, X.; Wang, Y.; Wu, Z.; Zhou, M.; Yuan, B. Capacity expansion model for multi-temporal energy storage in renewable energy base considering various transmission utilization rates. J. Energy Storage 2024, 98, 113145. [Google Scholar] [CrossRef]
- National Energy Administration. White Paper on China’s Energy Transformation. Available online: https://www.nea.gov.cn/2024-08/29/c_1310785406.htm (accessed on 23 November 2024).
- Ren, J.; Zhang, Q.; Chen, W. China’s provincial power decarbonization transition in a carbon neutral vision. Energy 2024, 310, 133211. [Google Scholar] [CrossRef]
- Ma, W.; Xiao, C.; Ahmed, S.F.; Feng, T.; Liu, G. Multi-objective carbon neutrality optimization and G1-EW-TOPSIS assessment for renewable energy transition. J. Clean. Prod. 2023, 415, 137808. [Google Scholar] [CrossRef]
Disclaimer/Publisher’s Note: The statements, opinions and data contained in all publications are solely those of the individual author(s) and contributor(s) and not of MDPI and/or the editor(s). MDPI and/or the editor(s) disclaim responsibility for any injury to people or property resulting from any ideas, methods, instructions or products referred to in the content. |
© 2025 by the authors. Licensee MDPI, Basel, Switzerland. This article is an open access article distributed under the terms and conditions of the Creative Commons Attribution (CC BY) license (https://creativecommons.org/licenses/by/4.0/).