Article

Research on Wellhead Uplift Prediction for Underground Gas Storage Wells

1
State Key Laboratory of Oil and Gas Equipment, Tubular Goods Research Institute, CNPC, Xi’an 710077, China
2
Tianjin Gas Storage Branch, PetroChina Dagang Oilfield Company, Tianjin 300280, China
3
School of Civil Engineering and Architecture, Northeast Petroleum University, Daqing 163318, China
4
PetroChina Changqing Oilfield Branch Production and Operation Department, Xi’an 716000, China
5
Bohai Rim Energy Research Institute, Northeast Petroleum University, Qinhuangdao 066004, China
*
Authors to whom correspondence should be addressed.
Energies 2025, 18(20), 5331; https://doi.org/10.3390/en18205331
Submission received: 8 July 2025 / Revised: 7 September 2025 / Accepted: 11 September 2025 / Published: 10 October 2025

Abstract

The issue of wellhead uplift in underground gas storage wells not only affects production efficiency but also poses a significant risk of wellhead seal failure, potentially leading to natural gas leakage accidents. This study proposes a systematic analytical framework for predicting wellhead uplift in gas storage wells. Initially, based on heat transfer theory and considering the coupled effects of temperature and pressure, a wellbore temperature prediction model was established. This model was tailored to the injection and production operations of gas storage wells, incorporating their specific operational characteristics. Subsequently, a predictive model for wellhead uplift distance was developed, accounting for various cementing conditions under fully cemented well scenarios. The proposed methodology was validated using data from injection and production wells in a gas storage reservoir. Furthermore, an analysis of the impact of injection and production parameters, along with predictions of wellhead uplift heights under different operating conditions, was conducted. The results indicate that the prediction errors relative to measured data are −0.8% and 4.3%, respectively. Gas production volume was identified as the most critical dynamic factor influencing wellhead uplift height. Predictions of wellhead uplift heights under both normal and extreme operating conditions can provide guidance for optimizing operational parameters. The proposed method holds theoretical and practical significance for the integrity management of gas storage wells.

1. Introduction

Underground gas storage facilities serve as critical infrastructure in natural gas supply chains, with injection–production wells acting as pivotal conduits for safe gas injection and withdrawal. During these operations, the temperature of injected/produced natural gas often exceeds that of the casing strings in the wellhead section, inducing axial thermal stresses in the casing and resulting in wellhead uplift. This phenomenon compromises wellbore integrity and may even necessitate well shutdowns [1]. Investigating wellhead uplift mechanisms is essential for optimizing cementing operations, enhancing wellhead equipment sealing performance, and ensuring the overall safety of underground gas storage systems [2].
Current methods for acquiring wellbore temperature data primarily rely on dynamic monitoring via downhole thermometer deployments. However, this approach incurs high costs and proves impractical for high-temperature/high-pressure gas wells. Alternative numerical simulations or analytical modeling techniques have emerged as viable alternatives for wellbore temperature prediction. Ramey [3] established a foundational theoretical model for wellbore heat transfer, which remains the dominant method for predicting wellbore temperature fields. This model assumes radial heat transfer within the wellbore, constant fluid properties in the tubing, steady-state heat conduction in wellbore structures, and transient heat transfer in formations. It provides a framework for calculating temperature distributions varying with injection time and depth for single-phase fluids. Building on Ramey’s work, Holst [4] incorporated fluid friction and kinetic energy losses into wellbore heat transfer analysis, systematically evaluating their impacts on thermal processes. Hasan et al. [5,6] further refined the model by integrating friction and kinetic effects within Fourier’s heat conduction equation, validating their revised two-phase flow temperature prediction model through dimensional time functions.
Over the past three decades, international research on wellhead uplift has predominantly focused on offshore thermal recovery wells. Aasen [7] et al. developed a multi-physics coupled mechanical model for production wells to analyze casing load distributions, theoretically investigating casing settlement. Their study confirmed that thermal stress-induced casing uplift generates tensile stresses in outer casing strings, with the uncemented length of casing exhibiting a strong correlation to uplift height. Meanwhile, inner uncemented casing sections are prone to buckling under axial compressive loads. M. Gjonnes [8] examined the combined effects of annular fluid pressure and temperature variations on wellhead uplift, conducting an in-depth analysis of the world’s first highly deviated offshore gas well and proposing mitigation strategies. McSpadden et al. [9] incorporated casing buckling effects into a linear elastic framework to study multi-string wellhead uplift in offshore wells, establishing a linear elastic theoretical model for uplift height prediction. Jing Jun [10] considered the differences in wellbore heat transfer characteristics between the seawater section and the formation section, as well as the influence of reservoir fluids on wellbore heat transfer capacity. They established a new mathematical model for wellhead growth in offshore gas wells by combining the calculation method of multi-annulus temperature and pressure conduction. The study shows that the strong convective heat transfer between the wellbore and seawater increases the temperature of the outer annulus and exacerbates wellhead uplift.
Despite these advancements, several research gaps persist. Existing studies on gas storage well cementing technologies—which require long-term operational reliability, high-intensity injection/production, and cyclic loading resistance—provide limited insights into wellhead uplift mechanisms [11]. Particularly lacking are systematic investigations into multi-cycle injection–production scenarios where formation pressures and tubular stresses undergo periodic fluctuations. Most analyses focus on single operational conditions or short-term dynamics rather than multi-cycle behaviors [12,13]. While finite element simulations have been employed to analyze wellhead uplift, these efforts are typically case-specific or narrowly scoped, failing to deliver generalized theoretical models or numerical methods applicable to gas storage wells undergoing repeated injection–production cycles [14].
This paper addresses these gaps by developing a wellbore temperature field model and a wellhead uplift prediction model under fully cemented well conditions. The framework is validated using data from A-6 injection–production wells in a gas storage reservoir, with sensitivity analyses conducted on dynamic factors influencing wellhead uplift. The findings offer practical guidance for optimizing field production protocols.

2. Analysis of Wellhead Uplift Causes in Underground Gas Storage Wells

Wellhead uplift remains a critical and multifactorial challenge in hydrocarbon production and gas storage injection–recovery operations. It arises from the combined effects of thermal expansion, annulus pressure fluctuations, casing deformation, cementing quality, and operational parameter variations. In high-temperature/high-pressure wells, heat transfer from produced hydrocarbon fluids induces thermal expansion of casings and wellhead equipment, leading to uplift through thermal expansion/contraction effects [15,16]. The magnitude of this effect correlates with formation temperature gradients, hydrocarbon flow rates, and thermal conductivity. During production, phase transitions, gas influx, and pressure adjustments in the wellbore increase annulus pressure, disrupting mechanical equilibrium at the wellhead and inducing upward displacement. Mechanical models have quantified the relationship between annulus pressure and uplift displacement [15].
Compared to conventional wells, gas storage wells are characterized by high-intensity injection–production cycles and frequent pressure fluctuations. Pressure swings during storage cycles can reach 10–20 MPa, with injection/production rates 20–30 times higher than conventional reservoirs. Annual injection–production cycles expose wellbores and surrounding formations to cyclic compressive–tensile loading, accelerating material fatigue. Gas injection and withdrawal operations alter wellbore temperatures, particularly at the wellhead section, causing thermal expansion/contraction of casings. Coupled with pressure variations, these thermal effects induce cyclic contact stress changes between cement sheaths, casings, and formations [17]. Over multiple cycles, differential thermal expansion coefficients between cement sheaths and casings lead to interfacial shear slip, reducing bonding strength.
Based on the monitoring data from 66 wells at a certain gas reservoir-type gas storage facility since its commissioning in 2019, a total of 51 wells experienced wellhead uplift during the gas injection period, with a maximum uplift height of 12.16 mm and common uplift heights ranging from 5 to 10 mm. A total of eight wells did not experience wellhead uplift. Due to more drastic temperature changes in the wellhead section during the gas production period, the wellhead uplift height at this stage will be higher than that during the gas injection phase. Therefore, it is necessary to establish a wellhead uplift prediction model to analyze the injection–production wells of this gas storage reservoir.

3. Prediction Method for Wellhead Uplift in Underground Gas Storage Wells

3.1. Methodological Framework

Firstly, a temperature field model for the gas injection and production processes is constructed, taking into account factors such as wellbore heat transfer, formation heat transfer, and gas flow, to simulate the temporal–spatial distribution of temperature under different operating conditions. Based on the results of the injection–production temperature field, a detailed analysis of the heat transfer process near the wellhead is conducted, and the temperature rise at the wellhead caused by injection and production operations is calculated. Using the prediction model, a predictive analysis of wellhead uplift height is carried out for both normal and extreme operating conditions, evaluating the trend of wellhead uplift height under different injection–production strategies, so as to provide a decision-making basis for the safe and efficient operation of the gas storage. The calculation process is shown in Figure 1.

3.2. Analytical Model for Injection–Production Temperature Field

(1)
Model Assumptions
The heat transfer process in the wellbore of underground gas storage is relatively complex, but in essence, it can be represented as shown in Figure 2. To predict the temperature distribution of each casing layer at various stages more efficiently and accurately, combined with the characteristics of actual gas storage production, the following assumptions are made:
(a)
Heat transfer from the gas in the tubing to the outer edge of the cement sheath (wellbore section) is considered steady-state, while heat transfer in the formation is transient.
(b)
Heat is primarily conducted radially from the tubing to the formation, with radial heat flux significantly exceeding axial heat flux.
(c)
The tubing, casings, and cement sheath are concentric cylinders.
(d)
Gas flows in a one-dimensional steady manner within the wellbore, meaning flow parameters in the tubing are time-invariant and uniformly distributed across any cross-sectional area, varying only along the flow direction [18].
(2)
Analysis of Heat Transfer Model
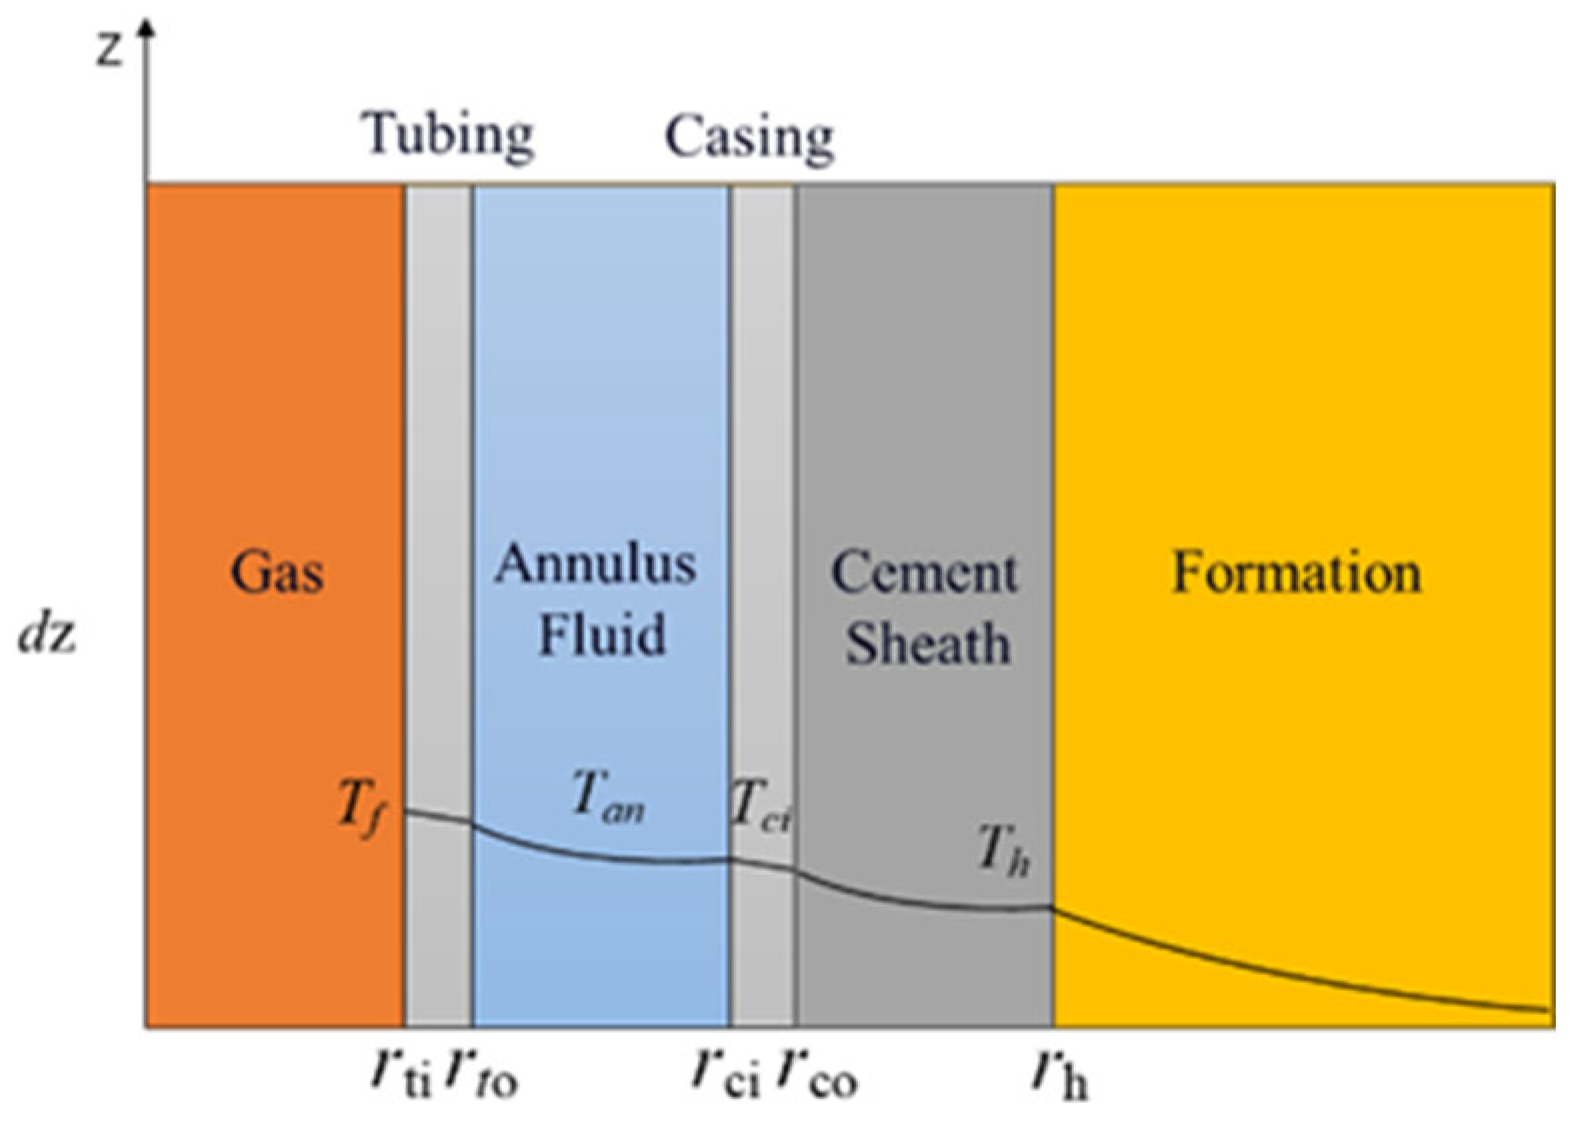
The heat transfer process from the gas in the tubing to the formation involves sequential steps: convective heat transfer between the gas and the inner wall surface of the tubing, conductive heat transfer through the tubing wall, convective and radiative heat transfer in the annulus, conductive heat transfer through each casing layer, and finally conductive heat transfer from the cement sheath to the formation. The corresponding radial heat transfer model is illustrated in Figure 3.
According to Assumption (1) described earlier, the heat transfer from the gas inside the tubing to the outer edge of the cement sheath in the wellbore section follows steady-state conduction, with the transferred heat quantity calculated as [19]:
d Q 1 = 2 π r t i U t o ( T f T h ) d z
where r t i is the inner radius of the tubing, m; U t o is the overall heat transfer coefficient, W/(m·°C); T f is the gas temperature inside the tubing, °C; T h is the temperature at the outer edge of the cement sheath, °C.
d Q 2 = 2 π r t i k e ( T h T e ) f ( t d ) d z
where k e is the formation thermal conductivity, W/(m·°C); T e is the formation temperature, °C; f ( t d ) is the dimensionless time function, which is a dimensionless quantity.
According to the formula proposed by Hasan [5] for calculating the dimensionless time function:
f ( t d ) = ( 0.4063 + 0.5 ln t d ) ( 1 + 0.6 t d ) , ( t d > 1.5 ) 1.1281 t d ( 1 0.3 t d ) , ( 10 10 t d 1.5 )
t d = α t r h 2
where α is the formation thermal diffusivity, m2/s; t is the injection or production time of the underground gas storage, s; r h is the cement sheath radius, m.
The overall heat transfer coefficient can be expressed as follows:
U t o = [ r t o k t u b r t i + 1 h r + h c + r t o k c a s ln r c o r c i + r t o k c e m ln r h r c o ] 1
where k t u b is the tubing thermal conductivity, W/(m·°C); h r is the annulus convective heat transfer coefficient, W/(s·m2·°C); h c is the annulus convective heat transfer coefficient, W/(s·m2·°C); k c a s is the casing thermal conductivity, W/(m·°C); r c o is the casing outer radius, m; r c i is the casing inner radius, m.
The gas undergoes one-dimensional steady flow within the oil tube. Here, the positive direction of the coordinate axis is defined to be consistent with the direction of gas flow. A micro-tube segment of length dz is taken as the unit control volume for heat transfer analysis, as shown in Figure 4.
Within a pipeline, fluid parameters are uniform at any cross-section. Based on the law of conservation of mass, the mass flowing into an infinitesimal element per unit time equals the mass flowing out per unit time, resulting in the differential form of the continuity equation [20]:
d ( ρ ν A ) d z = 0 ρ d ν d z + ν d ρ d z = 0
where ρ is the true density of the gas, kg/m3; ν is the flow velocity of the gas, m/s; A is the cross-sectional area of the oil pipe, m2.
According to the momentum theorem, the pressure gradient is given by [17]:
d p d z = ρ g ρ ν d v d z f ρ ν 2 4 r t i
where g is gravitational acceleration 9.8 m/s2; f is the pipe wall friction coefficient, which is a dimensionless quantity.
According to the law of conservation of energy,
d h d z + g + ν d ν d z = d q d z
where h is the specific enthalpy of gas, J/kg; q is the heat loss per unit mass of gas, J/kg.
As previously stated, the heat transfer mode within the wellbore can be approximated as steady-state heat transfer, while the heat transfer between the wellbore and formation is transient heat transfer. Based on d Q 1 = d Q 2 , it follows that
d q d z = 2 π r t i U t o k e ( T f T e ) ω [ r t i U t o f ( t d ) + k e ]
where ω is the mass flow rate, kg/s.
The specific enthalpy of the fluid d h d z is defined as
d h d z = C p d T f d z C J C p d p d z
where CJ is the Joule–Thomson coefficient, K/Pa.
Due to the minimal variation in tubing diameter, the Joule–Thomson coefficient is negligible and can be omitted. By combining Equations (8)–(10), the temperature gradient can be expressed as follows:
d T f d z = g C p ν C p d ν d z 1 C p d q d z
The relaxation distance L is introduced as
L = 2 π r t i U t o k e C p ω [ r t i U t o f ( t d ) + k e ]
The differential form of gas density along the depth direction, derived from the real gas equation of state, is expressed as
T d ρ d z + ρ d T d z = M R Z d p d z
where M is the molar mass of the gas, kg/mol; R is the universal gas constant, R = 8.314 J/(mol·K); Z is the compressibility factor, dimensionless; T is the thermodynamic temperature, K.
By taking the flow parameters at the wellhead or well bottom as initial values and sequentially solving through the explicit Runge–Kutta numerical method, the temperature distribution across the entire wellbore can be obtained. After calculating the wellbore temperature field under various injection–production parameters and combining it with the geothermal gradient, the temperature variations in each casing layer can be further analyzed. This analysis serves as the foundational input data for subsequent wellhead uplift evaluation models.

3.3. Wellhead Uplift Calculation Model

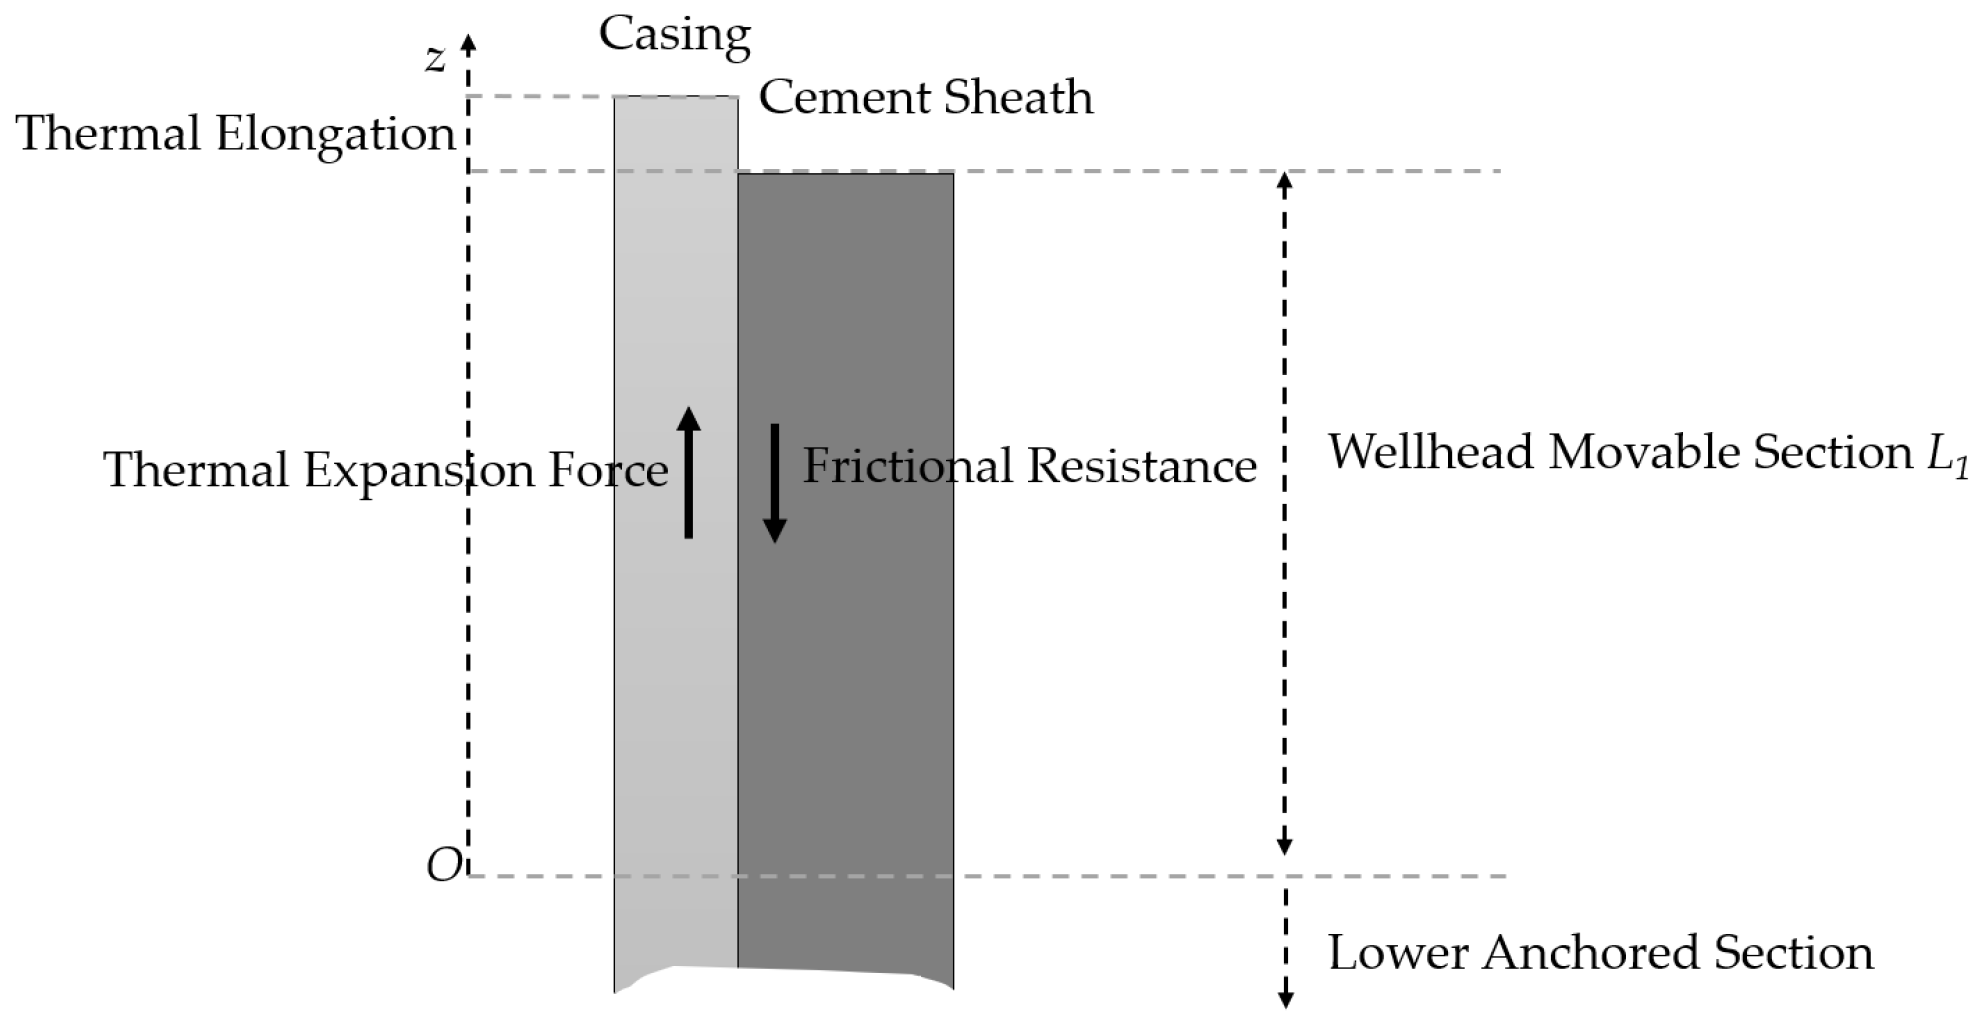
Injection–production wells in gas storage reservoirs typically employ full-well cementing, thus generally eliminating free casing sections or ensuring cement sheath bonding on at least one side of the casing. This can be illustrated through a typical tri-sectional wellbore structure: the innermost production casing experiences the highest potential temperature rise during injection–production operations and is only constrained by a single outer cement sheath, whereas the intermediate and surface casings—protected by cement sheaths under full-well cementing conditions—experience lower temperature increases and are frictionally restrained by cement sheaths on both internal and external sides. Consequently, the production casing is more susceptible to cement debonding, making it a primary contributor to wellhead uplift. Based on this understanding, the following analysis focuses on the production casing to demonstrate the fundamental analytical process. As previously defined, the cementing failure interval where thermal elongation occurs in the casing is termed the “wellhead mobility section,” with the corresponding mechanical analysis model illustrated in Figure 5.
For the aforementioned model, the basic assumptions are as follows:
(1)
The casing maintains good circularity and centralization;
(2)
The cement sheath and casing body remain intact without significant damage or deformation;
(3)
The casing–cement sheath composite system is radially continuous without gaps.
It can be assumed that the length of the wellhead mobility section of the production casing is L1, and the friction per unit length between the cement sheath and casing is f1. It can be derived from the calculation of cementation strength; cementation strength was obtained from [21]. The article states that the bonding strength at the casing–cement sheath interface ranges from approximately 0.005 MPa to 0.008 MPa. By calculating the contact area per meter between the casing and cement sheath, and multiplying this value by the aforementioned bonding strength, one can obtain the bonding strength per meter at the casing–cement sheath interface. This paper calculates the wellhead elevation height during a specific injection–production cycle, where frictional resistance values remain relatively constant. As the number of injection–production cycles increases, both interfacial bonding strength and frictional resistance at the interface gradually decrease. At this stage, the impact of reduced friction on wellhead elevation height must be considered.
A coordinate system is established with the origin O at the lower end of the mobility section and the Oz. With the positive direction along the Oz axis, a coordinate system is established. The axial force and axial strain at any position within the wellhead active section are defined as follows [22]:
N = L 1 z f 1
ε = α Δ T 1 L 1 z f 1 E A 1 1
where N is the axial force at any position within the active section, N; A1 is the cross-sectional area of the oil layer casing, m2; L1 is the length of the active section of the oil layer casing near the wellhead, m; f is the frictional resistance per unit length imposed by the cement sheath on the casing, N/m; E is the elastic modulus of the casing, Pa; ΔT1 is the average temperature change in the oil layer casing, °C.
Since the axial strain at the bottom end of the active section (i.e., the coordinate origin, z = 0) is zero, the boundary condition (z = 0, ε = 0) is applied to Equation (15) to solve for the wellhead active section length, L1:
L 1 = E α Δ T 1 A 1 f 1
For Equation (16), it should be pointed out that due to the fact that casing elongation occurs in the near wellhead area, where the temperature change in the casing in this area is almost linear and the length of the casing active section and the temperature change in the casing affect each other, the model uses the average temperature change as input from the perspective of computational feasibility. To solve the problem of the interaction between the length of the active section of the casing and the temperature change in the casing, it is necessary to first assume a length of the free active section of the casing, and then calculate the average temperature change within this range of the active section. Based on this, the free active section of the casing can be calculated. If the calculated length of the free movement section of the casing is less than the allowable error compared to the previously assumed length of the free movement section of the casing, then this value can be considered as a convergent analysis result.
Axial integration of ε within the wellhead mobility section yields the following:
Δ L 1 = 0 L 1 ε d Z = α L 1 Δ T 1 L 1 2 f 1 2 E A 1
Substituting Equation (16) into Equation (17), the elongation of the production casing can be determined as follows:
u 1 = E A 1 α Δ T 1 2 2 f 1
where u1 is the elongation of the oil layer casing, considering the effects of wellbore temperature change and the frictional resistance of the cement sheath, m;
If the length of the free mobility section is known, the axial force acting on the production casing within this free mobility section can be expressed as follows:
F t 1 = E A 1 α Δ T 1 L 1 f 1 2
The first term in this equation represents the axial force induced by thermal expansion, which increases with temperature variation. The second term represents the axial force opposing casing elongation caused by cement sheath friction, which intensifies with increasing mobility section length and frictional resistance. This equation reflects that when the thermal expansion coefficient is large and the frictional resistance is small, the axial force is predominantly governed by thermal expansion forces. Conversely, significant frictional resistance will substantially attenuate the axial force.
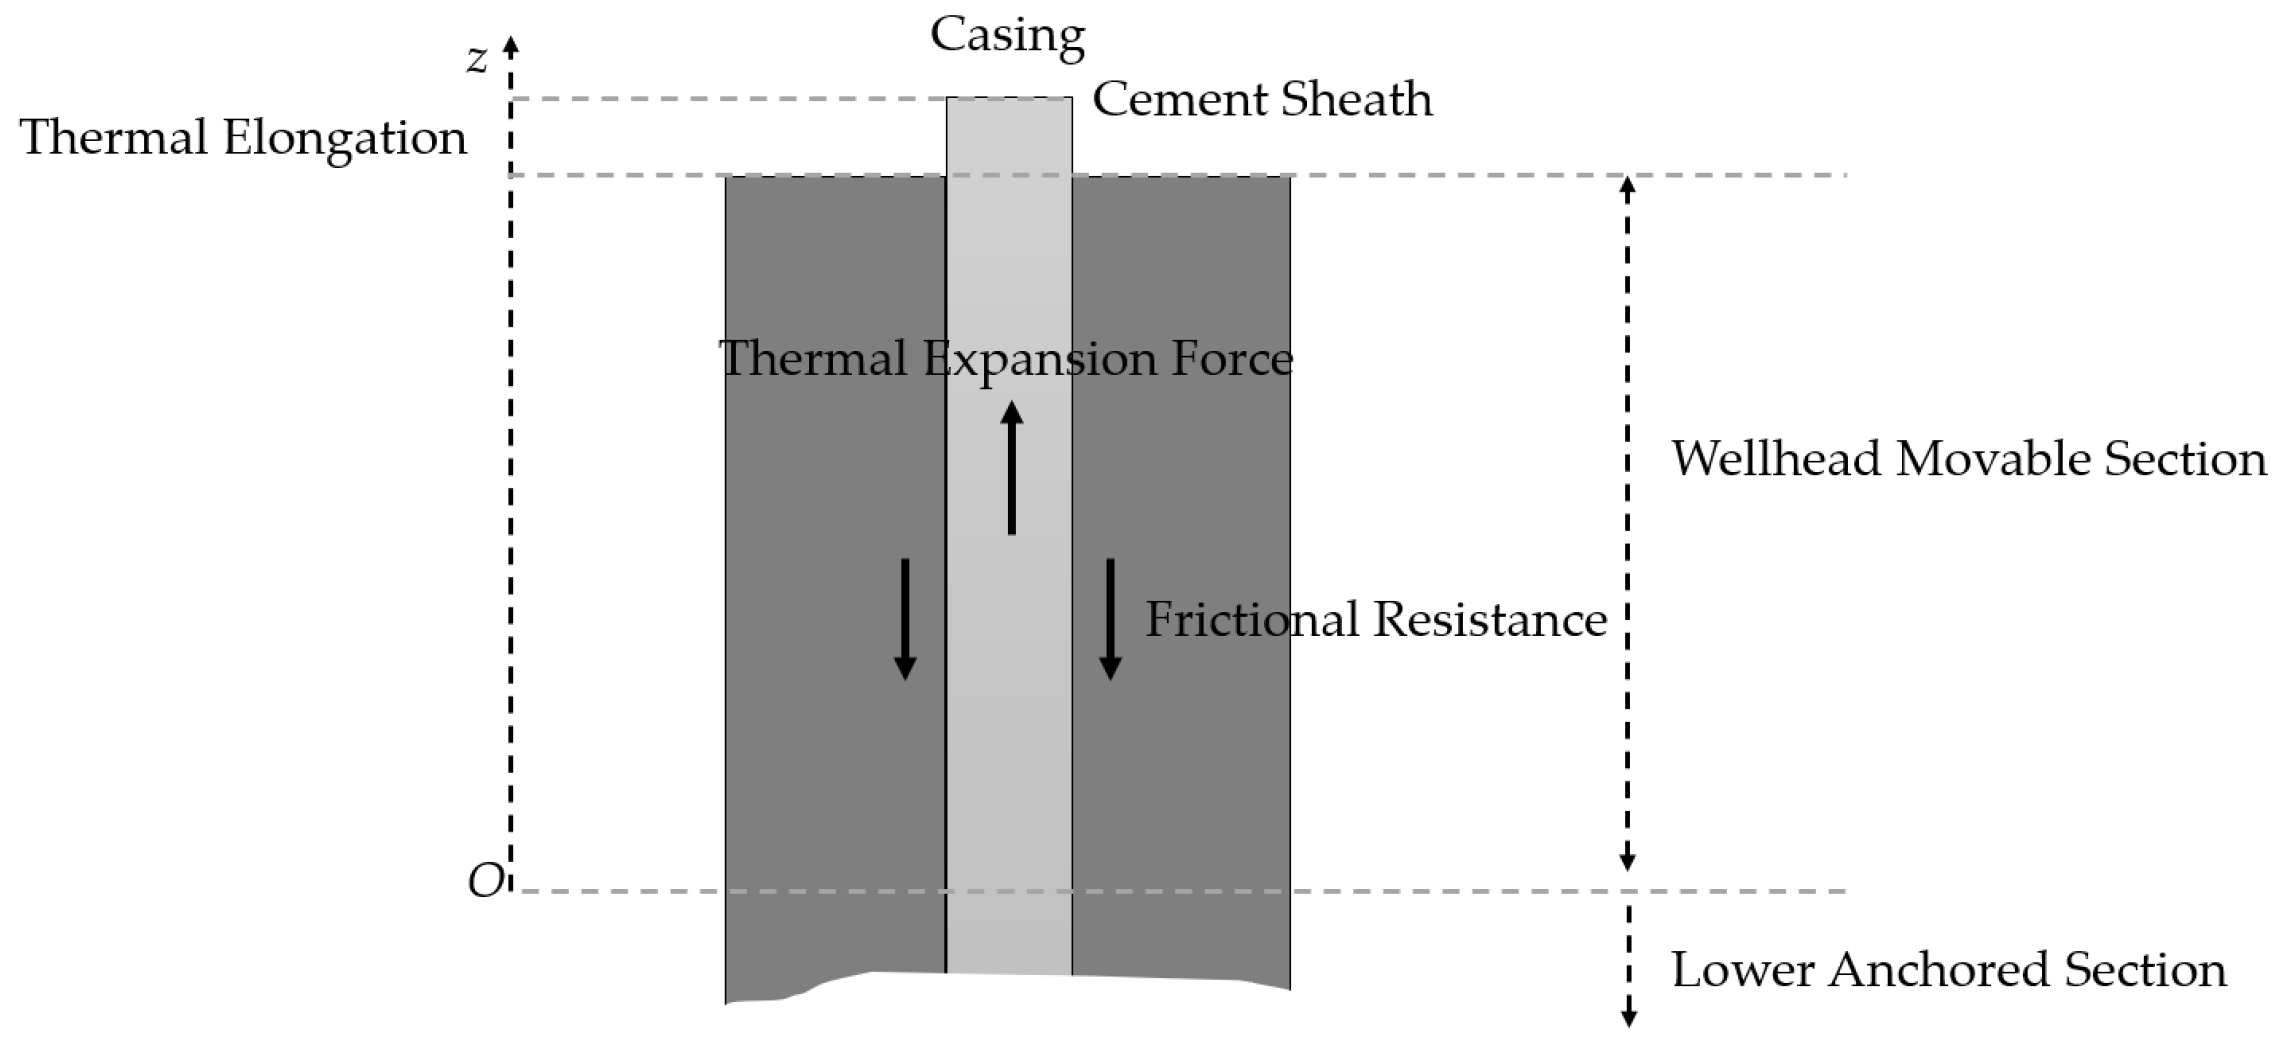
When analyzing intermediate casing or surface casing, which may be constrained by both internal and external cement sheaths, the corresponding frictional resistance should be considered as the sum of the frictional resistances from both the inner and outer cement sheaths. This allows the calculation of the wellhead uplift force or uplift height for the specific casing, and this scenario can be illustrated using Figure 6.
Figure 6 illustrates the thermal expansion load analysis for intermediate or surface casing under constrained conditions. Taking intermediate casing as an example, the axial force and axial strain at any position within the wellhead mobility section are expressed as follows:
N = 2 L 2 z f 2
ε = α Δ T 2 2 L 2 z f 2 E A 2 1
where L2 is the active section length of the technical casing near the wellhead, m; ΔT2 is the average temperature change in the technical casing, requiring iterative calculation, °C.
Similarly, following the methodology applied to the oil layer casing, the wellhead elevations caused by thermal elongation in the technical casing and surface casing can be expressed as follows:
u 2 = E A 2 α Δ T 2 2 4 f 2
u 3 = E A 3 α Δ T 3 2 4 f 3
where u2 and u3 are the elongations of the technical casing and surface casing, respectively. These variables account for the effects of wellbore temperature change and the frictional resistance of the cement sheath, m; A2 and A3 are the cross-sectional areas of the technical casing and surface casing, m2; ΔT2 and ΔT3 are the average temperature changes in the technical casing and surface casing, °C; f2 and f3 are the frictional resistances between the oil reservoir casing and technical casing, N/m.
If the lengths of the corresponding free active sections are known, the axial forces in the technical casing and surface casing can be expressed separately through integration of the axial strain:
F t 2 = E A 2 α Δ T 2 L 2 f 2
F t 3 = E A 3 α Δ T 3 L 3 f 3
In practical wellbore structures, multiple casing layers form a coupled system anchored at the wellhead, necessitating a comprehensive analysis of mechanical interactions. The elongation calculation for this coupled system proceeds as follows:
The effective uplift force causing wellhead displacement is determined:
F sys = F t + F an F W
where Fsys is the overall equivalent lifting force of the coupled system, N; Ft is the sum of lifting forces in each casing layer due to temperature effects, N; Fan is the equivalent lifting force caused by annular pressure, N; Fw is the weight of the wellhead equipment, N.
For the active section of casing with failed cement bonding, its axial stiffness can be modeled as a spring. Therefore, the wellhead elevation can be expressed as follows:
Δ L w = F sys K i

4. Engineering Case Study

4.1. Field Measurement Comparison

Based on the previously established wellbore temperature field and wellhead uplift distance prediction model, an instance analysis is conducted for Gas Storage Well A. The basic parameters of this injection–production well are summarized in Table 1 below.
From May 2023 to August 2023, based on the gas injection volume statistics from the production daily report, the average gas injection rate of Well A-6 was 21.4 × 10⁴ m3/d. Using the wellbore temperature field prediction model, the wellbore temperature profiles were calculated under the conditions of a gas injection duration of 10 days and 80 days, respectively, with a constant gas injection rate of 21.4 × 10⁴ m3/d.
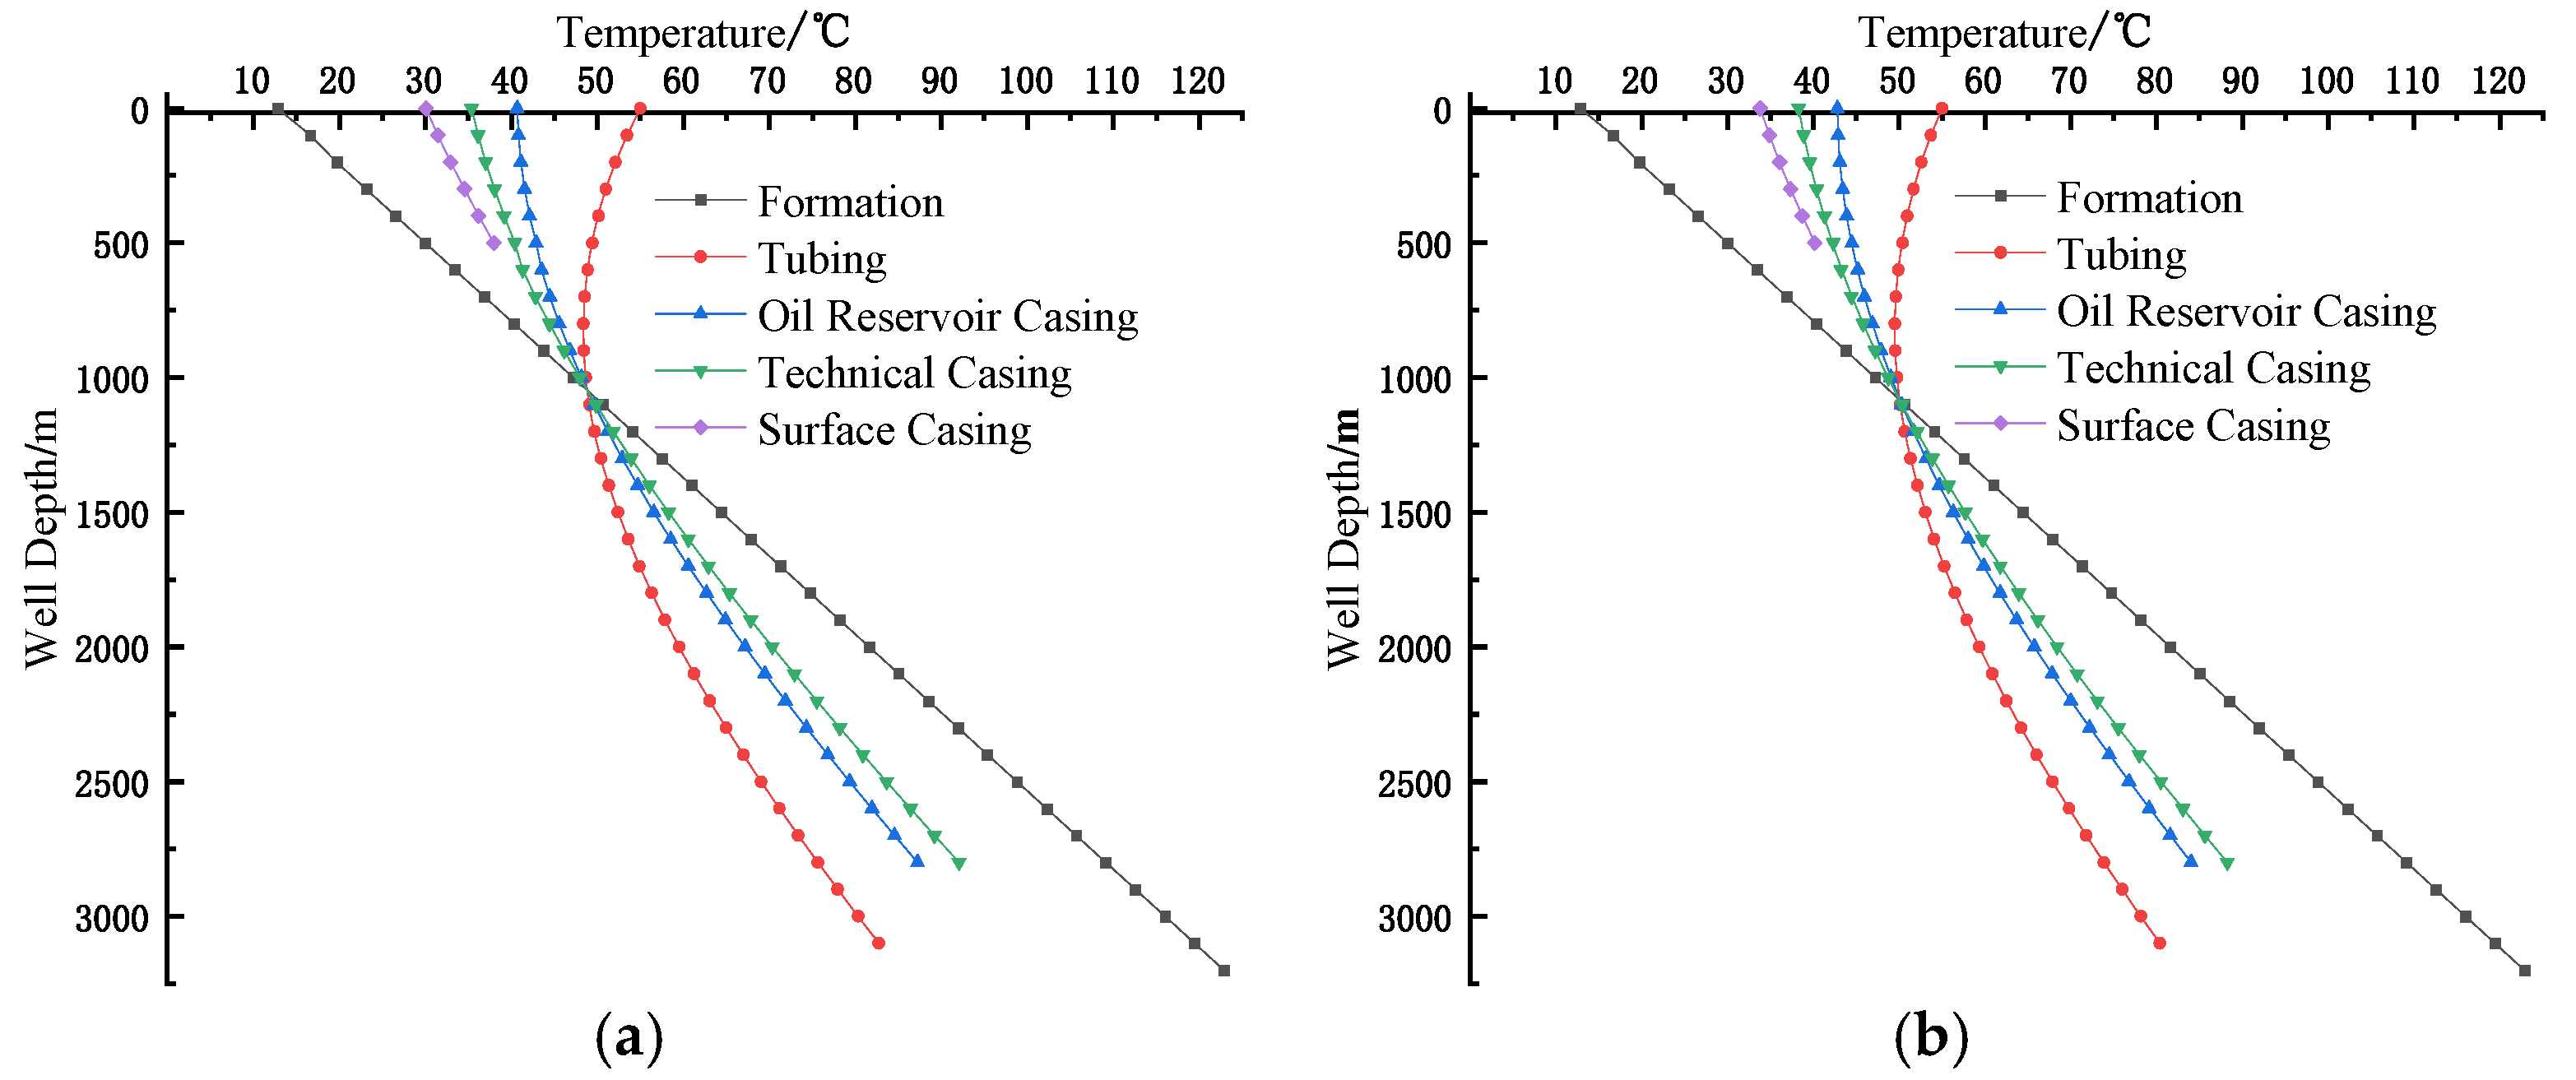
Figure 7 illustrates the temperature distribution across the wellbore structure. Near the wellhead, the gas temperature inside the tubing exceeds the formation temperature, resulting in higher gas temperatures within the tubing compared to all casing layers within the 0–1100 m interval. As depth increases, formation temperature rises progressively, with corresponding temperature increases observed in both tubing gas and all casing layers.
The variation amplitude of each casing string temperature in the first 10 days is significantly higher than that in the subsequent 70 days. The time required for different casing strings to reach thermal stabilization also varies, with inner casing strings stabilizing faster. This phenomenon reflects the hysteresis effect in heat transfer. During the initial gas injection phase, the steep temperature gradient between the wellbore and formation (caused by a significant temperature difference) gradually diminishes over time, resulting in the slowing down of wellhead elevation changes.
The average temperature rise in the wellhead section was utilized for calculating wellhead uplift. Calculations indicate that after 10 days of gas injection, the wellhead uplift height reaches 8.8 mm, with field measurements recording 8.73 mm, yielding a −0.8% error. For 80 days of continuous gas injection, the predicted wellhead uplift is 11.3 mm, showing a 4.3% error compared to the field-measured value of 11.81 mm.

4.2. Influence Analysis of Injection–Production Parameters

Taking Well A-6 in a central gas storage reservoir as an example, this section predicts wellhead uplift during different gas injection and production cycles, assuming constant friction resistance (i.e., single-cycle operation without friction variation).

4.2.1. Production Phase Analysis

(1) Impact of production rate on wellhead uplift: Under identical production durations, the gas withdrawal rate significantly affects wellhead displacement. Specifically, higher production rates elevate wellhead temperatures, increasing thermal stresses and extending the wellhead mobility section, thereby amplifying uplift forces and potentially exacerbating wellhead displacement.
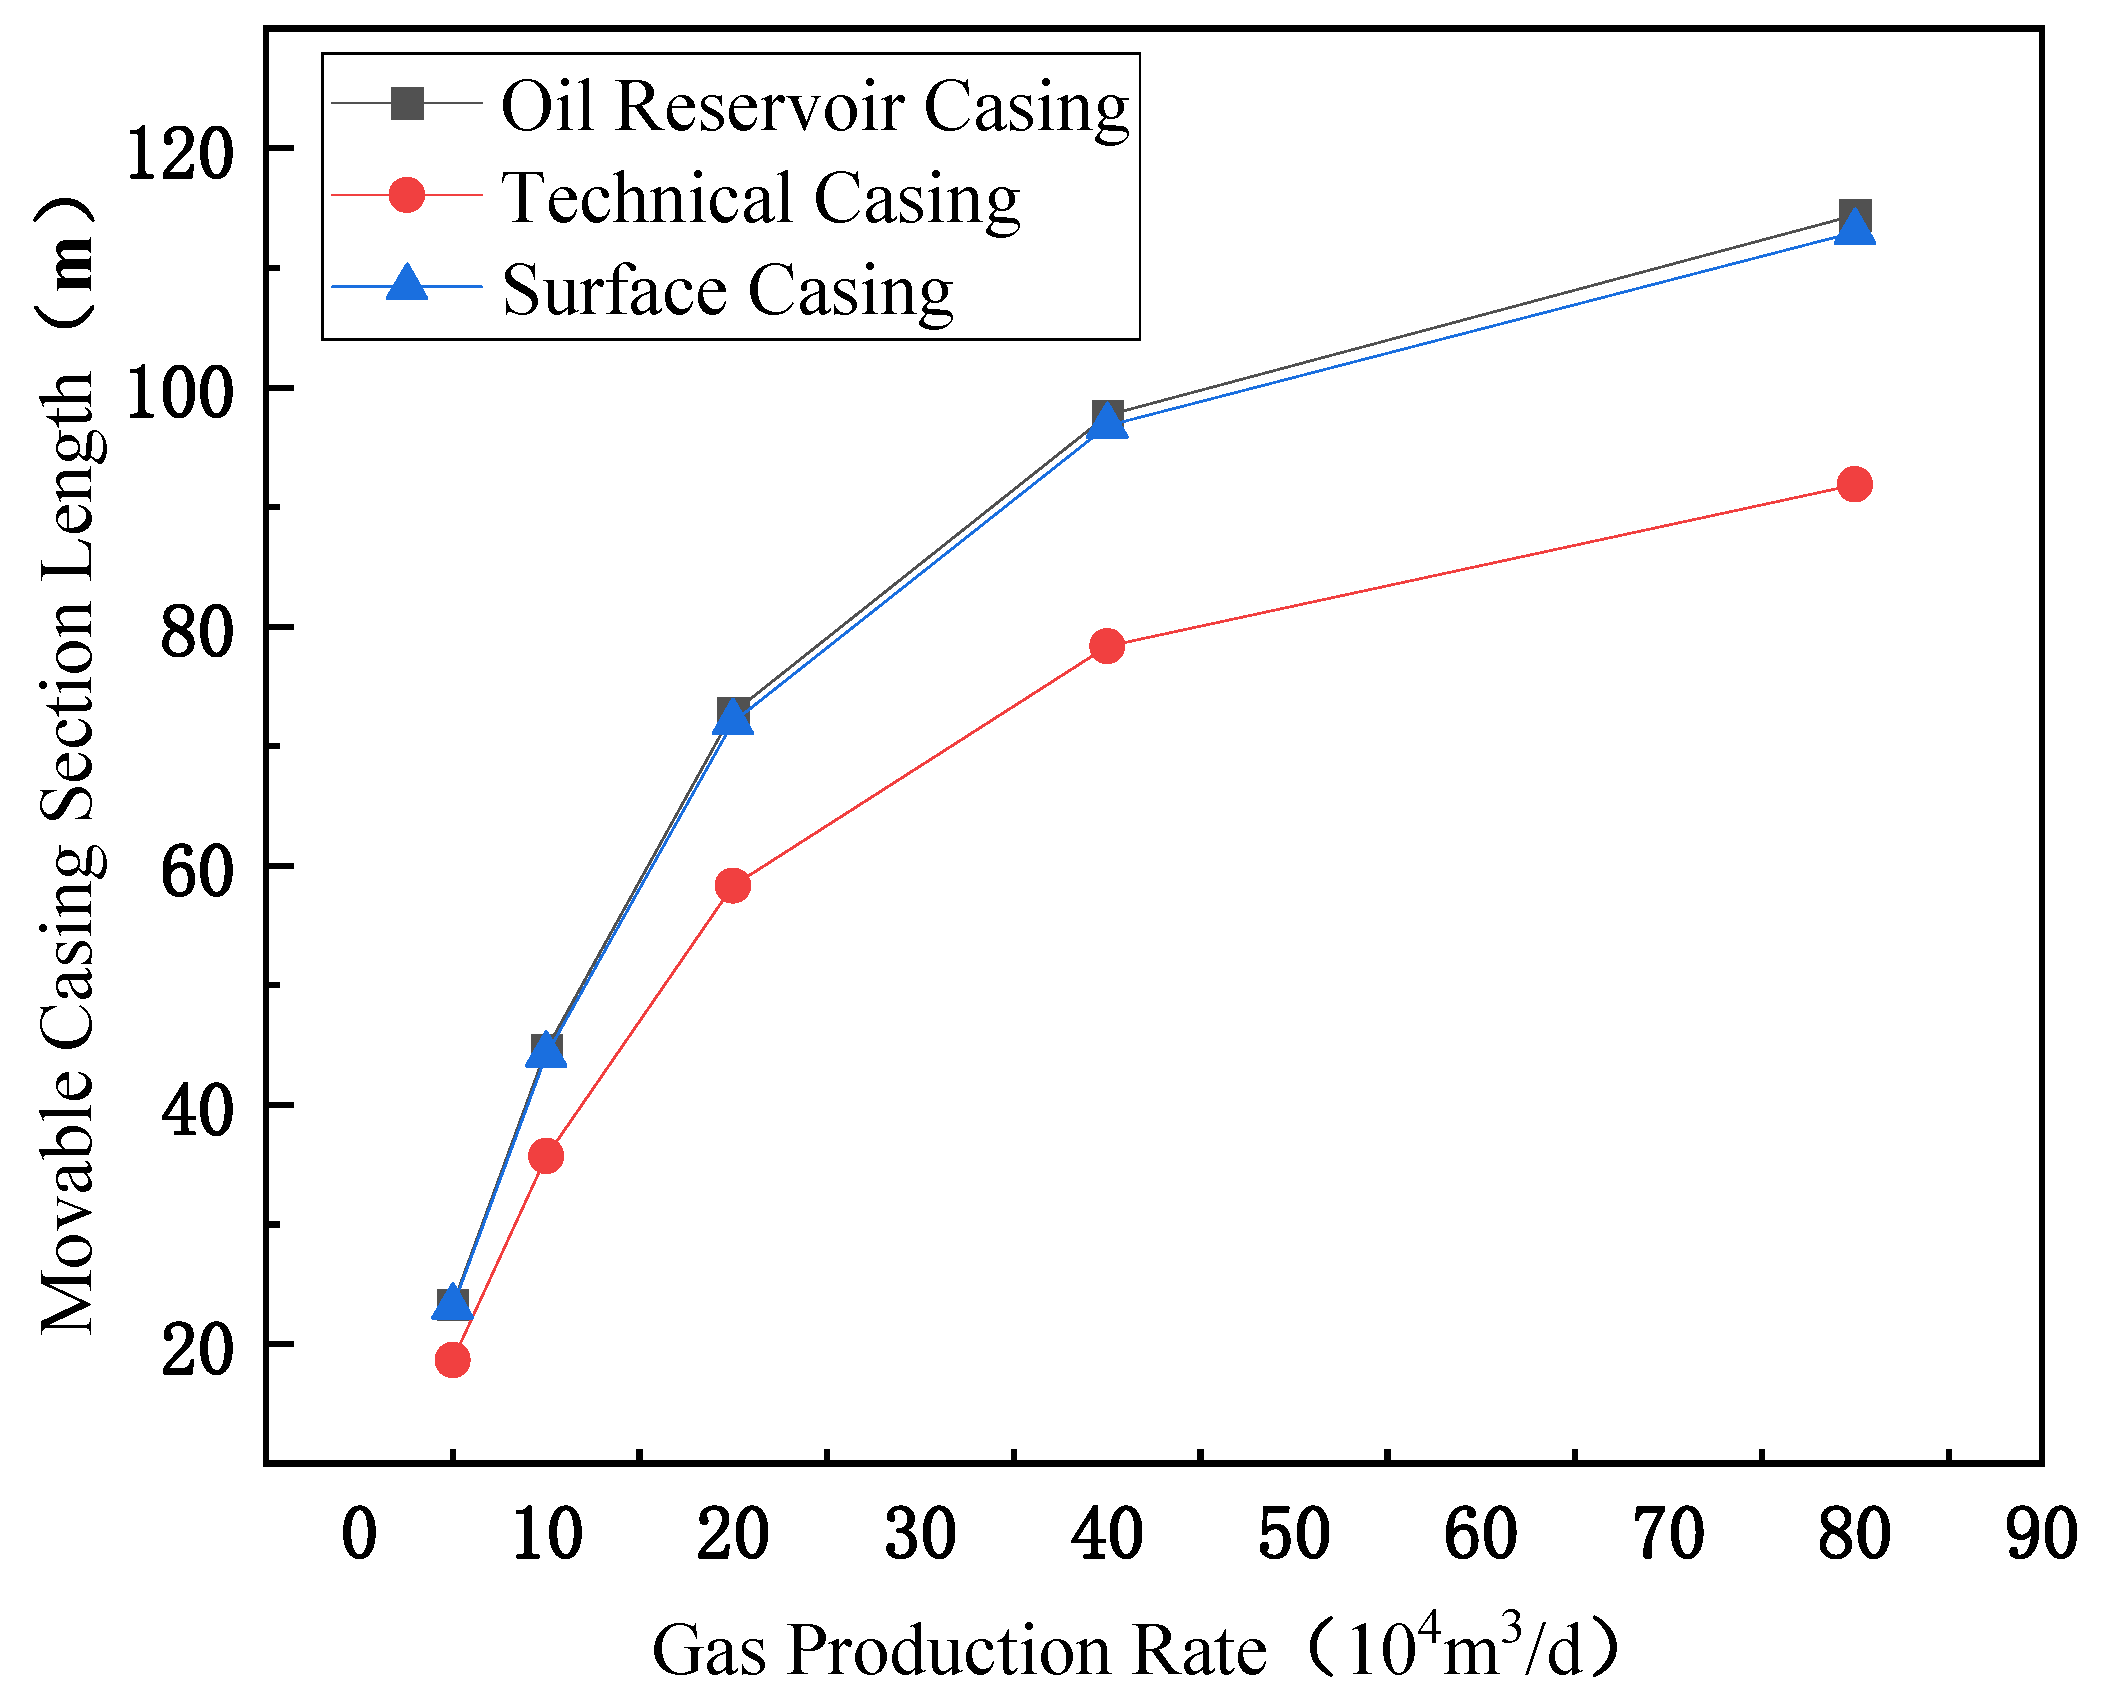
Figure 8 demonstrates the effect of production rates on casing temperature increases. As production rates rise, the mobility section lengths of all casing layers progressively increase, underscoring the critical role of operational parameters in wellhead uplift. Notably, the mobility section lengths of production casing and surface casing exceed those of intermediate casing. Figure 9 illustrates the influence of production rates on thermal elongation of each casing layer.
As shown in Figure 9, the thermal elongation of each casing layer gradually increases with rising gas production rates, with the innermost casing (oil layer casing) exhibiting significantly greater thermal elongation compared to the intermediate and surface casings. This phenomenon is attributed to the more substantial temperature increase in the oil layer casing and to the fact that this casing layer is only subjected to frictional resistance from the cement sheath on one side.
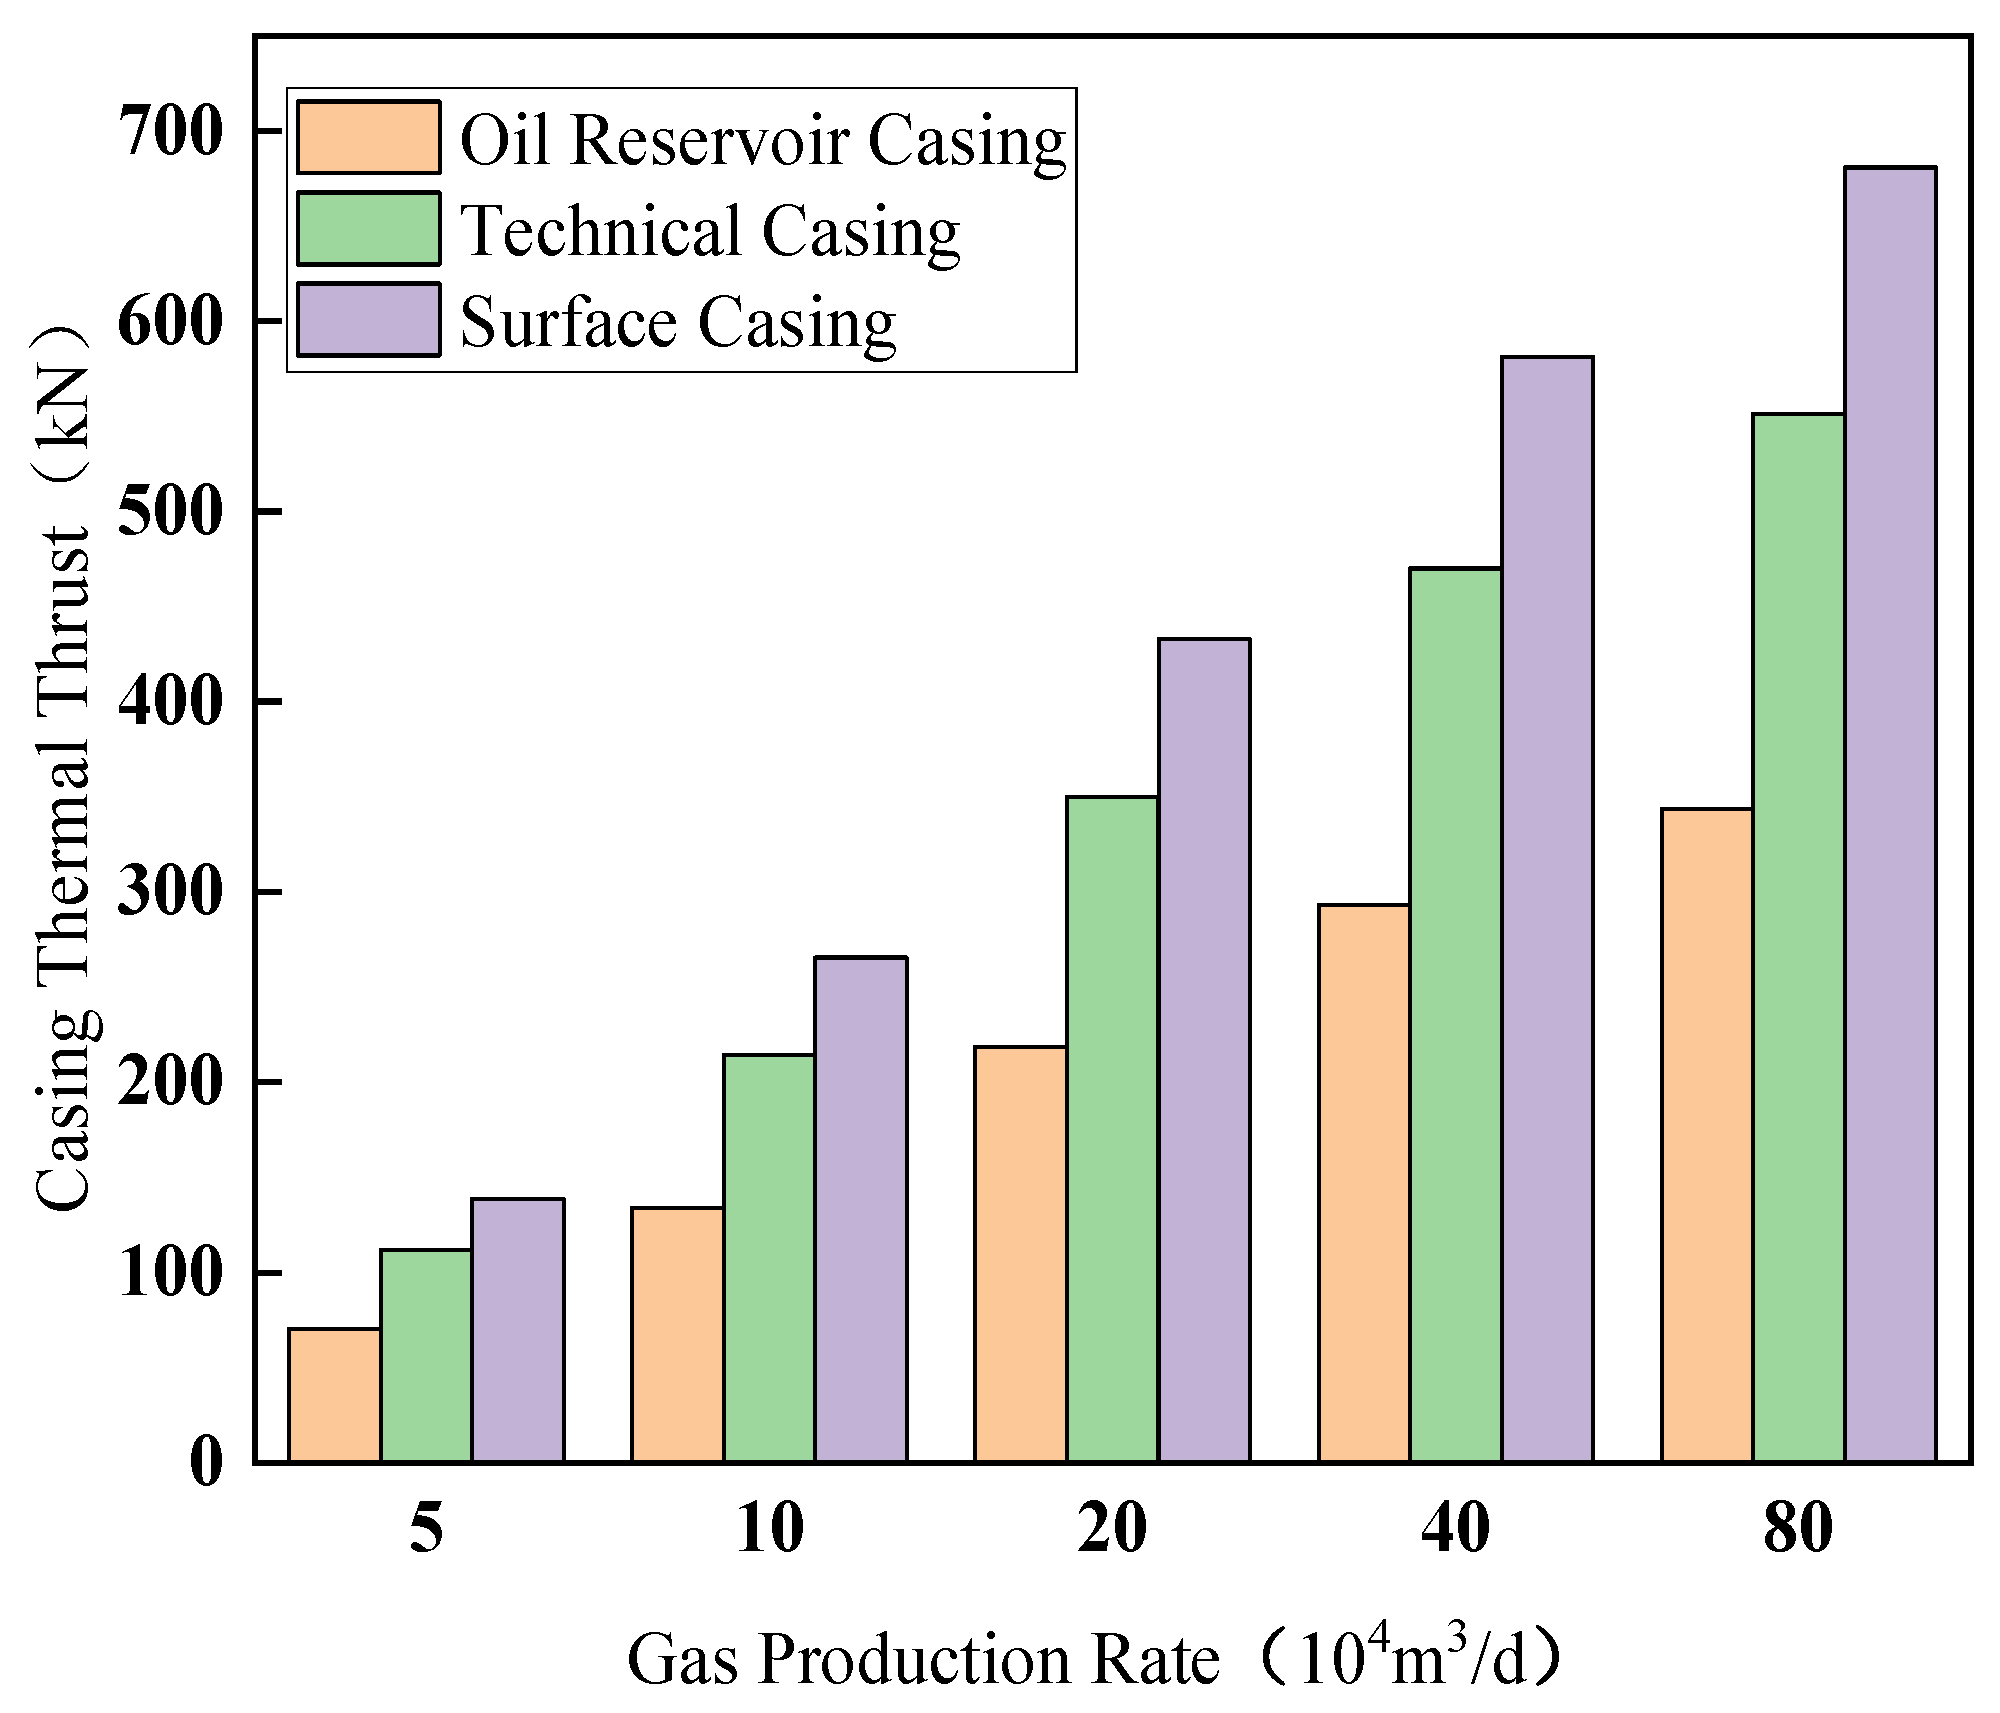
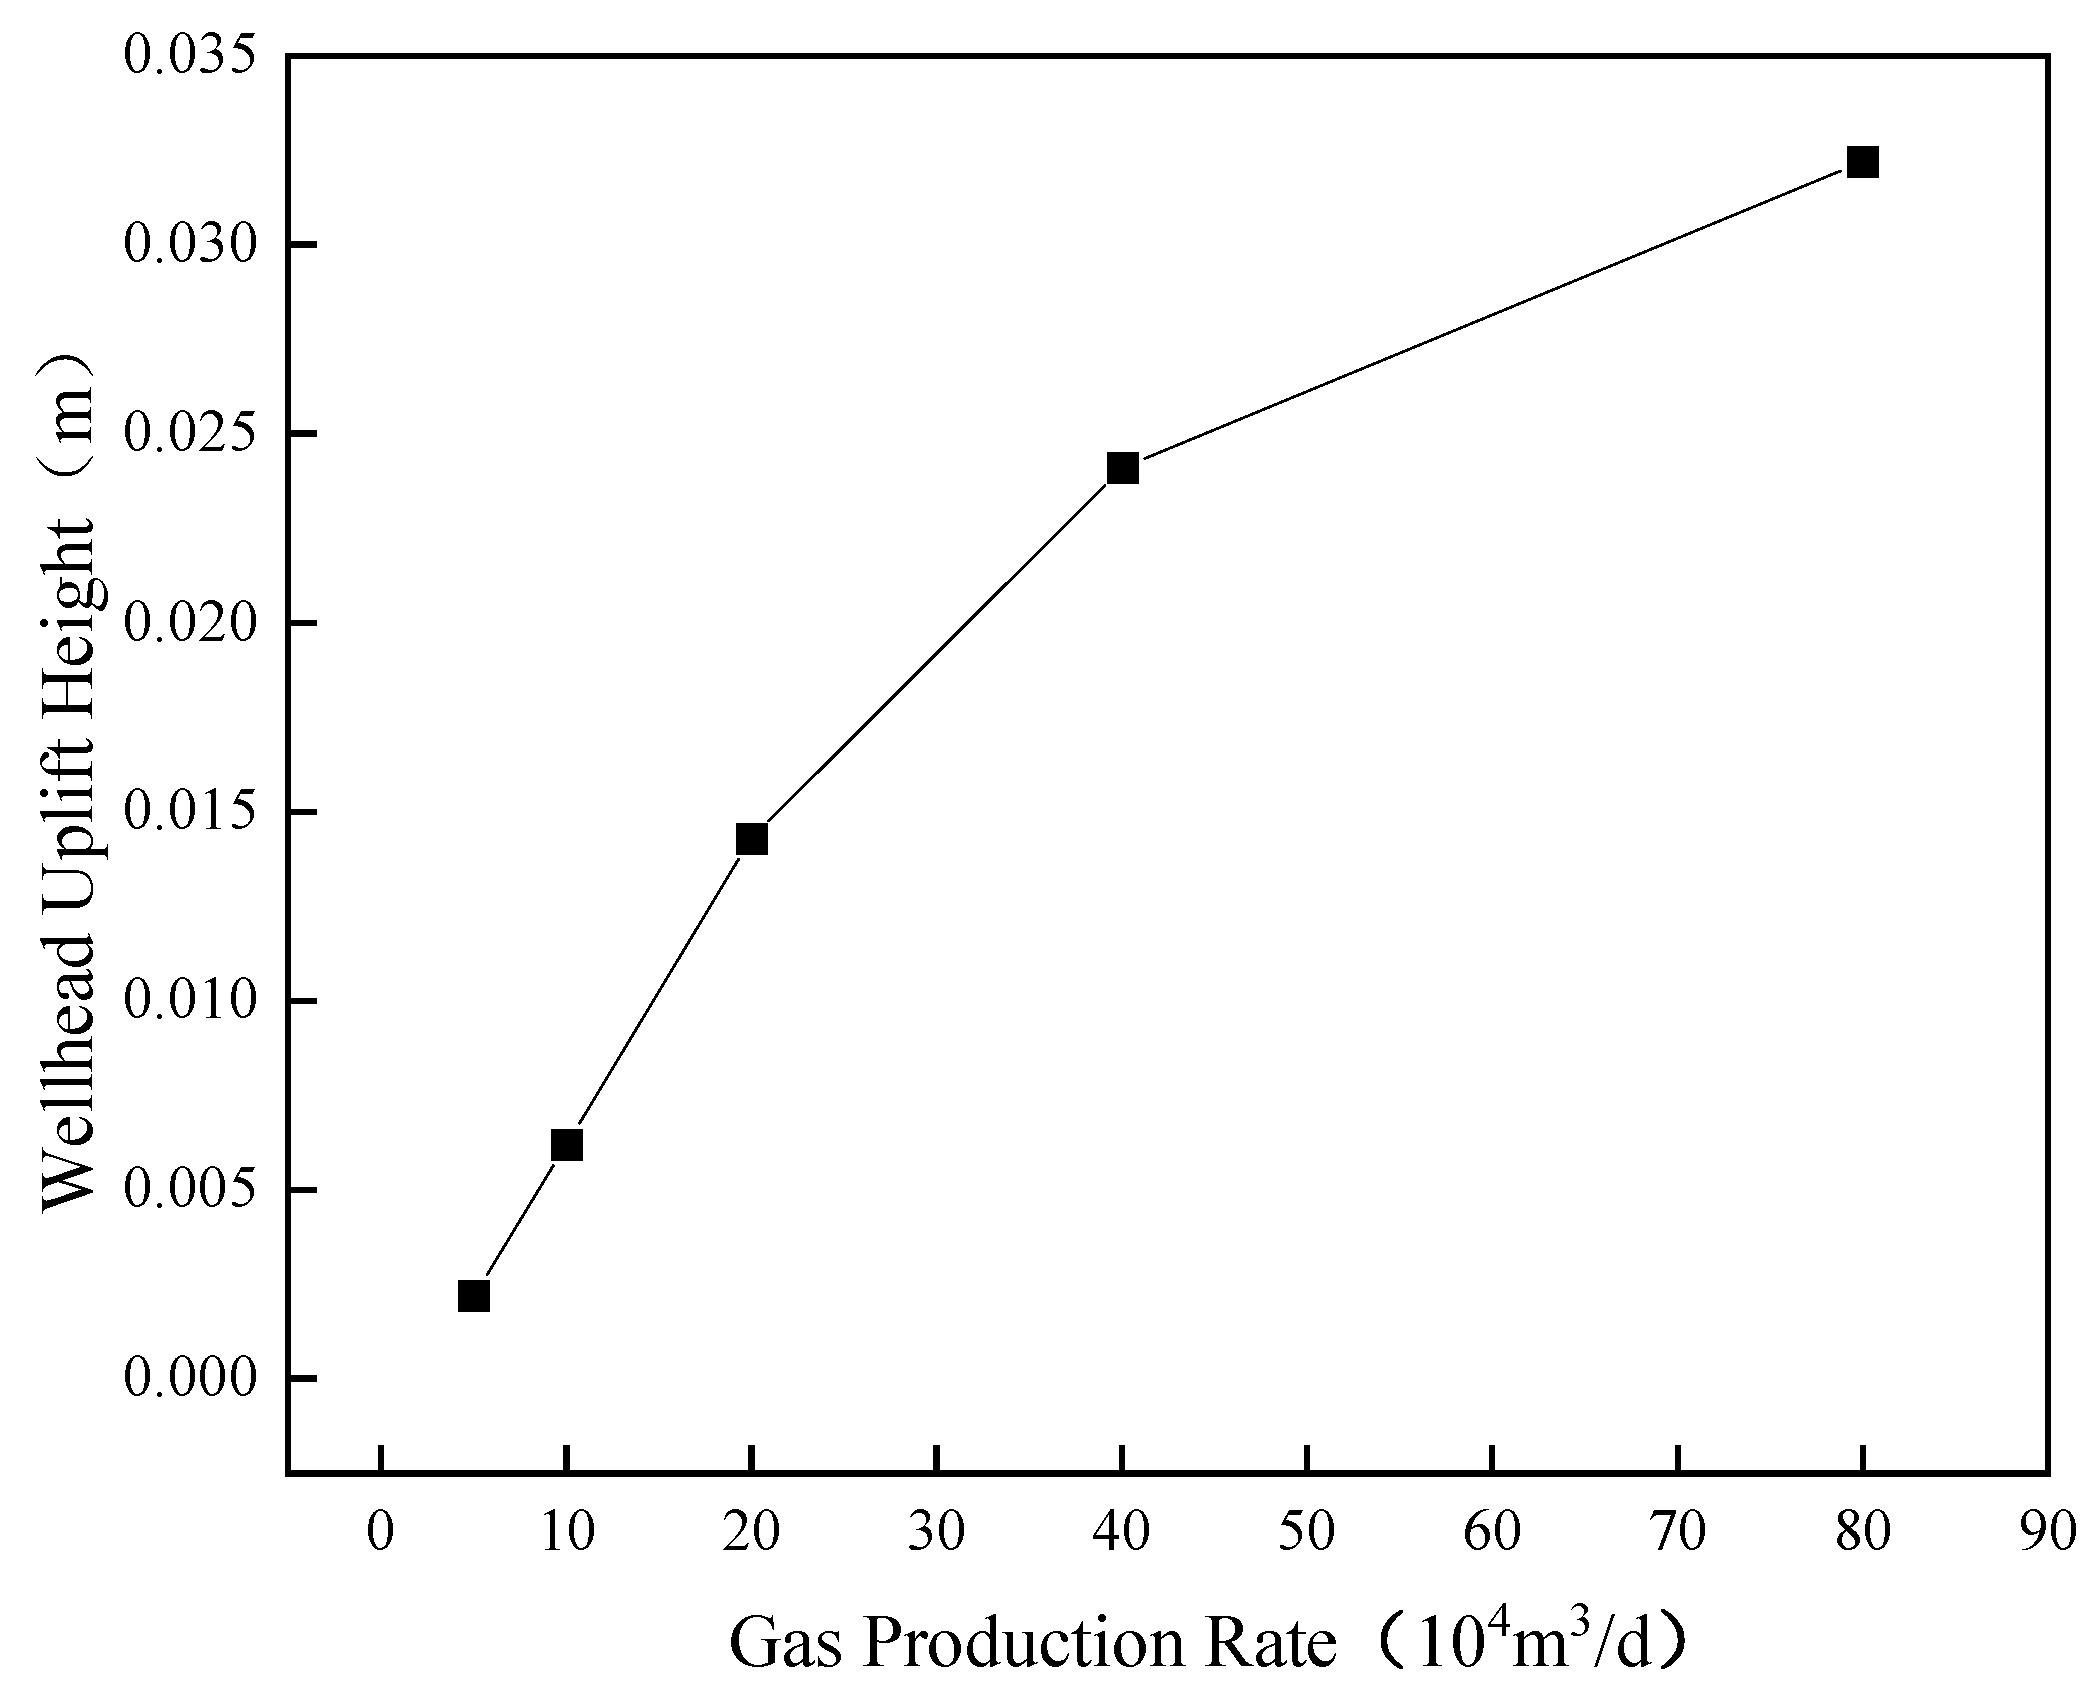
Figure 10 illustrates the influence of gas production rate on thermal thrust forces in each casing layer. All casing layers demonstrate increasing thermal thrust with higher gas production rates, with the surface casing experiencing the greatest thermal expansion force, followed by the intermediate casing and then the oil layer casing. This indicates that casing stiffness has a considerable impact on thermal expansion forces. After obtaining the mobile segment lengths of these casings and further considering the end effects of the tubular string, the final wellhead elevation can be estimated using an integrated stiffness model, as demonstrated in Figure 11.
As observed in Figure 11, at a gas production rate of 5 × 10⁴ m3/d, the wellhead elevation is approximately 0.22 cm, indicating negligible lifting. As gas production increases, the wellhead elevation gradually rises, though the rate of increase slows at higher production volumes. At 80 × 104 m3/d, the wellhead reaches 3.22 cm of elevation. These findings align with the preliminary temperature field analysis, confirming gas production rate as a critical factor influencing wellhead elevation. Additionally, due to end effects such as wellhead loads, the actual wellhead elevation may be lower than the thermal elongation observed in individual casing layers.
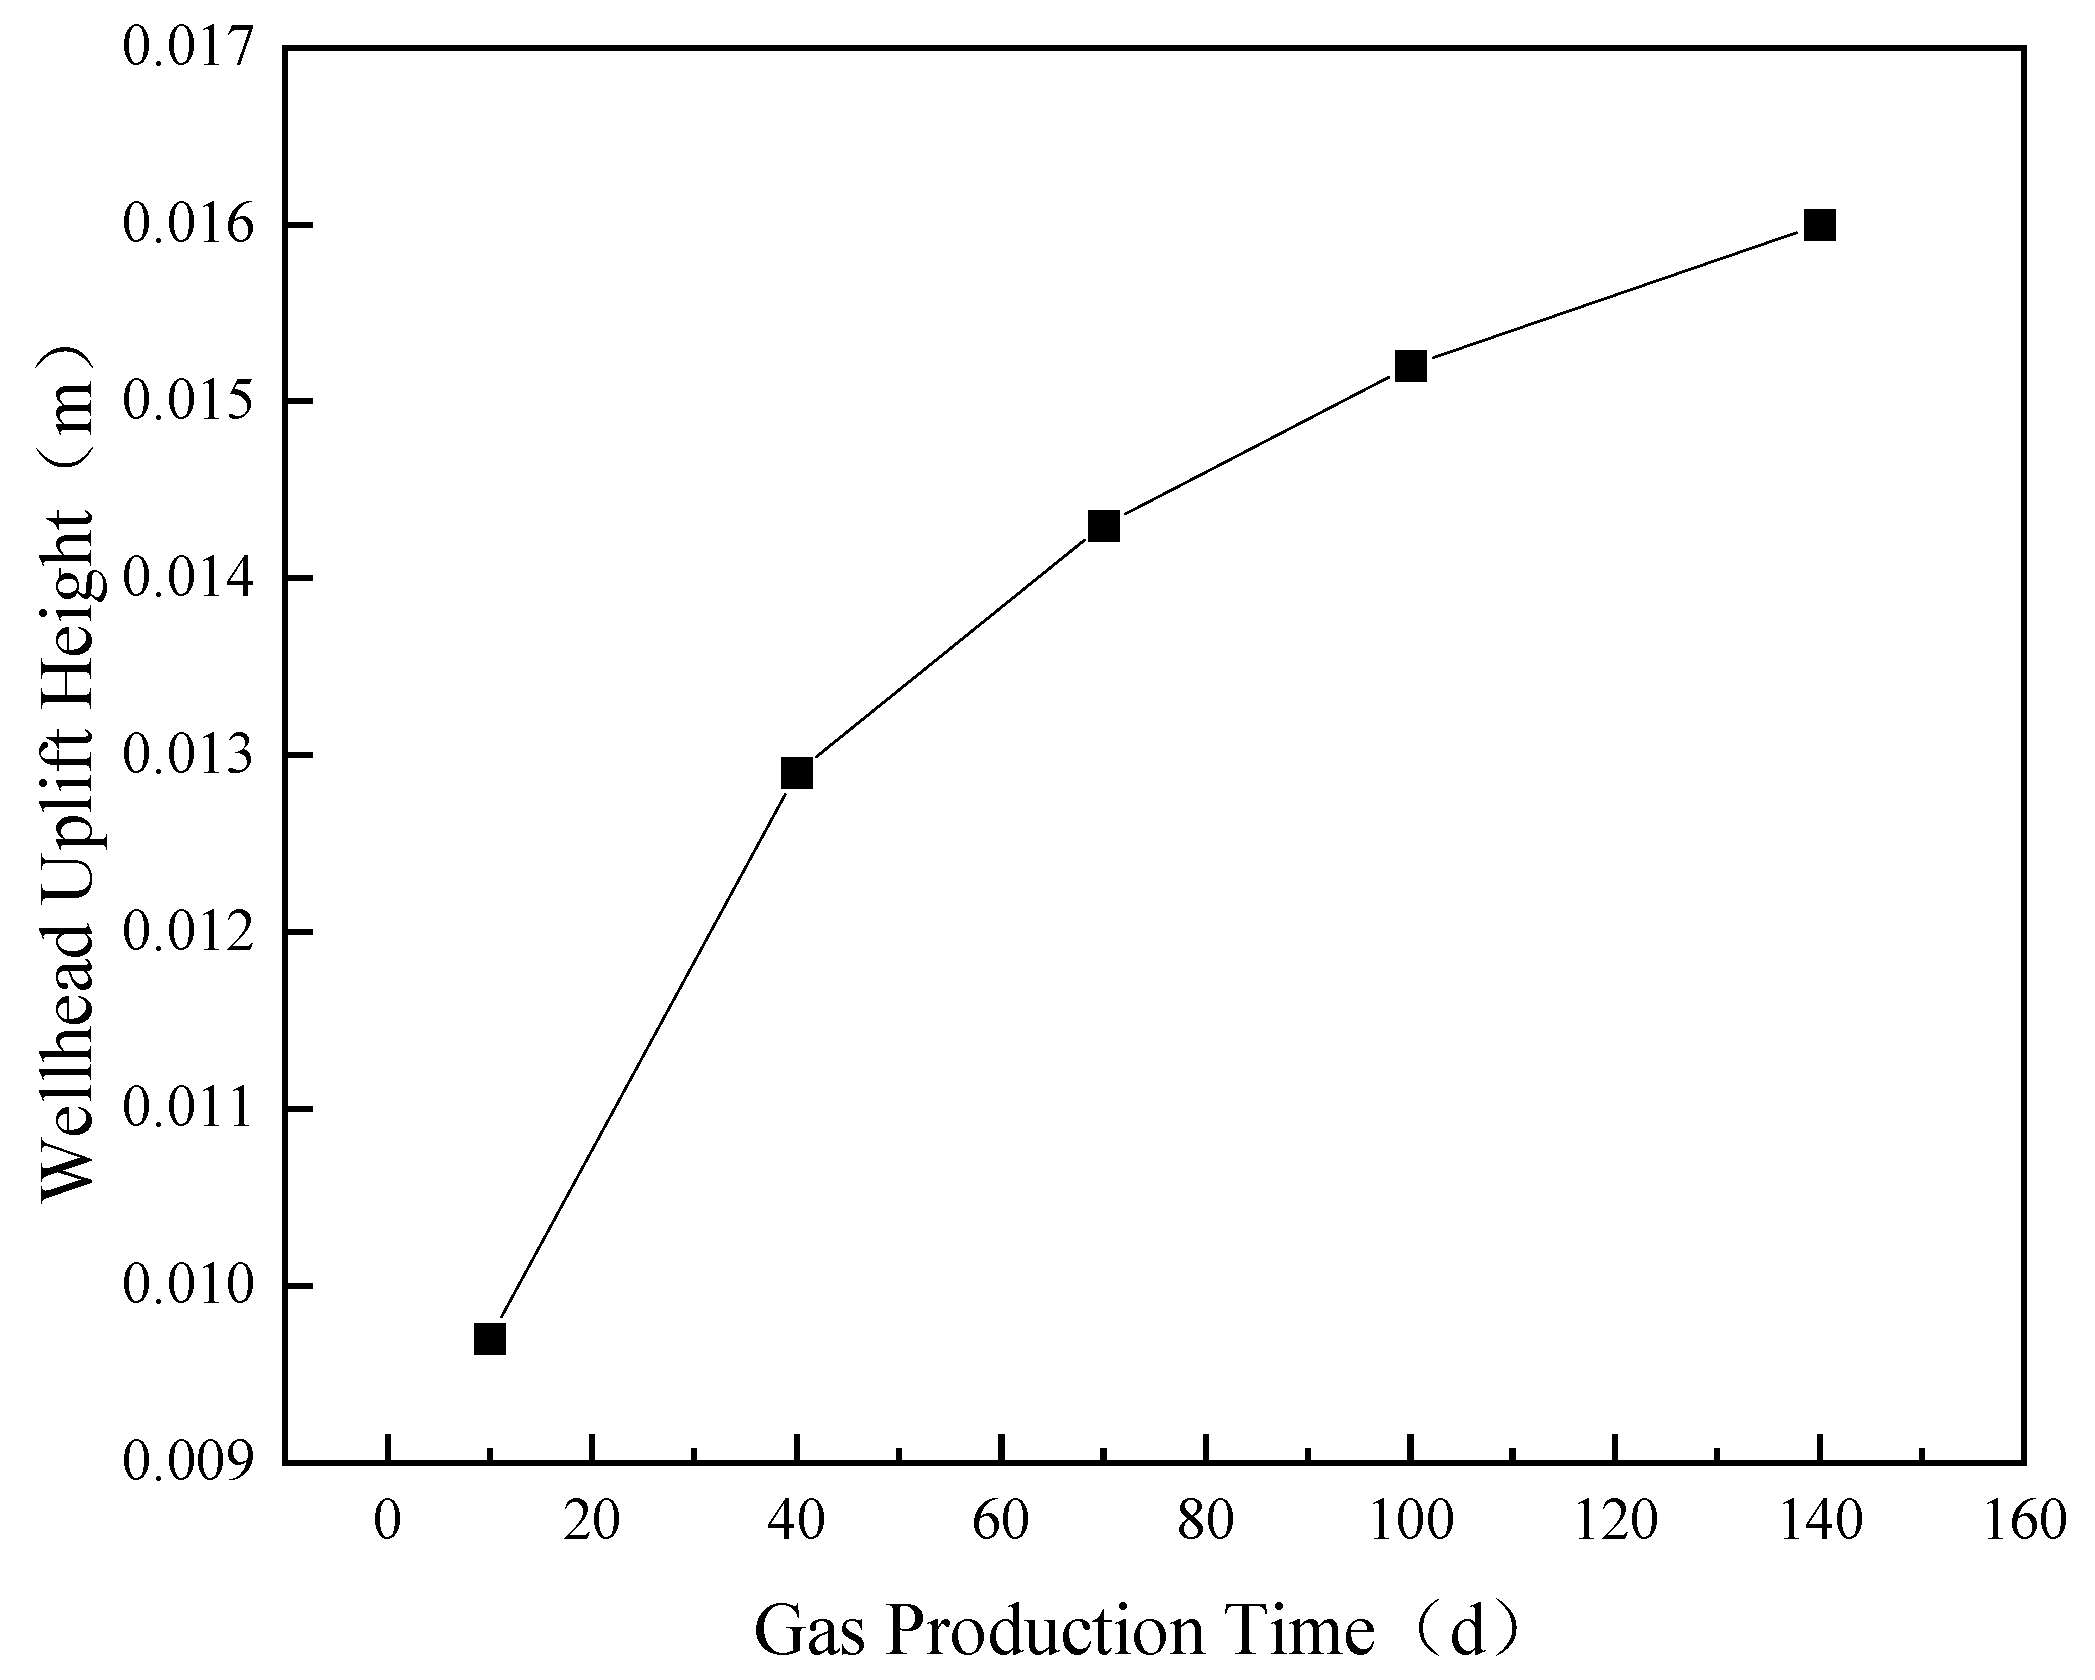
(2) Gas production duration is another key factor affecting wellhead elevation. With constant gas production rates, prolonged production time leads to higher wellbore temperatures and greater wellhead elevation.
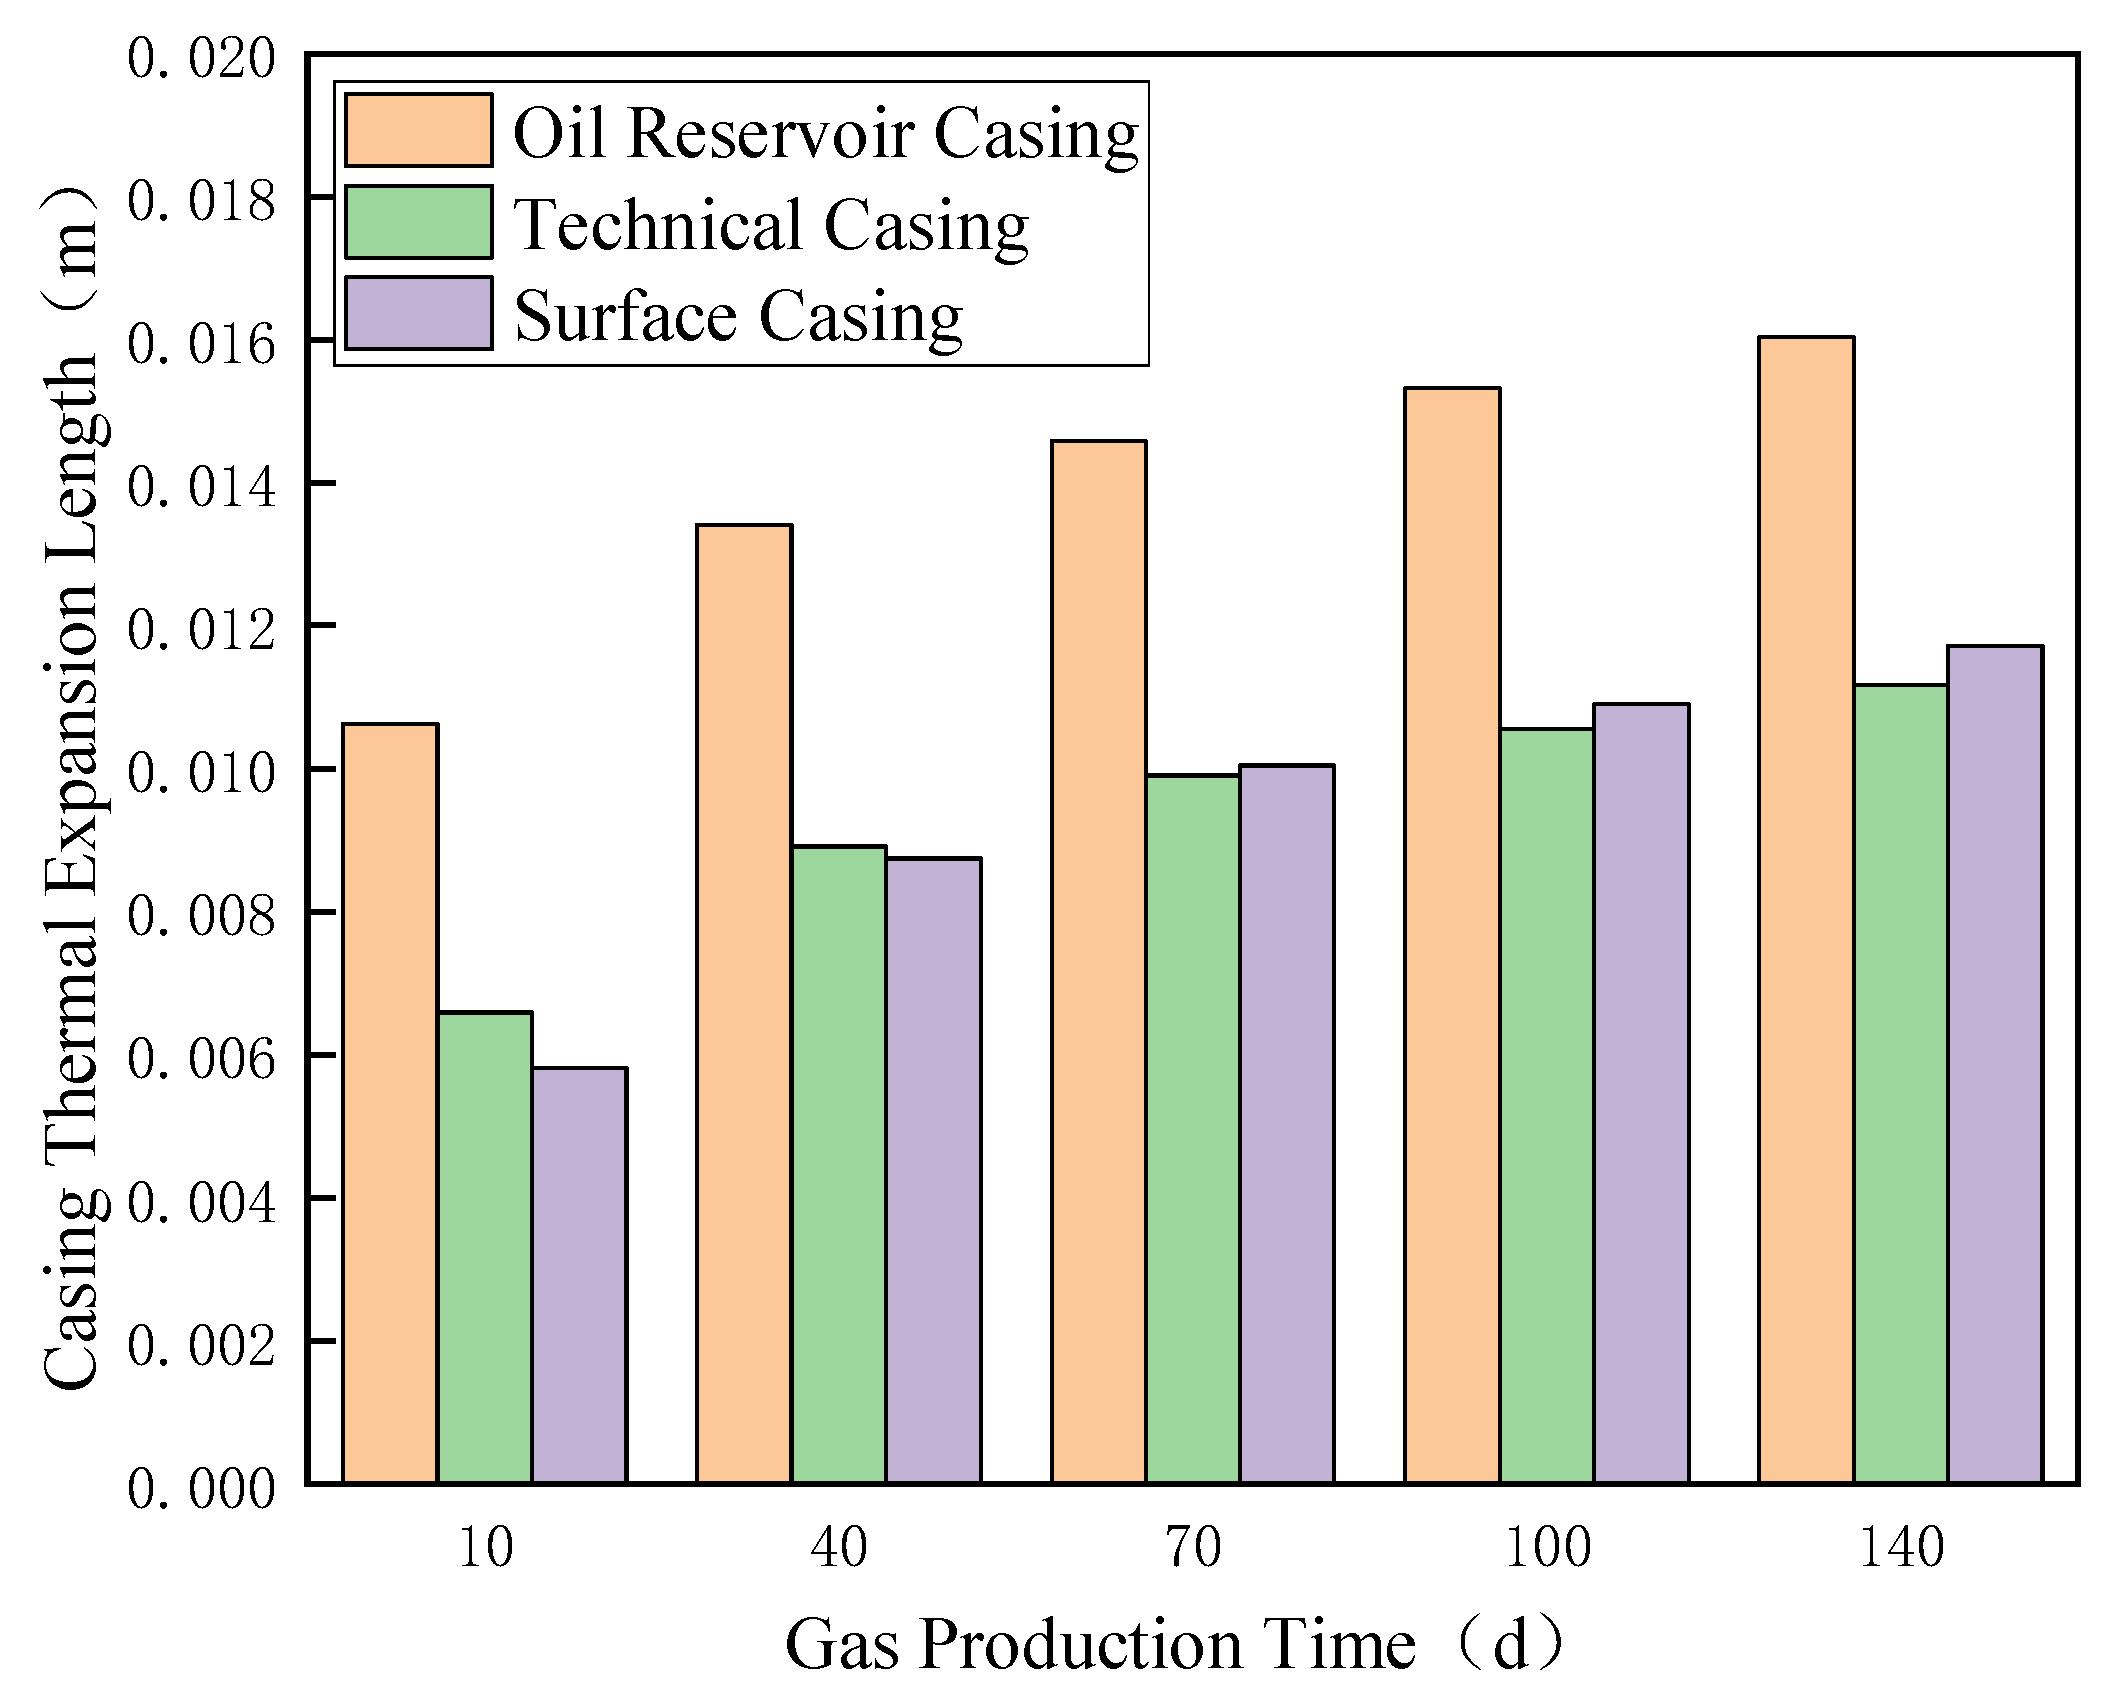
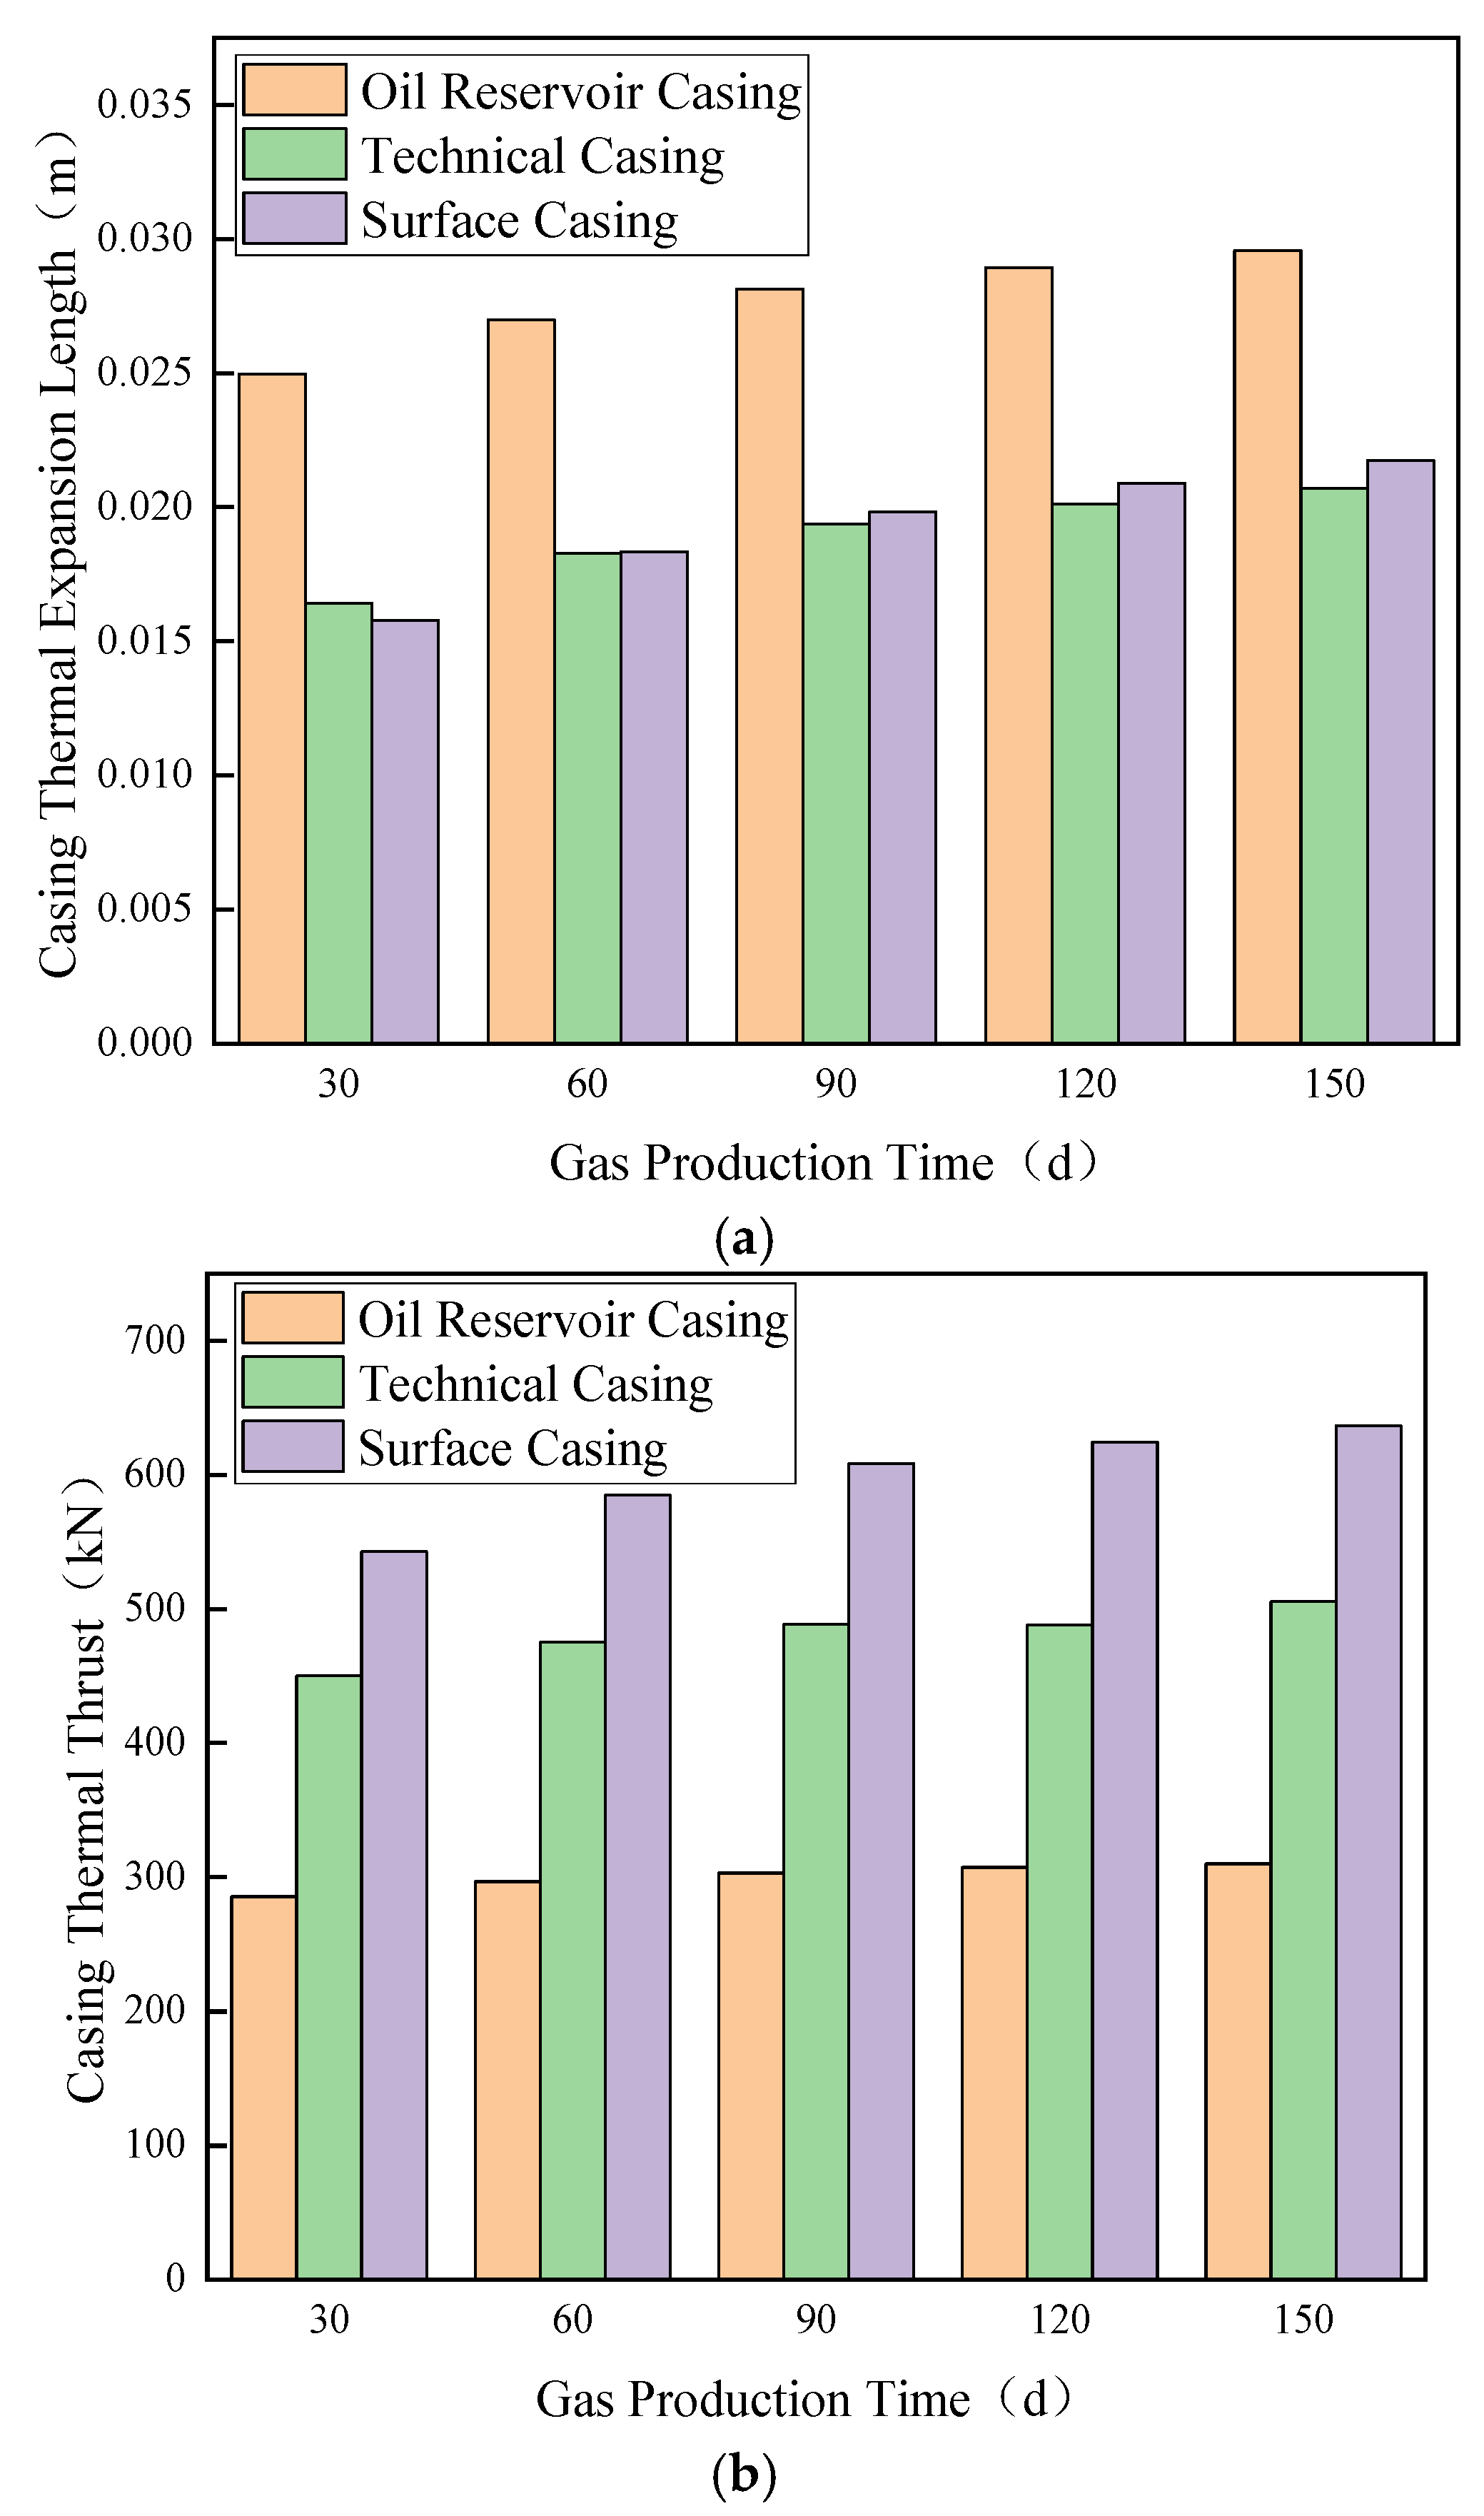
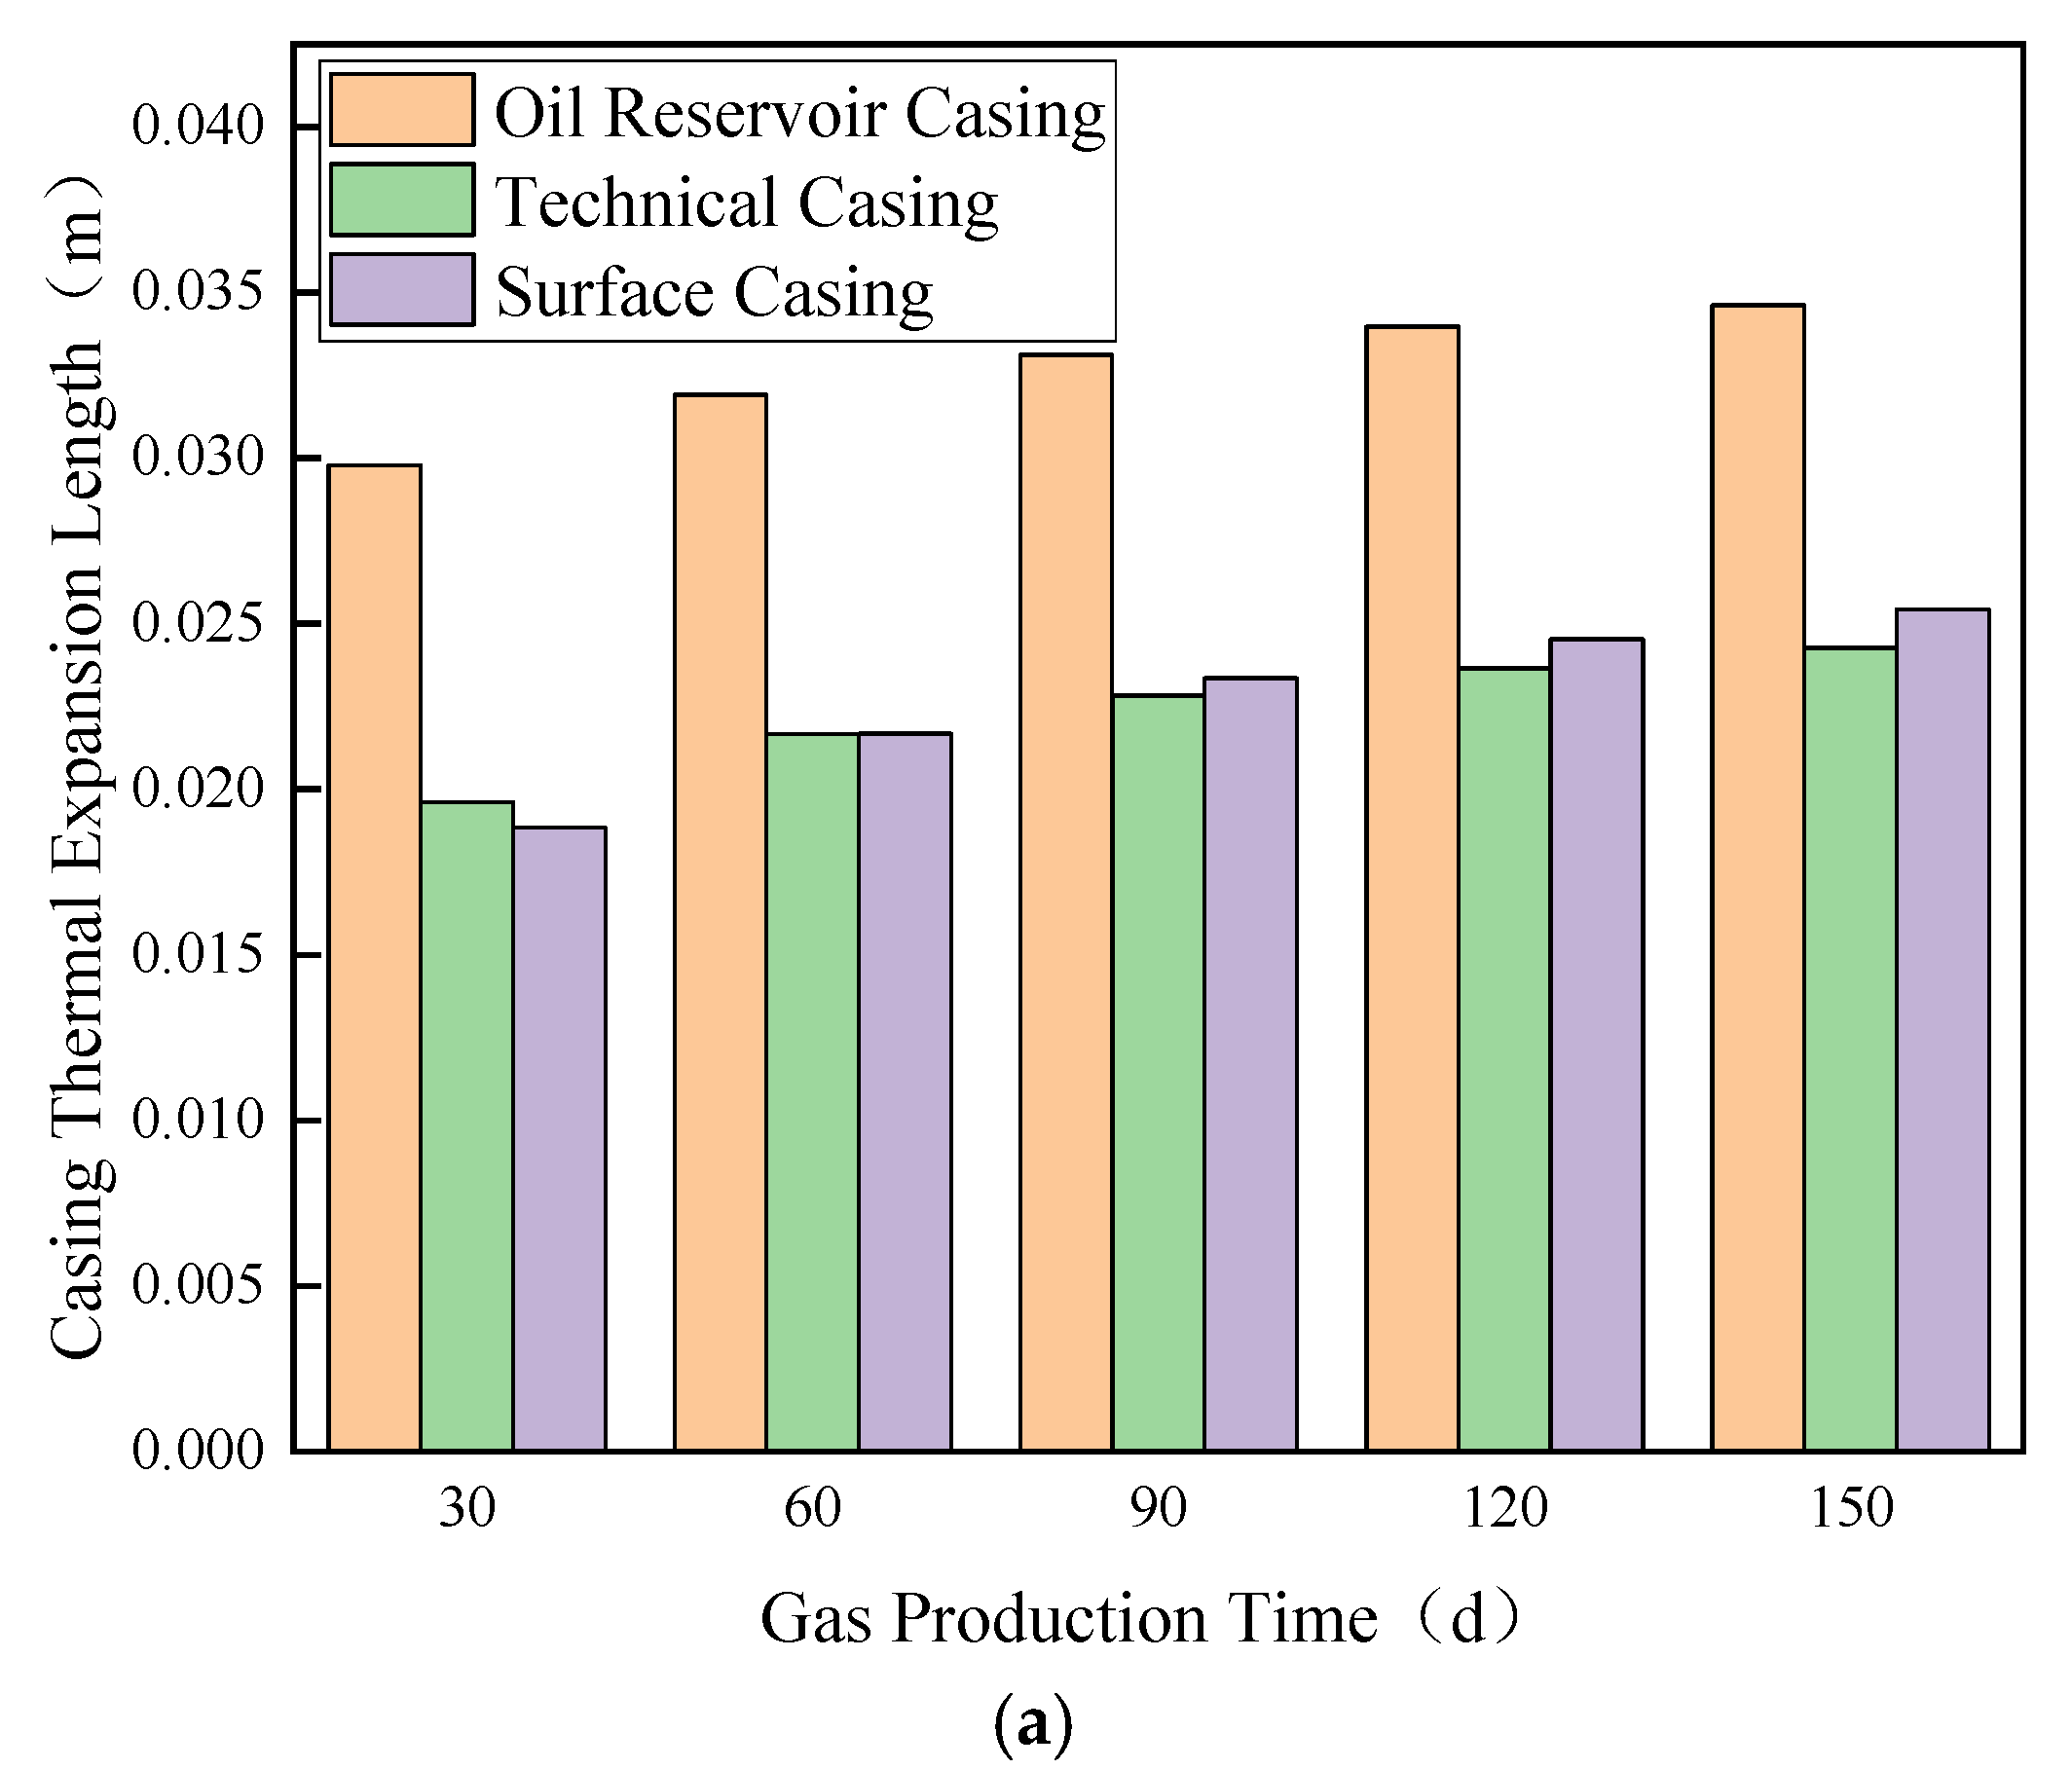
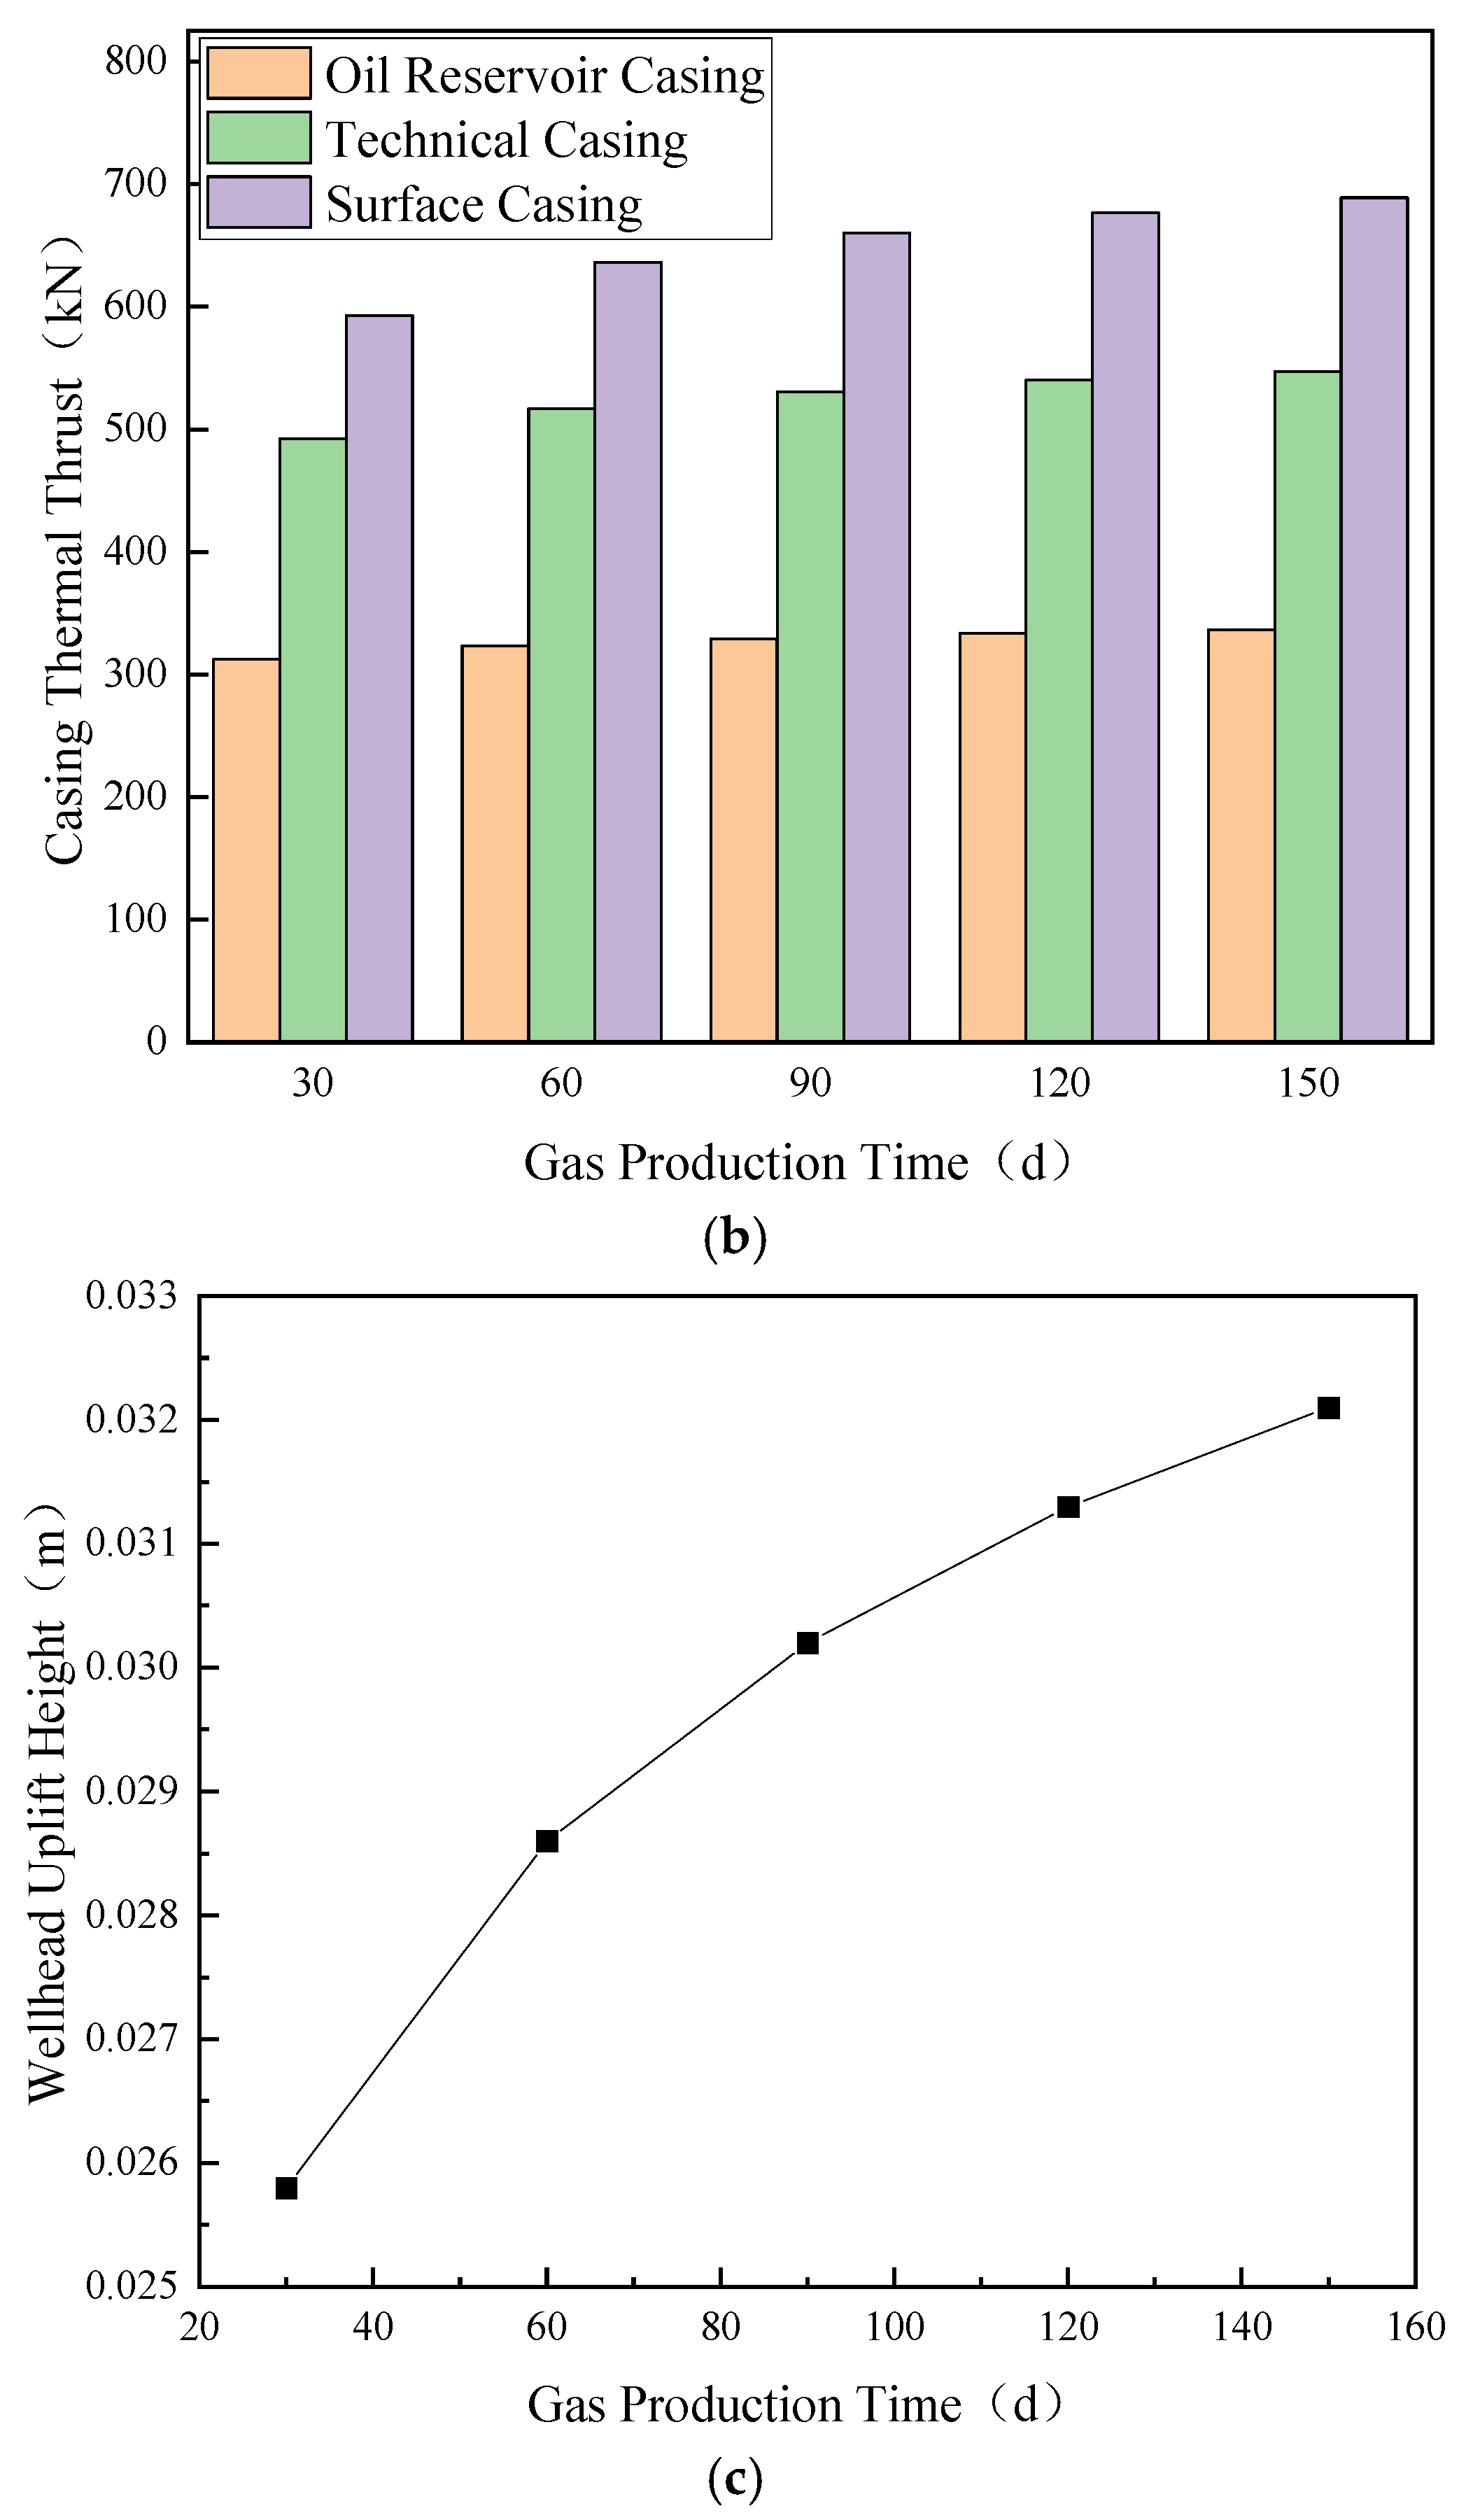
Figure 12 illustrates the effect of gas production time on thermal elongation of each casing layer, while Figure 13 demonstrates its impact on thermal thrust forces in these layers.
As shown in Figure 12 and Figure 13, the thermal elongation of each casing layer progressively increases with extended gas production duration. Notably, the oil layer casing exhibits significantly greater thermal elongation compared to the intermediate and surface casings, attributable to its more substantial temperature rise and unilateral frictional resistance from the cement sheath. Concurrently, thermal thrust forces in all casing layers also escalate with prolonged production time, following the sequence surface casing > intermediate casing > oil layer casing. This hierarchy underscores casing stiffness as the dominant factor influencing thermal expansion forces.
Figure 14 illustrates the temperature-induced wellhead elevation under a constant gas production rate of 20 × 104 m3/d. With fixed production volume, wellhead elevation exhibits a gradual increase as production duration extends, though the rate of elevation diminishes during prolonged production phases—a trend analogous to variations with gas production rate. Specific data points reveal a wellhead elevation of approximately 0.97 cm at 10 days of production, escalating to 1.6 cm after 140 days. These observations confirm that operational duration significantly impacts wellhead elevation, complementing the previously established influence of production rate.

4.2.2. Gas Injection Phase

(1) During gas injection, the elevated temperature of injected gas near the wellhead compared to the formation temperature leads to an increase in casing temperature. As formation depth increases, the formation temperature gradually rises. When the formation temperature exceeds the temperature of the gas inside the tubing, the wellbore temperature field begins to decrease.
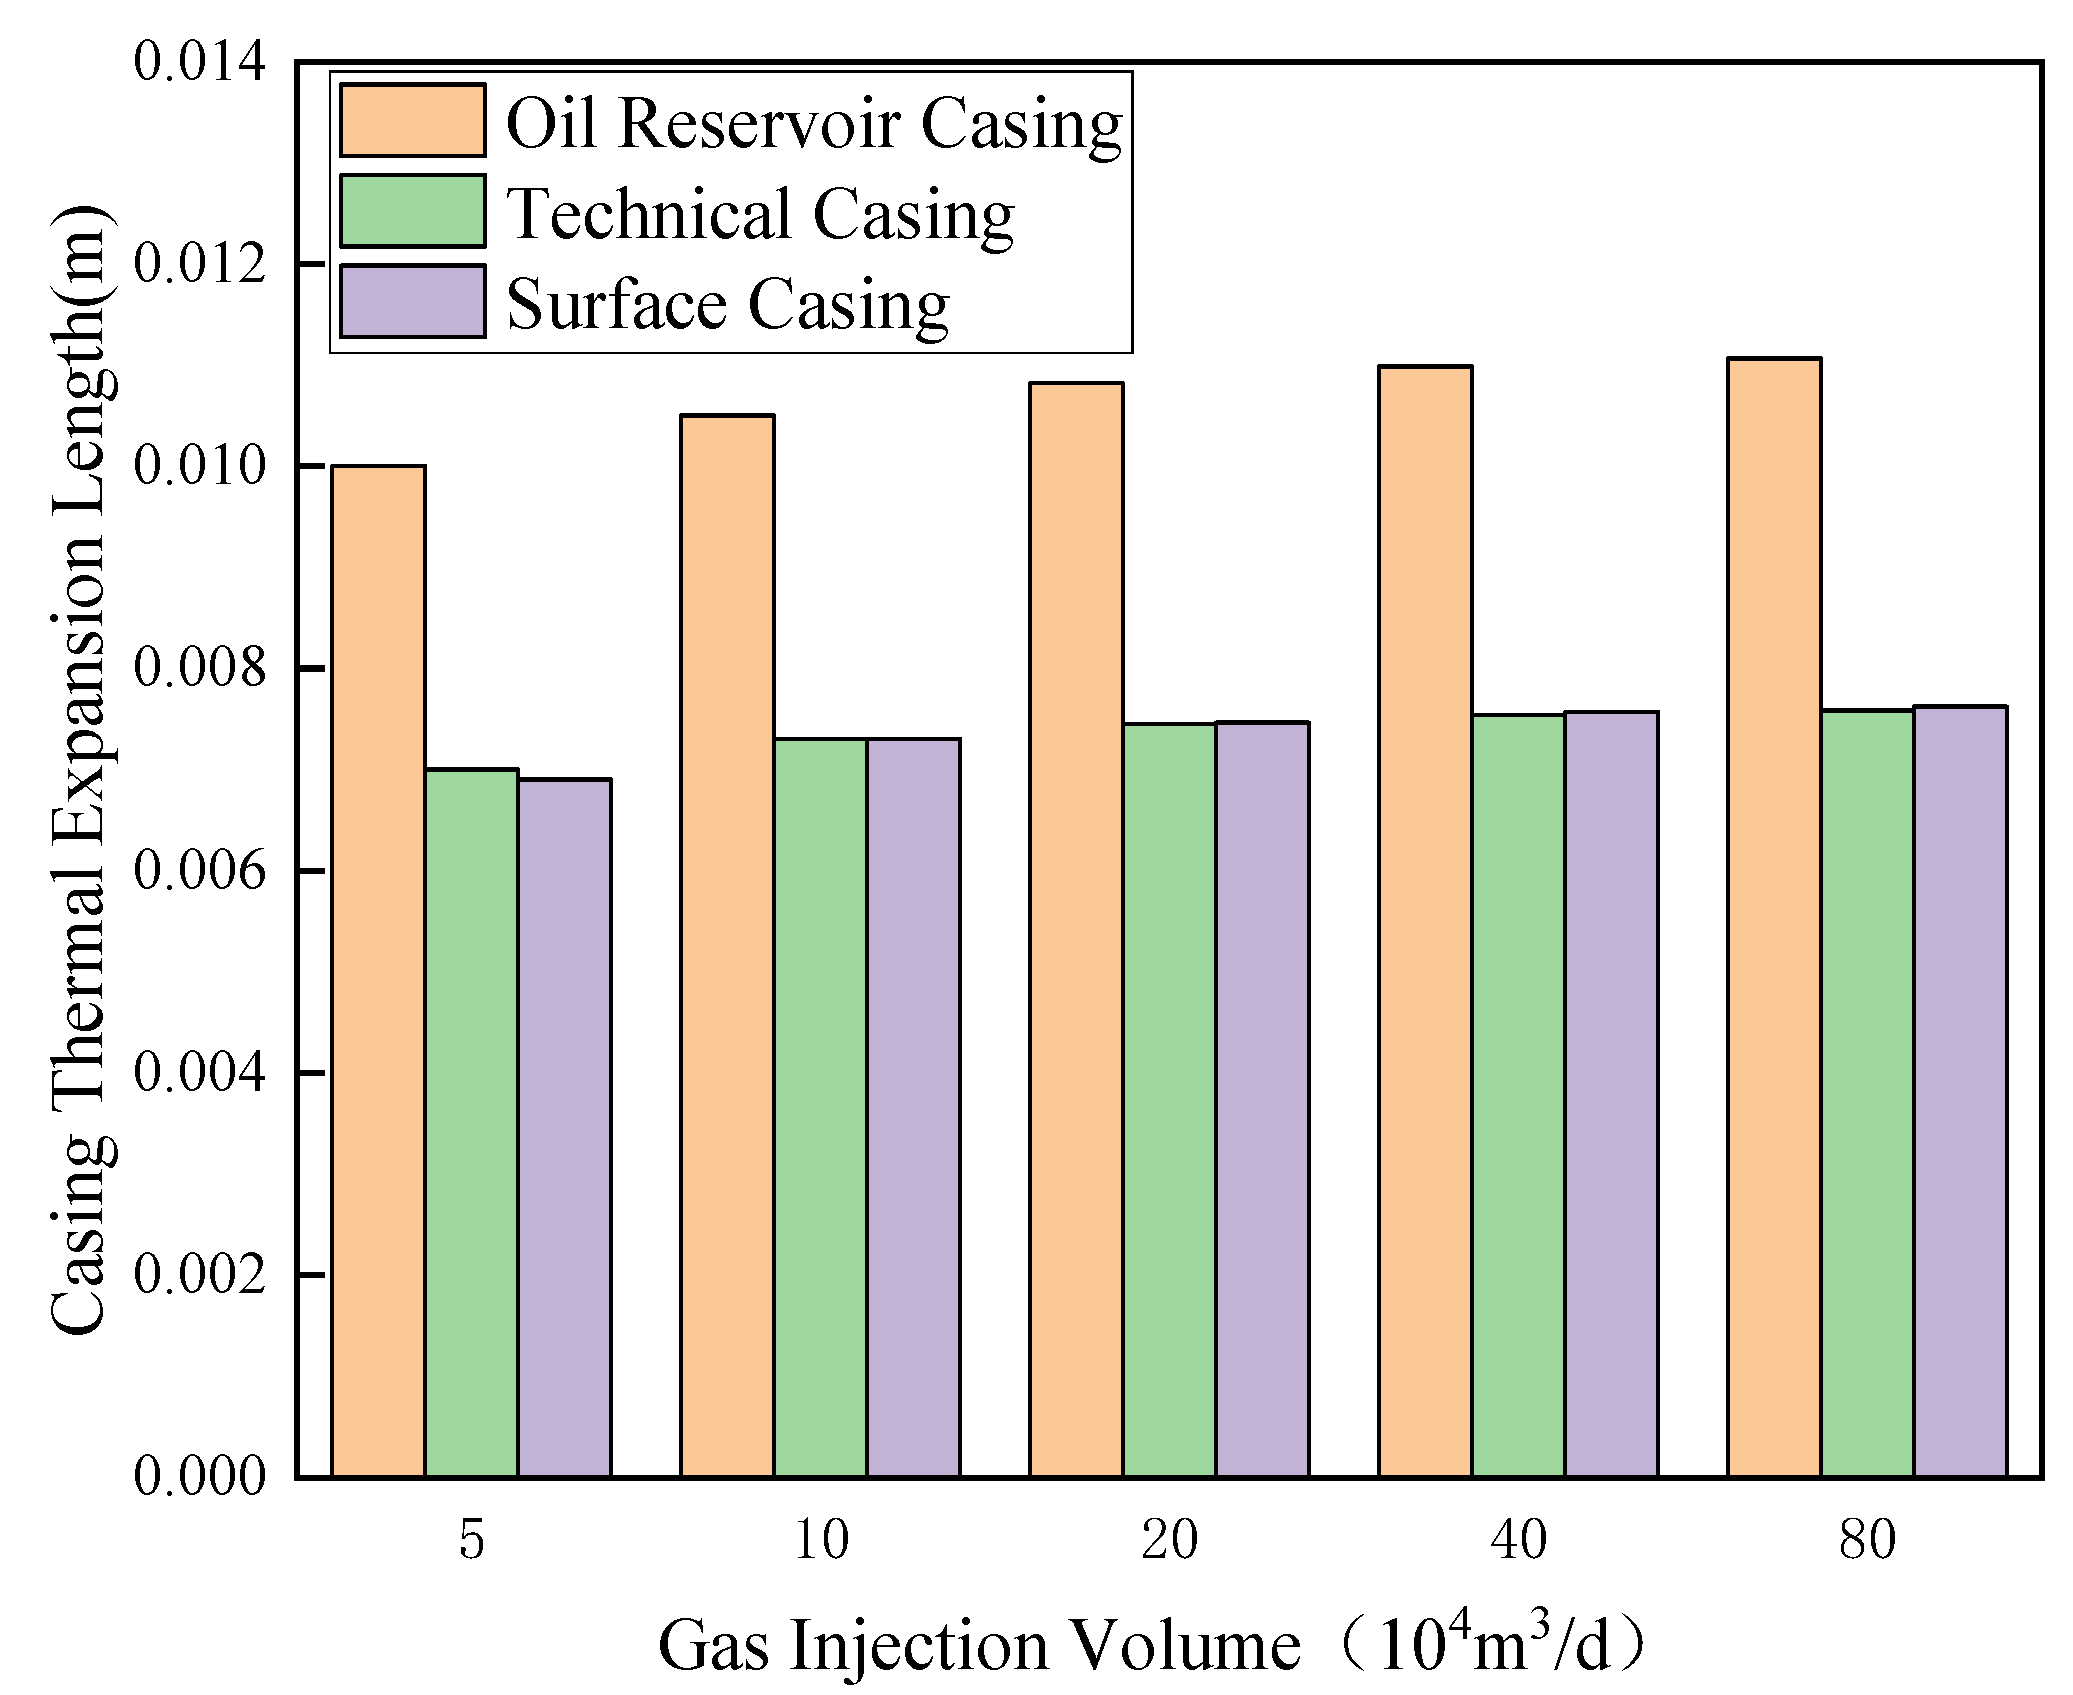
As shown in the Figure 15, the thermal elongation of all casing layers gradually increases with rising injection rates. The thermal elongation of the innermost oil layer casing is significantly greater than that of the technical casing and surface casing. This is because the oil layer casing experiences a greater temperature increase and is subject to cement sheath friction only on one side.
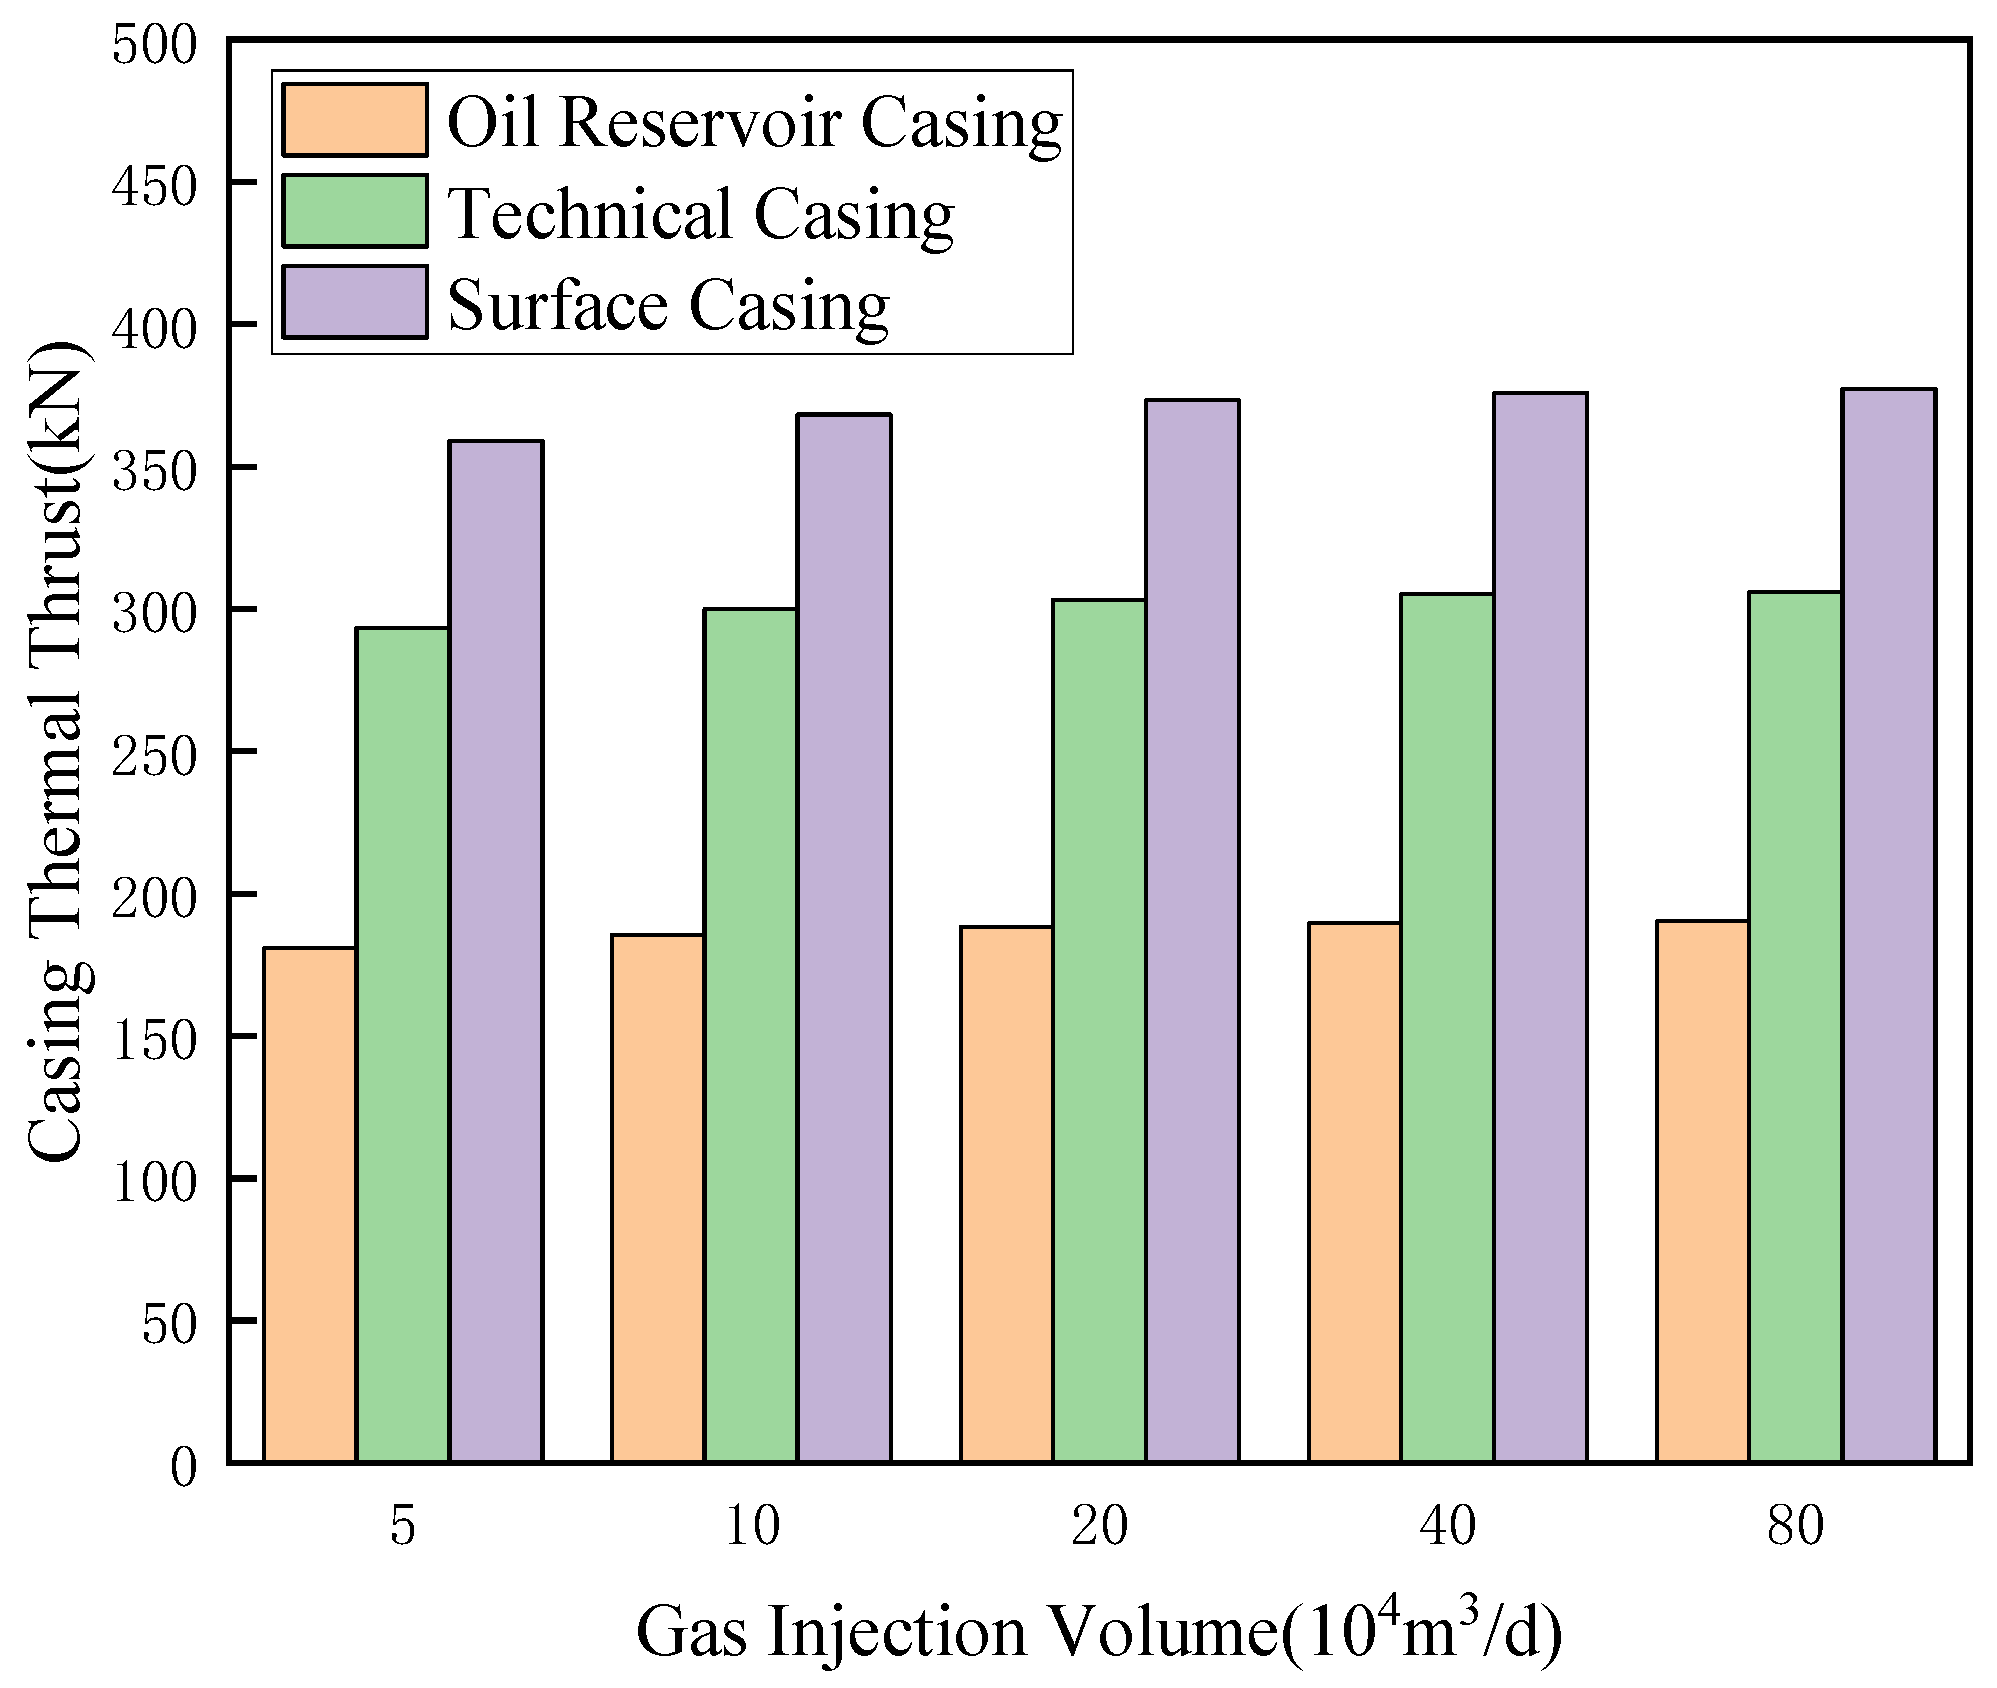
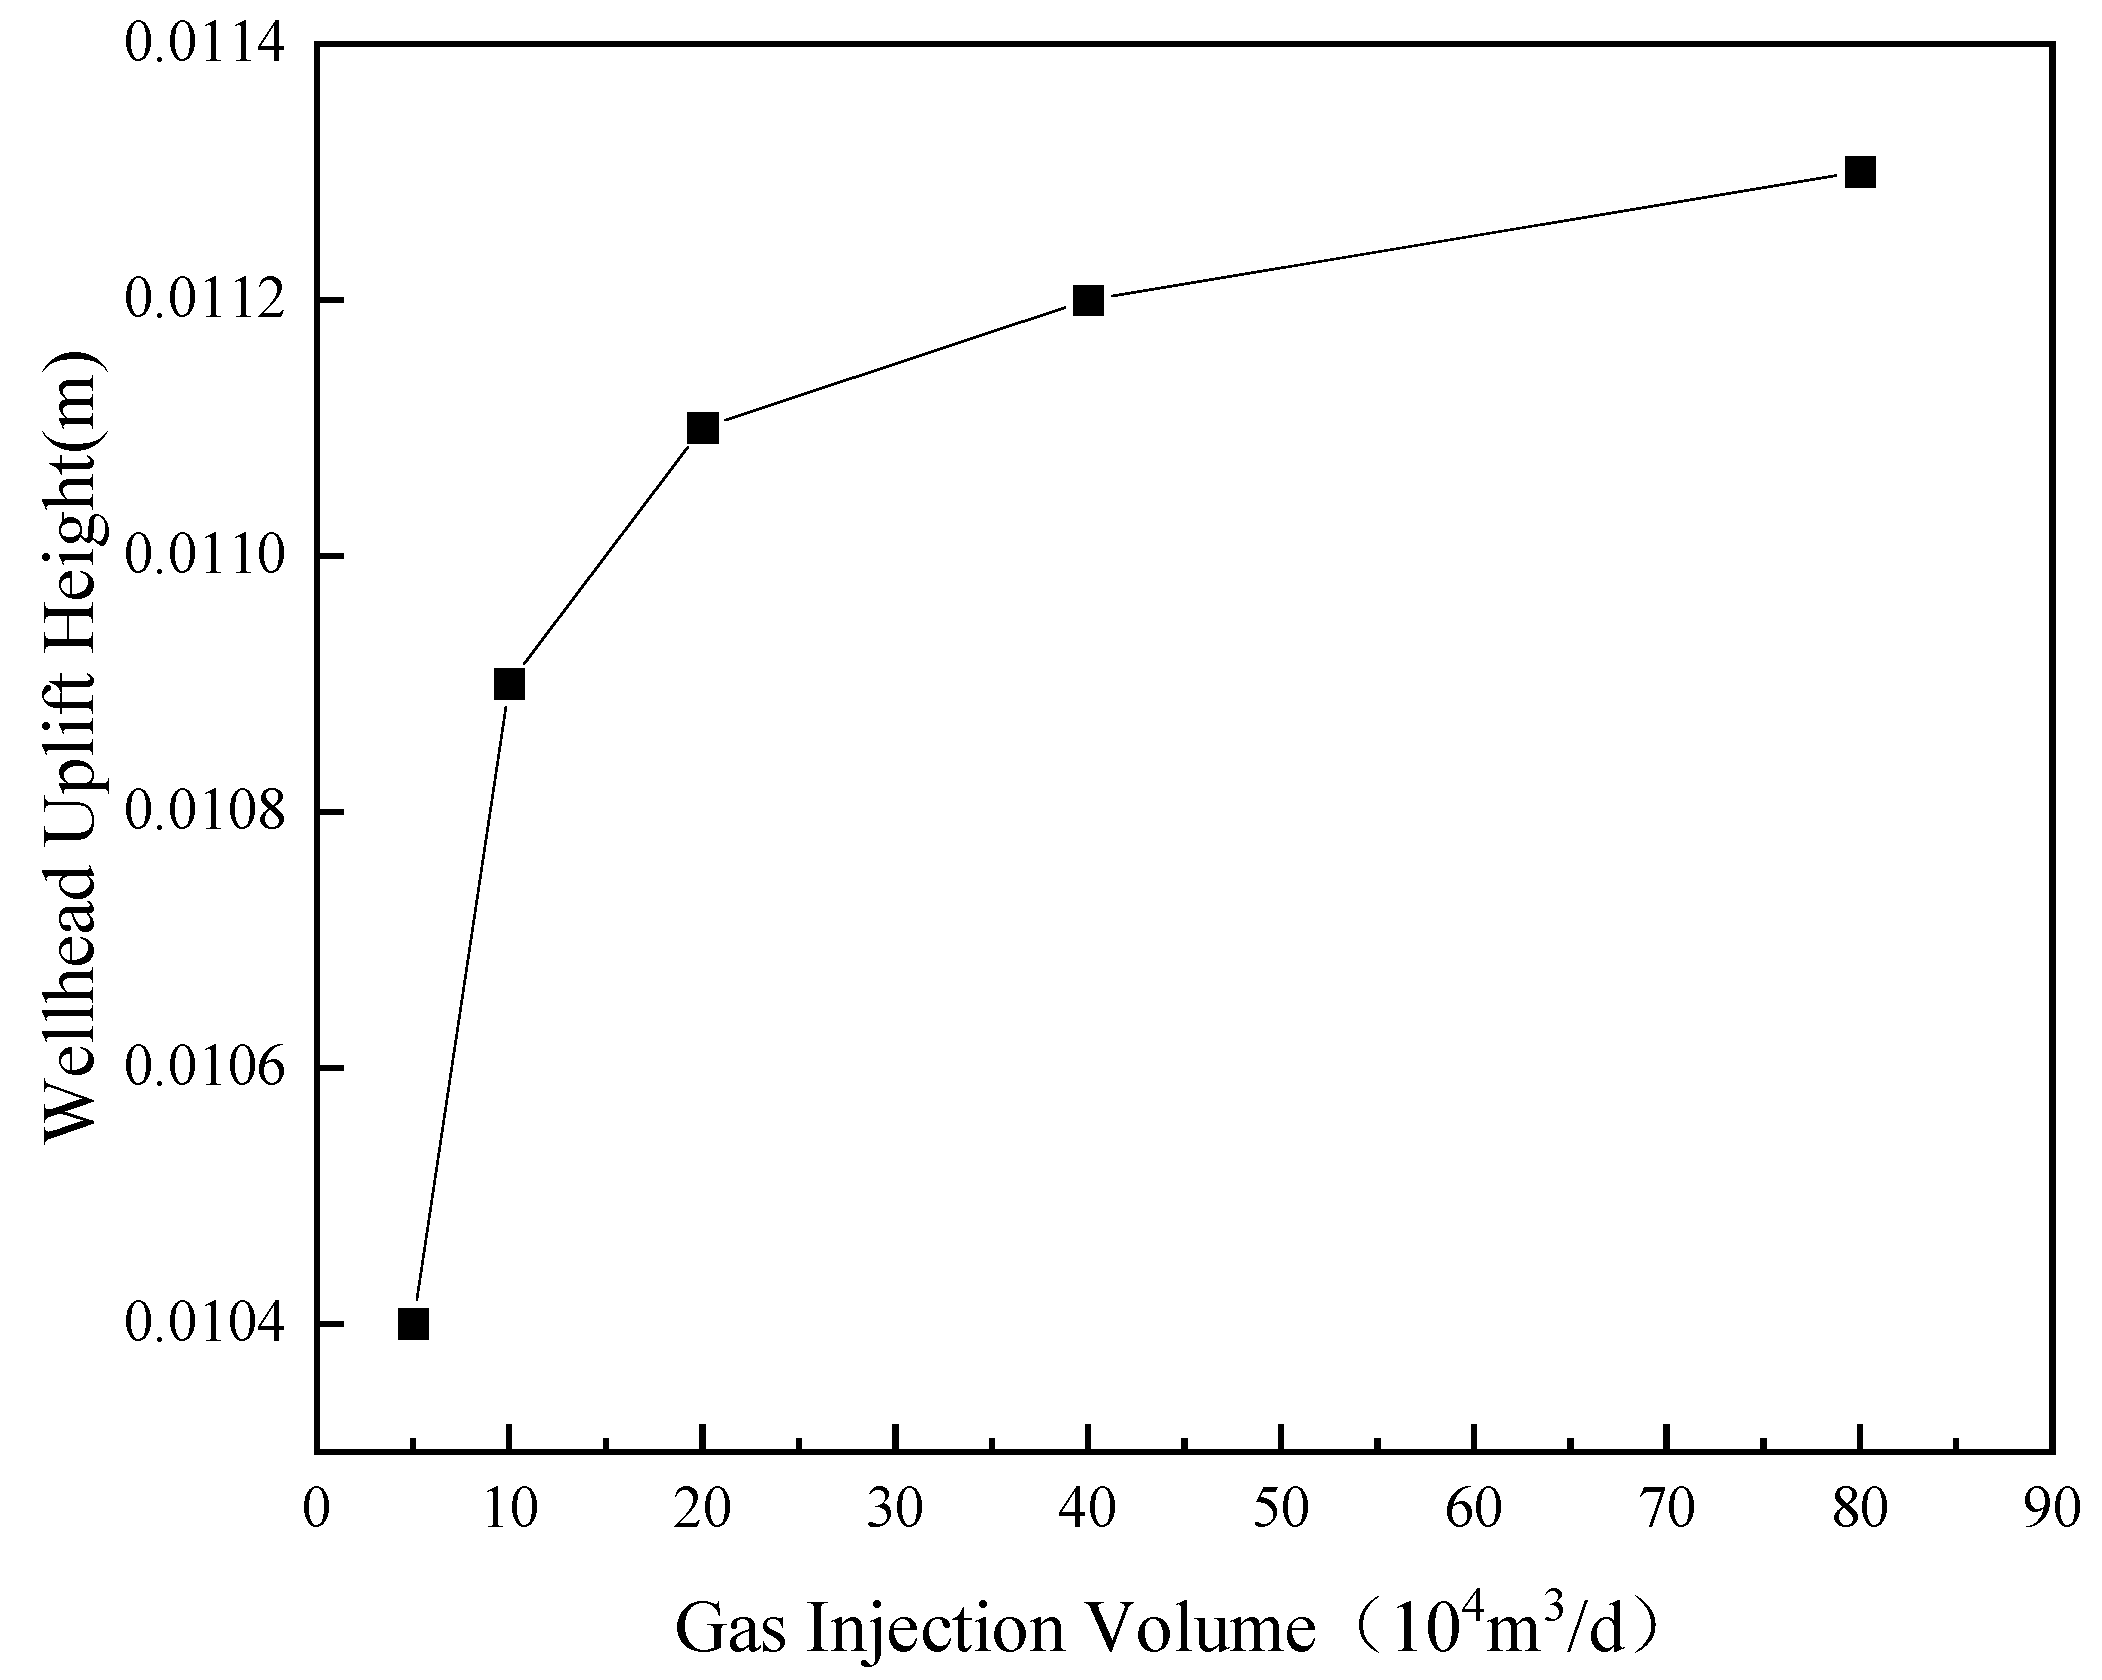
Figure 16 shows the impact of gas injection rate on the thermal thrust forces acting on each casing layer. The thermal thrust forces in all casing layers also increase with the injection rate. Among them, the surface casing experiences the highest thermal expansion force, followed by the technical casing and the oil layer casing. This indicates that casing stiffness has a significant influence on thermal expansion forces. Based on the obtained active segment lengths of these casings and further consideration of the end effects of the tubing string, the final wellhead elevation can be estimated using an overall stiffness model, as depicted in Figure 17.
As shown in Figure 17, at a gas injection rate of 5 × 10⁴ m3/d, the wellhead elevation is approximately 1.04 cm. The primary reason for this elevation is the higher temperature of the injected gas compared to the surface temperature, which heats the casing in the wellhead section. As the injection rate increases, the wellhead elevation gradually rises, but the rate of increase slows down at higher injection rates. At an injection rate of 80 × 104 m3/d, the wellhead elevation reaches 1.13 cm. These findings are consistent with the preliminary analysis of the temperature field, confirming that the gas injection rate is a key factor affecting wellhead elevation.
(2) The gas injection time is another critical factor influencing wellhead elevation. When the injection rate remains constant, longer injection durations result in higher wellbore temperatures and greater wellhead elevation.
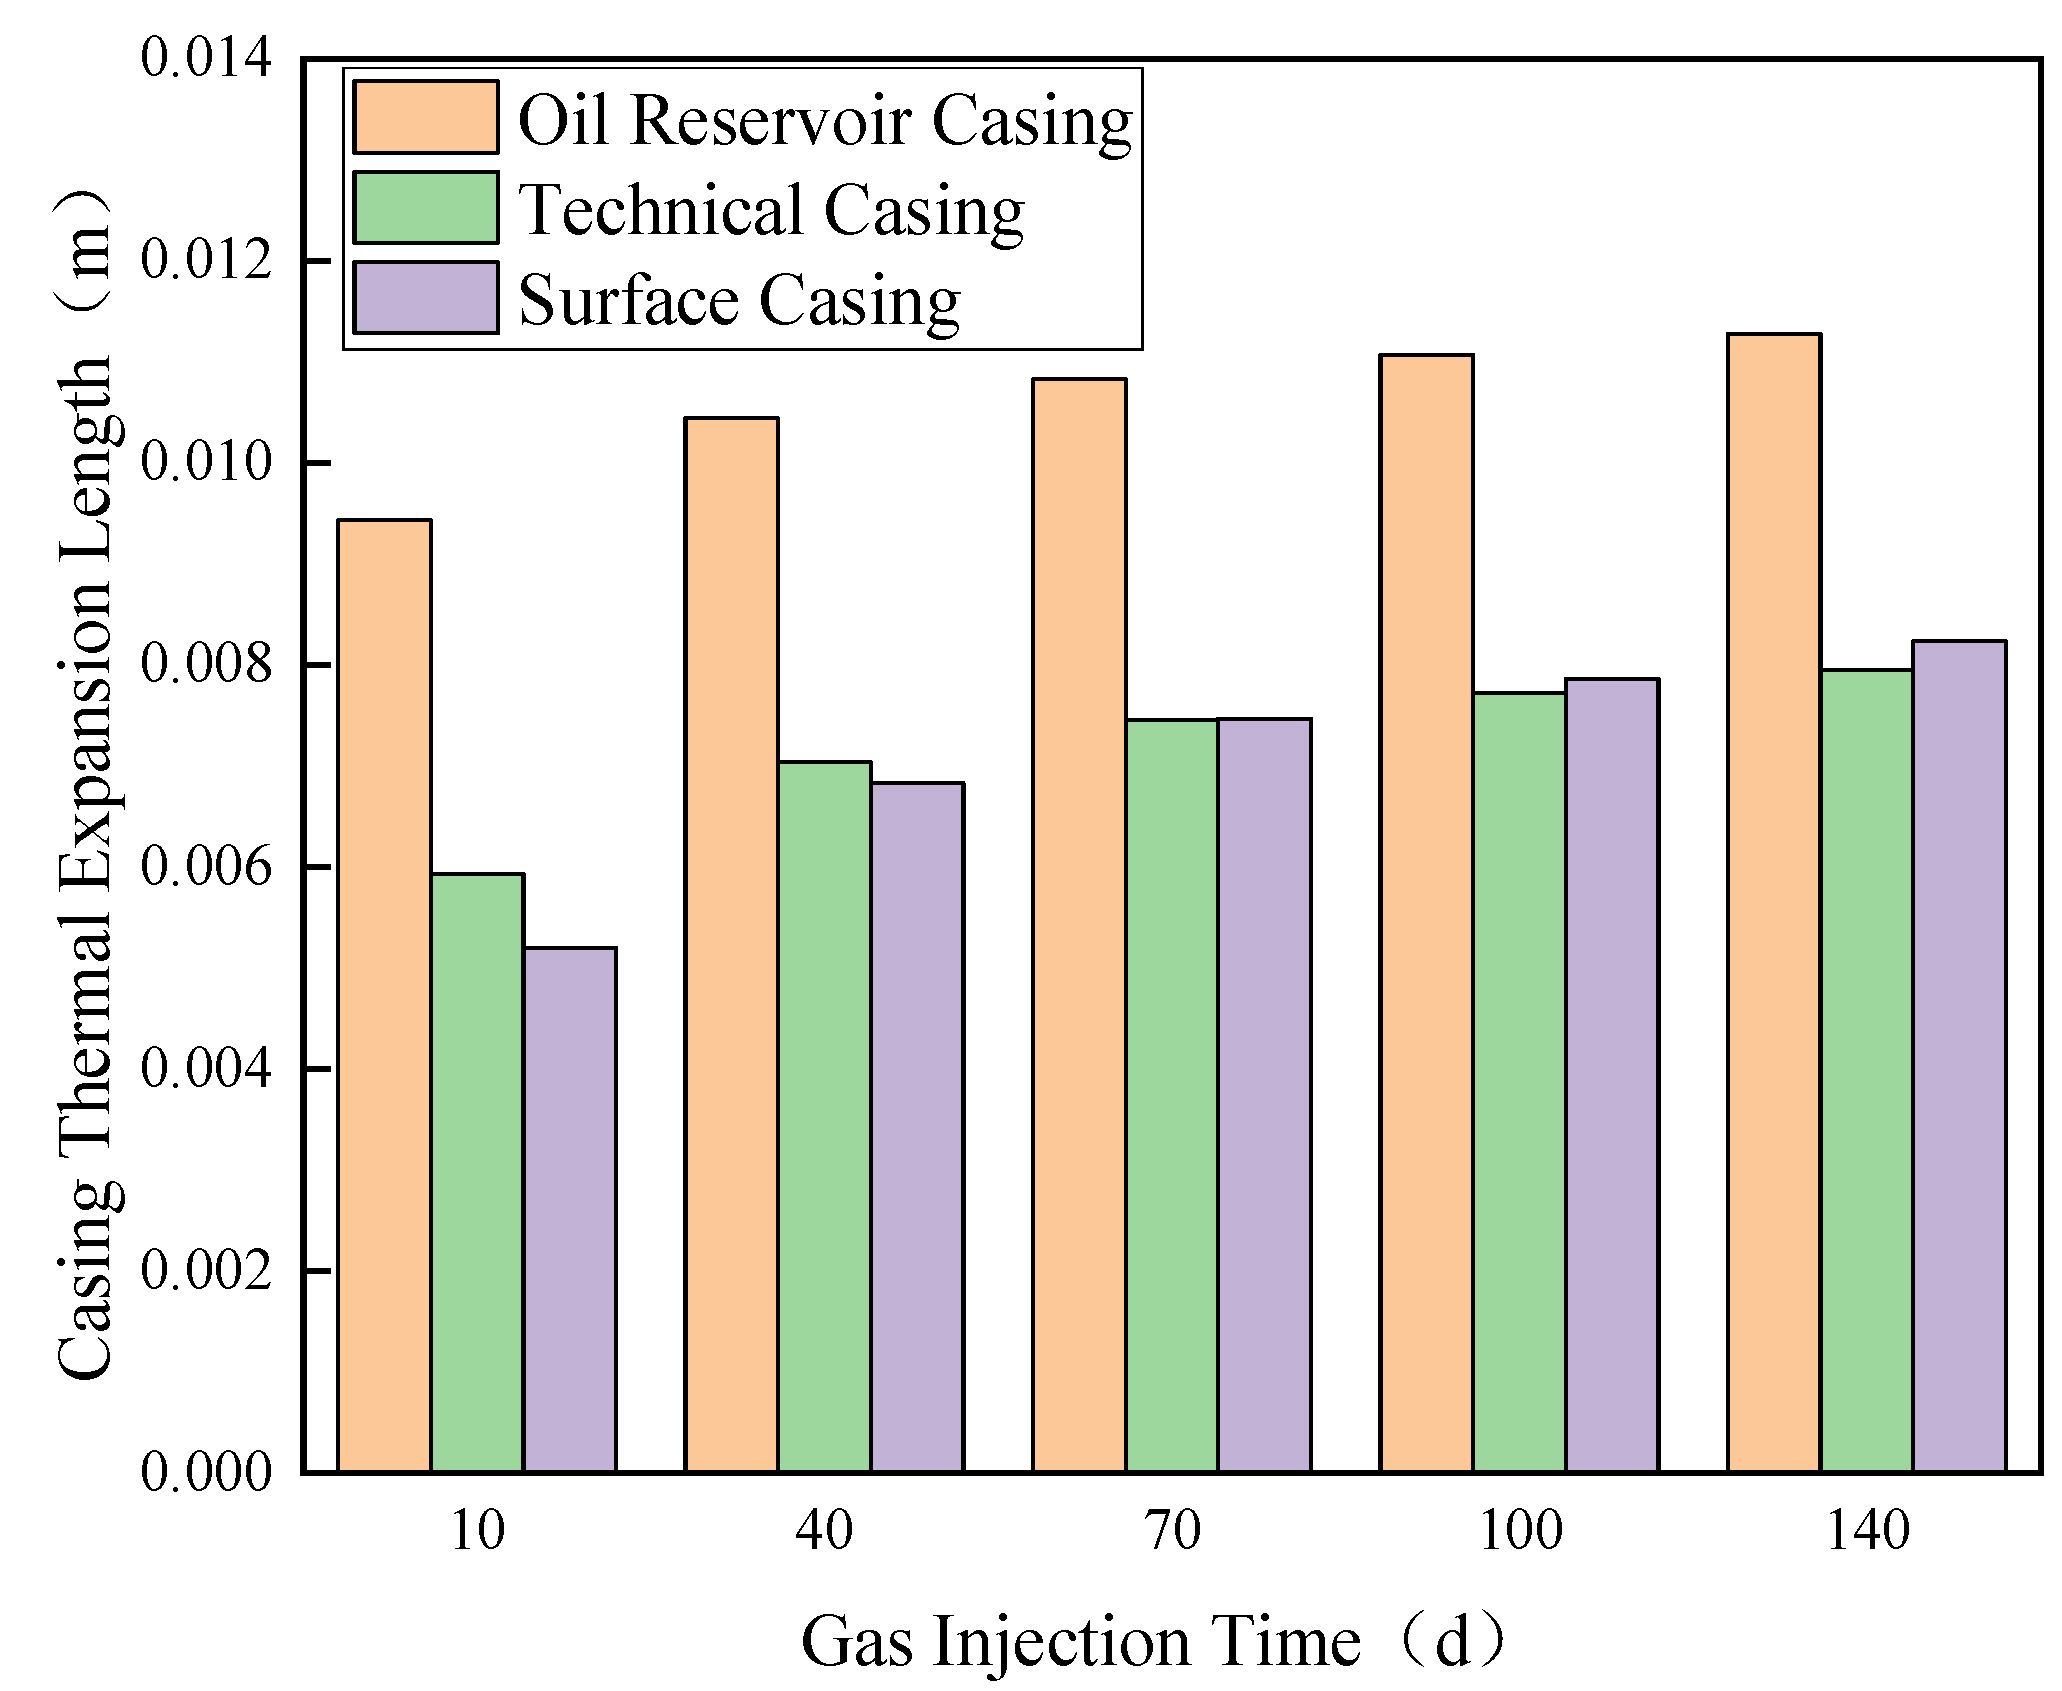
As shown in Figure 18, the thermal elongation of each layer of casing gradually increases with the extension of gas injection duration. The temperature rise amplitude of the oil layer casing is greater, resulting in its elongation being significantly larger than that of the intermediate casing and surface casing.
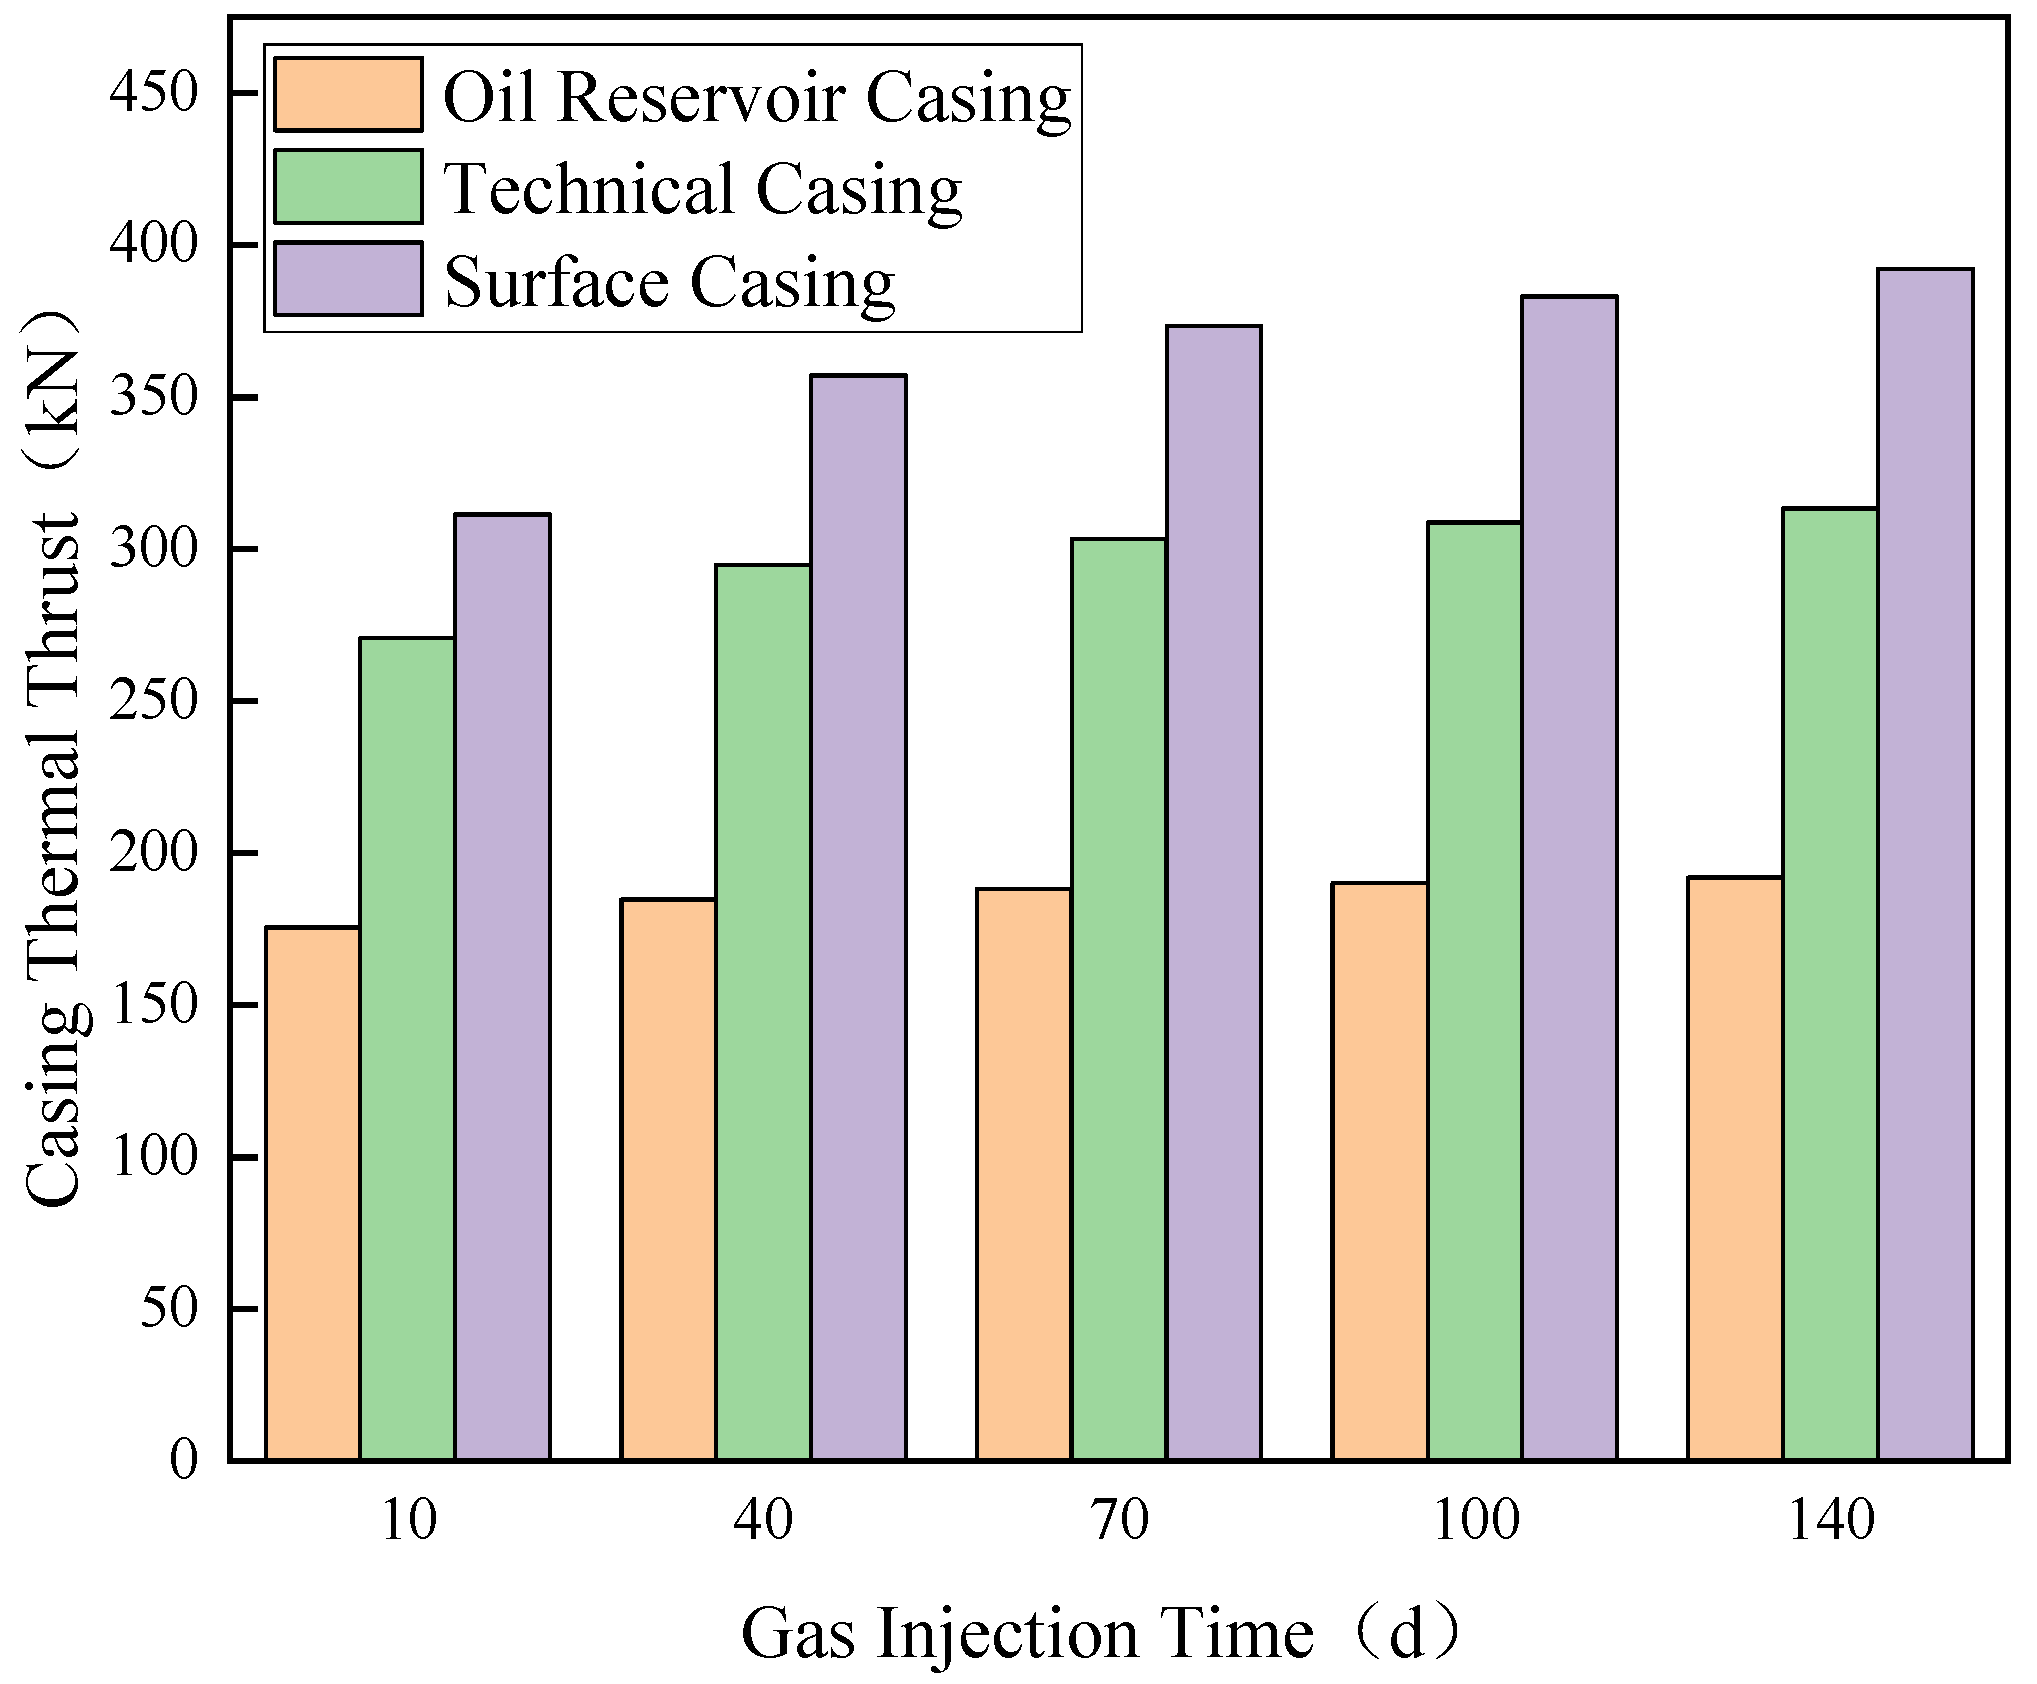
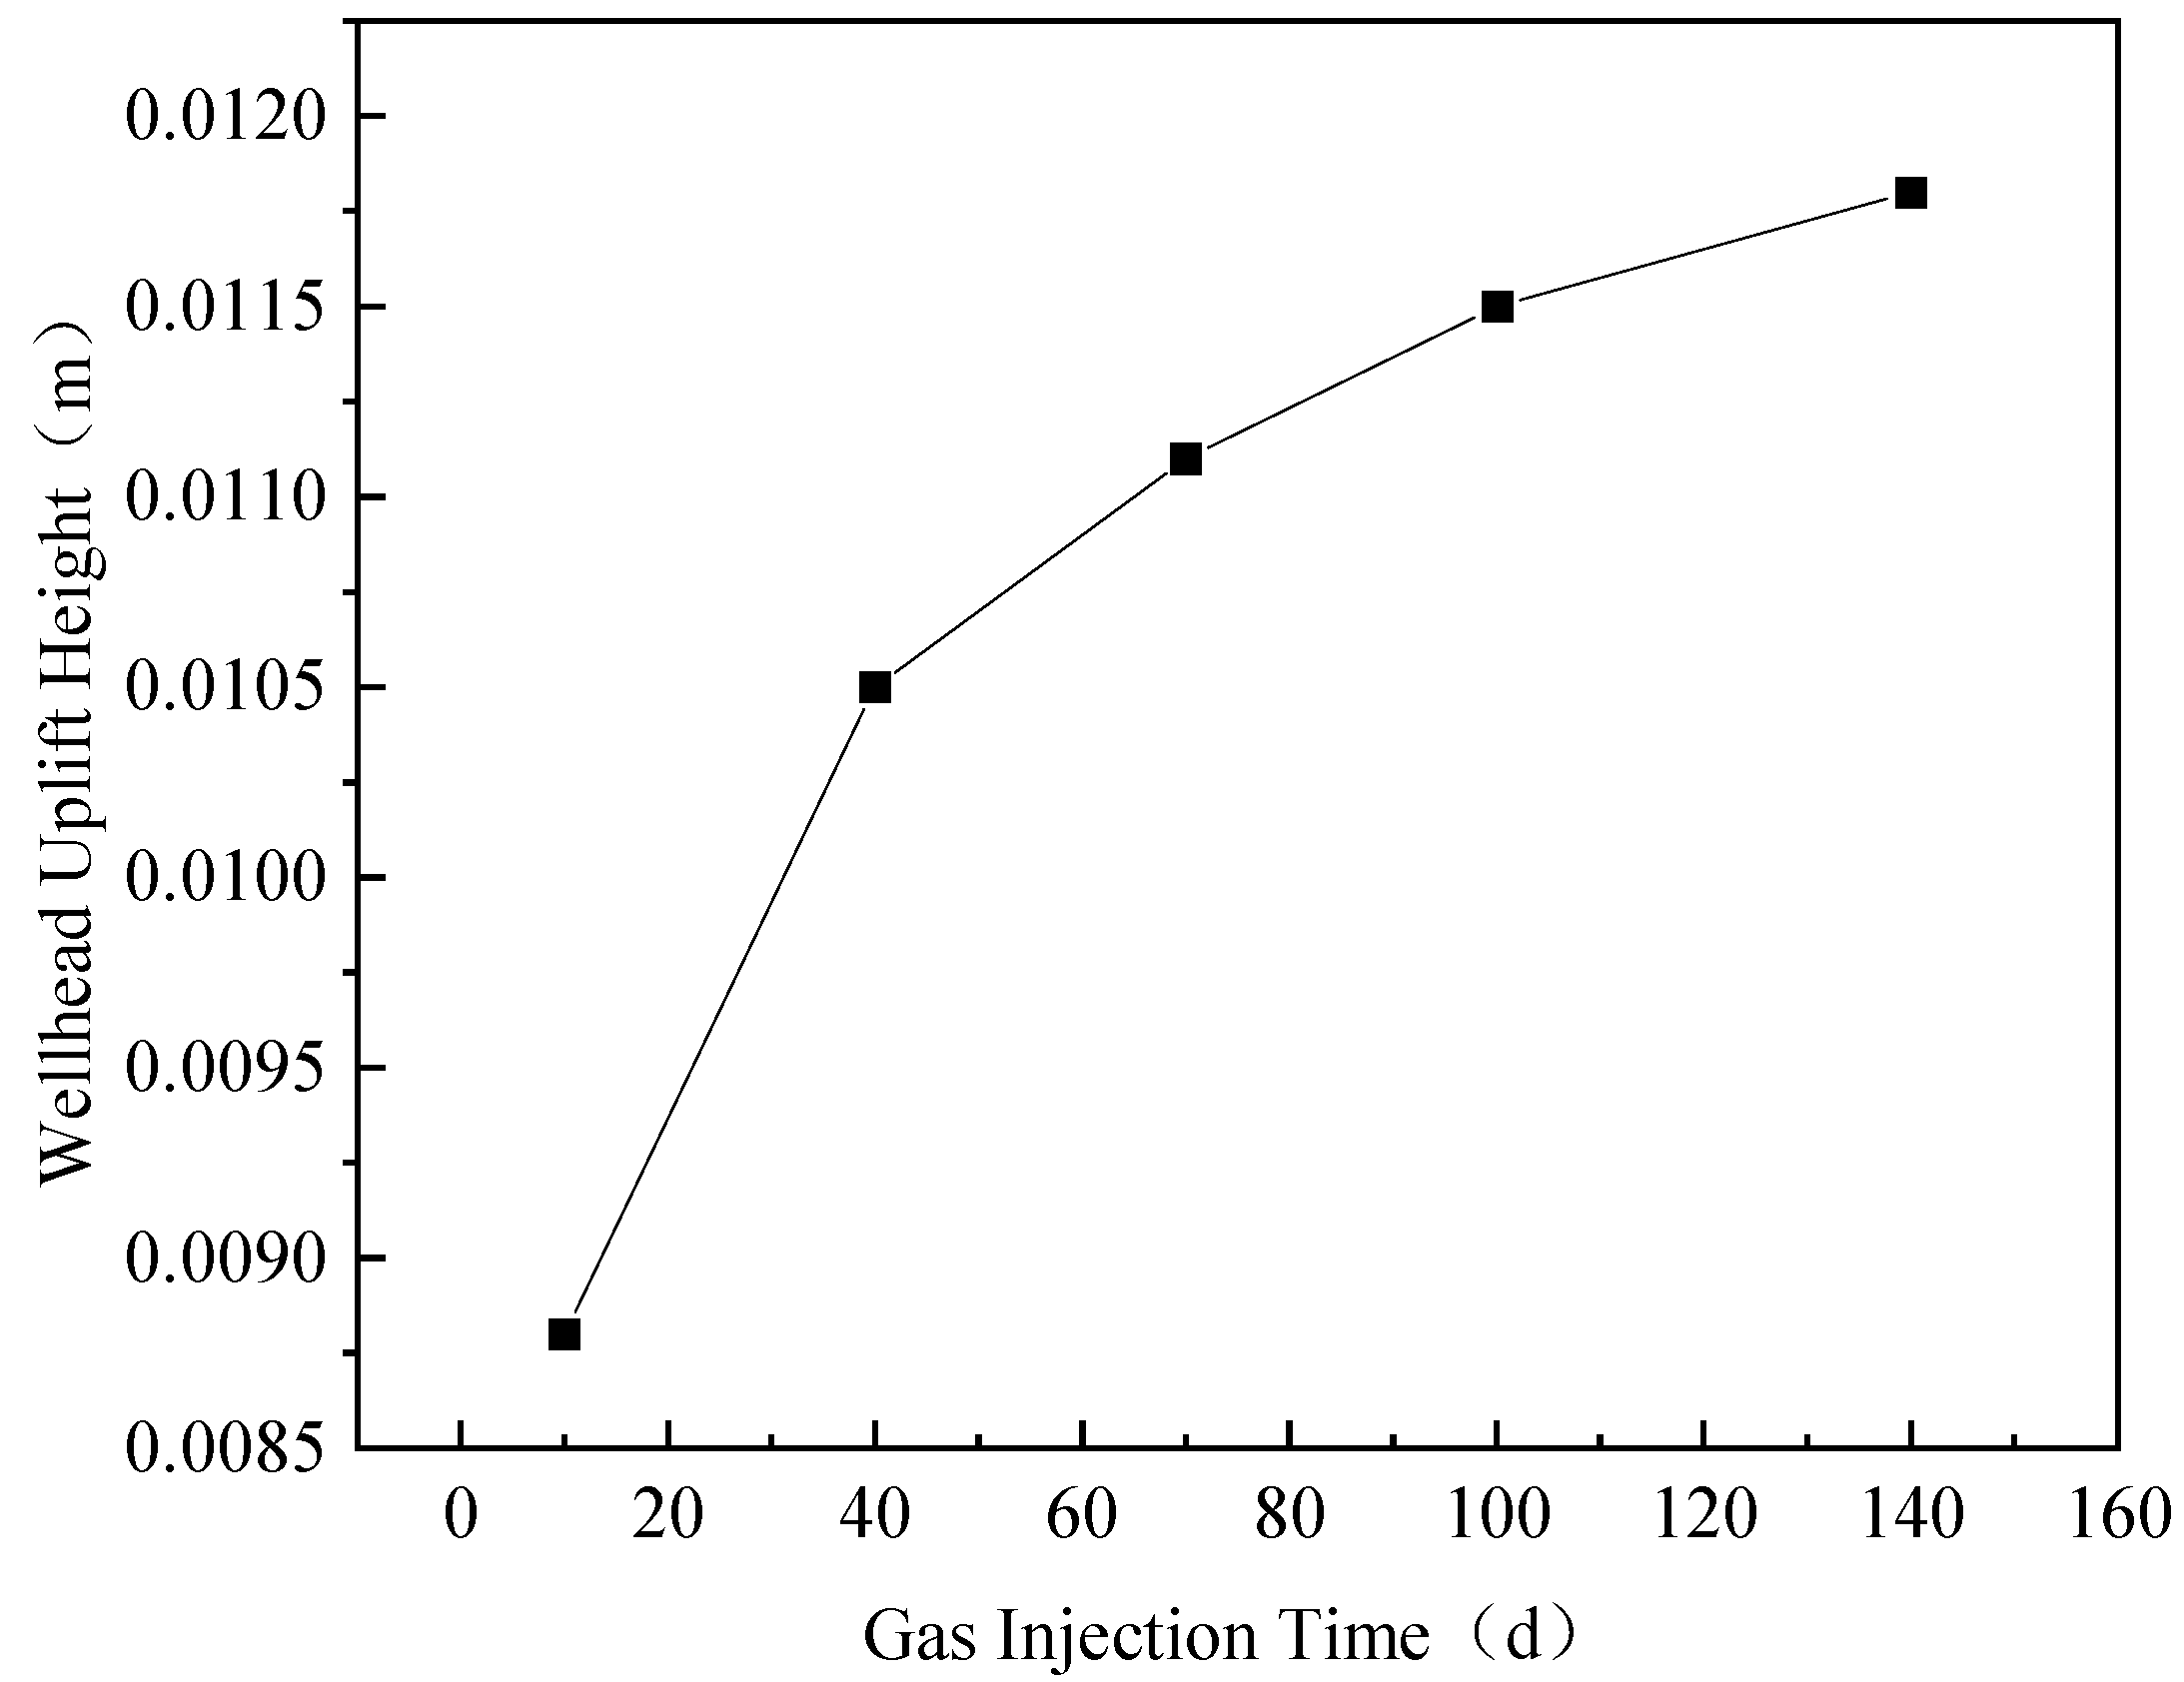
Figure 19 illustrates the effect of gas injection time on casing uplift force. As the gas injection time increases, the uplift force gradually increases. The wellhead elevation gradually increases with longer injection times. As shown in Figure 20, Similarly to the situation with varying injection rates, the rate of increase in wellhead elevation slows down during prolonged injection periods. At an injection time of 10 days, the wellhead elevation is approximately 0.88 cm, and it reaches 1.18 cm after 140 days of injection. This analysis confirms that the duration of gas injection operations also affects wellhead elevation.
(3) There is an impact of gas injection pressure on wellhead uplift. When the gas injection pressure changes, the variation in the wellbore temperature field is minimal. As illustrated in Figure 21, taking the oil reservoir casing as an example, under constant gas injection time and volume conditions, the temperature fluctuation of the oil reservoir casing is negligible. Since temperature serves as the fundamental driving factor for wellhead uplift, the influence of gas injection pressure on wellhead uplift can be considered negligible.

4.3. Prediction of Wellhead Elevation Under Different Operating Conditions

To meet seasonal demand variations for heating and power generation, gas storage reservoirs often operate under high-production conditions. According to the daily report of Reservoir A-6, the average daily gas production rate during winter is 43 × 104 m3/d, which is designated as the normal production condition. The feasible production rate range, considering factors such as comprehensive nodal analysis, critical erosion flow rate, and critical liquid carrying flow rate, is 35–52 × 104 m3/d. Therefore, 60 × 104 m3/d is regarded as the extreme production condition for emergency peak shaving. Wellhead elevations under these two conditions are predicted for different production durations.

4.3.1. Normal Condition Analysis

The gas production period for this reservoir spans from November to March of the following year, lasting 150 days. The wellhead elevation is calculated for a daily gas production rate of 43 × 104 m3/d across various production durations.
First, the thermal elongation of the casing is analyzed. As shown in Figure 22, at a daily production rate of 43 × 104 m3/d, the casing thermal elongation increases most significantly in the first 30 days. As time progresses, the wellbore temperature field gradually stabilizes, and the rate of temperature rise slows down, leading to a gradual decrease in the rate of casing thermal elongation. Similarly, both the casing thermal thrust force and wellhead elevation exhibit an upward trend that gradually slows down with increasing production time. After 30 days of production, the predicted wellhead elevation is 2.2 cm, and by the end of the 150-day production cycle, the maximum elevation reaches 2.78 cm.

4.3.2. Extreme Condition Analysis

In emergency peak-shaving scenarios, the daily gas production rate often exceeds normal levels. Therefore, the wellhead elevation is calculated for a daily production rate of 60 × 104 m3/d across various production durations.
As production time increases, both the thermal elongation and thermal thrust force of individual casing layers show an upward trend. Compared to normal production conditions, these parameters are significantly higher under extreme production conditions. As shown in Figure 23, After 30 days of production under extreme conditions, the predicted wellhead elevation is 2.58 cm. If production continues for 150 days, the wellhead elevation is expected to exceed 3 cm, reaching 3.21 cm.

5. Conclusions

This paper establishes a differential equation model coupling temperature gradients, pressure gradients, flow velocity gradients, and density gradients during the well-opening stage. It calculates gas flow parameters at different depths and obtains the temperature distribution along the wellbore. Considering the failure of cement sheath bonding near the wellhead under full-well cementing conditions and the resulting frictional constraints on the casing, a model for predicting wellhead elevation is developed. The model analyzes the injection and production factors affecting wellhead elevation and predicts the wellhead elevation under different operating conditions. By applying this model to predict and analyze the injection and production of well A-6 in a gas storage reservoir, the following conclusions are drawn:
(1)
During gas injection, the elevated temperature of injected gas near the wellhead compared to the formation temperature leads to an increase in casing temperature. As formation depth increases, the formation temperature gradually rises. When the formation temperature exceeds the temperature of the gas inside the tubing, the wellbore temperature field begins to decrease.
(2)
Based on the wellbore temperature field calculation model and the wellhead elevation prediction model, the wellhead elevation during the gas injection phase of well A-6 is calculated. The model is validated using field data, providing a reference for predicting wellhead elevation in practical applications.
(3)
By analyzing dynamic parameters such as gas production time, production rate, gas injection time, and injection rate, key factors influencing wellhead elevation are identified. Wellhead elevations under normal and extreme production conditions are predicted.
(4)
Based on the prediction of wellhead uplift height and in consideration of enterprise production requirements, production rates should be appropriately reduced when the calculated uplift height is relatively high, ensuring the stable and safe operation of injection and production wells.

Author Contributions

Investigation, methodology, validation, and writing—original draft, Z.S.; data curation and writing—review and editing, J.W.; supervision, conceptualization, and software, G.Z.; formal analysis, F.G.; data curation, J.C.; visualization, S.J. All authors have read and agreed to the published version of the manuscript.

Funding

Key Science and Technology Projects for Basic and Prospective Research of CNPC (No.: 2023ZZ11); State Key Technology Research Project (2023YFB3711700).

Data Availability Statement

Data are not available as the relevant dataset for oil and gas field companies was used.

Conflicts of Interest

Authors Zhaoxi Shen and Jianjun Wang were employed by the company State Key Laboratory of Oil and Gas Equipment, Tubular Goods Research Institute, CNPC. Author Gang Zhao was employed by the company Tianjin Gas Storage Branch, PetroChina Dagang Oilfield Company. Author Junfeng Cao was employed by the company PetroChina Changqing Oilfield Branch Production and Operation Department. The remaining authors declare that the research was conducted in the absence of any commercial or financial relationships that could be construed as a potential conflict of interest.

References

  1. Miao, J.; Qin, H.Y.; Dai, J.; Jiang, X.D.; Shi, J. Analysis of influencing factors and countermeasures for wellhead uplift in deepwater gas fields. Offshore Oil 2023, 43, 94–98. [Google Scholar]
  2. Zheng, S.J.; Xie, R.J.; Huang, Z.Q.; Wang, C.; Wu, Z.Q. Study on prediction of wellhead uplift caused by deepwater high-temperature and high-pressure oil and gas production. China Offshore Oil Gas 2021, 33, 126–134. [Google Scholar]
  3. Ramey, H.J.J. Wellbore heat transmission. J. Pet. Technol. 1962, 14, 427–435. [Google Scholar] [CrossRef]
  4. Holst, P.H.; Flock, D.L. Wellbore Behaviour During Saturated Steam Injection. J. Can. Pet. Technol. 1966, 5, 184–193. [Google Scholar] [CrossRef]
  5. Hasan, A.R.; Kabir, C.S. Heat Transfer During Two-Phase Flow in Wellbores; Part I—Formation Temperature. In Proceedings of the 66th Annual Technical Conference and Exhibition of the Society of Petroleum Engineers, Dallas, TX, USA, 6–9 October 1991. [Google Scholar]
  6. Hasan, A.R.; Kabir, C.S. Aspects of Wellbore Heat Transfer During Two-Phase Flow (includes associated papers 30226 and 30970). SPE Prod. Facil. 1994, 9, 211–216. [Google Scholar] [CrossRef]
  7. Aasen, J.A.; Aadnøy, B.S. Multistring analysis of well growth. In Proceedings of the Society of Petroleum Engineers, Kuala Lumpur, Malaysia, 13–15 September 2004. [Google Scholar]
  8. Gjonnes, M.; Myhre, I.G. High Angle HPHT Wells. In Proceedings of the Society of Petroleum Engineers, Rio de Janeiro, Brazil, 20–23 June 2005. [Google Scholar]
  9. Mcspadden, A.R.; Glover, S. Analysis of complex wellhead load events for conductor and surface casing strings. In Proceedings of the Society of Petroleum Engineers, Amsterdam, The Netherlands, 17–19 March 2009. [Google Scholar]
  10. Jing, J.; Shan, H.; Zhu, X.; Luo, H.; Sun, H.; Eryue, X. 2023. Analysis of wellhead growth mechanism and influencing factors of offshore gas wells based on gas-liquid two-phase. Geoenergy Sci. Eng. 2023, 223, 211541. [Google Scholar]
  11. Zhao, J.Z. Key engineering technologies of Wen 23 underground gas storage. Pet. Drill. Technol. 2019, 47, 18–24. [Google Scholar]
  12. Wei, S.Q.; Rong, W.; Yang, X.; Pan, Z.; Liu, L.; Yang, K.; Zhang, Y.; Li, H. Safety Evaluation and Treatment of Annular Pressure in Injection-Production Wells of Suqiao Gas Storage; China University of Petroleum: Beijing, China, 2022. [Google Scholar]
  13. Yuan, G.J.; Zhang, H.; Jin, G.T.; Xia, Y. Current status and development suggestions of drilling and completion technologies for underground gas storage in China. Pet. Drill. Tech. 2020, 48, 1–7. [Google Scholar]
  14. Gong, N.; Li, J.; Chen, Y.; Jia, L.; Xu, T. Analysis of causes and countermeasures for wellhead uplift in offshore oilfield production wells. China Pet. Mach. 2017, 45, 51–55. [Google Scholar]
  15. Pang, D.H. Wellhead uplift and sensitivity analysis of deepwater subsea wells. China Pet. Chem. Stand. Qual. 2022, 42, 135–137. [Google Scholar]
  16. Wang, X.Q. Research and application of solutions for wellhead uplift in Bohai A oilfield. Tianjin Chem. Ind. 2023, 37, 50–53. [Google Scholar]
  17. Guo, X.; Song, G. Prediction of Temperature and Pressure in Gas Wellbore; Science Press: Beijing, China, 2016. [Google Scholar]
  18. Wang, J.J.; Zeng, X.J.; Jia, S.P.; Sui, X.F.; Zhang, Y.X.; He, H.J. Prediction and analysis of influencing factors of wellbore temperature field in gas storage injection-production wells. Sci. Technol. Eng. 2022, 22, 7890–7902. [Google Scholar]
  19. Xiao, X.J.; Jiang, H.Q.; Liu, Y.W.; Zhang, J.; Wan, Y.; Wang, X.; Ouyang, W. Calculation method of wellbore temperature for high-temperature and high-pressure gas wells with complex wellbore structures. Sci. Technol. Rev. 2011, 29, 32–37. [Google Scholar]
  20. Zhang, H.; Shen, R.C.; Liang, Q.M.; Dong, W.T. Coupled analysis of temperature and pressure in injection-production wells of underground gas storage. Sci. Technol. Eng. 2017, 17, 66–73. [Google Scholar]
  21. Li, J.; Wang, H.; Zhang, H.; Zheng, G.W.; Liu, S.J.; Sun, T.F. Study on prediction of wellhead uplift distance for heavy oil thermal recovery wells in Bohai Sea. J. Eng. Thermophys. 2019, 40, 599–604. [Google Scholar]
  22. Liu, C.M. Research on optimization of wellhead uplift calculation for offshore high-temperature gas wells. Pet. Ind. Technol. Superv. 2024, 40, 42–45, 65. [Google Scholar]
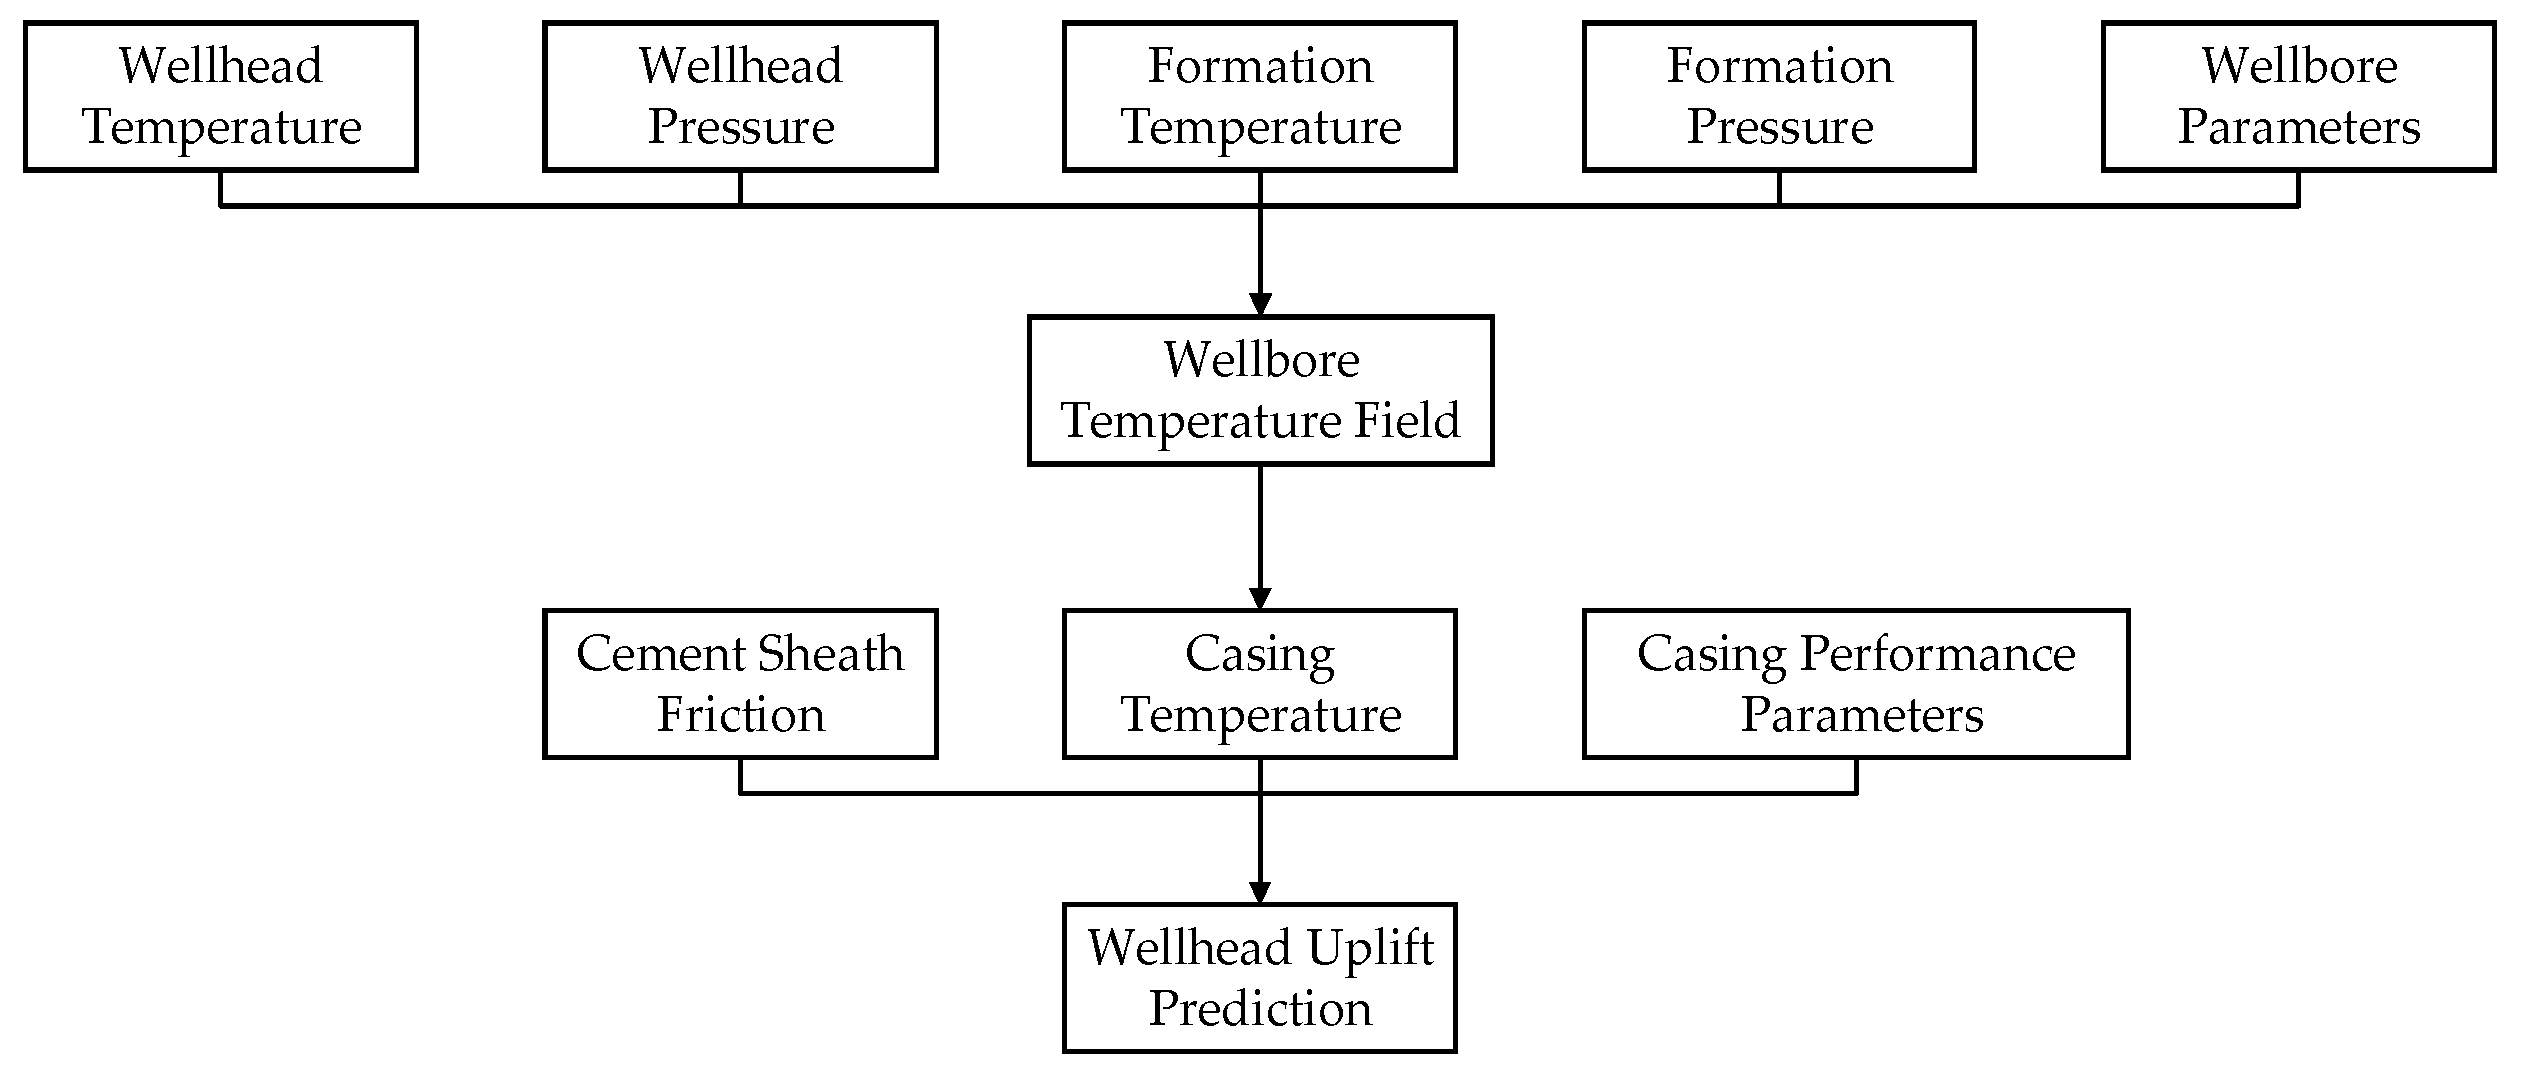
Figure 1. Computational Process Schematic.
Energies 18 05331 g001
Figure 2. Schematic of heat transfer model.
Energies 18 05331 g002
Figure 3. Schematic of radial heat transfer.
Energies 18 05331 g003
Figure 4. Schematic diagram of the unit control volume.
Energies 18 05331 g004
Figure 5. Analysis of thermal expansion load state of production casing under constraints.
Energies 18 05331 g005
Figure 6. Analysis of thermal expansion load state of intermediate or surface casing under constraints.
Energies 18 05331 g006
Figure 7. Wellbore temperature field. (a) Gas injection for 10 days; (b) Gas injection for 80 days.
Energies 18 05331 g007
Figure 8. Impact of gas production rate on the length of the wellhead active section.
Energies 18 05331 g008
Figure 9. Impact of gas production rate on thermal elongation of casing strings at different layers.
Energies 18 05331 g009
Figure 10. Impact of gas production rate on thermal thrust of casing strings at different layers.
Energies 18 05331 g010
Figure 11. Impact of gas production rate on wellhead uplift height.
Energies 18 05331 g011
Figure 12. Impact of gas production duration on thermal elongation of casing strings at different layers.
Energies 18 05331 g012
Figure 13. Impact of gas production duration on thermal thrust of casing strings at different layers.
Energies 18 05331 g013
Figure 14. Impact of gas production duration on wellhead uplift height.
Energies 18 05331 g014
Figure 15. The effect of gas injection rate on the thermal elongation of each casing layer.
Energies 18 05331 g015
Figure 16. Impact of gas injection rate on thermal thrust of casing strings at different layers.
Energies 18 05331 g016
Figure 17. Impact of gas injection rate on wellhead uplift height.
Energies 18 05331 g017
Figure 18. The effect of gas injection time on the thermal elongation of each casing layer.
Energies 18 05331 g018
Figure 19. The impact of gas injection time on the thermal thrust forces acting on each casing layer.
Energies 18 05331 g019
Figure 20. The effect of gas injection time on wellhead elevation.
Energies 18 05331 g020
Figure 21. Temperature distribution of oil reservoir casing under different gas injection pressures during gas injection.
Energies 18 05331 g021
Figure 22. Wellhead elevation prediction under normal conditions. (a) Prediction of casing thermal elongation under normal conditions at different production times. (b) Prediction of casing thermal thrust under normal conditions at different production times. (c) Prediction of wellhead elevation under normal conditions at different production times.
Energies 18 05331 g022aEnergies 18 05331 g022b
Figure 23. Wellhead elevation prediction under extreme conditions. (a) Prediction of casing thermal elongation under extreme conditions at different production times; (b) Prediction of casing thermal thrust under extreme conditions at different production times; (c) Prediction of wellhead elevation under extreme conditions at different production times.
Energies 18 05331 g023aEnergies 18 05331 g023b
Table 1. A-6 Main parameter table of injection–production well.
ParameterValueParameterValue
Well depth3200 mAverage gas injection rate21.4 × 104 m3/d
Packer position2800 mGas injection time10 d/80 d
Outer diameter of oil layer casing88.9 mmFormation temperature114.3 °C
Outer diameter of technical casing177.8 mmGeothermal gradient3.44 °C/100 m
Outer diameter of surface casing273.1 mmSteel gradeP110
Ground thermal conductivity2.06/[W·(m·°C)−1]Cement ring thermal conductivity0.98/[W·(m·°C)−1]
Ground thermal diffusivity0.0037/(m2·h−1)Oil and casing pipe thermal conductivity45.35/[W·(m·°C)−1]
Disclaimer/Publisher’s Note: The statements, opinions and data contained in all publications are solely those of the individual author(s) and contributor(s) and not of MDPI and/or the editor(s). MDPI and/or the editor(s) disclaim responsibility for any injury to people or property resulting from any ideas, methods, instructions or products referred to in the content.