Article

Testing Method for Non-Isothermal Radial Wall Jets from Ceiling Diffusers Used in Building Ventilation

Department of Heating, Ventilation and Dust Removal Technology, Faculty of Energy and Environmental Engineering, Silesian University of Technology, Konarskiego 20, 44-100 Gliwice, Poland
Energies 2025, 18(2), 411; https://doi.org/10.3390/en18020411
Submission received: 6 December 2024 / Revised: 5 January 2025 / Accepted: 15 January 2025 / Published: 18 January 2025
(This article belongs to the Special Issue Thermal Comfort, Environment Quality and Energy Consumption)

Abstract

:
Diffusers producing radial jets attached to the ceiling are most often used in ventilation and air conditioning systems. In building ventilation, the temperature of the jet supplying the air into the rooms is usually different to the surrounding air temperature. To save energy for air transportation during periods of low heat gains, the air flow should be reduced as low as possible, to about 20% of its nominal value. A significant decrease in the air flow supply in cooling mode may cause cold air dumping and, consequently, increase the risk of local discomfort due to drafts in the occupied zone. In this study, a method for assessing the effect of non-isothermality on the speed distribution of radial wall jets has been developed. The measured terminal speed isolines, W = 0.2 m/s, were compared with the isolines determined for isothermal jets. The test results have shown that, for radial wall jets supplying air at an Archimedes number higher than approximately 50 × 10−4, the risk of jet dumping is significant.

1. Introduction

Most new and renovated commercial buildings are equipped with high-efficiency heating, ventilation and air conditioning systems. These systems should provide a high-quality indoor environment with the lowest possible primary energy consumption. In air-conditioned buildings, different thermal and humidity conditions exist depending on the number of people in the room and their physical activity, internal heat gains and solar radiation. A recent review paper [1] deals with issues related to the indoor environment, which are assessed based on the thermal comfort and air quality for selected building types. It presents the current directions of scientific research and possibilities of using the results of this research in practice.
Due to the non-simultaneous occurrence of maximum heat gains in individual rooms, the building is usually divided into zones in which the internal environment is separately controlled. Most often, a zone consists of one or more rooms with the same orientation to the cardinal directions and a similar destination. In such a case, air conditioning systems that allow for the separate control of the internal environment in each zone are particularly useful. Air systems with a variable air volume (VAV), air-to-water systems with fan coils or chilled beams and systems with direct evaporation devices can be used. They differ in terms of capital costs, operating costs and operational reliability. So far, it has not been clearly determined which of these systems is most appropriate for commercial buildings. Although fan coil systems and direct evaporation systems such as Variable Refrigerant Flow (VRF) are popular, high-performance VAV systems have a number of advantages and may, in many cases, be the better choice for commercial applications [2]. An up-to-date literature review presenting the progress in energy-efficient ventilation systems in terms of building envelope tightness, demand-controlled ventilation strategies and heat recovery from exhaust air is included in [3]. Recommendations for the design of high-performance VAV systems are presented in the guide presented in [4]. The review study carried out in [5] deals with VAV system modeling and simulations, control strategies and systems diagnosis. By selecting appropriate control strategies, the energy consumption in VAV air conditioning systems can be minimized. A key factor influencing energy consumption in VAV systems is the wide range of ventilation air flow changes [6,7]. The results presented in [8] showed that, during the cooling season, the VAV system consumed almost the same amount of electricity as the chilled beam and fan coil systems. A comparison of the capital costs of different air conditioning systems for a selected building is presented in [9]. The chilled beam system and the VRV system were 100% and 31% more expensive than the VAV system, respectively.
In the ventilation of a building, the temperature of the supplied air t o is usually different than the indoor air temperature t i . The impact of temperature on velocity in jets depends on the ratio of the buoyancy and the inertia forces, characterized by the Archimedes number, A r o [10]:
A r o = g β A o 0.5 t i t o / U o 2
In VAV systems, the air flow rate is proportional to the heating load in the room. The energy used to transport air can be saved during times of low occupancy, low heat gains and low pollutant emissions. The air flow should be reduced as much as possible, [11,12]. However, a significant reduction in the supply air flow at temperatures 8–10 °C lower than the room air temperature may cause so-called supply air dumping, and in the occupied zone there may be a risk of local discomfort due to draft. When the air flow is reduced by a factor of five, the A r o number increases by a factor of twenty-five, while the jet throw length, which is proportional to the air flow, is significantly reduced. In such conditions there is a risk of jet dumping into the occupied zone. Weak air jets can be easily affected by thermal plumes over various heat sources like hot windows, occupants and computers. The interaction of the supplied cold air jet with thermal plumes may also result in local thermal discomfort caused by drafts [13].
The control of air flow in VAV systems is crucial to obtain a satisfactory thermal environment under variable heat gains in air-conditioned rooms. In high-performance VAV systems, the air flow can vary from the minimum measurable value to the maximum value limited by the noise level. This corresponds to the air velocity changes at the diffuser spigot from approx. 0.8 to 6 m/s. Due to a wide range of changes in the supplied air velocity and changes in the air temperature within the range of ±10 K, the Ar number may change within very wide range. The impact of limiting the minimum air flow in air-conditioned rooms on the indoor environment and energy consumption was the subject of extensive research presented in [14,15]. The authors concluded that reduction in the minimum air flow results not only in energy saving but also significantly reduces the risk of overcooling rooms in summer. The results of these studies also showed that the Coanda effect can be an important factor in maintaining thermal comfort within a reduced air flow. When the diffusers were mounted on the sidewall or there was no ceiling and the Coanda effect was not present, the risk of draft increased significantly.
Diffusers producing radial wall jets (RWJs) attached to the ceiling are most often used in ventilation and air conditioning systems. Analyzing the technical data of diffusers, which generate RWJs, it was found that, typically, the temperature of the air supply cannot be cooler than the room air temperature by more than 10 K. For this temperature difference, the air flow can typically be reduced to only 45% of the maximum value. Based on data from Eurovent Certita Certification [16], the cooling sources in air-conditioning systems operate at a power below 45% of maximum power for approx. 60% of the total operating time. Thus, by using conventional ceiling diffusers, the risk of losing flow stability is substantial. The use of active diffusers allows for the supply air flow to be changed over a wide range without the risk of jet detachment from the ceiling. In these diffusers, the air supply opening area is changed in such a way as to maintain an approximately constant supply air velocity regardless of the air flow supply. However, due to their high cost, active diffusers are rarely used. In the study carried out in [17], the air velocity distribution in an office room with a VAV system was experimentally tested. The air was supplied into the room by five different types of ceiling diffusers. Active diffusers provided a constant air supply velocity. Their performance was compared with commonly used diffusers: rectangular; swirl radial; swirl compact and multi-nozzle. The air distribution was tested at four different heat gain levels, from a high of 46 W/m2 to a low of 11 W/m2 heat gain. The corresponding air supply flow rates varied from a high of 4.3 L/(s · m2) to a low of 1 L/(s · m2). The air flow patterns were quite different for the different diffusers. Active diffusers produced a more uniform and stable air flow pattern, and these diffusers were therefore recommended for VAV systems where heat gains vary significantly.
In the VAV system design guide [4], the risk of cold jets dumping and worsening air mixing is marginalized. The guide claims that, in many buildings, the VAV system works correctly despite the air flow being limited to less than 30% of its nominal value. It is also stated that, when heat gains are very low, it is likely that occupants are absent and no one is exposed to local discomfort and so there may be relatively fewer hours during the operating period when the air flow set-point is minimal when people are present. However, we believe that, in the case of high-performance VAV systems, a significant reduction in the quality of the indoor environment should not be allowed at all. Thus, to recognize the phenomenon of jet detachment from the ceiling, studies of the velocity field in supplied jets at different air volume fluxes and with different temperatures of the supplied air are necessary.
The first studies of velocity in RWJs were carried out by Rajaratman [18]. He found that, when RWJs are spread linearly, the maximum velocity is inversely proportional to the radial distance, and that there is self-similarity in the distributions of mean velocity. Rajaratnam analyzed the continuity and motion equations and concluded that momentum flux is conserved in RWJs. Thus, he suggested that the losses of momentum caused by the friction of the fluid against the wall and the transfer of momentum from the main flow to the secondary flows can be neglected. Rajaratnam also discussed experiments on RWJs produced by impinging circular jets [19,20]. These results confirmed previous observations regarding the similarity of the mean motion, the linear jet spread and inversely proportional changes in maximum velocity with the radial distance.
The first turbulence measurements using a hot-wire anemometer in an RWJ, produced by a ring nozzle, were presented by Tanaka and Tanaka [21]. Their results confirmed the previous results regarding mean velocity distribution. They also showed the similarity in RMS distributions of radial velocity fluctuations. Single wire and cross-wire anemometers were used to measure the RMS of velocity fluctuations and shear stresses both streamwise and normal to the wall. However, due to the high turbulence intensity in RWJs, these results are inaccurate, especially in regions with a turbulence intensity above approx. 30% [22]. These difficulties do not occur when measurement techniques such as particle image velocimetry (PIV) and laser Doppler anemometry (LDA) are used. The PIV technique has been successfully applied in studies of impinging turbulent jets [23,24]. Velocity measurements in round impinging jets using LDA are presented in [25].
A new method for measuring the air velocity distribution in RWJs using a multi-channel thermo-anemometric system with spherical sensors was developed by the authors of [26]. The advantages of this method are a good spatial resolution, simultaneous multi-point measurement, wireless transmission of results, battery power supply and moderate price. The multi-point measurement technique allows the overall measurement time to be shortened and makes it possible to study more cases of flows.
The terms velocity and speed are often considered synonymous; however, speed W is a scalar quantity and velocity U is a vector. Spherical anemometers measure the air speed W , which is a module of the velocity vector. The mean speed W ¯ can be converted to mean velocity U ¯ if the turbulence intensity of the air flow is known. In our previous paper [26] we proved that, in the self-similarity zone of RWJs, the ratio of the maximum mean speed and maximum mean velocity W ¯ m / U ¯ m is equal to 1.068 and that the half-width of the mean speed profile y w 1 / 2 is 1.14 times higher than the half-width of the mean velocity profile y u 1 / 2 . The measurement of the air distribution in RWJs from ceiling diffusers confirmed that, in self-similar flows, the distribution of the mean air velocity can be successfully estimated based on the measured distribution of the mean air speed.
RWJs still arouse interest among many researchers. For example, Tummers et al. [25] reports measurements of mean velocity components and Reynolds stresses in the near field region r/D < 2.5 of a impinging jet issuing from a round pipe. The distance between the pipe exit and the flat impingement plate was 2D, and the Reynolds number was equal to 23,000. The flow field of an impinging jet was measured by Yadav and Agrawal [27]. Experimental data were analyzed to the self-similarity of radial wall jet based upon outer scaling. The outer scaling showed the self-similarity of normal to the wall distributions of mean velocity and normal stresses. Van Hout et al. [28]. measured the flow field in the radial wall jet zone of an impinging jet. In that zone, for Re = 12,354, the self-similarity of the mean radial velocity, RMS values of velocity fluctuations and Reynolds shear stresses were obtained.
Despite numerous studies, for a long time no model that could accurately describe the velocity distribution in RWJs was proposed. In our previous paper [26], we proposed a new, improved method for calculating the air velocity distribution in isothermal RWJs. This method is based on the self-similarity of the distributions of mean air speed, mean velocity components and the RMS of fluctuations in velocity components. The method takes into account the decrease in jet momentum, the non-zero position of the jet origin and faster velocity decrease in the terminal zone of a jet. The method was validated at Reynolds numbers from 24,000 to 77,800. For that range of Re numbers, no impact of Re on the air velocity distribution in RWJs was observed. For model validation we used the results of our measurements in isothermal jets from two types of ceiling diffusers. Using the new model, the air velocity distributions in the tested isothermal RWJs were calculated. The values of the model parameters effective area of the outlet Ao, virtual origin position, ro, jet spread coefficient au and momentum flux, Mo, and its decay coefficients, aM, and, nM, were optimized to obtain the best agreement between the measured and calculated results.
The temperature of the supplied air in VAV systems is usually 8–10 °C lower than the set temperature in the room, and therefore the supplied jets are non-isothermal. There are formulas for calculating the trajectory of the circular and three-dimensional non-isothermal jets in the case of the horizontal, vertical or inclined discharging of these jets, [10]. There is a gap in knowledge about the velocity distribution in non-isothermal radial wall jets and the conditions at which these jets lose stability have not been identified yet.
In this paper, we present a method for testing the velocity field in non-isothermal RWJs and propose a method for assessing the effect of the supply air temperature on the velocity distribution in these jets. In our previous paper [26], we presented a calculation model for the speed/velocity field in isothermal RWJs. In the present study, this model was used to determine the speed isolines, which were used as reference data to assess the effect of non-isothermal conditions on the air velocity distribution in RWJs.

2. Methods

The influence of temperature on the speed distribution in the supplied jet was assessed based on a comparison of the measured terminal speed isolines, W = 0.2 m/s, with the isolines determined for the isothermal jets. The test stand and the measurement method are presented in Section 2.1. The method of determining reference isolines for isothermal jets is described in Section 2.2.

2.1. Measurement Method

Tests of the air distribution in the non-isothermal jets from multi-cone diffuser were performed in a large room with an area of 105 m2 and a height of 2.8 m located in a building with a massive structure and a large thermal capacity. The air was conditioned in the external air handling unit. The diffuser used in the test is shown in Figure 1.
A sixteen-channel anemometer system with omnidirectional sensors was used to measure the air speed distribution in the jet. This system is described in more detail in [26]. The air temperature was measured with a copper-constant thermocouple placed near the thermo-anemometric sensors. The rack with anemometric transducers and thermocouples is shown in Figure 2. Additionally, twelve thermocouples were evenly distributed on a vertical stand over the entire height of the room and one thermocouple was placed directly at the air supply. The scheme of the test room and the location of the air speed sensors and thermocouples are shown in Figure 3.
Six measurement series were carried out at different values of air flow supply, V o , and different excess room temperatures above the supply air temperature t N . For each series, the Ar number was calculated using Equation (1). The effective area of the diffuser outlet, Ao, and velocity, U o , were determined based on the air volume flux measured in the diffuser spigot, V o , and the boundary value of momentum flux, M o , specified based on the measured air speed distribution at the diffuser outlet, [26].
The measurement series was as follows:
The average air temperature in the room was determined based on the readings of thermocouples placed on a vertical stand; the supply air temperature was set depending on the assumed temperature difference in a given measurement series;
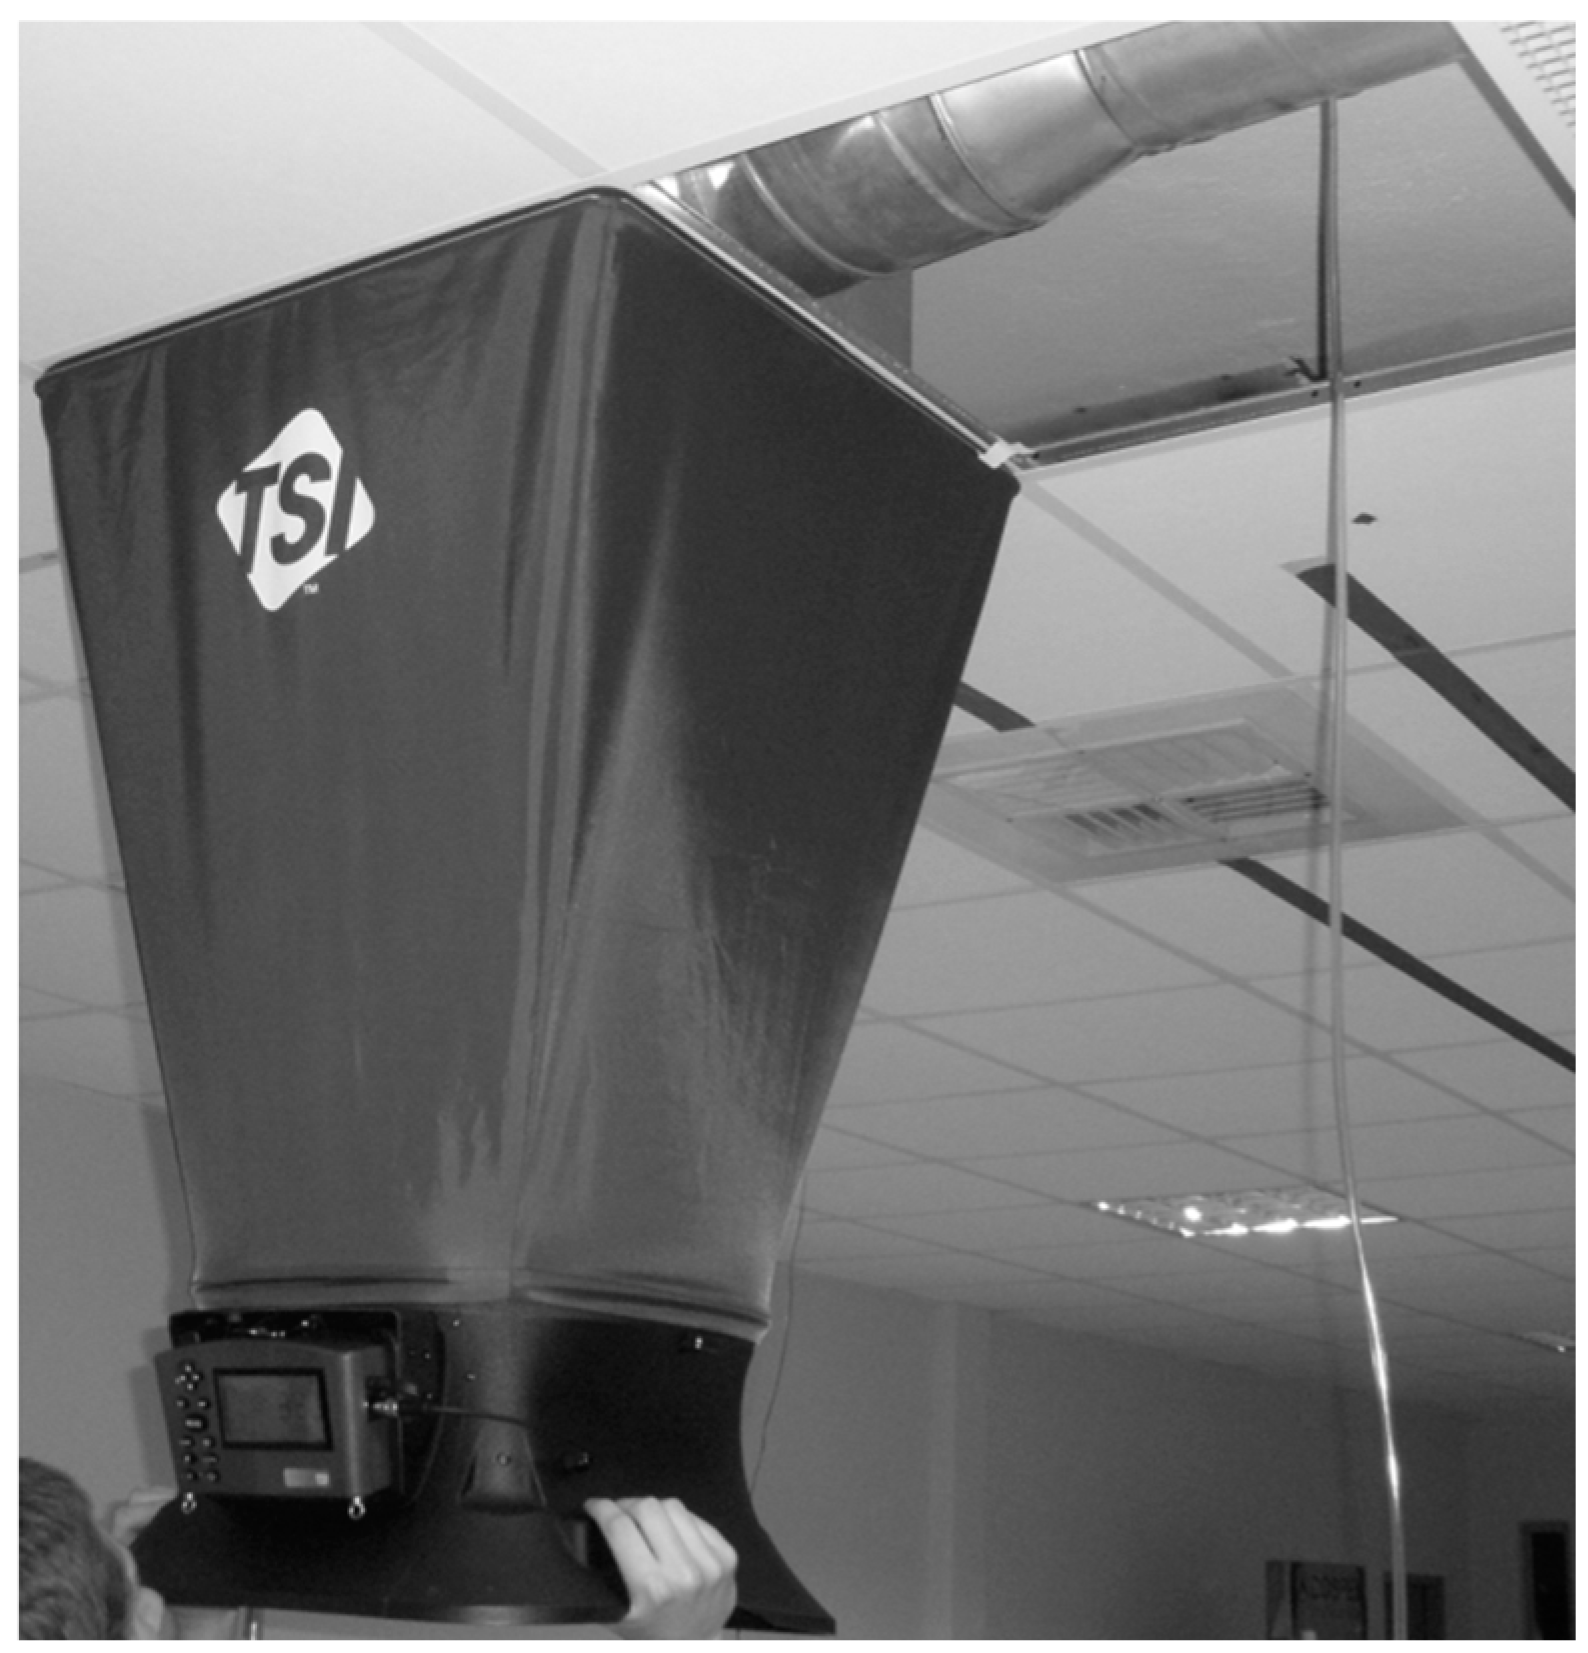
The supply and exhaust air flow rates were varied using fan inverters; the flow rate was measured using a circular MSD air flow unit, which was calibrated using the TSI 8710 measuring capture hood shown in Figure 4; and the pressure difference across the MSD air flow unit was measured using a precision manometer from Furness Controls;
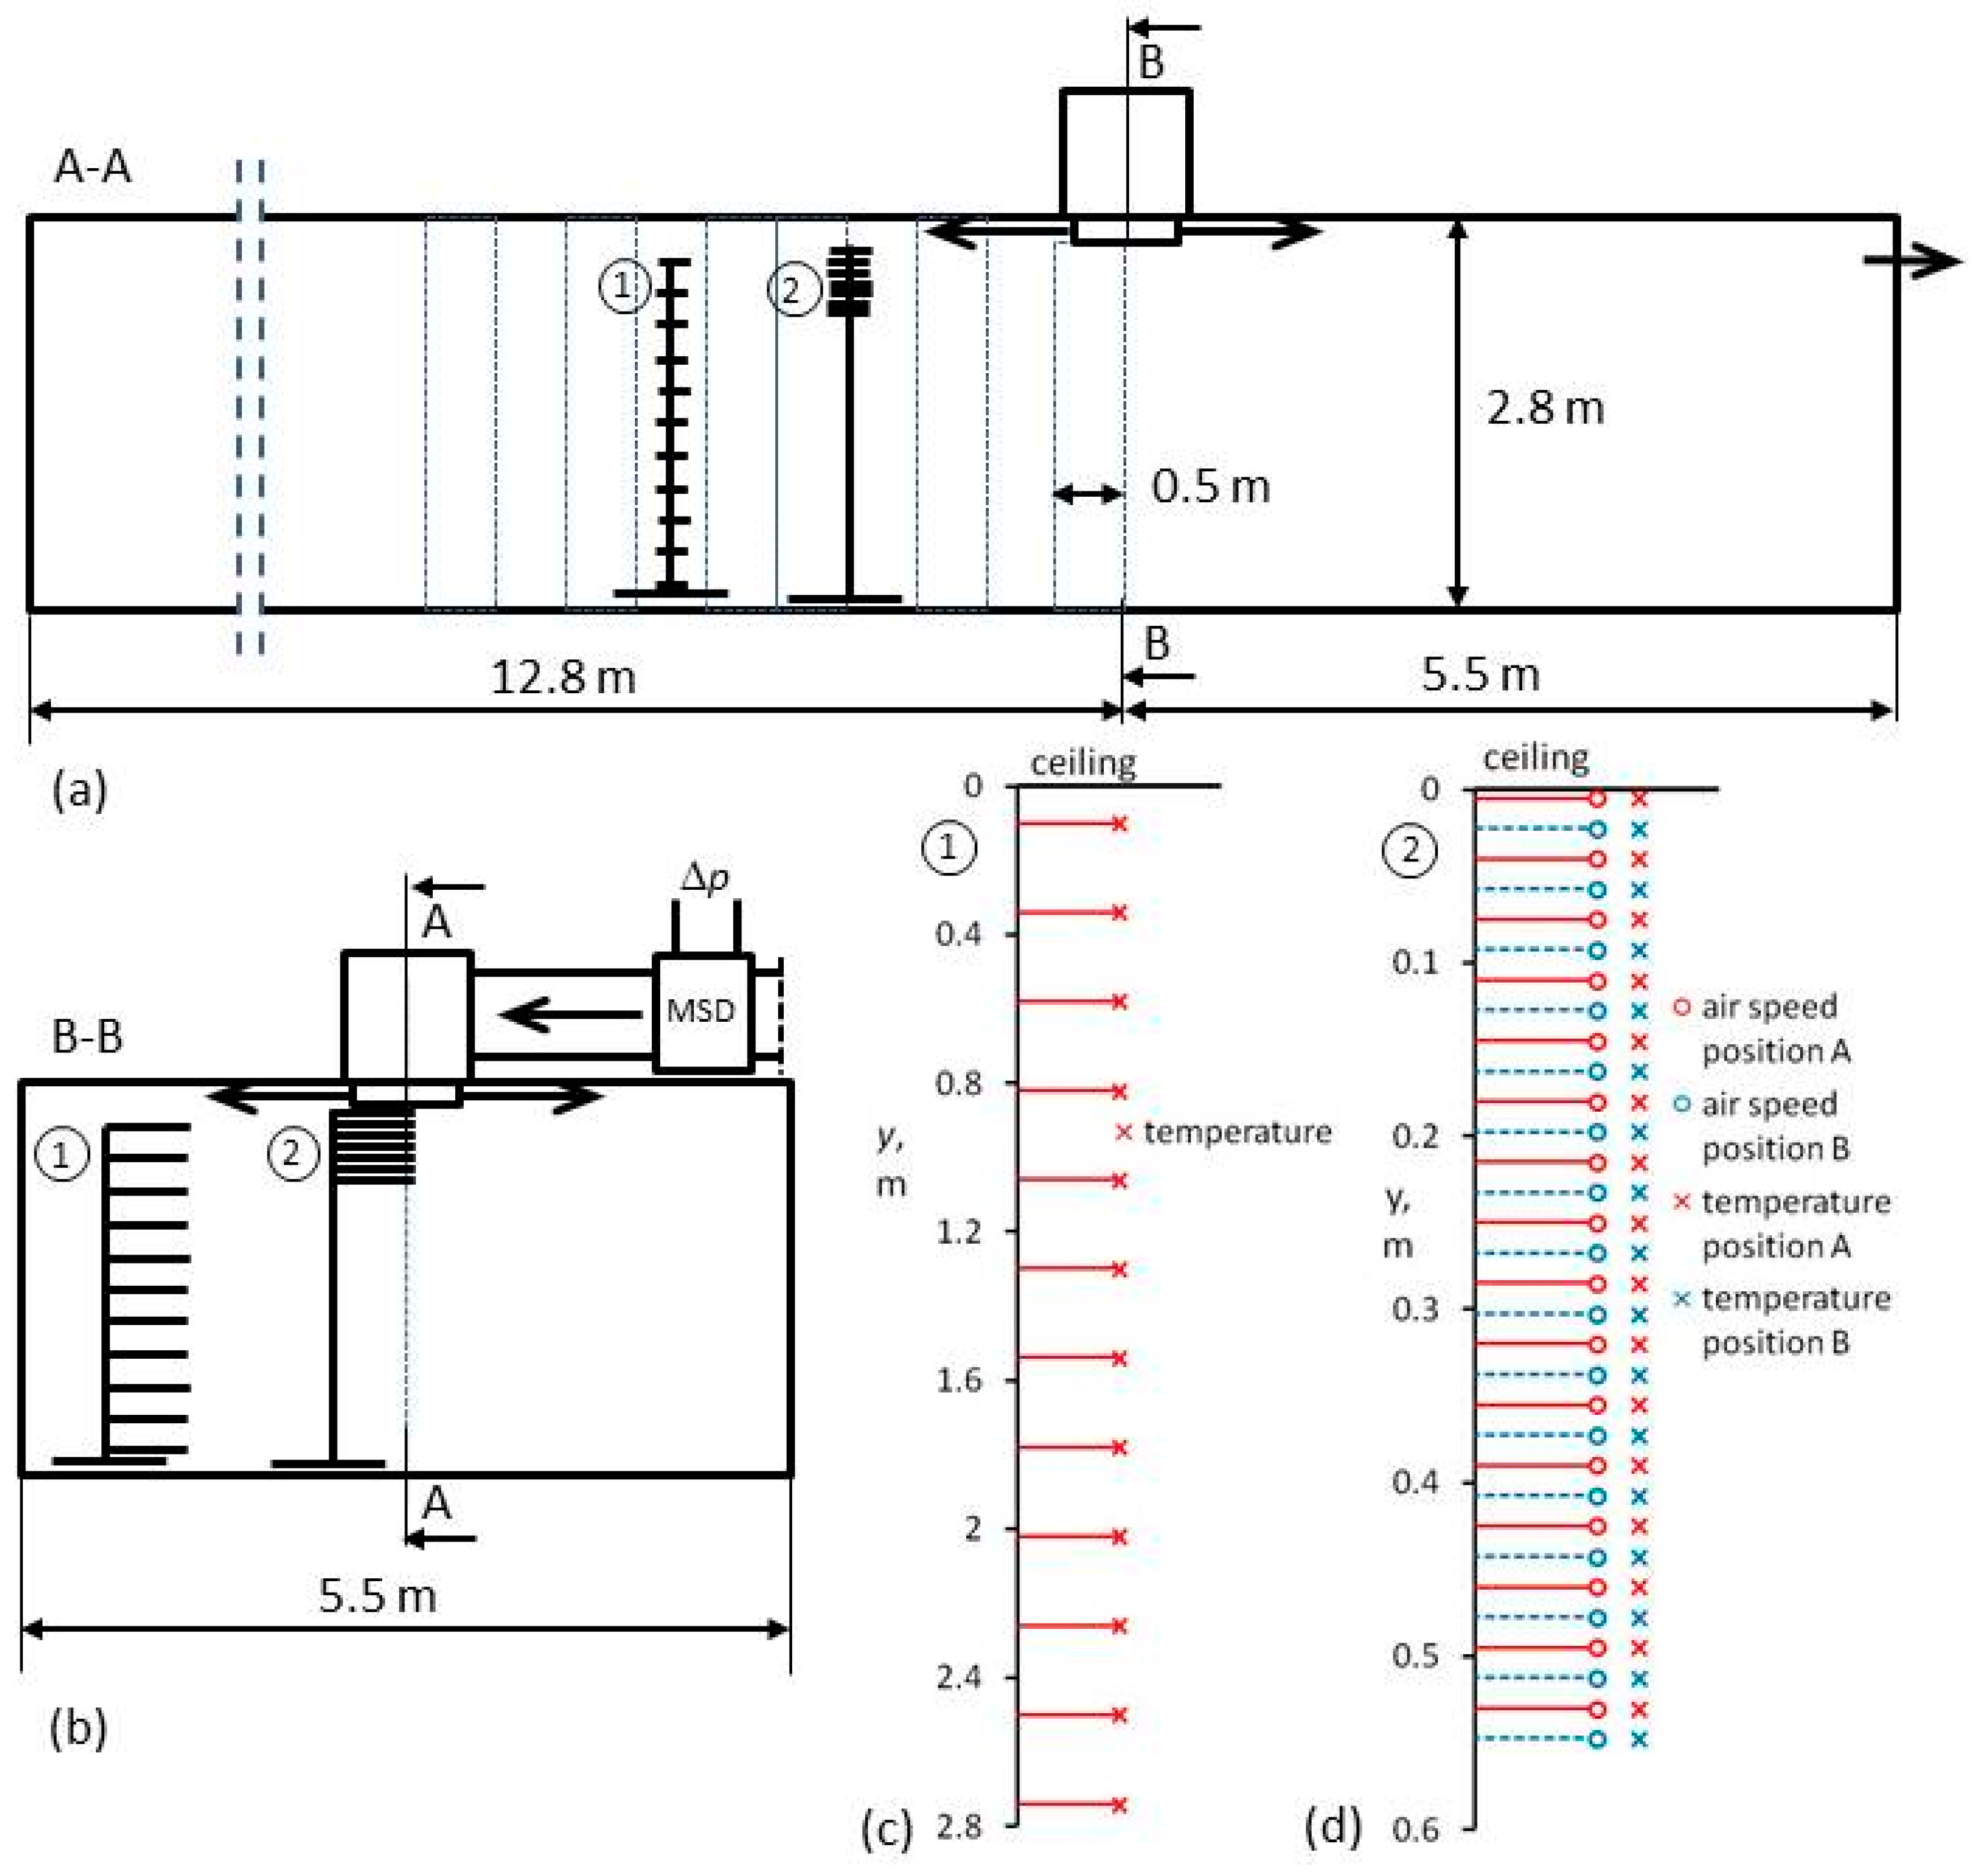
Air velocity measurements in the jet were performed using hot-sphere anemometric sensors positioned horizontally, Figure 2. The distance between the air speed sensors was 0.035 m; during the measurement, the rack with anemometric transducers and thermocouples, marked as (2) in Figure 3d, was moved down 0.0175 m from the starting position A to position B to be the same distance from diffuser, r, and air speed and temperature were measured in 32 points. Measurements started at a distance of 0.5 m from the center of the diffuser, and then sensors were moved every 0.5 m; the average time was 360 s;
Measurements were carried out up to a radial distance at which all the anemometer sensors showed a speed value lower than 0.2 m/s.
A list of instruments used in the measurements and the uncertainty of the measured quantities is presented in Table 1.

2.2. Envelopes of Isothermal RWJs

According EN 12238 standard [29] the “envelope” it is geometrical 3D surface where the local measured air velocity has the same value. In the case of a 2D representation, it is shown as an isoline of velocity. Envelopes can be used to characterize the spread of air jets from the diffusers. In order to determine the reference envelopes of isothermal RWJs from a multi-cone ceiling diffuser at different air flow rates, the model of an RWJ developed in [26] was used. The model parameters and boundary conditions are presented in Table 2 and Table 3, respectively.
The jet spread coefficient, a u , was found to be the same for two different diffusers and independent of Reynolds number in the range from 24,000 to 78,000. The location of the virtual momentum source, ro, and the area of diffuser opening Ao depend on diffuser construction. It was also found that the parameters of momentum flux decay a M and n M are the same for two different diffusers and are independent of the Re number.
The isoline of air speed can be determined in two steps: 1.—the calculation of the maximum air velocity U ¯ m as a function of radial distance, r , using a set of two equations, Equation (2) and (3), for U ¯ m ≥ 0.35 m/s and for U ¯ m < 0.35 m/s, respectively; and 2.—the determination of the normal to the wall coordinate y 0.2 from the equation describing normal to the wall profile of mean air speed W ¯ , Equation (4).
The decay of the maximum velocity U ¯ m in an RWJ can be found by combining Equation (2) with Equation (3). For U ¯ m ≥ 0.35 m/s:
U ¯ m = K u   U o r r r o / A o 0.5 1 + a M r r o / A o 0.5 n M
where K u = 4.821 a u 0.5 , for U ¯ m < 0.35 m/s:
U ¯ m = K u 1 + a M r r o / A o 0.5 n M r r r o / A o
where K u = K u r 0.35 r 0.35 r 0 / A o 0.5 Using Equation (3), the jet throw, i.e., the distance between the center of the diffuser and the plane tangent for the jet envelope perpendicular to the flow direction, can be calculated. Both the jet envelope and the throw are determined for an assumed velocity value, e.g., 0.2, 0.35 or 0.5 m/s.
Then, the normal to the wall profile of the mean air speed W ¯ can be calculate using Equation (4):
W ¯ = U ¯ m · 1.4023 η u   0.1415 1 E R F 0.4886 η u 1   +   0.4814 η u   0.8243 η u 2 + 0.2697   η u 3   ,
where η u = y / y u 1 / 2 and y u 1 / 2 = a u r r o .
The way to determine the mean speed isoline is illustrated in Figure 5.
Calculations of the mean speed profile W ¯ can be performed for several radial distances r lower than the throw L . For each selected radial distance r, the normal to the wall distance y can be gradually increased to find the distance at the which mean speed W ¯ drops to 0.2 m/s. Alternatively, the Solver procedure in Excel can be used for that purpose.
This method was used to find isolines for radial jets from a multi-cone ceiling diffuser with four flow rates V o and an air speed of 0.2 m/s, as presented in Table 3. The air speed isolines for the isothermal RWJs are shown in Figure 6. These isolines can be used as isothermal reference data for comparisons with non-isothermal cases.

2.3. Envelopes of Non-Isothermal RWJs

In the case of non-isothermal jets, due to the impact of buoyancy forces, the computational model developed for isothermal jets cannot be used. Therefore, the jet throw and the location of the envelope were determined based on speed profiles measured in the direction of the normal to the ceiling. The speed profiles were approximated using Equation (5):
W ¯ = U ¯ m · a 1 η u   n 1 E R F a 2 η u 1 + a 3 η u a 4 η u 2 + a 5   η u 3
Values of the exponent n and coefficients a 1 a 5 were optimized using the least squares method individually for each profile. For each profile, the distance from the ceiling, y 0.2 , at which the air speed value was 0.2 m/s was determined. The speed measurement results and their approximation for the selected profile are shown in Figure 7.

3. Results and Discussion

It was assumed that the maximum air velocity at the inlet spigot of the plenum box of the tested multi-cone diffuser is 4.5 m/s. This corresponds to air volume flux of approx. 795 m3/h. The air jets from the diffuser were tested at four levels of air volume flux Vo, i.e., at Vo = 793 m3/h; at Vo = 556 m3/h with the air flow reduced to 70%; at Vo = 395 m3/h—air flow reduced to about 50%; and at Vo = 248 m3/h with the air flow reduced to about 31%. The boundary conditions of the tested RWJs were as follows: outlet air flow Vo, temperature difference ∆to = tito, Archimedes number Aro (Equation (1)). And the determined parameters of the jet envelope were throw L0.2 and drop ymax, as presented in Table 4. Figure 8 shows the envelopes of isothermal and non-isothermal jets determined for three air volume fluxes, i.e., 556 m3/h, 395 m3/h and 248 m3/h.
For an air flow rate of 556 m3/h, as shown in Figure 8a, the envelope determined based on measurements at Aro = 2 × 10⁻⁴ is very consistent with the envelope determined based on the calculation model. With the increase in the Aro number to 10 × 10−4 and 40 × 10−4 the throw of the jet is shortened by 0.2 m and 0.8 m, i.e., by 5% and 21%, respectively. In the case of Aro = 40 × 10−4, the jet drop increases slightly, by 10%.
Figure 8b shows the RWJ envelope at Aro = 60 × 10−4. Compared to the isothermal case, the jet throw is smaller by 0.7 m, i.e., by about 25%, and the jet drop increases by 0.17 m, i.e., by 70%. Moreover, the shape of the envelope at Aro = 60 × 10−4 suggests that the jet may detach from the ceiling.
When the air flow is reduced to about 30% and the jet is slightly non-isothermal, the Aro number is 5 × 10⁻⁴ (Figure 8c), and the jet throw determined based on the calculation model is by 0.2 m, i.e., 9% lower than the throw obtained from measurements. No difference regarding the jet drop parameter is observed. In the case of a strongly non-isothermal flow such as Aro = 135 × 10−4, the outflowing air stops at a small distance from the diffuser and no wall jet is formed.

4. Conclusions

The paper presents a new method for assessing the effect of temperature on the air velocity distribution in radial wall jets, which is based on the following:
-
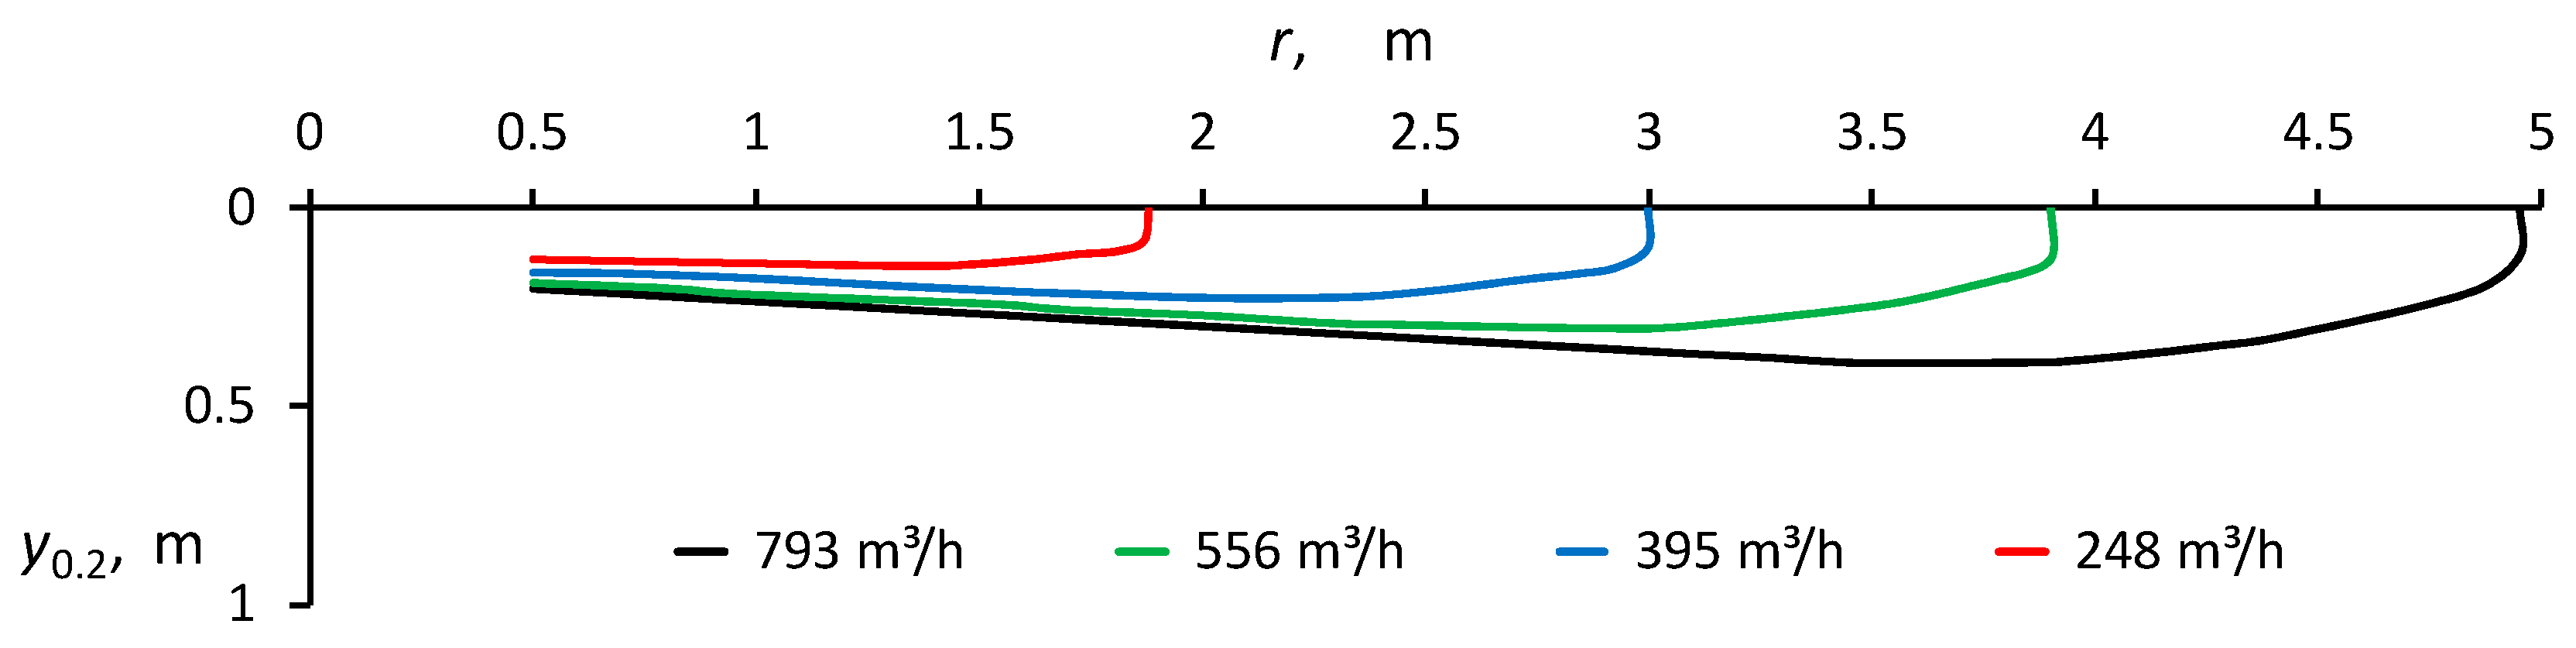
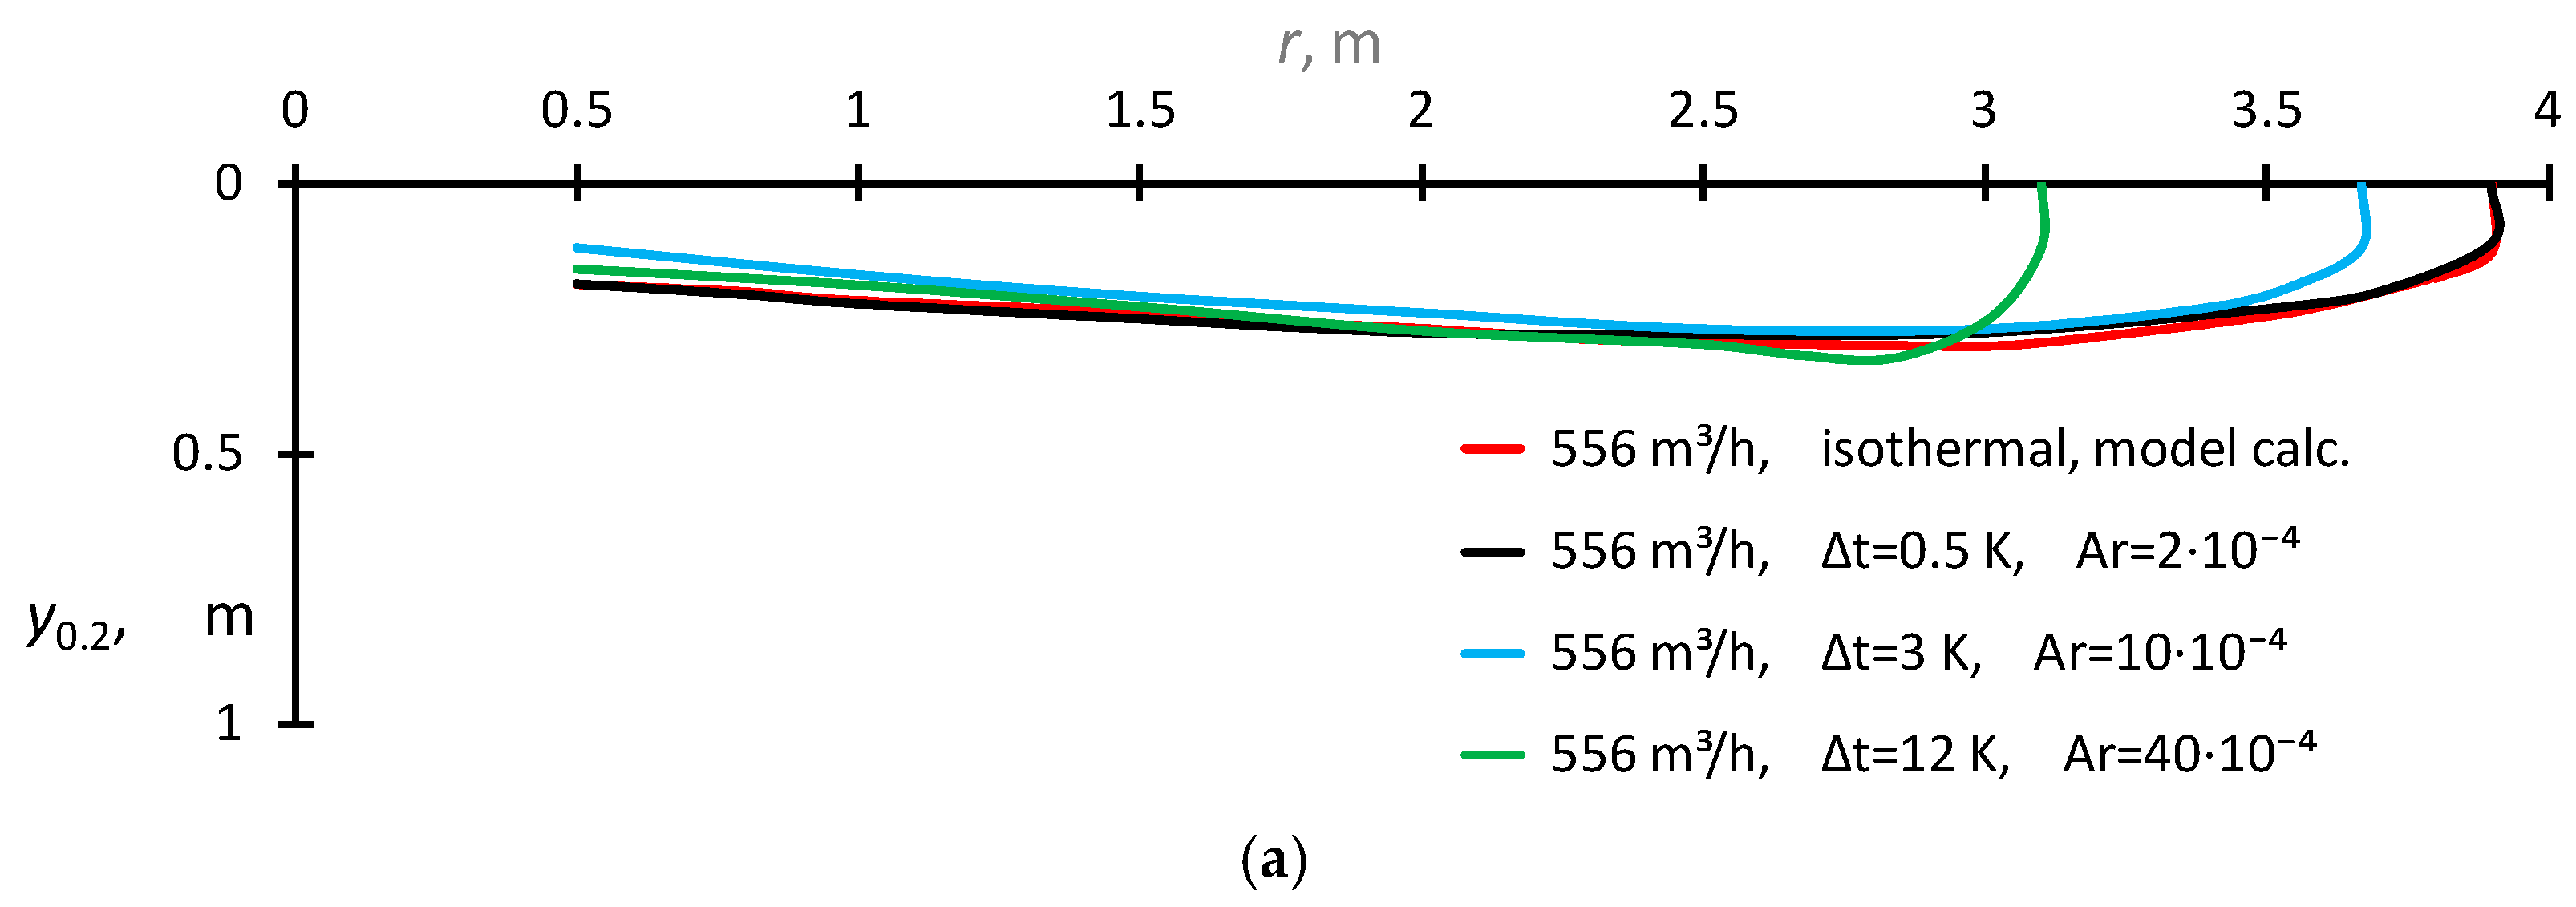
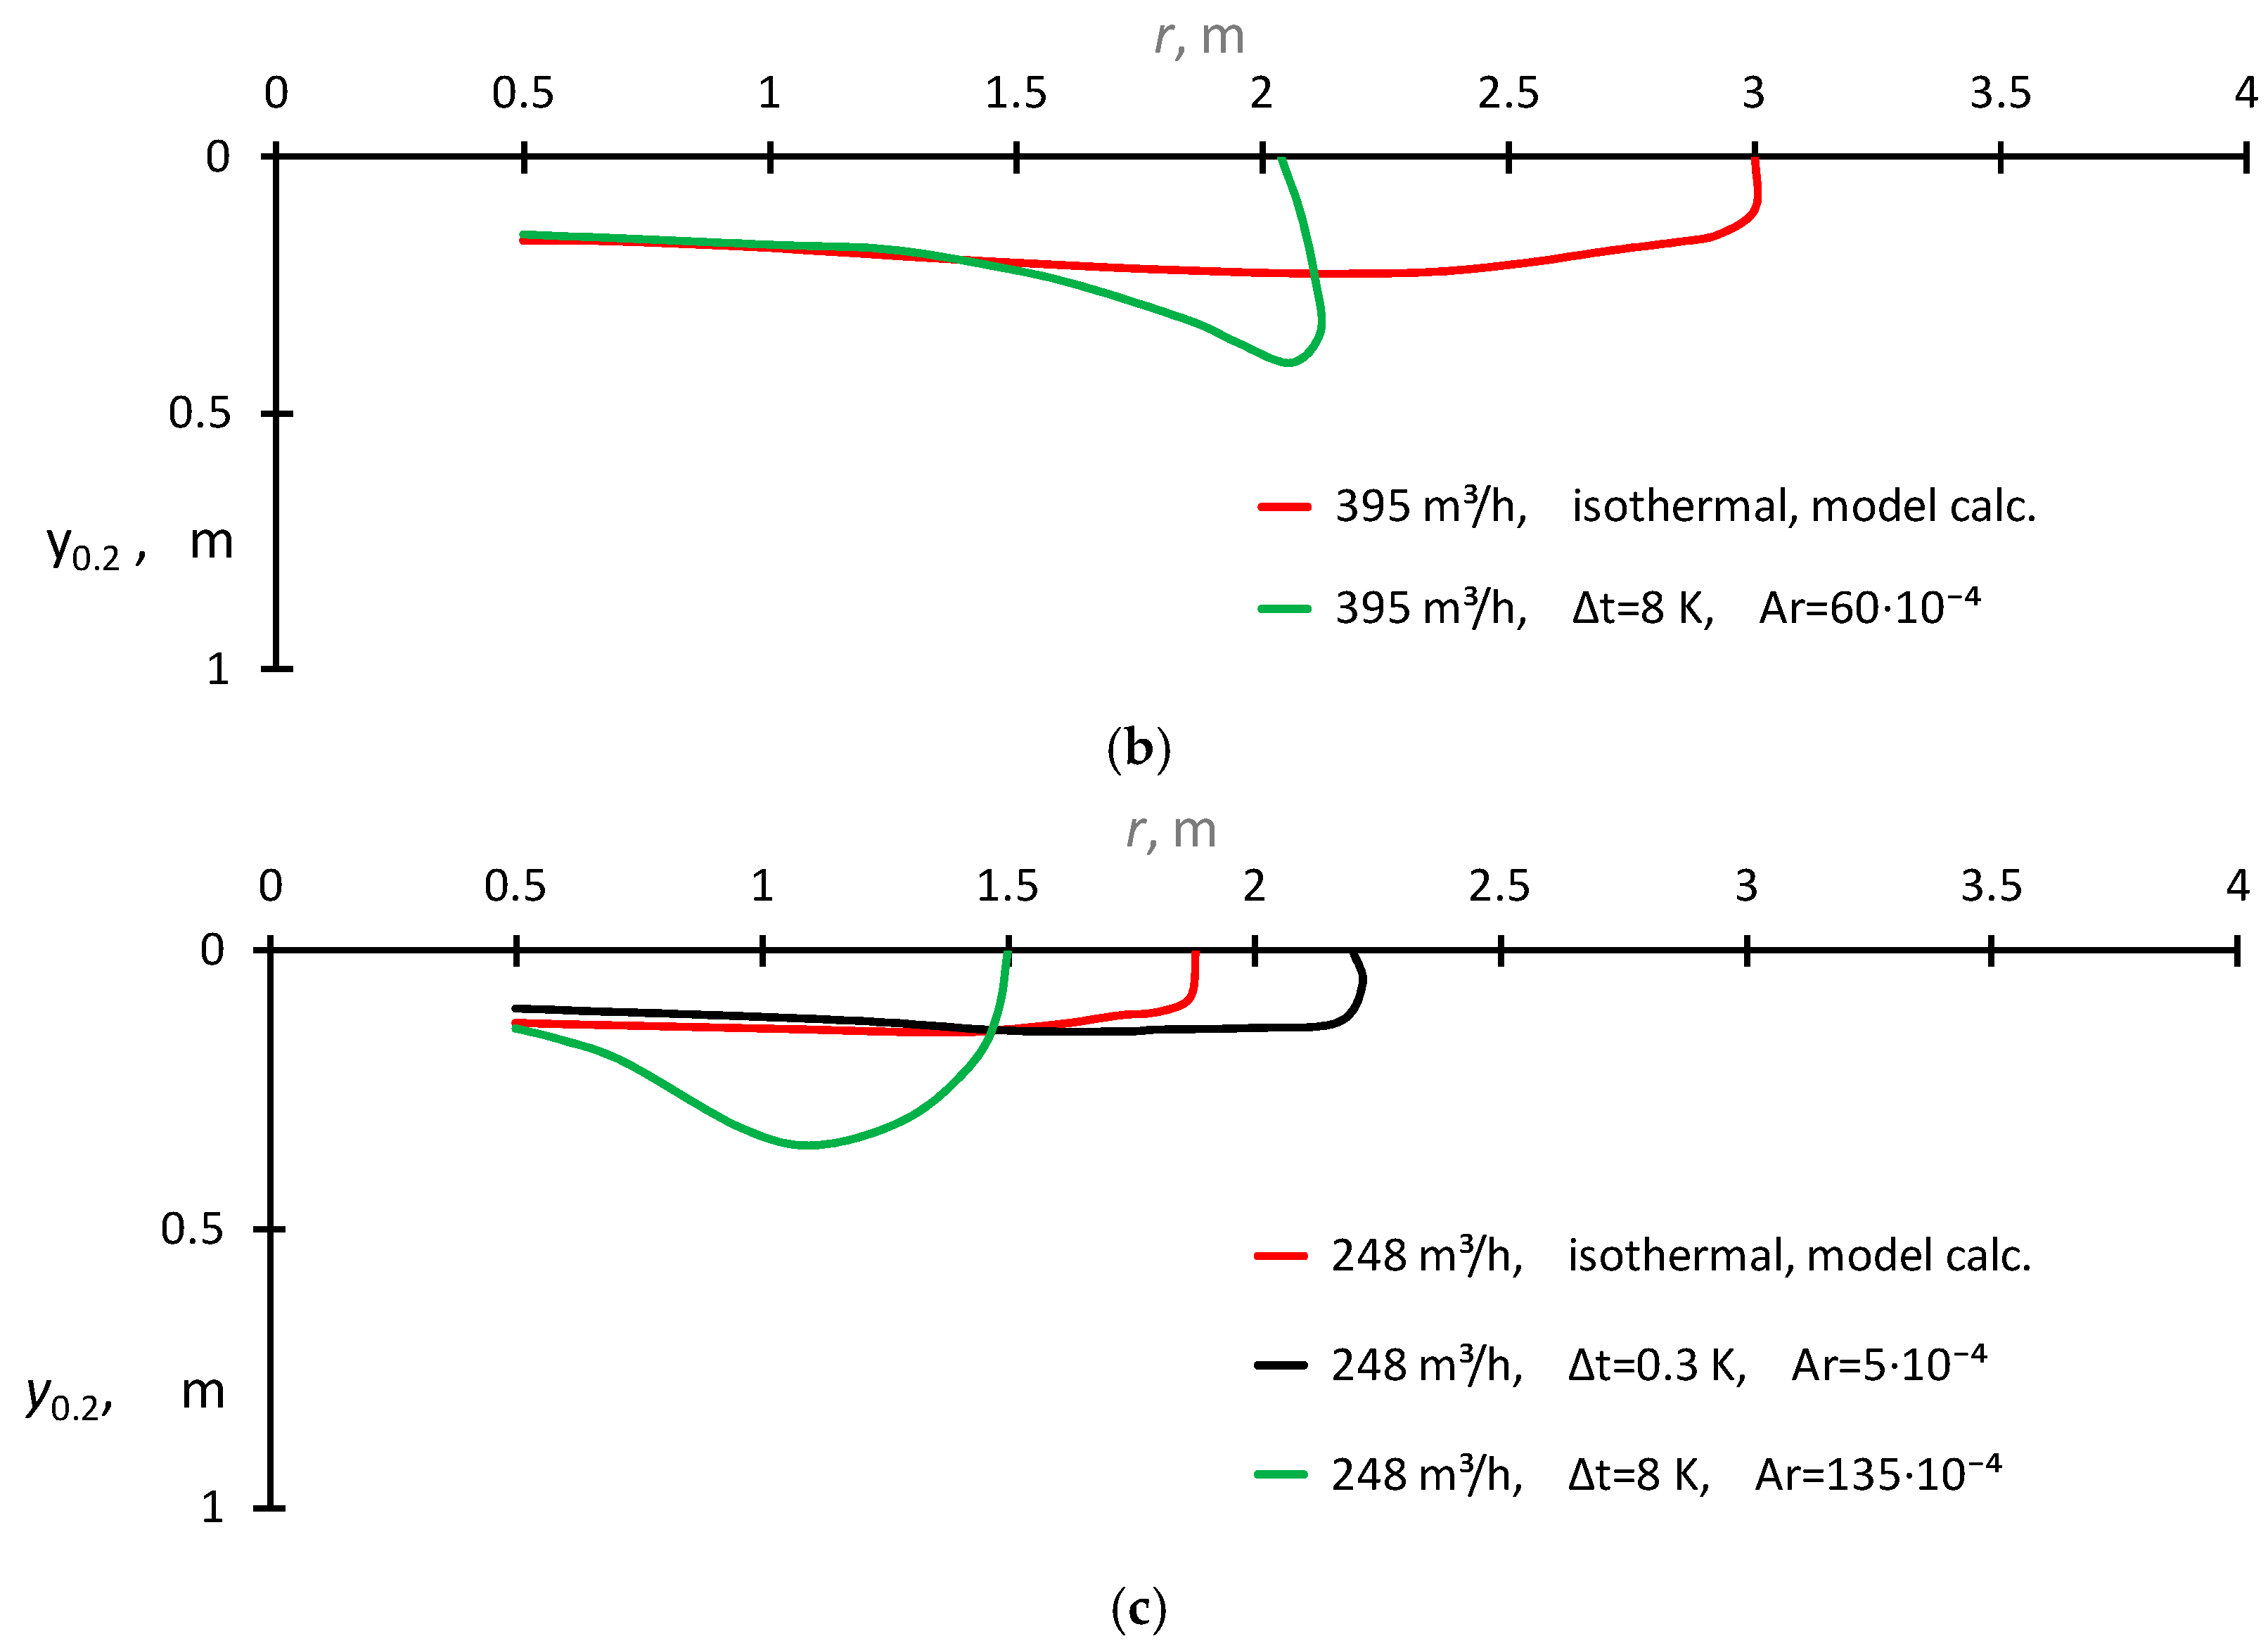
A comparison of the measured speed envelope, determined using the assumed terminal value of the speed, e.g., W = 0.2 m/s, with the calculated envelope for the isothermal radial wall jet obtained using the proposed model;-
-
The value of the boundary Aro number used as a criterion for the jet dumping risk assessment;
-
The test results which showed that the risk of jet dumping increases significantly for Aro numbers higher than approximately 50 × 10−4.
The developed method can be used to test non-isothermal jets from other ceiling diffusers across a wider range of Re numbers. Based on such tests, the range of changes in the volume flow rate and temperature of the supply air in VAV systems can be determined.

Funding

This research received no external funding.

Data Availability Statement

The original contributions presented in this study are included in the article. Further inquiries can be directed to the corresponding author.

Acknowledgments

The work was supported by the Polish Ministry of Science and Higher Education within research subsidy.

Conflicts of Interest

The author declares no conflicts of interest.

Nomenclature

Aarea, m2
acoefficient
ArArchimedes number
gacceleration due to gravity, m/s2
Kvelocity decay coefficient
Lthrow length, m
Mmean motion momentum flux, kg · m/s2
nexponent
rradial distance, m
ReReynolds number, R e = U o A o 0.5 / ν
RMSroot mean square, m/s
Ttemperature, °C
Uvelocity, m/s
Vvolume flux, m3/s
Wmean speed, m/s
ydistance normal to the ceiling, m
βair volume expansion coefficient, 1/K
ρdensity, kg/m3
ηdimensionless distance from the wall
νkinematic viscosity of air, m2/s
Subscripts
Mmomentum flux
iindoor
mmaximum
ooutlet
uvelocity

References

  1. Ratajczak, K.; Amanowicz, Ł.; Pałaszyńska, K.; Pawlak, F.; Sinacka, J. Recent Achievements in Research on Thermal Comfort and Ventilation in the Aspect of Providing People with Appropriate Conditions in Different Types of Buildings—Semi-Systematic Review. Energies 2023, 16, 6254. [Google Scholar] [CrossRef]
  2. Introducing High Performance Air System. An AMCA International White Paper. Available online: www.krueger-hvac.com/files/white%20papers/white_paper_amca_hpas.pdf (accessed on 27 November 2024).
  3. Amanowicz, Ł.; Ratajczak, K.; Dudkiewicz, E. Recent Advancements in Ventilation Systems Used to Decrease Energy Consumption in Buildings—Literature Review. Energies 2023, 16, 1853. [Google Scholar] [CrossRef]
  4. Hydeman, M.; Taylor, S.; Stein, J.; Kolderup, E.; Hong, T. Advanced Variable Air Volume System Design Guide; California Energy Commission, Energy Design Resour: Sacramento, CA, USA, 2003. [Google Scholar]
  5. Okochi, G.S.; Yao, Y. A Review of Recent Developments and Technological Advancements of Variable-Air-Volume (VAV) Air-Conditioning Systems. Renew. Sustain. Energy Rev. 2016, 59, 784–817. [Google Scholar] [CrossRef]
  6. Kang, S.-H.; Kim, H.-J.; Cho, Y.-H. A Study on the Control Method of Single Duct VAV Terminal Unit through the Determination of Proper Minimum Air Flow. Energy Build. 2014, 69, 464–472. [Google Scholar] [CrossRef]
  7. Nassif, N.; Tahmasebi, M.; Ridwana, I.; Ebrahimi, P. New Optimal Supply Air Temperature and Minimum Zone Air Flow Resetting Strategies for VAV Systems. Buildings 2022, 12, 348. [Google Scholar] [CrossRef]
  8. Hurnik, M. Novel Cylindrical Induction Controller and Its Application in VAV Air Conditioning System in an Office Building. Energy Build. 2016, 130, 341–349. [Google Scholar] [CrossRef]
  9. Herzog, K.; Sullens, W.; Ivanovich, M.; Perez, H. Achieving High Satisfaction in High Performance Buildings. In Proceedings of the Conference: ACEEE Summer Study on Energy Efficiency in Buildings, Portland, Oregon, 12–15 August 2019. [Google Scholar]
  10. Awbi, H.B. Ventilation of Buildings, 2nd ed.; Spoon Press: London, UK; New York, NY, USA, 2002. [Google Scholar]
  11. Szczepanik-Scislo, N.; Schnotale, J. An Air Terminal Device with a Changing Geometry to Improve Indoor Air Quality for VAV Ventilation Systems. Energies 2020, 13, 4947. [Google Scholar] [CrossRef]
  12. Wang, W.; Zhang, J.; Brambley, M.R.; Futrell, B. Performance Simulation and Analysis of Occupancy-Based Control for Office Buildings with Variable-Air-Volume Systems. Energies 2020, 13, 3756. [Google Scholar] [CrossRef]
  13. Melikov, A.; Yordanova, B.; Bozkhov, L.; Zboril, V.; Kosonen, R. Human Response to Thermal Environment in Rooms with Chilled Beams. In Proceedings of the CLIMA, 2007, Helsinki, Finland, 10–14 June 2007; 2007; pp. 10–14. [Google Scholar]
  14. Arens, E.; Zhang, H.; Hoyt, T.; Kaam, S.; Goins, J.; Bauman, F.; Zhai, Y.; Webster, T.; West, B.; Paliaga, G.; et al. Thermal and Air Quality Acceptability in Buildings That Reduce Energy by Reducing Minimun Airflow from Overhead Diffusers. 2012. Available online: https://core.ac.uk/download/pdf/13801478.pdf (accessed on 5 January 2025).
  15. Arens, E.; Zhang, H.; Hoyt, T.; Kaam, S.; Bauman, F.; Zhai, Y.; Paliaga, G.; Stein, J.; Seidl, R.; Tully, B.; et al. Effects of Diffuser Airflow Minima on Occupant Comfort, Air Mixing, and Building Energy Use (RP-1515). Sci. Technol. Built Environ. 2015, 21, 1075–1090. [Google Scholar] [CrossRef]
  16. Saheb, Y.; Becirspahic, S.; Simon, J. Effect of the Certification on Chillers Energy Efficiency. In Proceedings of the IEECB’06, Frankfurt, Germany, 26–27 April 2006; p. 137. [Google Scholar]
  17. Wu, Y.; Mustakallio, P.; Kosonen, R.; Kaukola, T.; Chen, J.; Liu, H.; Li, B. Experimental Study of Five Different VAV Air Terminal Devices under Variable Heat Gain Conditions in Simulated Office and Meeting Rooms. Build. Environ. 2022, 209, 108641. [Google Scholar] [CrossRef]
  18. Rajaratnam, N. Turbulent Jets; Elsevier Scientific Publishing Company: Amsterdam, The Netherlands; Oxford, UK; New York, NY, USA, 1976. [Google Scholar]
  19. Beltaos, S.; Rajaratnam, N. Impinging Circular Turbulent Jets. J. Hydr. Div. 1974, 100, 1313–1328. [Google Scholar] [CrossRef]
  20. Poreh, M.; Tsuei, Y.G.; Cermak, J.E. Investigation of a Turbulent Radial Wall Jet. J. Appl. Mech. 1967, 34, 457–463. [Google Scholar] [CrossRef]
  21. Tanaka, T.; Tanaka, E. Experimental Studies of a Radial Turbulent Jet: 2nd Report, Wall Jet on a Flat Smooth Plate. Bull. JSME 1977, 20, 209–215. [Google Scholar] [CrossRef]
  22. Mierzwinski, S.; Popiolek, Z. Anemometria i Jej Zastosowanie w Badaniach Modelowych Procesów Odpylania i Wentylacji; Zakład Narodowy Imienia Osolinskich; Wydawnictwo Polskiej Akademii Nauk: Wrocław, Poland, 1980; Available online: https://delibra.bg.polsl.pl/Content/25922/BCPS_29531_1980_Anemometria-i-jej-za.pdf (accessed on 14 January 2025).
  23. Hargrave, G.K.; Williams, T.C.; Anandarajah, K.; Halliwell, N.A. The 3D Velocity Field of an Impacting Turbulent Jet. J. Phys. Conf. Ser. 2006, 45, 162. [Google Scholar] [CrossRef]
  24. Shademan, M.; Balachandar, R.; Roussinova, V.; Barron, R. Round Impinging Jets with Relatively Large Stand-off Distance. Phys. Fluids 2016, 28, 075107. [Google Scholar] [CrossRef]
  25. Tummers, M.J.; Jacobse, J.; Voorbrood, S.G.J. Turbulent Flow in the near Field of a Round Impinging Jet. Int. J. Heat Mass Transf. 2011, 54, 4939–4948. [Google Scholar] [CrossRef]
  26. Hurnik, M.; Kaczmarczyk, J.; Popiolek, Z. Study of Radial Wall Jets from Ceiling Diffusers at Variable Air Volume. Energies 2021, 14, 240. [Google Scholar] [CrossRef]
  27. Yadav, H.; Agrawal, A. Self-Similar Behavior of Turbulent Impinging Jet Based upon Outer Scaling and Dynamics of Secondary Peak in Heat Transfer. Int. J. Heat Fluid Flow 2018, 72, 123–142. [Google Scholar] [CrossRef]
  28. Van Hout, R.; Rinsky, V.; Grobman, Y.G. Experimental Study of a Round Jet Impinging on a Flat Surface: Flow Field and Vortex Characteristics in the Wall Jet. Int. J. Heat Fluid Flow 2018, 70, 41–58. [Google Scholar] [CrossRef]
  29. EN 12238; Ventilation for Buildings—Air Terminal Devices-Aerodynamic Testing and Rating for Mixed Flow Application. European Standard: Luxembourg, 2001.
Figure 1. Multi-cone diffuser used in the tests.
Energies 18 00411 g001
Figure 2. The rack with anemometric transducers and thermocouples.
Energies 18 00411 g002
Figure 3. Scheme of the testing room: (a) longitudinal section, (b) cross section, (c) system of thermocouples for measuring room temperature, (d) system of anemometer sensors and thermocouples for measuring air speed and temperature in RWJ.
Energies 18 00411 g003
Figure 4. Air volume flow measurement using the TSI 8710 capture hood.
Energies 18 00411 g004
Figure 5. Determination of the mean speed isoline.
Energies 18 00411 g005
Figure 6. The air speed isolines for isothermal RWJs from a multi-cone ceiling diffuser.
Energies 18 00411 g006
Figure 7. Examples of measured and approximated vertical velocity profiles with y 0.2 distances marked.
Energies 18 00411 g007
Figure 8. The air speed envelopes for isothermal and non-isothermal RWJs from a multi-cone ceiling diffuser: (a) Vo = 556 m3/h, (b) Vo =395 m3/h and (c) Vo = 248 m3/h.
Energies 18 00411 g008aEnergies 18 00411 g008b
Table 1. Instruments used in the measurements and the uncertainty of the measured quantities.
Measuring InstrumentUncertainty
TSI 8710 capture hood, TSI Incorporated, Shoreview, Minnesota, USA3% of reading
Precision micro-manometer of Furness Controls Limited, Bexhill-on-Sea, England0.005 + 0.005 Δp Pa
MTT-302 Multichannel thermocouple type T thermometer, Sensor Electronic, Gliwice, Poland 0.3 K
AirDistSys 5000 16 channel air speed measurement system, Sensor Electronic, Gliwice, Poland 0.03 + 0.02 · W m/s
Table 2. Model parameters for calculating the air velocity distribution in the RWJ from a multi-cone ceiling diffuser.
a u -0.906
rom−0.05
Aom20.0356
Ao0.5m0.189
a M -−0.00122
n M -1.71
Table 3. The boundary conditions: flow rate, momentum flux and outlet velocity.
Vom3/h793556395248
Vom3/s0.2200.1540.10970.0689
Mo/pm4/s21.3630.6700.3380.133
Uom/s6.194.343.081.94
Table 4. The boundary conditions: Vo, ∆to, Ar and jet parameters: L0.2 and ymax.
Series12345678910
Vo, m3/h793556556556556395395248248248
to, Kisothermisotherm0.5312isotherm8isotherm0.38
Ar002 × 10−410 × 10−440 × 10−4060 × 10−405 × 10−4135 × 10−4
L0.2, m4.93.93.93.73.13.02.12.02.21.5
ymax, m0.390.300.280.270.330.230.40.150.150.35
Disclaimer/Publisher’s Note: The statements, opinions and data contained in all publications are solely those of the individual author(s) and contributor(s) and not of MDPI and/or the editor(s). MDPI and/or the editor(s) disclaim responsibility for any injury to people or property resulting from any ideas, methods, instructions or products referred to in the content.

