Article

Optimal µPMU Placement Considering Node Importance and Multiple Deployed Monitoring Devices in Distribution Networks

by
Ruifeng Zhao
1,
Jiangang Lu
1,
Yizhe Chen
2,
Yifan Gao
2,
Kai Gan
2,
Ming Li
3,
Chengzhi Wei
3,
Runhong Huang
3,
Fan Xiao
4 and
Liang Che
4,*
1
Power Dispatching and Control Center, Guangdong Power Grid Co., Ltd., Guangzhou 510600, China
2
Zhaoqing Power Supply Bureau, Guangdong Power Grid Co., Ltd., Zhaoqing 526040, China
3
Electric Power Research Institute, China Southern Power Grid Co., Ltd., Guangzhou 510663, China
4
College of Electrical and Information Engineering, Hunan University, Changsha 410082, China
*
Author to whom correspondence should be addressed.
Energies 2025, 18(2), 395; https://doi.org/10.3390/en18020395
Submission received: 13 December 2024 / Revised: 10 January 2025 / Accepted: 15 January 2025 / Published: 17 January 2025
(This article belongs to the Section F1: Electrical Power System)

Abstract

:
The placement of micro phasor measurement units in an active distribution network can improve the monitoring performance of the system. However, the price and placement cost of micro phasor measurement units are high, so existing research mostly focuses on solving the problem of achieving global observability with the minimum number of micro phasor measurement units. However, the problems of frequent topology change in the distribution network and the increase in the number of faults that will be caused by the high proportion of distributed energy resources connected to the system may lead to the above placement scheme losing the observability of the system. The balance of maintaining the number of micro phasor measurement units placed while ensuring the monitoring stability of the system remains a crucial challenge. To address this issue, a micro phasor measurement unit placement method that considers the observability of multiple monitoring devices and node importance is proposed in this paper, which, on the one hand, fully considers the impact of the observability of existing monitoring devices on the micro phasor measurement units placement scheme and reduces the number of micro phasor measurement units that are used to achieve global observability, and, on the other hand, gives priority to placing the micro phasor measurement units at important nodes in the distribution network that are closely related to observation stability, improving the observation performance of the system. The superiority of the proposed μPMU method is verified in standard systems such as IEEE-33, IEEE-34, and P&G69, in which the number of required μPMUs is reduced by 20%, and the observation performance of the system is improved by 30% in special cases.

1. Introduction

In recent years, with the increasing proportion of DER connected to the grid, the DN has transformed from a traditional radial DN to an active DN. The randomness of DER has brought new challenges to DN [1], which puts forward higher requirements for the observability and controllability of DN [2]. Placing μPMUs in the DN can improve the monitoring level and measurement redundancy of the system, but the high price and strict placement conditions of μPMUs make large-scale placement still difficult. Therefore, it is of great significance to study how to place μPMUs in a reasonably small amount.
Existing PMU placement research mostly uses the minimum number of PMUs or the minimum cost of PMU placement as the main objective function, e.g., Refs. [3,4,5,6] have constructed placement schemes that reduce the number of μPMUs using methods such as information theory and immune genetic algorithm, which typically result in multiple solutions with the same number or cost of PMUs during the optimization process. To select the optimal solution, some studies have considered auxiliary objectives in the PMU placement problem. Ref. [7] considers the installation costs of PMU’s measurement channels and communication links, which is more suitable for the actual working situation; Ref. [8] considers the division of the DN’s fault-monitoring domain to ensure effective fault monitoring of the placement scheme; Ref. [9] combines state perception research to minimize the perception error of placement schemes.
Based on the above research, to further reduce the number of μPMUs to achieve global observability in the system, some researchers have reconstructed the optimization scheme by combining the observability performance provided to the system by the existing measurement devices. Refs. [10,11] considered the impact of ZIB on the global observability of the system and reduced the number of μPMUs required for the placement, while Ref. [12] optimized the placement of PMUs in conjunction with the meters to reduce the requirement of achieving global observability of the system. Ref. [10] uses FTUs in conjunction with μPMUs, and the observation cost of the placement scheme is significantly reduced.
In addition, the placement scheme obtained to minimize the number of μPMUs is usually the critical scheme to achieve the observable system; however, in the event of special circumstances such as μPMU faults or topology changes, it is difficult to guarantee the observable performance of the system effectively. Some research considers the observation performance of the proposed placement scheme in special cases as an auxiliary function. Ref. [13] considers the system disconnect constraint to ensure that global observability can still be guaranteed after the system is disconnected in case of faults. Ref. [14] investigates the impact of PMU failure on observability and proposes a PMU placement scheme with higher reliability. Ref. [15] considers the fault rate of the line and the PMU to construct a placement model with the highest probability of observational stability. Refs. [16,17] constructed a second-order observability-constrained μPMU placement scheme, which guarantees the observation performance of the system in arbitrary situations.
The above research provides an effective reference for subsequent work, but the following challenges still exist in a DN which contains DER:
(1)
The number of μPMUs required to realize the global observability of the DN is large and the cost of placement is high. The number of PMUs required to realize the global observability of a DN is significantly higher than that of transmission networks due to the small number of lines connected to a single node, and, under the same circumstances, only 1/4 of the number of nodes of PMUs are required to realize the global observability of transmission grids, while 1/3 of the number of PMUs are required for the DN [10]; meanwhile, the larger number of nodes of DN further raises the requirement of the number of μPMUs. Although the above studies [10,11,12,18] reduced the number of configured μPMUs by combining PMUs with existing devices, they all consider only one type of measurement device and do not sufficiently combine multiple measurement devices that exist in the DN, and there is still a large potential to reduce the number of μPMU placements. There is an urgent need to study the μPMU placement scheme for the synergistic optimization of multiple monitoring devices.
(2)
It is still difficult to simultaneously balance the number of PMUs and the observability of the system in the event of line breaks [19,20], PMU failures [18,21], and topology changes [22,23] (“special cases” is used to indicate these faults below). First, Refs. [13,14] include single special cases such as line break and μPMU faults in the consideration of μPMU placement, and give the corresponding constraints, which theoretically can guarantee the observation performance of the system if there are enough constraints involved. However, it is undoubtedly difficult to consider a wide variety of DN fault forms, and more general strategies that can ensure observation performance need to be considered. Ref. [5] establishes a joint fault probability of the μPMU placement model, but it needs to collect the occurrence probability of various faults through historical data statistics, which is too idealized and difficult to achieve. Second, some of the methods obtained with second-order observability as a constraint [16,17], which can guarantee system observability in any special case, require more PMUs (about 1.5–2 times), which cannot meet the economy. Some researchers have partly considered the above two points by considering the maximization of measurement redundancy in the objective function [10], which improves the observability of the system under special cases by preferentially placing PMUs at nodes with a higher number of connected branches and increasing the overall number of observations at system nodes. However, this measurement redundancy only considers the overall number of system observations and focuses on placing μPMUs at a few nodes with high measurement redundancy, while neglecting the consideration of the remaining nodes, which does not guarantee the observability of the system under special cases. A typical example is that, in the case of topology transformation, some of the neighboring nodes with open lines have a high risk of losing observability, which should also be prioritized for the placement of μPMUs. Nowadays, supporting the global observability of the system in normal and special cases with a small number of PMUs is still an urgent problem.
To address the above challenges, an OPP method that considers the observability of multiple monitoring devices and the importance of nodes is proposed in this paper. First, the impact of multiple system-deployed monitoring devices (Meter, FTU) and ZIBs on system observability is fully considered in the μPMU placement; second, the μPMUs are placed in combination with the node importance, and nodes in the DN with high correlation with observation stability (i.e., nodes with high observation redundancy, adjacent nodes of lines with frequent topology changes, and nodes with small electrical distances [24]) are set as critical nodes, and these nodes are given a higher importance factor, and by maximizing the node importance factor, priority is given to placing PMUs at important nodes and nodes with more connected important nodes. Table 1 provides a comparison with existing studies. The main work of the study can be attributed to the following aspects:
(1)
To address the issue of the large number of μPMUs required to realize global observability in existing DNs, the observation performance provided by the existing measurement devices for the system is fully utilized, so that they can provide higher observability performance for the system. The number of PMUs required to realize global observability in active DNs is reduced as a result.
(2)
We aim in this study at the problem of insufficient observability of the existing μPMU placement scheme in special cases such as line fault and topology change. The observation stability of each node in the DN is analyzed under special cases, and the μPMUs are preferentially placed at critical nodes in the DN that are more relevant to the observation stability, and the observation performance of the system is thus improved.
The remainder of the paper is organized as follows. Section 2 analyzes the observability of DN. Section 3 presents the method of μPMU placement. Section 4 models the μPMU placement and gives the solution. Section 5 gives the results of the simulation. Section 6 concludes all the work.

2. Analysis of DN Observability

In this section, observational analyses are conducted on μPMUs, ZIBs, meters, and FTUs, and a multi-observation constraint is designed based on these analyses. It should be noted that the analysis of the observability of the system is based on the following simplifications or assumptions:
(1)
The network topology of the power system only considers the electrical topology of the system without considering large-scale geographic distribution or geographic barriers, and the parameters need to be known. This is because the analysis of the observability of the system is built based on reasoning about the power network, due to the limited number of measurement devices, which is not sufficient to install measurement devices at each node. The nodes of the system that are not placed with measurement devices need to be deduced from the data collected by existing measurement devices and the network topology parameters. The above-simplified topology parameters and structure can often be obtained from power operators.
(2)
Each measurement device can operate normally, and can correctly measure the required electrical parameters, and ensure that the measurement error is maintained in a certain acceptable range. This is because the essence of the measurement placement problem is a process of reasoning the unknown measurement data through the existing measurement data; to ensure the measurement accuracy of the existing measurement is the premise of deducing the global state of the power system. This assumption is also the premise to meet the stable operation of the power system.
(3)
Communication and data transmission assume that data transfer between systems is either latency-free or that the latency is small enough not to affect the real-time performance of the system. It is also required that the communication channel is highly reliable and does not suffer from severe packet loss or loss of data. This is because extrapolating an unknown system state using known gauge data requires that all data be analyzed simultaneously. This communication and data transmission problem corresponds to another specialized research area in power systems and is not the focus of this paper.

2.1. Observability Considering PMUs

This subsection analyzes DN observability with PMUs. The DN is observable, which means that all voltage magnitudes and phase angles of all the nodes in the DN can be observed directly or indirectly [18]. PMUs are placed with voltage measurement devices and current measurement channels, and the voltage at the node where the PMU has been placed as well as the current vectors of the individual outgoing lines of the node can be measured directly, i.e., nodes with PMU placed can be observed directly by the DN [20]. Based on the voltage and current vectors measured by the PMU, the topological impedance parameters of lines in the DN, and the basic circuit theories (Kirchhoff’s law, Ohm’s law, etc.), it is possible to derive the voltage vectors of the adjacent nodes to the node where the PMUs are placed [31, i.e., adjacent nodes of the node where the PMUs are placed can be observed indirectly by the DN through the calculations:
A X > B
A = a 1,1 a 1 j a 1 , n a i j a n , 1 a n , j a n , n
a i j = 1 i = j 1 Node   i   and   node   j   are   topologically   connected 0 Node   i   and   node   j   are   topologically   unconnected
X = x 1 x i x n T
x i = 0   PMU   not   placed   at   node   i 1   PMU   placed   at   node   i

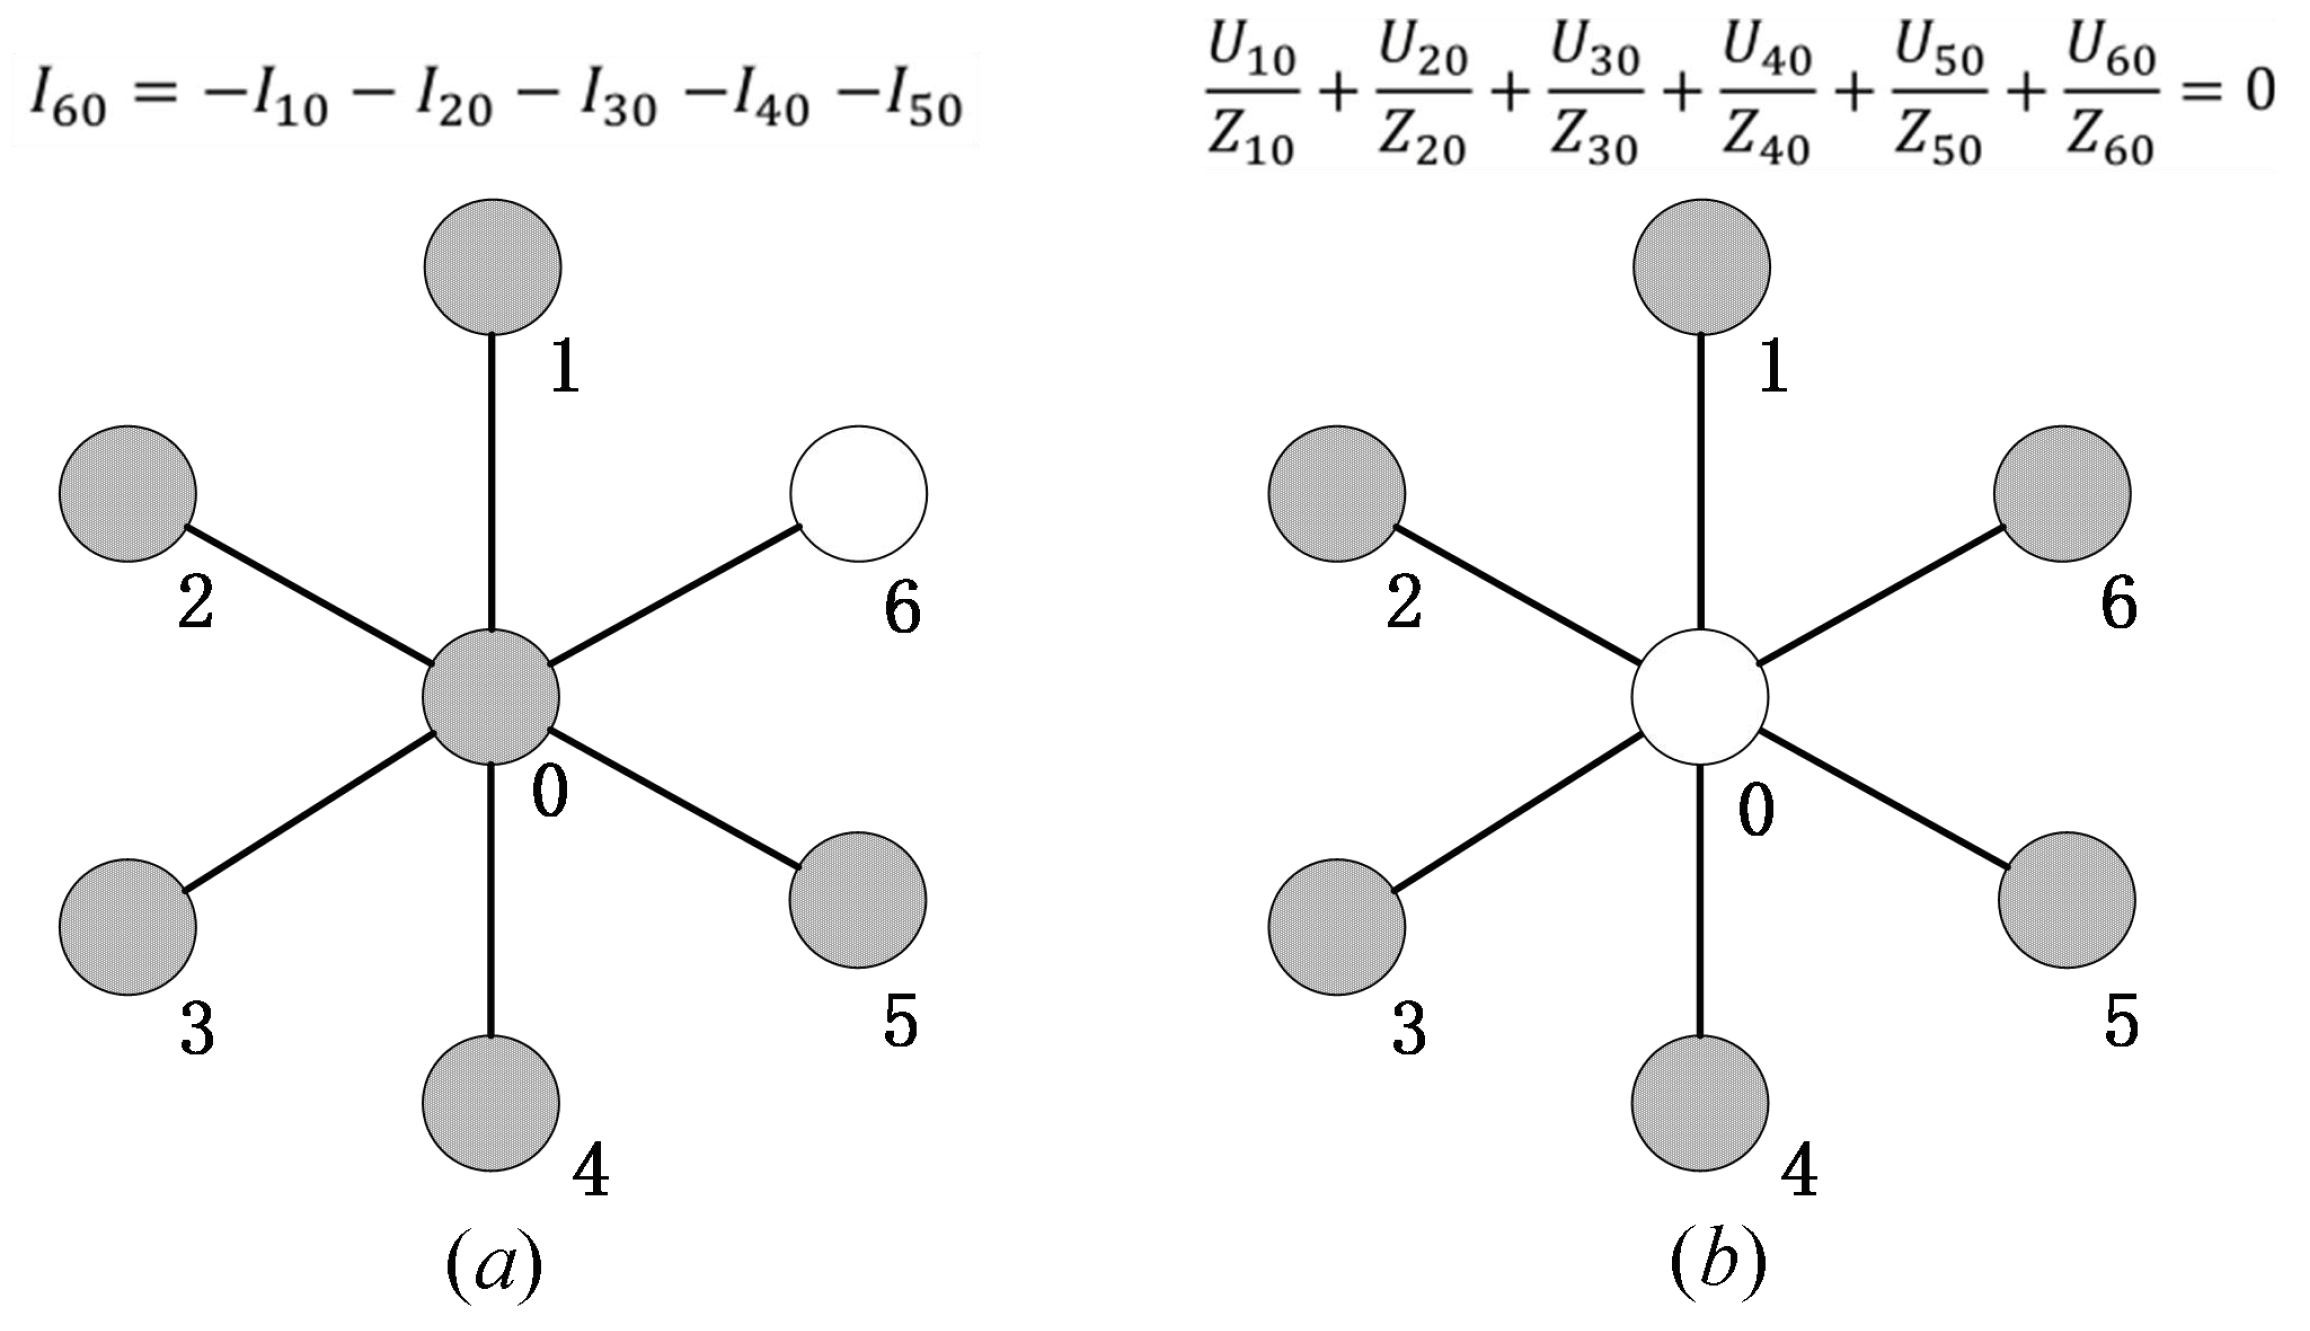
2.2. Observability Considering ZIBs and Meters

This subsection analyses DN observability with ZIBs. The ZIB is a bus that has neither active and reactive power injected by the generators nor load power outflow [25]. Because of the property of zero-injection above, ZIB can relax the observability constraint requirements with their adjacent nodes in the problem of OPP [11]. As shown in Figure 1a, if the ZIB 0 has only one adjacent node 6 which is unobservable, the currents in its branch 0–6 can be found by summing the current vectors of the other branches, which in turn can be used to find the voltage vector of node 0 through the law of circuits; as shown in Figure 1b, if only the ZIB 0 is unobservable, it can be used to find the voltage vector of ZIB 0 by setting it to be an unknown constant, which can be solved through the equation.
The above two cases can be considered together as one, i.e., if any m-1 nodes are observable among the m connections including ZIB, then all m nodes are observable. Many existing studies of PMU optimization consider ZIB, but very few of them fully consider the above two cases. In addition, the existing studies do not give the standard constraint matrix that facilitates the solution of the problem, based on which the derivation of the ZIB constraint matrix is proposed, as shown in the following equation:
P z = p z 1 p z i p z n T
P z = A z A z . A z T diag = 0 A X i f   n o t   0   s e t   1
C z = c z 1 c z i c z n T
c z i = 0     p z i m z 1 1     p z i = m z 1
The meter can measure the amount of power injected into the node, so the node on which the meter is placed has the same observability as the ZIBs. Therefore, the node where the meter is placed can be equivalent to a ZIB, which can also be solved by using Equations (6)–(9).

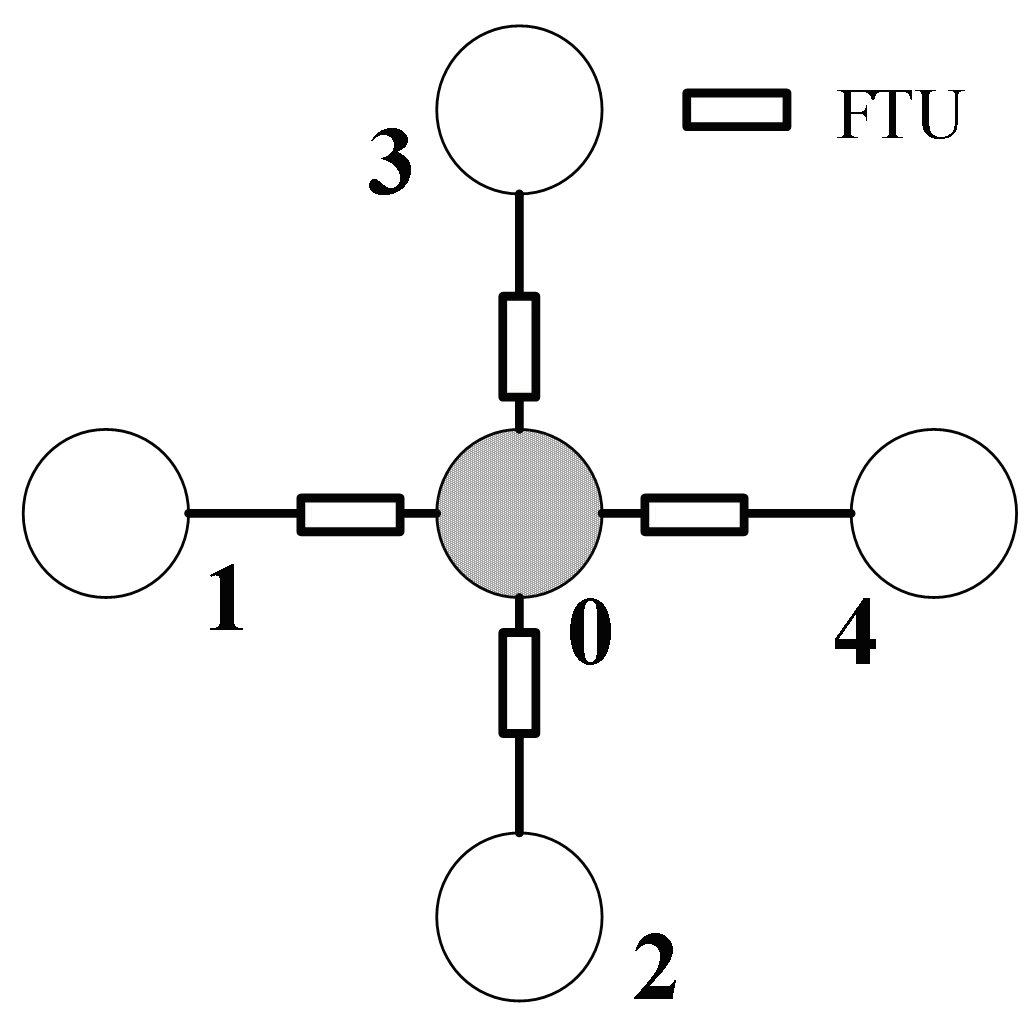
2.3. Observability Considering FTUs

This subsection analyses DN observability with FTUs. An FTU is a device that can collect measurements of voltage, current, and power, open and close segmented switches, etc., and has been widely used in information collection, state monitoring, fault location, and isolation of the DN [25,26], etc. The power data of branches in the DN collected by FTUs can be used to find out the current of the corresponding line, and if the voltage of one node in the two ends of the line is known, the voltage of the other node can be found out by the voltage of the node and the measurement data of FTUs, as shown in Figure 2.
Therefore, in the problem of PMU placement, if a node is directly or indirectly observable, and an FTU is placed on a branch of that node, the node connected through that branch is also observable, which is transformed into the standard constraint equation as follows:
A f t u = a t 1,1 a t 1 j a t 1 , n a t i j a t n , 1 a t n , j a t n , n
a t i j = 0 i = j 1 FTU   placed   between   node   i   and   node   j 0 No   FTU   placed   between   node   i   and   node   j
D = A f t u A X i f   n o t   0   s e t   1

2.4. Observability Constraint

For the sake of clearly discussing the proposed placement method of μPMU considering the importance of buses and the observability of the multiple monitoring terminals. Based on the previous three sections, the observable constraints used in place μPMU are listed as follows:
(1)
Nodes are directly observable if PMUs are placed, and indirectly observable if they are topologically connected to nodes with PMUs placed;
(2)
If the node is a ZIB or placed with a meter, and m-1 of the m nodes connected to the node are either directly observable or indirectly observable, then the remaining nodes are indirectly observable;
(3)
FTUs are placed on the line connecting the two nodes, and when any one node is directly or indirectly observable, the other node is indirectly observable.
The mixed constraints of this study can be expressed by the following equation, where Z is the ensemble of ZIBs:
A X + z Z C z + D > B

3. μPMU Placement Optimization

This section describes the calculation of the cost of the μPMU placement and the method of assessment of critical nodes, and based on this, the optimization scheme of this paper is proposed.

3.1. Cost of μPMU Placement

To reduce the cost of μPMU placement in the DN, it is usually assumed that all μPMUs are equal in price, and the problem of μPMU placement can be approximated to be equivalent to accomplishing the global observability of the DN with the minimum number of μPMUs. However, in practice, the cost of μPMUs placed on different nodes is not different, which depends on the number of measurement channels of the μPMUs [21]. Therefore, the cost function can be constructed by considering the placement cost of μPMUs at different nodes:
M = i = 1 n F C × x i + C C H × j n A i j

3.2. Assessment of Critical Node

In this subsection, the method for the assessment of the importance of each node is given. To improve the observation performance of the system in special cases, the nodes that are more associated with the observation stability are defined as critical nodes, and the arrangement of μPMUs at these critical nodes is prioritized in this paper, in which the evaluation formulas of the importance of each node are shown as follows Equations (15)–(21). The DN node observability (17), the node observability in the case of topology change (18), and the importance of each node to the system operation [24] (19) are considered, respectively. Among them: (1) node observability refers to nodes with a high number of lines, because when a node placing a μPMU, its neighboring nodes can also obtain observability through measurements of branch, so placing a μPMU at a node with a high number of neighboring nodes can maximize the use of its measurement performance, and placing a measurement device at this node can provide a higher redundancy of observability for the system; (2) when the system undergoes a topology change, the opening and closing of the line will often cause the lack of system observability, as the node with PMU placed can ensure its own observability through PMU even if the neighboring lines are disconnected, placing PMU on the node adjacent to the frequently disconnected lines can effectively reduce the unobservability caused by topology change; (3) the importance of each node to the system operation refers to the node which is more important to the safety and stability of the system, i.e., the fault of the node may lead to a global problem or cause a bigger problem for the system, and global problems or cause greater losses. The electrical coupling connectivity proposed in Ref. [24] is adopted in this paper to quantify the importance of each node. The node importance index is derived from Equation (15), and the index of importance of each node is related to its neighboring nodes so that the μPMUs in DN are prioritized to be placed at critical nodes and nodes with more connections to critical nodes during the OPP process.
N c e s i = x i j ϵ n N i j
N i j = α a i j N j t N j d N j c   i = j a i j N j t N j d N j c     i j
N j t = γ 1 + ( 1 γ 1 ) S u m A j M ax S u m A i i n
N j d = γ 2 + ( 1 γ 2 ) 1 i = 1 , i j i = n Z i j . e q u
N j D G = γ 3 + ( 1 γ 3 ) n j D G
Z i j . e q u = Z i i Z i j ( Z i j Z j j )
n j D G = 1   N o d e   j   c o n n e c t e d   t o   D G s 2   N o d e   j   n o t   c o n n e c t e d   t o   D G s

3.3. μPMU Placement at Critical Nodes

In this paper, the objective function is established by comprehensively considering the cost of μPMU and the importance of nodes, and, while reducing the cost of μPMU placement, the μPMUs are prioritized to be placed at critical nodes in DN or nodes with more connections to critical nodes, to improve the monitoring capability and monitoring accuracy of critical nodes. The scheme of μPMU placement at critical nodes is as follows:
F = min M β n i n N c e s i

4. μPMU Placements Optimization Model

4.1. Model Establishment

Based on the previous two sections, an OPP method is proposed in this paper that considers the node importance, and the effect of multiple deployed monitoring devices as follows:
F = m i n M β n i n N c e s i s t .     A X + z Z C z + D > B

4.2. Model Solution

In this paper, adaptive weight coefficient simulated annealing algorithm is used to complete the solution of the model, the flowchart of the solution is shown in Figure 3. First, randomly generate the solution that meets the constraints and assign it to the temporary solution. Next, use the interpolation method, exchange method, mutation method, inverse order method, and other change strategies to generate a new solution that meets the constraints; then update the parameters to save the optimal solution and assign the new solution to the temporary solution; and finally, iterate until it reaches the maximum number of iterations, and then output the optimal solution.
Next, the adaptive weighting coefficient simulated annealing algorithm process is shown in Figure 4. First, randomly set the initial solution, calculate the objective loss function, and compare the existing solution with the new solution; if the new solution is smaller than the existing solution, then replace the existing solution as the new optimal solution, otherwise, there is a certain chance to change the new solution to the optimal solution. Next, compare the current solution with the optimal solution, if the current solution is smaller than the optimal solution, replace the optimal solution with the current solution. Then, update the weights of the simulated annealing algorithm according to the current solution and modify the current solution to obtain the new solution. Finally, iterate until the maximum number of iterations is reached, and gradually reduce the annealing coefficient in each iteration. For details, please refer to the Appendix A.
The parameters of the annealing algorithm set in this paper, the number of outer loop iterations Niter, the quenching coefficient T0, and the annealing coefficient α b , are shown in Table 2.

5. Simulation and Analysis

In this section, the proposed method is validated by the IEEE-33 system. First, the effectiveness of the proposed adaptive weight coefficient simulated annealing algorithm is verified in Section 5.1. Second, the effect of multi-measurement devices on the μPMU placement scheme is verified in Section 5.2. Finally, the effectiveness of prioritizing the placement of μPMUs at critical nodes is verified in Section 5.3.

5.1. Validation of Algorithm

This subsection verifies the effectiveness of the proposed adaptive simulated annealing algorithm in two ways.
Firstly, to verify the convergence of the proposed method, a simulation comparison is carried out with the genetic algorithm described in Ref. [27] as well as the ordinary simulated annealing algorithm on the IEEE123 system. Considering that the heuristic algorithms are random and do not obtain the optimal solution every time, the three algorithms are iterated 1000 times, respectively, and the resultant training process is obtained as shown in Figure 5.
From Figure 5, the genetic algorithm has a higher probability of obtaining the optimal solution than the simulated annealing algorithm, but its convergence speed is slower, and it often takes 80 rounds of iterations to obtain the optimal solution; the simulated annealing algorithm can obtain the optimal solution with 30 rounds of iterations, which is faster than the genetic algorithm, but it is weaker than the genetic algorithm in terms of the solution effect. The adaptive simulated annealing algorithm proposed in this paper can efficiently solve the μPMU placement problem with 40 rounds of iterations and obtains a higher probability of solving the optimal solution compared with the previous two.
Secondly, to visually demonstrate that the optimal placement scheme obtained by the proposed algorithm can satisfy the observability constraints of the system, the simulations on the IEEE33 node system (the number of nodes in this algorithm is relatively moderate, which makes it convenient to graphically demonstrate that the proposed method can satisfy the observability constraints), are carried out in this paper, in which node 10 and node 6 are the ZIB of the system. The results obtained are shown in Table 3 and Figure 6 below.
From Table 3 and Figure 6, all 33 nodes of the system are observable, 11 of them are directly observable by placing μPMUs, 20 are indirectly observable by being directly connected to the nodes with μPMU placed, and nodes 11 and 27 acquire observability by ZIB.

5.2. μPMU Placement Scheme Considering Existing Monitoring Devices

The rationality and effectiveness of the proposed plan which consider existing monitoring devices are verified in this section.

5.2.1. Rationality Verification

The rationality of the proposed placement scheme combining the existing monitoring devices is verified in IEEE33, to reflect the observation performance provided by the established devices, in this paper, the IEEE-33 node system of the branches 6–26 and 14–15 add FTUs, and the 33 nodes add the meter, and the μPUM placement scheme before and after the addition of the devices is compared, and the results are shown in Figure 7 and Table 4 below.
The proposed placement scheme, which combines existing monitoring devices, is verified in the IEEE-33 node system. To reflect the observation performance provided by the existing terminals, FTUs are added to branches 6–26 and 14–15, and meter are added to the nodes 33 in the IEEE-33 system. A comparison is made between the μPMU placement schemes before and after the addition of these terminals, with the results shown in Figure 8 and Table 4 below.
From Table 4, after considering the placed monitoring devices, the number of μPMUs in the μPMU placement scheme is reduced by two, which saves cost while still ensuring the global visibility of the system. Among them, nodes 2, 5, 9, 13, 17, 21, 24, 29, and 32 are directly monitored by μPMUs, nodes 1, 3, 4, 6, 8, 10, 12, 14, 16, 18, 19, 20, 22, 23, 25, 28, 30, 31, and 33 are indirectly observable as they are adjacent to nodes where μPMUs have been placed, and nodes 7, 11, and 27 are indirectly observable by ZIB. Nodes 15 and 26 are indirectly observable by the deployed monitoring devices. The simulation results show that the μPMU placement method proposed in this paper fully considers the optimization of the μPMU placement scheme by multiple monitoring devices and effectively reduces the number of μPMUs required for the placement.

5.2.2. Effectiveness Verification

To further validate the superiority of the proposed methodology, simulations are carried out on additional larger-scale systems (IEEE 33, IEEE 34, and PG&E 69 systems). Due to space limitations, only the IEEE 33 system will be described here. The IEEE 33 system features nodes 1–33 that are numbered, and switches s1–s37 that are labeled. Meters are deployed at nodes 6 and 27, and FTUs are installed on lines 2–19, 23–24, and 28–29. Since DNs operate in an open loop, simulations are conducted using the topology structure of the open-loop design (where switches s1–s32 are closed and switches s33–s37 are open) and verified by simulation comparison in Refs. [28,29,30,31,32]. The results obtained are shown in Table 5.
From Table 5, the method is consistent with the effect of [28,29] on the IEEE 33 system, and only 11 μPMUs are needed to potentially satisfy the requirement of global observability of the system, which is better than [30,31]; on the IEEE 34 system, the number of μPMUs required by the proposed scheme to realize the global observability of the system is consistent with that of the Ref. [28] and is less than that of the Refs. [29,30,31]. On the PG&E 69 system, the number of μPMUs required by this paper’s method is 4, 5, 6, and 8 (about 20% on average) less than those of [28,29,30], respectively. It is clear that the proposed scheme achieves the optimal simulation results under various simulation systems, which is due to its full utilization of the observation performance provided by the existing measurement devices in the system, and reduces the observability provided by the μPMUs to realize the global observability.

5.3. Effect on μPMUs Placement Considering Node Importance

To verify the effectiveness of introducing node importance, simulations are carried out in this subsection on two aspects: the effect of node importance on the placement scheme and the effectiveness of prioritizing the placement of μPMUs at critical nodes to enhance the observation performance of the system.

5.3.1. The Impact of Node Importance on Placement Schemes

The importance of each node according to Equation (15) is shown in Figure 8, where the darker color indicates the higher importance of the corresponding node.
Combining the node importance parameters obtained from the above figure, two μPMU configuration schemes are derived as shown in Table 6 below. Where the importance of each node is higher in Scheme 1 than in Scheme 2.
To visually demonstrate the difference between the μPMU placement schemes that consider different node importance, the analysis is performed in conjunction with Figure 9. The figure is compared with Scheme 1 and Scheme 2, and the image results show that Scheme 1 is associated with more critical nodes than Scheme 2. The proposed scheme can effectively place μPMUs on the critical nodes in DN.

5.3.2. The Effectiveness of Prioritizing the Placement of μPMUs at Critical Nodes

Comparing the proposed node importance-based μPMU placement method with existing strategies that consider measurement stability (comparison includes ignore observation redundancy [32] scenarios with more redundancy [31], and average maximum observation redundancy for multiple scenarios [33]), the effect of the proposed scheme in improving the observation stability has been verified, where the observation stability of the system in the presence of μPMU fault, line breaks, and topology changes is used as a control experiment. The simulation is run on IEEE33, and the switches with the highest number of openings and closings (S8, S9, S14, S28, S16, S32, S36, S37) in [34] are used to simulate the line openings and closings in the case of topology changes. The experimental results are shown in the following Table 7 and Table 8.
From Table 7, the observed index of the proposed scheme is better than the methods in the case of either line break or μPMU faults (The average risk is reduced by 30%). As for Ref. [24], the index under both fault conditions is much better than the other three schemes, which is mainly because the number of μPMUs used in [24] is also much more than the other schemes. In contrast, the method proposed in this paper better ensures the observation stability of the system in special cases while keeping the number of μPMUs relatively low.
From Table 8, the proposed method avoids the system unobservability caused when topology changes occur in the DN, which is better than the other three methods. This is mainly because the proposed method includes the nodes with frequent topology openings breaks into the category of critical nodes, and prioritizes the placement of μPMUs at these nodes, which improves the observation stability of these nodes.

6. Conclusions

An OPP method is proposed in this paper which considers the observability of multiple monitoring devices and the importance of nodes:
(1)
In response to the problem of many μPMUs required for global observability in existing DNs, the layout of μPMUs fully utilizes the observation performance provided by existing measurement devices for the system, reducing the number of PMUs required for achieving global observability. Among them, the number of PMUs required for global observability in IEEE33, IEEE34, and P&G69 systems is less than existing methods, and more μ PMUs are saved as the system grows.
(2)
Aiming at the problem of insufficient observability of existing μPMU placement schemes in special cases such as line fault and topology changes. In this paper, the placing μPMUs at critical nodes in the DN that are more related to the observation stability (e.g., high-observable redundant nodes, adjacent nodes of frequently disconnected lines), which improves the observation performance of the system in the case of disconnected faults and μPMU fault, and greatly reduces the unobservable risk of the system caused by topology changes in the DN. Higher monitoring stability of the system is ensured with a smaller number of μPMUs.
The proposed study considers, when considering the importance of nodes, prioritizing the PMUs to be placed at the nodes with a higher number of connected branches to improve the overall number of observations at the system nodes. However, the problem of uneven distribution of measurement redundancy is neglected, i.e., a small number of nodes have high measurement redundancy while the majority of nodes still have 0 redundancy, and this part of nodes with 0 observation redundancy still has a greater risk of being unobservable, and the subsequent study will focus on improving the observation redundancy of each node to further enhance the observation stability of the placement scheme.

Author Contributions

Conceptualization, writing—original draft preparation, R.Z.; conceptualization, methodology, supervision, writing—review & editing, J.L.; software, formal analysis, methodology, writing—review & editing, Y.C.; software, validation, resources, funding acquisition, writing—review & editing Y.G.; formal analysis, funding acquisition, writing—review & editing, K.G.; formal analysis, investigation, writing—review & editing, M.L.; formal analysis, resources, writing—review & editing, C.W.; data curation, visualization, validation, writing—review & editing, R.H.; data curation, visualization, validation, writing—review & editing F.X.; writing—original draft preparation, R.Z.; writing—review and editing, L.C.; visualization, L.C.; supervision, L.C.; project administration, L.C. All authors have read and agreed to the published version of the manuscript.

Funding

The authors declare that this study received funding from the Science & Technology Projects of China Southern Power Grid Co., Ltd., grant number 031200KK52222026 (GDKJXM20222220). The funder had the following involvement with the study: conceptualization, data curation, formal analysis, funding acquisition, investigation, methodology, resources, software, supervision, validation, visualization, writing—original draft preparation, writing—review & editing.

Data Availability Statement

The data are unavailable due to privacy.

Conflicts of Interest

Authors Ruifeng Zhao and Jiangang Lu were employed by the Power Dispatching and Control Center, Guangdong Power Grid Co., Ltd. Authors Yizhe Chen, Yifan Gao and Kai Gan were employed by the Zhaoqing Power Supply Bureau, Guangdong Power Grid Co., Ltd. Authors Ming Li, Chengzhi Wei and Runhong Huang were employed by the Electric Power Research Institute, China Southern Power Grid Co., Ltd. The remaining authors declare that the research was conducted in the absence of any commercial or financial relationships that could be construed as a potential conflict of interest.

Nomenclature

The abbreviations or symbols used in this text are detailed below:
Abbreviations
DERdistributed energy resourcesFTUfeeder terminal unit
DNdistribution networkOPPoptimal µPMU placement
μPMUsmicro phasor measurement unitsZIBzero-injection bus
Symbol
Athe system adjacency matrix in n × n dimensionsZthe set of ZIBs
Xthe PMU placement matrix in n × 1 dimensionsMthe total cost of the placement scheme
Bthe matrix with all elements equal to 1 in n × 1 dimensionsFCthe unit cost of the voltage measuring device
a i j the elements in the ith row and jth column of matrix ACCHthe unit of the current measuring device
x i the nth element in matrix X N c e s i the importance of node i
nthe number of nodes N i j the importance of node j observed by node i
P z a 1 × n matrix of observability of adjacent nodes of the ZIB N j t the topological importance of node j
p z i the number of nodes except the ith node that is observable among the nodes connected to the ZIB N j d the importance of the electrical distance of node j
A z the zth row of the adjacency matrix A N j c the importance of node j which considers the DGs and frequent disconnection of line joint points
A X i f   n o t   0   s e t   1 the value of non-zero elements in the matrix (AX) is set to 1 N j D G the DG coefficient of node j
m z the number of nodes connected to the zth ZIB x i whether the ith node has a µPMU placed or not
C z the indirect observable matrix representing the ZIB z Z i i , Z j j the self-impedance of node i or j
C z i the nth element in the matrix C z Z i j the mutual impedance between nodes i and j
A f t u the line matrix of FTUs placed in n × n dimensions Z i j . e q u the equivalent mutual impedance between nodes i and j
a t i j the elements in the ith row and jth column of the matrix A f t u n j D G the DG coefficient of node j
Dthe indirect observability matrix of FTUs in n × 1 dimensions α ,   γ 1 , γ 2 , γ 3 the constant coefficients of the importance of the nodes
zZIB β the weight coefficient

Appendix A

Energies 18 00395 i001
Algorithm A1. Weighting coefficient simulated annealing a algorithm.
  Step 1: Randomly generate a binary-encoded target vector with the length of the number of nodes to represent the installation of PMUs, where 1 indicates the system nodes with PMUs installed.
  Step 2: Determine whether the current objective vector satisfies the mixed observation constraint, if so turn to step 3 and record the current objective function value as the optimal value, otherwise turn to step 1.
  Step 3: Update the target vector by randomly using any of the following strategies:
  ① Descending strategy: randomly select an element in the vector with value 1 and set it to 0. The number of elements set to 0 follows a normal distribution with a mean of 1 and a standard deviation of 1 (absolute value, rounding).
  ② Ascending strategy: randomly select an element in the vector with value 0 and set it to 1. The number of elements set to 1 is fixed at 1.
  ③ Changing strategy: randomly exchange the positions of two elements in the target vector, including interpolation, exchange, and reverse.
  Step 4: Check if the mixed observation constraints are satisfied. If they are, move to step 5 and record the current objective function value; otherwise, go back to step 3 to update the target vector.
  Step 5: Compare the objective value with the optimal value. If the former is smaller, replace the target vector; otherwise, there is a chance to update the target vector based on the difference between the optimal and the objective values.
  Step 6: Update the factors in the descending and changing strategies based on the number of elements equaling 1 in the target vector. Check if the termination condition is met; if yes, output the target vector; otherwise, go back to step 3.

References

  1. Wu, Z.; Yu, X.; Dong, X.; Liu, Z.; Chen, L.; Li, P. Real-time Situation Awareness and Evaluation of Distribution Network Based on State Estimation. Proc. CSU-EPSA 2018, 30, 140–145. [Google Scholar]
  2. Bai, L. PMU Application Prospect in the Distribution and the Optimized Allocation of Research. Master’s Thesis, North China Electric Power University, Beijing, China, 2009. [Google Scholar]
  3. Mallikarjuna, B.; Gopakumar, P.; Jaya Bharata Reddy, M.; Mohanta, D.K. A case study on optimal phasor measurement unit placement for emerging Indian national smart grid. In Proceedings of the 2016 International Conference on Signal Processing, Communication, Power and Embedded System (SCOPES), Paralakhemundi, India, 3–5 October 2016. [Google Scholar]
  4. Li, Q.; Cui, T.; Weng, Y.; Negi, R.; Franchetti, F.; Ilic, M.D. An information-theoretic approach to PMU placement in electric power systems. IEEE Trans. Smart Grid 2012, 4, 446–456. [Google Scholar] [CrossRef]
  5. Aminifar, F.; Lucas, C.; Khodaei, A.; Fotuhi-Firuzabad, M. Optimal placement of phasor measurement units using immunity genetic algorithm. IEEE Trans. Power Deliv. 2009, 24, 1014–1020. [Google Scholar] [CrossRef]
  6. Cho, K.-S.; Shin, J.-R.; Hyun, S.H. Optimal placement of phasor measurement units with GPS receiver. In Proceedings of the 2001 IEEE Power Engineering Society Winter Meeting Conference Proceedings (Cat No 01CH37194), Columbus, OH, USA, 28 January–1 February 2001. [Google Scholar]
  7. Manoharan, H.; Srikrishna, S.; Sivarajan, G.; Manoharan, A. Economical placement of PMUs considering observability and voltage stability using binary coded ant lion optimization. Int. Trans. Electr. Energy Syst. 2018, 28, e2591. [Google Scholar] [CrossRef]
  8. Zhang, J.L.; Gao, Z.J.; Wang, Z.Y.; Sun, X.R. Fault Location Method for Active Distribution Based on Finite μPMU. Power Syst. Technol. 2020, 44, 2722–2731. [Google Scholar]
  9. Milosevic, B.; Begovic, M. Nondominated sorting genetic algo-rithm for optimal phasor measurement placement. IEEE Trans. Power Syst. 2003, 18, 69–75. [Google Scholar] [CrossRef]
  10. Gou, B. Generalized integer linear programming formulation for optimal PMU placement. IEEE Trans. Power Syst. 2008, 23, 1099–1104. [Google Scholar] [CrossRef]
  11. Xu, B.; Abur, A. Observability analysis and measurement placement for systems with PMUs. In Proceedings of the IEEE PES Power Systems Conference and Exposition, New York, NY, USA, 10–13 October 2004. [Google Scholar]
  12. Dubey, R.; Popov, M.; Muro, J.D.J.C. Cost effective wide area measurement systems for smart power network. IEEE Power Energy Technol. Syst. J. 2018, 5, 85–93. [Google Scholar] [CrossRef]
  13. Abdelkader, M.; Selim, A.; Kamel, S.; Jurado, F. Optimal placement of phasor measurement units for state estimation of electrical power systems. In Proceedings of the 2019 21st International Middle East Power Systems Conference (MEPCON), Cairo, Egypt, 17–19 December 2019. [Google Scholar]
  14. Rather, Z.H.; Chen, Z.; Thøgersen, P.; Lund, P.; Kirby, B. Realistic approach for phasor measurement unit placement: Consideration of practical hidden costs. IEEE Trans. Power Deliv. 2014, 30, 3–15. [Google Scholar] [CrossRef]
  15. Huang, Y.; Li, S.; Li, J.; Hou, W.; Zhang, Y.; Yang, K. A multi-objective model for PMU placement considering redundancy in the presence of line outages. In Proceedings of the 2019 IEEE 3rd Conference on Energy Internet and Energy System Integration, Changsha, China, 8–10 November 2019. [Google Scholar]
  16. Du, X. Optimal Placement of Micro-PMU in Distribution System. Master’s Thesis, Southeast University, Nanjing, China, 2019. [Google Scholar]
  17. Guo, X.-C.; Liao, C.-S.; Chu, C.-C. Probabilistic Optimal PMU Placements Under Limited Observability Propagations. IEEE Syst. J. 2022, 16, 767–776. [Google Scholar] [CrossRef]
  18. Liu, X.; Jiang, Q.; Cao, Y. Optimal PMU placement to guarantee observability under N − 1 condition. Proc. CSEE 2009, 29, 47–51. [Google Scholar]
  19. Arpanahi, M.K.; Alhelou, H.H.; Siano, P. A novel multiobjective OPP for power system small signal stability assessment considering WAMS uncertainties. IEEE Trans. Ind. Inform. 2019, 16, 3039–3050. [Google Scholar] [CrossRef]
  20. Zhou, X.; Sun, H.; Zhang, C.; Dai, Q. Optimal placement of PMUs using adaptive genetic algorithm considering measurement redundancy. Int. J. Reliab. Qual. Saf. Eng. 2016, 23, 1640001. [Google Scholar] [CrossRef]
  21. Aminifar, F.; Fotuhi-Firuzabad, M.; Safdarian, A.; Shahidehpour, M. Observability of hybrid AC/DC power systems with variable-cost PMUs. IEEE Trans. Power Deliv. 2014, 29, 345–352. [Google Scholar] [CrossRef]
  22. Almunif, A.; Fan, L. Optimal PMU placement for modeling power grid observability with mathematical programming methods. Int. Trans. Electr. Energy Syst. 2020, 30, e12182. [Google Scholar] [CrossRef]
  23. Bi, G. Research on the Influence of Distributed Generation on Distribution Network. Master’s Thesis, Shandong University, Jinan, China, 2019. [Google Scholar]
  24. Tan, Y.; Li, X.; Cai, Y.; Zhang, Y.D. Critical node identification for complex power grid based on electrical distance. Proc. CSEE 2014, 34, 146–152. [Google Scholar]
  25. Fu, J.C.; Lu, Q.S. Fault sections location of distribution network based on bat algorithm. Power Syst. Prot. Control 2015, 43, 100–105. [Google Scholar]
  26. Gong, M.; Xu, Z.; Xie, Y.; Pan, J.; Li, R. Fault-section location of distribution network containing distributed generation based on the multiple-population genetic algorithm of chaotic optimization. In Proceedings of the 2017 Chinese Automation Congress (CAC), Jinan, China, 20–22 October 2017. [Google Scholar]
  27. Chakrabarti, S.; Kyriakides, E. Optimal placement of phasor measurement units for power system observability. IEEE Trans. Power Syst. 2008, 23, 1433–1440. [Google Scholar] [CrossRef]
  28. Kong, X.; Wang, Y.; Yuan, X. Optimal configuration of PMU based on customized genetic algorithm and considering observability of multiple topologies of distribution network. Electr. Power Autom. Equip. 2020, 40, 66–72. [Google Scholar]
  29. Chen, X.; Chen, T.; Tseng, K.J.; Sun, Y.; Amaratunga, G. Customized optimal μPMU Placement method for distribution networks. In Proceedings of the 2016 IEEE PES Asia-Pacific Power and Energy Engineering Conference (APPEEC), Xi’an, China, 25–28 October 2016; pp. 135–140. [Google Scholar] [CrossRef]
  30. Kumar, V.S.S.; Thukaram, D. Approach for multistage place-ment of phasor measurement units based on stability criteria. IEEE Trans. Power Syst. 2015, 31, 2714–2725. [Google Scholar] [CrossRef]
  31. Abdelsalam, H.A.; Abdelaziz, A.Y.; Osama, R.A.; Salem, R.H. Impact of distribution system reconfiguration on optimal placement of phasor measurement units. In Proceedings of the 2014 Clemson University Power Systems Conference, Clemson, SC, USA, 11–14 March 2014; pp. 1–6. [Google Scholar] [CrossRef]
  32. Cao, P.; Liu, M. PMU placement method based on improved integer programming method combined with zero injection nodes. Power Syst. Prot. Control 2021, 49, 143–150. [Google Scholar]
  33. Do Coutto Filho, M.B.; de Souza, J.C.S.; Tafur, J.E.V. Quanti-fying observability in state estimation. IEEE Trans. Power Syst. 2013, 28, 2897–2906. [Google Scholar] [CrossRef]
  34. Wang, C.; Gao, Y. Dynamic Reconfiguration of Dis-tribution Network Based on Optimal Fuzzy C-means Cluster-ing and Improved Chemical Reaction Optimization. Proc. CSEE 2014, 34, 1682–1691. [Google Scholar]
Figure 1. Analysis of observability of the ZIBs. (a) Case 1; (b) Case 2.
Energies 18 00395 g001
Figure 2. Analysis of observability of FTU.
Energies 18 00395 g002
Figure 3. Flowchart of model solving.
Energies 18 00395 g003
Figure 4. Flowchart of adaptive coefficient simulated annealing algorithm.
Energies 18 00395 g004
Figure 5. Comparison of convergence effect and speed of each algorithm.
Energies 18 00395 g005
Figure 6. Observability in IEEE 33 system. (Nodes with * in the figure is ZIB).
Energies 18 00395 g006
Figure 7. Considering observability of FTUs in IEEE 33 system. (Nodes with * in the figure is ZIB).
Energies 18 00395 g007
Figure 8. Importance of nodes.
Energies 18 00395 g008
Figure 9. Analysis of the importance of nodes in the IEEE-33 system.
Energies 18 00395 g009
Table 1. Comparison of this paper with other Refs. on the consideration of existing measurement devices and observation stability.
ParametersValue[10,11][12][18]Ours[13][14][10]Ours
Consideration of existing measurement devicesZIB
Meter
FTU
Considerations of observation StabilityμPMU failure
line failure
Topology Change
Table 2. Parameters used in the simulated annealing algorithm.
ParametersValue
Niter1000
T01
α b 0.9995
Table 3. Number and location of buses with PMU placed in IEEE-33.
Number of PMUObservabilityNodes with PMU Placed
11observable2, 4, 6, 9, 13, 14, 17, 21, 24, 29, 32
Table 4. Number and location of buses with PMU placed in IEEE-33.
With Measurement or NotNumber of PMUNodes with PMU Placed
No112, 4, 6, 9, 13, 14, 17, 21, 24, 29, 32
Yes92, 5, 9, 13, 17, 21, 24, 29, 32
Table 5. Comparison of PMU placement quantities between IEEE-33, IEEE 34, and PG&E-69 systems.
With Measurement or NotIEEE 33IEEE 34PG&E 69
Ours111119
[28]111123
[29]111325
[30]131525
[31]141427
Table 6. Importance factor for the scheme of optimization.
SchemeNodes with μPMUs PlacedImportance Factor
12, 4, 6, 9, 13, 14, 17, 21, 24, 29, 321.254
22, 5, 9, 12, 14, 17, 21, 24, 27, 30, 321.222
Table 7. Comparison of the scheme with and without deployed monitoring devices.
MethodμPMU FaultsLine BreakNumber of μPMUs
Ours1.8670.32811
[29]2.8760.46011
[32]4.9680.71911
[31]1.0630.19215
Table 8. Simulation in case of topology change.
MethodSwitches That Can Cause Unobservability in the System When Disconnected
OursWithout
[29]S8, S14, S32
[32]S32
[31]S16, S28, S30, S36, S37
Disclaimer/Publisher’s Note: The statements, opinions and data contained in all publications are solely those of the individual author(s) and contributor(s) and not of MDPI and/or the editor(s). MDPI and/or the editor(s) disclaim responsibility for any injury to people or property resulting from any ideas, methods, instructions or products referred to in the content.

