Article

Simulation and Economic Benefit Analysis of Carburetor Combined Transport in Winter at a Liquefied Natural Gas Receiving Station

1
School of Electrical Engineering, Hebei University of Science and Technology, Shijiazhuang 050027, China
2
Caofeidian Xintian LNG Co., Ltd., Tangshan 063200, China
3
School of Information and Intelligent Engineering, Tianjin Renai College, Tianjin 301636, China
*
Author to whom correspondence should be addressed.
Energies 2025, 18(2), 276; https://doi.org/10.3390/en18020276
Submission received: 18 December 2024 / Revised: 6 January 2025 / Accepted: 8 January 2025 / Published: 10 January 2025
(This article belongs to the Section C: Energy Economics and Policy)

Abstract

:
In the winter, a certain LNG receiving terminal operates exclusively with the submerged combustion vaporizer (SCV). However, due to the high operational costs associated with the SCV, a new combined operation scheme utilizing both the SCV and the open rack vaporizer (ORV) has been proposed. First, models for the SCV and ORV gasification units were developed in Aspen HYSYS and validated using actual operational parameters. Next, the relationship between the seawater inlet–outlet temperature difference and the minimum seawater flow rate for the ORV was determined, and an optimized seawater pump operation strategy, considering LNG export volumes, was formulated. Additionally, the relationship between the SCV fuel gas flow rate and LNG export volume was analyzed, and a comparison was made between the operating costs of SCV running independently and the combined SCV-ORV operation under winter conditions. The results of the combined operation experiments indicated that at a seawater inlet–outlet temperature difference of 3 °C, the joint operation mode could save costs by 70–77%; at 2.5 °C difference, it saves 60–67%; at 2 °C difference, it saves 45–50%; at 1.5 °C difference, it saves 35–38%; and at 1 °C difference, it saves 20–23%. This approach achieves optimized economic performance for LNG terminal operations.

1. Introduction

Natural gas, as a green energy source, plays a crucial role in promoting social development [1,2]. With the continuous reform of China’s energy strategy and rapid development of the natural gas industry, LNG (liquefied natural gas) is gaining increasing attention as a new form of natural gas utilization that facilitates storage and transportation. An LNG receiving terminal is a facility for receiving, storing, gasifying, and distributing natural gas. The gasification unit, as a critical component of the LNG receiving terminal, is the primary optimization target [3,4].
Currently, researchers primarily optimize gasification units through field experiments based on LNG terminal operational experience. Reference [5] mainly focuses on joint operation optimization research of ORV (open rack vaporizer) and IFV (intermediate fluidized bed gasifier), while reference [6] primarily designs SCV (submerged combustion vaporizer) and ORV joint operation schemes under different seawater inlet temperature conditions. However, these studies have not addressed the impact of seawater inlet–outlet temperature difference on the minimum seawater flow rate of ORV. Therefore, this paper primarily analyzes the relationship between different seawater outlet temperature differences and ORV minimum seawater flow rate, designs ORV and SCV joint operation schemes under various conditions, and calculates the cost savings.
The LNG receiving terminal has constructed two ORVs and six SCVs. The main energy-consuming equipment for ORV is the seawater pump. Seawater flows downward in a film on the heat exchanger surface, exchanging heat with the LNG inside the tube bundle panels [7,8,9,10,11,12]. The main energy-consuming equipment for SCV includes fans and circulating water pumps, where the heat generated from fuel gas combustion directly enters the water bath, heating the water, and LNG gasifies in the heat exchanger tubes within the water bath [13,14,15,16,17,18,19,20].
This paper further explores the minimum seawater flow requirements of ORVs under different seawater inlet and outlet temperature differences, with the aim of determining the number of seawater pump starts required under various operating conditions. In addition, based on the fact that the energy consumption of SCVs is significantly higher than that of ORVs, this study also proposes a scheme for the joint operation of SCVs and ORVs under winter operating conditions in order to maximize the savings in the operating costs of the receiving station.

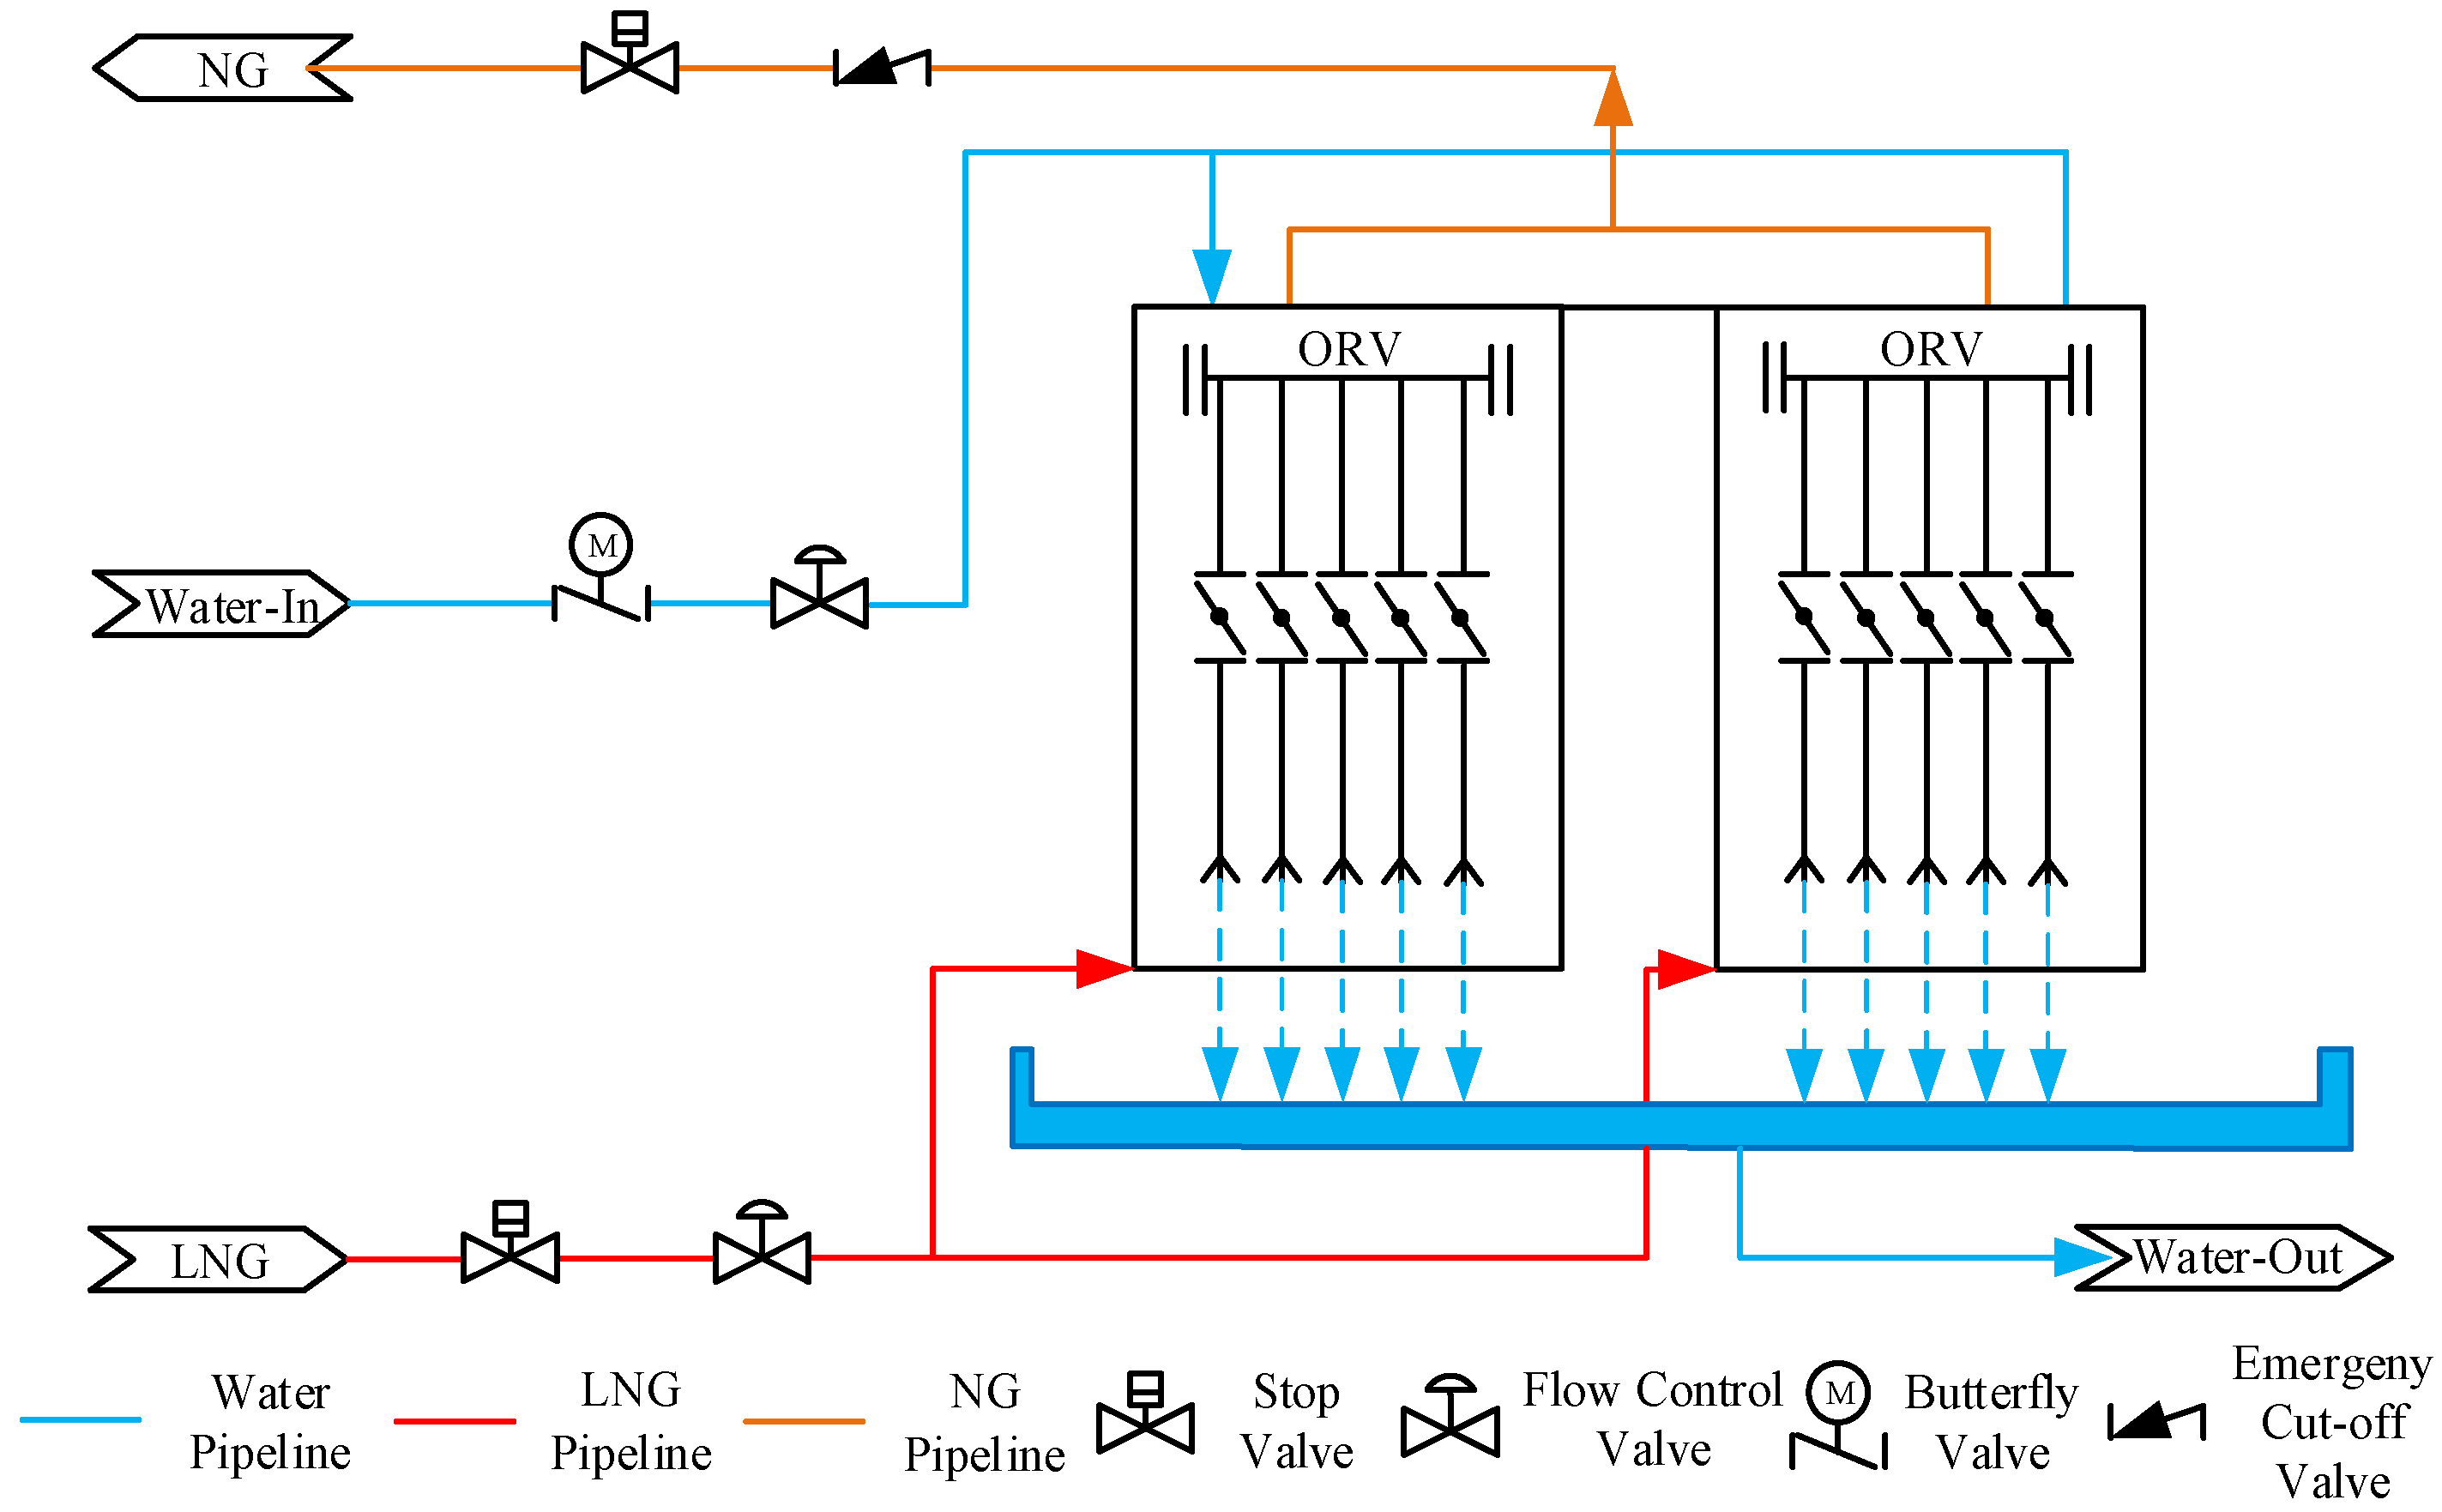
2. Technical Equipment Configuration

The operational process flow of the ORV system, as shown in Figure 1, begins with LNG being pumped into the ORV system by high-pressure pumps. Through LNG manifolds and headers, the LNG is evenly distributed to various tube bundle panels. Within the tube bundles, the LNG rises while exchanging heat with seawater, undergoing vaporization and converting into natural gas (NG). The vaporized NG is then transported to outlet pipelines via NG headers and manifolds.
Seawater, which serves as the heat source for LNG gasification, is supplied through seawater lines and distributed to the ORV system via seawater manifolds, butterfly valves, and seawater headers. The seawater overflows from the seawater tank and flows downward along the heat exchanger surface, transferring heat to the LNG during this process. The ORV design data are provided in Table 1.
The SCV operational process flow is shown in Figure 2: LNG is delivered to the vaporizer by high-pressure pumps, where it undergoes heat exchange with the heat exchanger in the water bath, absorbing heat and vaporizing into natural gas. The water bath is heated by a gas burner, which generates heat to maintain the water temperature. This temperature is continuously regulated through a circulating water system. The vaporized natural gas is then transported through pipelines to end users or a manifold, while the combustion by-products are discharged via the exhaust system. The SCV design parameters are shown in Table 2.

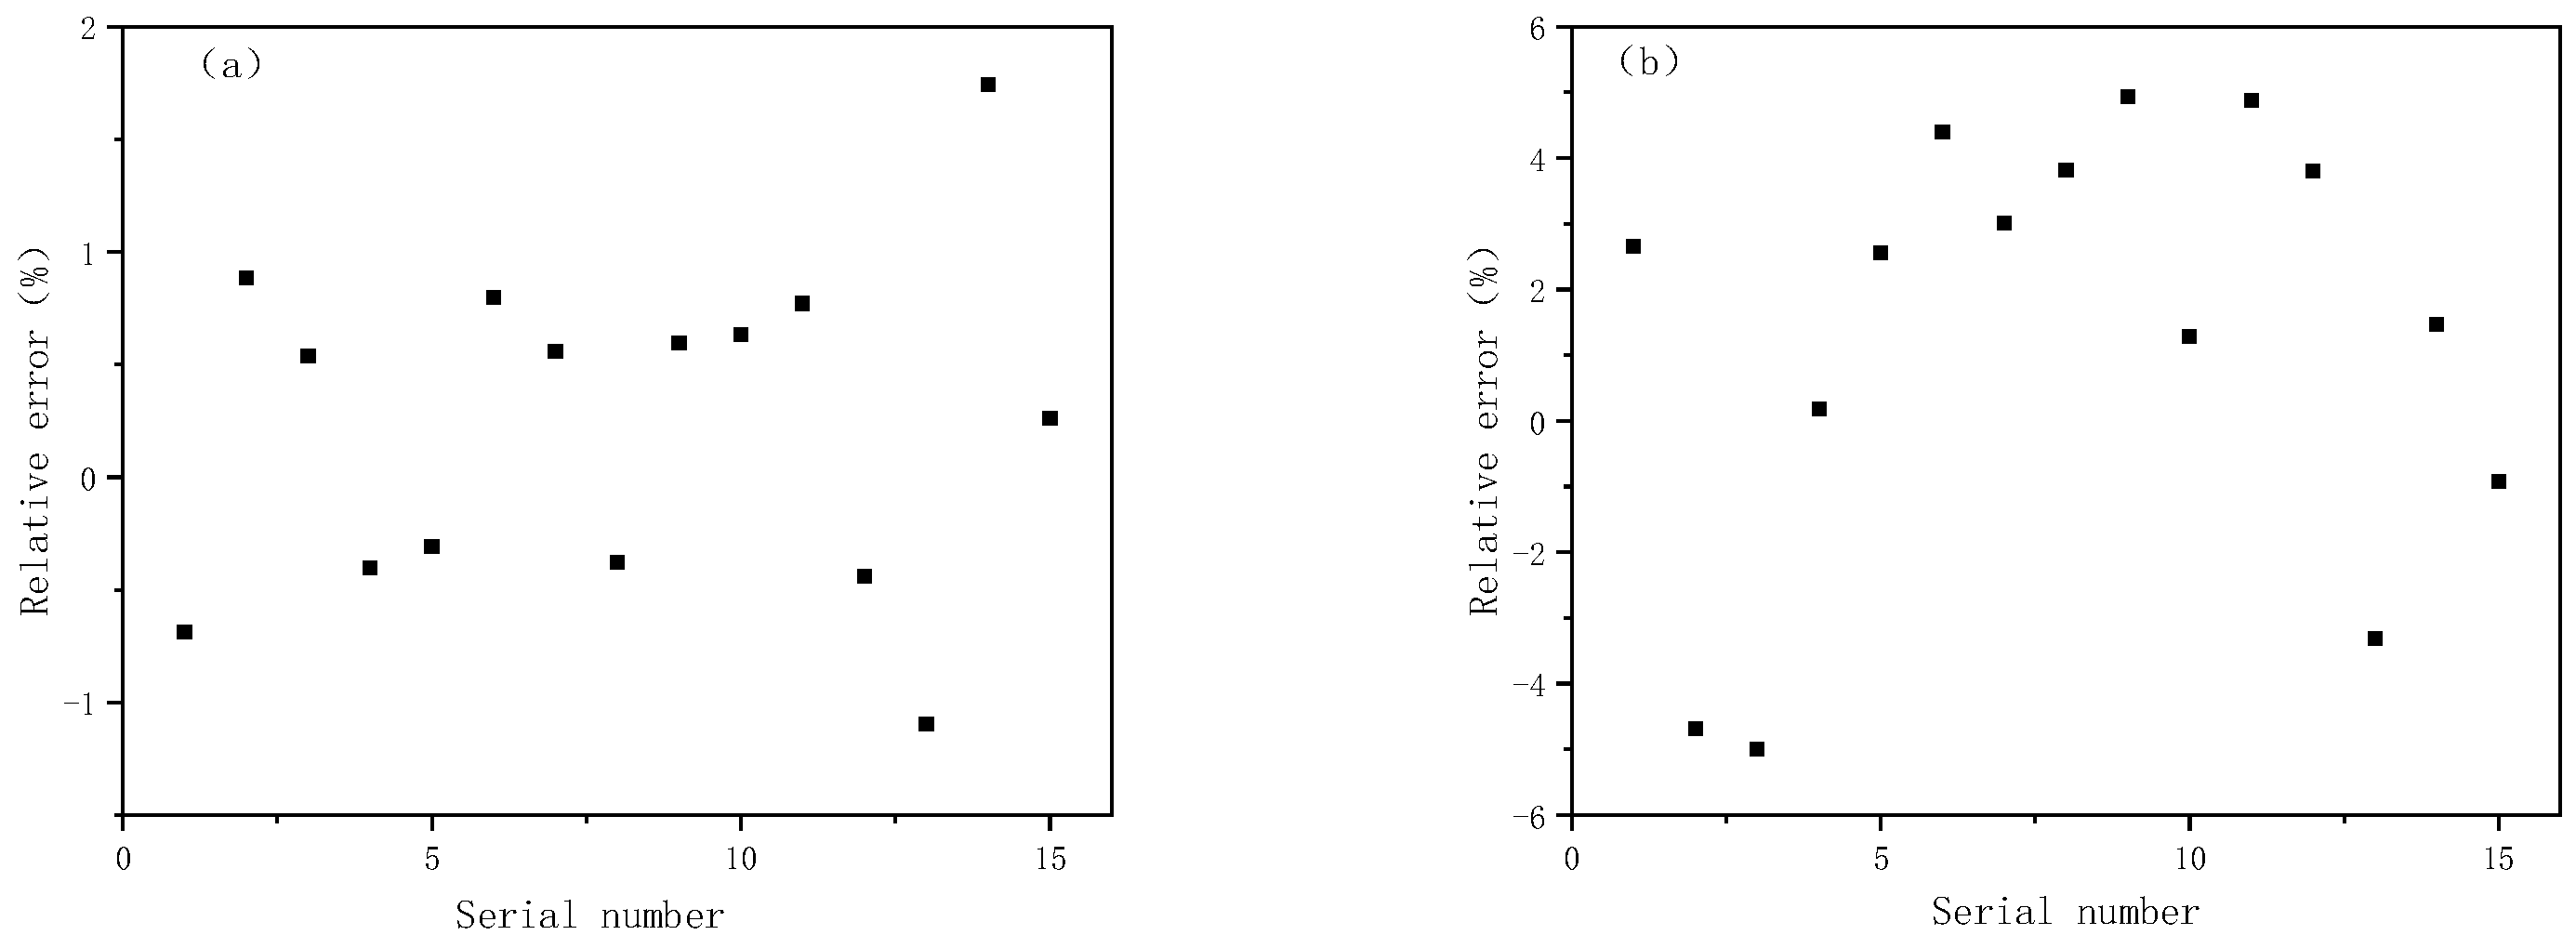
3. Establishment and Verification of Gasification Unit Model

Based on the actual operational process flow of the Tangshan LNG receiving terminal’s gasification unit, a gasification unit process model was established using Aspen HYSYS V14 (40.0.0.359), as shown in Figure 3. Some simplifications and assumptions were made, as outlined below:
(1)
Neglecting Pressure Drop and Heat Loss in the Piping System: It is assumed that the pressure drop and heat loss in the system’s piping are neglected, which simplifies the simulation and calculation process.
(2)
Heat Source Assumption: The external environment of the vaporizer is considered to have no heat exchange with the system. All heat required for the vaporization process is provided by external heat sources, such as seawater heating or water bath heating.
(3)
Heat Source Efficiency Assumption: The heat efficiency of the heat source is assumed to be known and fixed, simplifying the calculation of heat requirements for the vaporizer.
(4)
Assumption of No Chemical Reactions: It is assumed that the vaporization process within the vaporizer involves only physical changes, with no chemical reactions occurring during the LNG vaporization.
(5)
LNG Composition Assumption: The LNG is assumed to be a mixture of methane, ethane, propane, and other hydrocarbon gases, with the composition remaining constant throughout the process.
In the simulation study of the gasification unit, shell-and-tube heat exchanger modules were selected for both the ORV and SCV models based on their operating principles. The Peng–Robinson equation of state (P-R EOS) was employed for the simulation calculations. The composition of the LNG is presented in Table 3.
Model verification was performed based on field operational data by comparing 15 sets of data for both types of vaporizers, with the results presented in Figure 4. The actual operational parameters for both the ORV and SCV were obtained from field test data collected during a specific period. Table 4 provides the field test operational data for a particular moment in time.
From Figure 4, it can be seen that the ORV gasification process model has an error of less than 2% compared to actual data, while the SCV gasification process model has an error of less than 5% compared to actual data. Therefore, this model can be used for subsequent simulation research.

4. Simulation Optimization Research

4.1. Gasification Unit Operation Research Under Different Conditions for ORV and SCV

The LNG receiving terminal is located on the coast of the Bohai Sea in northern China. The Bohai Sea is a semi-enclosed, shallow sea, and its temperature is influenced by various factors, resulting in significant seasonal variations. Winter temperatures typically range from 0 to 8 °C, while summer temperatures range from 18 to 26 °C. As a result, ORV research primarily focuses on both winter and non-winter conditions. In contrast, SCV is not affected by seasonal changes but incurs higher costs.
Based on the actual production conditions at the Tangshan LNG receiving terminal, the operational requirements for ORV, and environmental regulations, the LNG export volume and ORV operational requirements are presented in Table 5.
An optimal seawater usage simulation was conducted using the established ORV gasification unit model, with seawater inlet temperatures of 30 °C and 25 °C, and corresponding outlet temperatures of 25 °C and 20 °C, respectively. The results are presented in Figure 5a,b.
As shown in Figure 5, when the seawater inlet temperatures vary but the inlet–outlet temperature difference remains constant, the optimal seawater flow rate exhibits minimal variation. This indicates that the optimal seawater flow rate is primarily influenced by the seawater inlet–outlet temperature difference, rather than by the individual inlet or outlet temperatures. Consequently, subsequent research focused on investigating the optimal seawater flow rate under varying inlet–outlet temperature differences.
According to Table 5, the seawater inlet–outlet temperature difference must be less than 5 °C, with a minimum temperature difference of 0 °C required for effective heat exchange. Based on these constraints, research was conducted to determine the optimal seawater flow rates for five different seawater inlet–outlet temperature differences, as illustrated in Figure 6a–e.
It is evident from Figure 6a–e that the temperature differential between the seawater inlet and outlet significantly influences the optimal seawater flow rate, assuming a fixed LNG export volume. The results show that when the temperature difference between the seawater inlet and outlet is 5 °C or 4 °C, both ORVs are capable of meeting the LNG export requirements. However, when the temperature difference decreases to 3 °C, 2 °C, or 1 °C, both ORVs fail to satisfy the LNG export requirements, necessitating the activation of the SCV.
Under non-winter conditions, to maximize economic benefits, the temperature difference between the seawater inlet and outlet is typically maintained at 5 °C. In contrast, during winter conditions, due to variations in seawater inlet temperature, it becomes essential to adjust the temperature differential between the inlet and outlet according to the fin icing height requirements. This ensures the safe operation of the system while optimizing gasification efficiency.
The fuel gas consumption of an SCV is primarily influenced by the LNG inlet temperature and flow rate. To accurately simulate the SCV vaporization process, we have developed a detailed model of the SCV vaporization unit within Aspen HYSYS. By applying the SCV efficiency specified by the manufacturer (98%) and using the calorific value of the fuel gas (55,440 kJ/kg), we have calculated the SCV fuel gas consumption through straightforward thermodynamic calculations. The resulting variations in SCV fuel gas consumption across different LNG inlet temperatures and flow rates are presented in Figure 7.

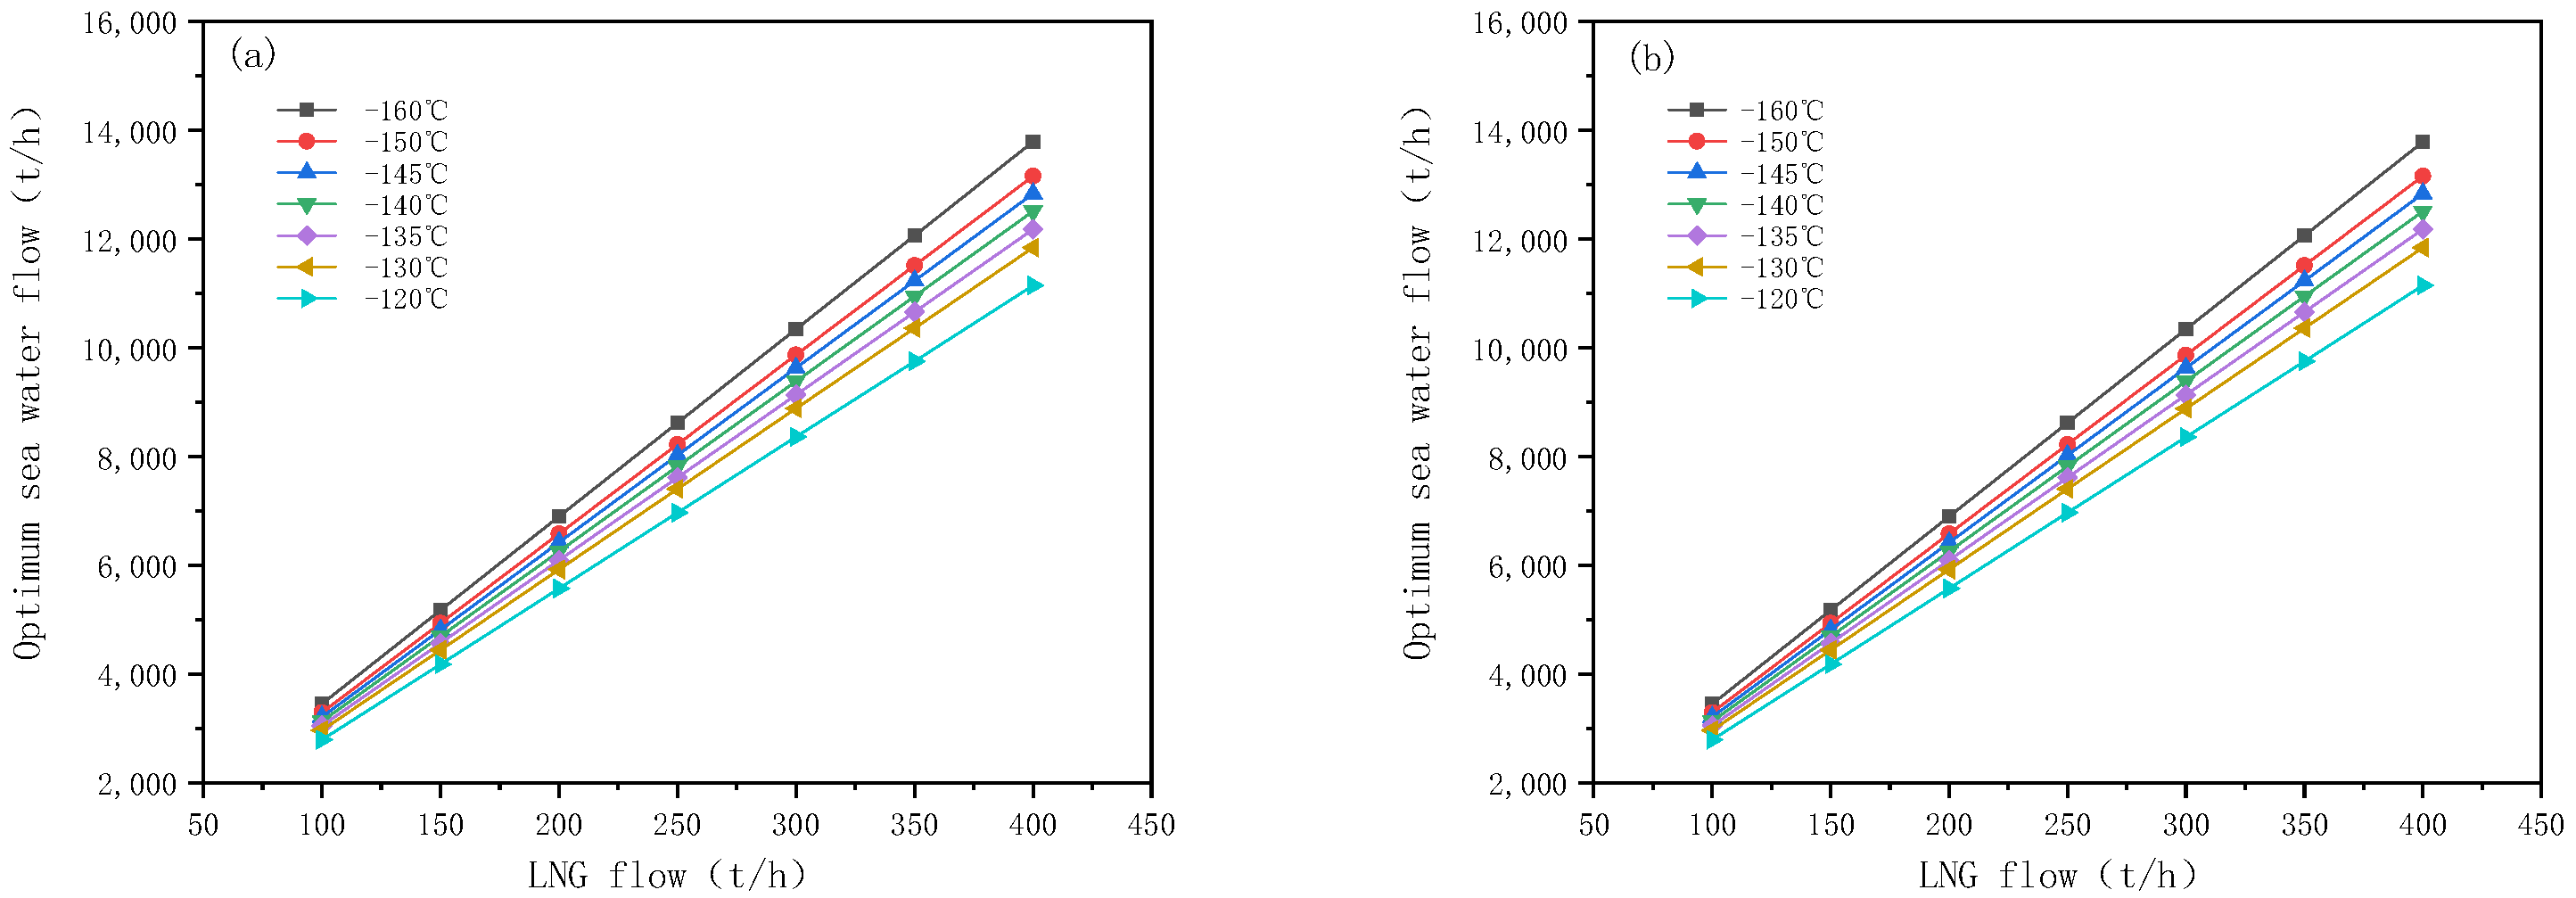
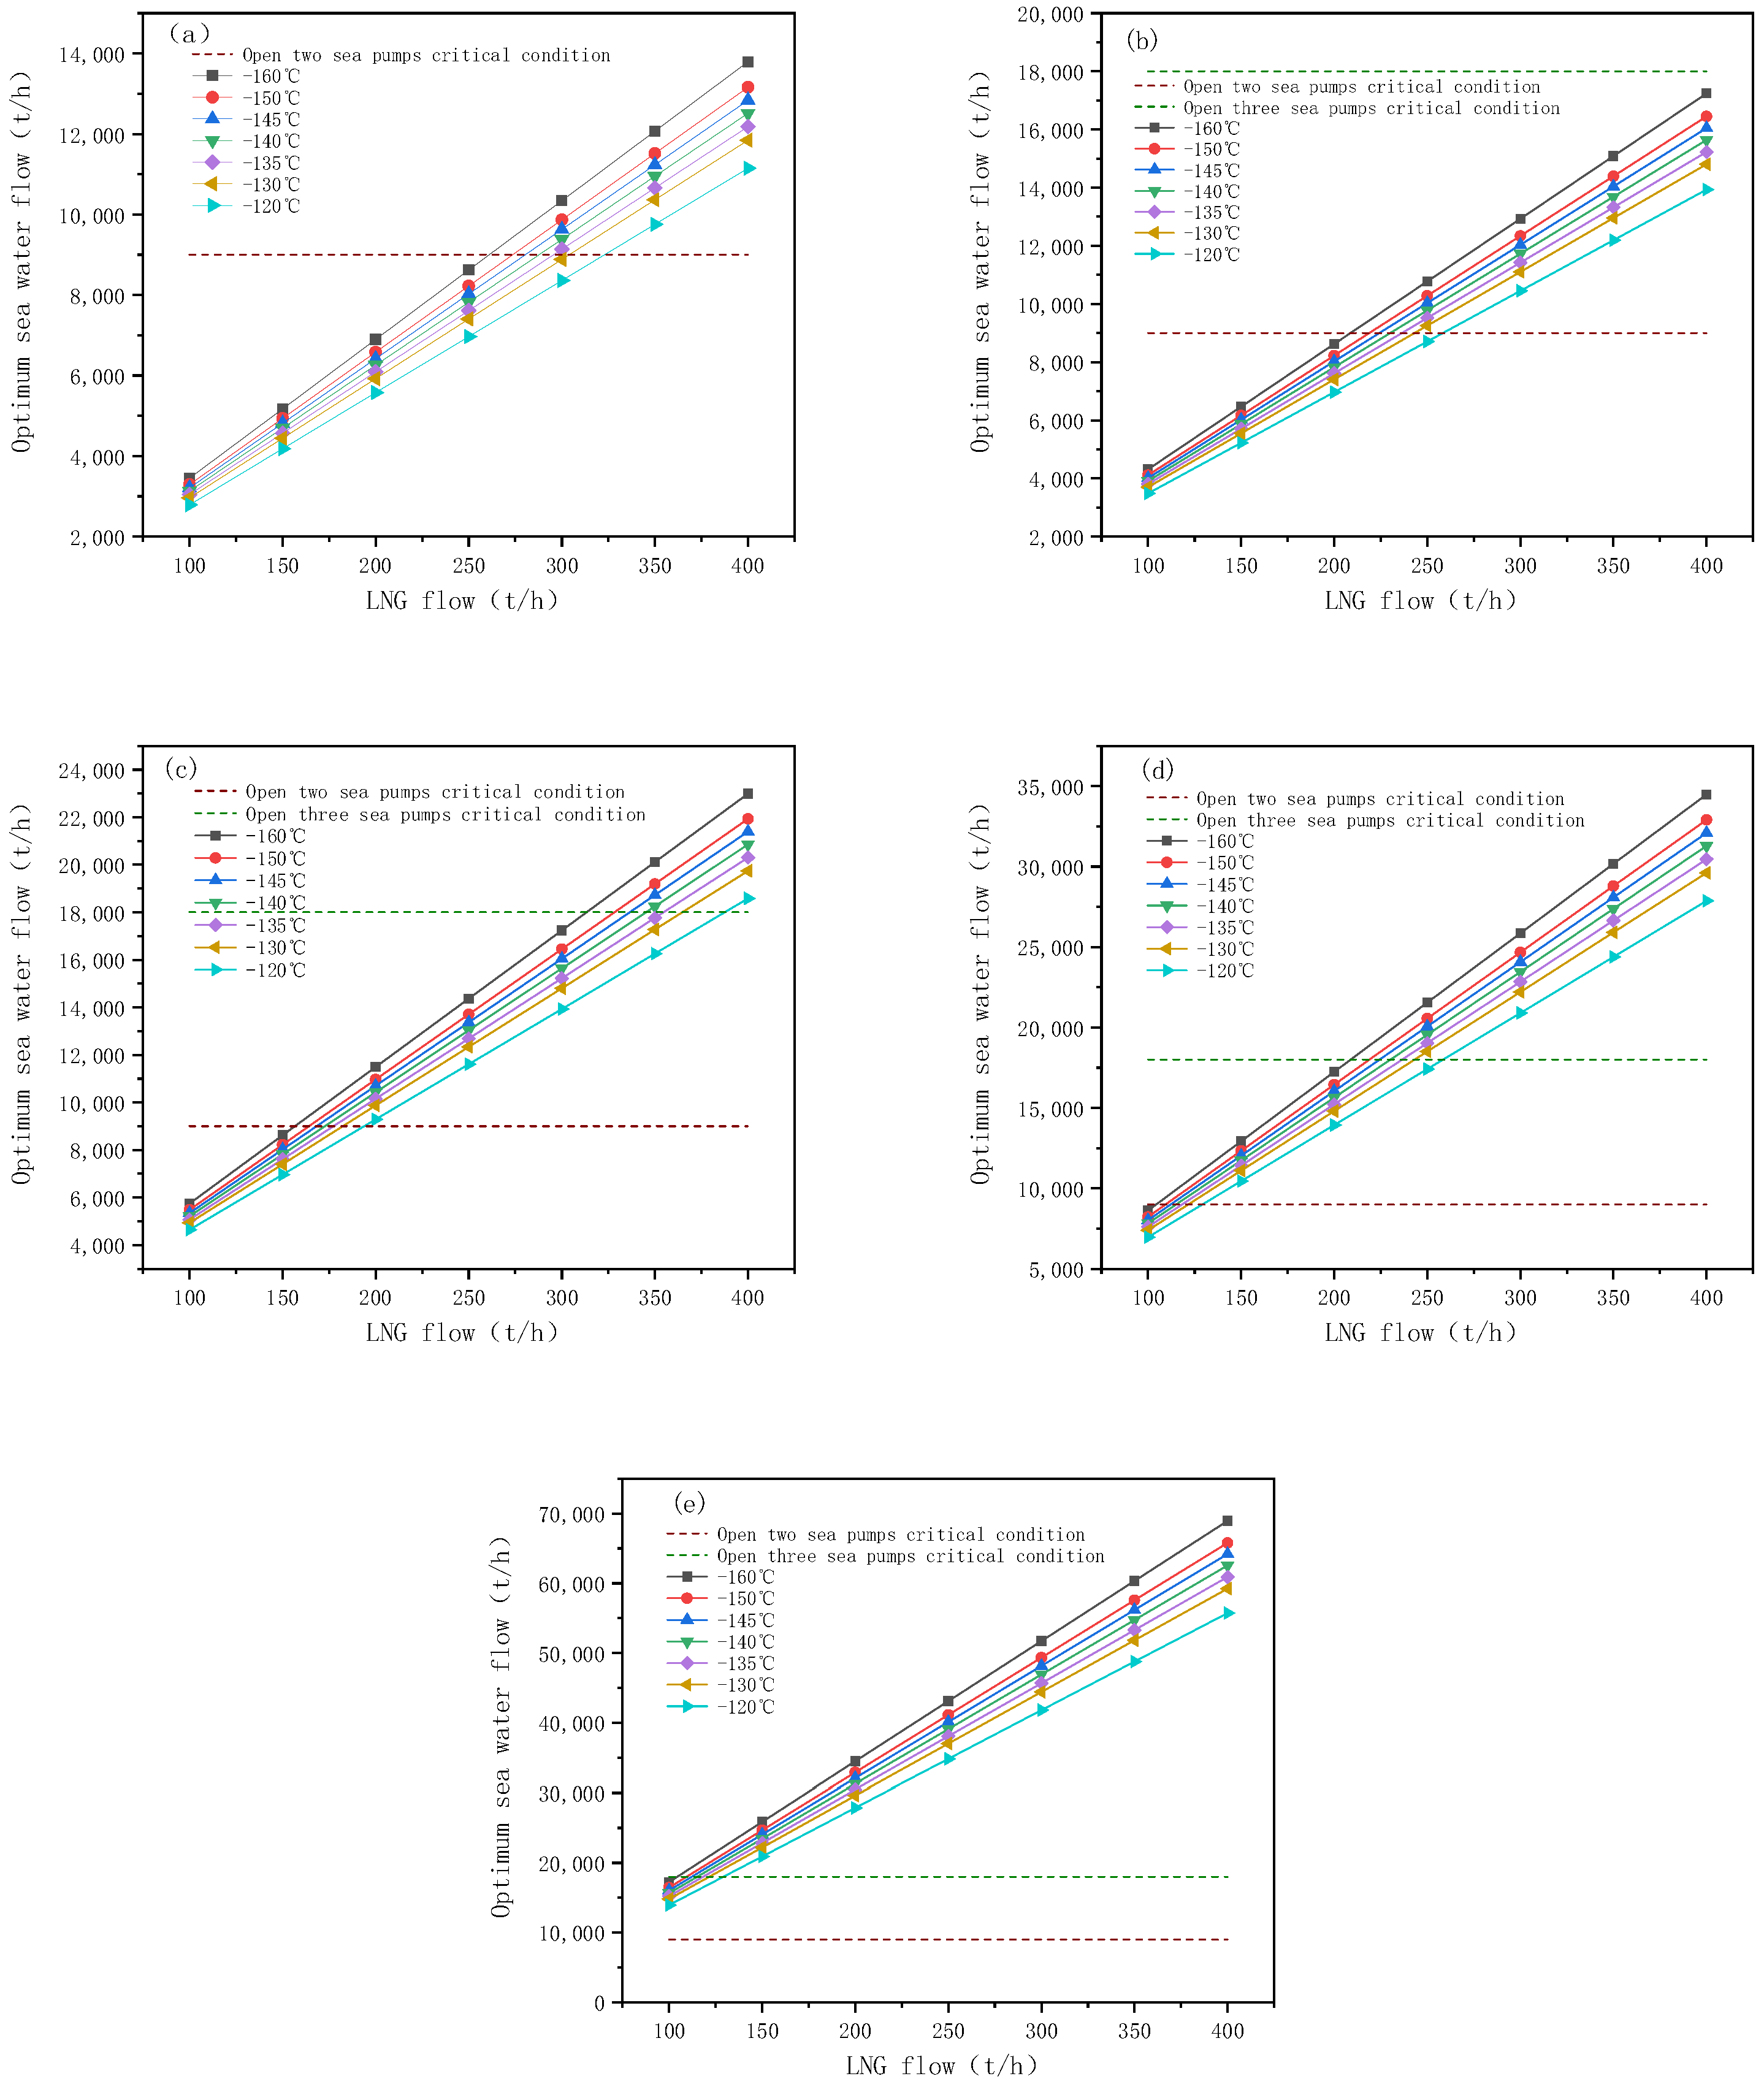
4.2. ORV Operation Optimization Characteristics Under Non-Winter Conditions

Under non-winter conditions (seawater inlet temperature between 15 °C and 30 °C), the seawater inlet–outlet temperature difference can reach 5 °C, making the impact of variations in seawater inlet temperature on ORV operation negligible. Different LNG gasification export volumes require varying amounts of seawater, allowing for the flexible operation of seawater pumps to optimize energy consumption. The Tangshan LNG receiving terminal is equipped with two ORVs units and two seawater pumps, each with a flow rate of 9000 t/h. Figure 6a illustrates the conditions for starting the two seawater pumps: when the LNG flow rate corresponds to an optimal seawater flow rate below 9000 t/h, only one seawater pump is used; otherwise, both pumps are activated. Moreover, during actual ORV operation, selecting the appropriate seawater flow rates can effectively mitigate issues such as gasifier fin vibration and ORV operational noise [20,21,22,23].

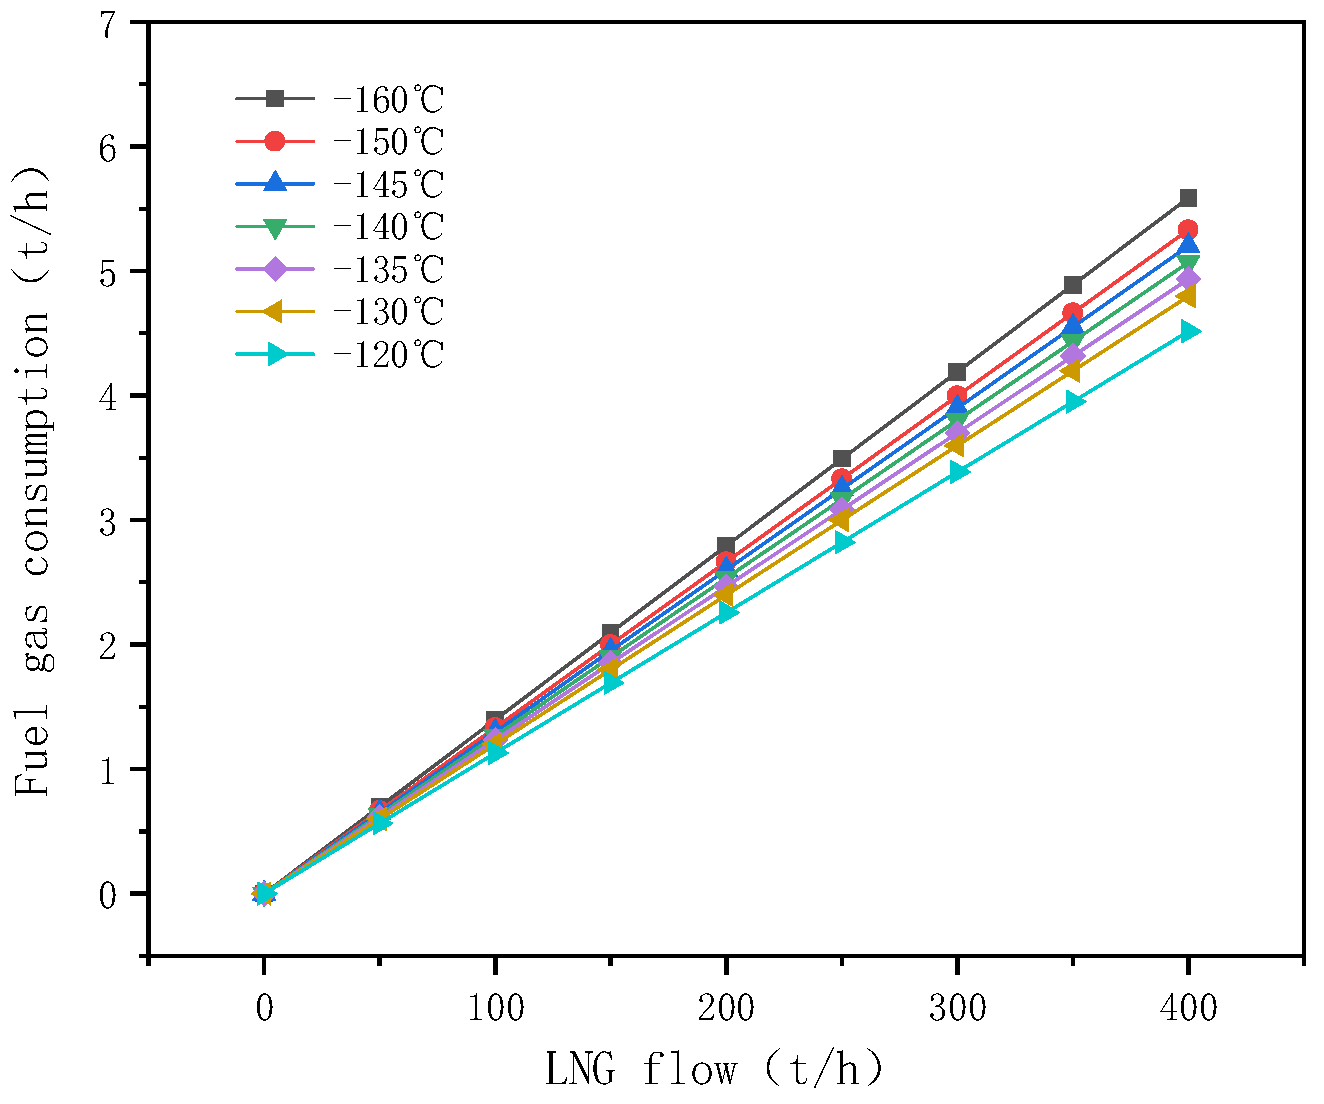
4.3. ORV Operation Research Under Winter Conditions

Under winter conditions, if the temperature differential between the seawater inlet and outlet does not reach the required 5 °C drop, the maximum vaporization flow rates of the two ORVs will be significantly affected. This is due to the need to meet the fine icing height requirements and optimize economic performance, all while being constrained by the maximum capacity of the seawater pump. The specific variations are outlined in Table 6.
Table 6 illustrates the variation in the ORV’s maximum LNG gasification rate under different seawater inlet–outlet temperature differences. The analysis reveals a significant negative correlation between the seawater temperature differential and the ORV’s maximum gasification rate: a smaller temperature difference results in a reduced gasification rate, while a larger temperature difference leads to a corresponding increase in the rate. During winter operation, if the ORV can meet the LNG export volume requirements, it will be prioritized for gasification. However, if the ORV cannot meet the export volume even at full load, the excess volume will be gasified through the SCV.

4.4. ORV + SCV Joint Operation Mode Optimization Research

The principal energy-consuming equipment for ORV comprises seawater pumps and LNG pumps, with a single seawater pump power of 880 kW and a total LNG pump power P p u m p , L N G of 2390 kW. The SCV energy-consuming equipment includes fans and LNG pumps, in addition to fuel gas consumption. The power of a single fan unit P f a n is 450 kW, utilizing the local industrial electricity price C e l e c t r i c i t y of 0.6 Yuan/kWh and the fuel gas price C f u e l   g a s of 3.36 Yuan/kg.
For the ORV, the main energy-consuming equipment consists of the seawater pump and the LNG pump. The energy consumption is quantified based on the LNG flow rate and seawater flow rate, respectively.
For the LNG pump, the energy consumption P L N G is expressed as
P L N G = m ˙ L N G P p u m p , L N G m ˙ L N G , r a t e d
In the equation, m ˙ L N G represents the LNG flow rate. m ˙ L N G , r a t e d is rated at 9000 tonnes per hour.
For the seawater pump, this study assumes that the pump operates continuously at its rated power. Therefore, P s e a w a t e r is 1760 kW.
For the ORV, the required cost c O R V is
c O R V = ( P s e a w a t e r + P L N G ) C e l e c t r i c i t y
For the SCV, the main energy-consuming equipment includes the LNG pump, fans, and gas consumption. Therefore, the energy consumption is primarily quantified based on the LNG flow rate.
For the LNG pump, it follows the same equation as (1) for the ORV.
For the fan, this study assumes that it operates continuously at its rated power. Therefore, P f a n is 450 kW.
For gas consumption, as shown in Table 2, the calorific value of the fuel gas H H is 54,433 kj/kg, and the heat exchange efficiency of the SCV is 98%. Therefore, the gas consumption m ˙ f u e l   g a s is:
m ˙ f u e l   g a s = H L N G 0.98 H H
where H L N G is the heat required for LNG vaporization:
H L N G = ( T N G T L N G ) m ˙ L N G
In the equation, T N G is the outlet temperature of the NG and T L N G is the inlet temperature of the LNG.
For the SCV, the required c S C V cost is
c S C V = ( P f a n + P L N G ) C e l e c t r i c i t y + m ˙ f u e l   g a s C f u e l   g a s
In the actual operation of the gasification unit, the operating costs also encompass the energy consumption of the seawater cleaning system, the rotary filter mesh, and the consumption of alkali solution. However, these costs are relatively minor in comparison to the energy consumed by the seawater pumps and fuel gas. As a result, they are often excluded from cost comparison analyses.
In light of the aforementioned research, it can be posited that two distinct vaporizer operational modes may be employed in winter conditions. The first of these entails the utilization of all SCVs for gasification, while the second employs a combination of ORV and SCV operation. Table 6 illustrates that an export volume of 400 tonnes per hour can be met even when the seawater inlet–outlet temperature difference is 4 °C. Accordingly, the subsequent discussion will concentrate on scenarios with temperature discrepancies of 3 °C, 2.5 °C, 2 °C, 1.5 °C, and 1 °C. To illustrate, Table 7 depicts the number of operational units and flow values for varying seawater inlet–outlet temperature differences, utilizing an LNG inlet temperature of −140 °C as a case in point.
Table 7 illustrates that the number of ORVs in operation remains constant at two, regardless of the seawater inlet–outlet temperature differential. The operational count of submerged combustion vaporizers (SCVs) is one at temperature differentials of 3 °C and 2 °C and increases to two at a 1 °C differential. The efficiency is optimized when two SCVs are in use, with each unit capable of vaporizing 142.3375 tons of fuel per hour.
By performing calculations, the operating costs for both combined operation and standalone SCV operation at different seawater inlet and outlet temperature differentials are presented in Figure 8.
As illustrated in Figure 8, the operating cost of the standalone SCV operation is the highest. In contrast, for combined operation, the operating cost decreases significantly as the temperature difference between the seawater inlet and outlet increases. Additionally, for both operating modes, higher LNG inlet temperatures result in lower operating costs.
The economic benefits under the ORV+SCV intermodal transport mode are obtained through comparative calculations, as shown in Figure 9.
In a joint operation mode, the economic benefits of the SCV and ORV working together are derived from the maximum heat provided by the ORV. As illustrated in Equation (1), the ORV is constrained by its seawater pump flow rate, and its maximum heat provision capacity is fixed under the same seawater inlet–outlet temperature difference. Consequently, the economic benefits are also fixed.
G = 3.6 Q c t 1 t 2
In the formula, G represents the design flow rate in tons per hour (t/h); Q denotes the calculated heat load in kilowatts (kW); c is the specific heat capacity in kilojoules per kilogram-degree Celsius (kJ/kg·°C); t1 is the supply water temperature in degrees Celsius (°C); and t2 is the return water temperature in degrees Celsius (°C).
The results of the calculations demonstrate that at seawater inlet temperature differentials of 3 °C, 2.5 °C, 2 °C, 1.5 °C, and 1 °C, the percentage of cost savings achieved by the ORV-SCV combined operational mode in comparison to the sole operation of SCV varies with different LNG inlet temperatures. The aforementioned findings are illustrated in graphical form in Figure 10.
Figure 10 illustrates that as the LNG inlet temperature increases, the economic advantages of the ORV-SCV combined operational mode over the standalone SCV operational mode gradually increase. Nevertheless, the extent of this enhancement is relatively modest, indicating that while LNG inlet temperature does influence the cost-saving effect, its impact is not substantial. In contrast to the LNG inlet temperature, the seawater inlet–outlet temperature differential exerts a more pronounced impact on cost savings. As the seawater inlet–outlet temperature differential widens, there is a significant increase in the percentage of cost savings achieved by the combined operation mode compared to the standalone SCV operation mode.
The economic benefit curves of the intermodal transport model for different seawater inlet and outlet temperature differences are shown in Figure 11.
As can be seen in Figure 11, there is a positive correlation between the economic benefits of the intermodal mode relative to the SCV solo mode of operation as the temperature difference between the seawater inlet and outlet increases.

5. Conclusions

A study was conducted to optimize the simulation of the gasification unit of the LNG receiving terminal. The process flows of the ORV and SCV were introduced based on the operational procedures of the gasification unit. A simulation model of the gasification unit was constructed using Aspen HYSYS software and subsequently validated. The model was then used to conduct simulation optimization research on ORV and SCV under different conditions, the results of which yielded the following conclusions:
(1)
Under non-winter conditions, the number of operating ORV seawater pumps should be adjusted according to different LNG export volumes to achieve energy-saving objectives.
(2)
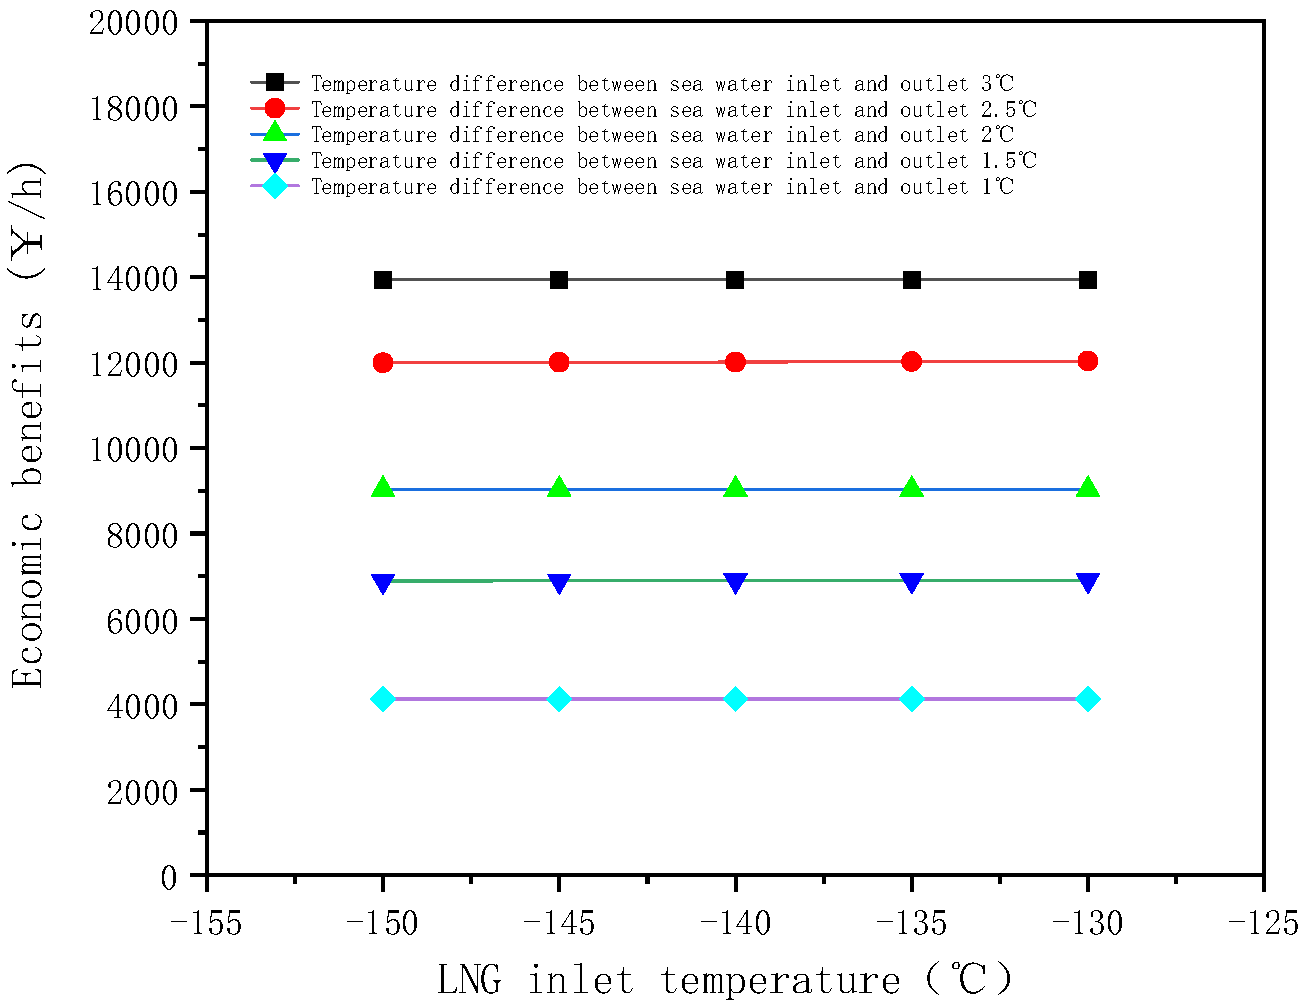
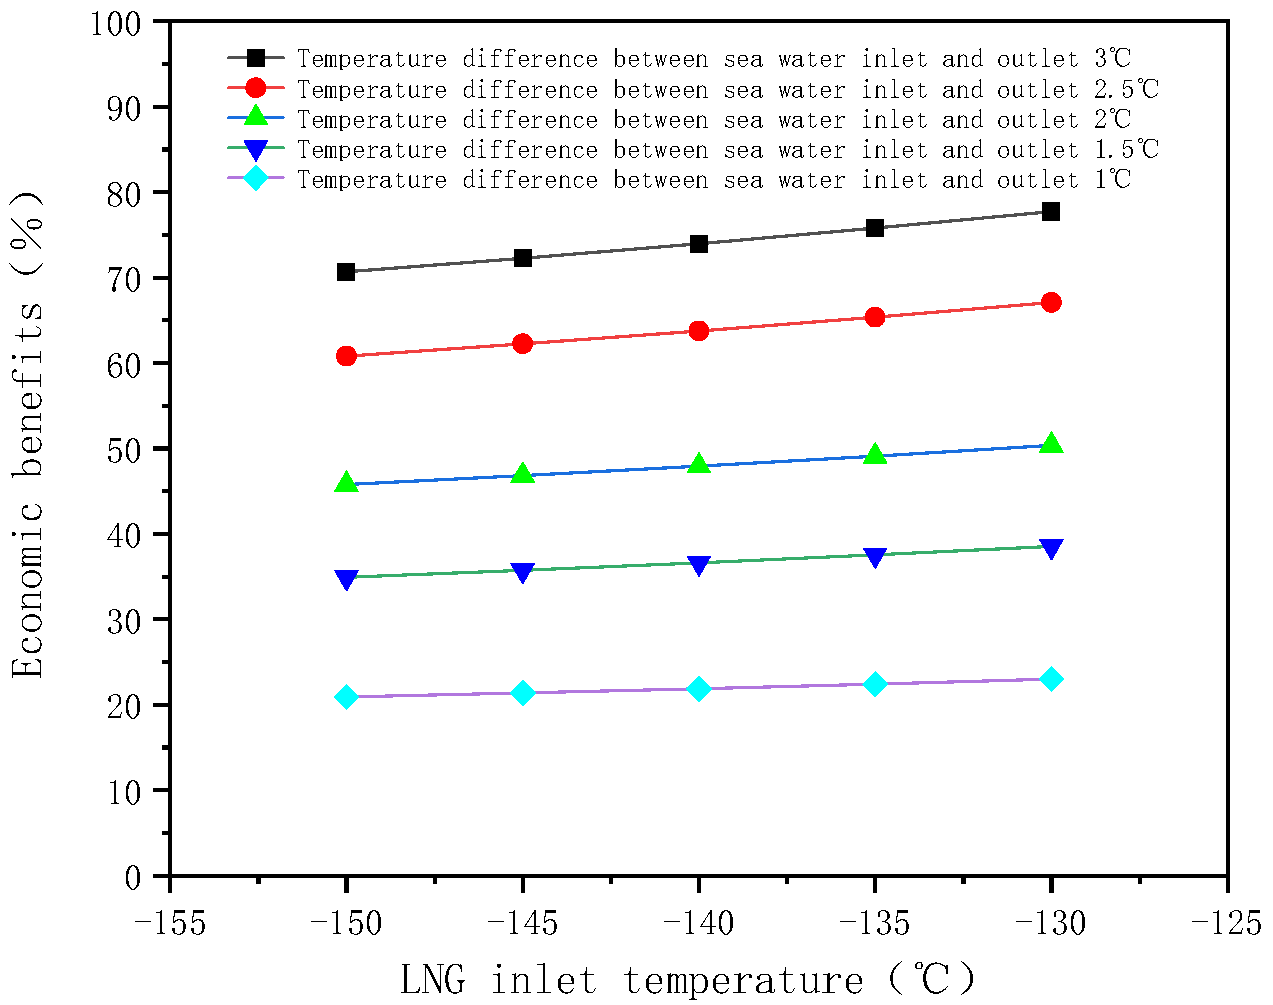
For winter conditions, an ORV + SCV joint operation scheme was designed. When the seawater inlet–outlet temperature difference is less than 4 °C, choosing the joint operation scheme shows significant cost savings compared to SCV operation alone. When the seawater inlet–outlet temperature difference is 3 °C, under different LNG inlet temperatures, the joint operation mode saves 70–77% in costs compared to SCV operation alone; at 2.5 °C difference, it saves 60–67%; at 2 °C difference, it saves 45–50%; at 1.5 °C difference, it saves 35–38%; and at 1 °C difference, it saves 20–23%.
The results of this study have significant implications for optimizing the operation of gasification units at LNG receiving terminals, particularly in terms of energy efficiency and cost reduction. The simulation optimization of the ORV and SCV systems under varying conditions provides valuable insights that can directly influence the technological processes and operational strategies at LNG terminals.
(1)
Energy Efficiency Improvement: The finding that the number of operating ORV seawater pumps should be adjusted according to different LNG export volumes (under non-winter conditions) is crucial for reducing energy consumption. By optimizing the seawater flow requirements, the LNG terminal can operate more efficiently, ensuring that the energy consumption is in line with actual demand. This not only reduces operational costs but also contributes to the sustainability of the terminal’s operations.
(2)
Cost Reduction in Winter Conditions: As LNG terminals typically operate in varying temperature conditions, especially during winter, the results of this study provide a practical framework for adjusting operational strategies to minimize costs while maintaining optimal gasification performance. This flexible operational strategy ensures that LNG terminals can adapt to changing environmental conditions and continue to operate cost-effectively, improving the overall economic viability of LNG import operations.

Author Contributions

Conceptualization, S.C. and T.L.; methodology, S.C. and X.S.; software, S.C. and P.Z.; validation, T.L.; formal analysis, P.Z.; investigation, P.Z.; resources, X.S.; data curation, X.S.; writing—original draft preparation, S.C.; writing—review and editing, S.C. and Y.G.; visualization, P.X.; supervision, P.X.; project administration, Y.G.; funding acquisition, Y.G. All authors have read and agreed to the published version of the manuscript.

Funding

This research was funded by S&T Program of Hebei, grant number 242Q4502Z.

Data Availability Statement

The authors confirm that the data supporting the findings of this study are available within the article.

Conflicts of Interest

Authors Tao Luan, Pengliang Zuo and Xiaolei Si were employed by the Caofeidian Xintian LNG Co., Ltd. The remaining authors declare that the research was conducted in the absence of any commercial or financial relationships that could be construed as a potential conflict of interest.

References

  1. Li, Q.; Li, Q.; Han, Y. A Numerical Investigation on Kick Control with the Displacement Kill Method during a Well Test in a Deep-Water Gas Reservoir: A Case Study. Processes 2024, 12, 2090. [Google Scholar] [CrossRef]
  2. Li, Q.; Li, Q.; Wang, F.; Wu, J.; Wang, Y. The Carrying Behavior of Water-Based Fracturing Fluid in Shale Reservoir Fractures and Molecular Dynamics of Sand-Carrying Mechanism. Processes 2024, 12, 2051. [Google Scholar] [CrossRef]
  3. Zhou, S.W.; Zhu, J.; Shan, T.; Fu, Q.; Zhang, D.; Wang, J. Development status and outlook of natural gas and LNG industry in China. China Offshore Oil Gas 2022, 34, 1–8. [Google Scholar]
  4. Dong, L.W.; Wang, H.R. Research on energy consumption of LNG terminal based on E-P analysis method. Energy Conserv. Pet. Petrochem. Ind. 2023, 13, 10–14. [Google Scholar]
  5. Gao, Z.Y.; Gao, P.; Liu, Q.; Zhou, Y.; Li, T.Y.; Sun, S.C. LNG industry in China and some suggestions on its development. Nat. Gas Technol. Econ. 2019, 13, 14–19. [Google Scholar]
  6. Wu, B.; Yu, X.; Liu, J.J.; Tang, J.F.; Yao, B.L.; Li, T. Simulation and optimization of combined transportation of IFV and ORV after capacity expansion of Qingdao LNG terminal. Nat. Gas Chem. Ind. 2022, 47, 134–141. [Google Scholar]
  7. Wang, X.S.; Chen, W.J.; Li, X.T.; Tang, J.F.; Liu, Q.Y.; Shi, Y. Simulation study on optimized operation of gasification unit in Qingdao LNG terminal. Nat. Gas Chem. Ind. 2019, 44, 63–69. [Google Scholar]
  8. Liang, Y.; Zhou, Y.X.; Yuan, S.J.; Meng, F.P.; Zhang, S.M.; Wei, S.R.; Leng, X. Analysis on comprehensive utilization scheme of circulating water in LNG terminal and power plant. Nat. Gas Chem. Ind. 2021, 46, 96–101. [Google Scholar]
  9. Chen, S.; Zhang, Z.X. Energy-saving operation of ORV under low seawater temperatures at LNG terminals. Nat. Gas Ind. 2016, 36, 106–114. [Google Scholar]
  10. Liu, J.C.; Ju, Y.L.; Fu, Y.Z. Heat transfer model and calculation method for three types of LNG seawater vaporizers. Cryog. Supercond. 2014, 42, 56–61. [Google Scholar]
  11. Xu, Y.; Ma, M.J.; Zhu, M.; Ji, M.L. Research of the open rack vaporizer operation. Chem. Eng. Oil Gas 2019, 48, 57–60+68. [Google Scholar]
  12. Shi, H.Q.; Chen, B.; Chen, S.; Jing, X.L. Minimum Seawater Flow Calculation of Open Rack Vaporizer in Different Working Conditions. Autom. Petro-Chem. Ind. 2017, 53, 50–55. [Google Scholar]
  13. Sun, Q.D.; Chen, S.P.; Yao, S.T.; Zhao, T.; Jin, S.F.; Liu, D.Y.; Meng, G.L. Numerical simulation of freezing on the surface of ORV. Cryog. Supercond. 2016, 44, 16–19+54. [Google Scholar]
  14. Wang, Y.J.; Li, S.Y.; Chen, W.J.; Tang, J.F.; Li, X.T.; Wang, D.X.; Yu, X. Heat transfer behaviors and operation optimization of LNG submerged combustion vaporizers. Nat. Gas Ind. 2021, 41, 134–143. [Google Scholar]
  15. Wang, T.J.; Chen, W.J.; Zhao, J.R.; Wang, J.K. Optimization of the operation mode of vaporizers at LNG terminals in winter. Oil Gas Storage Transp. 2018, 37, 1272–1279. [Google Scholar]
  16. Qi, C.; Yi, C.; Wang, B.; Wang, W.; Xu, J. Thermal performance analysis and the operation method with low temperature seawater of super open rack vaporizer for liquefied natural gas. Appl. Therm. Eng. 2019, 150, 61–69. [Google Scholar] [CrossRef]
  17. Zhang, J.; Yin, X.; Lei, Z.; Wang, J.; Fan, Z.; Liu, S. Economic Feasibility of LNG Business: An Integrated Model and Case Study Analysis. Energies 2024, 17, 3351. [Google Scholar] [CrossRef]
  18. Jiao, Y.M.; Chen, S.; Yang, L.; Zhou, H.; Wang, Z.; Li, Q. Operation efficiency and cost check of energy consumption of submerged combustion vaporizer. Chem. Eng. Oil Gas 2014, 43, 505–511. [Google Scholar]
  19. Peng, C.; Wang, H.D.; Hou, X.G.; Wang, H.S.; Lyu, H.S.; Liu, P.P.; Wei, J.R.; Chen, A.M. Optimization of operation scheme with combined BOG treatment process in LNG terminals. Oil Gas Storage Transp. 2023, 42, 624–631. [Google Scholar]
  20. Xie, X.G.; Sun, N. Calculation method of greenhouse gas emission from LNG terminals. Oil Gas Storage Transp. 2023, 42, 276–282+312. [Google Scholar]
  21. Li, X.; Chen, S. Energy saving analysis on variable-frequency seawater pump and high-pressure pump in LNG terminal. Chem. Eng. Oil Gas 2016, 45, 100–106. [Google Scholar]
  22. Chen, F.; Xie, X.G.; Sun, N.; Gao, Z. Sequential measurement and economic evaluation of carbon emissions from LNG terminals. Oil Gas Storage Transp. 2023, 42, 509–516. [Google Scholar]
  23. Khan US, S.; Khaliq, M.M.; Shakeel, M.A. Simulation Analysis of Novel Integrated LNG Regasification-Organic Rankine Cycle and Anti-Sublimation Process to Generate Clean Energy. Energies 2023, 16, 2824. [Google Scholar] [CrossRef]
Figure 1. Open rack vaporizer (ORV) process flow chart.
Energies 18 00276 g001
Figure 2. Submerged combustion vaporizer (SCV) process flow chart.
Energies 18 00276 g002
Figure 3. Process model of the LNG terminal gasification unit based on Aspen HYSYS.
Energies 18 00276 g003
Figure 4. Simulation gasification process model validation. (a) Relative error of the ORV simulation model, (b) relative error of the SCV simulation model.
Energies 18 00276 g004
Figure 5. Optimal seawater flow at different seawater inlet temperatures. (a) Seawater inlet temperature 30 °C; (b) seawater inlet temperature 25 °C.
Energies 18 00276 g005
Figure 6. The optimal seawater flow rate of the two ORV under different temperature differences between seawater inlets and outlets. (a) Temperature difference 5 °C. (b) Temperature difference 4 °C, (c) Temperature difference 3 °C. (d) Temperature difference 2 °C. (e) Temperature difference 1 °C.
Energies 18 00276 g006
Figure 7. SCV fuel gas consumption.
Energies 18 00276 g007
Figure 8. Operational costs of coupled operation and SCV standalone operation with different seawater inlet/outlet temperature differences.
Energies 18 00276 g008
Figure 9. Economic benefit of combined transport under different temperature differences of seawater inlet and outlet.
Energies 18 00276 g009
Figure 10. Intermodal cost savings by percentage.
Energies 18 00276 g010
Figure 11. Intermodal mode economic efficiency curve.
Energies 18 00276 g011
Table 1. Open rack vaporizer (ORV) main parameters of an LNG receiving station.
DesignationParameter
LNG quantity of flow207.26 t/h
LNG inlet temperature−160 °C
NG outlet temperature3 °C
Design temperature−165 °C/50 °C
LNG inlet pressure (design/operation)15.7 MPaG/10.1 MPaG
Rated sea water pump flow9000 t/h
Seawater inlet temperature (design/operation)50 °C/8–37.8 °C
Seawater outlet temperature≥3 °C
Table 2. Submerged combustion vaporizer (SCV) main parameters of an LNG receiving station.
DesignationParameter
LNG quantity of flow207.26 t/h
LNG inlet temperature−160 °C
NG outlet temperature3 °C
Design temperature−165 °C/50 °C
LNG inlet pressure (design/operation)15.7 MPaG/10.1 MPaG
Design heat transfer efficiency98%
Design temperature of water bath22 °C
High calorific value of fuel gas54,330 kj/kg
Table 3. LNG component content at the inlet of the gasification unit.
NameCH4C2H6N2
Mole Fraction99.8%0.07%0.13%
Table 4. Onsite test operation data of LNG terminal at a certain time.
ParameterORV Actual Operation ValueSCV Actual Operation Value
LNG quantity of flow162.246 t/h134.001 t/h
LNG inlet temperature−148.61 °C−147.67 °C
LNG inlet pressure7.3 MPaG8.08 MPaG
NG outlet temperature4.65 °C8.5 °C
NG outlet pressure7.3 MPaG8 MPaG
ORV seawater inlet temperature9.04 °C——
ORV seawater outlet temperature5.42 °C——
SCV tube area water bath temperature——13.17 °C
SCV combustion area water bath temperature——13.19 °C
Table 5. LNG export volume and ORV operation requirements of Tangshan LNG receiving station.
NameParameterNameParameter
LNG export volume0~400 t/hNG outlet temperature≥1 °C
Seawater inlet–outlet temperature drop≤5 °CSeawater outlet temperature≥0 °C
Fin plate freezing height≤1 mMinimum seawater film-forming flow3742.5 t/h
Table 6. Maximum ORV gasification flow under winter conditions.
Seawater Inlet–Outlet
Temperature Difference/°C
LNG Inlet Temperature/°CMaximum LNG Gasification Rate/(t/h)
4−130487.2
−135473.717
−140461.184
−145449.481
−150438.504
3−130365.43
−135355.316
−140345.916
−145337.137
−150328.905
2−130243.64
−135236.897
−140230.63
−145224.777
−150219.288
1−130121.831
−135118.459
−140115.325
−145112.398
−150109.654
Table 7. The number of operating units and flow values of temperature difference vaporizers at different seawater inlets and outlets.
Seawater Inlet–Outlet
Temperature Difference
ORV UnitsORV Gasification RateSCV UnitsSCV Gasification Rate
3 °C2345.916 t/h154.094 t/h
2.5 °C2300.698 t/h199.302 t/h
2 °C2230.630 t/h1169.370 t/h
1.5 °C2180.539 t/h2219.461
1 °C2115.325 t/h2284.675 t/h
Disclaimer/Publisher’s Note: The statements, opinions and data contained in all publications are solely those of the individual author(s) and contributor(s) and not of MDPI and/or the editor(s). MDPI and/or the editor(s) disclaim responsibility for any injury to people or property resulting from any ideas, methods, instructions or products referred to in the content.

