Article

A Novel Nonlinear Droop Function for Flexible Operation of Grid-Forming Inverters

by
Salman Harasis
Department of Electrical Power and Mechatronics Engineering, Tafila Technical University (TTU), Tafila 66110, Jordan
Energies 2025, 18(18), 4885; https://doi.org/10.3390/en18184885
Submission received: 9 August 2025 / Revised: 10 September 2025 / Accepted: 10 September 2025 / Published: 14 September 2025

Abstract

This paper introduces the Exponent Droop Function (EDF), a nonlinear grid-forming (GFM) control paradigm that enhances the flexibility and performance of droop-based control in microgrids. Unlike conventional droop mechanisms, the EDF establishes a generalized framework that unifies multiple nonlinear droop relations, enabling adaptive shaping of droop characteristics through the adjustment of a single tuning parameter. This capability effectively mitigates the inherent limitations of traditional droop, particularly frequency degradation, while ensuring flexible power-sharing and improved dynamic performance. The proposed approach is rigorously validated through (i) detailed system modeling and small-signal stability analysis of EDF-controlled microgrids under variable load and droop conditions, (ii) dynamic assessments of distributed generators (DGs) supported by frequency-domain analysis, and (iii) extensive time-domain simulations encompassing seven representative operating scenarios. Comparative studies against state-of-the-art GFM controllers demonstrate that EDF achieves superior transient and steady-state performance with minimal control complexity, highlighting its potential as a practical and efficient next-generation GFM control strategy for microgrids.

1. Introduction

Grid modernization and transformation require reliable deployment of multiple types of energy sources. This is accompanied by an increased interest in achieving reliable GFM technology. Therefore, extended penetrations of renewables into power networks can be achieved at minimal risk. Moreover, the future shape of the existing power system and the formation of microgrids necessitate a mature deployment of all types of DGs [1,2]. The increased large-scale deployments of renewables in the existing power systems accelerate the growth of independent microgrids. Stabilizing the operation of such sources should be ensured by developing advanced control strategies to ensure satisfying performance of all power electronic-based power systems.
Microgrids under dynamic conditions are different from conventional power systems [3]. The applied control algorithms, the effect of measurements and communications delay, and the possible configurations that can be either radial or mesh play major roles in shaping the dynamics of microgrids [4]. The droop control mechanism is commonly used in power systems as a reliable and simple control to maintain voltage and frequency stability. Traditional linear droop control involves adjusting the power output of DG in proportion to the degradation in frequency or voltage [4]. However, there are needs and motivations that drive the development of new advanced droop mechanisms to overcome the shortcomings of linear droop and to fulfill the new requirements. EDF control is proposed here as a nonlinear droop mechanism to bridge the gaps in conventional droop control. In microgrids with multiple DGs, EDF control can better distribute the load among the DGs, ensuring that each source operates at its optimal operating point. With renewable sources, EDF control can effectively prioritize their utilization for efficient integration. As a result, EDF control aims at substituting linear droop as a flexible, easy-to-implement control, and applicable to all types of DGs.
The absence of physical inertia impacts the frequency profile and augments the stabilization issues of inverter-based microgrids [5,6]. Consequently, detailed investigations are continuously required to achieve high-performing microgrids under all operating conditions. These factors motivated the development of the modeling section of this paper and led to considerable involvement of the control and physical components in the modeling process such that their effect on system performance can be carefully observed. Therefore, stability of EDF control is also investigated.
Recent literature has reported several versions of droop control that can be applied in microgrids. The researchers proposed and examined several droop-based strategies according to the required functionality. The author in [4,5,6] discussed and compared different droop control methodologies and their implementation in microgrids. The classification and applicability of each type based on X/R ratio have also been addressed in [3,6]. Among different modeling techniques, large signal and small signal analyses have been developed as executable methodologies to investigate system stabilization and dynamic performance [7,8,9]. In large signal analysis, large variation in system operating range is considered to encompass nonlinear operating ranges. In this way, energy functions, equal area criterion, and Lyapunov-based analysis are implemented as large signal analysis tools [10]. In small signal analysis, a narrower operating range is considered, which is linearized to result in an accurate modeling [11,12,13]. The small signal is mathematically easy as it enables state-space-based analysis that can be performed on any system size or type. Moreover, small signal analysis offers the ability to extract the relationship between system instability, physical, and control parameters. To cover wide operating ranges, the small signal analysis should be reconstructed at each operating point as performed in this work.
In [7], the authors discussed different methodologies used to study microgrid modeling. The work highlighted how the modeling procedure becomes inaccurate and difficult with the increased number of sources and gave the advantages of using a small signal analysis approach. The authors in [14] investigated the resistive droop as a universal droop that works suitably with different types of output filters. The work showed that the droop can be performed if decoupling active power from the phase is ensured. In [15], virtual synchronous generator (VSG) was proposed and equipped with droop control to eliminate the phase-locked loop. The control was proposed to work under a grid connection, where the power synchronization loop ensures suitable inverter performance under grid disturbances. In [16], a droop-control was analyzed using the state space averaging method. The authors segregated the components of the system to simplify the modeling. The developed model was used to test the effect of the droop coefficients on system stability. In [17], the stability of a nonlinear frequency drooped microgrid was examined by studying the dynamics of the frequency controller without considering the dynamics of the controllers and load. The work in [18] focused on studying the effect of network losses and filter parameters on microgrid stability. The authors related the droop gains to the power sharing accuracy and to the stability margins of the system.
For single-phase system, the authors in [19] implemented a bandpass filter (PBF) droop control. The BPF was employed to minimize the steady state error in voltage and frequency. The dynamics of the system were examined using the eigenvalue mapping method. In [20], state feedback control was used to help the droop control stabilize the dynamics of parallel connected inverters. Small signal and root locus analysis were used to verify the effectiveness of the state feedback control in suppressing microgrid’s dynamics. In [21], the focus was made on analyzing microgrid performance based on droop coefficients and X/R ratio. The obtained results showed how the stability of frequency and voltage profiles can be maintained when with H control to suppress the low-frequency oscillations. The work presented in [22] showed the stability of a modified droop control. The authors multiplied the frequency droop by a cascaded lead compensator to increase the stability margins by increasing the droop gain. However, the modified droop showed very poor performance during the transient where the current exceeded the limits multiple times compared to the conventional droop.
In [23], the authors showed that working with large droop constants leads to unstable equilibrium points. The work examined the possible oscillations that occur during disturbances using a reduced-order model of the microgrid. The researcher in [24] proposed a natural exponential function to improve the reactive power sharing in microgrids. A stability analysis was carried out to examine the stability of the proposed controller. The small signal analysis performed in [25] has confirmed the small signal stability of DGs working with small droop constants obtained in [24]. The authors modified the droop relation by introducing the inverse tangent function to relax the slope of the relation as the power increases. In [26,27], the authors proposed a cost-based nonlinear droop function to minimize operating costs of microgrids. However, no technical aspects were discussed. In [28,29,30], small signal analysis has been used to check the suitability of inverter-based systems in grid interaction applications. In [31], a power exponent droop was reported and compared with the synchronous generator. The authors designed the droop to minimize the power reserve. However, a secondary loop was needed to compensate for the frequency offset caused by the developed droop. The authors in [32] proposed a high-order polynomial-based droop function where the nonlinearity increases as the order increases. This incurs additional mathematical implications.
Unlike the aforementioned nonlinear control strategies, the EDF control brings new features and capabilities. Particularly, the need for a more advanced and flexible GFM control strategy is fulfilled by EDF control. Traditional droop control has limitations such as frequency degradation and lack of flexibility in shaping droop characteristics to meet diverse operational requirements. EDF control addresses this gap by introducing a novel approach that offers flexibility in constructing multiple nonlinear droop relations with just one parameter adjustment. Through comprehensive modeling, analysis, and case studies, the paper demonstrates the effectiveness of the EDF control in various operational scenarios, highlighting its superiority over existing control strategies in terms of performance and simplicity. To clarify the differences between the proposed control and the literature, Table 1 compares the proposed control and state-of-the-art control strategies considering many aspects.
A generalized descriptive scheme of the procedure is shown in the flowchart in Figure 1. The steady equilibrium operating point is derived from the model for each loading condition. State space averaging is then used to obtain the small signal linearized model, leading to the generation of complete system eigenvalues. The system’s dynamic stability is examined through eigenvalue mapping. This stability assessment involves constructing an overall dynamic model that includes distributed generators (DGs), distribution lines, and variable loads.
The remainder of this paper is organized as follows. Section 2 introduces the proposed Exponent Droop Function (EDF) control strategy and highlights its unique features compared to conventional droop control. Section 3 develops the dynamic modeling of EDF-controlled microgrids, including the linearized small-signal state-space representation. Section 4 evaluates the dynamic performance of EDF through frequency-domain analysis and detailed time-domain case studies. Section 5 provides a discussion of the key insights and implications of the proposed method, while Section 6 concludes the paper and outlines potential future research directions.

2. Exponent Droop Function (EDF) Control Strategy

The detailed flowchart of the proposed modeling is shown in Figure 2, where the procedure is updated with each new operating point. Stable operating points are determined using small signal analysis under certain conditions. The modeling incorporates variable load and control parameters, as the droop slope changes continuously with the load. Examining the droop mechanism by sweeping the load is effective. Dynamic stability analysis is conducted at different loading conditions covering a wide range of droop characteristics, ensuring system stability under both scanned control parameters and variable loading conditions.
The EDF control proposed in this paper introduces a range of advanced features that significantly enhance GFM control technology. While simple to implement and adaptable to various DGs, the EDF control offers several novel advantages over conventional droop control methods. The characteristics can be summarized as follows:
  • The proposed EDF control dynamically adjusts the loading of DGs to ensure optimal stabilization of both frequency and voltage even under varying load conditions. This adaptive capability ensures more balanced power distribution which leads to enhanced system resilience.
  • EDF control supports the generation of multiple nonlinear droop characteristics by tuning one parameter which allows the control to adapt to diverse operational requirements. This flexibility ensures efficient power management in microgrids with complex configurations.
  • The novel EDF approach introduces simultaneous horizontal and vertical shifts in droop characteristics which allows DGs to meet complex technical and economic constraints. This generalization provides a higher degree of operational flexibility which, in turn, ensures that DGs can adjust to a wider range of conditions and setpoints.
The specific contributions of this research are summarized as follows:
  • A variable load-variable control (VLVC) small-signal stability analysis is performed to rigorously evaluate the system stability under EDF control. This analysis provides a deeper understanding of the control method’s dynamic behavior across various operating conditions (The proposed technique is visualized in Figure 2).
  • The paper identifies the feasible range of coefficients for maintaining stable microgrid operation under EDF control.
  • A complete and adaptive procedure is developed to evaluate the dynamics and stability of a microgrid equipped with EDF under variable load conditions. This procedure ensures that EDF control can be reliably deployed under variable loading conditions.
  • Several time-domain simulations are performed to validate the effectiveness of EDF as an advanced GFM control strategy. These simulations demonstrate the control’s ability to handle variable power-sharing and system stability under various load profiles, supporting its practical application.
  • In addition, EDF is compared with other GFM (e.g., VSG) and GFD (e.g., MPPT) control strategies. This comparison confirms the superior dynamic performance, adaptability, and enhanced stability of EDF which emphasizes its effectiveness as an optimal replacement of the conventional droop control.
In the linear droop mechanism, the operating frequency and voltage of a source runs in an inductive network are controlled according to conventional f P and V Q droop relations given in (1) and (2) [6]:
f o u t = f n l m p P i f ,
V o u t = V n l n q Q i f ,
where f o u t , V o u t , f n l , V n l ,   m p , n q are the operating frequency, output voltage, no load frequency, no-load voltage, active power droop coefficient, and reactive power droop coefficient of the ith source working in parallel with other sources supplying filtered active power, P i f and reactive power, Q i f .
Flexible power sharing can be reliably realized by implementing the proposed control. The droop relations of EDF control are established as expressed in (3) and (4) after obtaining the filtered power signals (i.e., P i f and Q i f ). The proposed droop is considered a universal control due to the ability to shape the droop relations flexibly with a high degree of freedom and minimal mathematical expression.
f o u t = f n l α f 1 P m a x P i P m a x β f P i f = f n l γ p P i f
V o u t = V n l α v 1 Q m a x Q i Q m a x β v Q i f = V n l γ q Q i f
Here, P m a x ,   Q m a x , f n l ,   V n l ,   γ p , a n d   γ q are maximum active power, maximum reactive power, no load frequency, no load voltage, equivalent frequency droop coefficient, and equivalent voltage droop coefficient, respectively. The coefficients: α f , α v , β f ,   and β v are the corresponding droop coefficients. The coefficients; γ p and γ q are equivalent to   m p and n q when β f = β v = 1 , respectively as given in (5).
γ p β f = 1 = m p = f m a x P m a x   ,     γ q β v = 1 = n q = V m a x Q m a x  
The coefficients; β f and β v can be selected offline or online [6]. In offline, they can be determined according to generation type and cost, network capacity, and load type. Online, the controller can be tuned according to real-time measurements to either control the amount the power supplied by the source or to regulate the voltage and frequency. The coefficients; α f and α v can be easily set as in linear droop, where the values of α f and α v are the same as mp and nq, respectively [6]. The carried-out work focuses on f P droop relation as the power and frequency dynamics are mainly incorporated in stability studies. Even though a reasonable selection of the coefficients of EDF can be performed, their contribution to system stability is included in the modeling to explicitly study their impact on microgrid dynamics.
Before starting the modeling, it is important to revise the major features of the proposed droop. The features can be described as follows:
1-
By changing the exponent droop coefficient (i.e., β f ) (considering β f as a “variable” with a predetermined fixed α f ), the relation can be flexibly shaped. The obtained relation is equivalent to a high-order polynomial that requires several terms to construct. An example is given in Figure 3 where the droop relation is reconstructed using a 3rd order polynomial (equivalent to β f = 0.5 ) and 7th order polynomial (equivalent to β f = 0.5 ).
2-
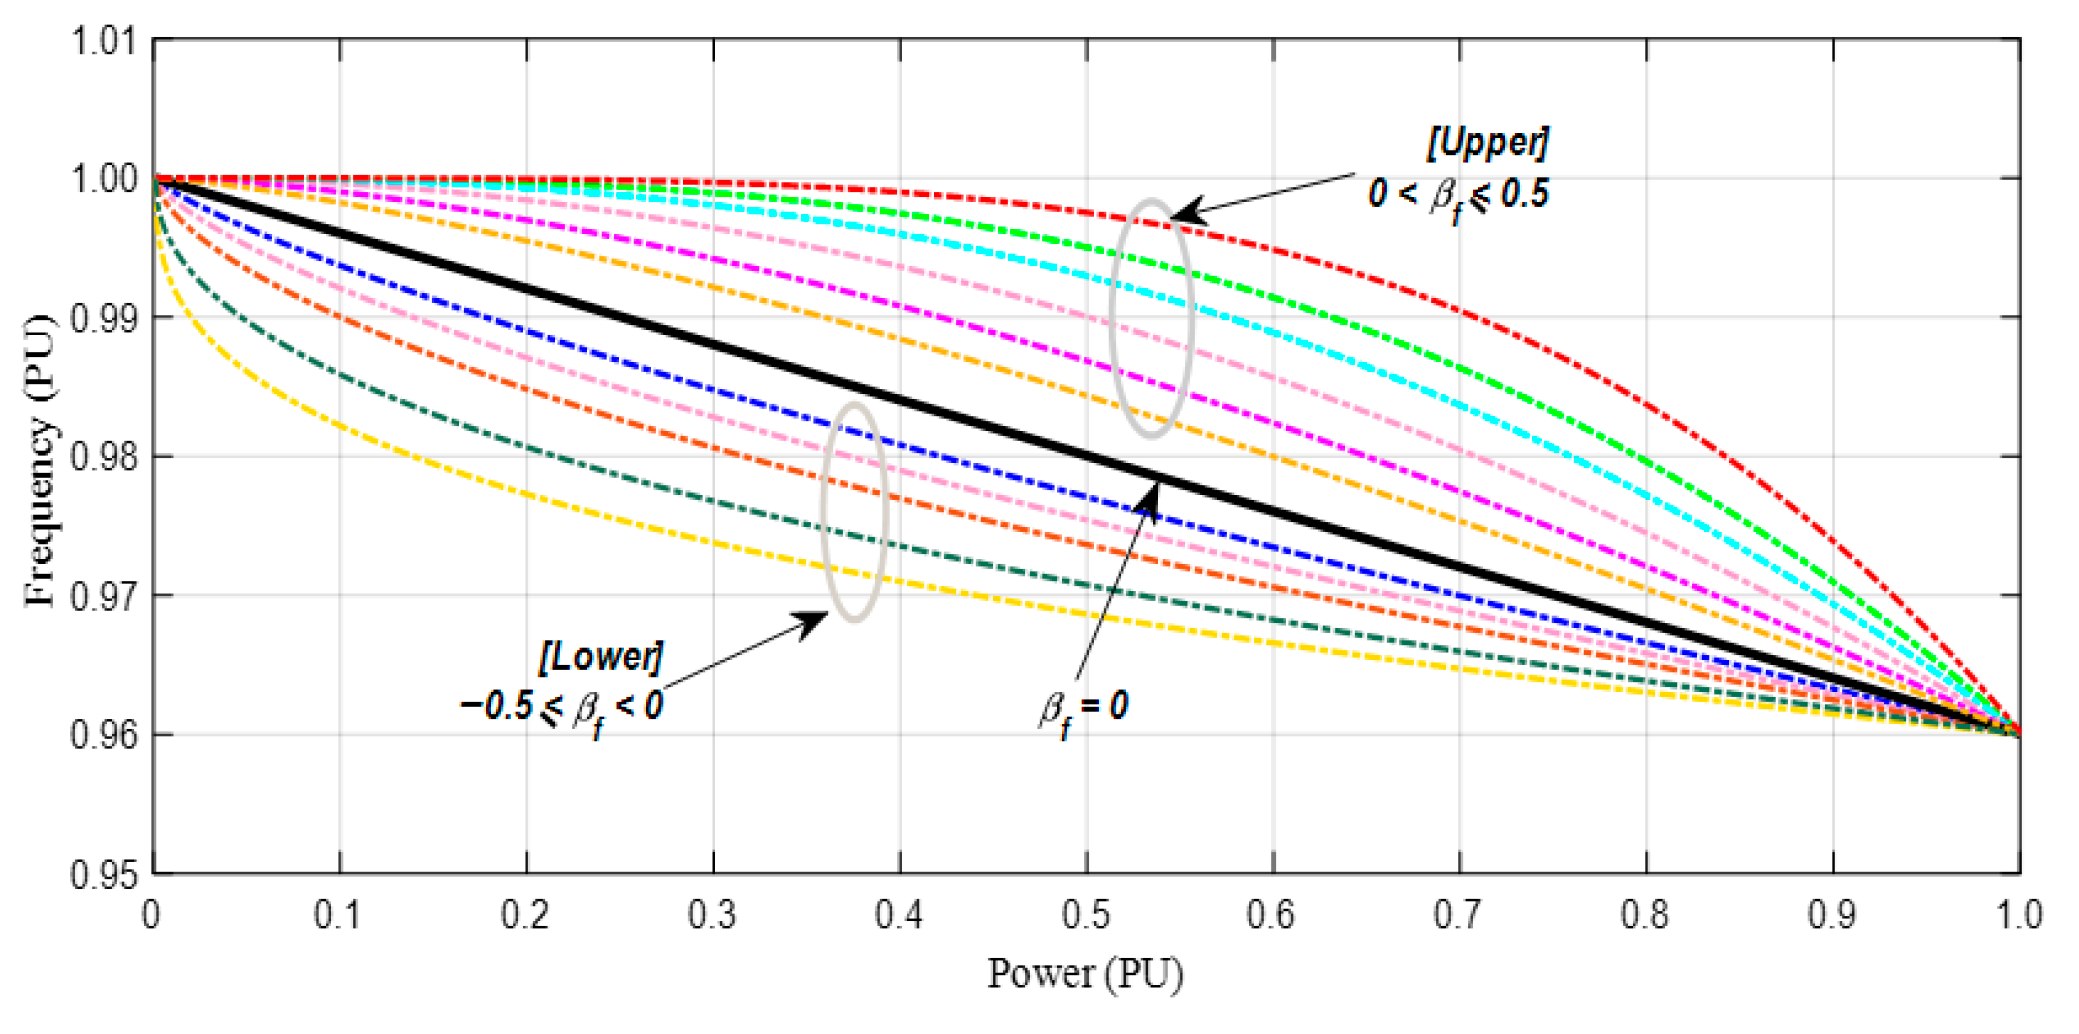
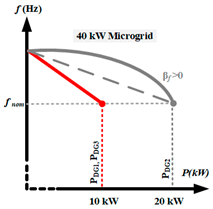
The droop relation with β f > 0   can be effectively applied to large DGs due to the high utilization levels of the existing reserve compared to linear droop. This is because, as β f increases, more power can be processed from the source with minimal frequency deviation. This can be visualized from the upper characteristics depicted in Figure 4.
3-
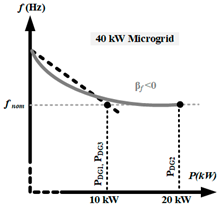
The droop relation with β f < 0   can be effectively implemented on small DGs. The small equivalent droop coefficient at high loadings, where the relation relaxes, helps stabilize a small DG under disturbances. This increases the stability margins at high loadings in the presence of disturbances. This can be visualized from the lower characteristics depicted in Figure 4.
It is important to mention that the resultant nonlinear droop control dynamically adjusts the power output of DGs based on their operating conditions and requirements. The adaptive power-sharing mechanism ensures that DGs operate closer to their optimal efficiency points to minimize overall power losses. On the other hand, conventional droop controls may lead to inefficient power distribution when some DGs operate fully loaded while others are underloaded.
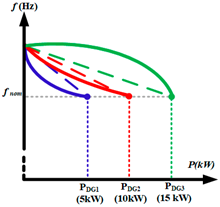
The generalized droop and higher degree of freedom that can be realized by the EDF droop function enables the DG to operate at various setpoints considering both technical and economic constraints. This allows the microgrid to share power in a way that minimizes generation costs and losses by prioritizing the use of renewable DGs which results in cost-effective operation. For example, when a renewable DG is equipped with EDF control under a positive droop coefficient (i.e., + β f ) , the DG can work as a semi-MPPT control and outputs most of the power harvested at low and heavy loading conditions as can be seen from the upper characteristic of Figure 4. In this case, the cost-effective operation of the DG can be ensured without compromising the stability and dynamics due to the flat shape characteristic under light loads and the steep shape characteristic under very heavy load. Consequently, power generation with a certain headroom can be realized easily under EDF control according to the type and size of the DG.

3. Dynamic Modeling of EDF-Controlled Microgrid

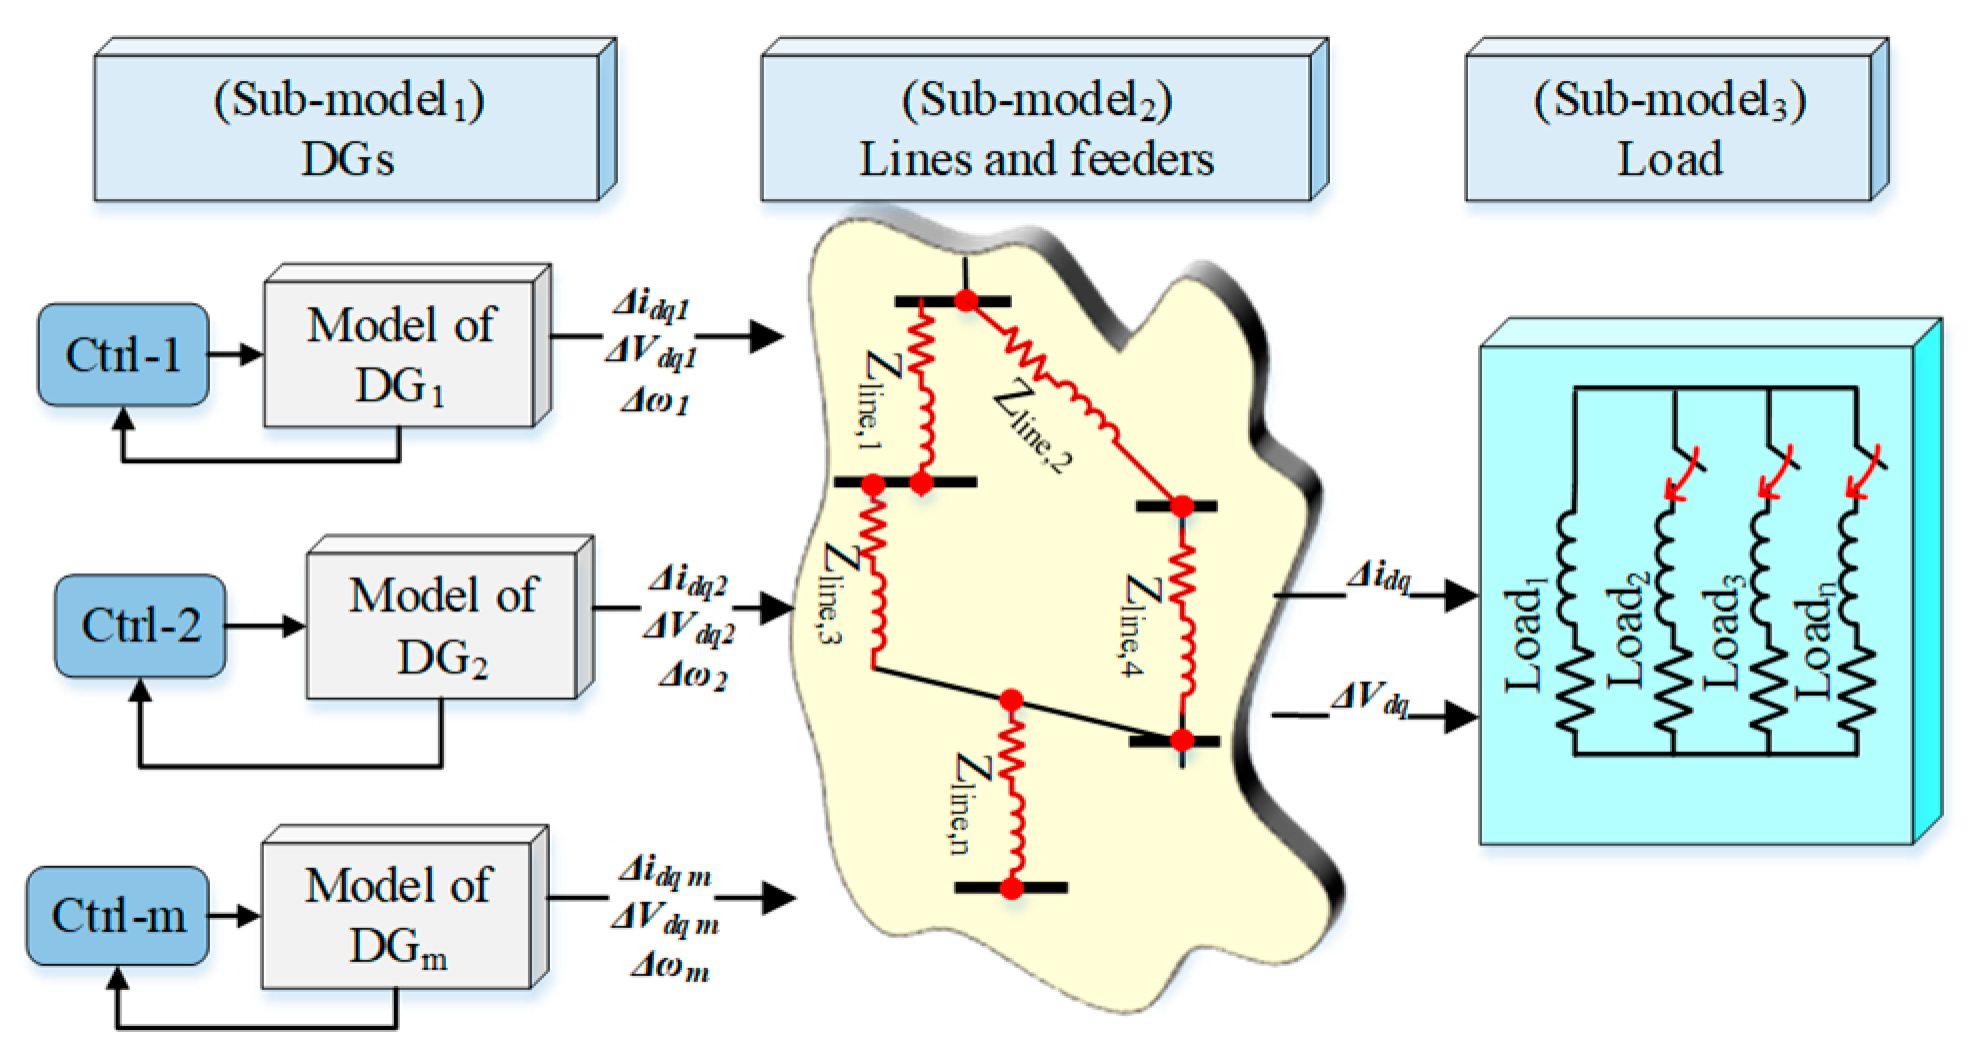
To perform the analysis and performance evaluation of the microgrid equipped with the proposed control under different loadings, the components are first modeled independently and then grouped together to generate the overall input-output transfer function. The modeling is depicted in Figure 5.
In the developed modeling procedure, the integrated DGs are represented based on a unified reference frame that is used to refer to the modeling of system components. The modeling of the system components is referred to a common DQ- frame according to the transformation matrix given in (6) [16,19].
X D Q = cos δ i sin δ i sin δ i cos δ i X d q ,
where   X D Q is the common frame that is revolving at the common angular frequency   ( c o m ) of the first DG. The value X d q is the reference frame of the other components revolving at their own angular frequency ( ω i ) .

3.1. Constructing EDF Controlled DG Model

For modeling DGs, it is represented by a voltage source inverter fed by a dc source, and the inverter output is connected to the system through an LC filter. The output active and reactive power signals are obtained from the d- and q-components of the voltage and current before being low pass filtered (i.e.,   X i f = c s + c X i   ,   X = P , Q ). A first order filter is usually used with a reasonable cutoff frequency,   ω c . The filter is added to the control loop to damp the oscillations and smooth the dynamics. The power angle of the first DG is considered as a reference; therefore, its angle, δ 1 = 0 . The first state equation representing the ith DG states is given in (7).
x 1 = δ i = ω i = [ ω n l γ p i P i f ω c o m ]
The related state variable equations of the active and reactive power, and the dq- components of the operating voltage are derived and given in (8) through (11).
P i f = ω c ( P i P i f ) = ω c V d i   i d i + V q i   i q i 2 P i f
Q i f = ω c ( Q i Q i f ) = ω c V q i i d V d i i q 2 Q i f
V d i = V n l γ v i Q i f cos ( δ i )
V q i = V n l γ v i Q i f sin ( δ i )
The state equation of the filtered active power ( P i f ) and reactive power ( Q i f ) are then obtained. After plugging (10) and (11) into (8) and (9), the detailed state equations of the active power can be obtained as in (12) and (13). The values; V d i , V q i , i d i , and i q i   are the d- and q-components of ith DG output voltage and current, respectively.
P i f = ω c V n l i d i cos δ i 2 γ v i i d i cos δ i 2 + V n l i q i s i n δ i 2 γ v i i q i sin δ i 2 P i f
Q i f = ω c   V n l i d i sin ( δ i ) 2 γ v i i d i sin ( δ i ) 2 V n l i q i cos ( δ i ) 2 + γ v i i q i cos ( δ i ) 2 Q i f
The voltage at the coupling points of each DG can be defined as shown in (14) where V o is the bus voltage and V i is the DG voltage with the filter inductance, L i .
V o d q = V i d q + L i d i q d d t ± ω L i q d
From (14), the derivative of the d- and q- current components are given in (15) where ω i is the system frequency. If the voltage and frequency values are substituted by the expression in the droop equations, the current equations can be given as in (16). The state equations of the inverter d- and q- current components ( i q d ) are considered in the model.
i d i = ω i i q i + 1 L i V o d V d i
  i q i = ω i i d i + 1 L i V o q V q i
i d i = ω n l γ p i P i i q i + V n l γ v i Q i L i c o s ( δ i ) V o d L i
i q i = ω n l γ p i P i i d i + V n l γ v i Q i L i s i n ( δ i ) V o q L i
The above equations, (7) to (18) represent the nonlinear model of the DG. Since the difference between phase angles of the DGs are small, the linearization can be achieved assuming cos ( δ i ) 1 and sin ( δ i ) δ i . So, V d i and V q i can be simplified as shown in (19) and (20). Substituting (19) and (20) in (12) and (13), the real and reactive power of ith DG can be expressed as given in (21) and (22), respectively. Also, plug (17) in (15), the d- and q- currents ith DG can be expressed as in (23) and (24).
V d i V n l γ v i Q i
V q i V n l γ v i Q i δ i
x 2 = P i f = ω c V n l i d i γ v i Q i   i d i + V n l δ i i q i δ i γ v i Q i   i q i 2 P i f
x 3 = Q i f = ω c V n l δ i i d i γ v i Q i   δ i i d i V r e f i q i + γ v i Q i   i q i 2 Q i f
x 4 = i d i = ω n l i q i γ p i P i   i q i + V n l γ v i Q i L i V o d L i
x 5 = i q i = ω n l i d i + γ p i P i   i d i + V n l γ v i Q i L i δ i V o q L i
By perturbing the state variables of the DGs around a stable steady state operating point, X o , (e.g., δ i o , Q i f o are the steady state phase, and the filtered reactive power of the ith DG, respectively) and applying Taylor series expansion (TSE) on each steady state, the linearized model can be obtained as given in (25). In state space averaging, the steady state of the “state variable” equals its average value considering that each state has negligible ripple (i.e., X 0 = X ¯ ).
x 1 ~ ˙ = δ i ~ ˙ = γ p i δ P i + γ p , 1 δ P 1       x 2 ~ ˙ = P i f ~ = ω c 2 V r e f γ q i Q i f o δ i d i n q i I d i o + δ i γ q i I q i o δ Q i f + V n l I q i o γ q i I q i o Q i f o δ ~ i + V n l δ i o δ i o γ q i Q i f o δ i q i x 3 ~ ˙ = Q i f ~ = ω c 2 V n l δ i o γ q i Q i f o δ i o δ i d i 1 + γ q i δ i o I d i o γ q i I q i o δ Q i f + V n l I d i o γ q i Q i f o I d i o δ ~ i V n l γ q i Q i f o δ i q i X 4 ~ ˙ = i d i ~ = ω r e f γ p i δ i q i + γ q i L i δ Q i f δ V o d L i I q i o α f i δ P   x 5 ~ ˙ = i q i ~ = δ γ p i I d i o + γ p i ω r e f δ i d i γ q i δ i o L i δ Q i f + V n l γ q i Q i f o L i δ ~ i δ V o q L i      

3.2. Constructing Distribution Lines and Load Models

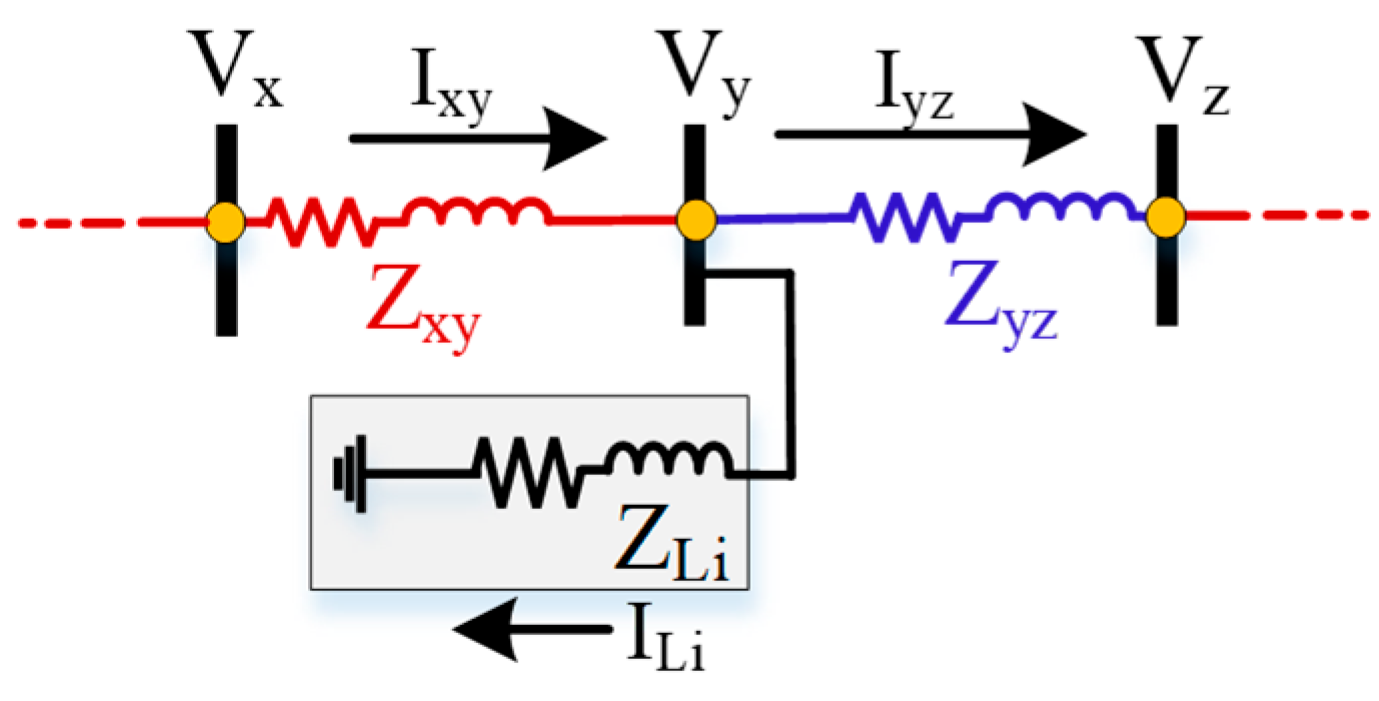
The inductive distribution lines of the microgrid are shown in Figure 6 with an equivalent impedance Z x y = R x y + j ω L x y .
As variable loading conditions are considered, the load is considered as an input (u(t)) to the state-space model. The system equations of the coupling lines and load branches are given in (26) and (27), respectively.
i x y d q = R x y L x y i x y d q ± ω i x y q d + 1 L x y V o x d q 1 L x y V o y d q
i L i d q = R L i L L i i L i d q ± i L i q d + 1 L L V o d q
Similarly to the procedure developed in modeling the DG in the detailed development shown before, the equations given in (28) through (31) represent the linearized small signal state-space models of the lines and loads sub-models.
x 6 ~ ˙ = i x y d ~ ˙ = R x y L x y δ i x y d + δ ω 1 I x y q o + ω 1 o δ i x y q + 1 L x y δ V o x d 1 L x y δ V o y d
x 7 ~ ˙ = i x y q ~ ˙ = R x y L x y δ i x y q δ ω 1 I x y d o ω 1 o δ i x y d + 1 L x y δ V o x q 1 L x y δ V o y q
x 8 ~ ˙ = i L i d ~ ˙ = δ Z L i L L i I L i d o + Z L i L L i δ i L i d + ω 1 o δ i L i q + δ 1 I L i q o + 1 L L i δ V o d
x 9 ~ ˙ = i L i q ~ ˙ = δ Z L i L L i I L i q o + Z L i L L i δ i L i q ω 1 o δ i L i d δ 1 I L i d o + 1 L L i δ V o q

3.3. The Entire Model of the System

The aggregated state-space model of the whole system can be obtained by combining the realized sub-models as given in (32). The size of the matrices in (32) depends on the number of DGs and lines. The resultant model shows that the nodal voltages obtained from the load flow routine are the inputs of the system. Moreover, the assigned load impedance is also taken as an input as it represents variable loadings. (For more details see Appendix A)
x D G s x L i n e s x L o a d s = A D G 0 0 0 A L i n e 0 0 0 A L o a d δ i   P i f   Q i f   i d i   i q i T I A B d   I A B q   T i L i d   i L i q   T + B D G B L i n e B L o a d T V o d   V o q   c o m T V o x d   V o x q   V o y d   V o y q   c o m T V o d   V 0 q   c o m   Z L   T Y = C D G   C L i n e C L o a d   δ i   P i f   Q i f   i d i   i q i T I A B d   I A B q   T i L i d   i L i q   T
The eigenvalues of the equivalent state transition matrix; [ A ] given in (32) are dynamically updated to examine the stability of the system. This matrix includes the whole system components and control parameters. The numerical results of the small signal analysis are reported in the next section.
The stability margins can also be obtained to accurately quantify the feasible range of the droop coefficients. The output matrix (Y) is considered to be the same as state variables. Therefore, the matrix; C is an identity matrix.

4. EDF Control Implementation

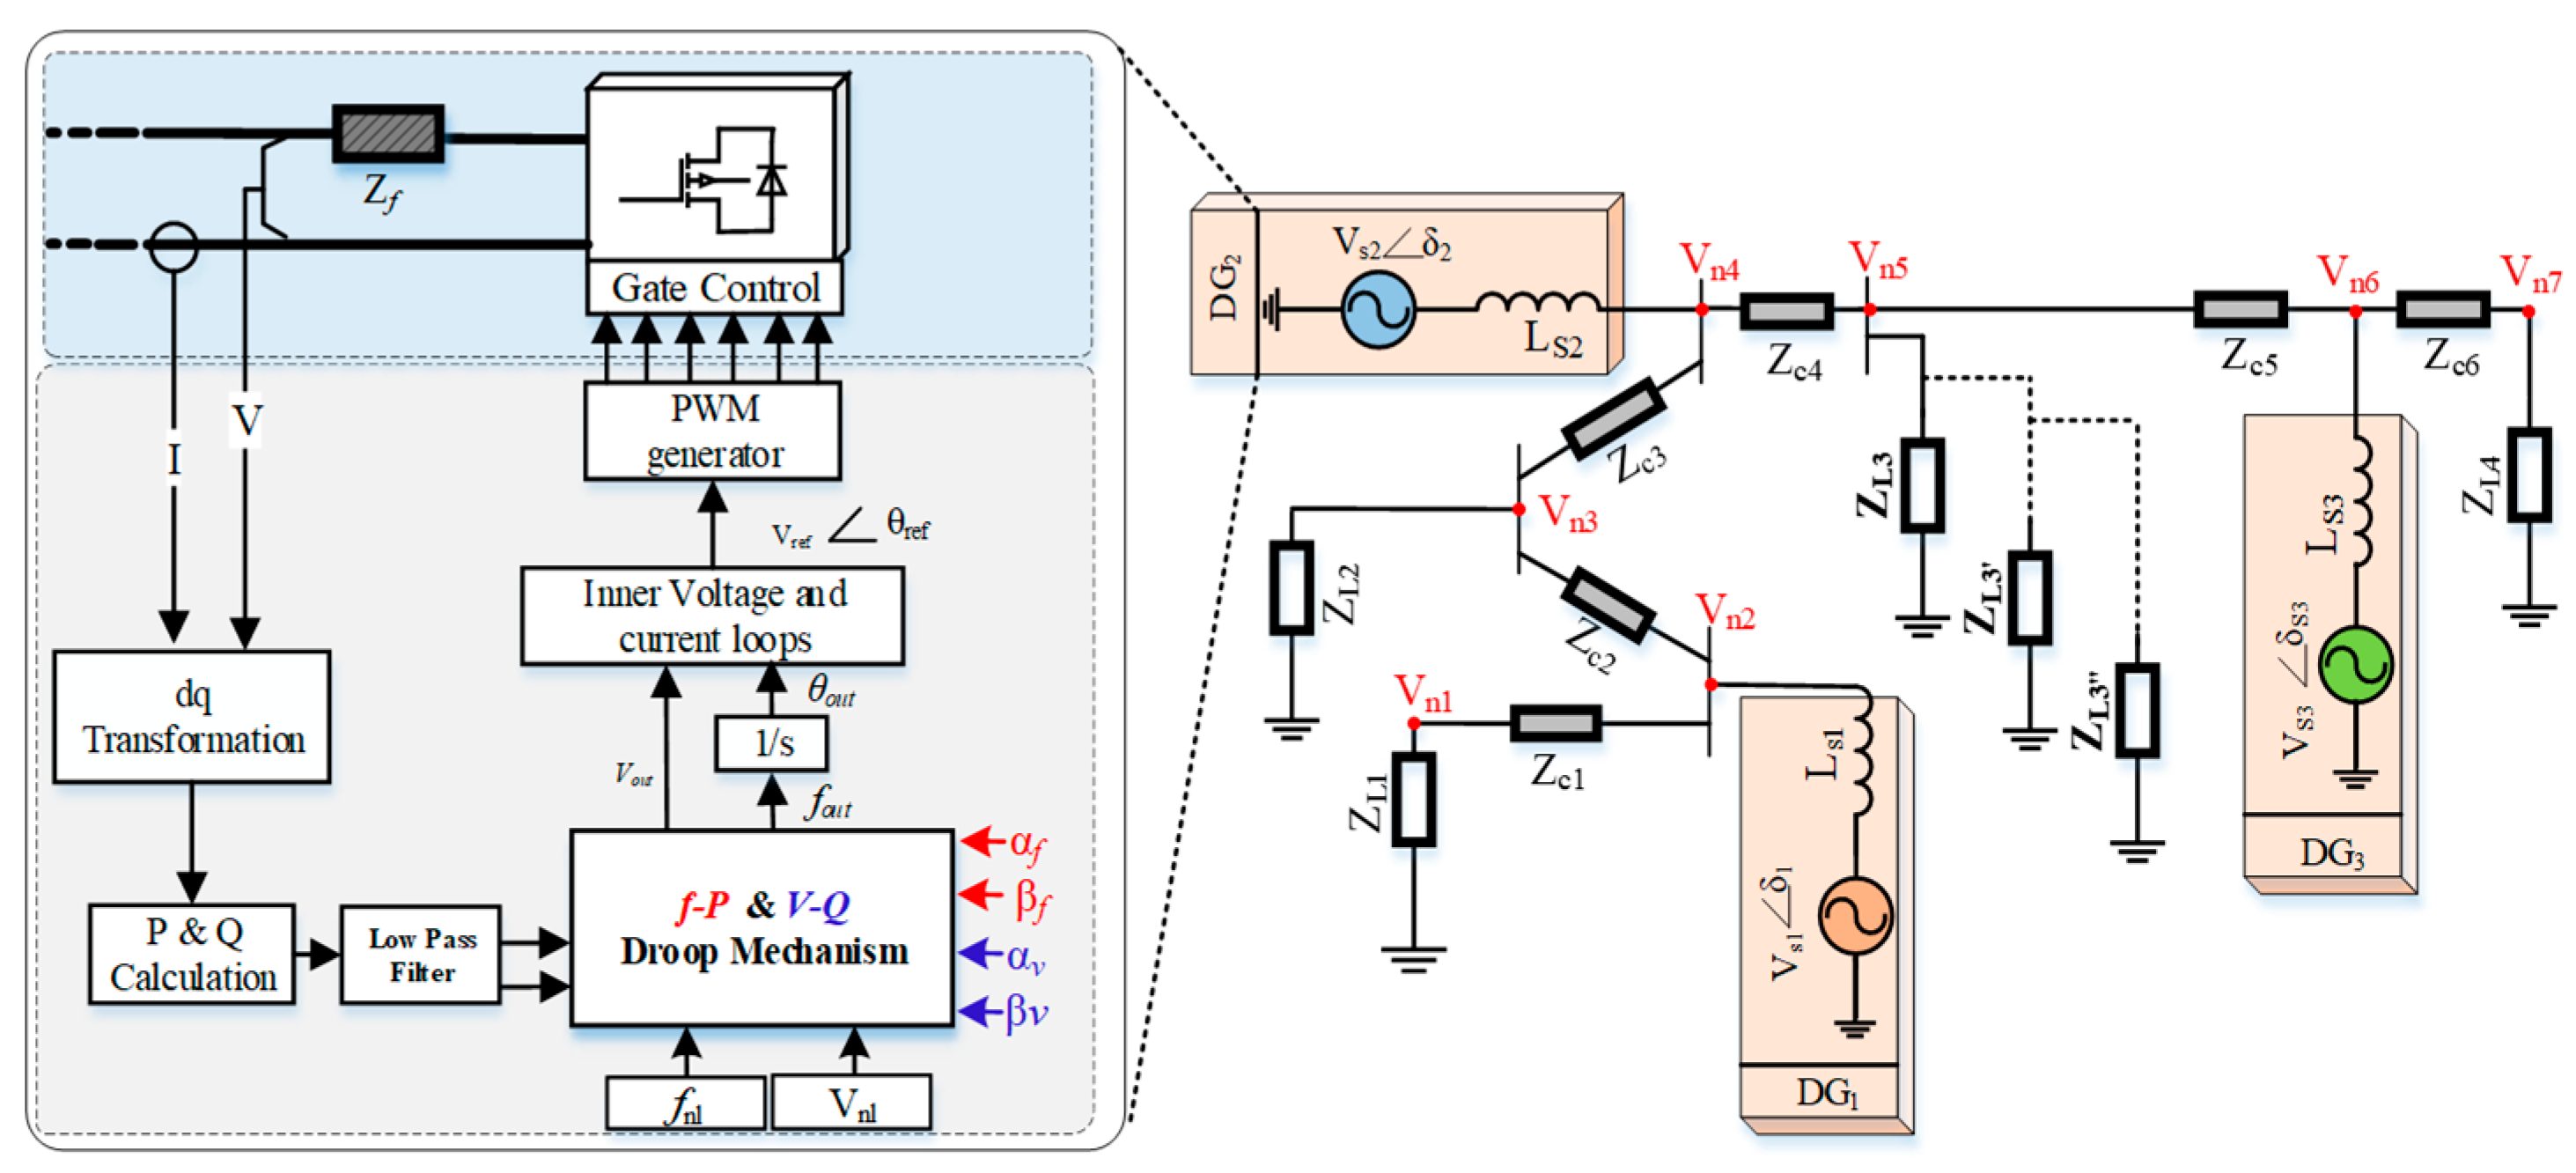
All the equations provided in Section 3 have been coded in MATLAB 2020a environment. A Simulink file has also been invoked in the coded model to obtain the updated initial values of the microgrid’s state variables. The microgrid consists of three DGs, six distribution lines, and four loads distributed between four buses. The microgrid is shown in Figure 7 where the associated parameters are given in Table 2. The state matrix of the linearized system is dynamically updated by having the initial values periodically from the nonlinear model of the system; therefore, the stability is dynamically tracked as previously pictured in Figure 2.
The dynamic simulations are performed to check the stability, considering the following conditions:
  • Changing the load indicates horizontal scanning of the droop characteristic.
  • Changing βf indicates vertical scanning of the droop characteristic at the same loading conditions (see Figure 4).
To evaluate the effect of EDF control on system dynamics, several case studies are carried out. The cases are summarized in Table 3. Moreover, a summary table that describes the cases and their objectives is developed in Appendix B. The variable loading is applied by step-changing the load; ( Z L 3 ,   Z L 3 ,   and   Z L 3 ).
In the first three cases, the microgrid depicted in Figure 7 has been reconfigured based on the capacity of DG2 where a 5.0 kW, 10.0 kW, or 20.0 kW source is considered according to different exponent coefficients ( β f ) .

4.1. Frequency Domain Analysis

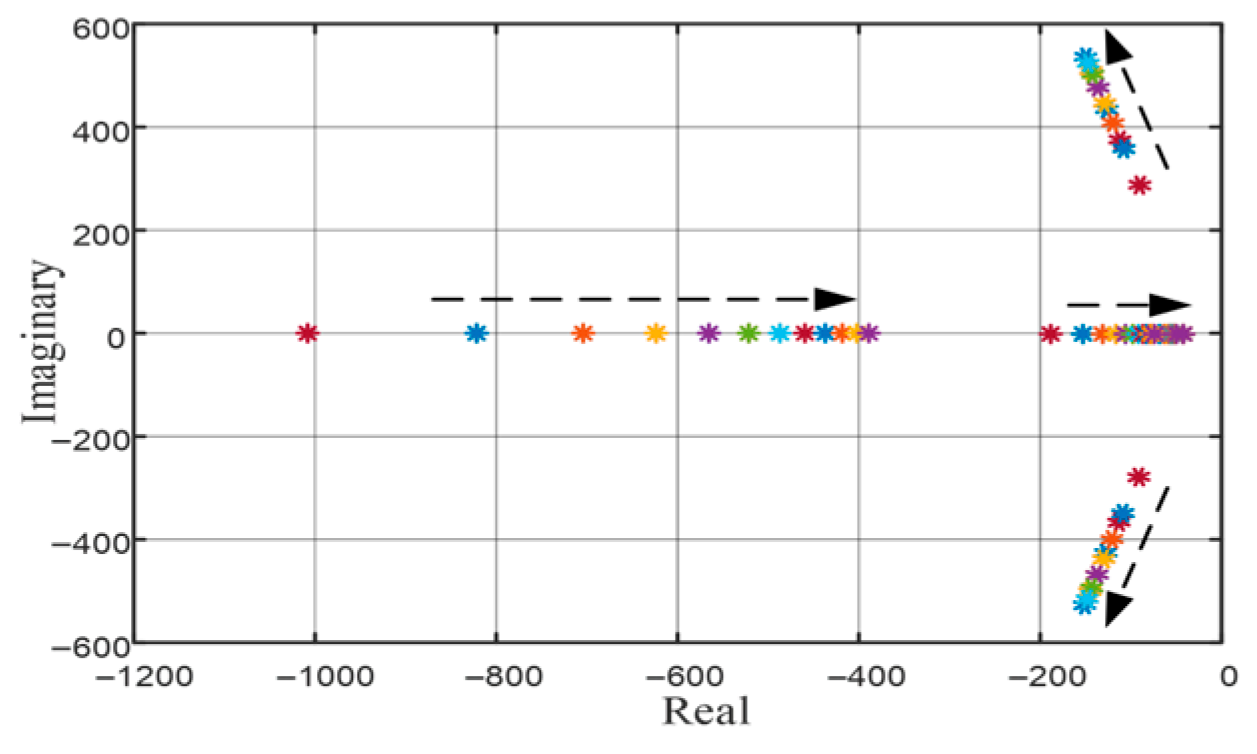
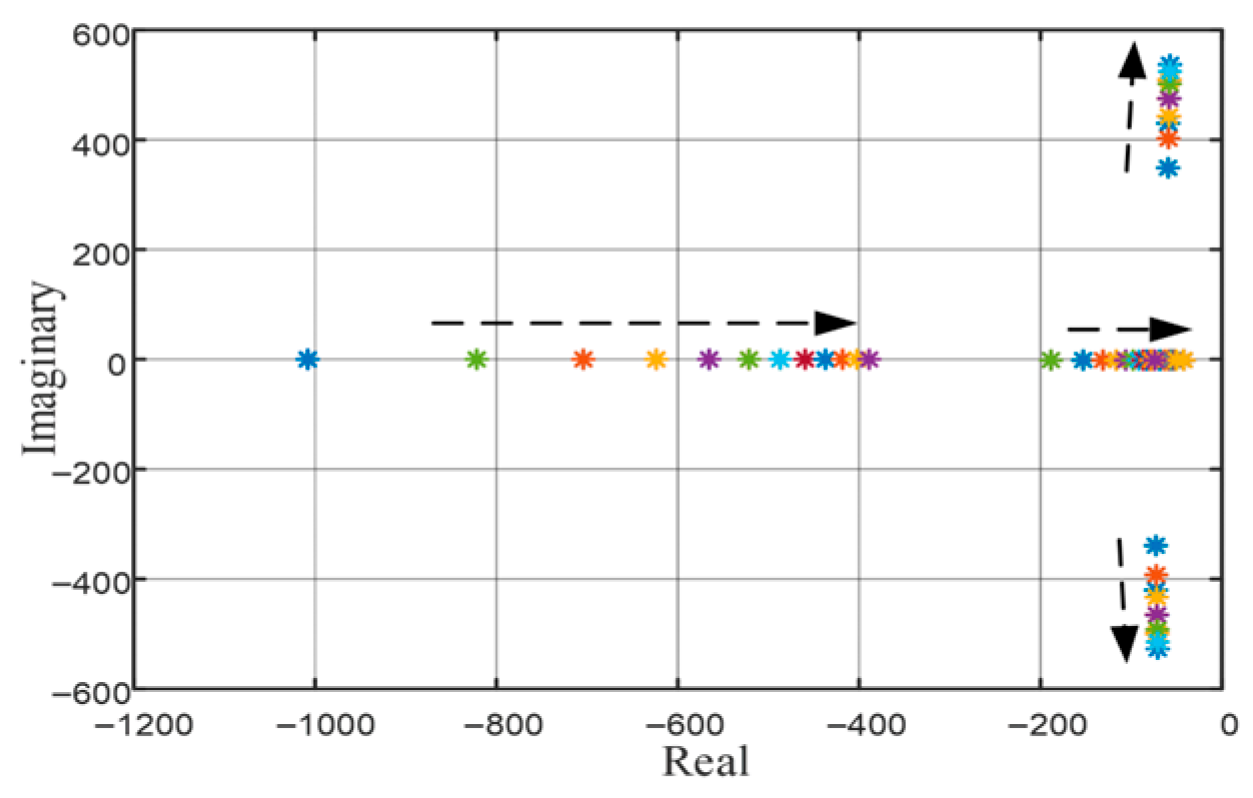
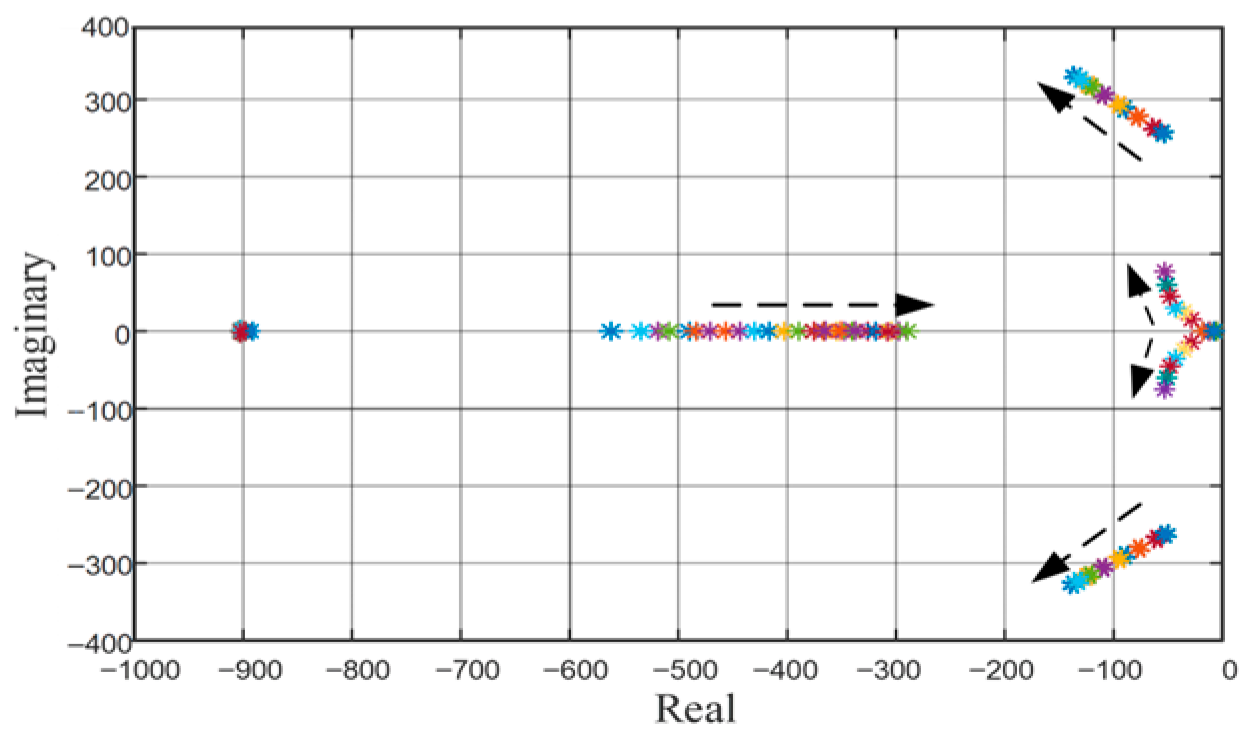
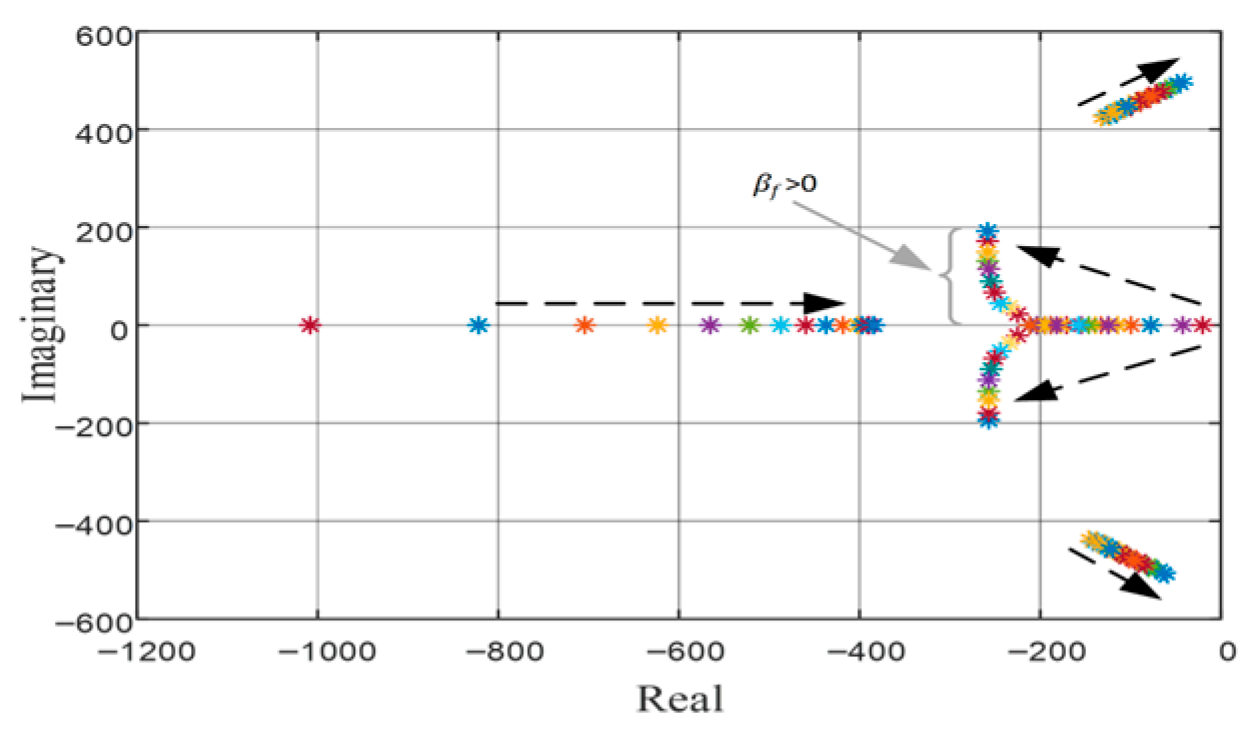
The eigenvalue-based stability analysis results are depicted in Figure 8, Figure 9, Figure 10, Figure 11 and Figure 12. The microgrid is modeled and the state transition matrix of each case is obtained to evaluate the microgrid stability.
Figure 8 shows the results of Case-1 where the load is swept from 2.5 to 25 kW. The eigenvalues show stable operation with the damping of the complex modes increased by increasing the load with the help of DG2 characteristics. The results of Figure 9 and Figure 10 show new tracing patterns according to the control and size of the microgrid in Case-2.
The eigenvalues of the 30 kW microgrid are traced and compared for β f D G 2 = 0.5 (Figure 9) and β f D G 2 = + 0.5 (Figure 10), respectively. The mapping in Figure 9 shows a decreased damping of the dominant complex modes; however, the dynamics become faster where the real modes are shifted more to the right and become more dominant. Overall, the performance is stable as long as the load does not exceed the rated limits. The modes in the range of [−1000: −400] that are dictated by the inner voltage and current loops become more involved, and their interaction increases by increasing the load. However, they are well accommodated, and their dynamics are fast enough to be damped.
In Figure 10, the frequency of oscillation is increased for the complex modes as the load approaches the limits and the characteristic of DG2 achieves a steeper slope. Figure 11 depicts the tracing of Case-3 with a 40 kW microgrid. The mapping shows a stable operation under all loading conditions due to the large size of DG2 which is equipped with EDF control.
In Figure 12, not only is the load increased but also the exponent coefficient; β f is swept from −10 to 10 to capture its impact on system dynamics. It is shown that low frequency modes become faster, and bifurcation of low frequency real modes occurs at high loading conditions and positive β f . This corresponds to a significant increase in characteristic slope.

4.2. Time Domain Analyses

4.2.1. Desirable Dynamic Performance

To test the microgrid under disturbances, variable load, and β f   values are applied in all cases as previously indicated in the flowchart of Figure 2. First, the microgrid runs with a small load and after 1.0 s another load is suddenly added. At t = 1.6 s, a third load is inserted.
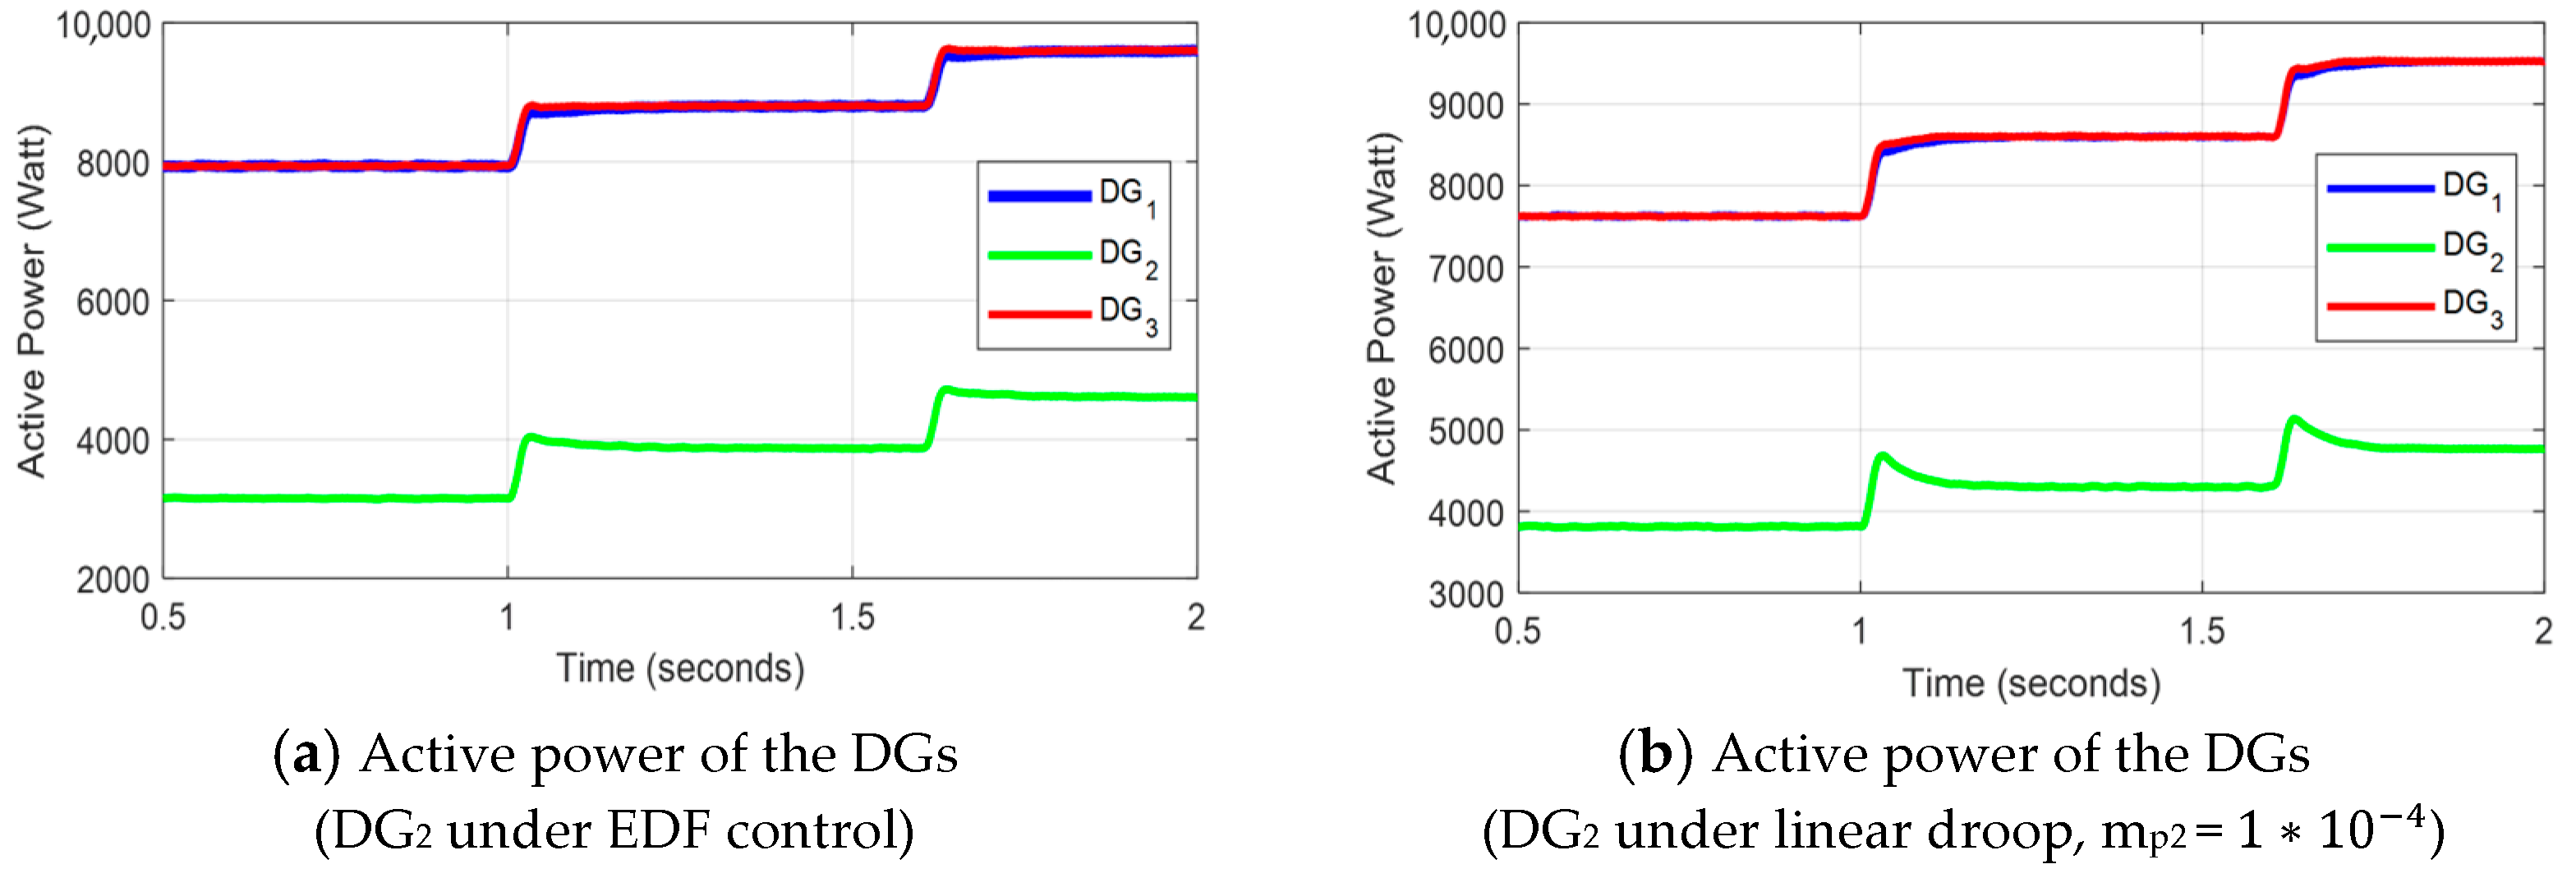
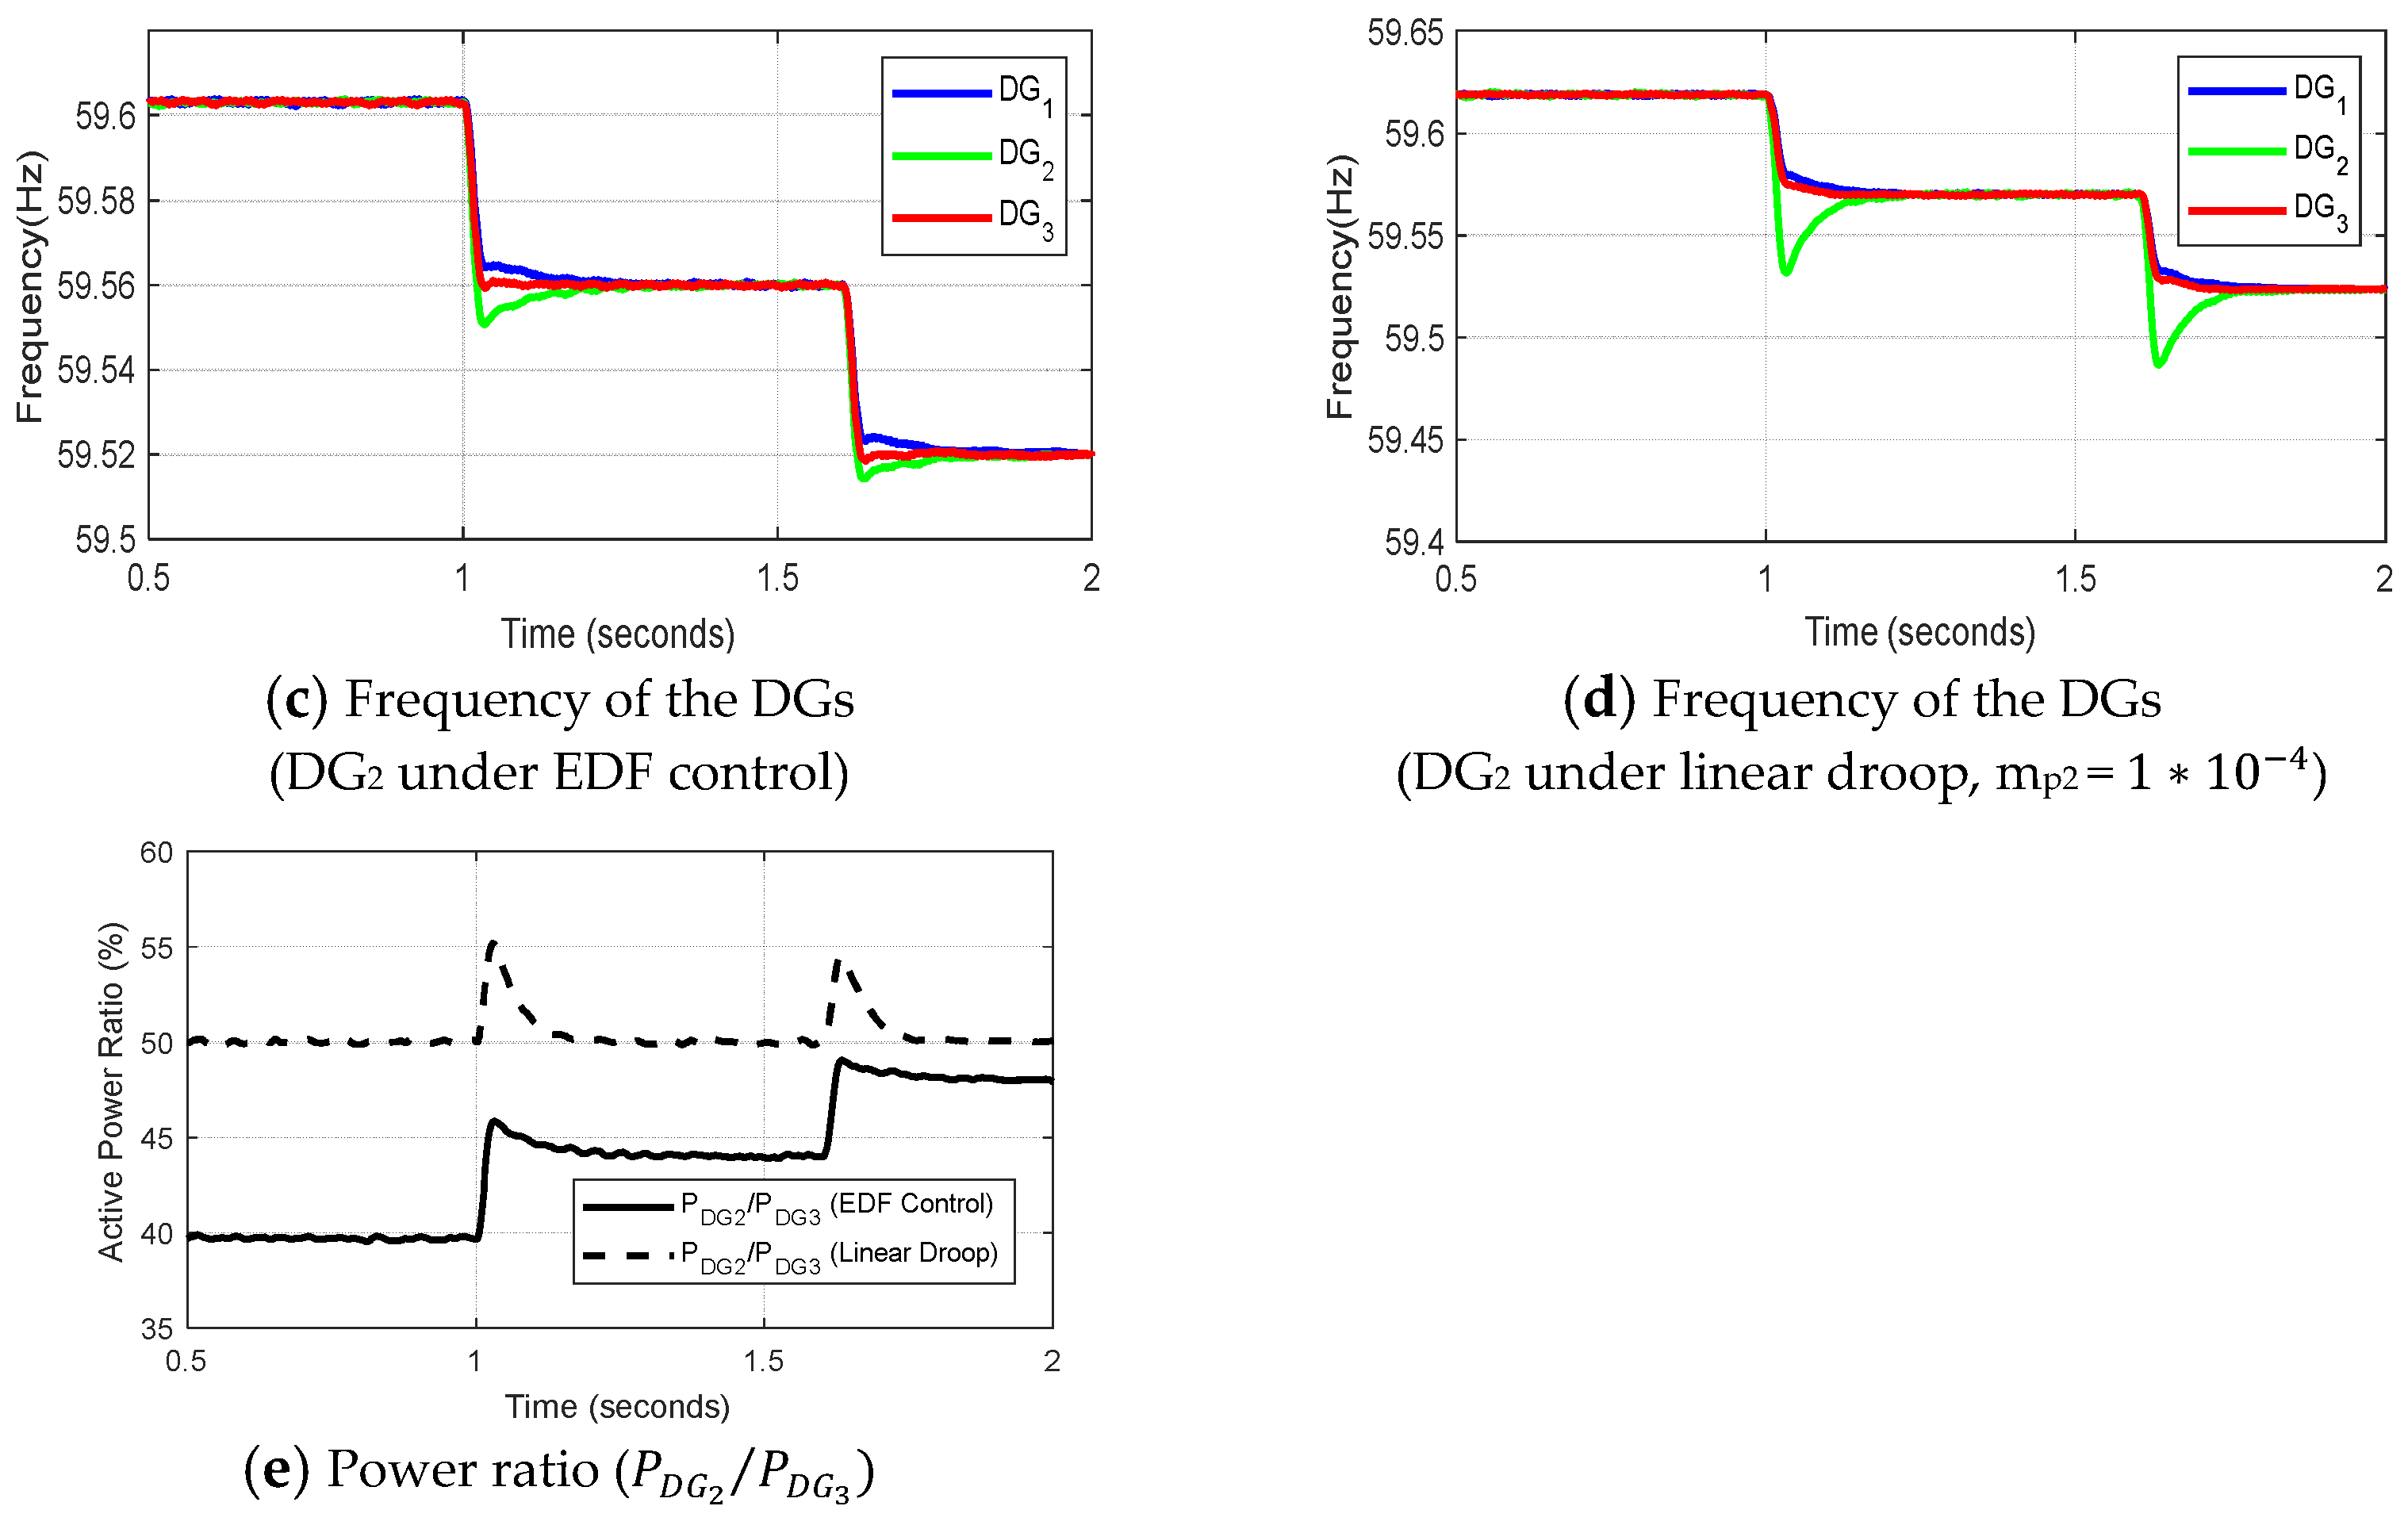
Case-1: In this case, two 10 kW DGs (i.e., DG1 and DG3) are controlled by linear droop and the small 5.0 kW DG2 is EDF-controlled. The results of Case-1 are shown in Figure 13 wherein the power and frequency are obtained to accurately compare and capture the differences under variable loadings. Figure 13a,b compare the active power sharing among the three DGs when the load increases in steps. Figure 13c,d show the frequency measured at the output of each DG. It is clear from Figure 13a–d that the transient power sharing and frequency are well accommodated under EDF control. To quantify the power sharing differences between EDF and the linear droop, Figure 13e compares the power ratio between DG2 and DG3 (DG1 is the same as DG3) when DG2 works under both control strategies. The self-adaptive power sharing of DG2 under EDF control is shown where the power ratio changes from about 40% to 50% with minimal transient power sharing. This would be useful to protect such small DGs from being overstressed under large disturbances.
Case-2: Here, three 10.0 kW DGs are deployed. DG2 is first equipped with β f = 0.5 then with β f = + 0.5 (See Table 3/Case-2). The results are depicted in Figure 14a–e. The figures compare the significant effect of the exponent droop coefficient; β f on shaping the power of DG2 as can be seen from plot (a) and plot (b) wherein the power sharing of DG2 starts with 3.0 kW at low loadings with β f = 0.5 compares to 5.8 kW with β f = + 0.5 . As positive β f allows DG2 to take the lead and shares most of the load compared to the other DGs, the frequency profile exhibits more dynamics. This can be seen by comparing the frequency of Figure 14c,d.
Even though DG2 with β f = + 0.5 shows more power overshoot, its stability is restored in very few cycles. Under variable load, the power ratio between DG2 and the other DGs for both scenarios is depicted in Figure 14e where DG2 shares different watts. The variation in power shared by DG2 under both positive and negative β f can be seen in Figure 14f where the effect of the sign makes DG2 almost duplicate the shared power at the first loading condition. At higher loading conditions, the power shared by each DG starts to reach the rated power, and the maximum power of the DG is about to be touched. Thus, the sharing ratio approaches unity as they have the same ratings. The results obtained in Figure 14 conclude the optimal selection of β f   based on the type of DG2. For example, if DG2 is renewable source running in an islanded microgrid, β f > 0 can be implemented to increase the utilization level without the need to implement any grid-feeding algorithm. Therefore, it works as a GFM unit maximizing the harvested power and stabilizing the microgrid.
Focusing on the power dynamics in Case-2 results, we can observe the following by comparing Figure 14a,b:
i.
Figure 14a—Point (t = 1.0 s, D G 2 β f = 0.5 ): The equivalent droop coefficient at this operating point is small (corresponds to P     0.5 PU on Figure 4). Therefore, there is no power overshoot (critically damped response).
ii.
Figure 14a—Point (t = 1.6 s, D G 2 β f = 0.5 ): The equivalent droop coefficient (the slope of the characteristic) at this operating point is relatively very small (corresponds to P     0.82 PU on Figure 4). Therefore, dynamics shows a slow and overdamped response.
iii.
Figure 14b—Point (t = 1.0 s, D G 2 β f = 0.5 ): The equivalent droop coefficient is high (corresponds to P     0. 8   PU on Figure 4). Therefore, the dynamics of the power signal exhibit significant overshoot, and the response can be approximated to be underdamped.
iv.
Figure 14b—Point (t = 1.6 s, D G 2 β f = 0.5 ): The equivalent droop coefficient (the slope of the characteristic) at this operating point is relatively very small (corresponds to P     1.0 PU on Figure 4). Therefore, the power signal dynamic shows a fast and tangible overshoot.
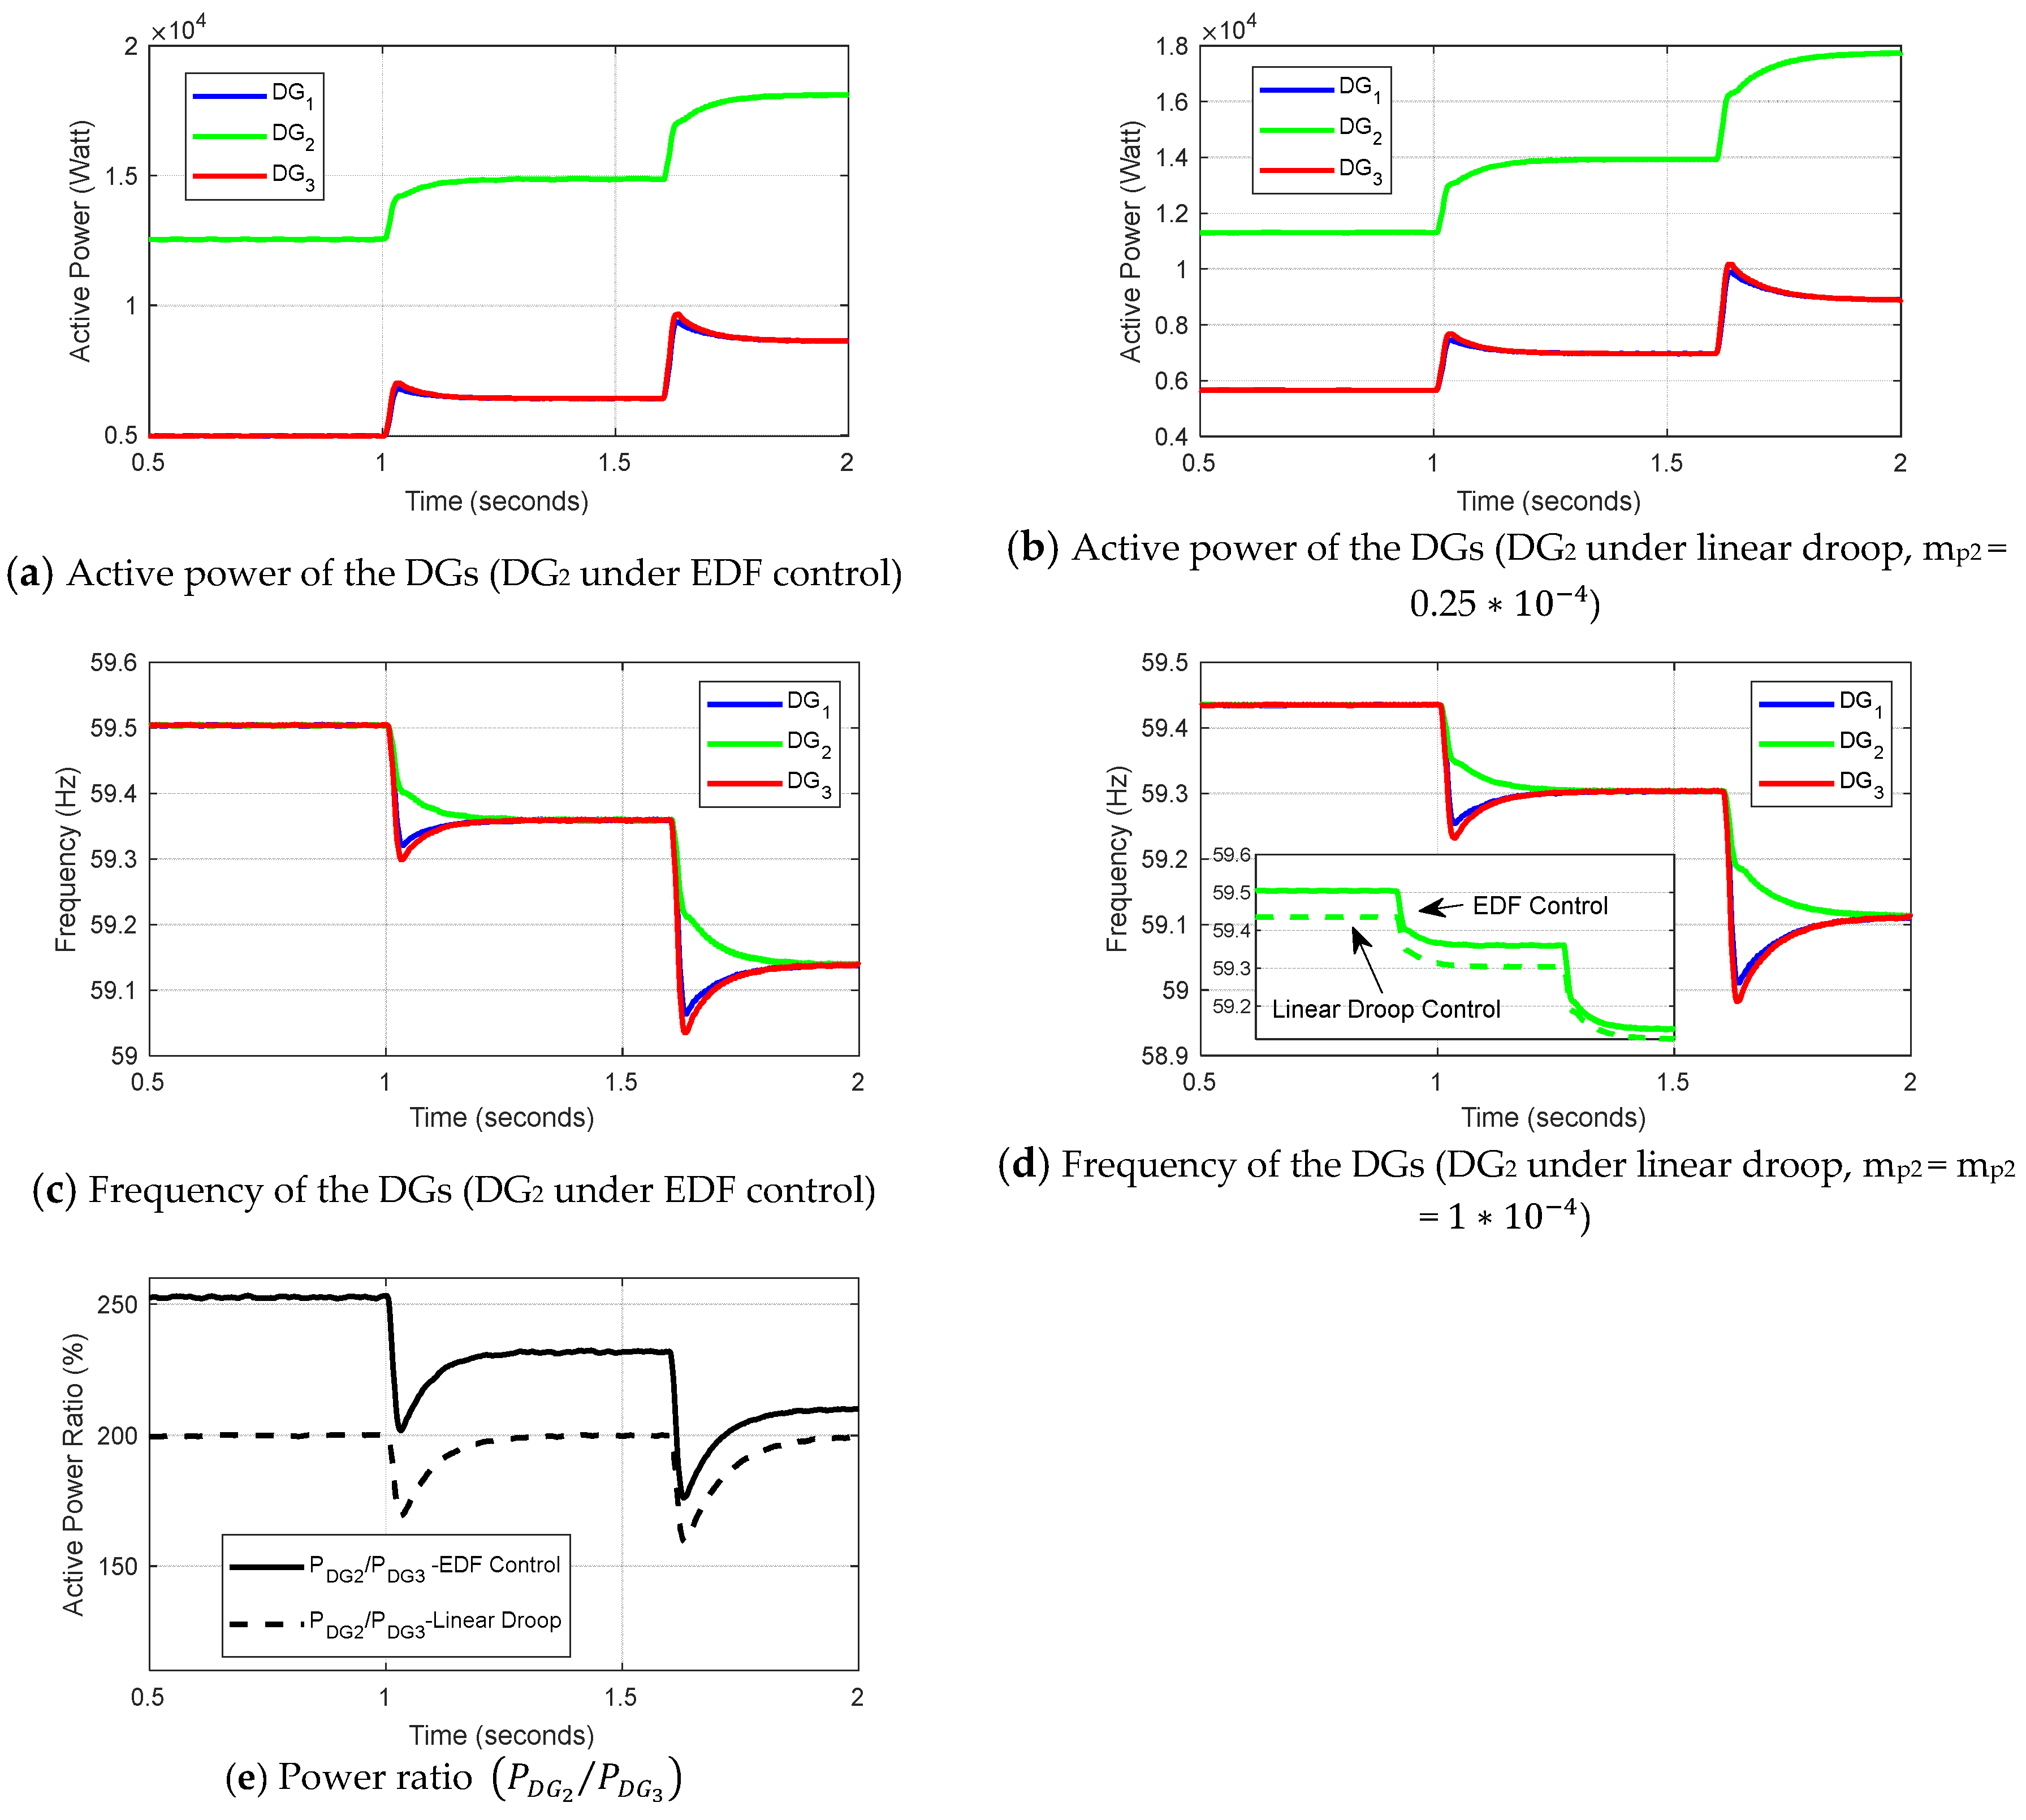
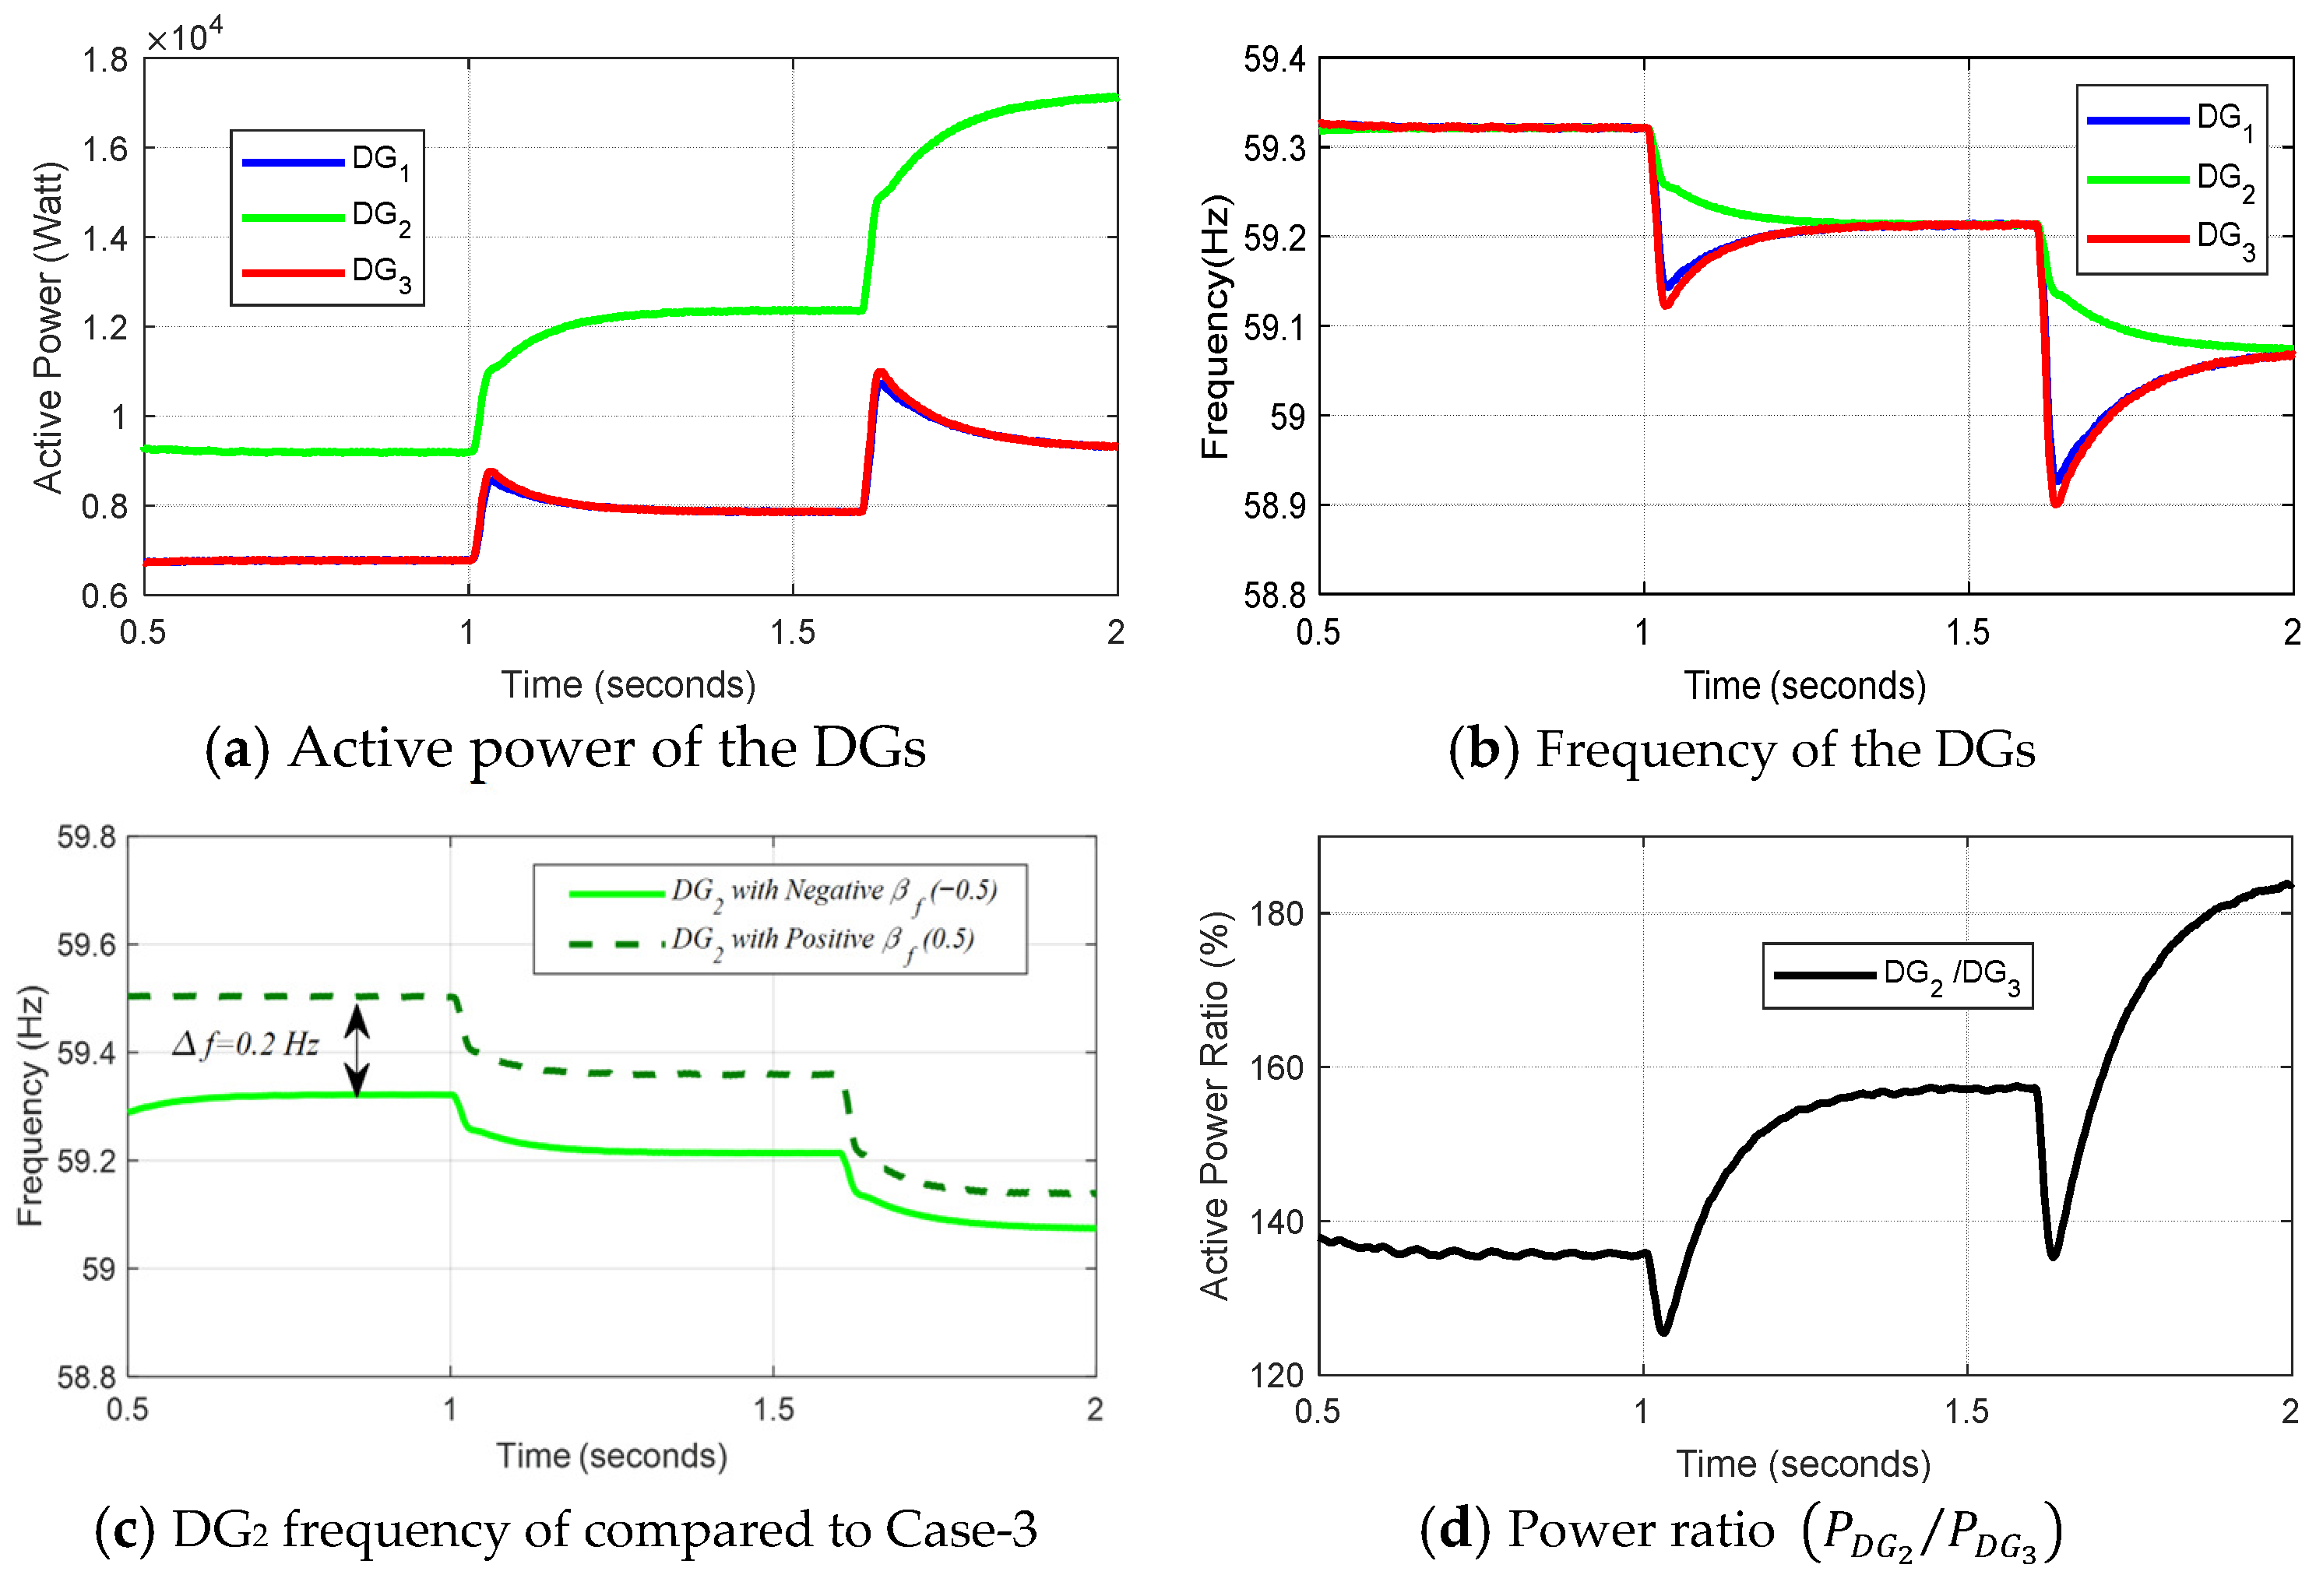
Case-3: In this case, DG2 is the largest DG in the microgrid (See Table 3/Case-3). Therefore, it works with positive β f as a preferred sign for large DG. This case is opposite to Case-1 and it is considered to investigate the stability of EDF control if applied to a large DG. The results of Case-3 are shown in Figure 15 where the power and frequency of the deployed DGs are obtained. Figure 15a,b compare the active power sharing among the DGs. Figure 15c,d show the frequency measured at the output of each DG. The comparison shows that the frequency profiles look similar; however, the frequency degradation f is less under EDF control with higher power sharing. The power ratio between DG2 and the other DGs is depicted in Figure 15e.

4.2.2. Undesirable Dynamic Performance

Two cases are considered to demonstrate the importance of β f sign in to determine system performance. Case-4 is analogous to Case-1 with β f = + 0.5 and Case-5, which is analogous to Case-3 with β f = 0.5 . In microgrid applications, these coefficients are not recommended as they may affect the dynamic performance of the system. The specification of these cases is summarized in Table 3. The details are as follows:
Case-4: To quantify the effect of improper selection of control coefficients, the results shown in Figure 16 are investigated. Figure 16a,b reflect the behavior of 5.0 kW DG2 and two others 10.0 kW DGs. The sharp transient power and frequency deteriorate the performance of DG2. This can easily drive the microgrid into unstable operation. Figure 16c compares the frequency of DG2 considered in Case-1 with Case-4 where the dynamics are replicated due to the improper value of the exponent droop coefficient; β f . The power dynamic is also depicted in Figure 16d, where most of the transient power is shared by DG2. This overloads the power converter and may trigger the overcurrent protection.
Case-5: Here, the power and frequency of 20.0 kW DG2 is integrated with two 10.0 kW DGs are shown in Figure 17a and Figure 17b, respectively. As can be seen that even DG2 shares stabilized dynamic power, it harms the operation of the other DGs. This can be seen that DG1 and DG3 undergo severe transient caused by DG2 control. This is a very important point to mention, as the control of DG2 affects the other DGs. Figure 17c compares the frequency of DG2 considered in Case-3 with Case-5 where the steady state frequency is degraded by 0.2 Hz compared to Case-3. The power dynamic of this case is depicted in Figure 17d where most of the transient power is shared by DG1 and DG3.

5. Dynamic Performance of EDF-Based Microgrid

In order to examine the dynamics of the microgrid when all DGs are equipped with EDF control, Case-6 is investigated. On the other hand, to compare the performance of EDF with other state-of-the-art control strategies, Case-7 is carried out.
Case-6: Three DGs of different sizes are considered here to examine their dynamics under EDF control. The characteristics and the coefficients of the DGs are given in Table 3/Case-6, where the optimal sign of β f in each DG is determined based on DG2 performance in the previous cases.
The outcomes depicted in Figure 18a,b offer a comprehensive description of the findings. These figures illustrate the active power and frequency profiles of each DG under EDF control (solid lines), contrasted with the corresponding linear droop control (dashed lines). The analysis of these results clearly indicates a degree of variation in power distribution among the deployed DGs. Conversely, the frequency exhibits a more stable and smoother transient response under EDF control, characterized by reduced overshoot and a shorter settling time.
Based on the insights derived from these results, it can be inferred that the proposed control strategy is well-suited for implementation in a microgrid that includes different sources of types and sizes.
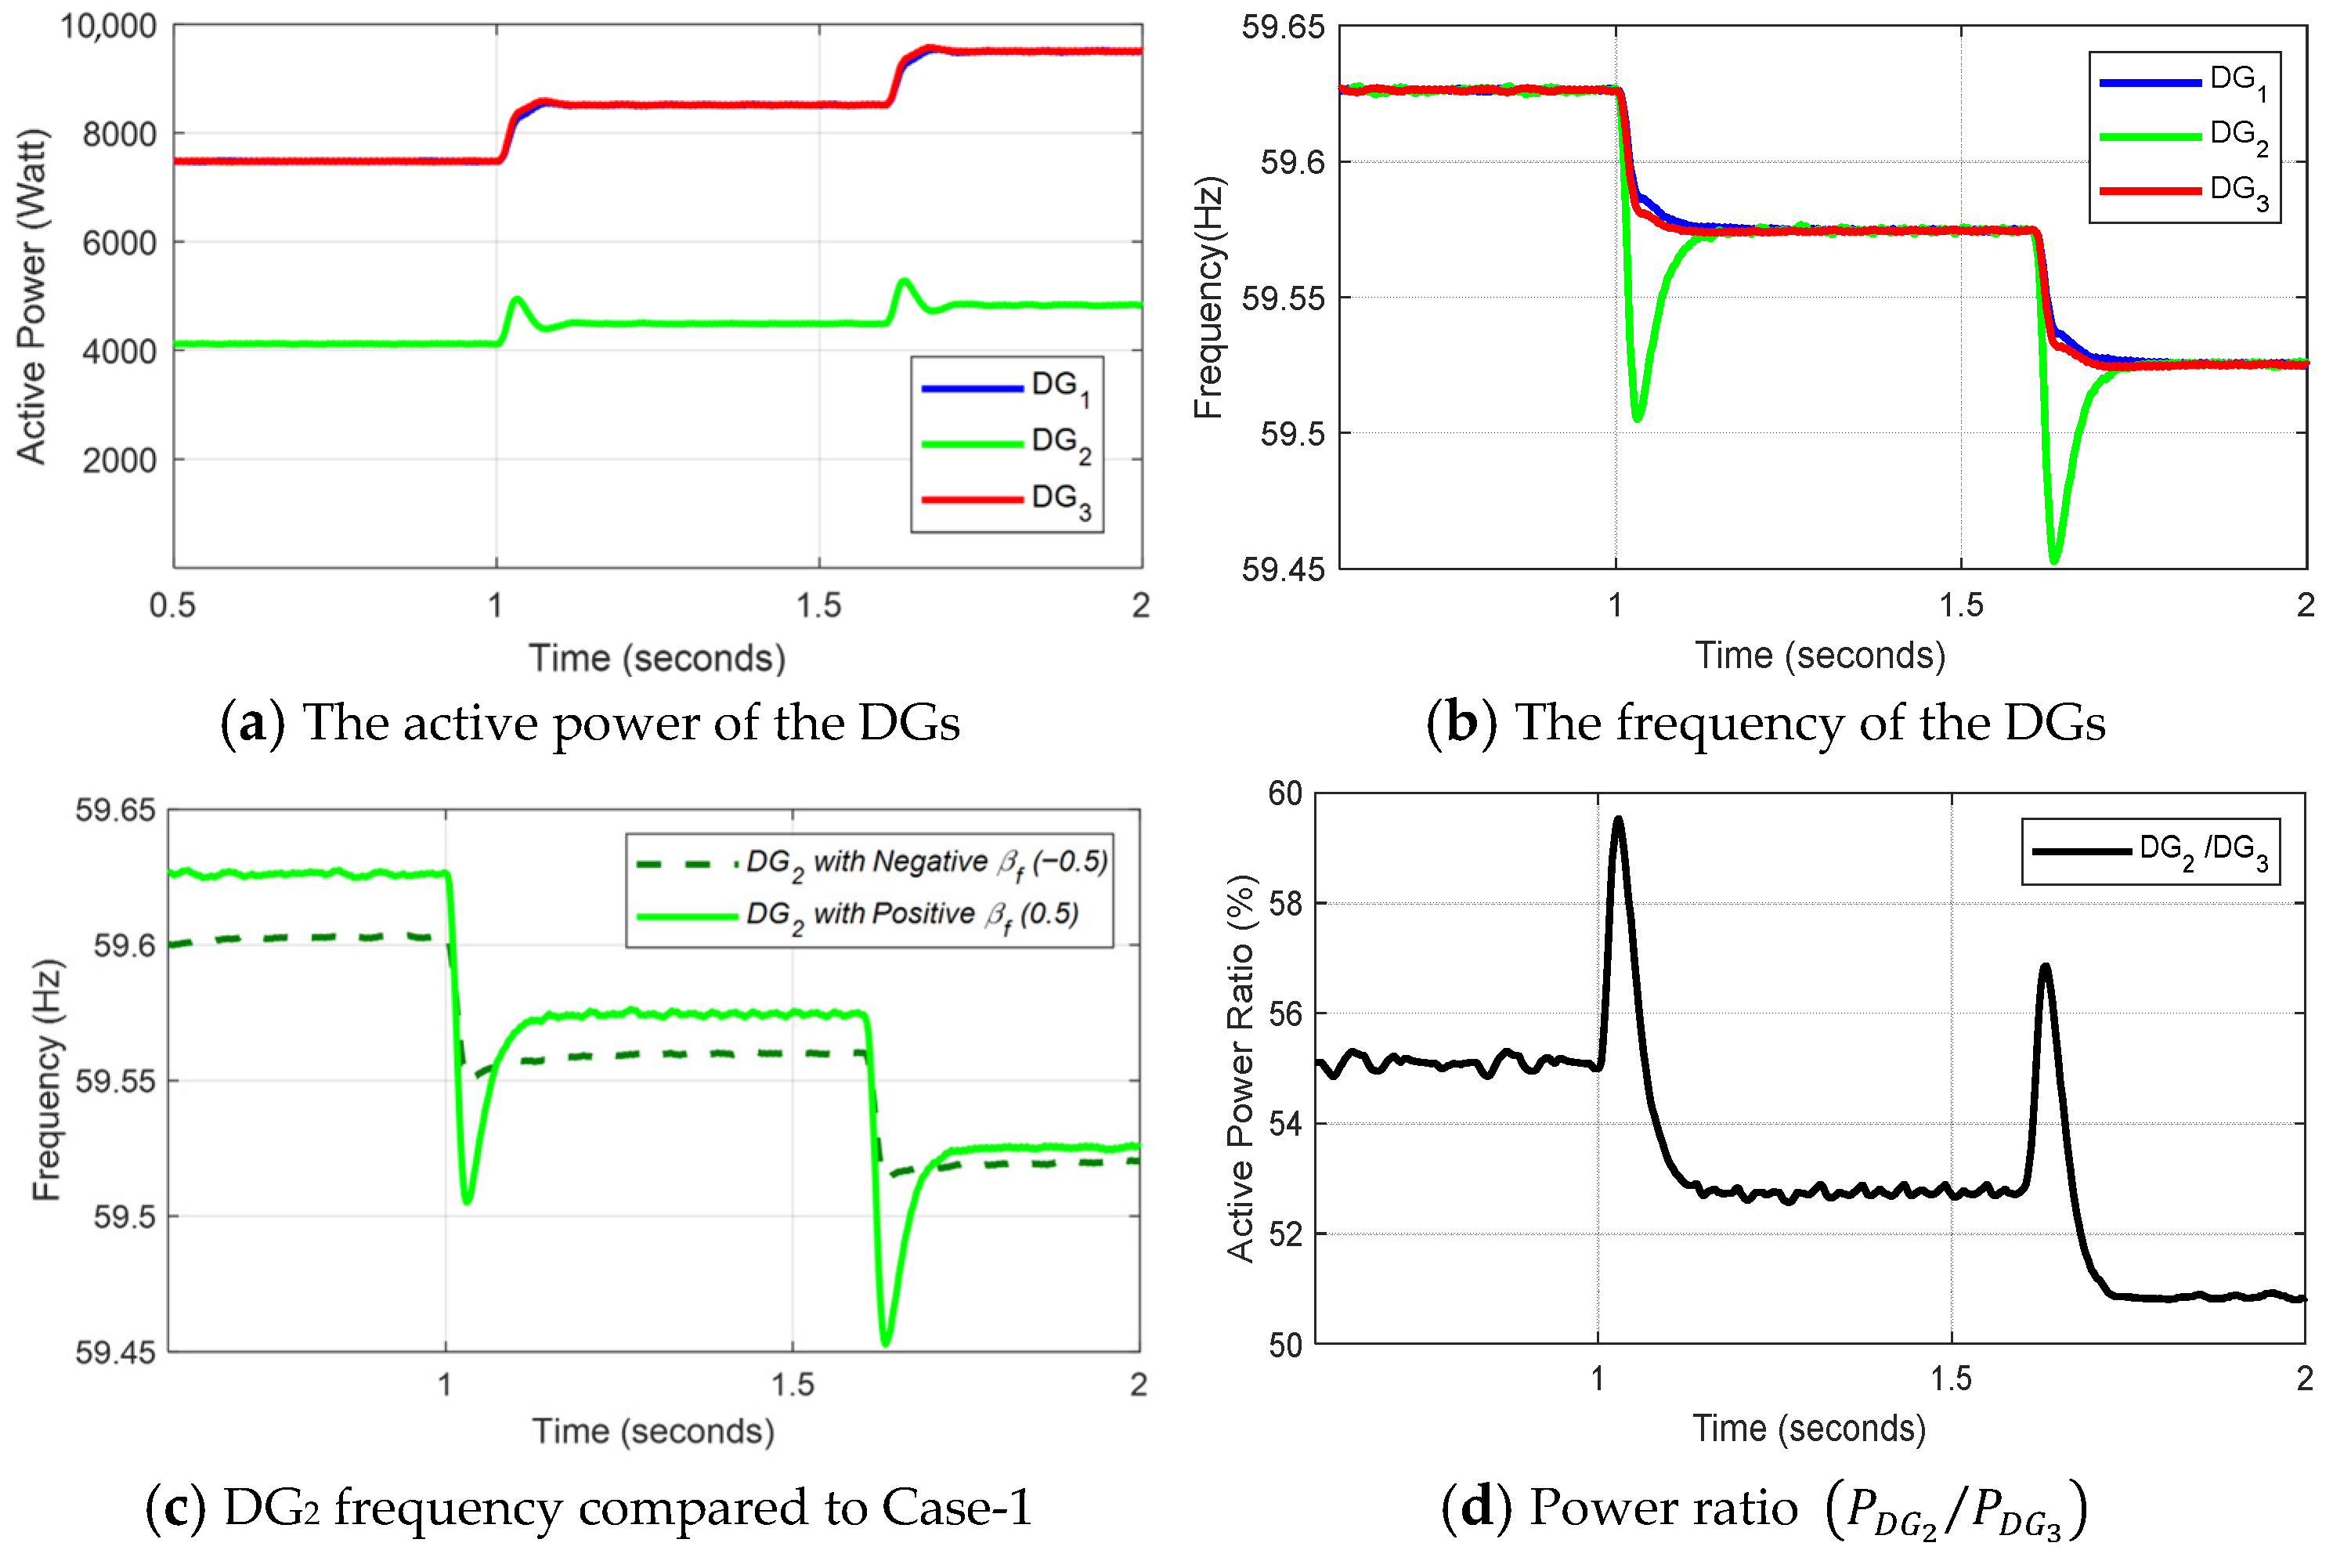
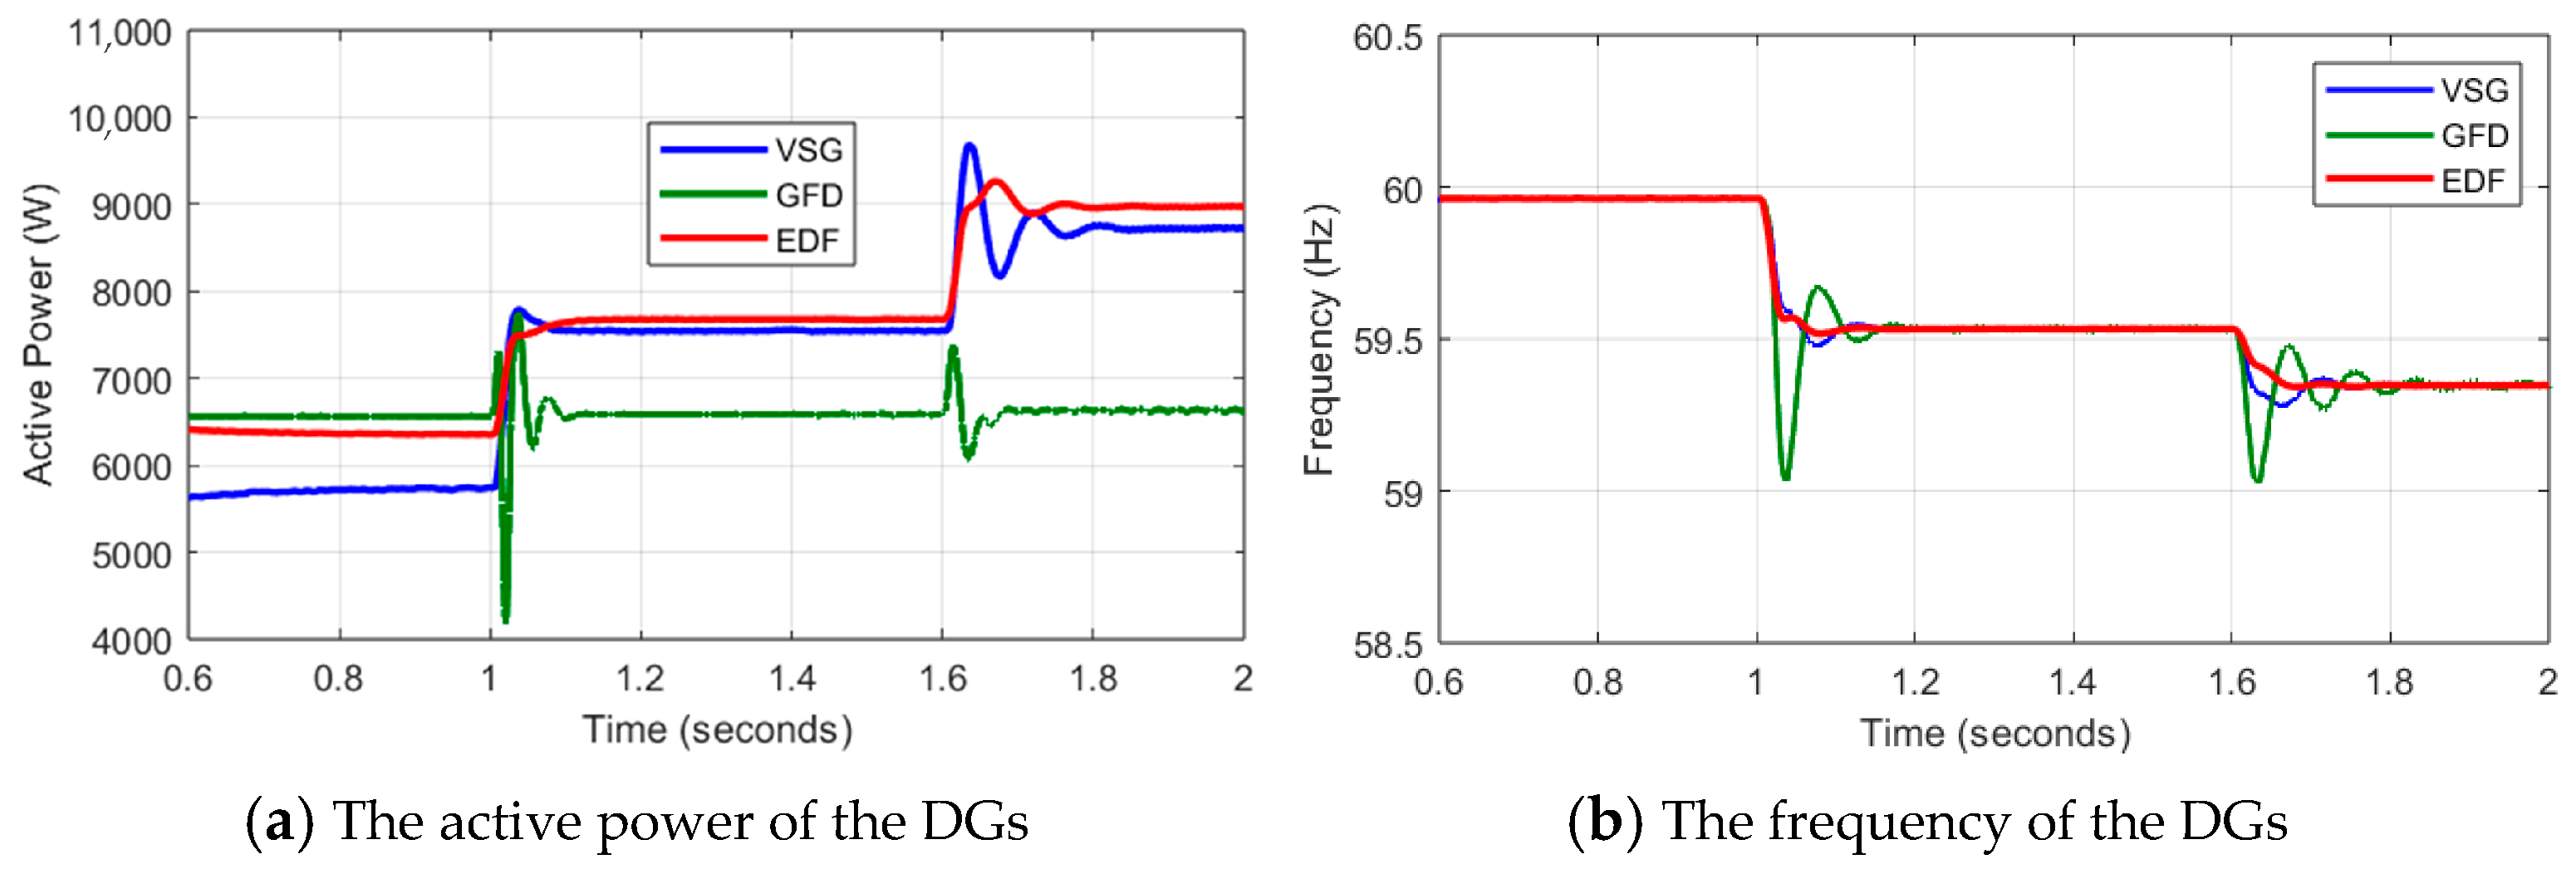
Case-7: To verify the suitability of EDF in the presence of other control strategies, three different types of DGs are integrated into a microgrid. A VSG, which has been built based on the model in [15] with an inertia constant (H = 5 s), an MPPT-controlled DG that works as a grid feeding (GFD) DG, and an EDF-controlled DG are integrated into a microgrid. The power and frequency are given in Figure 19a and Figure 19b, respectively. The coefficients of EDF-controlled DG are: α f = 0.5 10 4 ,   β f = 0.5 . The results show significant power and frequency oscillations in the GFD DG power signal at the instants of load increase due to the PLL loop and fast dynamics associated with this type of controller. The EDF shows a stabilized dynamic performance, where the VSG shows some oscillation according to its equivalent swing equation.

6. Discussion

It is important to note that linear and nonlinear power sharing can be achieved under EDF control by only tuning β f coefficient. The achieved flexible power sharing is a key feature of EDF control where a high degree of loadability can be ensured. The resultant nonlinear droop characteristics can be utilized to optimize power-sharing and reduce power loss for cost-effective system operation, compensate for the mismatch in the transmission line impedances, and prioritize the power shared by renewable sources. All these functionalities can be achieved according to the application, source type, and operational objectives. EDF control can also be used in DC microgrids for better voltage regulation and load sharing.
This paper provides a generalized approach for implementing EDF and to prove its advanced capability. Therefore, future research will be conducted to investigate the effectiveness of EDF control in fulfilling the requirements of specific applications and design objectives.

7. Conclusions and Future Work

This research investigates and evaluates microgrid stability and performance with the implementation of the novel EDF control. The investigation encompassed (i) dynamic small signal analysis, (ii) frequency domain examination, and (iii) time domain simulations. The findings are summarized as follows:
-
The proposed droop control exhibits distinctive advantages, including its simplicity in construction, minimal coefficient requirements, variable adaptability, and ease of implementation, making it a viable alternative to conventional droop control for inverterbased DGs.
-
The pivotal role of the coefficient β f in influencing DG dynamics was confirmed through case studies. This coefficient can be tuned to shape the dynamics according to the design requirements.
-
Small DGs demonstrate stability and reliable performance across a wide operating range when working under negative β f values.
-
On the other side, larger DGs with positive β f values lead and maximize the power sharing in microgrids.
-
During disturbances, large fully loaded DGs exhibited fast response capabilities, effectively protecting smaller DGs from transient overloads.
While the investigations primarily focus on a limited range of β f , it is worth noting that this approach can be extended to a broader range to accommodate varying power-sharing requirements in different applications.
Future work will focus on extending the evaluation of the proposed EDF control to include investigations under fault, unbalanced conditions, and harmonic distortion scenarios.

Funding

This research received no external funding.

Data Availability Statement

The original contributions presented in this study are included in the article. Further inquiries can be directed to the corresponding author(s).

Conflicts of Interest

The author declare no conflict of interest.

Appendix A. The Implication of EDF Control in Realizing the State Matrix of the DG

It is known from the frequency droop equation that the angle equation is:
δ i = 2 π f n l γ p i P i d t
where δ i is the phase of ith source with respect to the 1st source that is taken as a reference (i.e., δ r e f = δ 1 ) . The derivative can be written as
δ i = 2 π ( f n l γ p i P i )
Referring (A2) to the reference phase, (A2) can be rewritten as
δ i δ i δ 1 = 2 π f n l γ p i P i f n l γ p 1 P 1 = 2 π ( γ p 1 P 1 γ p i P i )
The voltage of each droop-controlled source will have the same expression as
V o u t i = V n l γ q i Q i
The expression in (A3) and (A4) are nonlinear. Using Tayler series expansion (TSE) to perform small-signal linearization around the equilibrium point, where the filtered active and reactive power are ( P i f , 0 , Q i f , 0 ) , can be formulated as:
δ i ~ ˙ = 2 π γ p 1 P 1 P 1 f , 0 p ~ 1 f γ p i P i P i f , 0 p ~ i f
V ~ o u t i = γ p 1 P 1 P 1 f , 0 q i ~
The cutoff frequency of the LPF used to filter the power signals in the droop control is incorporated in the modeling as shown in Section 5. This can be used to derive the state equation of the power signals as
P i f = ω c ( P i P i f )
Q i f = ω c ( Q i Q i f )
Linearizing (A7) and (A8) about the equilibrium points; ( P i , 0 , Q i , 0 ) , we obtain
p i , f ~ ˙ = ω c P i ~ P ~ i , f
q i , f ~ ˙ = ω c Q i ~ Q ~ i , f
In state space form, the equations can be written as
x ~ ˙ = A d X ~ + B d u ~ = A d P ~ 1 , f   Q ~ 1 , f   0 P ~ i , f   Q ~ i , f   δ ~ i T + B d P ~ 1   Q ~ 1 P ~ i   Q ~ i T
The unknowns in (A11) can be determined using LFA software (Matlab 2020a). NR-method can be used to solve such nonlinear algebraic systems after putting it in the typical form of the nonlinear equation (i.e., f x = f i ( x 1 , x 2 , x n ) i = 1, 2…). This can be typically applied in conventional power system studies. The partial derivative is then applied following TSE to linearize the system. The resultant system can be expressed in the following form.
f x U 0 X ~ + f u X 0 u ~ = 0
As some of the inputs are functions of some states, these inputs can be embedded inside matrix “A”. Therefore, we need to substitute (A12) into (A11) which yields the expression in (A13) that is used in the modeling.
x ~ ˙ = A d X ~ B d f u 1 f x X ~ = [ A D G ] [ X ~ ]

Appendix B. A Summary of the Carried-Out Cases

Table A1. A descriptive summary of the carried out cases.
Case #Case Description and Objective
Case-1To investigate the impact of the negative droop coefficient ( β f ) on a small DG size
Case-2To investigate the impact of positive and negative droop coefficient ( β f ) on a DG that works with other similar-sized DGs
Case-3To investigate the impact of positive droop coefficient ( β f ) on a large DG size
Case-4
(opposite to Case-1)
To investigate the impact of positive droop coefficient ( β f ) on a small DG size
Case-5
(opposite to Case-3)
To investigate the impact of the negative droop coefficient ( β f ) on a large DG size
Case-6To demonstrate the impact of all EDF-controlled microgrid on power sharing, dynamics, and stability
Case-7To demonstrate the superiority of EDF as an advanced GFM control works against state-of-the-art control strategies

References

  1. Antunes, H.M.A.; Piero, R.R.D.; Silva, S.M. Application of Repetitive Control to Grid-Forming Converters in Centralized AC Microgrids. Energies 2025, 18, 3427. [Google Scholar] [CrossRef]
  2. Rios, M.A.; Pérez-Londoño, S.; Garcés, A. Dynamic Performance Evaluation of the Secondary Control in Islanded Microgrids Considering Frequency-Dependent Load Models. Energies 2022, 15, 3976. [Google Scholar] [CrossRef]
  3. Liu, C.; Li, B.; Zhang, Y.; Jiang, Q.; Liu, T. The LCC Type DC Grids Forming Method and Fault Ride-Through Strategy Based on Fault Current Limiters. Int. J. Electr. Power Energy Syst. 2025, 170, 110843. [Google Scholar] [CrossRef]
  4. Harasis, S. Controllable transient power sharing of inverter-based droop controlled microgrid. Int. J. Electr. Power Energy Syst. 2024, 155, 109565. [Google Scholar] [CrossRef]
  5. Bragin, M.A.; Yan, B.; Kumar, A.; Yu, N.; Zhang, P. Efficient Operations of Micro-Grids with Meshed Topology and Under Uncertainty through Exact Satisfaction of AC-PF, Droop Control and Tap-Changer Constraints. Energies 2022, 15, 3662. [Google Scholar] [CrossRef]
  6. Harasis, S. Development of a droop control strategy for flexible operation of distributed generators. Jordan J. Electr. Eng. 2022, 8, 179–194. [Google Scholar] [CrossRef]
  7. Huang, X.; Chen, D.; Xu, L. Microgrid design using folded P-f droop and new grid interface unit to minimize the need for communication. Int. J. Electr. Power Energy Syst. 2021, 130, 106949. [Google Scholar] [CrossRef]
  8. Beza, M.; Bongiorno, M. Impact of converter control strategy on low- and high-frequency resonance interactions in power electronic dominated systems. Int. J. Electr. Power Energy Syst. 2020, 120, 105978. [Google Scholar] [CrossRef]
  9. Tavakoli, S.; Araujo, E.; Sanchez, E.; Bellmunt, O. Interaction assessment and stability analysis of the MMC-based VSC-HVDC link. Energies 2020, 13, 2075. [Google Scholar] [CrossRef]
  10. Kabalan, M.; Singh, P.; Niebur, D. Large signal Lyapunov-based stability studies in microgrids: A review. IEEE Trans. Smart Grid 2017, 8, 2287–2295. [Google Scholar] [CrossRef]
  11. Agundis-Tinajero, G.D.; Vasquez, J.C.; Guerrero, J.M. Stability Boundary Analysis of Islanded Droop-Based Microgrids Using an Autonomous Shooting Method. Energies 2022, 15, 2120. [Google Scholar] [CrossRef]
  12. Khanabdal, S.; Banejad, M.; Blaabjerg, F.; Hosseinzadeh, N. A Novel Power Sharing Strategy Based on Virtual Flux Droop and Model Predictive Control for Islanded Low-Voltage AC Microgrids. Energies 2021, 14, 4893. [Google Scholar] [CrossRef]
  13. Dehkordi, N.M.; Sadati, N.; Hamzeh, M. Robust tuning of transient droop gains based on Kharitonov’s stability theorem in droop-controlled microgrids. IET Gener. Transm. Distrib. 2018, 12, 3495–3501. [Google Scholar] [CrossRef]
  14. Zhong, Q.; Zeng, Y. Universal droop control of inverters with different types of output impedance. IEEE Access 2016, 4, 702–712. [Google Scholar] [CrossRef]
  15. Ebrahimi, H.; Yazdaninejadi, A.; Golshannavaz, S. Transient stability enhancement in multiple-microgrid networks by cloud energy storage system alongside considering protection system limitations. IET Gener. Transm. Distrib. 2023, 17, 1816–1826. [Google Scholar] [CrossRef]
  16. Shi, Z.; Li, J.; Nurdin, H.I.; Fletcher, J.E. Transient response comparison of virtual oscillator controlled and droop controlled three-phase inverters under load changes. IET Gener. Transm. Distrib. 2020, 14, 1138–1147. [Google Scholar] [CrossRef]
  17. Cingoz, F.; Elrayyah, A.; Sozer, Y. Plug-and-play nonlinear droop construction scheme to optimize islanded microgrid operations. IEEE Trans. Power Electron. 2017, 32, 2743–2756. [Google Scholar] [CrossRef]
  18. Ouederni, R.; Davidson, I.E. Co-Optimized Design of Islanded Hybrid Microgrids Using Synergistic AI Techniques: A Case Study for Remote Electrification. Energies 2025, 18, 3456. [Google Scholar] [CrossRef]
  19. Yang, M.; Wang, C.; Han, Y.; Xiong, J.; Yang, P. Small-signal stability analysis of the standalone single-phase parallel inverter with BPF-based droop control scheme. In Proceedings of the IEEE 4th Southern Power Electronics Conference, Singapore, 10–13 December 2018. [Google Scholar]
  20. Long, B.; Li, X.; Rodriguez, J.; Guerrero, J.M.; Chong, K.T. Frequency stability enhancement of an islanded microgrid: A fractional-order virtual synchronous generator. Int. J. Electr. Power Energy Syst. 2023, 147, 108896. [Google Scholar] [CrossRef]
  21. Eskandari, M.; Savkin, A.V. A critical aspect of dynamic stability in autonomous microgrids: Interaction of droop controllers through the power network. IEEE Trans. Ind. Inform. 2022, 18, 5. [Google Scholar] [CrossRef]
  22. Dheer, D.K.; Vijay, A.S.; Kulkarni, O.V.; Doolla, S. Improvement of stability margin of droop-based islanded microgrids by cascading of lead compensators. IEEE Trans. Ind. Appl. 2019, 55, 3241–3251. [Google Scholar] [CrossRef]
  23. Mestriner, D.; Labella, A.; Brignone, M.; Bonfiglio, A.; Procopio, R. A transient stability approach for the analysis of droop-controlled islanded microgrids. Electr. Power Syst. Res. 2020, 187, 106509. [Google Scholar] [CrossRef]
  24. Wang, R.; Sun, Q.; Gui, Y.; Ma, D. Exponential-function-based droop control for islanded microgrids. J. Mod. Power Syst. Clean Energy 2019, 7, 899–912. [Google Scholar] [CrossRef]
  25. Rowe, C.N.; Summers, T.J.; Betz, R.E.; Cornforth, D.J.; Moore, T.G. Arctan power–frequency droop for improved microgrid stability. IEEE Trans. Power Electron. 2013, 28, 8. [Google Scholar] [CrossRef]
  26. Khan, M.Z.; Ahmed, E.M.; Habib, S.; Ali, Z.M. Multiobjective optimization technique for droop controlled distributed generators in AC islanded microgrid. Electr. Power Syst. Res. 2022, 213, 108671. [Google Scholar] [CrossRef]
  27. Nutkani, U.; Loh, P.C.; Blaabjerg, F. Droop scheme with consideration of operating costs. IEEE Trans. Power Electron. 2014, 29, 1047–1052. [Google Scholar] [CrossRef]
  28. Li, C.; Huang, Y.; Wang, Y.; Monti, A.; Wang, Z.; Zhong, W. Modelling and small signal stability for islanded microgrids with hybrid grid-forming sources based on converters and synchronous machines. Int. J. Electr. Power Energy Syst. 2024, 157, 109831. [Google Scholar] [CrossRef]
  29. Isakov, I.; Vekić, M.; Rapaić, M.; Todorović, I.; Grabić, S. Decentralized self-stabilizing primary control of microgrids. Int. J. Electr. Power Energy Syst. 2023, 155, 109477. [Google Scholar] [CrossRef]
  30. Kweon, J.; Jing, H.; Li, Y.; Monga, V. Small-signal stability enhancement of islanded microgrids via domain-enriched optimization. Appl. Energy 2023, 353, 122172. [Google Scholar] [CrossRef]
  31. Kenyon, R.; Sajadi, A.; Hodge, B. Droop-e: Exponential droop as a function of power output for grid-forming inverters with autonomous power sharing. arXiv 2022, arXiv:2207.03564. [Google Scholar]
  32. Elrayyah, A.; Cingoz, F.; Sozer, Y. Construction of nonlinear droop relations to optimize islanded microgrid operation. IEEE Trans. Ind. Appl. 2015, 51, 3404–3413. [Google Scholar] [CrossRef]
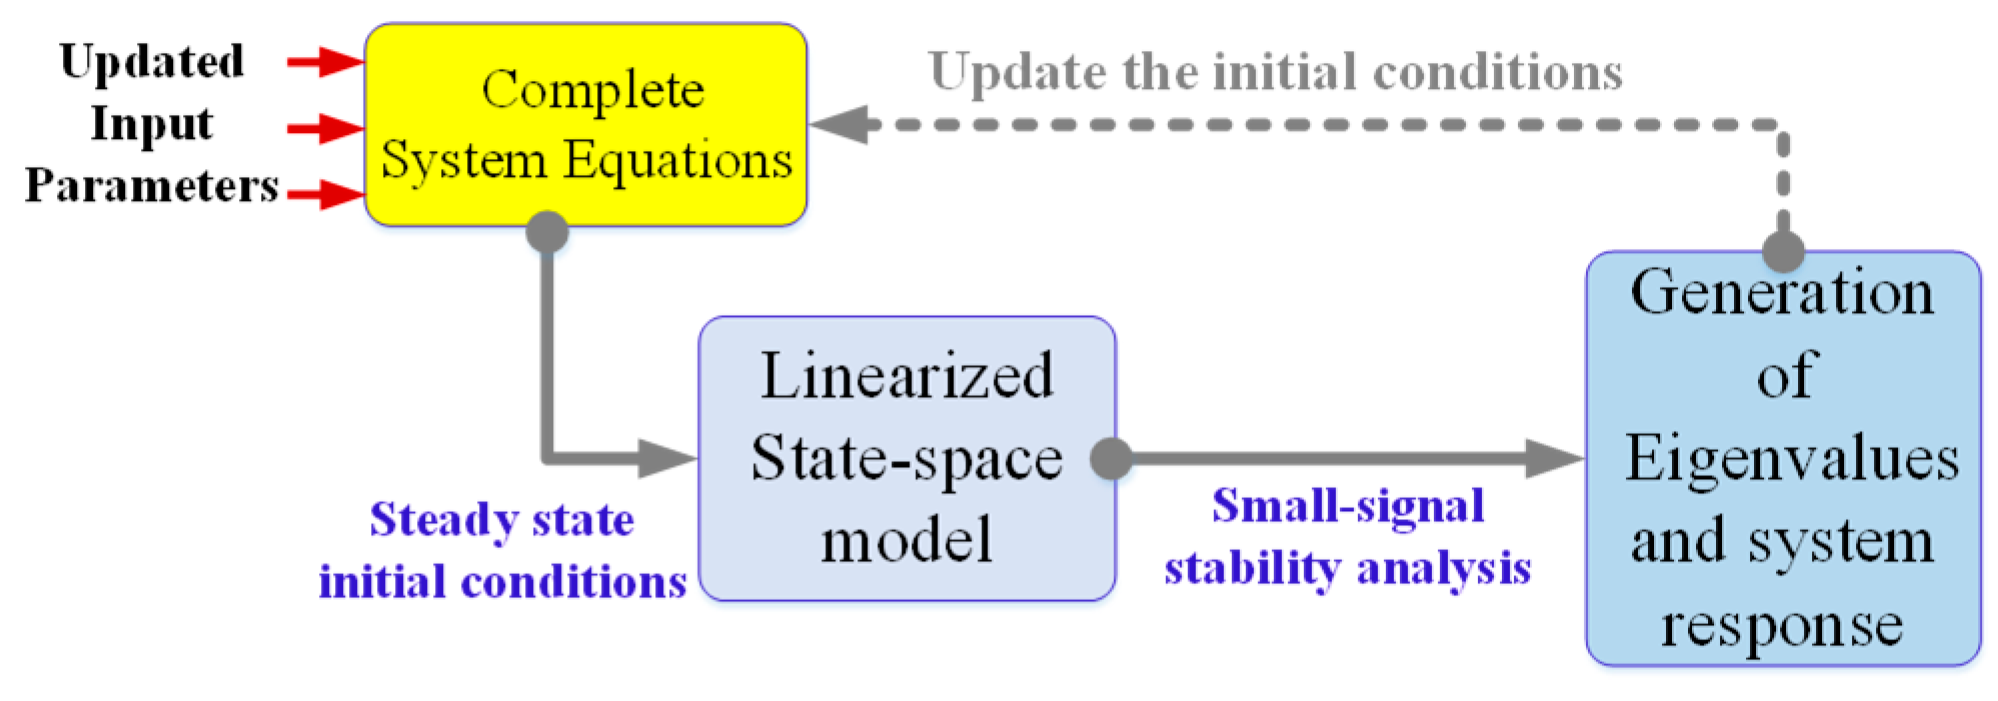
Figure 1. The generalized procedure of the dynamic modeling framework of the microgrid with the proposed control.
Energies 18 04885 g001
Figure 2. Flowchart of the proposed EDF modeling framework of the system, linearization, eigenvalue analysis, and iterative updating of β f to ensure robust stability under varying load conditions.
Energies 18 04885 g002
Figure 3. Comparative example between the proposed droop and the high-order polynomial droop.
Energies 18 04885 g003
Figure 4. Family of EDF-based droop characteristics for −0.5 ≤ β f ≤ 0.5.
Energies 18 04885 g004
Figure 5. The segmented sub-models of the microgrid model used in the aggregated small-signal state space modeling.
Energies 18 04885 g005
Figure 6. Labeled distribution lines and load section of the microgrid used in the modeling.
Energies 18 04885 g006
Figure 7. Block diagram of the microgrid under study including the implementation of the proposed EDF control.
Energies 18 04885 g007
Figure 8. The direction of eigenvalue mapping with load increase in the interval: [ 0.1   PU P L o a d   1.0   PU ] in a 25.0 kW microgrid modeled with β f D G 2 = 0.5 , [Case-1].
Energies 18 04885 g008
Figure 9. The direction of eigenvalue mapping with load increase in the interval: [ 0.1   PU P L o a d   1.0   PU ] ,   in a 30.0   k W microgrid modeled with β f D G 2 = 0.5 , [Case-2].
Energies 18 04885 g009
Figure 10. The direction of eigenvalue mapping as load increases in the interval: [ 0.1   PU P L o a d   1.0   PU ] ,   in a 30.0 k W microgrid with β f D G 2   = 0.5 , [Case-2].
Energies 18 04885 g010
Figure 11. The direction of eigenvalue mapping as load increases in the interval: 0.1   PU P L o a d   1.0   PU   in a 40.0 kW microgrid with β f D G 2 = 0.5 , [Case-3].
Energies 18 04885 g011
Figure 12. The direction of eigenvalue mapping by sweeping the load and the exponent droop coefficient the interval: [ 0.1   PU P L o a d   1.0   PU ] and [ 10 < β f D G 2 < 10 ]   in a 40   k W microgrid.
Energies 18 04885 g012
Figure 13. Case-1 result: Variable load applied to 25 kW microgrid.
Energies 18 04885 g013aEnergies 18 04885 g013b
Figure 14. Case-2 results: Variable load applied to 30 kW microgrid.
Energies 18 04885 g014
Figure 15. Case-3 results: Variable load applied to 40 kW microgrid.
Energies 18 04885 g015
Figure 16. Case-4 results: Variable load applied to 25 kW microgrid.
Energies 18 04885 g016
Figure 17. Case-5 results: Variable load applied to 40 kW microgrid.
Energies 18 04885 g017
Figure 18. Case-6 results: Variable load applied to 30.0 kW EDF-based microgrid (solid lines: EDF control, dashed lines: linear droop).
Energies 18 04885 g018
Figure 19. Case-7 results: Variable load applied to 30.0 kW microgrid with different types of sources.
Energies 18 04885 g019
Table 1. Summary and comparison of state-of-the-art nonlinear droop control strategies.
RefDroop
Function
Type
Droop
Coefficients
Mathematical
Representation
Ease of ImplementationPurpose
(Application)
Function FlexibilityRemark
[24]Natural
Exponential
Function
2 f o u t = f n l f 1 e P x K P r a t e d ModerateTo reduce the reactive power-sharing deviationUnwanted variable offset appears with each coefficient
[25]Arctan Droop Function4 f o u t = f n l a π tan 1 ρ P i P o EasyTo relax the slope of the relation as the power increasesUnwanted variable offset appears with each coefficient
[26,27]Cost-based Nonlinear Function
(Quadratic Functions)
>3 f o u t = f n l f m a x f m i n w 1 P S m a x + w 2 C p w 3 Moderate/Offline optimization is requiredTo minimize operating costs in microgridsAt each characteristic, the Min/Max frequency/voltage should be updated
[31]Power Exponent Droop2 f o u t = α f n l e β P o e β P i EasyTo minimize the power reserveUnwanted variable offset appears with each coefficient
[32]Combination of Integer and Fractional Terms>3 f o u t = f n l i ( K f i P i + K f p i P 1 i )   DifficultTo minimize operating costs in microgridsRequires several terms to increase flexibility
ProposedExponent Droop Function2 f o u t = f n l α f 1 P m a x P i P m a x β f P i f EasyTo flexibly share the power at minimum frequency deviation and forms a general droop functionCan realize any point on
f P / V Q planes by tuning
one coefficient
Table 2. The physical parameters of the microgrid.
ParameterValue
Z c 1 ,   Z c 2 ,   Z c 3 0.02 , 0.04 , 0.034   Ω
Z c 4 ,   Z c 5   , Z c 6 0.026 , 0.023 , 0.03     Ω
L S 1 ,   L S 2   , L R E S   1.54 , 1.4 , 1.5   m H
ω c 157 d/s
Table 3. The specifications of the deployed DGs in the microgrid.
ParameterCase-1Case-4
Graphical
Representation
Energies 18 04885 i001Energies 18 04885 i002
Microgrid Capacity25.0 kW microgrid25.0 kW microgrid
Control Type(DG1/DG3): Linear Droop, (DG2): EDF(DG1/DG3): Linear Droop, (DG2): EDF
DG Capacity(DG1/DG3): 10.0 kW, (DG2): 5.0 kW(DG1/DG3): 10.0 kW, (DG2): 5.0 kW
Droop Parameters(DG1/DG3): m p = 0.5 10 4
(DG2): α f = 1.0 10 4 ,     β f = 0.5
(DG1/DG3): m p = 0.5 10 4 ,
(DG2): α f = 1 10 4 ,     β f = + 0.5
ParameterCase-2Case-5
Graphical
Representation
Energies 18 04885 i003Energies 18 04885 i004
Microgrid Capacity30.0 kW microgrid40.0 kW microgrid
Control Type(DG1/DG3): Linear Droop, (DG2): EDF(DG1/DG3): Linear Droop, (DG2): EDF
DG Capacity(DG1/DG2/DG3): 10.0 kW(DG1/DG3): 10.0 kW, (DG2): 20.0 kW
Droop Parameters(DG1/DG3): m p = 0.5 10 4
(DG2): α f = 0.5 10 4 ,     β f 1 = 0.5 ,     β f 2 = 0.5
(DG1/DG3): m p = 0.5 10 4 ,
(DG2): α f = 0.25 10 4 ,   β f = 0.5
ParameterCase-3Case-6 (EDF Controlled DGs)
Graphical
Representation
Energies 18 04885 i005Energies 18 04885 i006
Microgrid Capacity40.0 kW microgrid30.0 kW microgrid
Control Type(DG1/DG3): Linear Droop, (DG2): EDF(DG1/DG2/DG3): EDF Control
DG Capacity(DG1/DG3): 10.0 kW, (DG2): 20.0 kW(DG1): 5.0 kW, (DG2): 10.0 kW, (DG3): 15.0 kW
Droop Parameters(DG1/DG3): m p = 0.5 10 4
(DG2): α f = 1.0 10 5 ,     β f = + 0.5
(DG1): α f = 0.75 10 4 ,     β f = 0.5
(DG3): α f = 0.5 10 4 ,             β f = 0.1
(DG2): α f = 0.25 10 4 ,     β f = + 0.3
Disclaimer/Publisher’s Note: The statements, opinions and data contained in all publications are solely those of the individual author(s) and contributor(s) and not of MDPI and/or the editor(s). MDPI and/or the editor(s) disclaim responsibility for any injury to people or property resulting from any ideas, methods, instructions or products referred to in the content.