Residential Electricity Consumption Behaviors in Eastern Romania: A Non-Invasive Survey-Based Assessment of Consumer Patterns
Abstract
1. Introduction
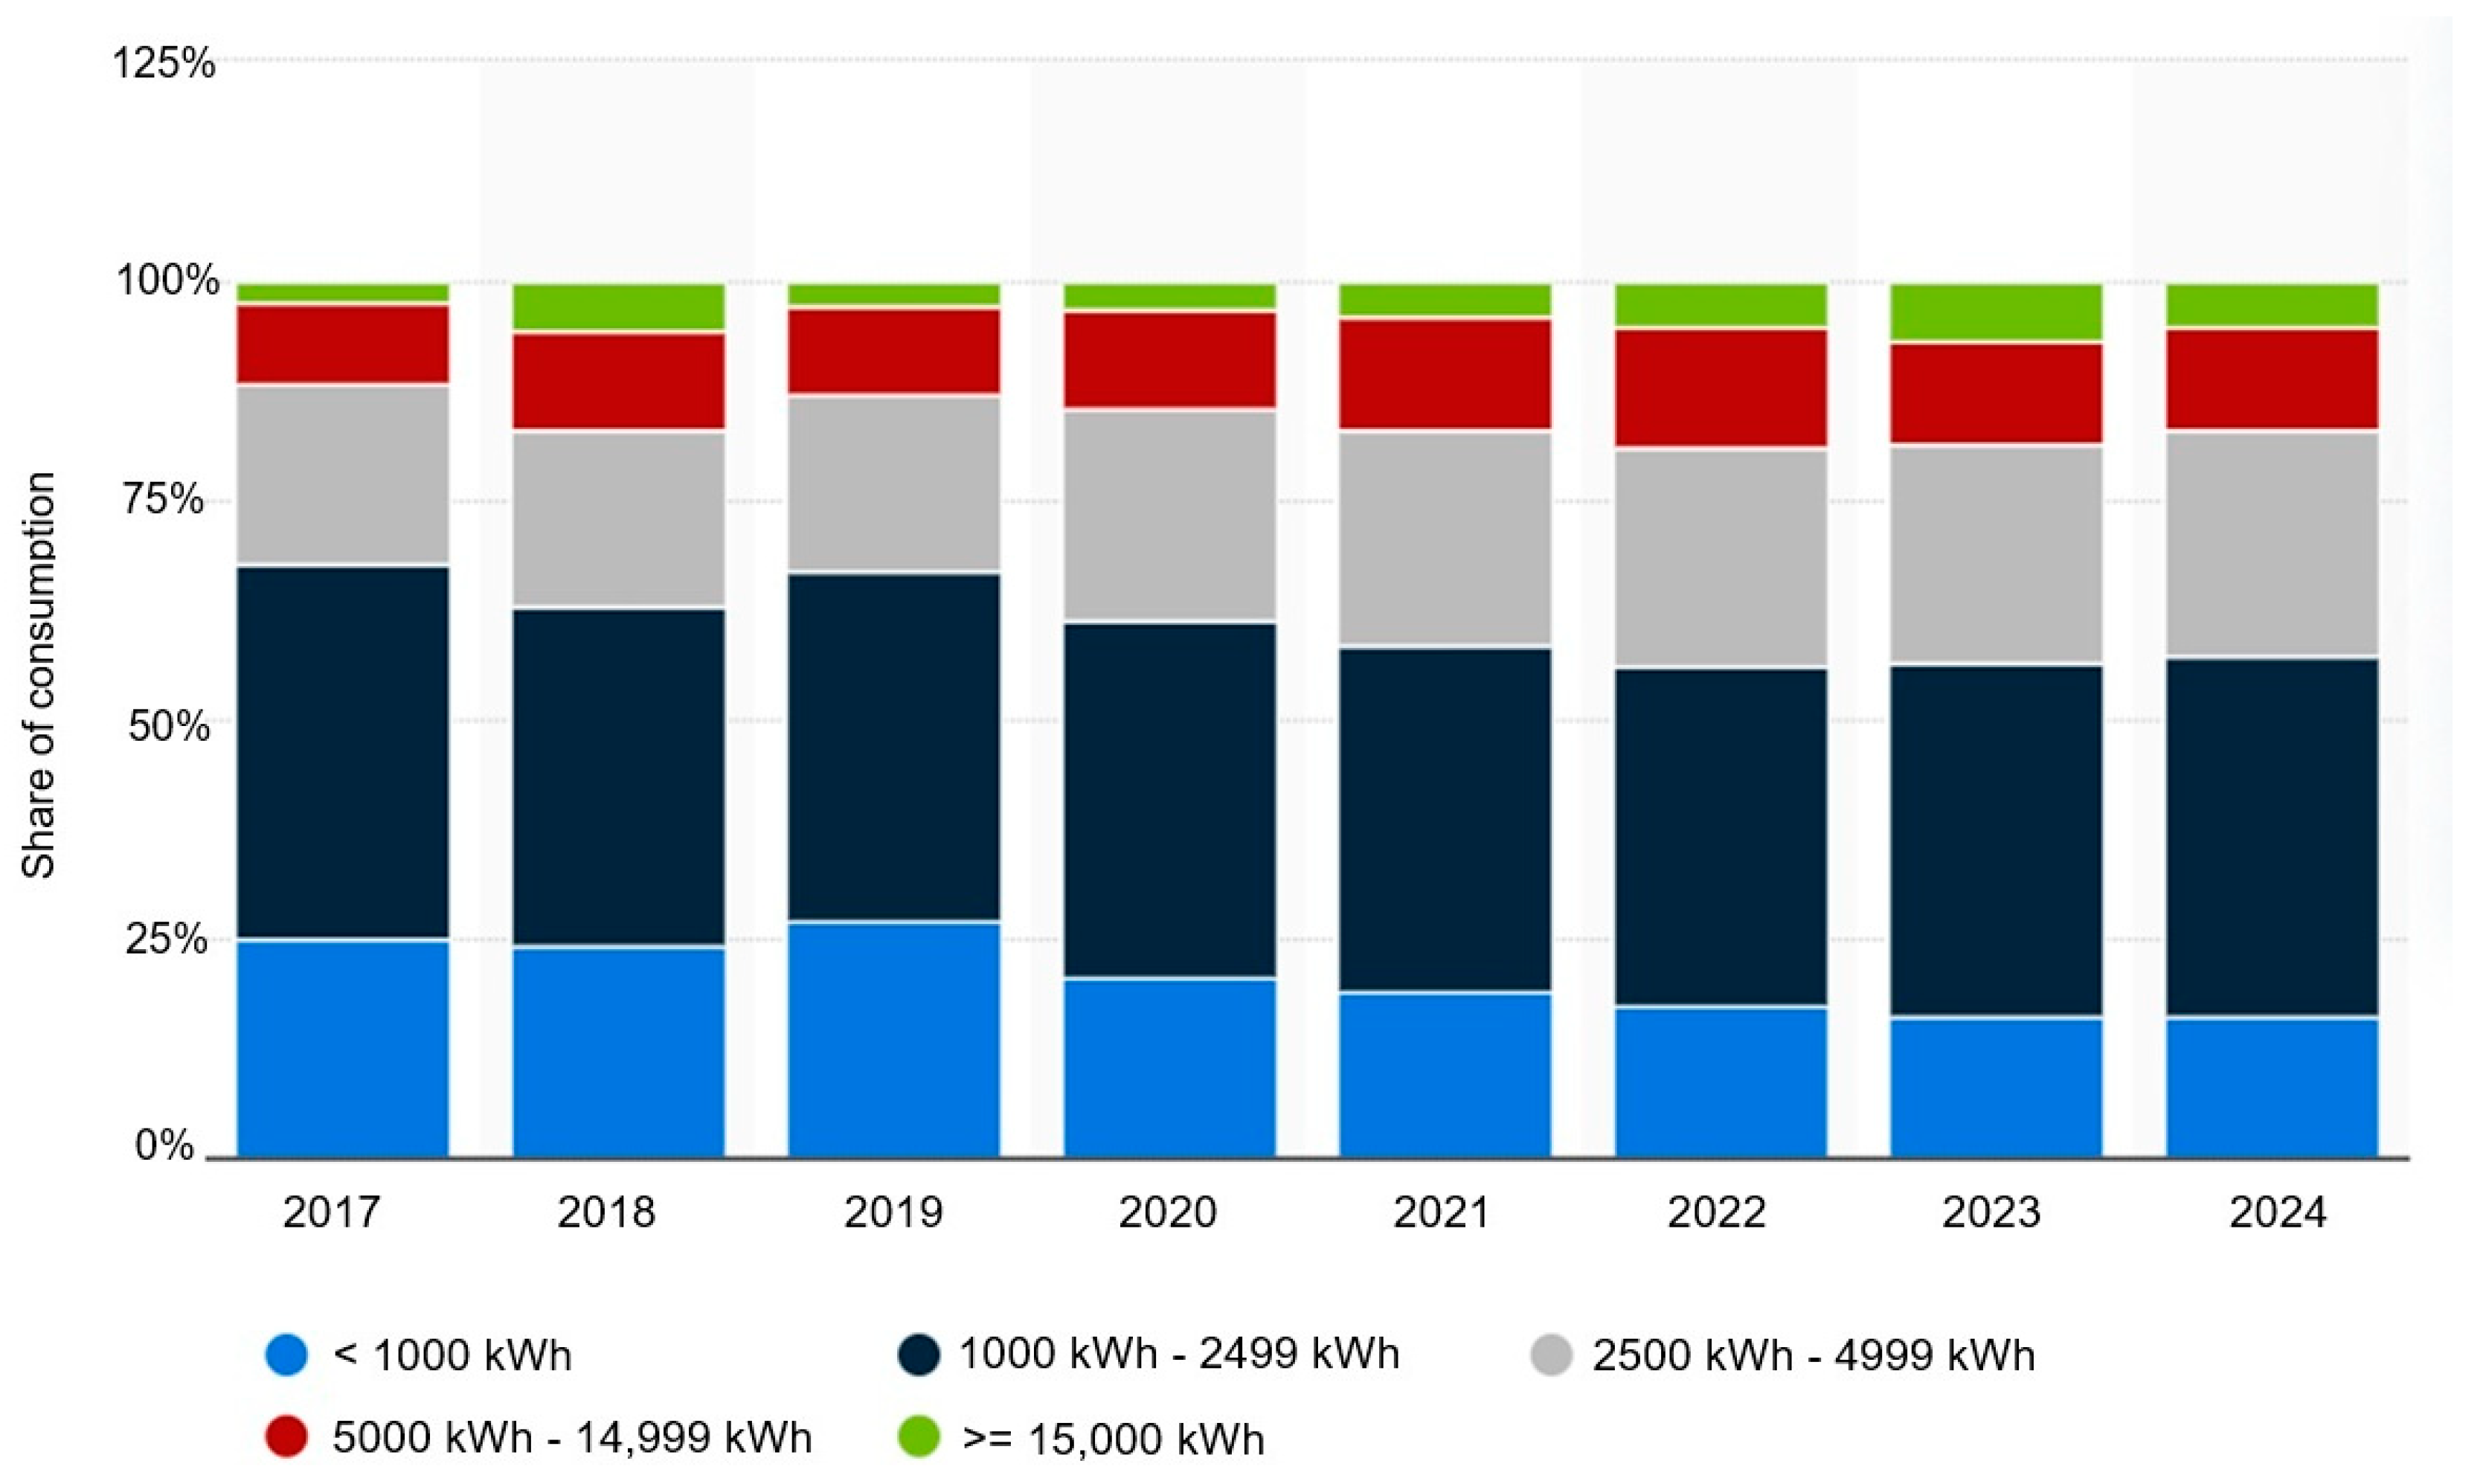
- Stability in mid-range consumption: The 1000–2499 kWh and 2500–4999 kWh bands have consistently accounted for the majority share (about 60–70%) across all years, indicating that most Romanian residential consumers fall within moderate consumption brackets.
- Slight decline in low consumption: The share of residential consumption under 1000 kWh annually has declined slightly over time, suggesting reduced prevalence of minimal energy use.
- Rising high consumption segments: The shares of the 5000–14,999 kWh and ≥15,000 kWh categories have gradually increased since 2017, indicating a growing portion of high-consumption.
- Post-2020 stabilization: After noticeable shifts around 2019–2020 (likely due to COVID-19-related behavioral changes), the consumption distribution has largely stabilized, with only minor annual variation.
2. Materials and Methods
2.1. Study Design and Sample
2.2. Data Collection Instrument
- Sociodemographic characteristics (age, gender, education level, employment status).
- Dwelling characteristics (type, area in m2, number of occupants, urban/rural location).
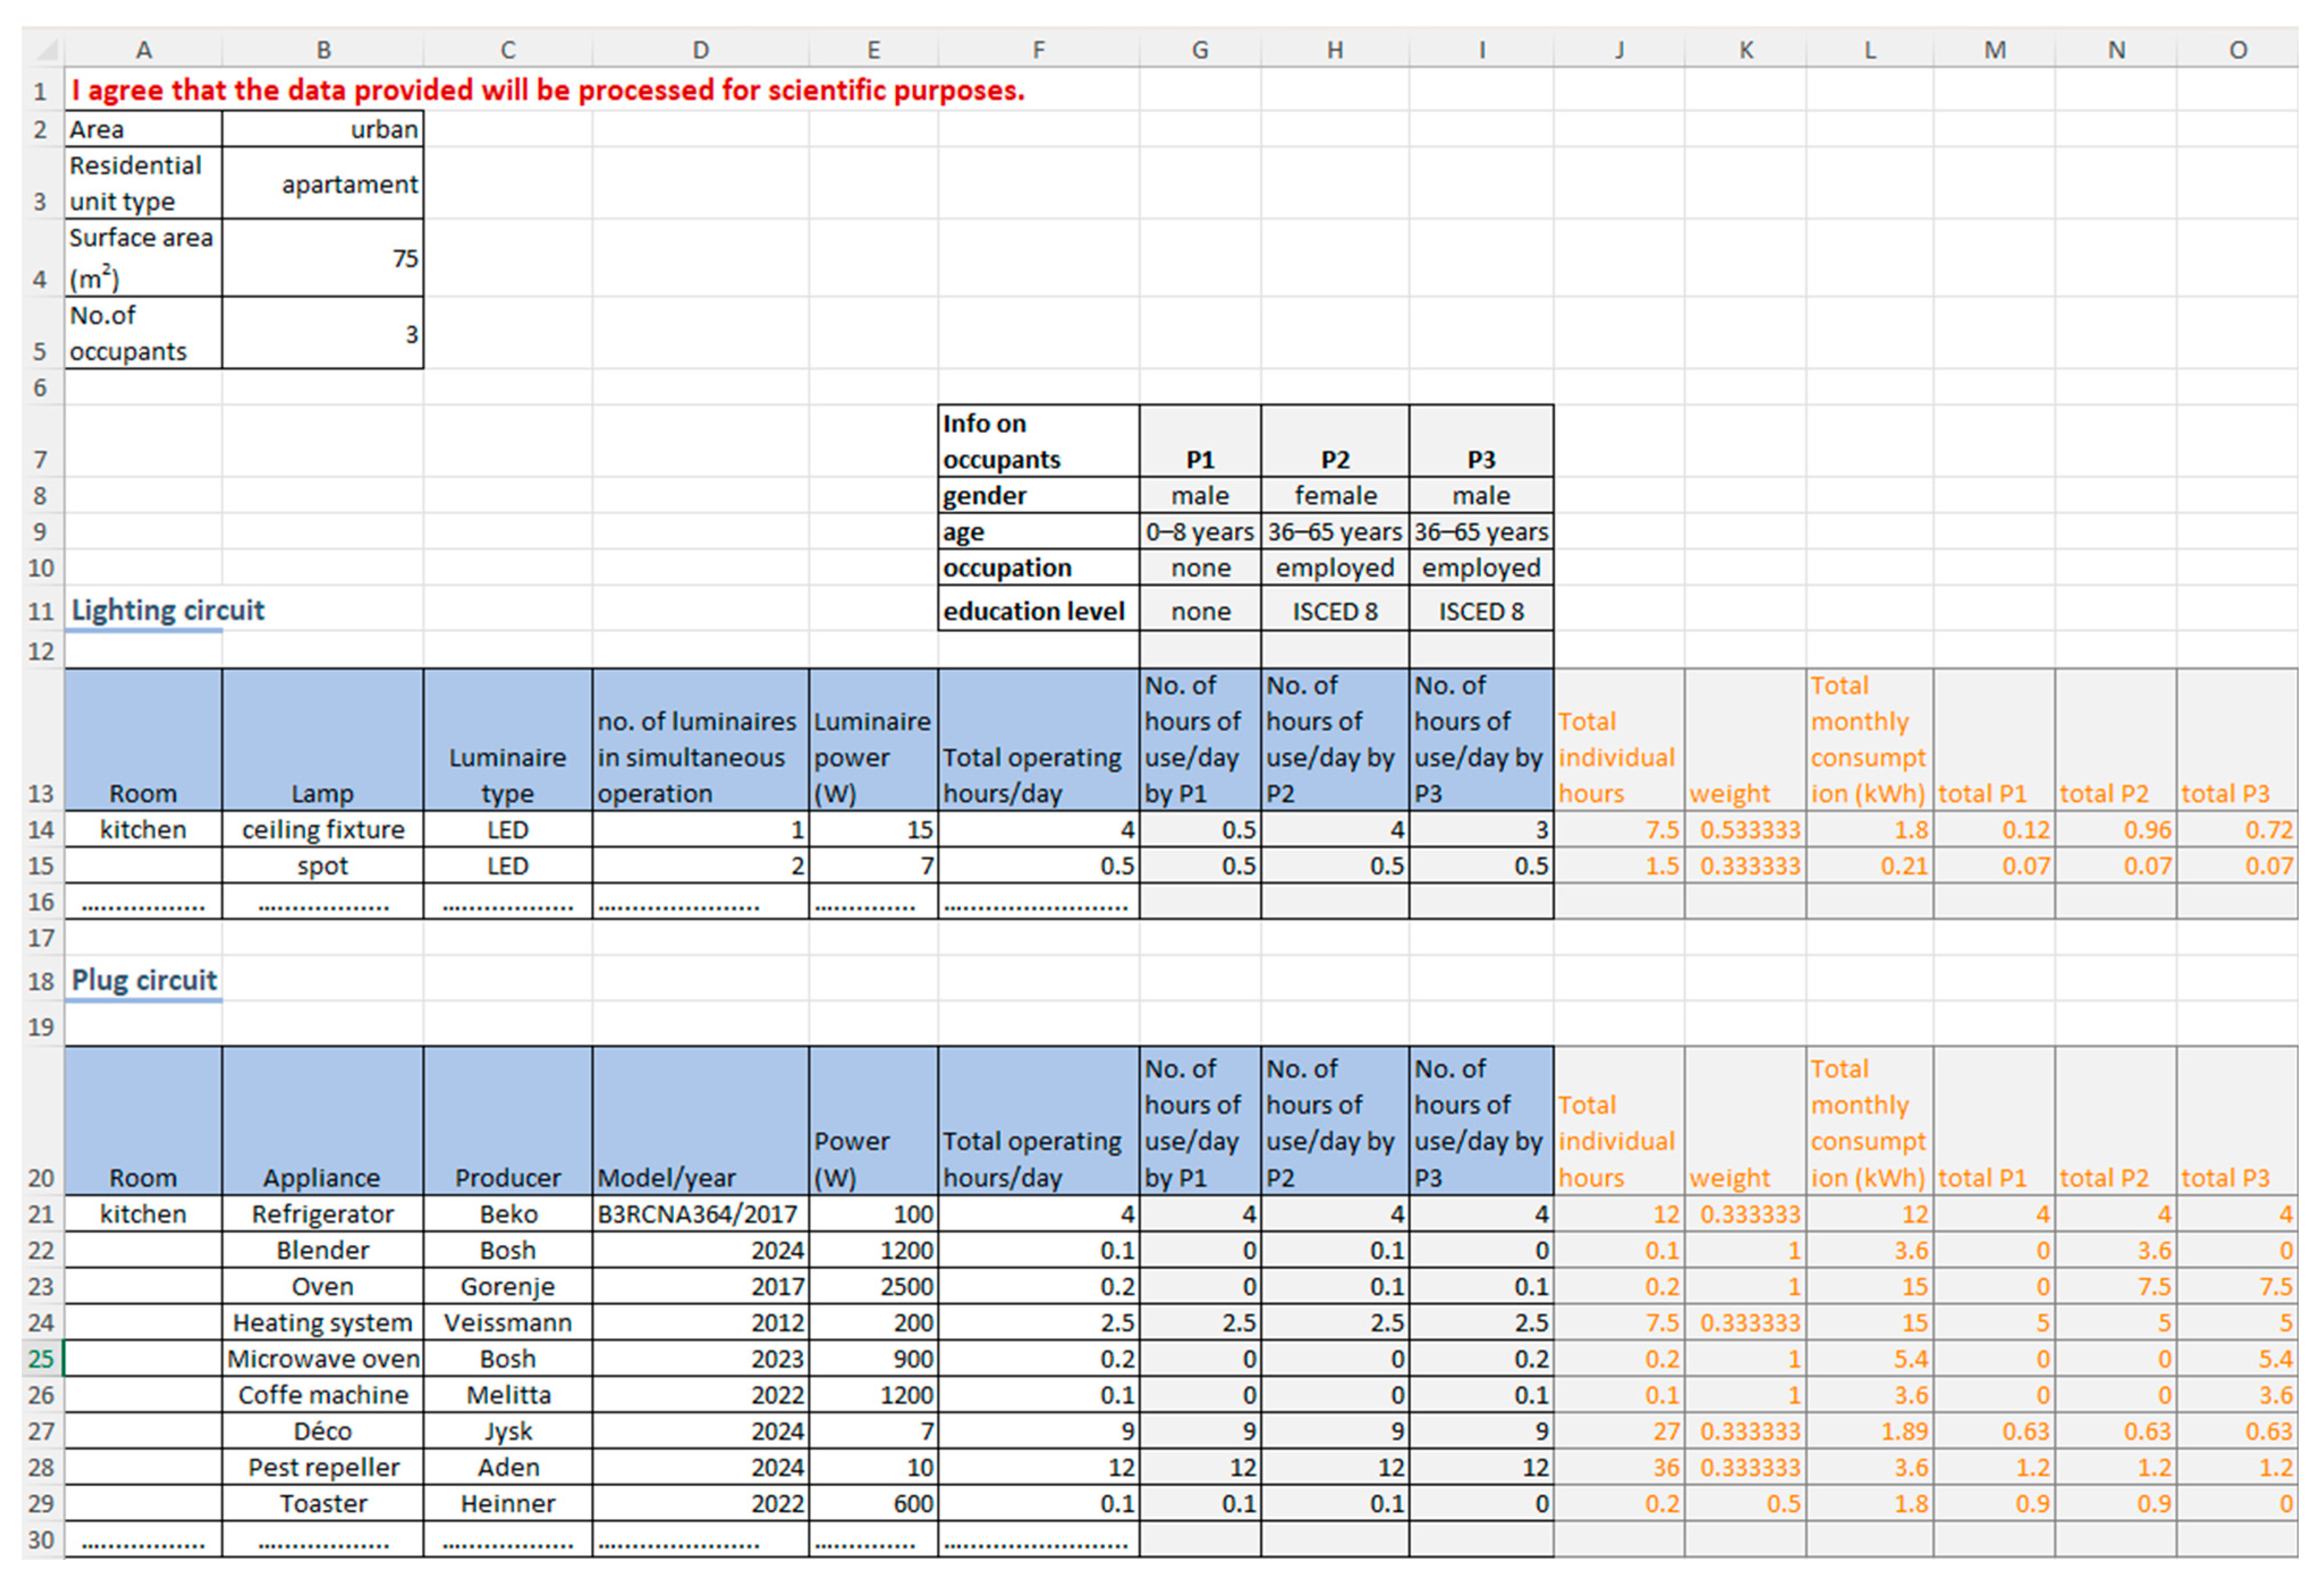
- Appliance ownership and self-declared usage (hours/month) for all electricity-consuming devices.
- Billed consumption values from electricity bills over the same period. Billed consumption was considered as the quantity effectively read on the power meter by the energy supplier, taken directly from the bill document (for the same period the calculation assessment was recorded).
2.3. Data Validation
2.4. Adjustments for Simultaneous Usage
- Aggregation: For each appliance, the individually declared daily usage durations were summed across all household members.
- Normalization: The appliance’s total realistic daily operation time was divided by the sum obtained above, resulting in a subunitary coefficient (i.e., <1).
- Adjustment: Each individual’s declared usage duration was then multiplied by this coefficient to obtain the adjusted value used in the per-person consumption calculation.
2.5. Consumption Estimation and Error Analysis
2.6. Statistical Processing
3. Results
3.1. Residential Consumer Own Consumption Assessment
| Consumer | Calculated Consumption (kWh) | Billed Consumption (kWh) | ε (%) | Mean (%) | σ | NORMAL | y |
|---|---|---|---|---|---|---|---|
| 1 | 253.2204 | 334 | −24.1855 | 8.5552 | 31.3891 | 0.007377 | 2.028678 |
| 2 | 110.076 | 139 | −20.8086 | 0.0082054 | 2.2564909 | ||
| 3 | 152.55 | 185 | −17.5405 | 0.0089959 | 2.473882 | ||
| 4 | 160.4928 | 183 | −12.2990 | 0.0101925 | 2.8029484 | ||
| 5 | 72.8959 | 83 | −12.1735 | 0.0102196 | 2.8103812 | ||
| 6 | 342.381 | 387 | −11.5294 | 0.0103568 | 2.8481216 | ||
| 7 | 87.955 | 99 | −11.1565 | 0.0104351 | 2.869651 | ||
| 8 | 54.9105 | 61 | −9.9827 | 0.0106756 | 2.9357832 | ||
| 9 | 232.23 | 255 | −8.9294 | 0.0108831 | 2.9928629 | ||
| 10 | 270.66 | 289 | −6.3460 | 0.0113552 | 3.1226693 | ||
| 11 | 365.22 | 389 | −6.1131 | 0.0113949 | 3.133602 | ||
| 12 | 209.6392 | 220 | −4.7094 | 0.0116239 | 3.196577 | ||
| 13 | 160.2309 | 167 | −4.0533 | 0.0117245 | 3.2242324 | ||
| 14 | 308.055 | 320 | −3.7328 | 0.0117721 | 3.2373161 | ||
| 15 | 163.728 | 170 | −3.6894 | 0.0117784 | 3.2390657 | ||
| 16 | 84.9361 | 87 | −2.3722 | 0.0119623 | 3.2896268 | ||
| 17 | 150.279 | 153 | −1.7784 | 0.0120392 | 3.3107694 | ||
| 18 | 245.8102 | 250 | −1.6759 | 0.0120521 | 3.3143139 | ||
| 19 | 455 | 462 | −1.5151 | 0.0120735 | 3.3202188 | ||
| 20 | 378.18 | 381 | −0.7401 | 0.0121643 | 3.3451884 | ||
| 21 | 337.2890 | 337 | 0.0857 | 0.0122552 | 3.3701894 | ||
| 22 | 204.351 | 204 | 0.1720 | 0.0122643 | 3.3726771 | ||
| 23 | 486.072 | 480 | 1.2650 | 0.0123714 | 3.4021237 | ||
| 24 | 81.0998 | 80 | 1.3748 | 0.0123813 | 3.404868 | ||
| 25 | 154.035 | 149 | 3.3791 | 0.0125379 | 3.4479326 | ||
| 26 | 104.1544 | 100 | 4.1544 | 0.0125853 | 3.4609479 | ||
| 27 | 139.58 | 134 | 4.1641 | 0.0125858 | 3.4610981 | ||
| 28 | 208.545 | 200 | 4.2725 | 0.0125918 | 3.4627487 | ||
| 29 | 131.7164 | 126 | 4.5368 | 0.0126058 | 3.4666066 | ||
| 30 | 80.727 | 77 | 4.8402 | 0.0126209 | 3.4707371 | ||
| 31 | 137.58 | 130 | 5.8307 | 0.0126618 | 3.4819894 | ||
| 32 | 159.1125 | 150 | 6.0750 | 0.0126652 | 3.4842363 | ||
| 33 | 143.25 | 135 | 6.1111 | 0.0126711 | 3.4845507 | ||
| 34 | 149.6616 | 141 | 6.1429 | 0.0126721 | 3.4848244 | ||
| 35 | 166.8971 | 157 | 6.3039 | 0.0126769 | 3.4861518 | ||
| 36 | 373.515 | 339 | 10.1814 | 0.0126925 | 3.4904427 | ||
| 37 | 128.562 | 115 | 11.7930 | 0.0126421 | 3.4765851 | ||
| 38 | 459.42 | 407.5 | 12.7411 | 0.0125971 | 3.4641901 | ||
| 39 | 98.325 | 87 | 13.0172 | 0.0125818 | 3.4599946 | ||
| 40 | 117.6108 | 100 | 17.6108 | 0.0121915 | 3.3526671 | ||
| 41 | 274.71 | 233 | 17.9012 | 0.0121585 | 3.3435848 | ||
| 42 | 167.8815 | 142 | 18.2264 | 0.0121204 | 3.3331103 | ||
| 43 | 133.575 | 109 | 22.5458 | 0.0115078 | 3.1646393 | ||
| 44 | 116.964 | 95 | 23.12 | 0.0114124 | 3.1384196 | ||
| 45 | 620.175 | 410 | 51.2621 | 0.0050369 | 1.3851407 | ||
| 46 | 73.965 | 46 | 60.7934 | 0.0031821 | 0.8750852 | ||
| 47 | 109.4597 | 63 | 73.7455 | 0.0014707 | 0.4044327 | ||
| 48 | 180.195 | 64 | 181.5546 | 3.222 × 10⁻⁹ | 8.859 × 10⁻⁷ | ||
| 49 | 243.987 | NA | |||||
| 50 | 103.47 | NA | |||||
| 51 | 303.882 | NA | |||||
| 52 | 572.46 | NA | |||||
| 53 | 172.191 | NA | |||||
| 54 | 303.366 | NA | |||||
| 55 | 1093.65 | NA |
3.1.1. Residential Consumers’ Declared Consumption by Appliances
3.1.2. Residential Consumers’ Profile Analysis
4. Discussion
- 1.
- Systematic over- or underestimation.
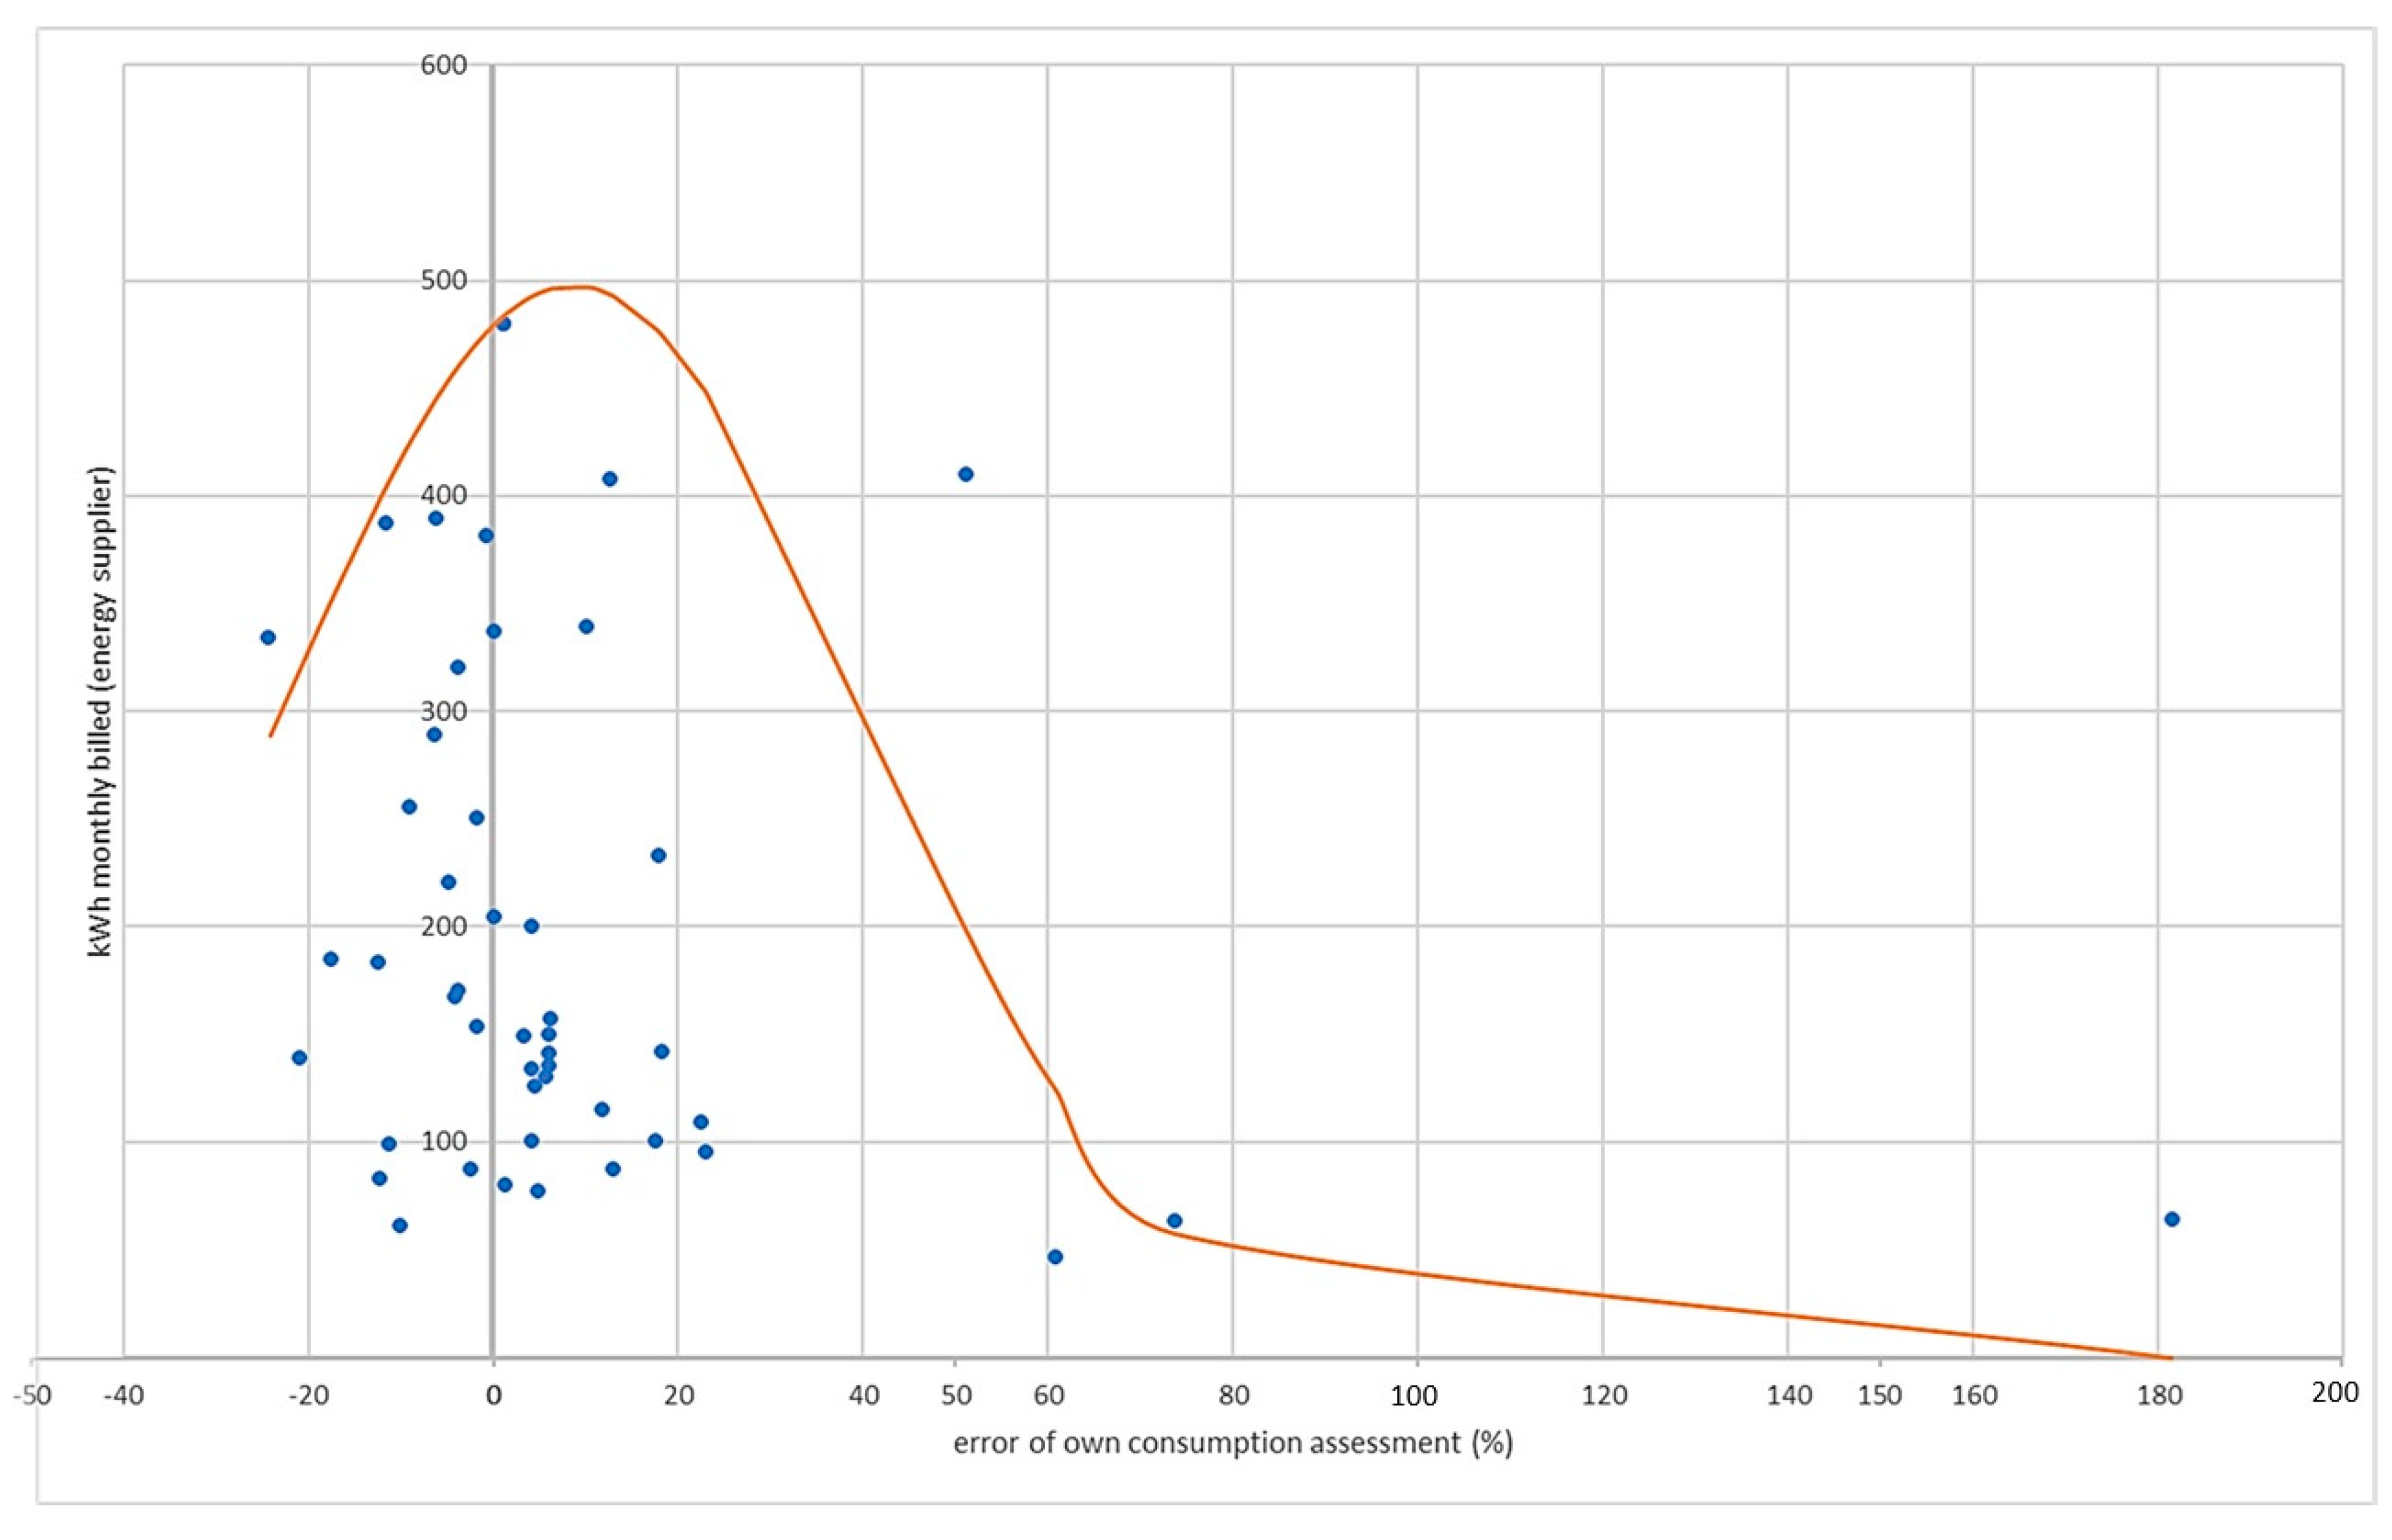
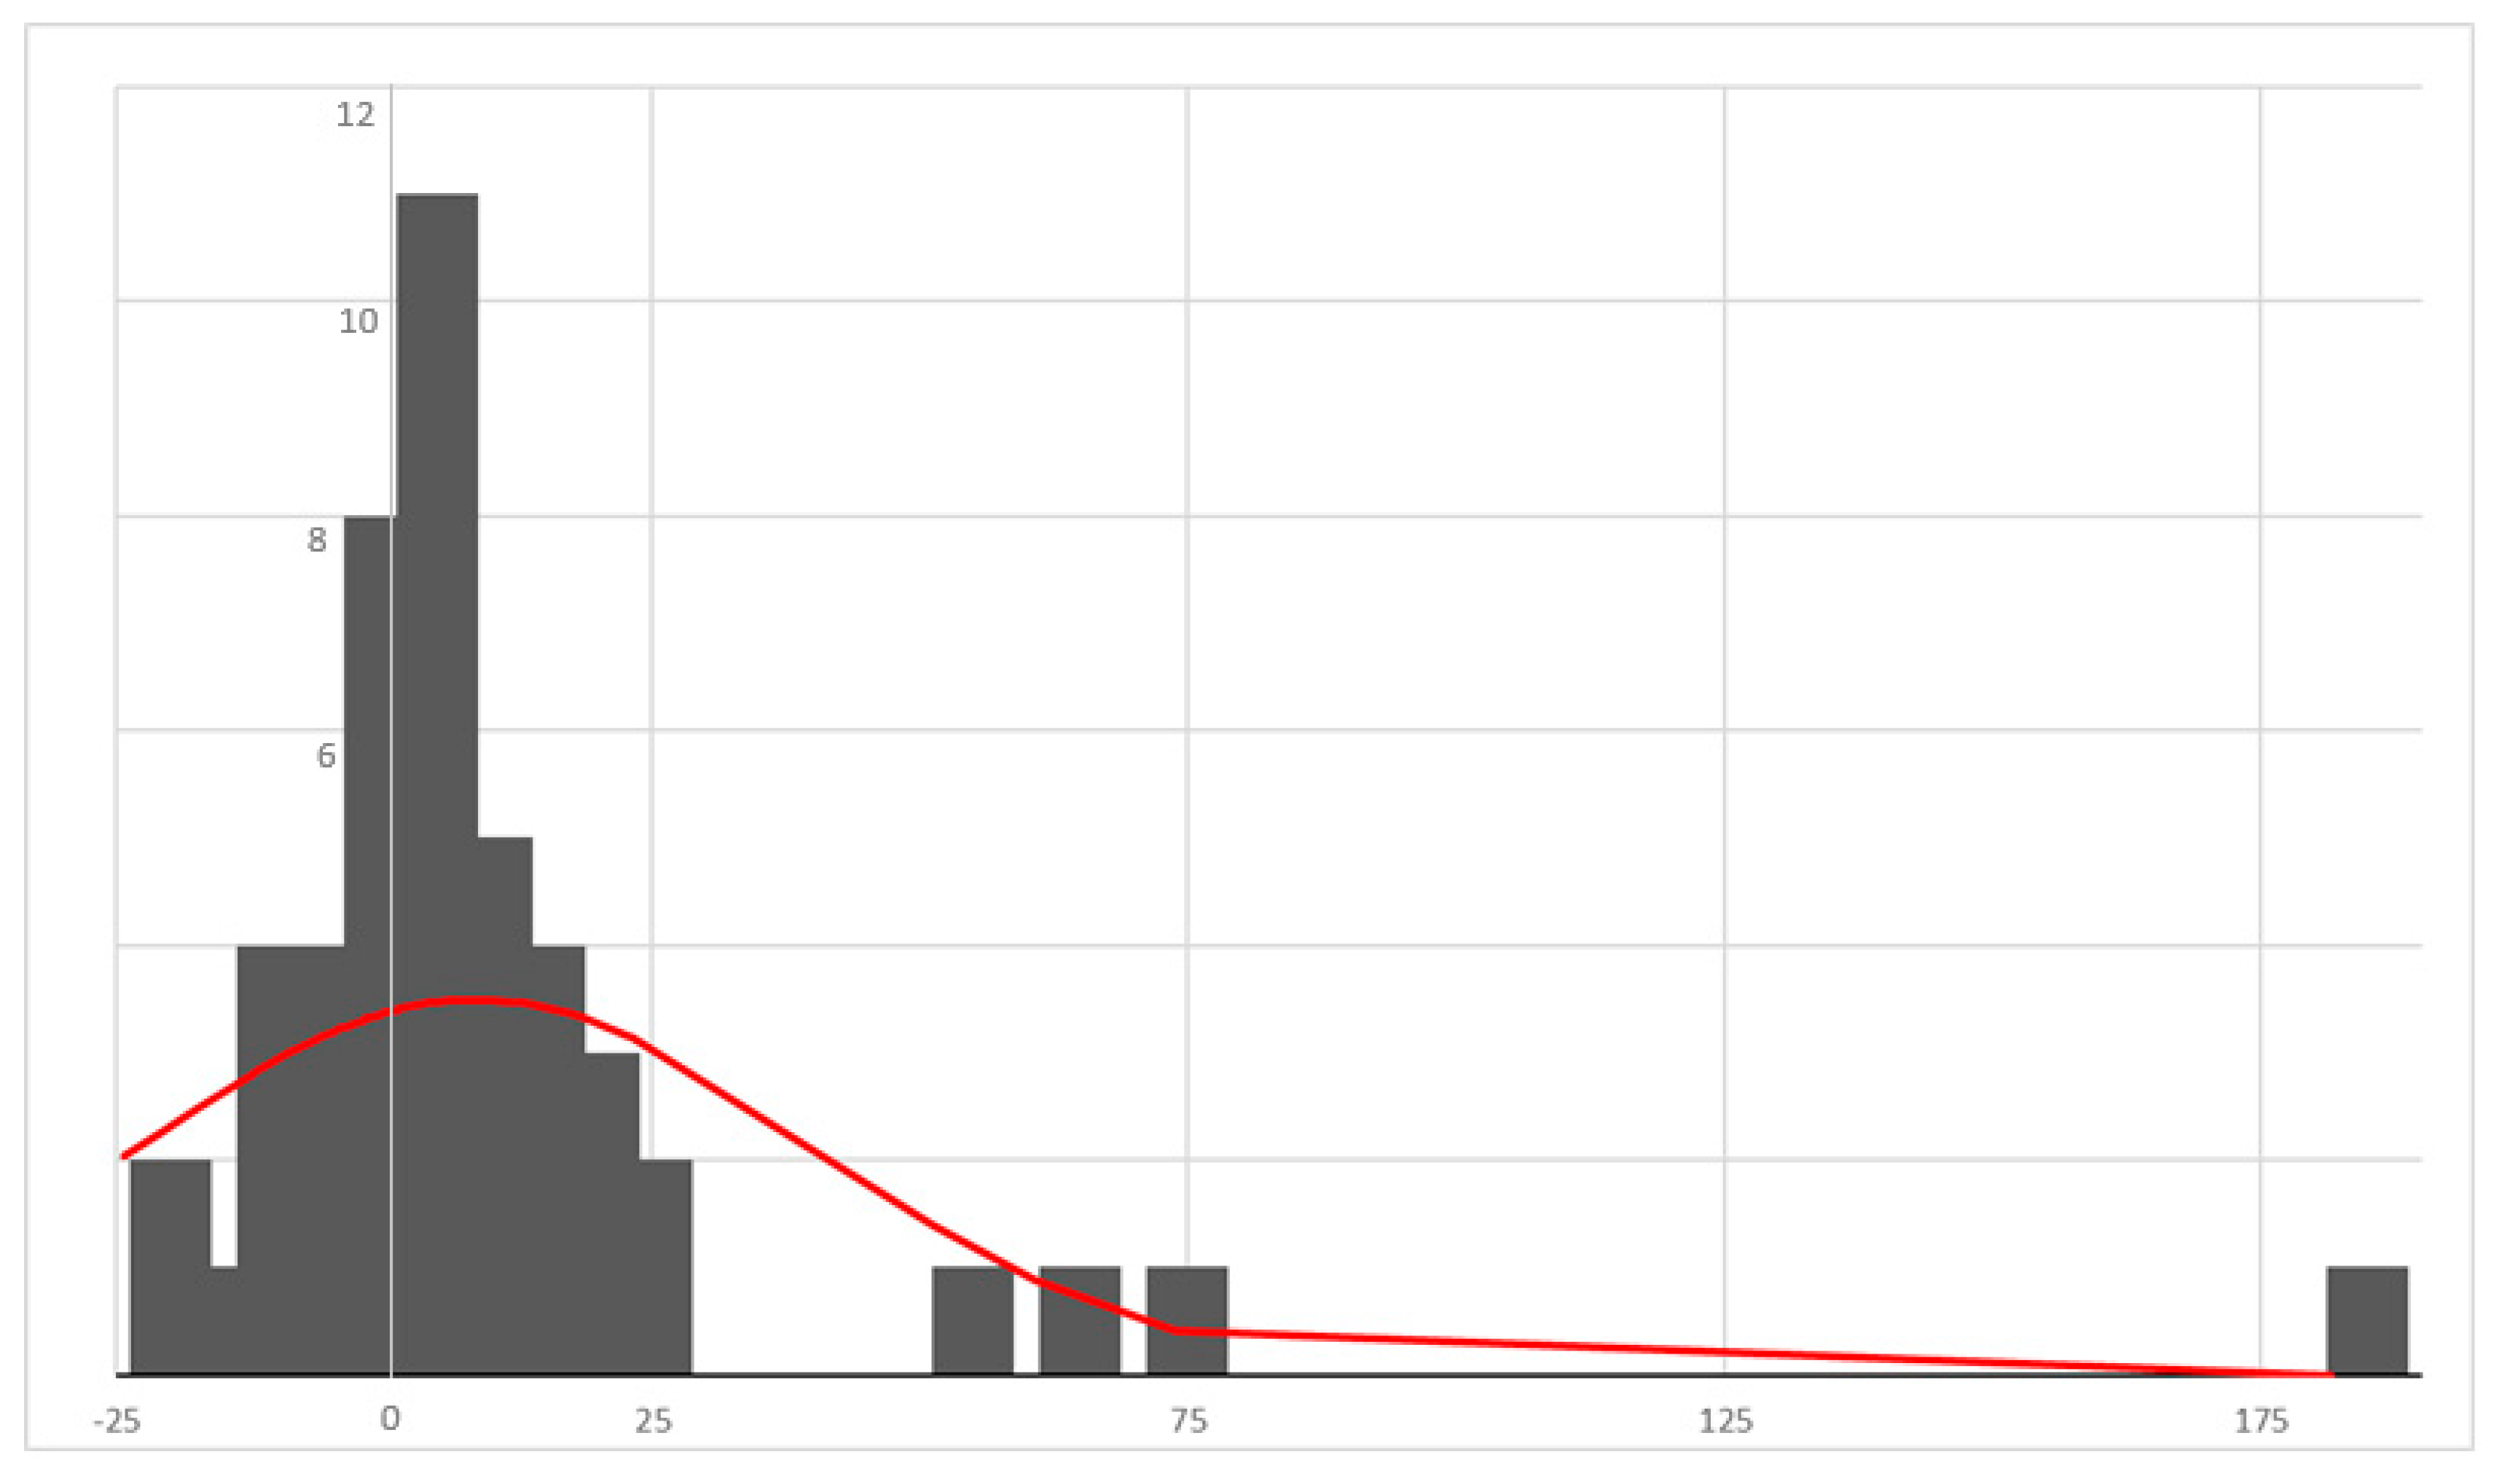
- The mean error of +8.55% indicates that, on average, the calculated consumption overestimates what is actually billed. This suggests a potential systemic bias in estimation methods, due to the following:
- Conservative estimation during meter read gaps.
- Lack of real-time data (e.g., smart meters not yet fully deployed).
- Behavioral changes (e.g., seasonal efficiency improvements, reduced usage) not captured by static estimation models.
- 2.
- High variability and skewness.
- The standard deviation of ~31% and strong positive skewness (3.97) imply that while most residential consumers are close to their actual consumption, a minority exhibit very large overestimations—some over 180%. These outliers could reflect the following:
- Residential consumers with erratic or seasonal usage patterns (e.g., electric heating/cooling).
- Inaccurate estimation algorithms not accounting for recent behavioral shifts (e.g., PV panels installation).
- Data entry or billing errors.
- 3.
- Behavioral insight
- The dispersion and positive tail of the error suggest behavioral heterogeneity—some consumers may drastically change their consumption (e.g., buying new appliances, teleworking), while others are relatively stable. Estimation models that do not adapt to such behavioral dynamics lead to higher uncertainty.
- Implications for energy management and policy rely on
- Trust and perception: Repeated overbilling based on overestimated consumption may undermine consumer trust in energy providers and reduce engagement with energy-saving initiatives.
- Targeting efficiency programs: The divergence in error rates suggests that residential consumers differ in how predictable their consumption is, possibly linked to income level, dwelling characteristics or usage behavior. Tailored feedback or interventions may be more effective than one-size-fits-all approaches.
- Smart metering justification: These findings underscore the need for high-resolution, real-time data (e.g., from smart meters) to reduce estimation errors and better capture consumption behaviors.
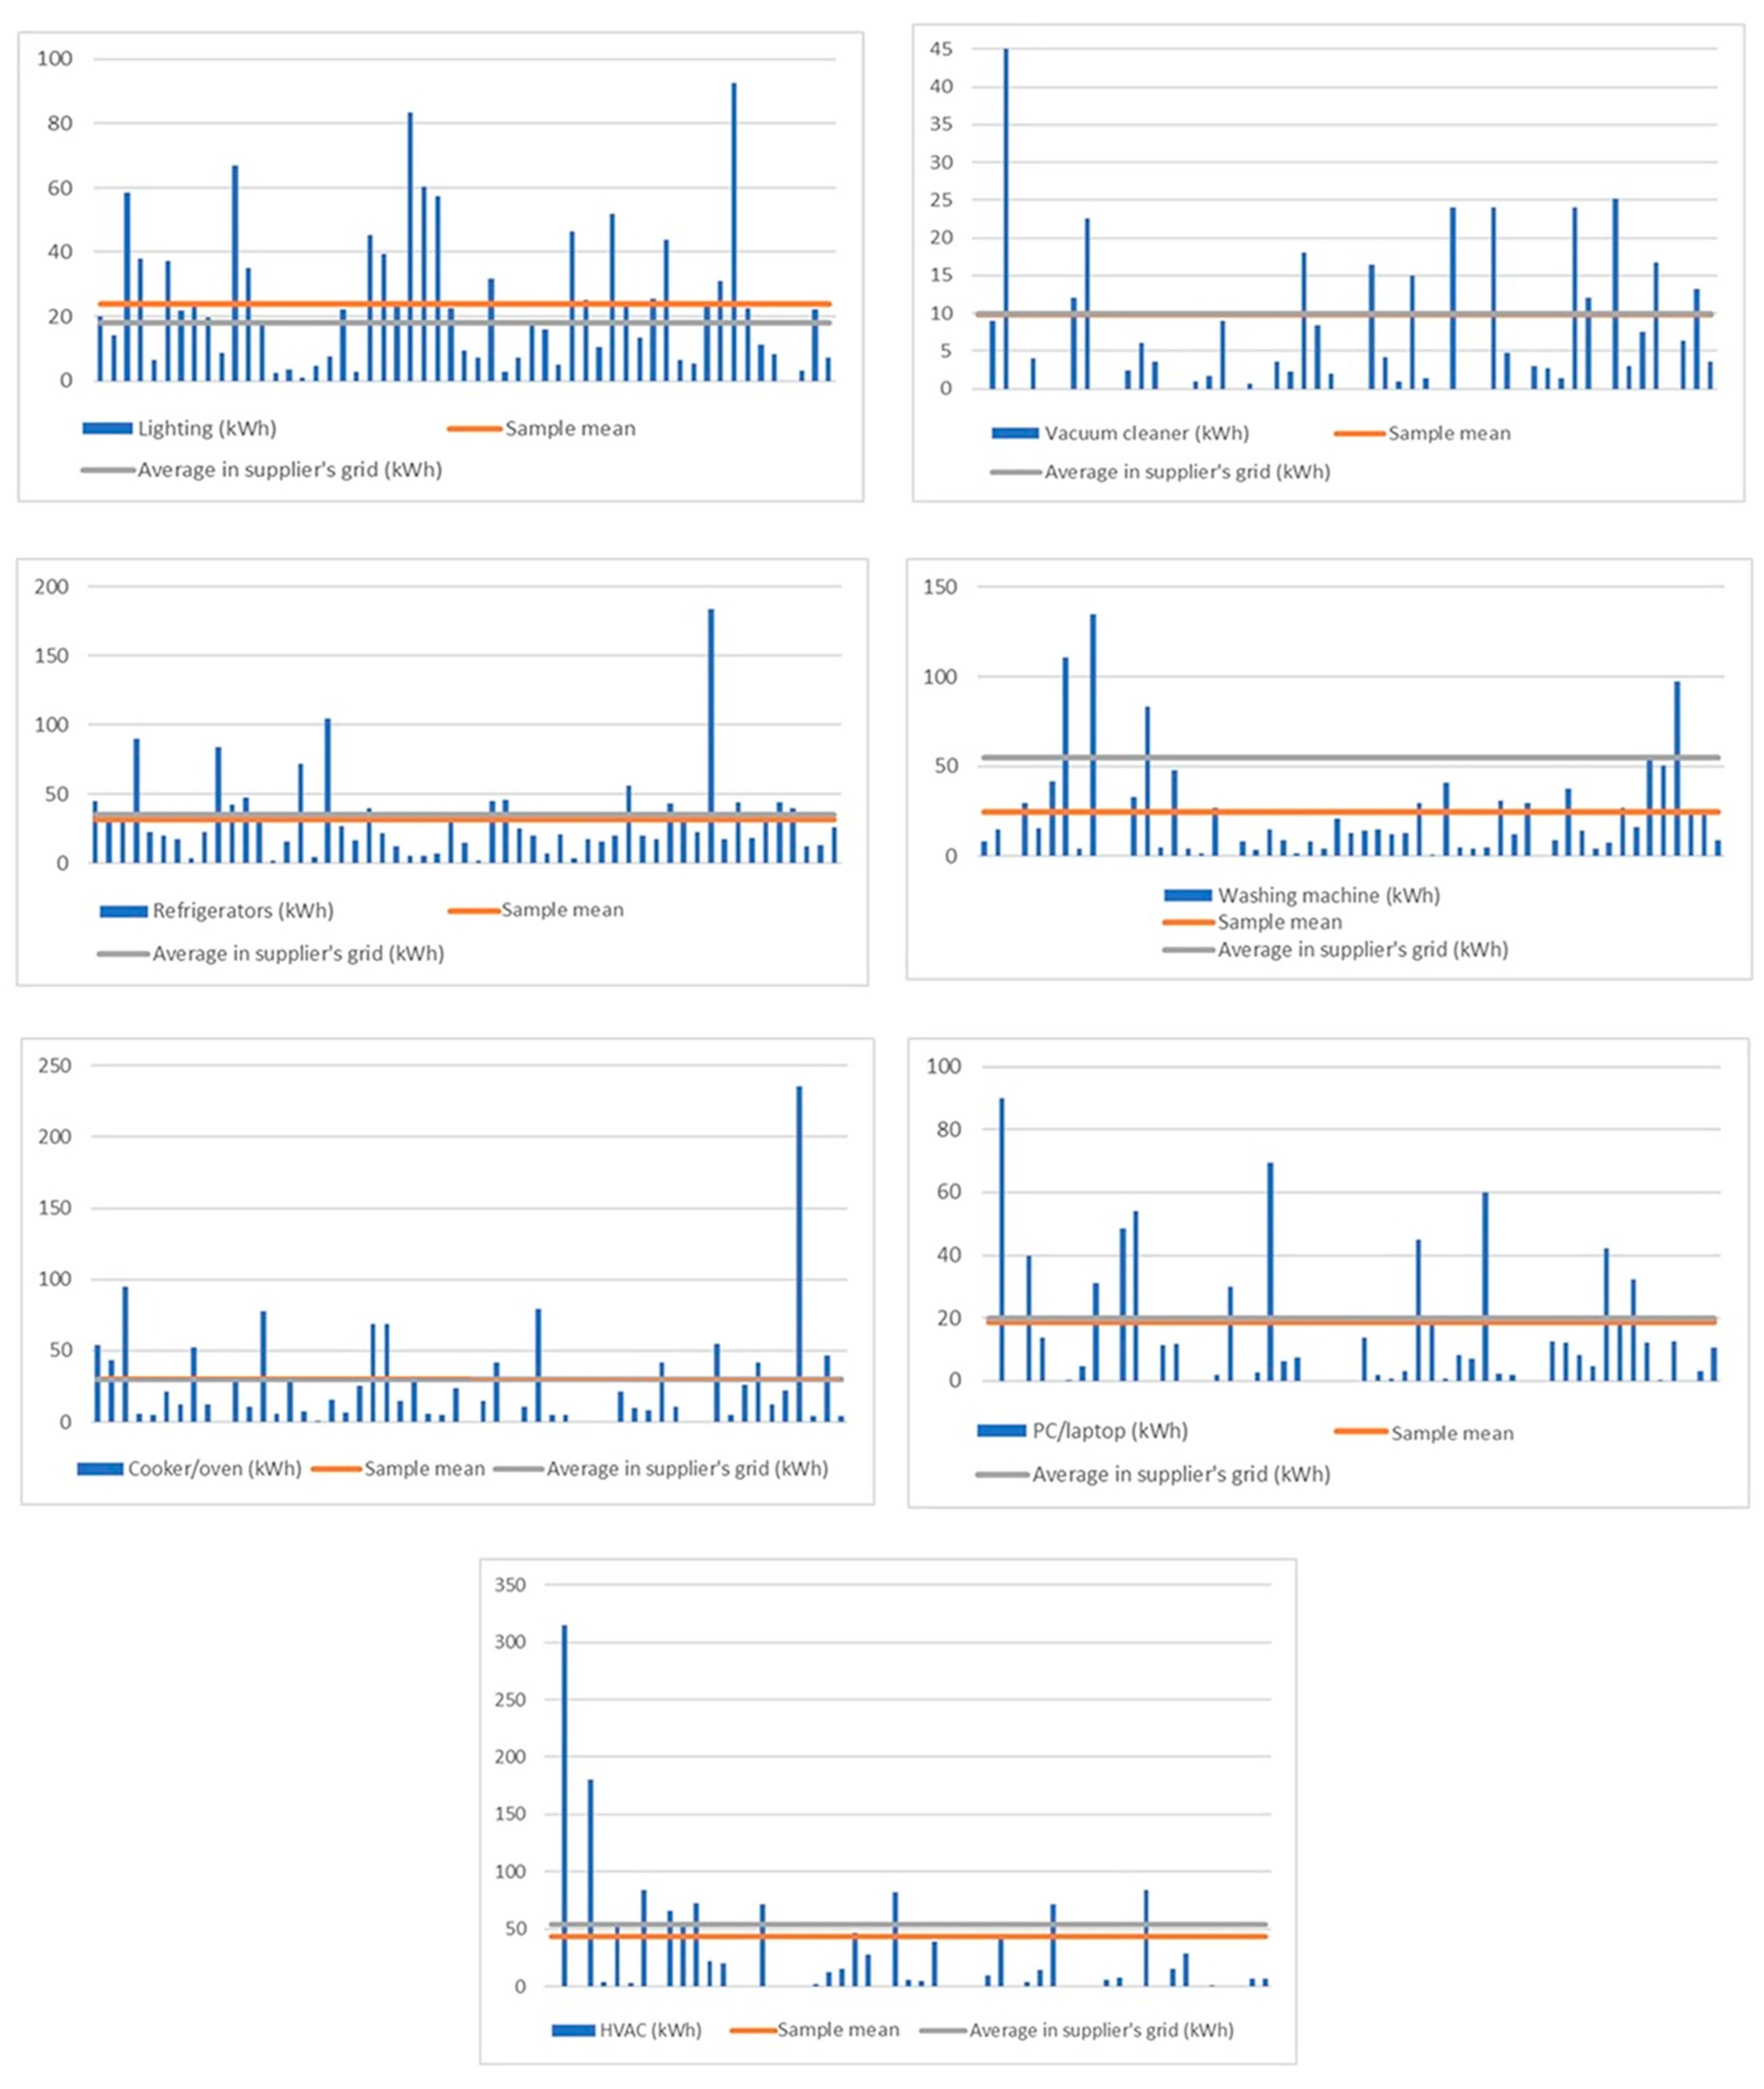
- In cases where multiple individuals use the same luminaires, the reported consumption reflects a cumulative (summative) value rather than an individualized (inclusive) allocation per user.
- The underestimation of HVAC consumption can be attributed to the variable and often automated nature of its operation. Consumers may underestimate total runtime, particularly during transitional seasons or when thermostats automate cycling. Moreover, the efficiency of HVAC systems varies widely with equipment type and insulation quality, complicating accurate perception.
- Despite being continuously operational, refrigerators tend to be overlooked in consumer estimations due to their quiet, background function. Underestimation may also result from improved energy efficiency in modern models, contrasting with outdated perceptions of refrigerator consumption.
5. Conclusions
Author Contributions
Funding
Data Availability Statement
Conflicts of Interest
References
- Darby, S.; Fawcett, T. Energy Sufficiency: A Concept Paper for ECEEE; European Council for an Energy-Efficient Economy: Stockholm, Sweden, 2018. [Google Scholar]
- Intergovernmental Panel on Climate Change (IPCC). AR6 Synthesis Report: Summary for Policymakers; IPCC: Geneva, Switzerland, 2023; Available online: https://www.ipcc.ch/report/ar6/syr/downloads/report/IPCC_AR6_SYR_SPM.pdf (accessed on 20 August 2025).
- Olesen, G.B.; Vikkelsø, A. Sufficiency in European Climate Policies, Four Country NECPs Analysed. Open Res. Eur. 2024, 4, 208. [Google Scholar] [CrossRef]
- Iavorschi, E.; Milici, L.D.; Ifrim, V.C.; Ungureanu, C.; Bejenar, C. A Literature Review on the European Legislative Framework for Energy Efficiency, Nearly Zero-Energy Buildings (nZEB), and the Promotion of Renewable Electricity Generation. Energies 2025, 18, 1436. [Google Scholar] [CrossRef]
- Słupik, S.; Kos-Łabędowicz, J.; Trzęsiok, J. Are You a Typical Energy Consumer? Socioeconomic Characteristics of Behavioural Segmentation Representatives of 8 European Countries. Energies 2021, 14, 6109. [Google Scholar] [CrossRef]
- Statista. Residential Electricity Consumption in Romania by Consumption Bands from 2017 to 2024. Available online: https://www.statista.com/statistics/1382809/romania-electricity-consumption-for-households-by-consumption-bands/ (accessed on 20 August 2025).
- Khafiso, T.; Adekunle, S.A.; Aigbavboa, C. Assessment of Energy-Saving Strategies Mitigating High Energy Usage in Residential Buildings. Prop. Manag. 2025, 43, 540–561. [Google Scholar] [CrossRef]
- Flipo, A.; Alexander-Haw, A.; Breucker, F.; Dütschke, E. Who Is Sufficient, and Why? A Mixed-Methods Approach to the Social Determinants of Sufficiency Lifestyles in the Pursuit of Decarbonisation. Consum. Soc. 2025, 4, 55–74. [Google Scholar] [CrossRef]
- Avila, M.; Méndez, J.I.; Ponce, P.; Peffer, T.; Meier, A.; Molina, A. Energy Management System Based on a Gamified Application for Households. Energies 2021, 14, 3445. [Google Scholar] [CrossRef]
- Chamaret, C.; Guérineau, M.; Mayer, J.C. When Saying “Enough” Is Not Enough: How Cultivating Households’ Mindfulness through Gamification Can Promote Energy Sufficiency. Energy Res. Soc. Sci. 2023, 105, 103294. [Google Scholar] [CrossRef]
- Rai, A.; Patyal, V.S.; Ambekar, S. Women as Catalysts: Eco-Literacy and Adoption of Energy-Efficient Appliances for a Sustainable Lifestyle. Energy Policy 2025, 203, 114650. [Google Scholar] [CrossRef]
- van Valkengoed, A.M.; Abrahamse, W.; Steg, L. To Select Effective Interventions for Pro-Environmental Behaviour Change, We Need to Consider Determinants of Behaviour. Nat. Hum. Behav. 2022, 6, 1482–1492. [Google Scholar] [CrossRef] [PubMed]
- Chatzigeorgiou, I.M.; Andreou, G.T. A Systematic Review on Feedback Research for Residential Energy Behavior Change through Mobile and Web Interfaces. Renew. Sustain. Energy Rev. 2021, 135, 110187. [Google Scholar] [CrossRef]
- Department for Energy Security and Net Zero. Monitoring Smart Meter Energy Savings Using the National Energy Efficiency Data-Framework; Research Report; UK Government: London, UK, 2024.
- Dai, S.; Meng, F.; Wang, Q.; Chen, X. DP2-NILM: A Distributed and Privacy-Preserving Framework for Non-Intrusive Load Monitoring. Renew. Sustain. Energy Rev. 2024, 191, 114091. [Google Scholar] [CrossRef]
- Góis, J.; Pereira, L. Appliance-Specific Noise-Aware Hyperparameter Tuning for Enhancing Non-Intrusive Load Monitoring Systems. Energies 2025, 18, 3847. [Google Scholar] [CrossRef]
- Liu, Y.; Wang, Y.; Ma, J. Non-Intrusive Load Monitoring in Smart Grids: A Comprehensive Review. arXiv 2024, arXiv:2403.06474. [Google Scholar] [CrossRef]
- Xue, J.; Zhang, Y.; Wang, X.; Wang, Y.; Tang, G. Towards Real-World Deployment of NILM Systems: Challenges and Practices. In Proceedings of the 2024 IEEE International Conference on Sustainable Computing and Communications (SustainCom), Chengdu, China, 16–23 October 2024; IEEE: Piscataway, NJ, USA, 2024; pp. 16–23. [Google Scholar]
- EVRYO. Economisește Consumul de Energie Electrică. Available online: https://evryo.ro/ro/media/comunicate-de-presa/1024-economiseste-consumul-de-energie-electrica (accessed on 5 August 2025).
- PPC Energy. Cum Alegi Aparatul de Aer Condiționat. Available online: https://www.ppcenergy.ro/electripedia/tehnologii-si-inovatii/cum-alegi-aparatul-de-aer-conditionat (accessed on 5 August 2025).
- România Eficientă. Cum Este Consumata Energia într-o Locuință Obișnuită și Care Este Topul Devoratorilor de Electricitate. Available online: https://www.romania-eficienta.ro/cum-este-consumata-energia-intr-o-locuinta-obisnuita-si-care-este-topul-devoratorilor-de-electricitate/ (accessed on 5 August 2025).
- Wang, Z.; Srinivasan, R.S. Classification of Household Appliance Operation Cycles: A Case-Study Approach. Energies 2015, 8, 10522–10536. [Google Scholar] [CrossRef]
- Van den Broek, K.L. Household Energy Literacy: A Critical Review and a Conceptual Typology. Energy Res. Soc. Sci. 2019, 57, 101256. [Google Scholar] [CrossRef]
- Athanasiadis, C.L.; Papadopoulos, T.A.; Kryonidis, G.C.; Doukas, D.I. A Holistic and Personalized Home Energy Management System With Non-Intrusive Load Monitoring. IEEE Trans. Consum. Electron. 2024, 70, 6725–6737. [Google Scholar] [CrossRef]
- Gkalinikis, N.V.; Nalmpantis, C.; Vrakas, D.; Chatzigeorgiou, S.; Athanasiadis, C.; Doukas, D. RHEA: Residential Home Energy Advisor. In Proceedings of the 2025 10th International Conference on Smart and Sustainable Technologies (SpliTech), Bol and Split, Croatia, 25–28 June 2025; pp. 1–6. [Google Scholar]
| Parameter | Value |
|---|---|
| Mean | 8.555 |
| Standard Error | 4.531 |
| Median | 2.377 |
| Mode | 1.265 |
| Standard Deviation (σ) | 31.389 |
| Sample Variance | 985.278 |
| Kurtosis | 19.913 |
| Skewness | 3.976 |
| Range | 205.740 |
| Minimum | −24.186 |
| Maximum | 181.555 |
| Sum | 410.651 |
| Count (n) | 48 |
| Kolmogorov–Smirnov D-Statistic | 0.258 |
| p-Value | <0.01 |
| A1. | μsample | μsupplier | A2 | μsample | μsupplier | A3 | μsample | μsupplier | A4 | μsample | μsupplier | A5 | μsample | μsupplier | A6 | μsample | μsupplier | A7 | μsample | μsupplier |
|---|---|---|---|---|---|---|---|---|---|---|---|---|---|---|---|---|---|---|---|---|
| 19.98 | 23.912 | 18 | 8.1 | 24.745 | 55 | 45 | 31.625 | 35 | NA | 9.747 | 10 | 54 | 30.293 | 30 | NA | 18.869 | 20 | NA | 43.447 | 54 |
| 13.995 | 15 | 35 | 9 | 43.2 | 90 | 315 | ||||||||||||||
| 58.68 | NA | 36 | 45 | 94.5 | NA | NA | ||||||||||||||
| 37.92 | 30 | 90 | NA | 5.8 | 39.75 | 180 | ||||||||||||||
| 6.375 | 15.39 | 22.5 | 4 | 4.98 | 13.65 | 4 | ||||||||||||||
| 37.2 | 42 | 20.4 | NA | 21 | NA | 54 | ||||||||||||||
| 21.8 | 111 | 17.5 | NA | 12.6 | 0.4 | 2.4 | ||||||||||||||
| 24.6 | 4.2 | 4.14 | 12 | 52.5 | 4.5 | 84 | ||||||||||||||
| 19.5 | 135 | 22.5 | 22.5 | 12 | 31.2 | NA | ||||||||||||||
| 8.55 | NA | 84 | NA | NA | NA | 66 | ||||||||||||||
| 66.78 | NA | 42.6 | NA | 27.6 | 48.6 | 54 | ||||||||||||||
| 35.07 | 33 | 48 | 2.4 | 11.07 | 54 | 72.9 | ||||||||||||||
| 17.382 | 83.25 | 36 | 6 | 77.4 | NA | 21.6 | ||||||||||||||
| 2.34 | 5.04 | 1.8 | 3.6 | 6 | 11.52 | 20.4 | ||||||||||||||
| 3.55 | 48 | 15.75 | NA | 27.6 | 11.7 | NA | ||||||||||||||
| 0.81 | 4.5 | 72 | NA | 7.2 | NA | NA | ||||||||||||||
| 4.43 | 1.87 | 4.23 | 0.9 | 0.8 | NA | 72 | ||||||||||||||
| 7.68 | 27 | 105 | 1.68 | 15.73 | 1.8 | NA | ||||||||||||||
| 22.08 | NA | 27 | 9 | 6.3 | 29.9 | NA | ||||||||||||||
| 2.64 | 8.1 | 16.56 | NA | 25.65 | NA | NA | ||||||||||||||
| 45.36 | 3.36 | 40.05 | 0.675 | 69 | 2.7 | 1.44 | ||||||||||||||
| 39.51 | 15 | 22 | NA | 69 | 69.5 | 12.41 | ||||||||||||||
| 24.708 | 9 | 12 | 3.6 | 15 | 6.411 | 15 | ||||||||||||||
| 83.55 | 1.62 | 5.76 | 2.28 | 28.5 | 7.44 | 46.5 | ||||||||||||||
| 60.33 | 8.64 | 5.711 | 18 | 6 | NA | 27.72 | ||||||||||||||
| 57.42 | 4.07 | 7.015 | 8.4 | 5.25 | NA | NA | ||||||||||||||
| 22.43 | 21.12 | 35.6 | 2 | 23.67 | NA | 81.9 | ||||||||||||||
| 9.45 | 13.2 | 15.25 | NA | NA | NA | 5.775 | ||||||||||||||
| 7.05 | 14.06 | 2.25 | NA | 15 | 13.8 | 4.8 | ||||||||||||||
| 31.78 | 15 | 45.5 | 16.5 | 42 | 1.95 | 39 | ||||||||||||||
| 2.9 | 12.54 | 46.044 | 4.2 | NA | 0.6754 | NA | ||||||||||||||
| 7.28 | 13.11 | 24.994 | 0.975 | 10.83 | 2.925 | NA | ||||||||||||||
| 16.89 | 29.4 | 19.92 | 15 | 78.984 | 45 | NA | ||||||||||||||
| 15.901 | 0.549 | 7.05 | 1.35 | 5.25 | 18 | 9.99 | ||||||||||||||
| 4.95 | 41.4 | 21.18 | NA | 5.25 | 0.915 | 42 | ||||||||||||||
| 46.5 | 4.656 | 3.7368 | 24 | NA | 8.1 | NA | ||||||||||||||
| 24.96 | 4.035 | 17.917 | NA | NA | 7.2 | 4.05 | ||||||||||||||
| 10.440 | 4.833 | 15.48 | NA | NA | 59.887 | 14.16 | ||||||||||||||
| 51.75 | 31.109 | 19.98 | 24 | 21 | 2.46 | 72 | ||||||||||||||
| 23.475 | 12.44 | 56.34 | 4.8 | 9.75 | 1.95 | NA | ||||||||||||||
| 13.5 | 29.4 | 20.4 | NA | 7.999 | NA | NA | ||||||||||||||
| 25.35 | NA | 17.76 | 3 | 42 | NA | NA | ||||||||||||||
| 44.01 | 9 | 43.2 | 2.7 | 10.5 | 12.405 | 5.4 | ||||||||||||||
| 6.405 | 37.8 | 30.06 | 1.407 | NA | 12.15 | 7.2 | ||||||||||||||
| 5.4 | 14.406 | 22.68 | 24 | NA | 8.1 | NA | ||||||||||||||
| 24.6 | 4.2 | 184.14 | 12 | 54.6 | 4.5 | 84 | ||||||||||||||
| 31.08 | 7.5 | 17.25 | NA | 4.8 | 42 | NA | ||||||||||||||
| 92.58 | 27 | 43.92 | 25.2 | 26.4 | 18.9 | 15 | ||||||||||||||
| 22.62 | 16.14 | 18 | 3 | 42 | 32.4 | 28.35 | ||||||||||||||
| 11.106 | 56.25 | 36 | 7.5 | 12 | 12 | NA | ||||||||||||||
| 8.19 | 50.4 | 44.33 | 16.8 | 22.56 | 0.1512 | 0.5376 | ||||||||||||||
| 0 | 97.05 | 40.35 | NA | 235.35 | 12.6 | NA | ||||||||||||||
| 3 | 24.99 | 12.33 | 6.375 | 4 | NA | NA | ||||||||||||||
| 22.258 | 23.552 | 13.41 | 13.2 | 46.68 | 3.15 | 6.75 | ||||||||||||||
| 7.08 | 9 | 25.8 | 3.6 | 4.5 | 10.5 | 6.93 |
| High-Duration Consumer | High-Load Consumer | |||||||||||||||
|---|---|---|---|---|---|---|---|---|---|---|---|---|---|---|---|---|
| Area | Residential Unit type | Surface Area (m2) | No. of Occupants | ID | Gender | Age | Occupation | Education Level | Monthly Duration of Individual Consumption (h/Month) | ID | Gender | Age | Occupation | Education Level | Monthly Individual Electricity Consumption (kWh/ Month) | Hourly Specific Consumption (kWh/ h) |
| rural | house | 100 | 3 | P1 | F | 36–65 | employed | ISCED 3 | 843.9 | P1 | F | 36–65 | employed | ISCED 3 | 95.319 | 0.1129 |
| rural | house | 376 | 3 | P3 | M | 20–35 | unemployed | ISCED 7 | 997.5 | P3 | M | 20–35 | unemployed | ISCED 7 | 240.165 | 0.2407 |
| rural | house | 350 | 5 | P2 | F | 36–65 | employed | ISCED 3 | 1158 | P2 | F | 36–65 | employed | ISCED 3 | 56.199 | 0.0485 |
| rural | house | 660 | 4 | P2 | F | 36–65 | employed | ISCED 7 | 1469.4 | P2 | F | 36–65 | employed | ISCED 7 | 141.779 | 0.0964 |
| urban | flat | 27 | 2 | P1 | F | 20–35 | student | ISCED 7 | 867.69 | P1 | F | 20–35 | student | ISCED 7 | 56.707 | 0.0653 |
| urban | flat | 150 | 4 | P4 | F | 36–65 | employed | ISCED 3 | 952.5 | P4 | F | 36–65 | employed | ISCED 3 | 232.005 | 0.2435 |
| urban | flat | 52 | 4 | P2 | F | 36–65 | employed | ISCED 3 | 999.63 | P2 | F | 36–65 | employed | ISCED 3 | 105.467 | 0.1055 |
| rural | house | 112 | 4 | P3 | F | 36–65 | employed | ISCED 3 | 1097.4 | P3 | F | 36–65 | employed | ISCED 3 | 171.087 | 0.1559 |
| urban | house | 80 | 4 | P2 | M | 9–19 | pupil | ISCED 3 | 978.75 | P4 | M | 36–65 | employed | ISCED 7 | 148.548 | |
| urban | flat | 40 | 2 | P1 | M | 20–35 | employed | ISCED 3 | 405 | P1 | M | 20–35 | employed | ISCED 3 | 91.5 | 0.2259 |
| urban | house | 85 | 4 | P1 | F | 36–65 | employed | ISCED 3 | 2019 | P1 | F | 36–65 | employed | ISCED 3 | 209.005 | 0.1035 |
| urban | flat | 250 | 4 | P4 | F | 36–65 | employed | ISCED 3 | 619.5 | P4 | F | 36–65 | employed | ISCED 3 | 188.435 | 0.3041 |
| urban | house | 170 | 4 | P3 | M | 36–65 | employed | ISCED 3 | 1407 | P1 | F | 20–35 | student | ISCED 7 | 80.667 | |
| urban | flat | 60 | 2 | P1 | F | 20–35 | student | ISCED 6 | 358.5 | P1 | F | 20–35 | student | ISCED 6 | 42.562 | 0.1187 |
| urban | flat | 74 | 4 | P4 | F | 20–35 | student | ISCED 7 | 1089 | P2 | F | 36–65 | employed | ISCED 3 | 86.070 | |
| urban | flat | 16 | 2 | P1 | M | 20–35 | student | ISCED 3 | 306 | P2 | F | 20–35 | student | ISCED 3 | 54.09 | |
| urban | flat | 56 | 4 | P3 | F | 36–65 | employed | ISCED 2 | 1302.87 | P3 | F | 36–65 | employed | ISCED 2 | 68.892 | 0.0528 |
| rural | house | 120 | 4 | P2 | F | 36–65 | unemployed | ISCED 3 | 1322.799 | P2 | F | 36–65 | unemployed | ISCED 3 | 123.482 | 0.0933 |
| rural | house | 122 | 4 | P2 | F | 36–65 | unemployed | ISCED 2 | 3453 | P2 | F | 36–65 | unemployed | ISCED 2 | 113.776 | 0.0329 |
| rural | house | 160 | 4 | P2 | F | over 65 | retired | ISCED 2 | 1223.1 | P2 | F | over 65 | retired | ISCED 2 | 43.720 | 0.0357 |
| rural | house | 150 | 4 | P3 | M | 36–65 | employed | ISCED 3 | 627 | P2 | F | 36–65 | employed | ISCED 3 | 102.135 | |
| urban | flat | 53 | 3 | P2 | M | 20–35 | employed | ISCED 7 | 1833 | P2 | M | 20–35 | employed | ISCED 7 | 291.437 | 0.1589 |
| urban | flat | 75 | 3 | P2 | F | 36–65 | employed | ISCED 8 | 3303.3 | P3 | M | 36–65 | employed | ISCED 8 | 61.415 | |
| rural | house | 54 | 3 | P2 | F | 36–65 | unemployed | ISCED 3 | 1140 | P2 | F | 36–65 | unemployed | ISCED 3 | 136.2 | 0.1194 |
| urban | flat | 50 | 1 | P1 | M | 20–35 | student | ISCED 7 | 2100 | P1 | M | 20–35 | student | ISCED 7 | 172.191 | 0.0819 |
| rural | house | 90 | 2 | P1 | F | 36–65 | employed | ISCED 3 | 1293 | P1 | F | 36–65 | employed | ISCED 3 | 75.554 | 0.0584 |
| rural | house | 100 | 3 | P1 | F | 36–65 | employed | ISCED 2 | 872.4 | P1 | F | 36–65 | employed | ISCED 2 | 139.069 | 0.1594 |
| urban | flat | 47 | 3 | P1 | F | 36–65 | unemployed | ISCED 3 | 487.5 | P1 | F | 36–65 | unemployed | ISCED 3 | 54 | 0.1107 |
| urban | flat | 36 | 2 | P2 | M | 20–35 | employed | ISCED 7 | 1168.245 | P1 | F | 20–35 | student | ISCED 7 | 57.581 | |
| rural | house | 70 | 2 | P1 | F | 36–65 | unemployed | ISCED 3 | 3040.5 | P1 | F | 36–65 | unemployed | ISCED 3 | 222.574 | 0.0732 |
| urban | flat | 140 | 3 | P1 | F | 36–65 | unemployed | ISCED 3 | 1156.8 | P1 | F | 36–65 | unemployed | ISCED 3 | 60.619 | 0.0524 |
| rural | house | 90 | 5 | P2 | F | 36–65 | unemployed | ISCED 3 | 758.7 | P2 | F | 36–65 | unemployed | ISCED 3 | 27.469 | 0.0362 |
| rural | house | 140 | 4 | P1 | F | 36–65 | employed | ISCED 7 | 1480.98 | P1 | F | 36–65 | employed | ISCED 7 | 155.717 | 0.1051 |
| urban | flat | 55 | 2 | P2 | F | 20–35 | employed | ISCED 7 | 637.5 | P2 | F | 20–35 | employed | ISCED 7 | 49.333 | 0.0773 |
| urban | flat | 56 | 3 | P1 | F | 20–35 | employed | ISCED 7 | 532.5 | P3 | F | 20–35 | student | ISCED 7 | 77.018 | |
| rural | house | 112 | 8 | P3 | F | 9–19 | pupil | ISCED 3 | 481.5 | P1 | F | 36–65 | unemployed | ISCED 7 | 47.708 | |
| urban | flat | 42 | 2 | P1 | M | 20–35 | student | ISCED 7 | 1072.5 | P1 | M | 20–35 | student | ISCED 7 | 36.401 | 0.0339 |
| urban | flat | 53 | 4 | P1 | M | 20–35 | student | ISCED 7 | 1149.03 | P3 | M | 20–35 | student | ISCED 7 | 33.774 | |
| urban | house | 170 | 5 | P4 | M | 36–65 | employed | ISCED 3 | 1177.2 | P2 | F | 20–35 | unemployed | ISCED 3 | 85.906 | |
| rural | house | 300 | 4 | P1 | M | 36–65 | employed | ISCED 3 | 1689 | P2 | F | 36–65 | employed | ISCED 3 | 78.998 | |
| rural | house | 130 | 4 | P1 | F | 36–65 | unemployed | ISCED 2 | 1269.579 | P4 | F | 20–35 | student | ISCED 7 | 37.909 | |
| rural | house | 180 | 5 | P4 | F | 36–65 | unemployed | ISCED 3 | 1635 | P4 | F | 36–65 | unemployed | ISCED 3 | 76.888 | 0.0470 |
| rural | house | 266 | 5 | P2 | F | 36–65 | employed | ISCED 3 | 1242 | P5 | F | over 65 | retired | ISCED 3 | 46.08 | |
| urban | flat | 100 | 3 | P3 | M | 20–35 | employed | ISCED 6 | 645.51 | P1 | F | 20–35 | employed | ISCED 3 | 53.472 | |
| urban | flat | 47 | 3 | P1 | M | 36–65 | employed | ISCED 3 | 914.4 | P2 | F | 36–65 | employed | ISCED 3 | 42.016 | |
| rural | house | 65 | 4 | P3 | F | 36–65 | employed | ISCED 3 | 1097.4 | P3 | F | 36–65 | employed | ISCED 3 | 171.087 | 0.1559 |
| rural | house | 146 | 4 | P1 | M | 36–65 | employed | ISCED 3 | 553.5 | P4 | M | 9–19 | pupil | ISCED 3 | 62.39 | |
| urban | flat | 100 | 4 | P2 | M | 36–65 | employed | ISCED 3 | 3258 | P2 | M | 36–65 | employed | ISCED 3 | 122.862 | 0.0377 |
| rural | house | 150 | 3 | P2 | M | 36–65 | employed | ISCED 7 | 1302 | P1 | F | 36–65 | unemployed | ISCED 3 | 169.537 | |
| rural | house | 160 | 5 | P2 | F | 36–65 | unemployed | ISCED 2 | 675 | P2 | F | 36–65 | unemployed | ISCED 2 | 70.199 | 0.1039 |
| urban | house | 180 | 4 | P3 | M | 36–65 | employed | ISCED 3 | 1218.06 | P4 | F | 36–65 | employed | ISCED 7 | 64.434 | |
| rural | house | 150 | 5 | P1 | F | 36–65 | unemployed | ISCED 6 | 1320 | P1 | F | 36–65 | unemployed | ISCED 6 | 1106.22 | 0.8380 |
| urban | flat | 33 | 2 | P1 | F | 20–35 | student | ISCED 7 | 1039.98 | P1 | F | 20–35 | student | ISCED 7 | 58.181 | 0.0559 |
| urban | flat | 67 | 4 | P3 | M | 20–35 | student | ISCED 7 | 1526.4 | P3 | M | 20–35 | student | ISCED 7 | 60.061 | 0.0393 |
| urban | flat | 42 | 2 | P1 | M | 20–35 | employed | ISCED 6 | 2032.8 | P1 | M | 20–35 | employed | ISCED 6 | 71.754 | 0.0352 |
Disclaimer/Publisher’s Note: The statements, opinions and data contained in all publications are solely those of the individual author(s) and contributor(s) and not of MDPI and/or the editor(s). MDPI and/or the editor(s) disclaim responsibility for any injury to people or property resulting from any ideas, methods, instructions or products referred to in the content. |
© 2025 by the authors. Licensee MDPI, Basel, Switzerland. This article is an open access article distributed under the terms and conditions of the Creative Commons Attribution (CC BY) license (https://creativecommons.org/licenses/by/4.0/).
Share and Cite
Donciu, C.; Serea, E.; Temneanu, M.C. Residential Electricity Consumption Behaviors in Eastern Romania: A Non-Invasive Survey-Based Assessment of Consumer Patterns. Energies 2025, 18, 4883. https://doi.org/10.3390/en18184883
Donciu C, Serea E, Temneanu MC. Residential Electricity Consumption Behaviors in Eastern Romania: A Non-Invasive Survey-Based Assessment of Consumer Patterns. Energies. 2025; 18(18):4883. https://doi.org/10.3390/en18184883
Chicago/Turabian StyleDonciu, Codrin, Elena Serea, and Marinel Costel Temneanu. 2025. "Residential Electricity Consumption Behaviors in Eastern Romania: A Non-Invasive Survey-Based Assessment of Consumer Patterns" Energies 18, no. 18: 4883. https://doi.org/10.3390/en18184883
APA StyleDonciu, C., Serea, E., & Temneanu, M. C. (2025). Residential Electricity Consumption Behaviors in Eastern Romania: A Non-Invasive Survey-Based Assessment of Consumer Patterns. Energies, 18(18), 4883. https://doi.org/10.3390/en18184883


