Article

Numerical Modeling of Potential CO2-Fed Enhanced Geothermal System (CO2-EGS) in the Gorzów Block, Poland

1
Mineral and Energy Economy Research Institute, Polish Academy of Sciences, Wybickiego 7A, 31-261 Kraków, Poland
2
Faculty of Geology, Geophysics and Environmental Protection, AGH University, Mickiewicza 30 Avenue, 30-059 Krakow, Poland
3
Faculty of Energy and Fuels, AGH University, Mickiewicza 30 Avenue, 30-059 Krakow, Poland
*
Author to whom correspondence should be addressed.
Energies 2025, 18(18), 4825; https://doi.org/10.3390/en18184825
Submission received: 25 April 2025 / Revised: 18 August 2025 / Accepted: 22 August 2025 / Published: 11 September 2025
(This article belongs to the Special Issue The Status and Development Trend of Geothermal Resources)

Abstract

This article presents the results of numerical modeling for a hypothetical CO2-EGS system in the volcanic rocks of the Gorzów Block, Poland. Modeling was carried out in the following stages: in phase 0, modeling of the fracturing process was performed, as a result of which the permeability distribution for the newly created fractured zone was obtained. Next, the process of saturating the EGS reservoir with CO2 was modeled until pure CO2 could enter the production well (phase 1). Then, a multi-variant simulation of heat production was performed (phase 2). The obtained results allowed for drawing interesting conclusions: (1) the duration of phase 1 may take several years unless a sufficiently high injection rate of CO2 is supplied, (2) the higher the injection rate of CO2, the lower the cumulative storage ratio of CO2, and (3) most of the CO2 storage in the formation takes place in phase 1, while even 92% of the CO2 injected in phase 2 can be recovered via the production well. Despite the environmental benefits connected with structural trapping of CO2, the Gorzów Block has probably too low formation temperature (145 °C) and too low stimulated volume (~0.1 km3) to deliver satisfactory and stable thermal output.

1. Introduction

Carbon dioxide (CO2) emissions from anthropogenic sources can be partially reduced by geological carbon storage (GCS), known also as carbon capture and storage (CCS). It relies on the fact that CO2 is injected and stored in geologic formations such as depleted hydrocarbon reservoirs, saline aquifers, and underground caverns [1,2,3]. Recently, i.e., starting from the beginning of the 21st century, the use of CO2 as a working medium in installations for coupled carbon dioxide storage and geothermal extraction in an enhanced geothermal system (EGS) has been considered an alternative method of reducing carbon dioxide emissions into the atmosphere [4,5,6,7]. Petrothermal systems, unlike hydrothermal systems, do not contain sufficient fluid volume for heat extraction. Natural hot dry rock (HDR) systems, which use petrothermal resources, have limited capacity for heat extraction due to their low permeability and porosity. For this purpose, the concept of the enhanced geothermal system (EGS) was developed which is based on the artificial stimulation (hydraulic, chemical, thermal, or mixed) of low-permeable HDR. Thanks to stimulation processes, an extended fracture network is created, forming a reservoir suitable for heat extraction [7].
In classical EGS systems, water is used as the working medium. However, studies indicate that 10–20% of water is lost during stimulation and operation [6,7]. The application of supercritical carbon dioxide (often referred to as sCO2, but for consistency, in this article we will use CO2 for both sub- and supercritical carbon dioxide) as a working fluid in EGS is considered an alternative to traditional methods based on water. By using CO2 in EGS, higher mass flow rates and greater energy recovery can be achieved compared with water [6,8,9]. According to the International Energy Agency (IEA) report from September 2022, to meet the emission goals, at least 650 Mt of anthropogenic CO2 is required to be stored annually by 2030. Currently, only approximately 40 Mt per year (6% of the planned amount) is the CO2 storage capacity of CCS projects on a large and commercial scale [3].
Many countries, including Poland, are researching coupled carbon storage and geothermal extraction in a CO2-enhanced geothermal system. Industrial use of the aforementioned technologies is limited due to high costs and safety issues. EGS technology was introduced in the 1970s at Fenton Hill [10,11,12]. Since then, it has been developed over the past 50 years in several countries all over the world [12]. EGS technology was established, among others, in France (project at Soultz-sous-Forêts) [11,13], Italy, Switzerland, Germany, the UK, Tasmania, India, Philippines, Japan, South Korea, the USA, and Australia [11,14]. The resources base for engineered geothermal systems was assessed in Great Britain, which can be available for the generation of electricity in some regions. Busby and Terrington indicated that improvements in drilling will allow EGS exploitation all over the country [15]. In Japan, in 1986, CREPI initiated the Ogachi project to determine the feasibility of an HDR geothermal power plant that works based on a multi-layer reservoir. Also, at the Ogachi EGS geothermal field, experimental injection of CO2 into the geological formation was conducted [16,17,18,19]. In Poland, for more than 10 years, scientific and research work has been carried out in aspects of the application of HDR and EGS technologies [14,20]. Uliasz-Misiak et al. [21] indicated that about 10% of injected CO2 into geological formations is stored permanently in the rock mass, and this should be considered when running simulations.
The 3D numerical modeling can be used for multivariant simulations of CO2 injection and exploitation with a forecast of reservoir behavior over time. The mass flow and heat extraction rates can be simulated using numerical modeling for EGS systems that use CO2 or water as a heat transmission fluid [5,22,23]. Pruess [22] investigated the possibility of using CO2 as a working fluid to extract heat from HDR. The results indicated that CO2 is superior to water with 50% larger net heat extraction rates. It was also concluded in one of the works by Pruess [5] that the buoyancy effect of CO2 has a tremendous impact on CO2 migration paths in the reservoir, thus different paces of cold front propagation at different depths may result in a wide range of temperatures of CO2 entering the production well. However, Pruess also indicated that further exploration and assessment of this technology should be conducted, especially in terms of the injection/production behavior of systems operated with CO2. Liu et al. [24] presented numerical modeling of the cooling effect in a simplified, idealistic geological model which was established based on the Guantao formation and its overlying and underlying formations in the Binhai district in Tianjin (China). This effect was induced by simulated injection of CO2 and cooled geothermal water into geological formations. It was also indicated that it may take several years for pure CO2 to reach the production well.
This article pays a lot of attention to the phase preceding energy production, namely, the time when CO2 is pumped to displace the original pore fluid or fluid that was injected during fracturing. So far, only a few authors have devoted enough attention to this issue. Among the few works, it is worth mentioning one by Liu et al. [24]. Although he was modelling a CO2-plume geothermal system with a high natural porosity and permeability, it can be concluded that the CO2 fraction in the reservoir will increase slowly with time, due to the large volume of the pore space that is filled originally with water. In the case of conventional (permeable) reservoirs, the CO2 saturation level in production wells may reach a plateau at 30–40%, as estimated by Miecznik et al. using 3D numerical modeling [25].
Depending on many factors, including but not limited to fractured zone shape and volume, permeability, distance between wells, and the injection rate of CO2, the time to reach the desired saturation of gaseous CO2 in the production well may vary significantly. This research focused on determining the CO2 mass flow needed to achieve full CO2 saturation at the production well inlet within an acceptable time. For this purpose, a 3D numerical model was developed for the Gorzów Block area in western Poland. As Poland is the sixth biggest CO2 emitter in Europe [2], any solutions to reduce greenhouse gas emissions are worth considering. The CO2-EGS technology presented in this article is one of them, taking into account the huge capacity of geological structures that enable permanent storage of carbon dioxide. Previous research on EGS structures in Poland were based on the assumption of using water as a heat-transfer fluid [26,27]. The results of these studies were used in publication [28] as a basis for identifying CO2 emitters in Poland. The present work is the first in Poland to analyze the feasibility of using CO2 as a working fluid in a CO2-EGS system at a specific location, incorporating hydraulic fracturing modeling under site-specific geological conditions and multi-scenario heat production simulations. These results constitute a key component of the Energizers project, partial outcomes of which have also been presented in publications [20,29], among others.

2. Materials and Methods

2.1. Geological Setting and the Conceptual Model of the Gorzów Block

The Gorzów Block is a regional geological unit that is located in the northwestern part of Poland, whose geological structure is quite well recognized due to the presence of oil and gas deposits in the Zechstein formation [30,31,32,33]. The Gorzow Block is distinguished on the basis of the extent and thickness differentiation of Upper Cretaceous formations and the distribution of local halokinetic and halotectonic structures in the Zechstein-Mesozoic complex [33]. This structure, especially the Lower Permian formation, is considered one of the most promising areas of HDR-type rocks in Poland, characterized by low porosity and permeability [26,33,34]. However, for CO2 storage in this formation, additional stimulation techniques need to be applied to increase its permeability [19,35].
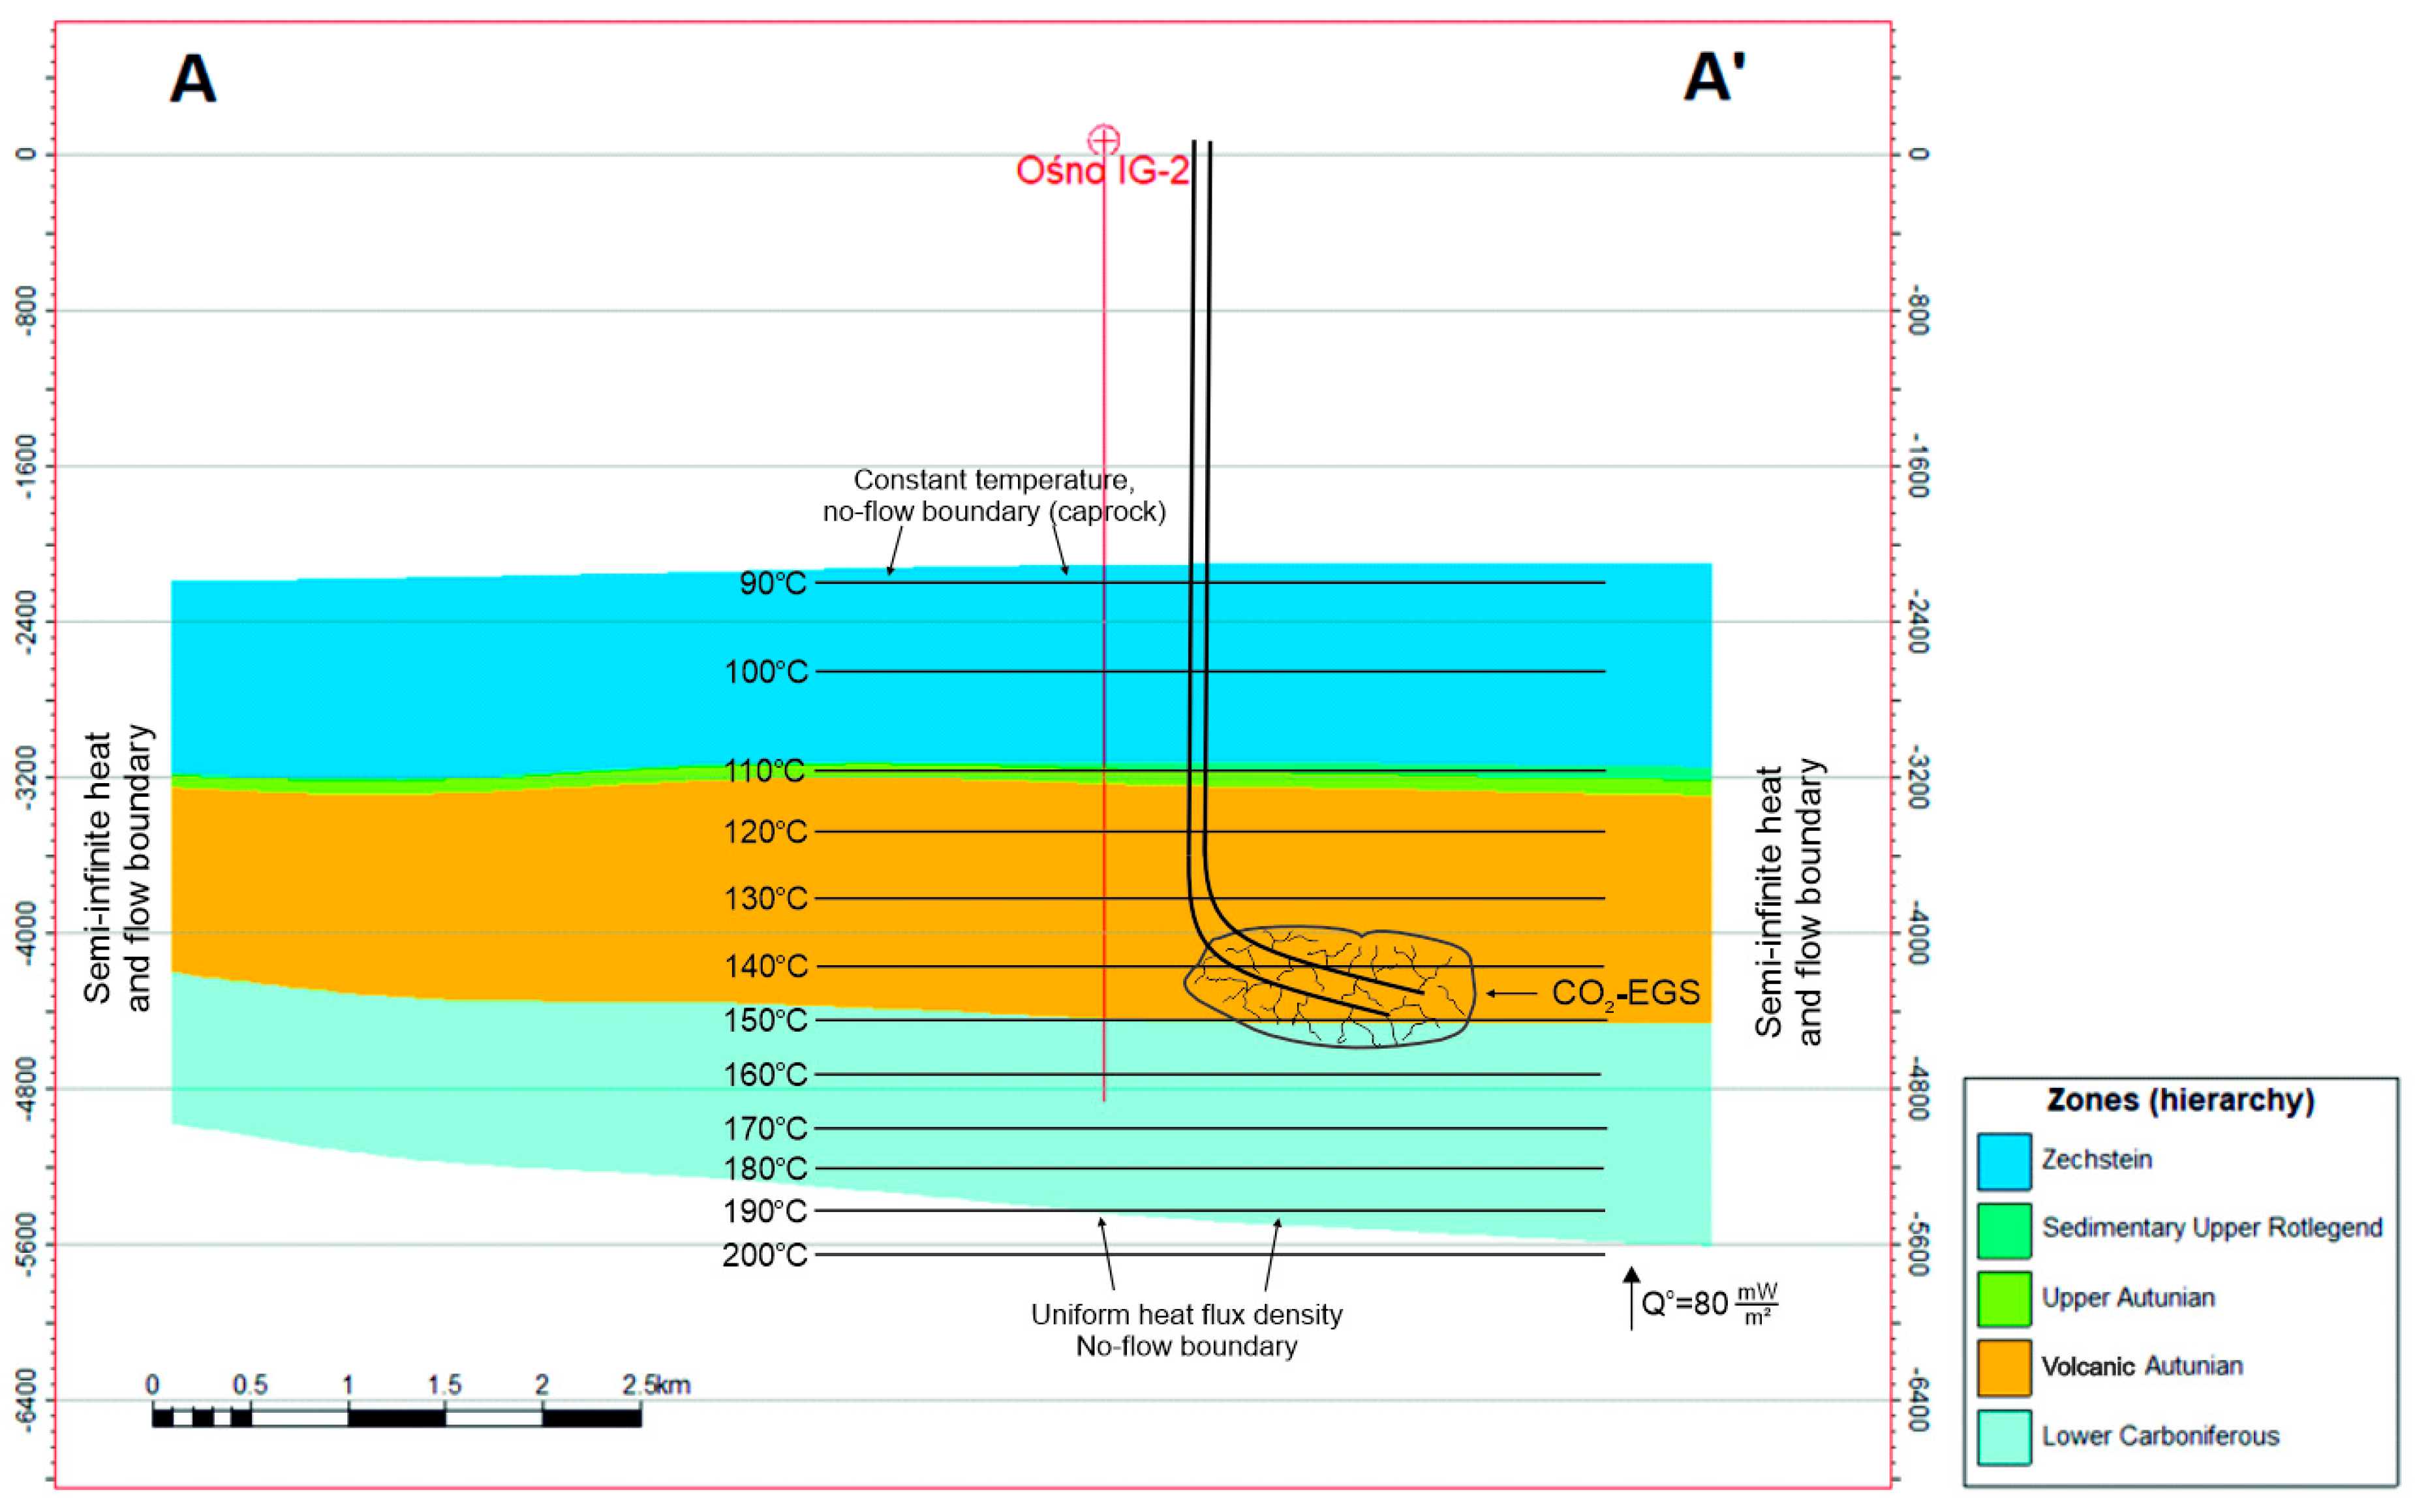
A regional model was delineated covering an area of approximately 7245 km2 for which investigation was carried out. In the area of the regional model, 120 wells with a depth of at least 3000 m were drilled to penetrate Upper Permian hydrocarbon formations (Figure 1). Of those identified, only 17 boreholes are 3500 m or deeper, and only five reach the Carboniferous. The deepest well in that area is the Ośno IG-2 well, which is 4950 m deep. The modeled domain consists of Zechstein formations, Rotliegend sedimentary rocks, Autunian formations (sedimentary and volcanic), and Lower Carboniferous rocks. In the Ośno IG-2 borehole, the Zechstein top was reached at a depth of 2190 m, and the thickness of the formation is 1019 m. In this area, the Zechstein thickness varies from about 950 m to about 1100 m and consists primarily of limestone and dolomite. Due to high thickness and low permeability, Zechstein sediments should be considered as sealing layers, preventing the migration of CO2 upward.
The conceptual model for the 3D numerical modeling within the Gorzów Block for a potential CO2-fed enhanced geothermal system (CO2-EGS) was located around the Ośno IG-2 well. The model area (8 km × 8 km, Figure 1) was selected based on a preliminary complex analysis of both regional structures and the distribution of the main petrophysical parameters of rocks (density, porosity, permeability, shale content), as well as laboratory testing of core samples from this borehole. Based on the course of seismic profiles, no faults have been identified in the modeled area.
The heat flux density within the Gorzów Block according to Szewczyk and Gientka is about 90–100 mW/m2, and locally even above 100 mW/m2, taking into account paleoclimatic correction [36]. However, according to Plewa [37] and Majorowicz et al. [38,39,40], the terrestrial heat flux density is only 75–80 mW/m2. Variations in heat flux density estimates can result from several factors, including inaccurate laboratory measurements of rock thermal conductivity due to a failure to replicate actual reservoir conditions (such as temperature, pressure, and fluid saturation); insufficient sampling frequency of rock cores for laboratory analysis; and conducting temperature profiling in the well under unsteady conditions [40,41]. From the given range of heat flux density, the values proposed by Plewa or Majorowicz seem to be closer to the actual values, which was demonstrated at the stage of calibrating the natural state model (see Section 2.3.1). Nevertheless, it is certain that the study area is a region with one of the highest values of heat flow density in Poland—which causes temperatures at a depth of 3 km below ground level to exceed 100 °C [35].
Based on the analysis of well log data from the deepest well in this region, i.e., Ośno IG-2, it was found that the average geothermal gradient along the entire length of the well is around 30 °C/km. However, below 4000 m depth, the thermal gradient rises to 3.3 °C/100 m. Based on the well log analysis, namely, porosity and shale content logs, the depth interval indicated for hydraulic fracturing is 4100–4300 m b.s.l. According to borehole data from the Ośno IG-2 well, the temperature at these depths varies from 139 °C to 145 °C (Figure 2).
The main petrophysical parameters of rocks were formulated based on the available borehole data, as well as recent studies on drill cores [35]. The greatest shale content was recorded in the Upper Rotliegend sedimentary formation, ranging from 6.75% to 71.1% (average 30.3%). However, this formation has a small thickness within the boundaries of the local model (ca. 80 m). In the Volcanic Autunian rocks, this parameter ranges from 0.28% to 44.9% (average 12.4%).
The bulk density recorded in boreholes located within the boundaries of the local model in the Volcanic Autunian is from 2.34 to 2.66 g/cm3, with the average value of 2.56 g/cm3. In the Lower Carboniferous formation (which lies below the Volcanic Autunian), the average value of the bulk density of the rocks is 2.64 g/dm3.
Porosity recorded in three deep wells located in the area of the local model in Volcanic Autunian ranges from 0 to 14% (average 6%), and on a regional scale, porosity varies from 0 to 29%. In the Lower Carboniferous formation (which lies below the Volcanic Autunian), the average value of the porosity of rocks is 4%. The Upper Autunian rocks, which lie above the Volcanic Autunian, have average porosity of 7%, and the overlying Zechstein formation has porosity estimated at only 1%.
The permeability recorded in wells within the local model area in the Volcanic Autunian formation is up to 0.5 mD (on average 0.1 mD). However, at the depths selected as the most promising for fracturing, near the Ośno IG-2 well (4100–4300 m b.s.l.), the average porosity there is 3%, while the average permeability is only 0.003 mD. For the Upper Autunian rocks, which lie above the Volcanic Autunian, permeability varies from 0.14 to 0.65 mD (on average 0.27 mD), while for the Lower Carboniferous, the average value of permeability is only 0.004 mD. Therefore, the middle to bottom parts of the Volcanic Autunian formations were selected as the most suitable for the CO2-EGS location, taking into account their low porosity, low permeability, relatively high temperature, and the presence of sealing formations above (Figure 3).

2.2. Model Workflow

To analyze the behavior of supercritical CO2 as a working fluid in a deep, hot rock formation, a 3D numerical model was developed for the area marked as the local model in Figure 1. This model is 7800 × 8600 × 500 m in size in the X, Y, and Z directions, respectively. The simulation code used is TOUGH3 v. 1.0 [42,43]. Fluid properties, e.g., density, dynamic viscosity, and enthalpy, are calculated as a function of primary variables, i.e., temperature, pressure, and NaCl or CO2 saturation, if needed. To simulate CO2 flow in a high-temperature, high-pressure rock formation, a dedicated equation of state (EOS) was applied, namely, ECO2N v. 2.0. [44]. This EOS implementation can be used to model fluids that are a mixture of brine and CO2 with an upper range of up to 300 °C, 80 bar, and up to halite saturation. Since TOUGH3 does not have a built-in graphical user interface and the creation of input files is time-consuming and error-prone, the authors decided to use the PyTOUGH library v. 1.6.5 [45,46]. This Python library contains classes that help in building a model mesh, preparing input files, and postprocessing simulation results.
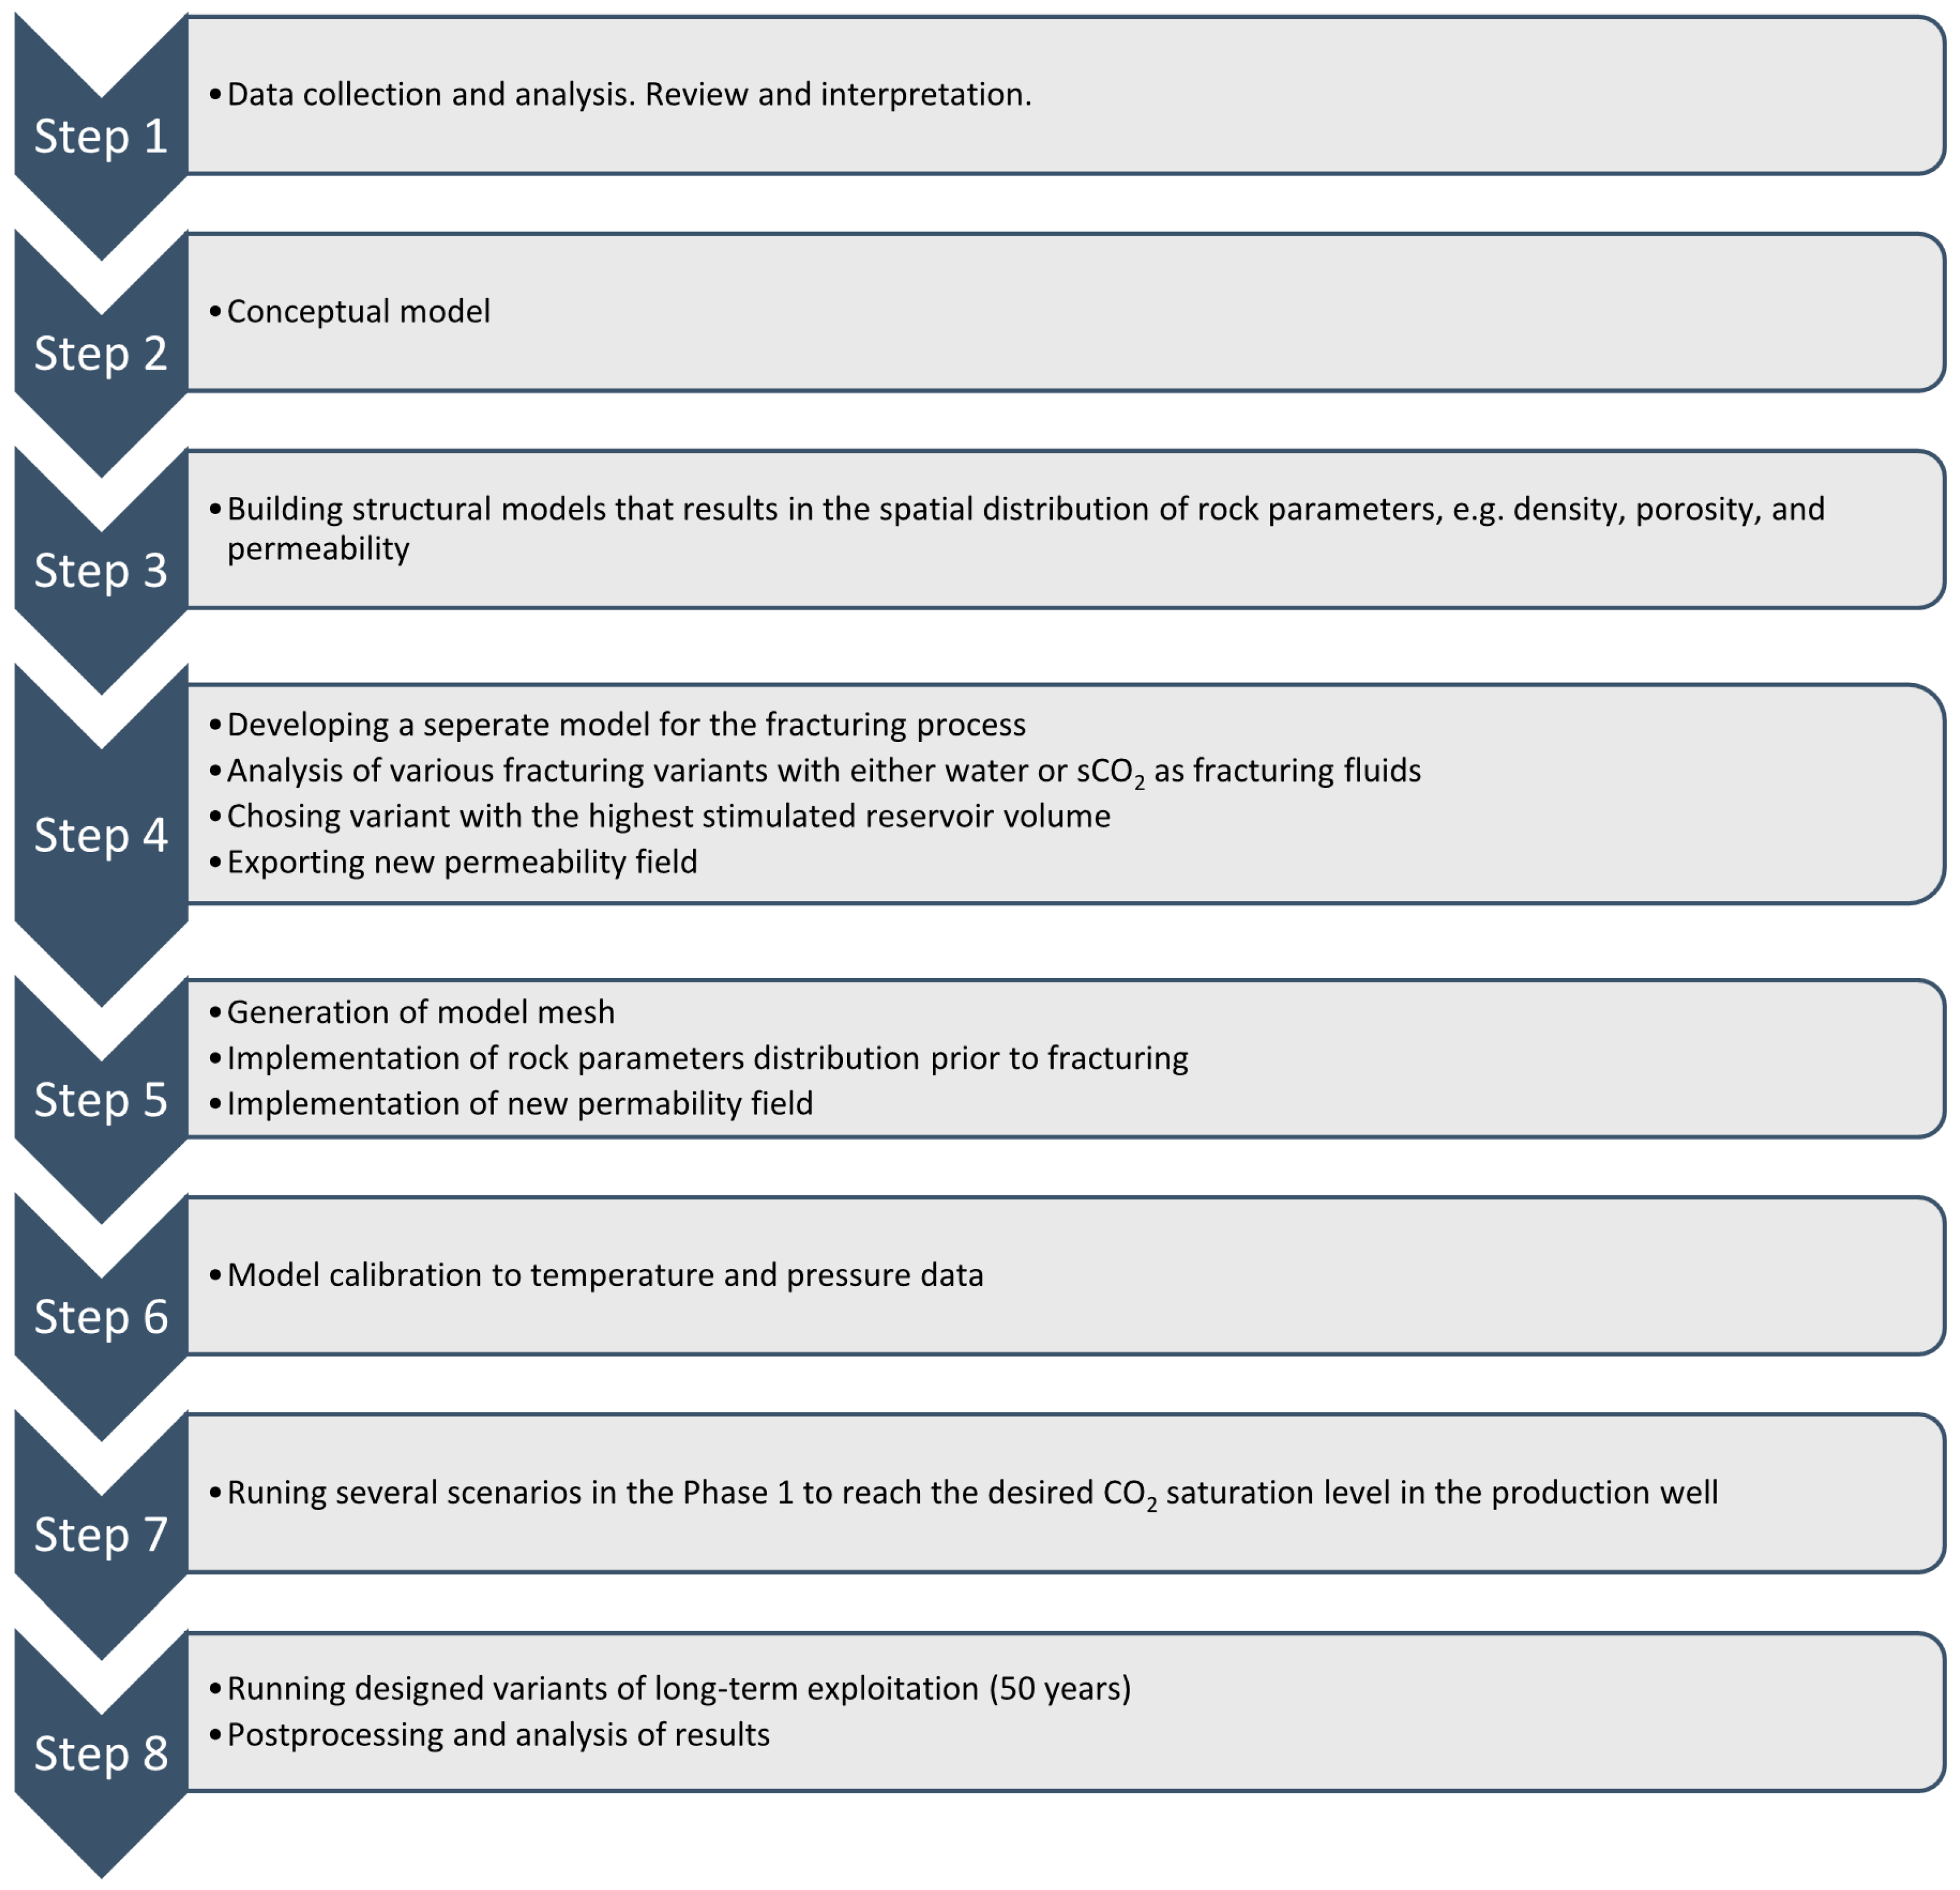
The chart in Figure 4 presents the workflow for developing a numerical model for an EGS reservoir with CO2 as a working fluid. This is not a general scheme applicable to every EGS reservoir, but this sequence of steps was applied for the case of Gorzów Block. As can be seen from the chart below, apart from the 3D numerical flow model, a separate 3D geomechanical model was developed in order to simulate fractures propagation. Fractures are induced when fluid pressure exceeds the total stress required to open natural fractures in the formation.

2.3. Model Setup

2.3.1. Temperature Calibration of Natural State

In the laboratory studies conducted by Sowiżdżał et al. [35], the thermal conductivity of effusive rocks was found to average approximately 1.8 W/(m∙K) for dry samples, 2.0 W/(m∙K) for samples fully saturated with water, and 2.1 W/(m∙K) for those saturated with a mixture of water and CO2. However, the analyzed samples were obtained from a significantly shallower depth interval (3199 m to 3578 m b.s.l.) than the target zone intended for hydraulic fracturing. Based on the known geothermal gradient and literature values of heat flux density, we estimated that the thermal conductivity of the Autunian volcanic rocks in the target depth interval should be around 2.5 W/(m∙K). This value was subsequently adopted for further calculations.
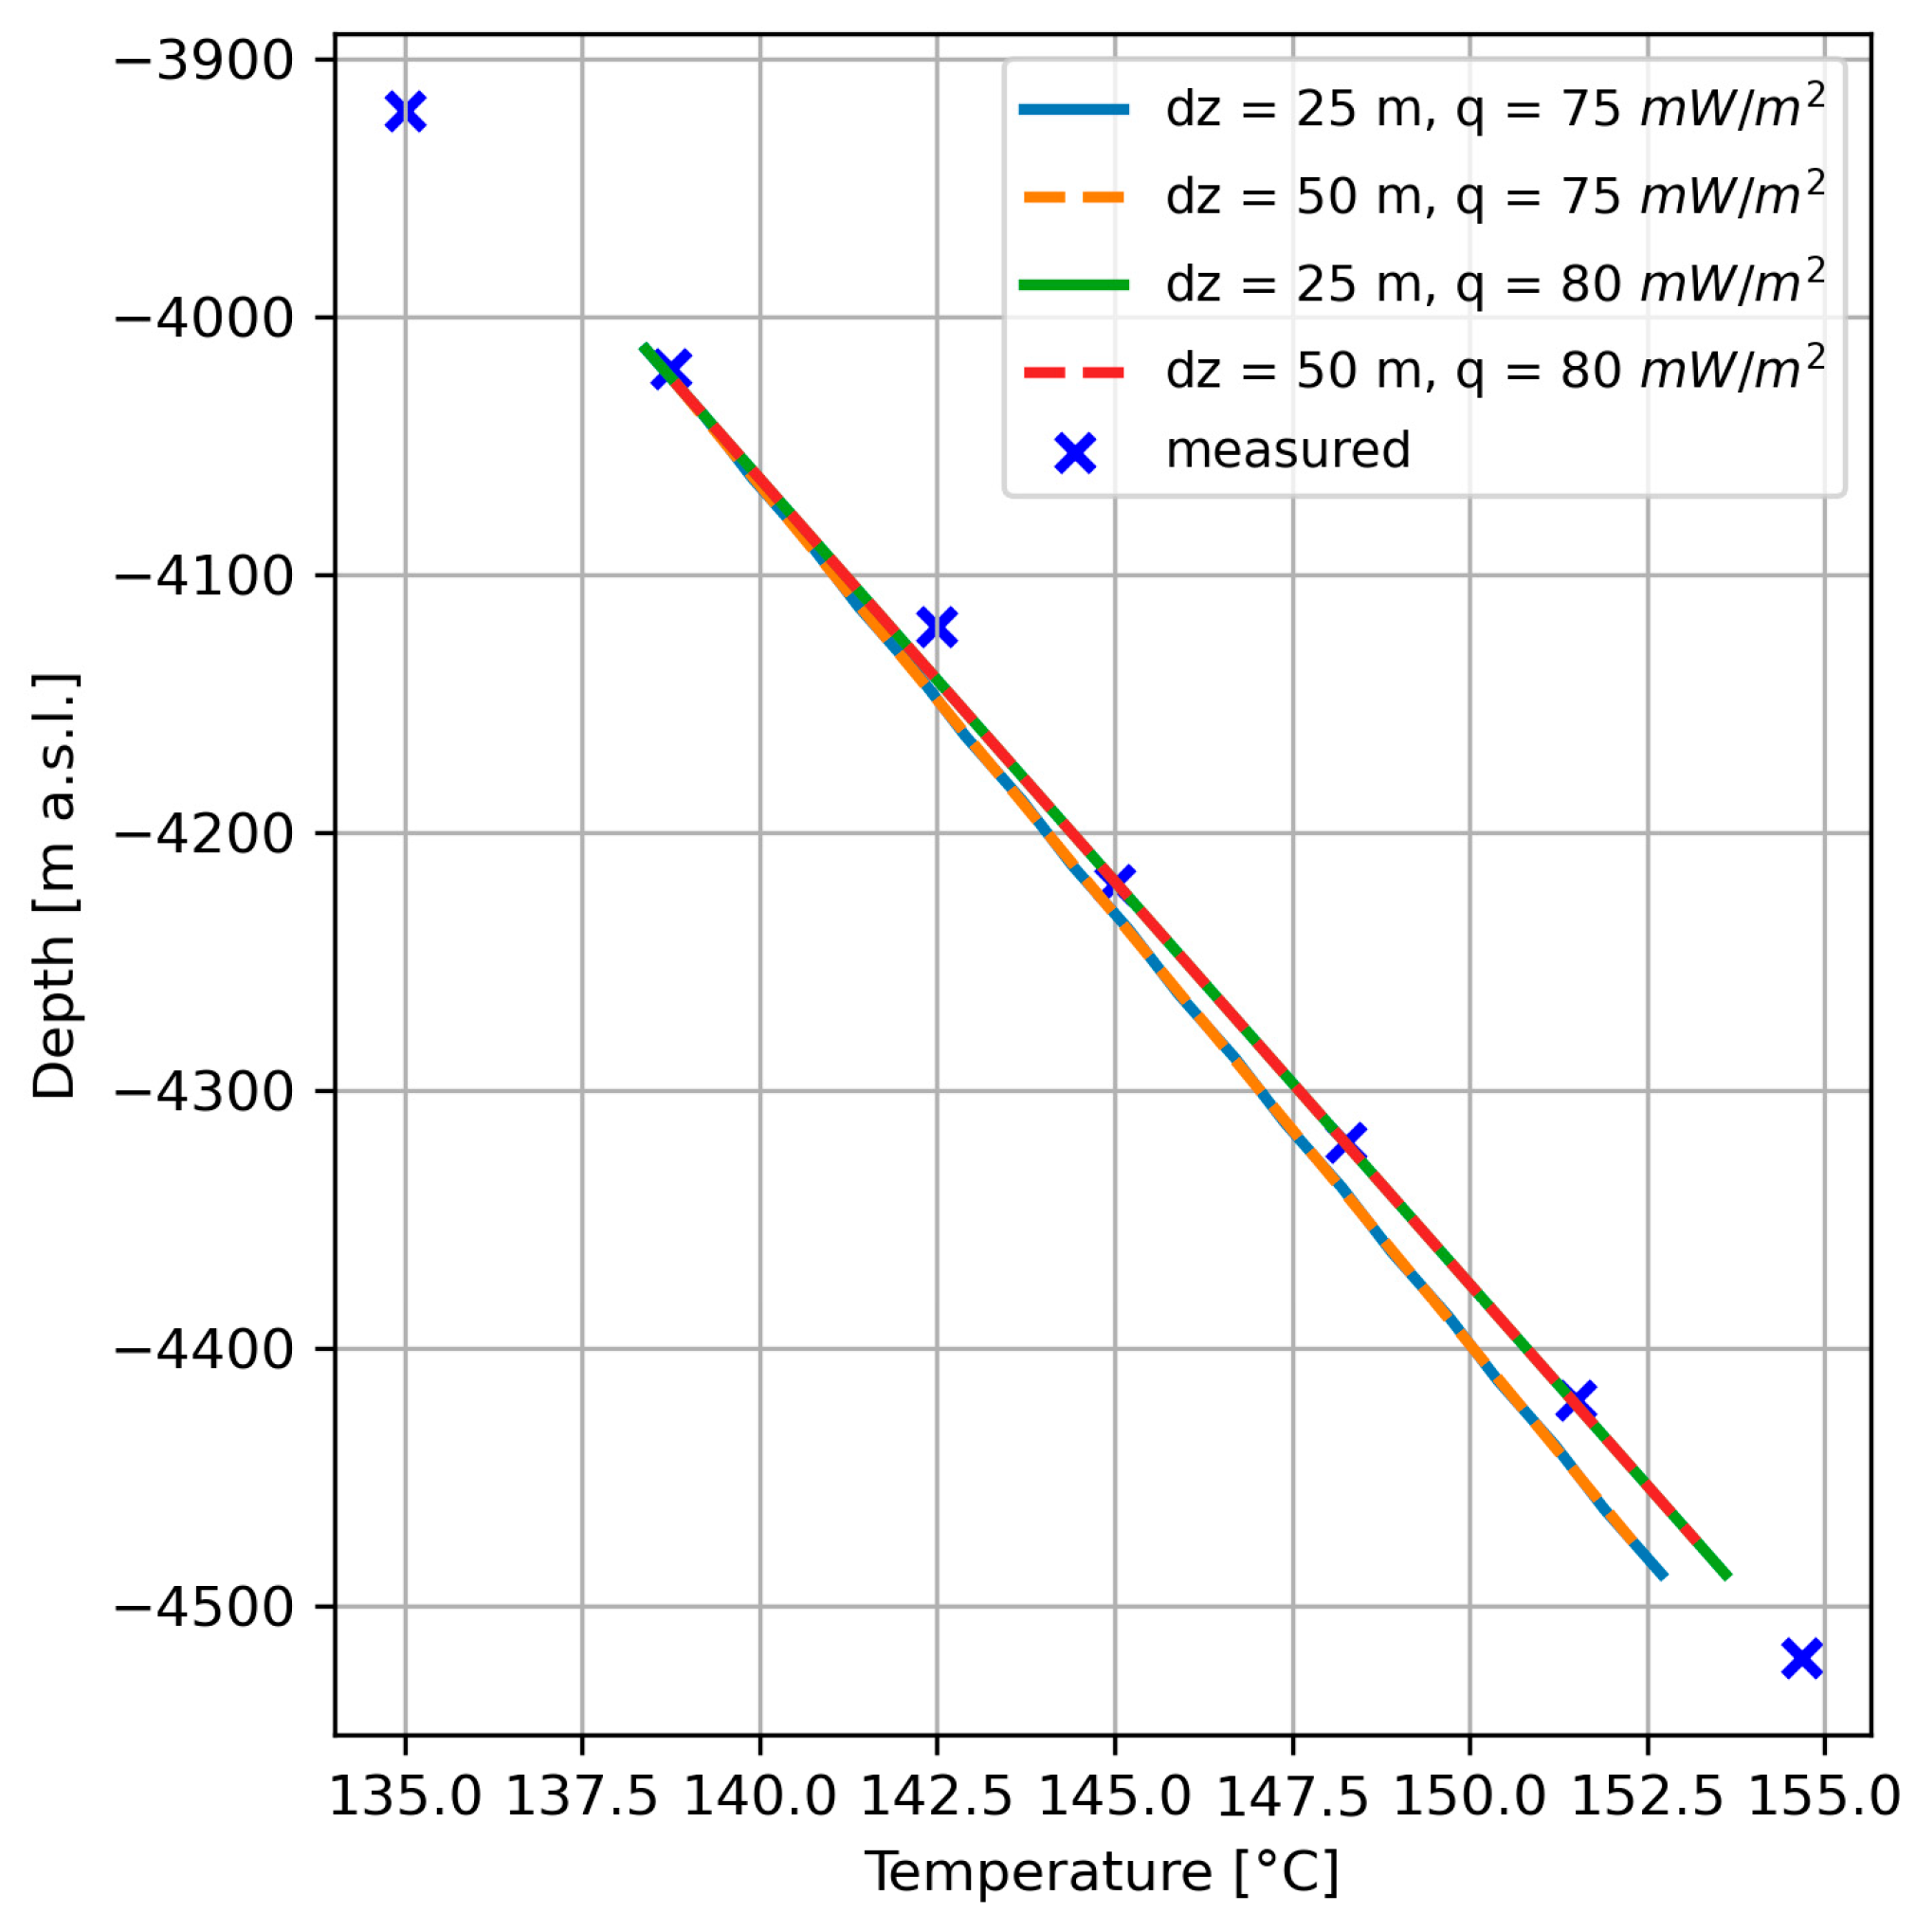
To address the previously noted discrepancies in heat flux density estimations among various authors [36,37,38,39,40], we examined the impact of heat flux density values (75 mW/m2 and 80 mW/m2) and vertical model resolution (25 m and 50 m) on the accuracy of reproducing the temperature distribution within the modeled domain. The Dirichlet boundary condition was applied to set the temperature at 138.8 °C in the top layer, which corresponded to an elevation of −4212.5 or −4225 m b.s.l., depending on the thickness of the layers.
The results of natural-state model calibration were compared with the steady-state temperature profile recorded in the Ośno IG-2 well. It turns out that a heat flux density of 80 mW/m2 allows for a high degree of accuracy in reproducing the temperature distribution in its natural state, as shown in Figure 5. In this context, the influence of vertical model resolution appears to be negligible.

2.3.2. Phase 0—Fracturing the Target Interval

Various variants of well trajectories were simulated in order to find the optimal length of the inclined or horizontal section of the fracking well [47]. For each of these variants, the fracturing process of the target zone was simulated using both H2O and CO2. In the end, the most advantageous variant turned out to be a directional well with a length of 5120 m MD and a depth of 4296 m TVD, assuming a 600 m long horizontal section. Hydraulic fracturing with water allowed it to achieve a larger volume of enhanced permeability compared to using carbon dioxide, in each of the analyzed variants. In this study, injection intervals exceeding 600 m proved to be ineffective for both fluids.
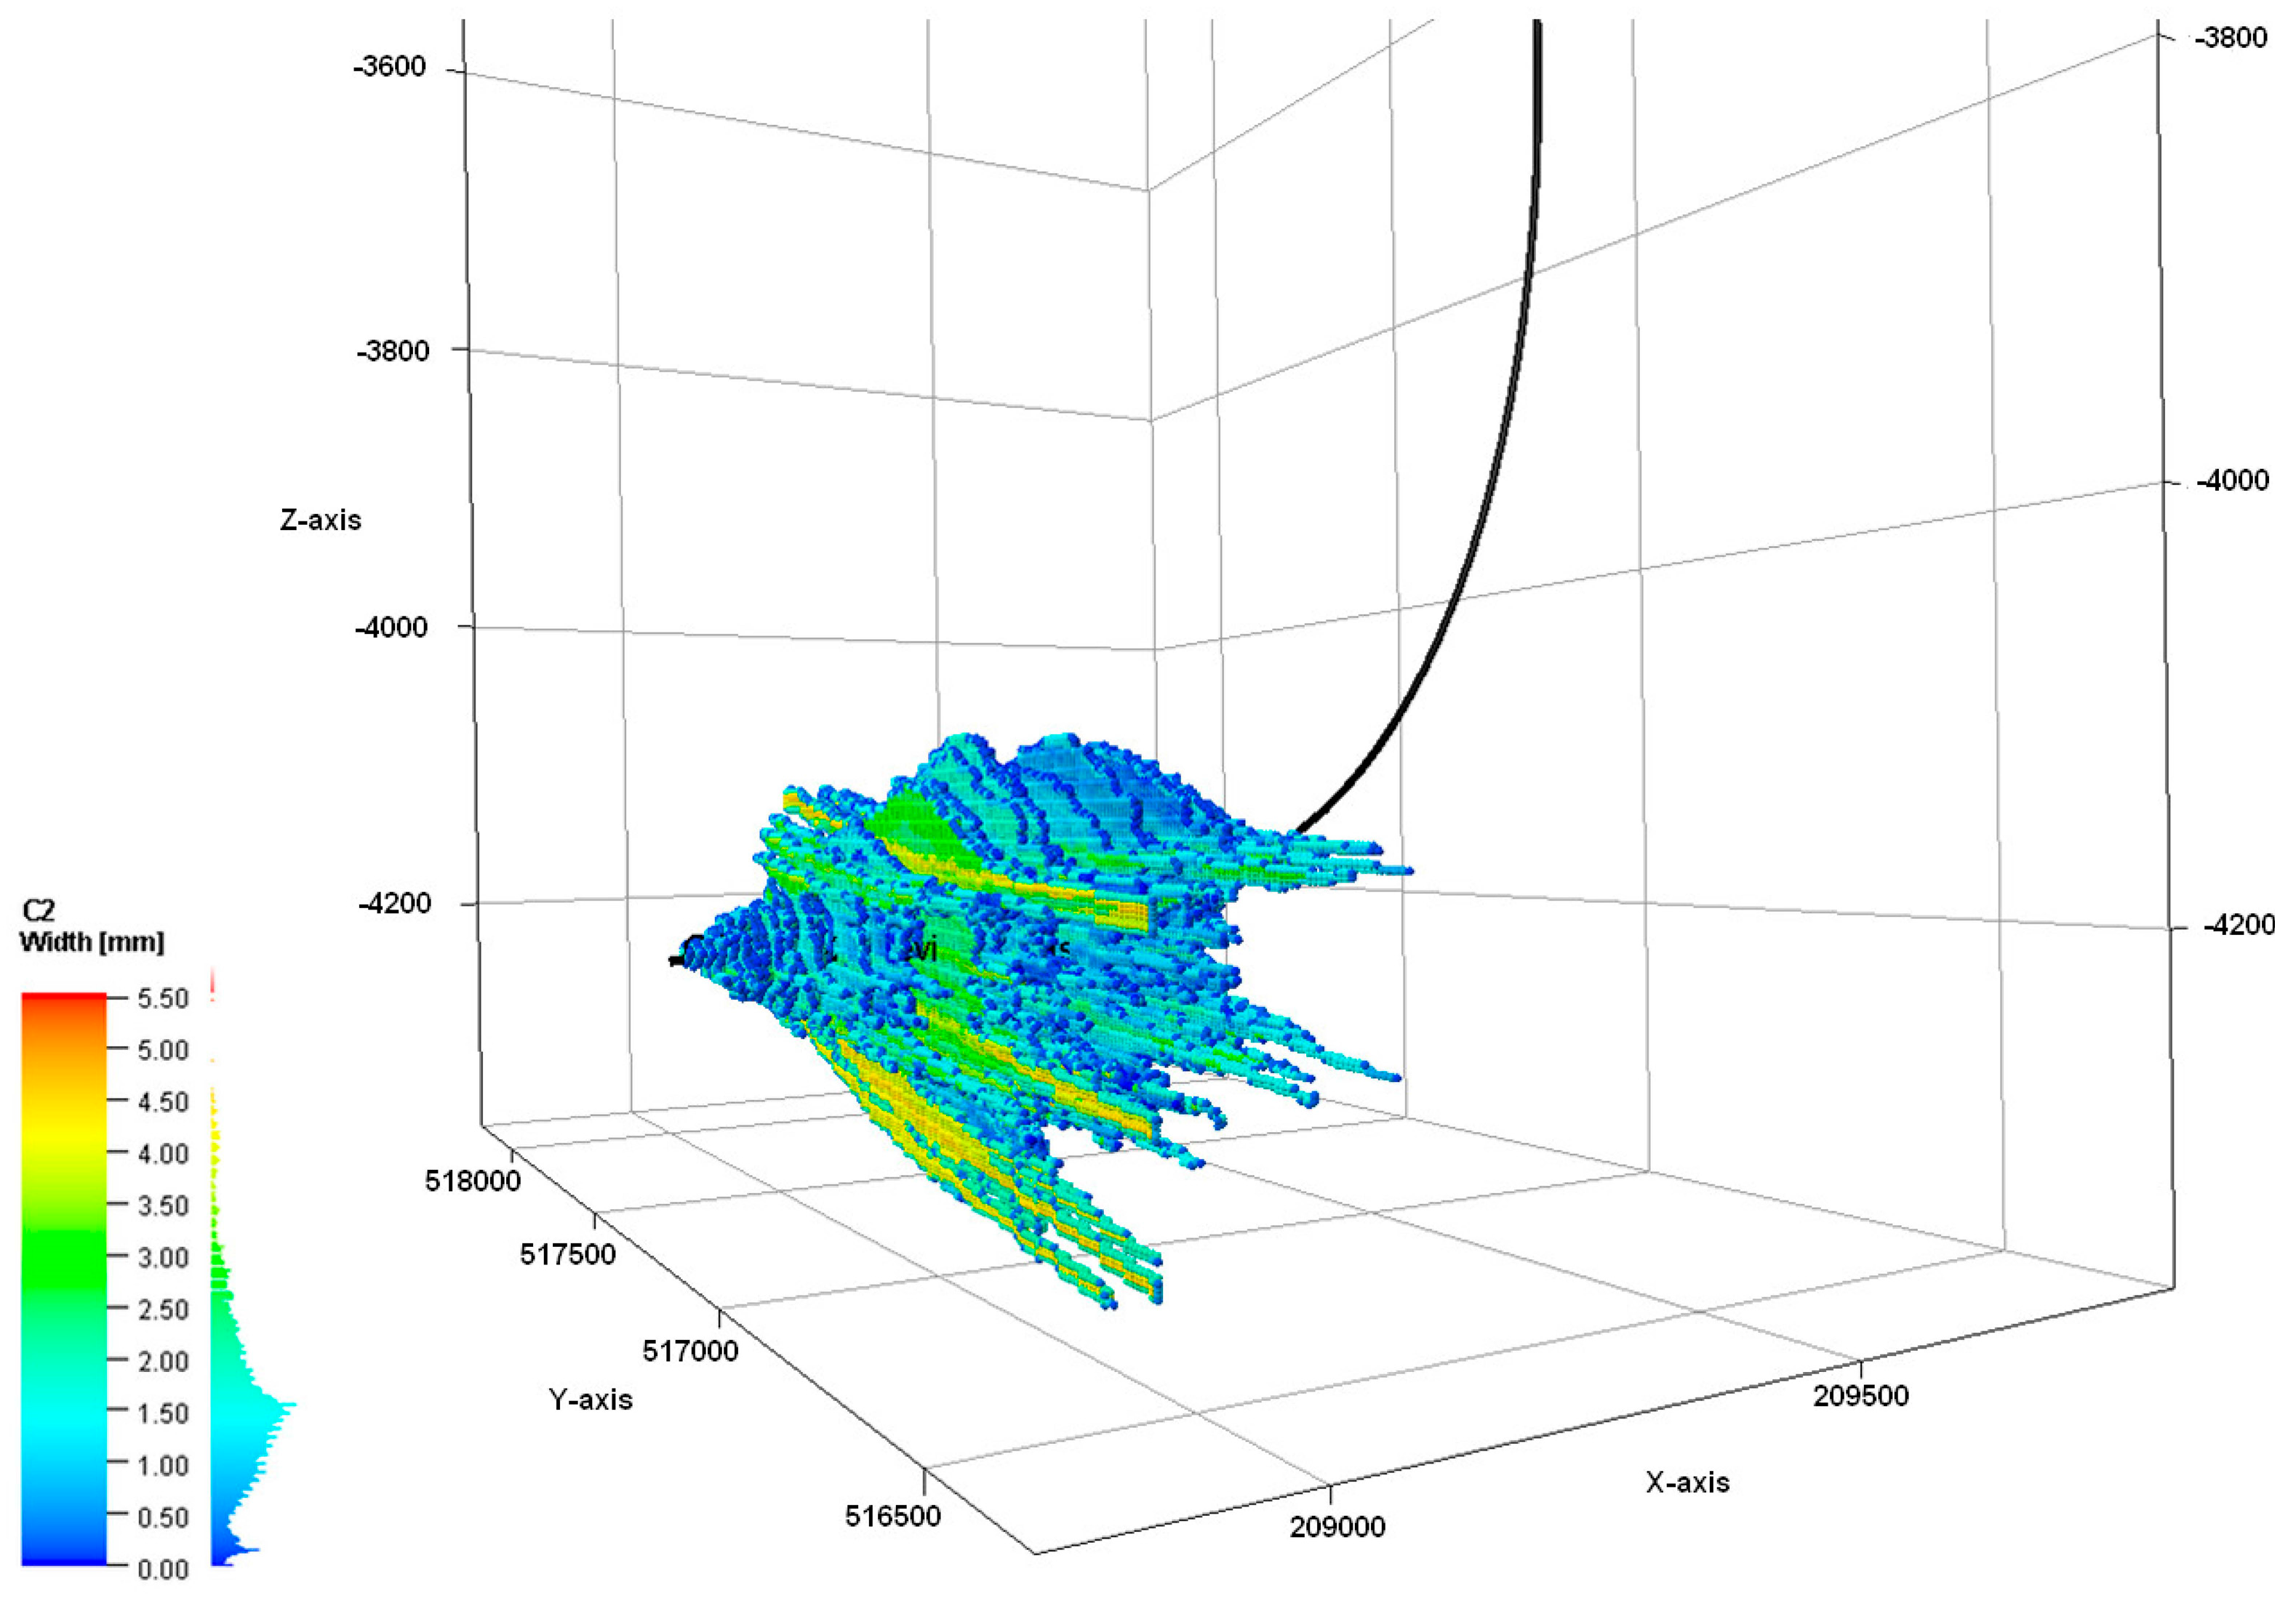
Results of simulation indicate that the half-length in the direction perpendicular to the well axis, and at the same time parallel to the direction of maximum horizontal stress, is approximately 800 m, while in the vertical direction up to 238 m. The propagation of fractures along the wellbore axis was highly heterogeneous. Ultimately, the zone affected by hydraulic fracturing had a volume of 0.096 km3 in the best-case scenario (Figure 6).
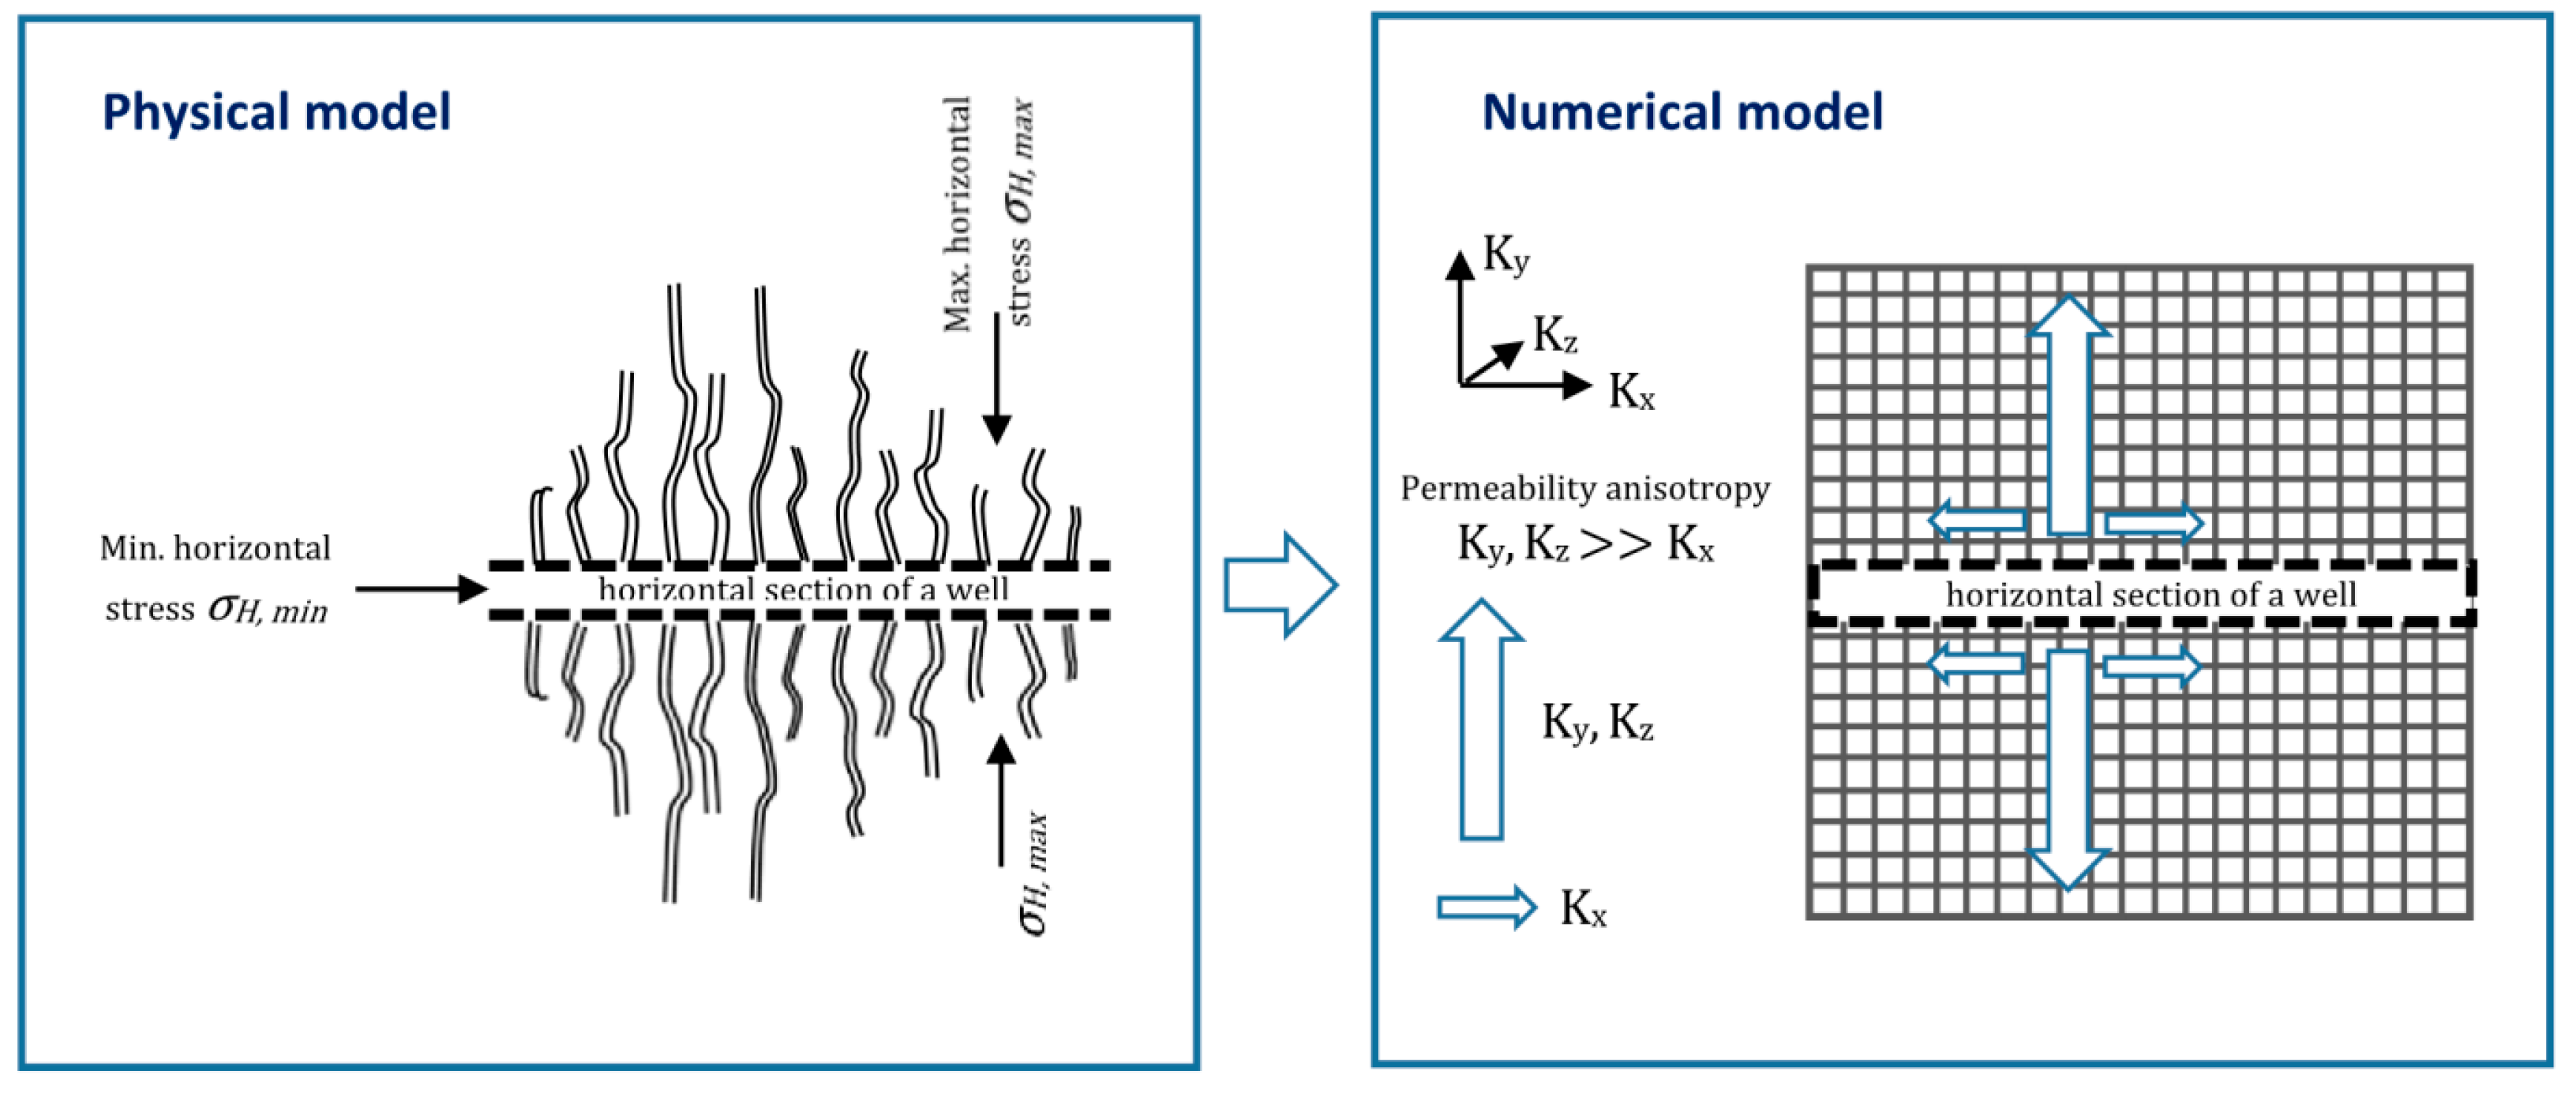
Rock fracturing typically occurs parallel to the maximum horizontal stress. Therefore, the well trajectory should be aligned such that its inclined or horizontal section runs parallel to the minimum in situ horizontal stress. This orientation ensures that fractures propagate perpendicular to the wellbore axis, in the direction of maximum horizontal stress. As a result, fracture permeability in the radial directions ( K y , K z ) increases significantly—by several orders of magnitude—while permeability along the well axis ( K x ) remains largely unchanged. This phenomenon results in the formation of permeability anisotropy in the fractured zone, which is schematically shown in Figure 7. Consequently, fluid flow between the injection and production wells tends to follow relatively straight paths. This effect plays a crucial role in reducing flow path tortuosity, thus—unfortunately—limiting the effective heat transfer area in hard rocks characterized by negligible natural porosity and permeability.
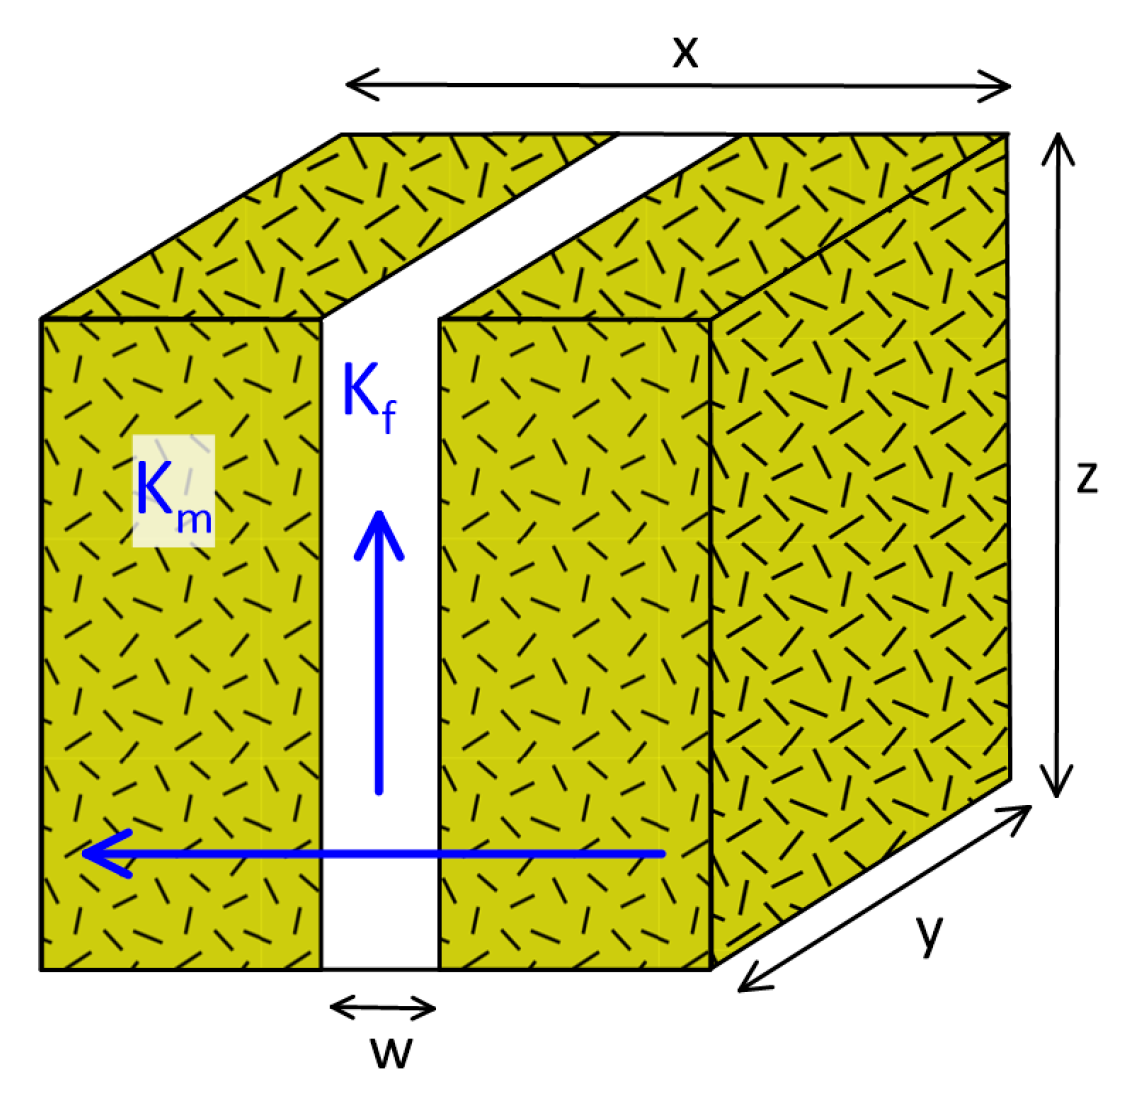
In order to calculate permeability anisotropy for each block, the following information is needed: fracture aperture and permeability, block dimensions, and matrix permeability. In Figure 8, a representation of such a computation block is presented. There, w denotes fracture aperture, while x , y ,   and z are block dimensions. K f is fracture permeability and K m is matrix permeability. Both are assumed to be isotropic.
Fracture permeability K f (expressed in m2) can be calculated from the following correlation [47]:
K f = 0.05758 · φ f · h f · w f 3
where φ f is average fracture porosity [-], h f is simulation cell height [m], and w f is fracture width [m]. In the 3D geomechanical model used to simulate fractures propagation, their porosity was assumed to be 0.01, while the cell height was 2 m [47]. The length and width of each block were 8 m in both directions. The highest simulated aperture of the fracture network was 5.54∙10−3 m, while the average value was 1.50∙10−3 m. Maximum permeability calculated for the network of fractures was 3.36∙10−7 m2 (3.4∙105 Darcy), with the average value of 5.31∙10−8 m2 (5.38∙104 Darcy).
Due to the spatial resolution of the production model and the significant scale difference between the width of fractures and the computational block sizes (order of dozens of meters), all fractures were upscaled to the mesh of the production model. Hence, they were not embedded in the production model as discrete conduits.
In the reservoir engineering literature, the relationships describing the average permeability for fluid flow through a compound medium are well known [48]. When fluid flow occurs from each of the parallel layers of the aquifer, then we have parallel flow, and the average permeability K a v .   | |   for such a system of n layers with individual permeabilities K i and thicknesses h i is calculated as the weighted mean:
K a v .   | |   =   i = 1 n h i · K i i = 1 n h i
When the flow is perpendicular to serially arranged layers of the rock formation, then average permeability should be calculated as a harmonic mean:
K a v .     =   i = 1 n h i i = 1 n h i K i
Assuming that a fracture of width w f and permeability K f runs through the center of the calculation block and divides it into 3 parts, of which the 2 lateral parts are the solid rock matrix characterized by isotropic permeability K m , it is possible to determine permeability anisotropy in each grid block (Figure 8):
K y =   K z =   K a v .   | |   =   L x w · K m + w · K f L x
where L x is the length of the block in the x direction.
For flow perpendicular to the fracture direction, the average permeability K x for the block is:
K x =   K a v .     =   L x L x w K m + w K f
After converting the fracture width to permeability and upscaling to the geomechanical model grid using Equation (4), where L x =   L y = 8   m , the permeability distribution parallel to the fractures plane was obtained as shown in Figure 9.
Based on the distribution of rock parameters in 3D space, three main rock types were defined in the local model domain (Table 1). In fact, due to the thickness of the Volcanic Autunian rocks exceeding 1000 m, the whole model domain is within the boundaries of this formation. However, two additional rock types were defined: FRACT, to represent the fractured volume, and CAPRK, to represent the top boundary of the model.
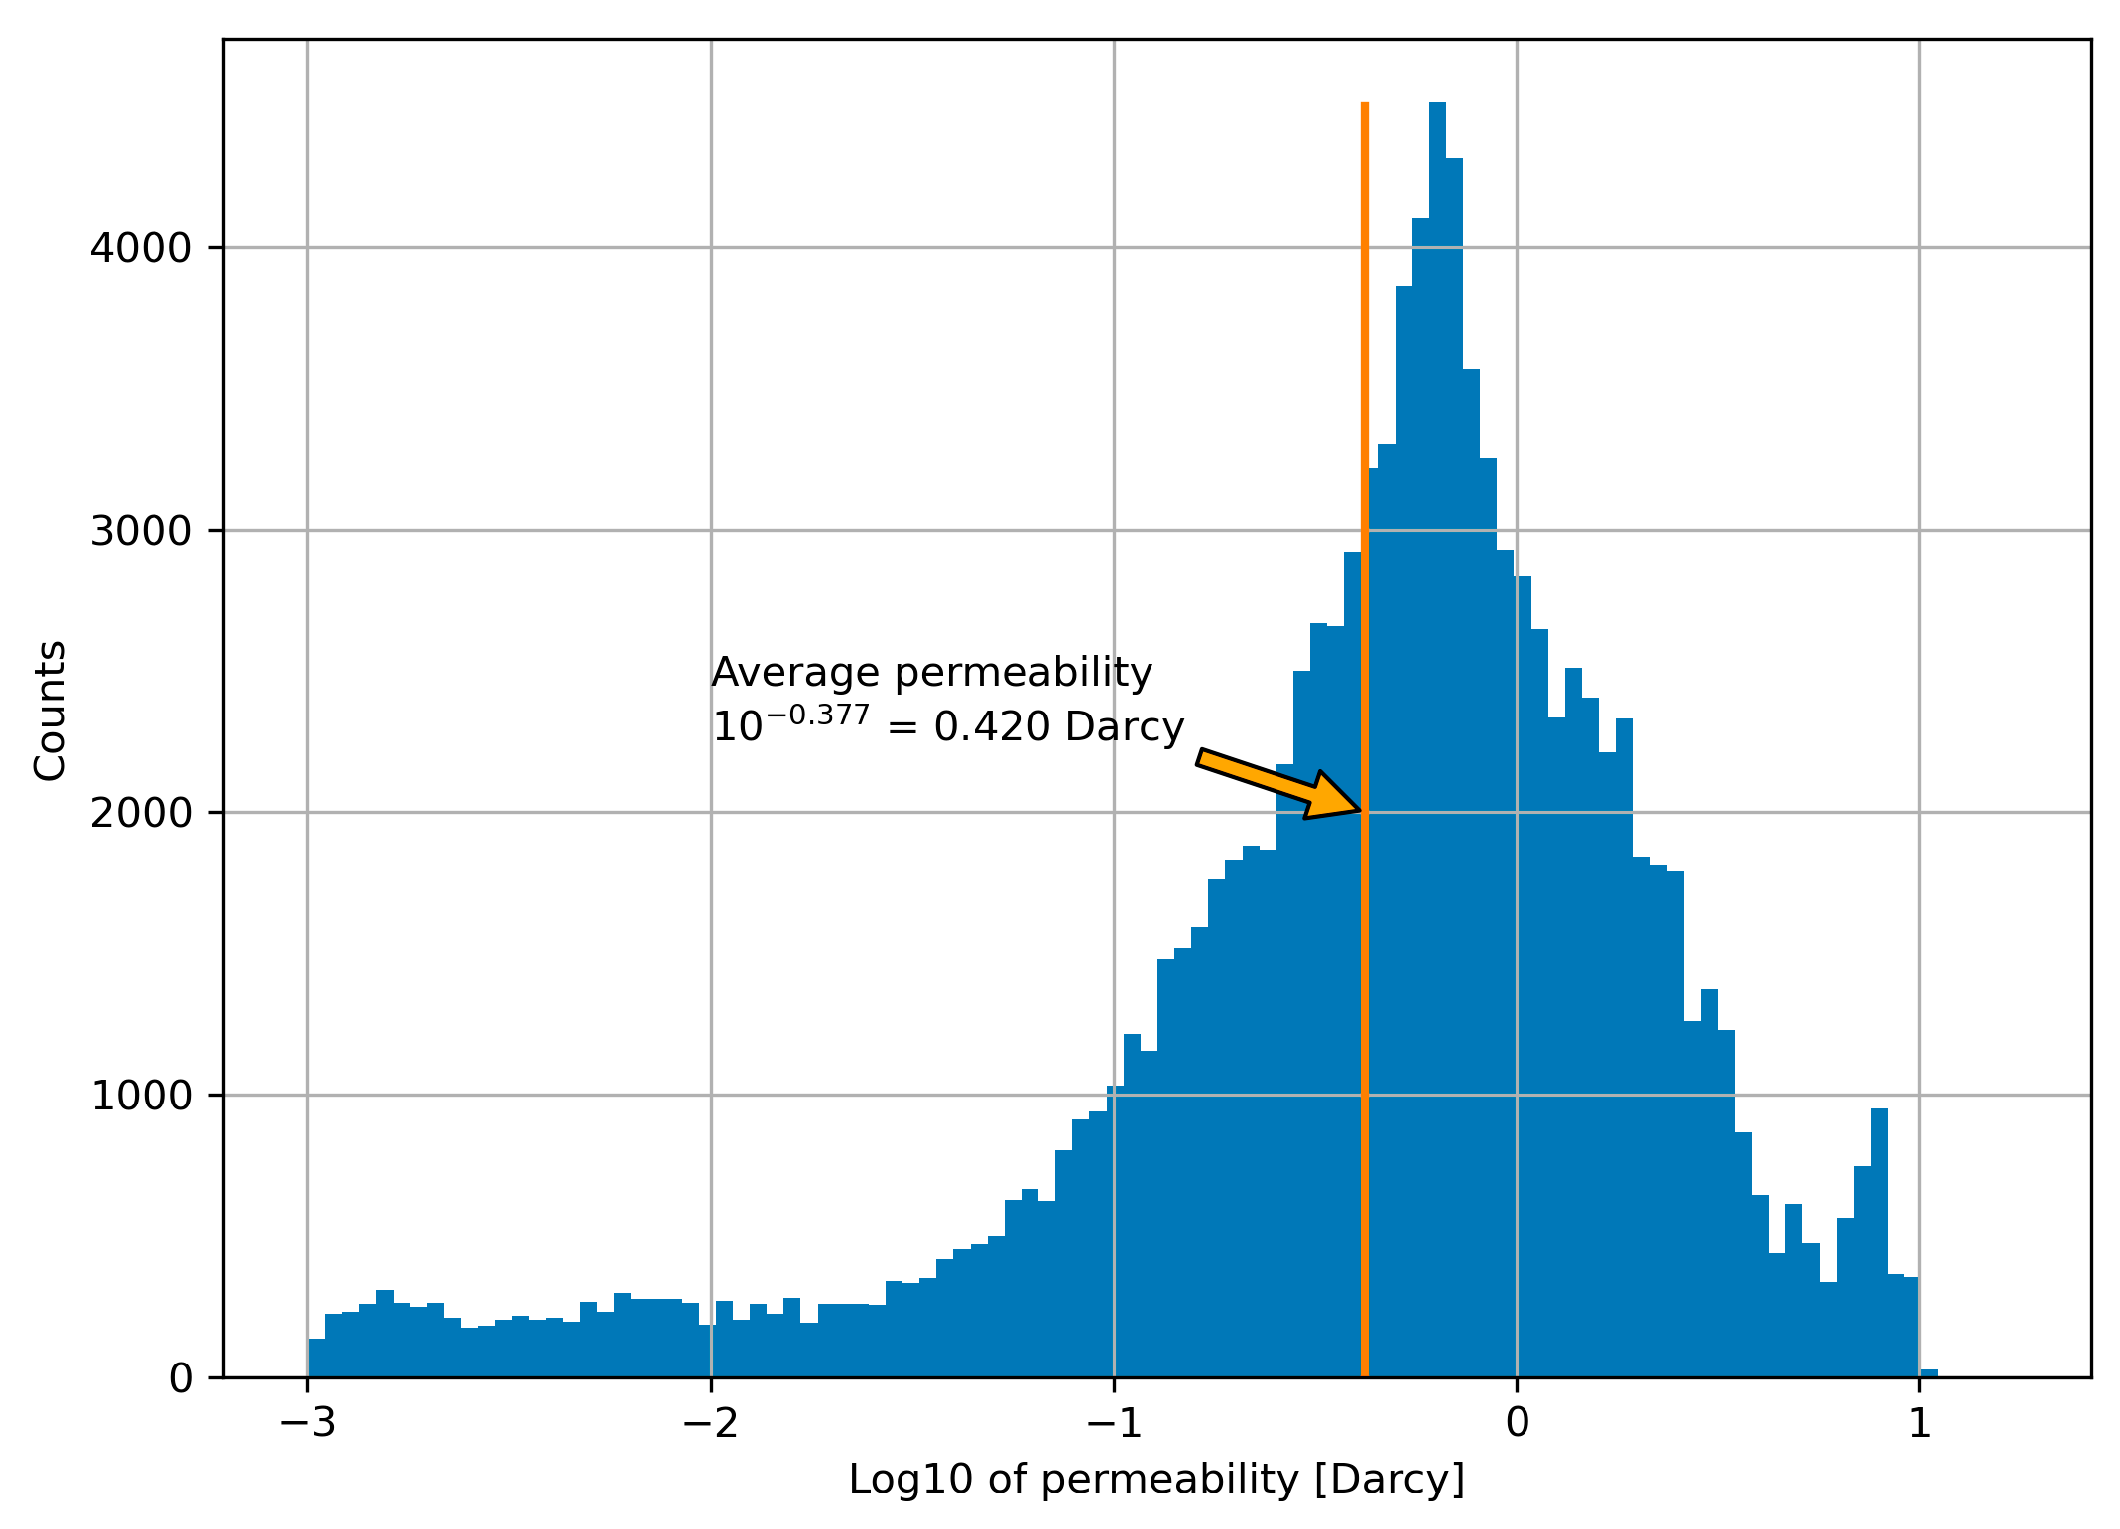
The fractured domain resembles an ellipsoid with the 1st principal axis 1600 m long, 2nd principal axis equal to 600 m (which is also the length of the horizontal section of the fracking well), and the 3rd principal axis 238 m long in the vertical direction (Figure 6). However, the upscaled permeability field in this zone is highly heterogeneous (Figure 6), with values reaching a maximum of 16.4 Darcy and an average of 0.42 Darcy across the model grid (Figure 9). Reproducing the exact distribution of the permeability field obtained as a result of modeling the fracturing process would require the use of a very fine computational grid. The authors made such attempts, but the use of an equation of state that enables the simulation of a mixture of water, NaCl, and CO2 generated much greater computational time compared to the non-isothermal flow of water alone. After numerous attempts, it was decided to approximate the fractured zone using a cuboid with dimensions of 1600 × 600 × 100 m, the volume of which is also 0.096 km3. The main difference is therefore the dimension in the vertical direction compared to the actual shape of the fractured zone, which reached a maximum extent in this direction of up to 238 m.
Due to strong permeability anisotropy, an increase in permeability occurred in the direction perpendicular to the axis of the well, i.e., in the Y and Z directions, while in the direction of the X axis, i.e., along the axis of the well, it remained unchanged (Table 1). The numerical model assumes a single-porosity approach; therefore, the fractured zone is homogenous with corresponding permeability increased to 0.42 Darcy on average in the Y and Z directions.
To maintain constant temperature in the top-most layer of the model, the density of the CAPRK rock type was exaggerated by several orders of magnitude. This is quite a common practice in TOUGH and TOUGH-like reservoir simulators, because increasing the material density or block volume several orders of magnitude simulates a remote boundary with a very large thermal capacity and therefore insensitive to heat transfer and fluid flow in adjacent blocks [42]. The steady-state model was then calibrated against known temperature well logs (Figure 2), assuming a hydrostatic pressure profile on the model lateral boundaries. However, in the case of the fractured zone, the pressure necessary to keep new fractures open was calculated to be approx. 64.5 MPa, i.e., about 21 MPa higher than the pressure in the natural state [47].
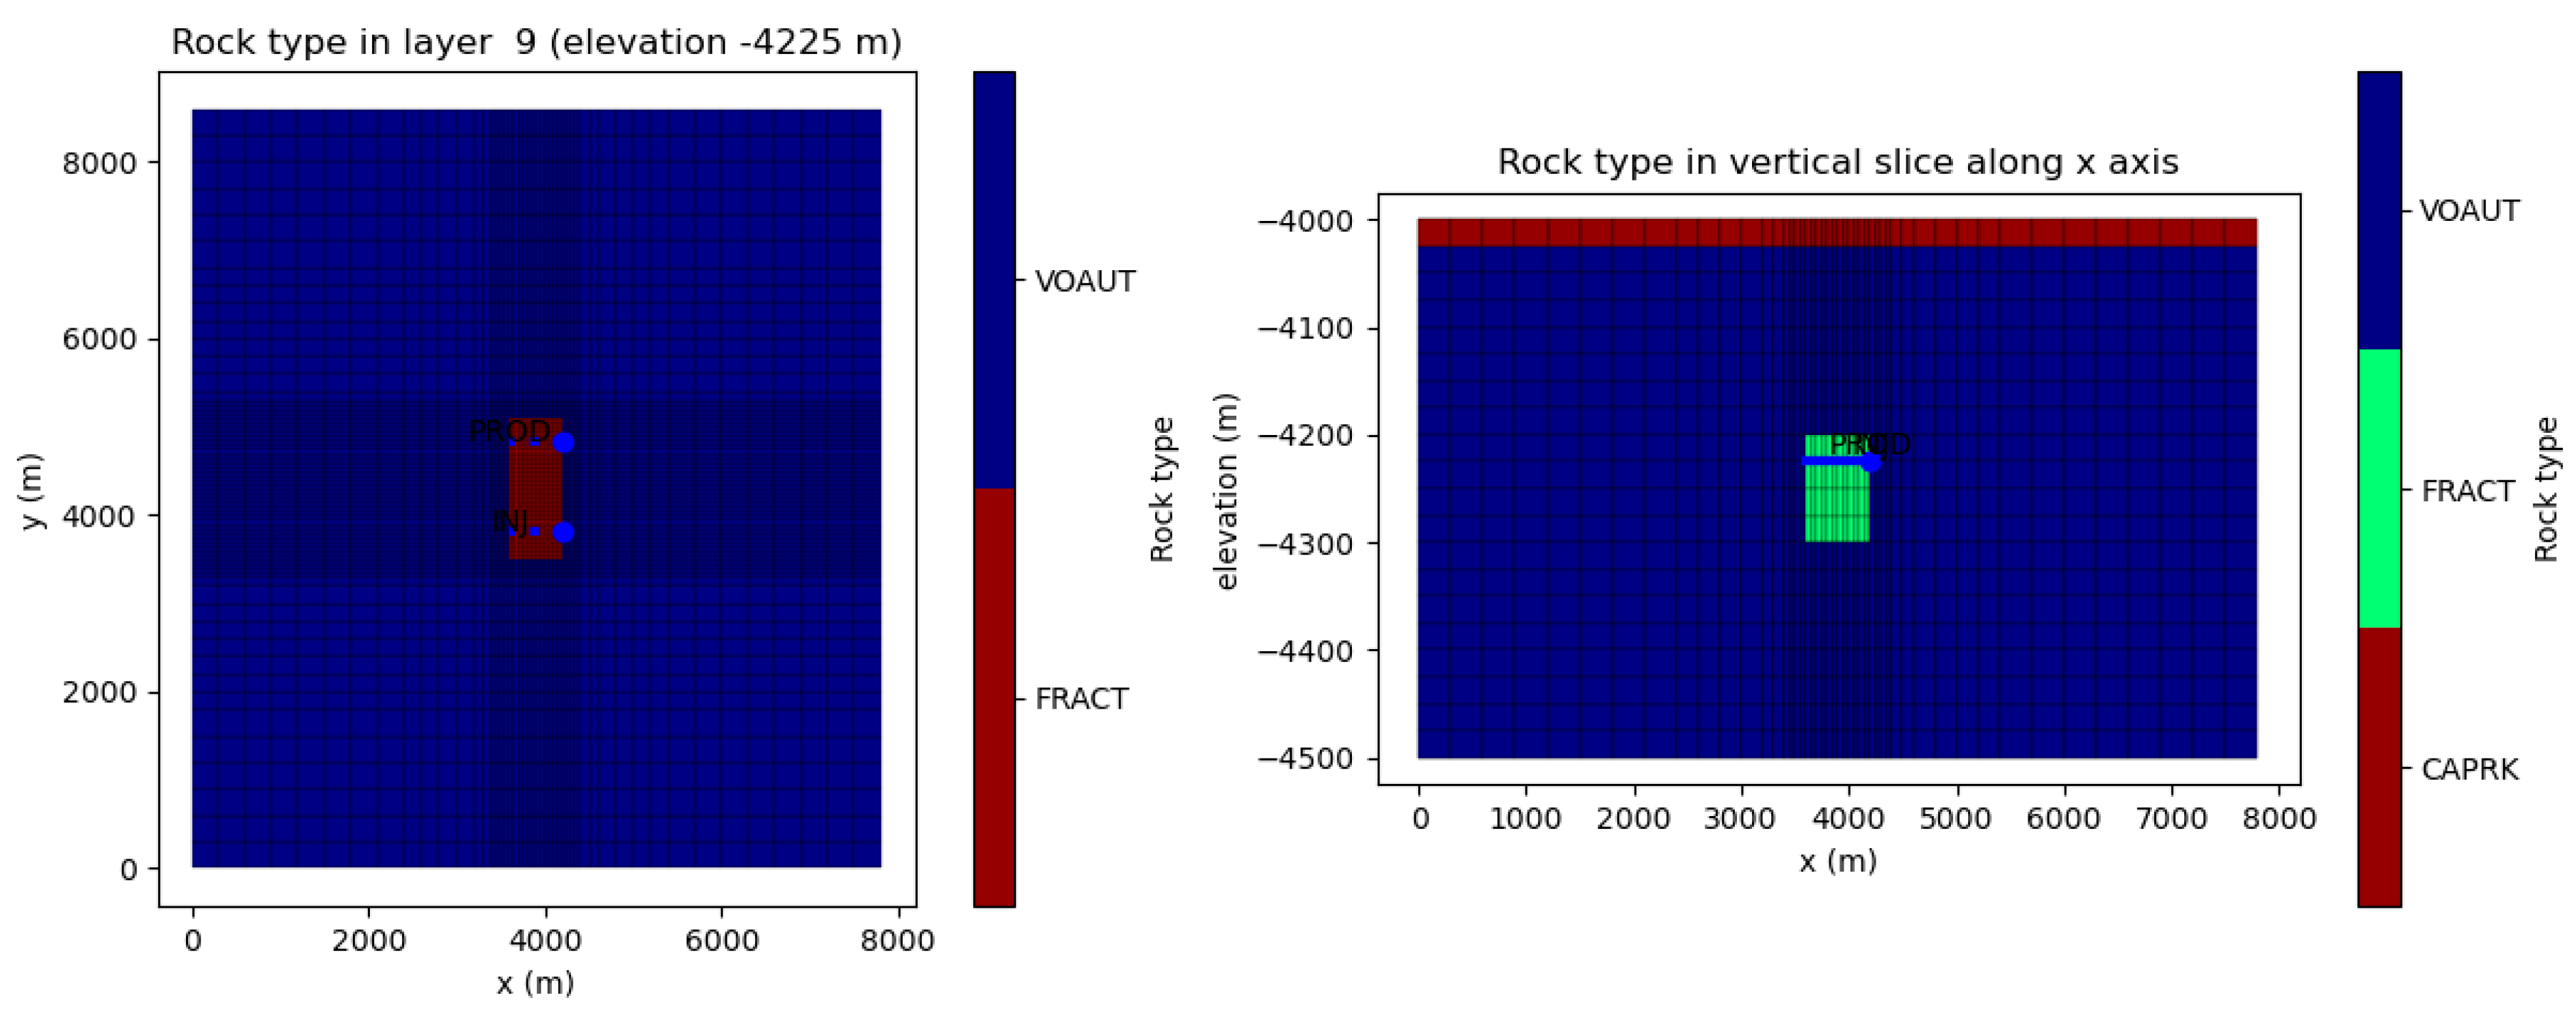
After numerous attempts, it was decided to separate the production and injection wells by 1000 m. Shorter distances caused the temperature in the production well to drop too early, while larger distances made it less likely that both wells would in the real environment intersect the same fractures. The final model grid was configured with either 10 layers of 3264 elements, each 50 m thick, or 20 layers of 3264 elements, each 25 m thick, resulting in a total of 32,640 or 65,280 elements, respectively. The higher vertical resolution was employed to assess whether a finer grid and increased distance from the fractured volume to the model boundaries would lead to significantly different simulation results in phase 1 (Figure 10).
It is also worth noting that the elements located at the lateral boundaries of the model were assigned volumes 100 times larger than inner elements to simulate the continuation of the Autunian volcanic formation beyond the modeled domain. These boundary elements can thus be conceptually understood as extending 100-fold in the X or Y direction. This extension of lateral elements does not apply to the top and bottom layer.

2.4. Phase 1—Saturation of the Fractured Zone with CO2

In the case of the Gorzów Block, the following approach was used: various variants of CO2 injection were modeled to obtain 100% saturation of CO2 at the outlet of the production well over a maximum period of 2 years (phase 1). Then, simulation of full-scale energy production from the EGS reservoir was performed (phase 2). However, before starting the modeling of phase 1, it was necessary to calculate the temperature of the CO2 that is reinjected during phase 1. For this purpose, it was assumed that during phase 1 there is no energy extraction on the surface. The CO2 stream is circulated in the reservoir, and the losses resulting from the underground storage of CO2 are leveled in the surface installation. Carbon dioxide supplied from the external source is heated using water separated from the fluid mixture exploited through the production well, and then it is compressed and reinjected through the injection well. As a result, it appeared that the temperature of the injected CO2 would be approximately 128.3 °C at the wellhead, which, due to gravitational compression, translates into a temperature of approximately 139.5 °C at the reservoir depth. Therefore, temperature of CO2 entering the production well is only 5.5 °C lower than the natural reservoir. To avoid lengthy mathematical description, the full calculation procedure is provided in Appendix A.
Table 2 shows the setup of the numerical model with an emphasis on the parameters of the fractured zone. Eight variants of CO2 injection were simulated for a period of 2 years, assuming flow rates from 150 to 400 kg/s, injection temperature of 139.5 °C each time, and vertical resolution of either 25 or 50 m per layer.
The naming convention for the simulated scenarios in phase 1 is the following: M.X.Y.Z, where “X” stands for the injection mass flow rate in kg/s, “Y” is the injection temperature of CO2 (139.5 °C for all variants in phase 1), and “Z” denotes the thickness of layers (each layer has the same thickness), expressed in meters.
Similarly, for phase 2, the naming convention for the simulated variants is as follows: M.X.Y, where “X” and “Y” have the same meaning as in the case of phase 1, except that the injection temperature was varying.
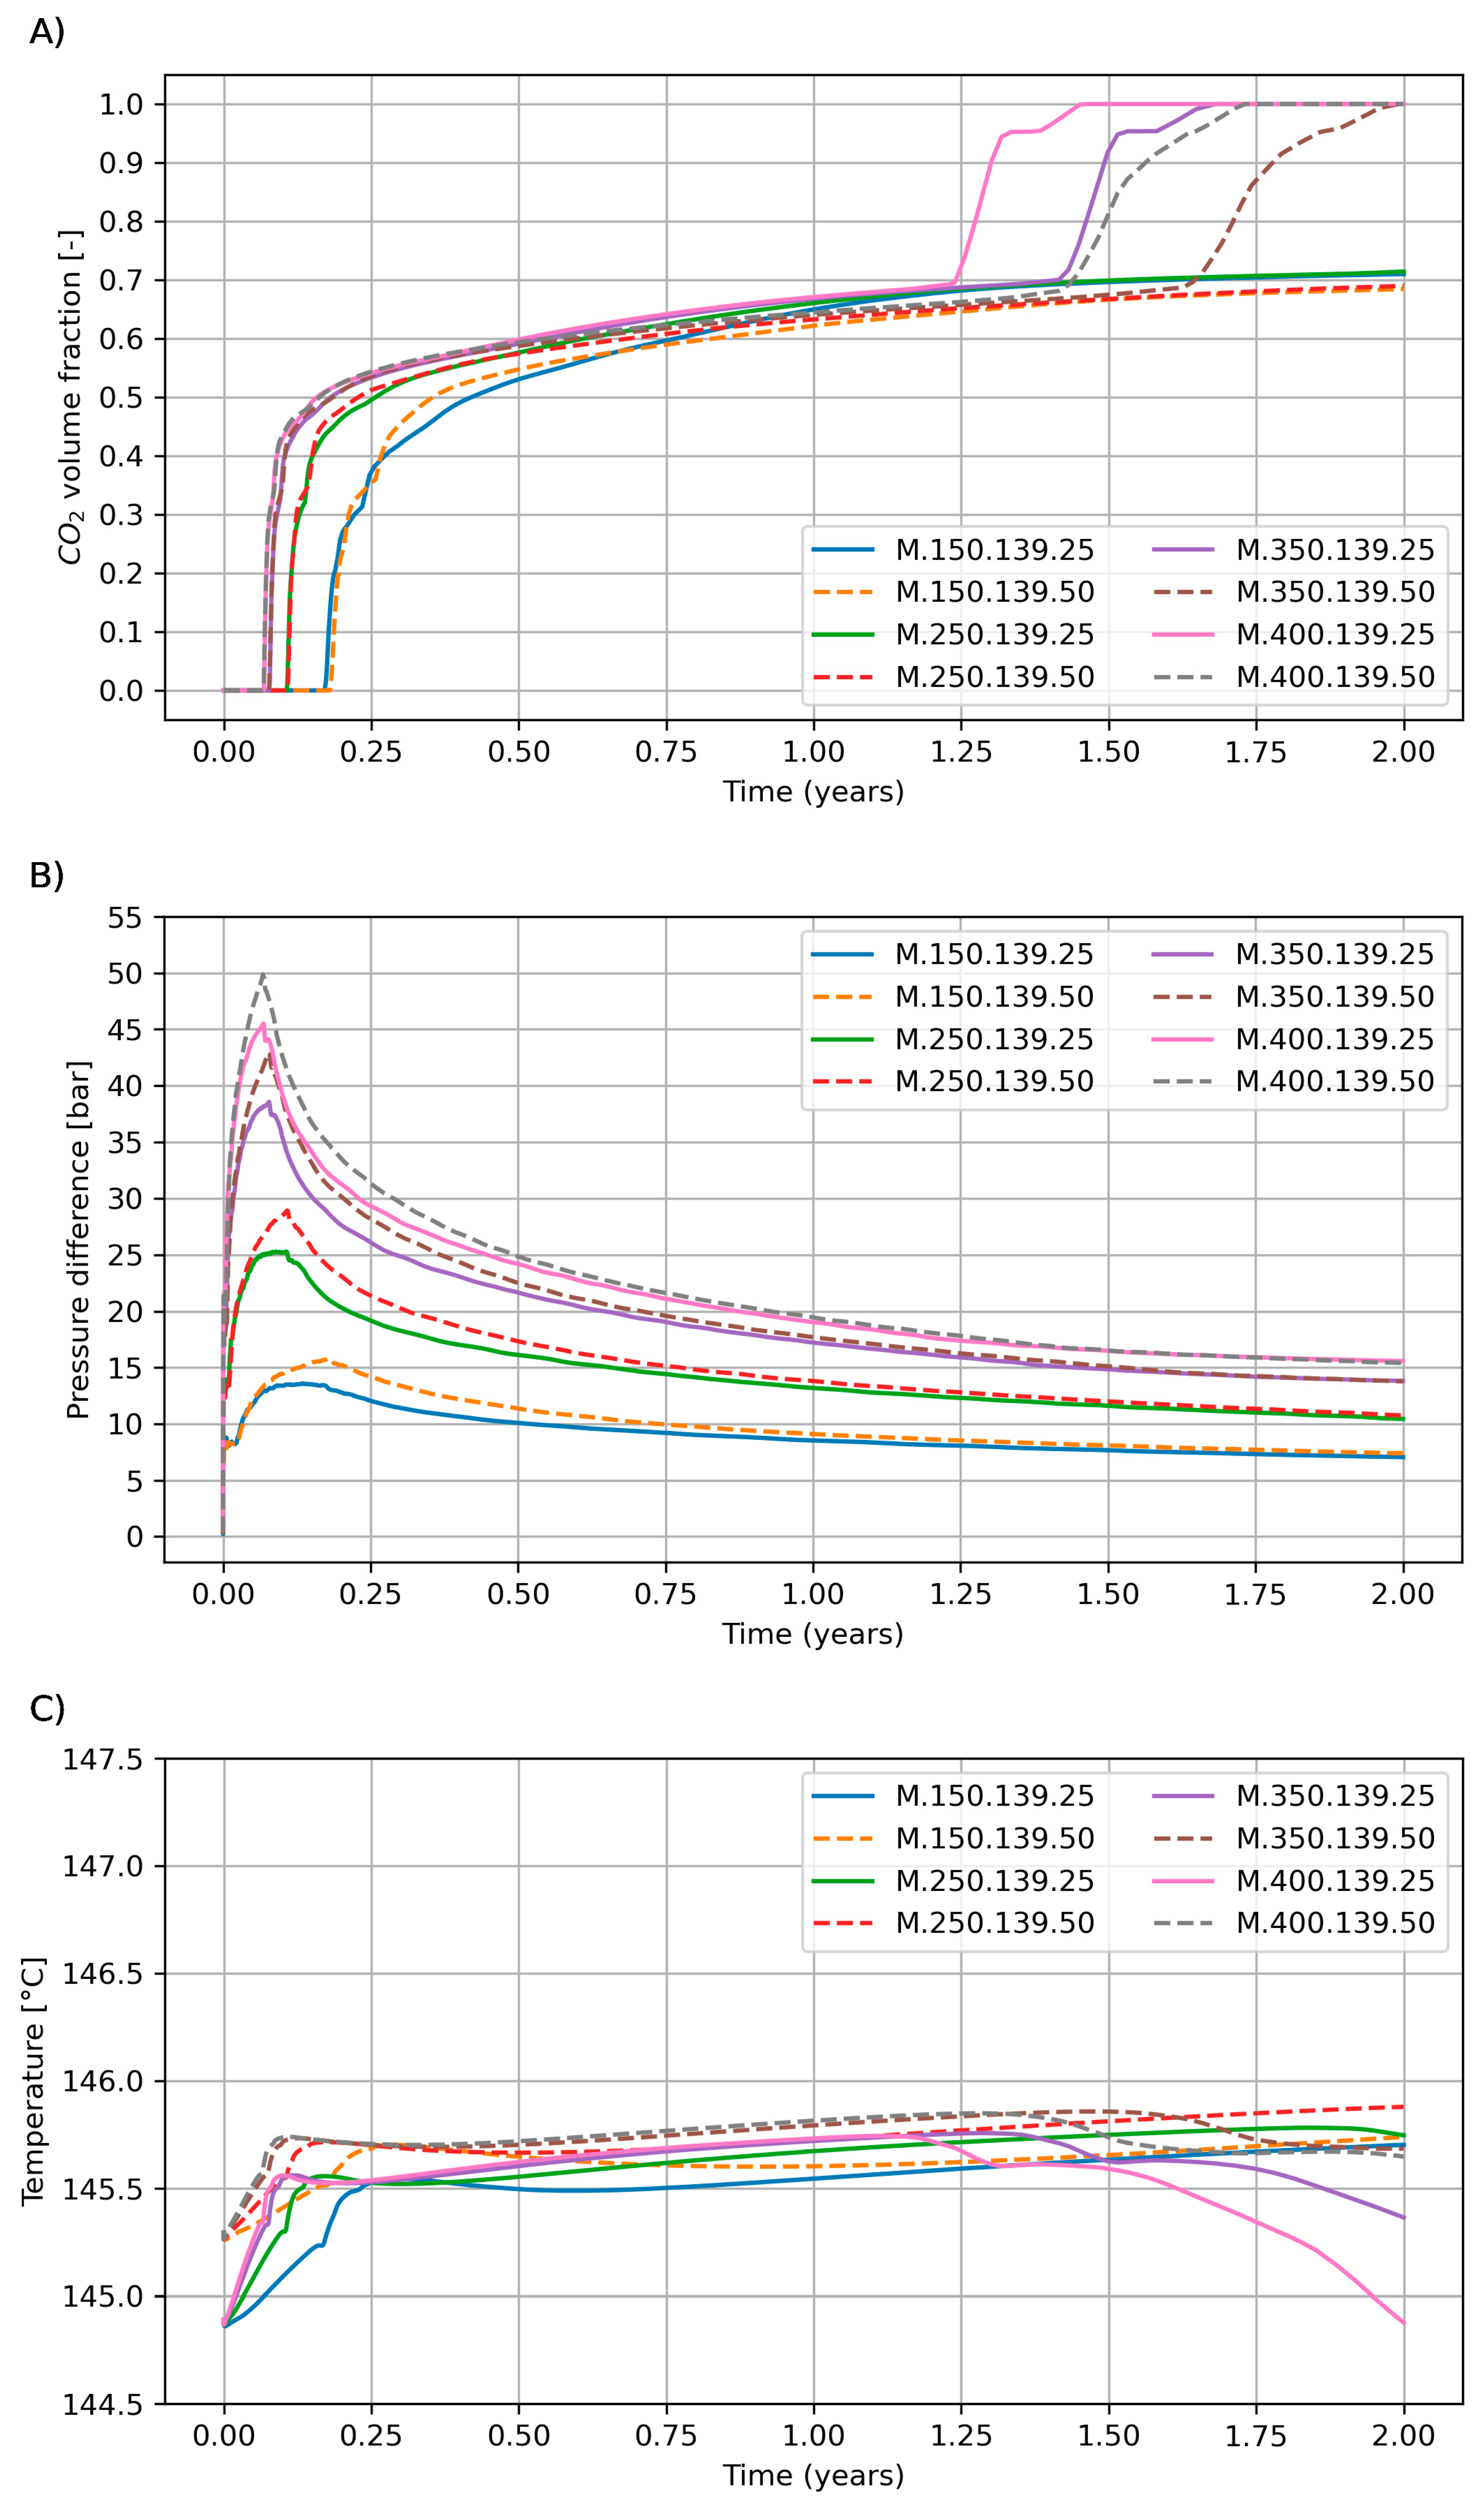
Results of the phase 1 simulation are plotted in Figure 11.
As can be seen from the plot on the Figure 11A, for low and medium CO2 flow rates, simulation results indicate the impossibility of achieving full carbon dioxide saturation at the inlet to the production well within the first 2 years. For mass flows ranging from 150 to 250 kg/s, the maximum CO2 saturation reached is approximately 70%. For high mass flows, i.e., 350 and 400 kg/s, the model indicates a sharp increase in CO2 saturation in the surroundings of the production well after approximately 1.25–1.62 years from the start of injection. In both cases, it is possible to achieve full saturation of the fractures connecting the injection well with the production well with CO2 within 2 years. The sharp increase in CO2 concentration observed after a certain period can be attributed to the pressure gradient in the reservoir reaching a threshold value between the injection and production wells. At this point, water is more effectively displaced from the pore space by carbon dioxide. This pressure gradient is strongly influenced by the injection and production rates, as clearly illustrated in Figure 11B.
The highest pressure difference between both wells is forecasted to take place in the first month of phase 1 due to the initial “shock” caused by fluid injection and withdrawal and the limited speed of pressure propagation in the formation (Figure 11B). Once the radius of investigation from the production well meets the radius of investigation from the injection well, the injection pressure starts to fall.
Since the CO2 injection temperature is close to the natural temperature of the fractured formation, the drop in reservoir temperature at the production well was generally not observed, except for scenarios involving injection rate of 350 or 400 kg/s of CO2 and layer thickness of 25 m (Figure 11C). This slight temperature decrease—approximately 0.4 °C and 0.9 °C, respectively, at the end of phase 1—coincides with the rise in CO2 concentration within the production blocks (Figure 11A).
The influence of vertical mesh resolution on phase 1 modeling is clearly visible. Models with 25 m thick layers exhibit significantly shorter time intervals between the start of CO2 injection and the point at which CO2 concentration begins to exceed 70%, ultimately reaching 100% in the production blocks. This difference is about 0.2–0.3 years when compared with models consisting of 50 m thick layers.
Considering that increasing the vertical resolution and the number of layers between the upper and lower boundary conditions significantly enhances the accuracy of the simulation, the geothermal system state after two years of initial CO2 injection—represented by the M.350.139.25 model—was selected as the basis for further calculations.

2.5. Phase 2—Continous Operation of CO2-EGS

The state of the system after the end of phase 1 (assuming a constant injection rate of 350 kg/s) was loaded as the initial conditions for the simulation of phase 2, i.e., the full-scale operation of CO2-EGS. Phase 2 is scheduled to last 50 years in order to verify production sustainability in the long run. In total, 9 variants were modeled, with 3 injection flow rates, i.e., 50, 100, and 150 kg/s of supercritical CO2 at temperatures of 45, 60, and 75 °C. All simulations were carried out using the “well on deliverability” model, assuming that the pressure in the production blocks could not drop below 64 MPa in order to keep fractures open. The productivity index value was estimated at 2.45∙10−11 m3.

3. Results

One of the main goals of this research was to simulate the process of the fractured zone saturation with CO2, bearing in mind that one of the possible technologies for generating electricity is the direct expansion of supercritical CO2. Therefore, in order to avoid separation of CO2 from water, it is necessary for this technology that after the end of phase 1, the fluid flowing into the production well is CO2 only. It was decided that a reasonable time for phase 1 is 2 years, after which the regular operation should start.
The following characteristics were determined for each scenario in phase 1, phase 2, or combined, excluding those that are directly available from the simulation output.
  • Average flow rate in the production well:
m a v = i = 1 n m i · t i i = 1 n t i
where m i is the mass flow rate from the production well during time interval t i , regardless of the fluid composition; i = 1 n t i = 6.3072 × 10⁷ s.
  • Production-to-injection flow rate ratio:
r p r o d / i n j = i = 1 n m i · t i i = 1 n q i · t i = m a v q
where m i and t i are the same as in Equation (6), while q i is the injection rate, which is constant throughout phase 1 and phase 2 (denoted here as q ).
  • Total CO2 injected:
C O 2 i n j = i = 1 n q i · t i
where q i and t i are the same as in Equation (7).
  • Total CO2 extracted:
C O 2 e x t = i = 1 n m i C O 2 · t i
where m i C O 2 is the mass flow rate of CO2 in gaseous (supercritical) state from the production well during time interval t i .
  • Total CO2 stored:
C O 2 s t = C O 2 i n j C O 2 e x t = i = 1 n ( q i m i C O 2 ) · t i
where q i , m i C O 2 , and t i have the same meaning as in Equations (8) and (9), respectively.
  • Cumulative CO2 storage ratio:
r c u m s t = C O 2 s t C O 2 i n j
where r c u m s t can be calculated at any time.
Results are summarized in Table 3 and in Figure 11. It is clearly demonstrated that in order to achieve 100% saturation of CO2 in the production well within 2 years, it is necessary to provide a very high initial injection rate. The break-even flow rate for the Gorzów Block case is 350 kg/s; therefore, this scheme was chosen as the optimal one before running phase 2 of the system operation. Table 4 presents the distribution of supercritical CO2 at the end of phase 1, categorized into gaseous and aqueous phases across various rock types. For details on the spatial distribution of these rock types, please refer to Figure 10.
The results of phase 2 are gathered in Table 5 and presented in Figure 12, Figure 13, Figure 14, Figure 15 and Figure 16. A CO2 balance at the end of phase 2, analogous to phase 1, is presented in Table 6.

4. Discussion

Despite simplifying assumptions regarding the geometry of the fractured zone, the results of different variants of numerical modeling allowed for observation of interesting behavior of supercritical CO2 in EGS-type formations.
When analyzing the phase 1 results, the following correlations can also be noticed:
  • The cumulative CO2 storage ratio is the ratio of the total mass of CO2 permanently stored in the formation to the total mass of CO2 injected over a period of time. This ratio appeared to be inversely proportional to the injection rate of CO2.
  • The production to injection ratio is the greater, the higher the mass flow rate of injected CO2. This is due to the fact that a higher injection flow rate prevents the rapid release of pressure from the fractured zone into the host rock, and thus allows preserving a relatively high flow between the injection and production wells, while maintaining the pressure above the threshold of 64 MPa, below which fractures may close.
  • In order for CO2 to become the only component flowing into the production well within a reasonable time period, it must be injected with a sufficiently high intensity. The simulation results indicate that there is a certain breakthrough point below which flow such an effect may never be achieved because it will not be possible to completely displace the water remaining after fracturing the rocks.
Analyzing the results of phase 2, which are gathered in Table 5 and presented in Figure 12, Figure 13, Figure 14, Figure 15 and Figure 16, the following conclusions may be drawn:
4.
The injection rate has a greater impact on the production temperature than the injection temperature, if we consider reasonable limits for both of these parameters.
5.
In the Gorzów Block case, the cold front approaches the production well after 10 years in the worst case (models M.150.X) and after approx. 30 years in the best-case scenario (models M.50.X; Figure 12, where X is the injection temperature in °C at the injection depth).
6.
After achieving 100% saturation of the fractured zone with CO2, most of the injected CO2 during phase 2 will be extracted, not stored, assuming very low permeability of rocks outside of the fractured volume. As can be seen in Table 5, the ratio of CO2 extracted to injected, considering phase 2 only, is increasing with the increasing injection rate, from 77% for the injection rate of 50 kg/s up to 92% for the injection rate of 150 kg/s. Therefore, the CO2 storage process in EGS-like formations, after reaching the initial saturation, becomes much less efficient in phase 2 and is decreasing with increasing injection rate.
7.
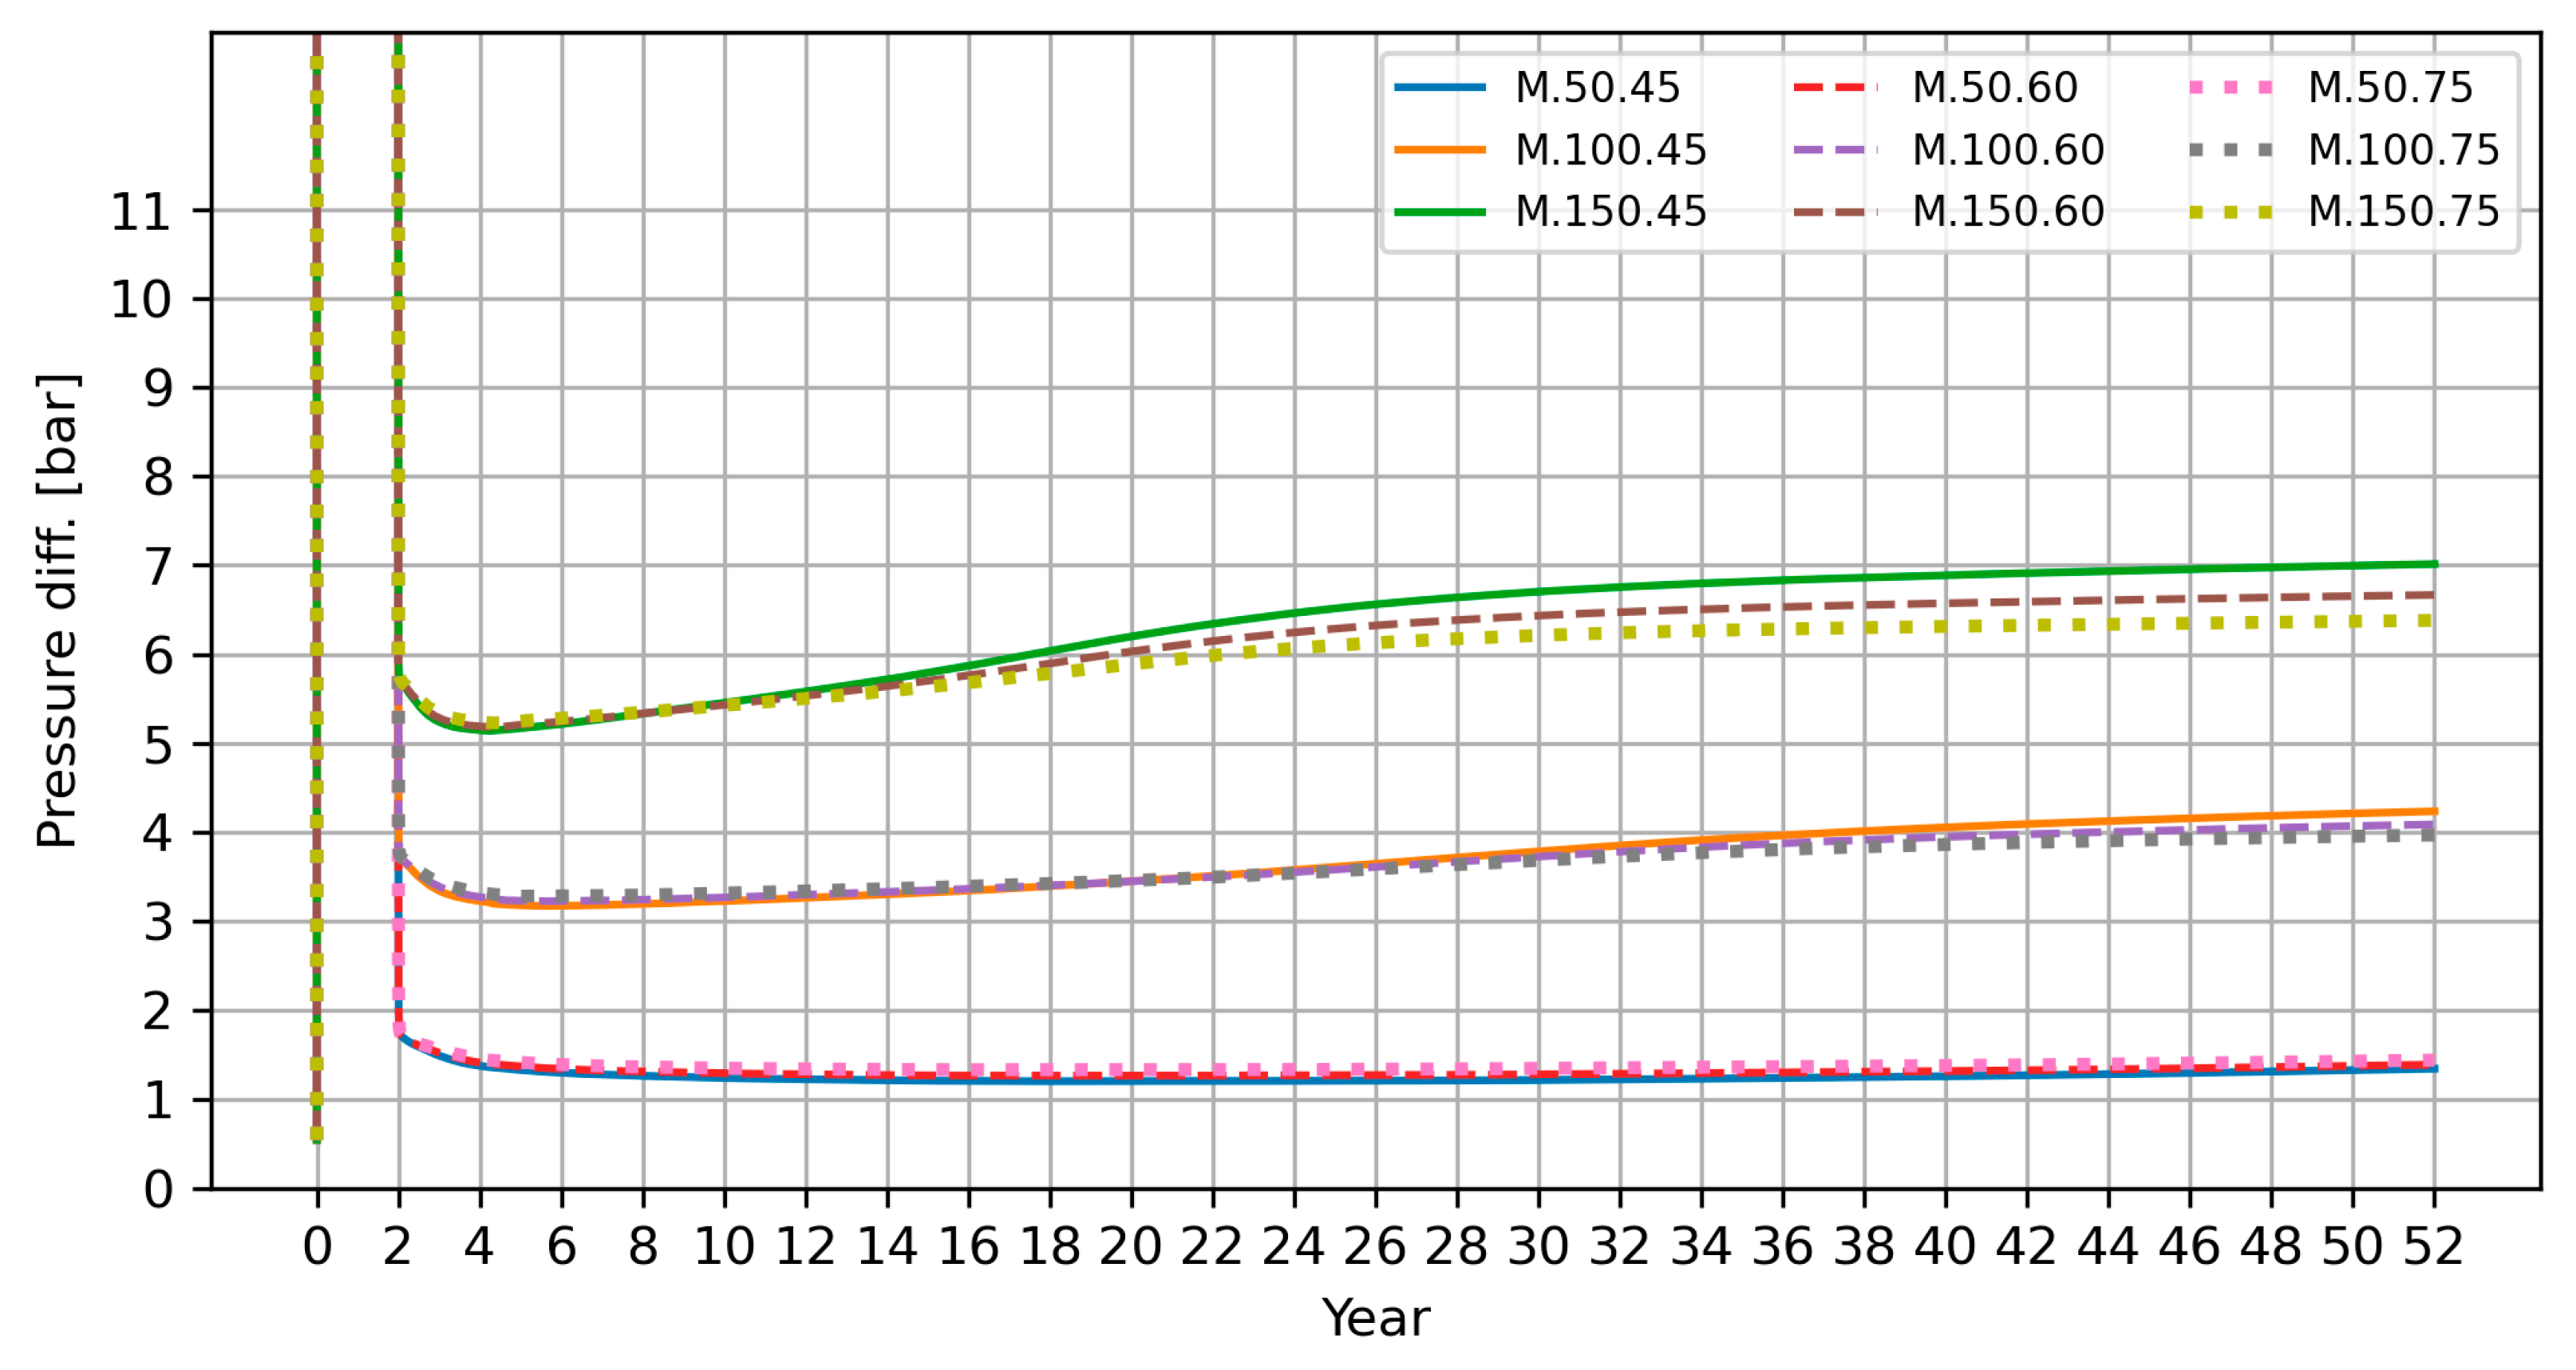
The pressure difference between the injection and production wells is highly sensitive to the injection rate and depends only to a small extent on the injection temperature (Figure 13). In all cases, the pressure difference is slightly increasing with time as a result of increasing injection pressure (reservoir pressure around the production well is set to a fixed value of 64 MPa in this study).
8.
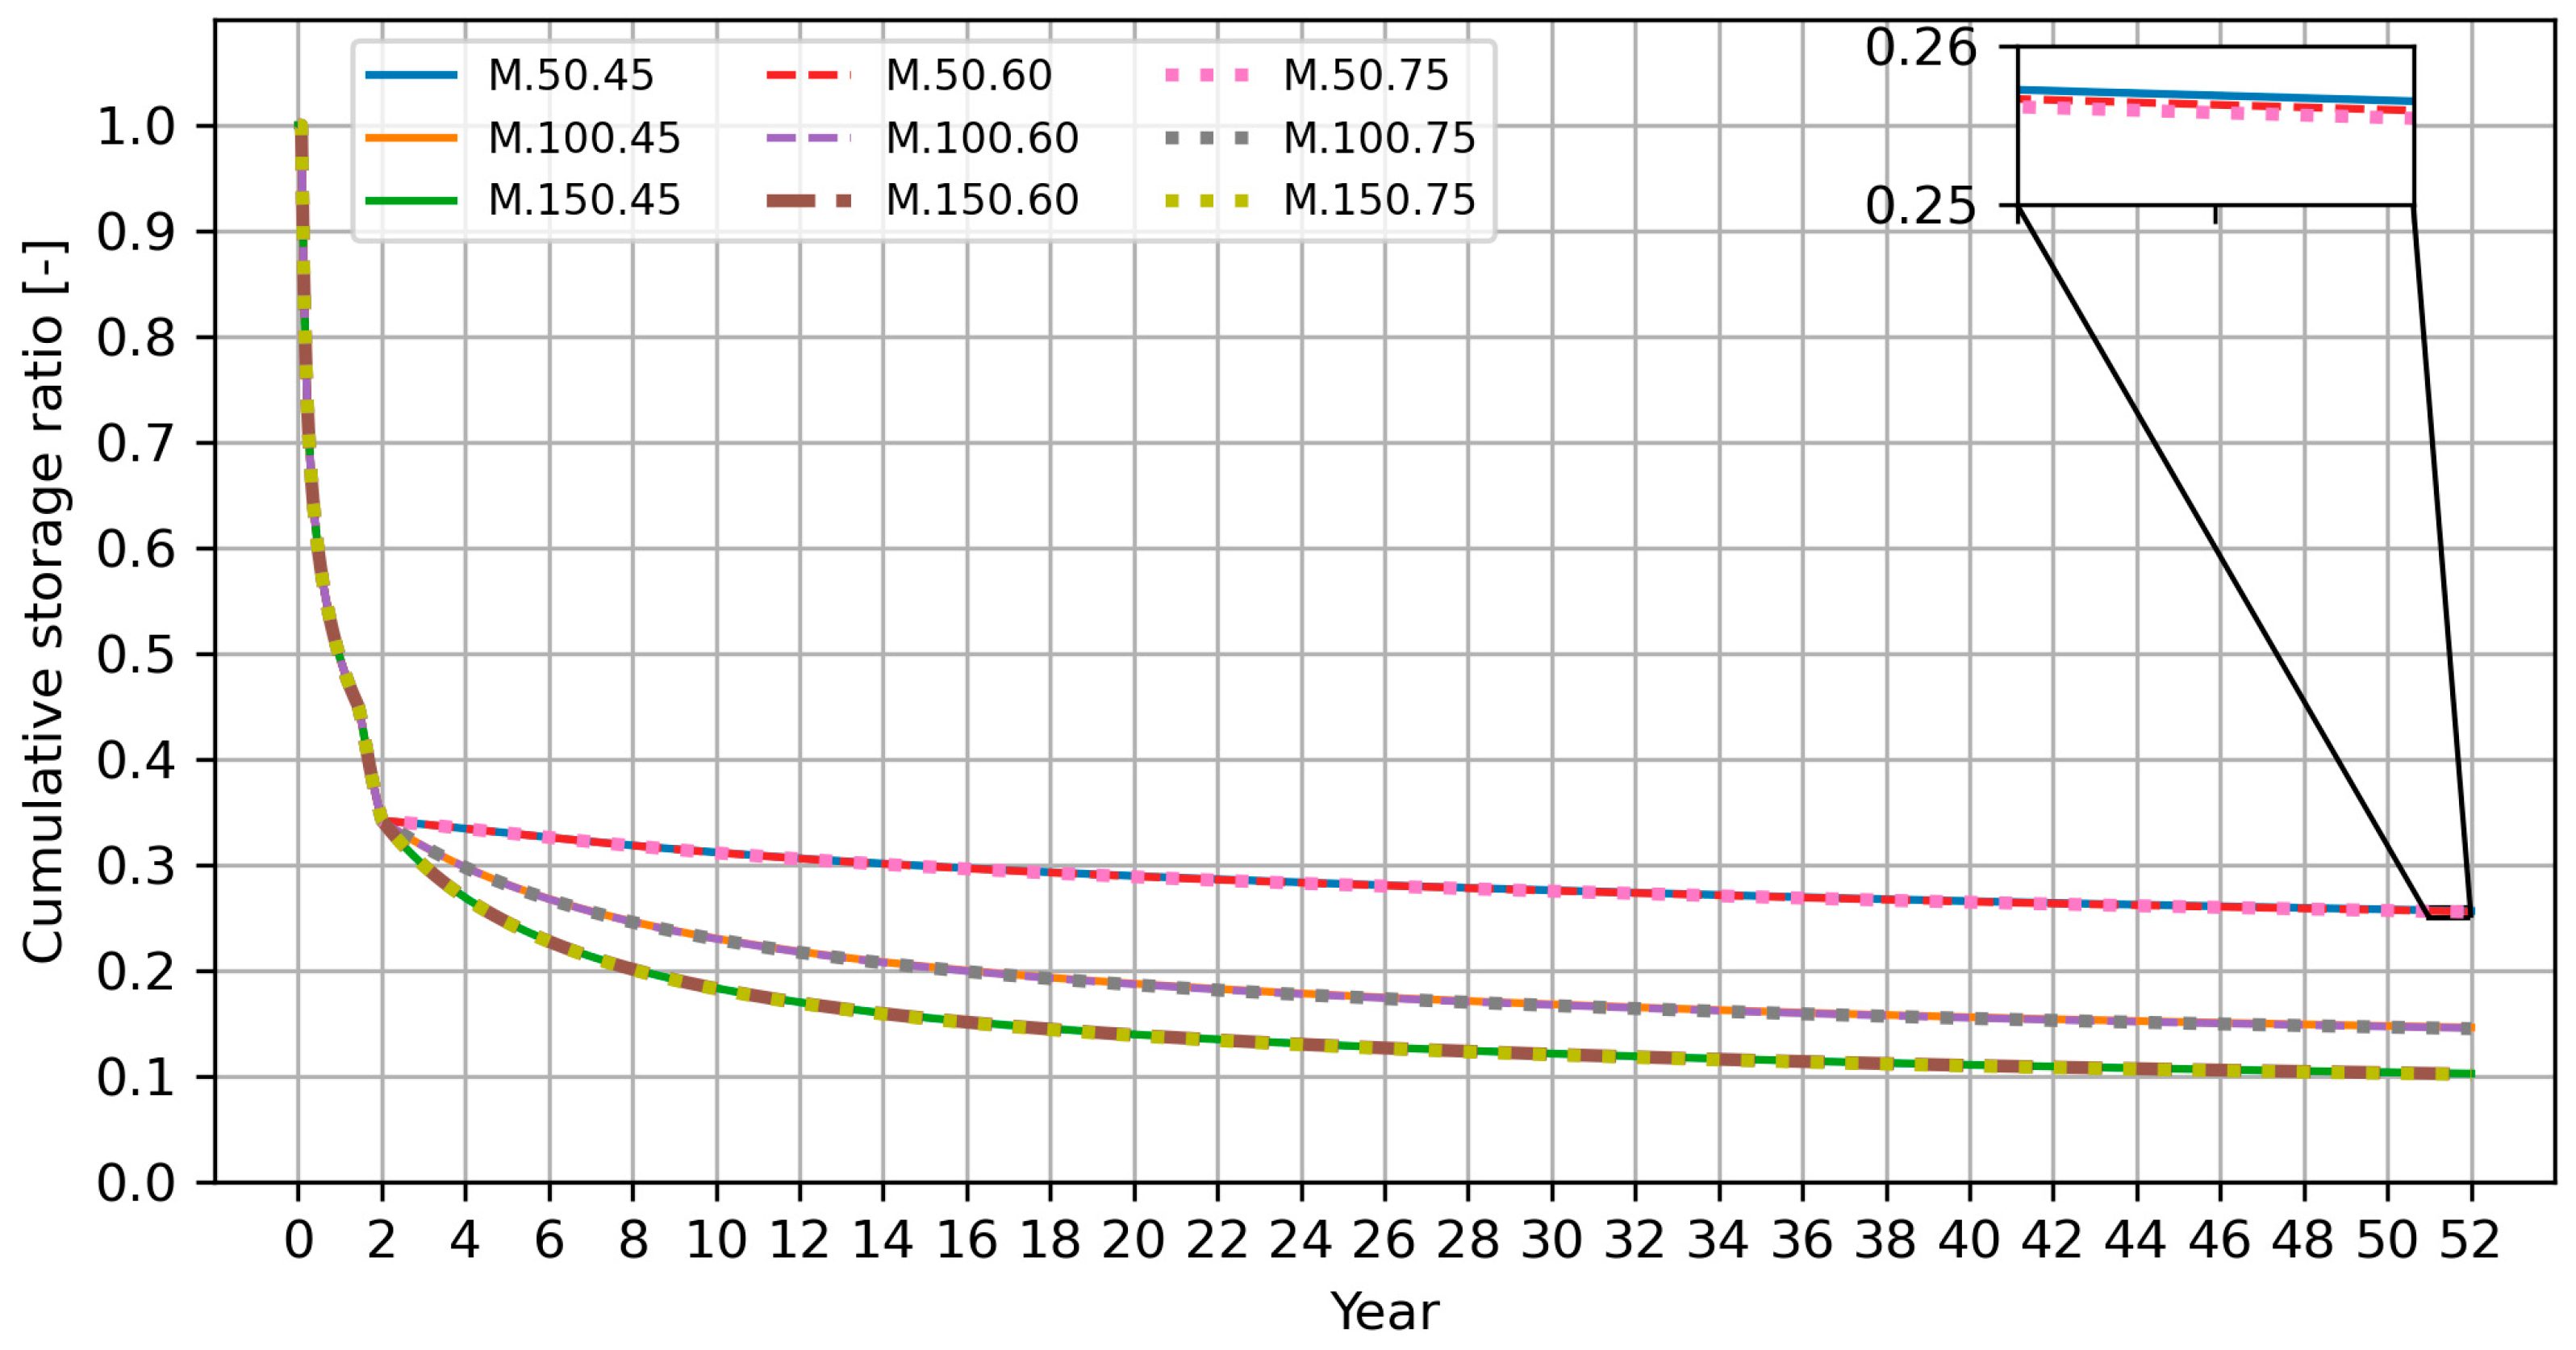
The cumulative CO2 storage ratio after 52 years, considering phases 1 and 2 combined, is highly dependent on the injection rate, but completely independent of the injection temperature. It declines with time for all cases, as proven on Figure 14.
Interesting conclusions can be drawn by analyzing CO2 mass balance between different phases and rock types at the ends of phase 1 and phase 2. These data are presented in Table 4 and Table 6, respectively. Solubility of carbon dioxide in water generally decreases with increasing temperature, but according to Henry’s law, it increases with increasing partial pressure of gas. In supercritical conditions, this relationship also holds, but above a pressure of approximately 30 MPa and a temperature of ca. 80 °C, CO2 solubility in water is practically constant for a given pressure, or even increases slightly [49]. As shown in Table 4, approximately two-thirds of the injected CO2 remains within the fractured zone (FRACT), while one-third migrates into the host rock (VOAUT). Notably, the CO2 injection rate has minimal impact on the mass balance between these domains, with minor variations attributed to differences in vertical resolution of the model grid. In the fractured zone, CO2 predominantly exists in the gas-like phase due to prior water displacement, whereas in the host rock, where a significant part of the pores remain filled with water, the ratio of gaseous to dissolved CO2 is approximately 2:1.
At the end of phase 2, approximately 86% of the stored CO2 resides in the host rock, while 11.4–12.4% remains in the fractured zone (Table 6). Differences across injection schedules are low. A slight reduction in CO2 storage within the FRACT domain with increasing injection temperature is attributed to decreased dynamic viscosity of CO2, facilitating lateral migration (Figure 16, middle part). Within the fractured zone, the injected CO2 remains in the gas-like phase, whereas in the host rock, the average ratio of gaseous to dissolved CO2 is approximately 4.5:1.
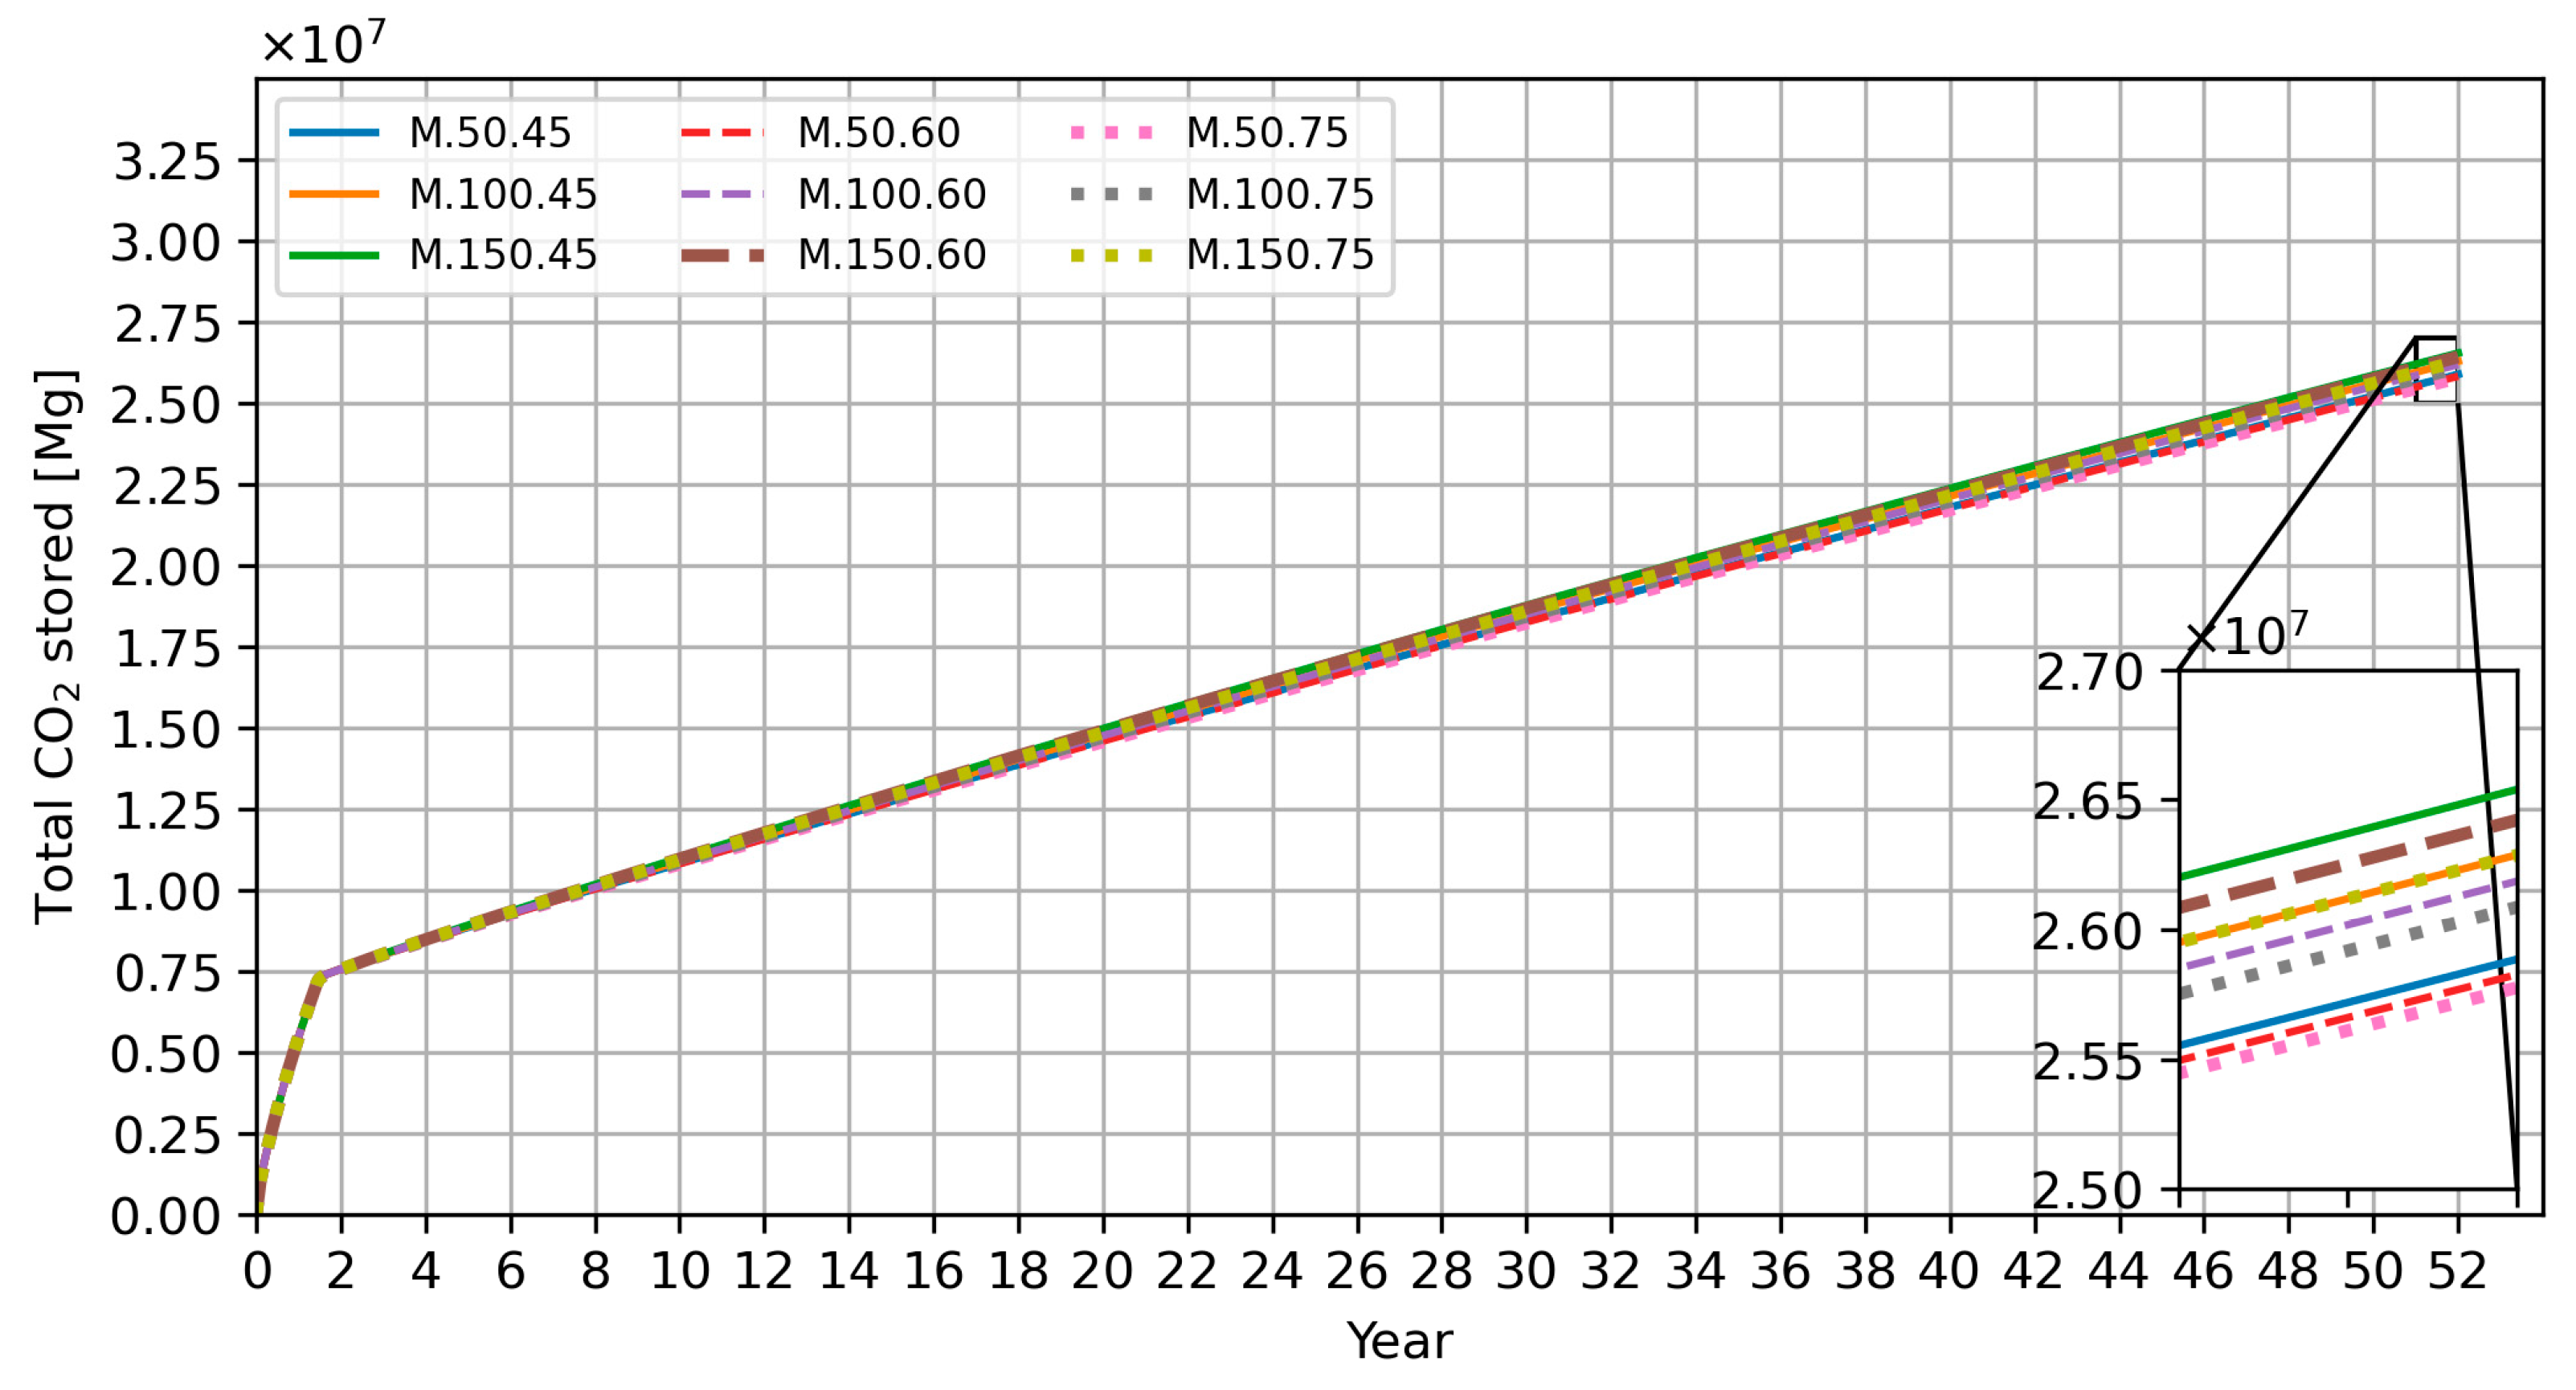
The total storage capacity of CO2 during the lifetime of the Gorzów Block project is estimated at around 26 Mt of CO2, of which 7.58 Mt of CO2 can be stored within the first two years (phase 1, constant injection of 350 kg/s of supercritical CO2). Throughout the full system operation (phase 2), the storage capacity is estimated at 364 kt to 379 kt of CO2 annually and is almost independent from the injection rate, because most of the injected CO2 is recovered (Table 5). It is worth mentioning here that the CCS capacity in about 30 operating facilities in September 2022 was estimated at 42.5 Mt of CO2 per year, and another 200 Mt of CO2 capacity is under development [50]. Therefore, it can be concluded that if the construction of the CO2-EGS system in the Gorzów Block were to be implemented, in addition to energy production (mostly for heat), this system would also be an element of the global effort to develop geological storage facilities for storing carbon dioxide, with a capacity up to 0.38 Mt CO2 annually.

5. Conclusions

Current research on the underground use of carbon dioxide goes significantly beyond enhanced oil recovery (EOR) or its underground storage. One of the relatively new research directions is the use of supercritical CO2 to extract heat from hot dry rock or enhanced geothermal systems. The example of the numerical model of the Gorzów Block in western Poland provides a few interesting results, especially in the context of achieving 100% saturation of the EGS reservoir in CO2. As it turns out, this is a key technological challenge that has been most often ignored in previous research work. How long the period of water displacement by CO2 will last will largely determine the moment of commencement of full-scale operation of the installation, as well as its economic viability.
The analysis of various variants in the case of the Gorzów Block indicates that in phase 1 a very high mass flow rate of CO2 should be injected at a temperature close to the reservoir temperature to achieve the desired effect, i.e., pure CO2 reaching the production well as quickly as possible without a drop in temperature. In turn, during full-scale operation (phase 2), a compromise must be found between the high flow rate and low injection temperature on the one hand and the risk of rapid breakthrough of the cold front and an increase in flow resistance on the other hand. Also, the significant difference between the amount of injected CO2 during phase 1 and phase 2 will create a challenge in the design of the transport pipeline between the CO2 source and the injection facility. For what flow should the pipeline be designed? Would it be profitable to transport CO2 using tanker trucks in phase 1 and, for the full-scale operation, to build a pipeline with a smaller diameter? How long is it economically justified to wait until full-scale operation begins? These and other questions remain open, and the goal of the EnerGizerS project was to answer at least some of them.

Author Contributions

Conceptualization, M.M., A.S., and L.P.; Data curation, M.M.; Formal analysis, M.M., L.P., and P.G.; Funding acquisition, A.S.; Investigation, M.M. and A.S.; Methodology, M.M. and A.S.; Project administration, A.S.; Resources, M.T. and K.P.; Software, M.M. and L.P.; Supervision, M.M. and A.S.; Validation, M.T.; Visualization, M.M. and L.P.; Writing—original draft, M.M., M.T., A.S., K.P., L.P., and P.G.; Writing—review and editing, M.M., A.S., and K.P. All authors have read and agreed to the published version of the manuscript.

Funding

This work was developed within the Polish–Norwegian project “CO2-Enhanced Geothermal Systems for Climate Neutral Energy Supply”, acronym EnerGizerS, registration number NOR/POLNOR/EnerGizerS/0036/2019, with funding from the Norway Grants 2014–2021 via the National Centre for Research and Development.

Data Availability Statement

Source code for PyTOUGH, TOUGH3 files, or summaries of modeling results for all modeling variants in XLSX files can be provided upon request. Please contact Maciej Miecznik. The raw output files from the TOUGH3 simulation (CSV and DAT files) are of the order of a few GB in size from each simulation, hence their sharing is possible, but only after reasonable justification. More information about the EnerGizerS project can be found at http://energizers.agh.edu.pl/en/.

Conflicts of Interest

The authors declare no conflicts of interest. The funders had no role in the design of this study; in the collection, analyses, or interpretation of data; in the writing of the manuscript; or in the decision to publish the results.

Abbreviations

The following abbreviations are used in this manuscript:
b.s.l.Below sea level
CCSCarbon capture and storage
CO2-EGSCO2-fed enhanced geothermal system
EGSEnhanced geothermal system
EOREnhanced oil recovery
EOSEquation of state
GCSGeological carbon storage
HDRHot dry rock
JTJoule–Thompson effect
kt1000 tons
MDMeasured depth
Mt1,000,000 tons
sCO2Supercritical carbon dioxide
TVDTrue vertical depth

Appendix A. Determination of the Parameters of the Injected CO2 in Phase 1
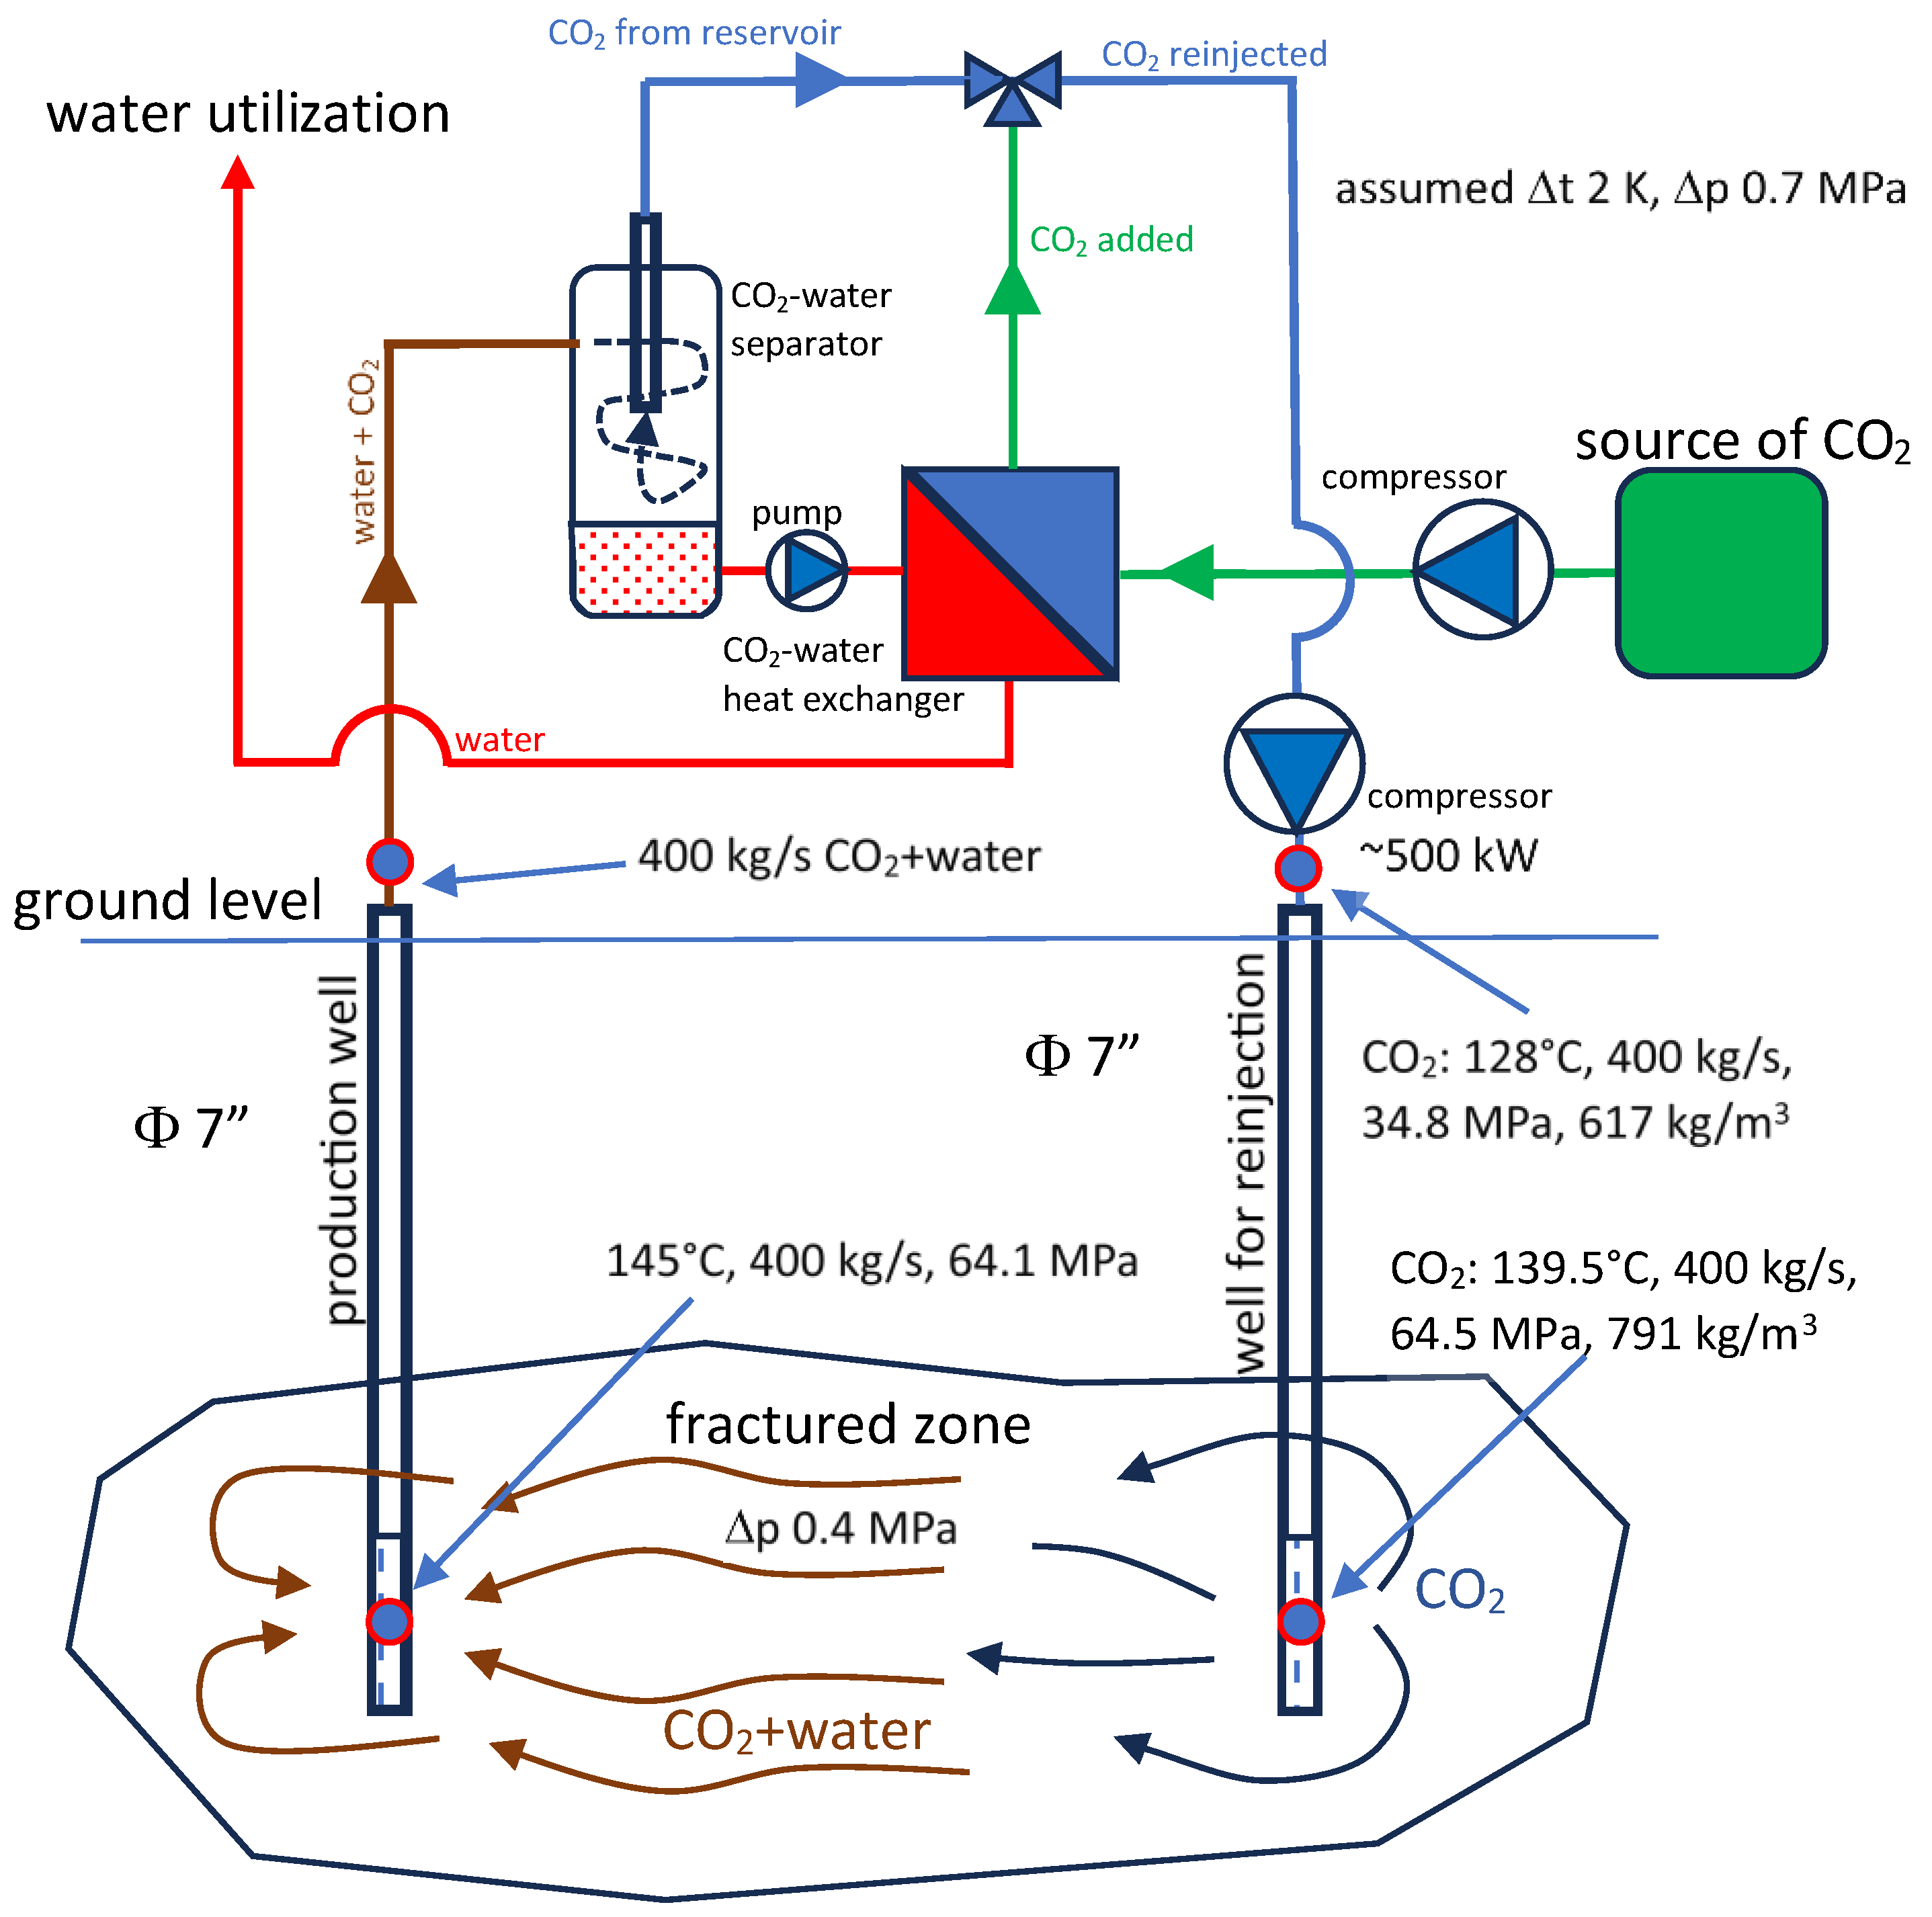
Production of pure CO2 is possible after the displacement of water remaining in reservoir paths (fractures) connecting injection with the production well. Water displacement requires a large stream of carbon dioxide, which can be challenging to supply continuously from external sources. Therefore, it is proposed to apply CO2 recirculation.
In the initial period of carbon dioxide injection, water will be gradually displaced from fractures to the peripheral areas of the reservoir. However, due to the simultaneous start of production well operation, only water inflow will be observed. Pumping the production well is required to maintain constant parameters at the wellhead of the injection well and, in particular, to limit the energy consumption of the injection pumps. After some time, the inflow of CO2 into the production well will be observed, gradually increasing its concentration in the mixture. Phase 1 of the CO2-EGS operation will end once CO2 is the only component pumped through the production well.
A technological diagram of the installation designed to achieve the intended goal is shown in Figure A1. Throughout phase 1, geothermal water exploited from the production well will have a temperature close to the formation temperature of approximately 145 °C—especially at mass flow rates exceeding 100 kg/s. This water will heat compressed carbon dioxide, which will be supplied from an external source. Then, the CO2 heated by water from the well will be additionally compressed before being injected into the fractured reservoir. Compression, thanks to the Joule–Thompson effect (JT), will increase the temperature of the injected fluid.
In the later stage of phase 1, when the inflow to the production well is two-component, gas and liquid phases need to be separated. The separated CO2 is mixed with CO2 from an external source, and then the total stream of CO2 is heated in a heat exchanger using previously separated hot water. Over time, less CO2 will be needed from an external source. Its mass flow will correspond to the amount of CO2 permanently stored in the EGS formation. Additionally, CO2 is also pumped into the formation to prevent fractures closing that may happen when the pressure drop is too high.
During CO2 injection, the rock formation cools down, limiting the available power during the regular operation of the CO2-EGS. The assessment of the state of the fractured zone after the period of water displacement, i.e., at the beginning of the system’s standard operation, requires determination of the 3D temperature distribution disturbed by this process. It depends on many parameters, of which the mass flow rate and temperature of the injected CO2 are the most important. The CO2 temperature at a depth of a liner of the reinjection well was evaluated using mathematical modelling, taking into account the Joule–Thomson effect, flow resistance through wells, and heat exchange with the rock formation. Carbon dioxide parameters were calculated using the CoolProp library, version 6.1.1 [51]. Calculations were performed in the PTC MathCad 9.0.0 environment.
The zone balance method was used for modelling, which required dividing both boreholes into several zones. Calculations related to flow resistance, heat exchange with the rock formation, and the JT effect were carried out separately for each zone. In the case of a production well, the boundary conditions were reservoir pressure and temperature. Fluid parameters in adjacent well intervals were calculated in the direction from the reservoir to the surface. In the case of the injection well, the boundary conditions were the fluid parameters at the wellhead. Fluid parameters in adjacent intervals were calculated in the reverse direction, i.e., from the ground surface to the reservoir. According to its definition, the Joule–Thomson effect is defined as an isenthalpic change in temperature caused by a pressure change. It was assumed that the specific enthalpy, density, specific heat, and other thermophysical parameters of CO2 were constant in the given zone. In the case of temperature and pressure, the inflow and outflow values to a zone were calculated. All other parameters were determined for mean temperature and pressure values.
Figure A1. Technological diagram of the system for recirculation and supplementation of CO2 in phase 1.
Energies 18 04825 g0a1
Thermal power losses or gains per well length as a function of time can be estimated using Equation (A1) [52]:
q f r = 4 Π λ t f t l n 4 λ c ρ τ r w 2 2 γ
where:
  • qfr—Unit heat flux exchanged between the fluid and the rock mass [W/m].
  • λ—Rock thermal conductivity [W/(m∙K)].
  • tf—Fluid temperature [K].
  • t—Temperature of the rock mass in natural conditions or at a distance outside the zone of thermal impact of the borehole [K].
  • c—Rock specific heat [J/(kg∙K)].
  • ρ—Rock density [kg/m3].
  • τ—Time for which the qfr value is determined [s]. The model assumes one year of continuous well exploitation.
  • rw—Well radius.
  • γ—Euler’s gamma function.
Flow resistance was estimated based on Equation (A2) [53]:
p =   φ σ   w 2 ρ   L 2 d
where:
  • Δp—Flow resistance [Pa].
  • φ—Pipe roughness coefficient, which usually takes the following values:
  • 1—for smooth and new pipes made of brass, copper, lead,
  • 1.1—for steel and cast-iron pipes, new,
  • 1.56—for cast iron and riveted steel,
  • 1.78—for old steel pipes (this value was assumed in the model as typical for boreholes),
  • 2.22—for old riveted steel pipes.
  • σ—Coefficient of linear resistances.
σ = i f   R e < 3000 :   64 R e i f   3000 R e   10000 :   0.3164 R e 0.25 i f   R > 10 4 :   0.221 R e 0.237 + 0.0032
  • Re—Reynolds number R e =   4 m ˙ π d μ .
  • m ˙ —Mass flow rate [kg/s].
  • π—Pi number [-].
  • d—Well’s inner diameter [m].
  • μ—Dynamic viscosity coefficient [Pa∙s].
  • w—Fluid velocity [m/s].
  • ρ—Fluid density [kg/m3].
  • L—Length of the section where the fluid flow occurs [m].
Due to the Joule–Thomson effect, a decrease in CO2 pressure in the well is accompanied by a decrease in temperature. The scale of this effect was determined using the CoolProp library.
t n J T = t h n 1 , p n t n m
where:
  • Δt(n)JT—Temperature drop in n-th zone caused by the Joule–Thomson effect [K].
  • h(n − 1)—Specific enthalpy of CO2 in n − 1 zone [J/kg].
  • p(n)—Pressure in n-th zone after subtracting the dynamic pressure ( ρ w 2 2 ) flow resistance [Pa].
  • t(n)m—Mean temperature of CO2 in n-th zone [K].
  • t[h(n − 1),p(n)]—Temperature of CO2 corresponding to the enthalpy of CO2 in the n − 1 zone under pressure in n-th zone, after subtracting the dynamic pressure and flow resistance [K].
The driving power of the compressor used for CO2 reinjection (Figure A1) was estimated based on Equation (A5), assuming the mass flow rate and density of CO2 as 400 kg/s and 617 kg/m3, respectively (using reinjection wellhead parameters). The compressor efficiency was assumed to be 0.9:
P c = 400 k g s 617 k g m 3 0.9 = 504   k W
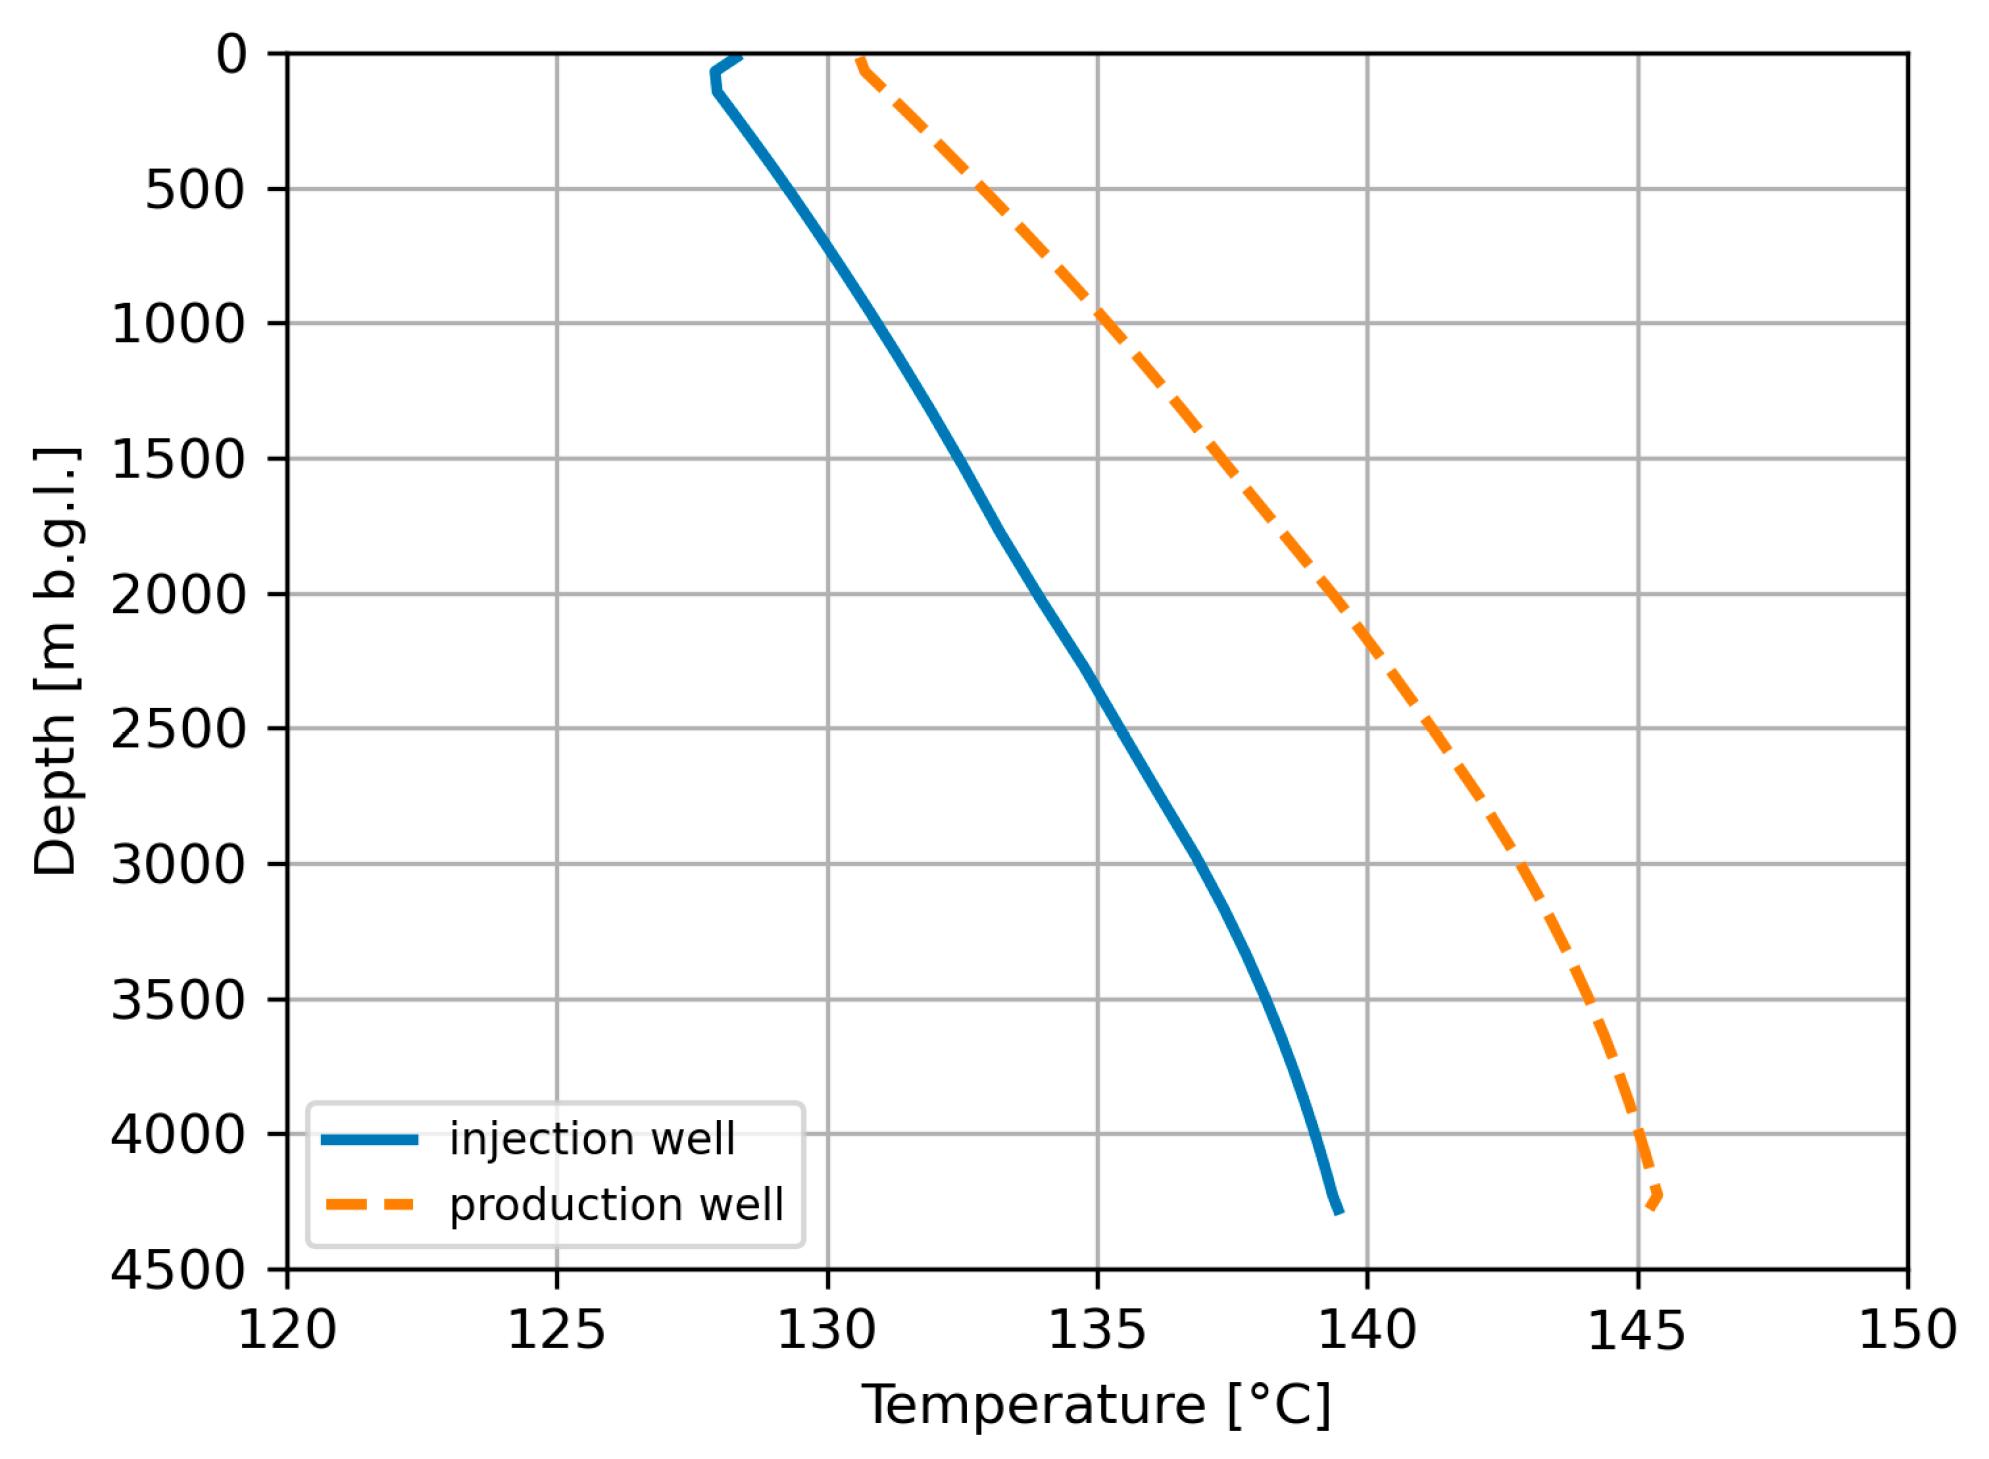
Temperature distribution vs. depth in both wells is shown in Figure A2.
Figure A2. Temperature distribution in production and reinjection wells assuming mass flow rate of 400 kg/s.
Energies 18 04825 g0a2

References

  1. Wetzel, M.; Otto, C.; Chen, M.; Masum, S.; Thomas, H.; Urych, T.; Bezak, B.; Kempka, T. Hydromechanical Impacts of CO2 Storage in Coal Seams of the Upper Silesian Coal Basin (Poland). Energies 2023, 16, 3279. [Google Scholar] [CrossRef]
  2. Gładysz, P.; Pająk, L.; Andresen, T.; Strojny, M.; Sowiżdżał, A. Process Modeling and Optimization of Supercritical Carbon Dioxide-Enhanced Geothermal Systems in Poland. Energies 2024, 17, 3769. [Google Scholar] [CrossRef]
  3. Song, Y.; Jun, S.; Na, K.; Kim, K.; Jang, Y.; Wang, J. Geomechanical challenges during geological CO2 storage: A review. Chem. Eng. J. 2023, 456, 140968. [Google Scholar] [CrossRef]
  4. Brown, D. A hot dry rock geothermal energy concept utilizing supercritical CO2 instead of water. In Proceedings of the Twenty-Fifth Workshop on Geothermal Reservoir Engineering, Stanford University, Stanford, CA, USA, 24–26 January 2000; pp. 233–238. [Google Scholar]
  5. Pruess, K. On production behavior of enhanced geothermal systems with CO2 as working fluid. Energy Convers. Manag. 2008, 49, 1446–1454. [Google Scholar] [CrossRef]
  6. Avanti Isaka, B.L.; Ranjith, P.G.; Rathnaweera, T.D. The use of super-critical carbon dioxide as the working fluid in enhances geothermal systems (EGSs): A review study. Sustain. Energy Technol. Assess. 2019, 36, 100547. [Google Scholar] [CrossRef]
  7. Wu, Y.; Li, P. The potential of coupled carbon storage and geothermal extraction in a CO2-enhanced geothermal system: A review. Geotherm. Energy 2020, 8, 19. [Google Scholar] [CrossRef]
  8. Zhang, F.; Jiang, P.; Xu, R. System thermodynamic performance comparison of CO2-EGS and water-EGS systems. Appl. Therm. Eng. 2013, 61, 236–244. [Google Scholar] [CrossRef]
  9. Zhao, W.; Yuan, Y.; Jing, T.; Zhong, C.; Wei, S.; Yin, Y.; Zhao, D.; Yuan, H.; Zheng, J.; Wang, S. Heat Production Performance from an Enhanced Geothermal System (EGS) Using CO2 as the Working Fluid. Energies 2023, 16, 7202. [Google Scholar] [CrossRef]
  10. Potter, R.; Robinson, E.; Smith, M. Method of Extracting Heat from Dry Geothermal Reservoirs. US Patent No. 3,786,858, 22 January 1974. [Google Scholar]
  11. Breede, K.; Dzebisashvili, K.; Liu, X.; Falcone, G. A systematic review of enhanced (or engineered) geothermal systems: Past, present and future. Geotherm. Energy 2013, 1, 4. [Google Scholar] [CrossRef]
  12. Huang, G.; Hu, X.; Ma, H.; Liu, L.; Yang, J.; Zhou, W.; Liao, W.; Ningbo, B. Optimized geothermal energy extraction from hot dry rocks using a horizontal well with different exploitation schemes. Geotherm. Energy 2024, 11, 5. [Google Scholar] [CrossRef]
  13. Duchane, D. The history of HDR research and development. In Proceedings of the Draft Proceedings of the 4th International HDR Forum, Strasbourg, France, 28–30 September 1998. [Google Scholar]
  14. Bujakowski, W.; Barbacki, A.; Skrzypczak, R. New directions of research in the Polish part of the Sudetic area in the aspect of HDR and EGS technologies. Przegl. Geol. 2013, 61, 706–711. [Google Scholar]
  15. Busby, J.; Terrington, R. Assessment of the resource base for engineered geothermal systems in Great Britain. Geotherm. Energy 2017, 5, 7. [Google Scholar] [CrossRef]
  16. Hori, Y.; Kitano, K.; Kaieda, H.; Kiho, K. Present status of the Ogachi HDR project, Japan, and future plans. Geothermics 1999, 28, 637–645. [Google Scholar] [CrossRef]
  17. Kitano, K.; Hori, Y.; Kaieda, H. Outrline of the Ogachi HDR Project and character of the reservoirs. In Proceedings of the World Geothermal Congress 2000, Tohoku, Japan, 28 May–10 June 2010. [Google Scholar]
  18. Ueda, A.; Yamada, T.; Yajima, T.; Sugiyama, K.; Odashima, Y.; Ito, H.; Todaka, N.; Sato, T.; Ohsumi, S.; Mito, S.; et al. CO2 sequestration into hydrothermal system at Ogachi HDR site. Jpn. Mag. Mineral. Petrol. Sci. 2009, 38, 220–231. [Google Scholar] [CrossRef]
  19. Sowiżdżał, A.; Starczewska, M.; Papiernik, B. Future Technology Mix—Enhanced Geothermal System (EGS) and Carbon Capture, Utilization, and Storage (CCUS)—An Overview of Selected Projects as an Example for Future Investments in Poland. Energies 2022, 15, 3505. [Google Scholar] [CrossRef]
  20. Bujakowski, W.; Barbacki, A.; Skrzypczak, R.; Kasztelewicz, A. Planowane wiercenie badawcze w Karkonoszach dla potrzeb modelowania termicznego systemów gorących suchych skał (HDR). Przegl. Geol. 2012, 60, 199–205. [Google Scholar]
  21. Uliasz-Misiak, B.; Lewandowska-Śmierzchalska, J.; Matuła, R. Criteria for selecting sites for integrated CO2 storage and geothermal energy recovery. J. Clear. Prod. 2021, 285, 124822. [Google Scholar] [CrossRef]
  22. Pruess, K. Enhanced geothermal systems (EGS) using CO2 as working fluid—A novel approach for generating renewable energy with simultaneous sequestration of carbon. Geothermics 2006, 35, 351–367. [Google Scholar] [CrossRef]
  23. Plaksina, T.; White, C. Modeling coupled convection and carbon dioxide injection for improved heat harvesting in geopressured geothermal reservoirs. Geotherm. Energy 2016, 4, 2. [Google Scholar] [CrossRef]
  24. Liu, H.; Qi, L.; Gou, Y.; Zhang, L.; Feng, W.; Liao, J.; Zhu, Z.; Wang, H.; Zhou, L. Numerical modelling of the cooling effect in geothermal reservoirs induced by injection of CO2 and cooled geothermal water. Oil Gas Sci. Technol. Rev. D’ifp Energ. Nouv. 2020, 75, 15. [Google Scholar] [CrossRef]
  25. Miecznik, M.; Tyszer, M.; Sowiżdżał, A.; Andresen, T.; Frengstad, B.S.; Stenvik, L.A.; Pierzchała, K.; Gładysz, P. Numerical modeling of the potential CO2-supplied enhanced geothermal system (CO2-EGS) in the Åsgard field, Norway. Geol. Geophys. Environ. 2024, 50, 175–190. [Google Scholar] [CrossRef]
  26. Wójcicki, A.; Sowiżdżał, A.; Bujakowski, W. Ocena Potencjału, Bilansu Cieplnego i Perspektywicznych Struktur Geologicznych dla Potrzeb Zamkniętych Systemów Geotermicznych (Hot Dry Rocks) w Polsce; Ministry of Environment: Warsaw, Poland; Krakow, Poland, 2013; ISBN 978-83-7863-263-4. [Google Scholar]
  27. Bujakowski, W.; Barbacki, A.; Miecznik, M.; Pająk, L.; Skrzypczak, R.; Sowiżdżał, A. Modelling geothermal and operating parameters of EGS installations in the lower triassic sedimentary formations of the central Poland area. Renew. Energy 2015, 80, 441–453. [Google Scholar] [CrossRef]
  28. Tarkowski, R.; Uliasz-Misiak, B. Prospects for the use of carbon dioxide in enhanced geothermal systems in Poland. J. Clean. Prod. 2019, 229, 1189–1197. [Google Scholar] [CrossRef]
  29. Starczewska, M.; Strojny, M.; Sowiżdżał, A.; Gładysz, P.; Pająk, L. Life cycle assessment of enhanced geothermal systems with CO2 as a working fluid—Polish case study. Clean Technol. Environ. Policy 2025, 27, 1863–1875. [Google Scholar] [CrossRef]
  30. Dadlez, R. Types of local tectonic structures in the Zechstein-Mesozoic complex of northwestern Poland. Biul. Inst. Geol. 1974, 274, 149–177. [Google Scholar]
  31. Narkiewicz, M.; Dadlez, R. Geologiczna regionalizacja Polski—Zasady ogólne i schemat podziału w planie podkenozoicznym i podpermskim. Przegl. Geol. 2008, 56, 391–397. [Google Scholar]
  32. Karnkowski, P.H. Regionalizacja tektoniczna Polski—Niż Polsk. Przegl. Geol. 2008, 56, 895–903. [Google Scholar]
  33. Karnkowski, P.H. Geology, origin and evolution of the Gorzów Block (NW Poland). Przegl. Geol. 2010, 56, 680–688. [Google Scholar]
  34. Moska, R.; Labus, K.; Kasza, P.; Moska, A. Geothermal potential of the Hot Dry Rock in south-east Baltic Basin countries—A review. Energies 2023, 16, 1662. [Google Scholar] [CrossRef]
  35. Sowiżdżał, A.; Machowski, G.; Krzyżak, A.; Puskarczyk, E.; Krakowska-Madejska, P.; Chmielowska, A. Petrophysical evaluation of the Lower Permian formation as a potential reservoir for CO2-EGS—Case study from NW Poland. J. Clean. Prod. 2022, 373, 134768. [Google Scholar] [CrossRef]
  36. Szewczyk, J.; Gientka, D. Terrestrial heat flow density in Poland—A new approach. Geol. Q. 2009, 53, 125–140. [Google Scholar]
  37. Plewa, S. Rozkład Parametrów Geotermalnych na Obszarze Polski; CPPGSMiE PAN: Krakow, Poland, 1994; ISBN 83-86286-15-6. [Google Scholar]
  38. Majorowicz, J.; Wybraniec, S. New terrestrial heat flow map of Europe after regional paleoclimatic correction application. Int. J. Earth Sci. 2011, 100, 881–887. [Google Scholar] [CrossRef]
  39. Majorowicz, J.; Polkowski, M.; Grad, M. Thermal properties of the crust and the lithosphere–asthenosphere boundary in the area of Poland from the heat flow variability and seismic data. Int. J. Earth Sci. 2019, 108, 649–672. [Google Scholar] [CrossRef]
  40. Majorowicz, J.; Grad, M. Differences Between Recent Heat Flow Maps of Poland and Deep Thermo-Seismic and Tectonic Age Constraints. Int. J. Terr. Heat Flow Appl. 2020, 3, 11–19. [Google Scholar] [CrossRef]
  41. Popov, Y.A.; Chekhonin, E.M.; Savelev, E.G.; Ostrizhniy, D.A.; Shakirov, A.B.; Romushkevich, R.A.; Babich, E.A.; Andreyev, B.E.; Spasennykh, M.Y.; Sannikova, I.A. Technique and results of determination of vertical variations in rock thermal properties, temperature gradient and heat flow. Geothermics 2024, 116, 102864. [Google Scholar] [CrossRef]
  42. Jung, Y.; Pau, G.S.H.; Finsterle, S.; Pollyea, R.M. TOUGH3: A new efficient version of the TOUGH suite of multiphase flow and transport simulators. Comput. Geosci. 2017, 108, 2–7. [Google Scholar] [CrossRef]
  43. Jung, Y.; Pau, G.S.H.; Finsterle, S.; Doughty, C. TOUGH3 User’s Guid, Version 1.0; Report no. LBNL-2001093; Lawrence Berkeley National Laboratory, University of California: Berkeley, CA, USA, 2018. [Google Scholar]
  44. Pan, L.; Spycher, N.; Doughty, C.; Pruess, K. ECO2N V2.0: A TOUGH2 Fluid Property Module for Mixtures of Water, NaCl, and CO2; Report no. LBNL-6930E; Lawrence Berkeley National Laboratory, University of California: Berkeley, CA, USA, 2015. [Google Scholar]
  45. Croucher, A. PyTOUGH: A Python scripting library for automating TOUGH2 simulations. In Proceedings of the 33rd New Zealand Geothermal Workshop, Auckland, New Zealand, 21–23 November 2011. [Google Scholar]
  46. Croucher, A. PyTOUGH User’s Guide, Version 1.6.5; University of Auckland: Auckland, New Zealand, 2025. [Google Scholar]
  47. Wojnarowski, P.; Janiga, D. Study of the Effectiveness of the EGS/HDR Fracturing Process with the Application of a 3d Planar Fracture Propagation Model. SSRN 2024, preprint. [CrossRef]
  48. Ahmed, T. Reservoir Engineering Handbook, 5th ed.; Gulf Professional Publishing: Cambridge, MA, USA, 2019; ISBN 978-0128136508. [Google Scholar]
  49. Diamond, L.W.; Akinfiew, N.N. Solubility of CO2 in water from −1.5 to 100 °C and from 0.1 to 100 MPa: Evaluation of literature data and thermodynamic modelling. Fluid Phase Equilibria 2003, 208, 265–290. [Google Scholar] [CrossRef]
  50. Steyn, M.; Oglesby, J.; Turan, G.; Zapantis, A.; Gebremedhin, R. Global status of CCS 2022; Global CCS Institute: Melbourne, Australia, 2022. [Google Scholar]
  51. CoolProp Thermophysical Fluid Properties Library, Ver. 6.1.1. Available online: http://www.coolprop.org (accessed on 24 January 2025).
  52. Carslaw, H.S.; Jaeger, J.C. Conduction of Heat in Solids, 2nd ed.; Clarendon Press: Oxford, UK, 1956. [Google Scholar]
  53. Recknagel, H.; Sprenger, E.; Schramek, E.H. Heating, Air-Conditioning, Hot Water, Cooling—Hand Book (Polish: Ogrzewanie, Klimatyzacja, Ciepła Woda, Chłodnictwo—Poradnik); OMNI SCALA: Wroclaw, Poland, 2008. [Google Scholar]
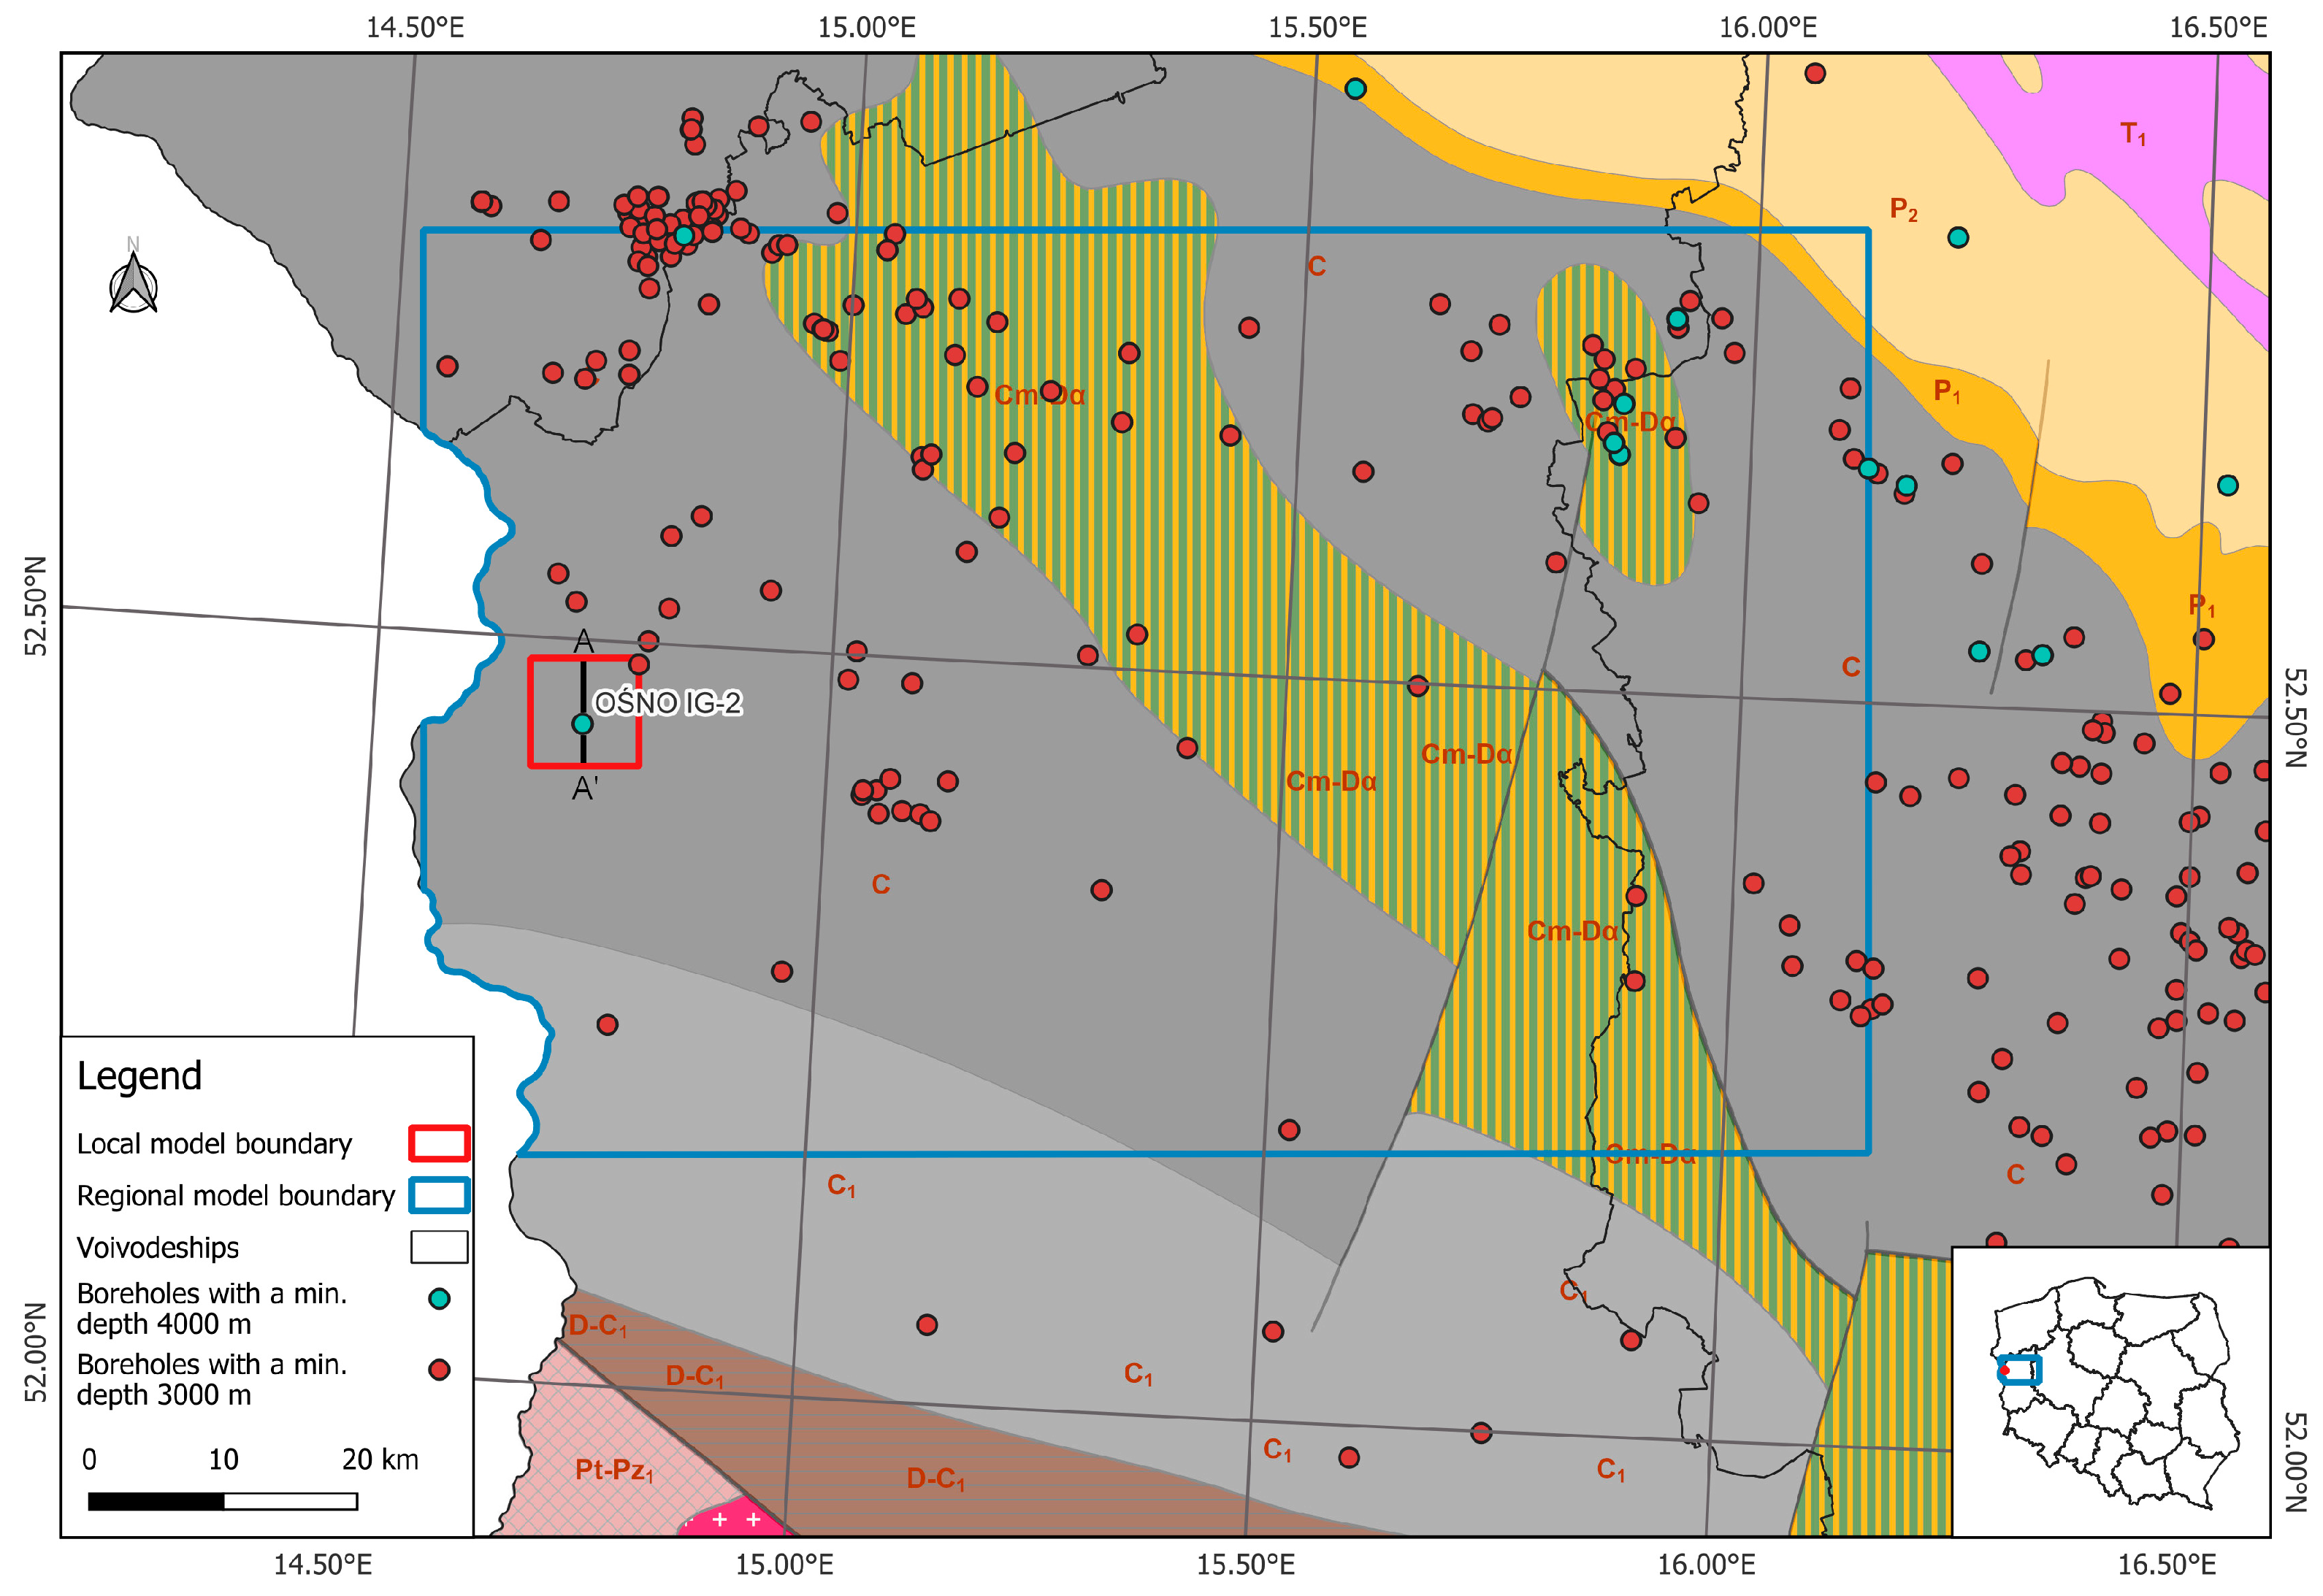
Figure 1. Location of regional and local parametric models against the background of the geological map at the depth of 4000 m b.s.l.
Energies 18 04825 g001
Figure 2. Comparison of the measured and calculated thermal profile of the Ośno IG-2 well with lithostratigraphic profile in the background.
Energies 18 04825 g002
Figure 3. A cross-section of the conceptual model (AA’ on Figure 1).
Energies 18 04825 g003
Figure 4. Workflow for numerical modeling of CO2-EGS in Gorzów Block, Poland.
Energies 18 04825 g004
Figure 5. Calibration of the natural-state model for the Gorzów Block, Poland, case study.
Energies 18 04825 g005
Figure 6. Hydraulic fracture geometry with width property, the best variant [47].
Energies 18 04825 g006
Figure 7. Transition from physical fracture geometry to its numerical representation; view from the top showing permeability anisotropy [25].
Energies 18 04825 g007
Figure 8. Scheme of the computation block with fluid flow either along the fracture or perpendicular.
Energies 18 04825 g008
Figure 9. Permeability K a v .   | |   distribution in the fractured zone, upscaled to the production model grid.
Energies 18 04825 g009
Figure 10. Top (left) and slice view (right) of the numerical model grid of the Gorzów Block, generated by PyTOUGH.
Energies 18 04825 g010
Figure 11. Results of phase 1: (A) CO2 saturation by volume in the production well, (B) pressure difference between injection and production well, (C) temperature at the inlet to the production well.
Energies 18 04825 g011
Figure 12. Simulation of temperature drop in the production well caused by long-term CO2-EGS exploitation, phases 1 and 2.
Energies 18 04825 g012
Figure 13. Simulation of pressure difference between the injection and the production wells caused by long-term CO2-EGS exploitation, phases 1 and 2.
Energies 18 04825 g013
Figure 14. Cumulative storage ratio of CO2, including phases 1 and 2.
Energies 18 04825 g014
Figure 15. The cumulative amount of CO2 stored, including phases 1 and 2.
Energies 18 04825 g015
Figure 16. Layer plot of pressure (left), CO2 gas saturation (middle), and temperature (right) distribution in the −4225 m a.s.l. model M.100.75. (the reader is asked to check the online version of the figure for better resolution).
Energies 18 04825 g016
Table 1. Properties of rock types specified in the numerical model based on [35].
Rock Name VOAUTFRACTCAPRK
Description Volcanic Autunian Fractured zone Top boundary
Density [kg/m3] 2564.0 2564.0 1.0 × 10²⁰
Porosity [-]0.03
Permeability X, Y, Z [m2] 9.87 × 10⁻¹⁷ (X, Y, Z) 9.87 × 10⁻¹⁷ (X)
4.2 × 10⁻¹³ (Y, Z)
9.87 × 10⁻¹⁷ (X, Y, Z)
Thermal conduct. [W/(m∙K)] 2.5
Specific heat [J/kg] 900.0
Table 2. Numerical model setup and list of phase 1 variants.
General Model Setup
Model size [m] 7800 (X) × 8600 (Y) × 500 (Z)
Top layer boundary conditionDirichlet B.C. (fixed temperature) + no-flow boundary
Bottom layer boundary conditionUniform heat flow density of 80 mW/m2 + no-flow boundary
Lateral boundary conditionsSemi-infinite heat and flow boundaries (volume of lateral elements increased 100 times)
Initial conditionsTemperature and pressure taken from the natural (steady-state) model;
no NaCl and CO2 concentration at the start of phase 1
Relative permeability modelCorrey’s curves: Slr = 0.2, Sgr = 0.1
Capillary pressure modelLinear function; saturation limits [0, 1]
Fractured zone size [m] 600 (X) × 1600 (Y) × 100 (Z)
Fractured zone volume [km3] 0.096
Fractured zone permeability [m2] X: 9.87 × 10⁻¹⁷, Y and Z: 4.2 × 10⁻¹³
Fractured zone porosity [-] 0.03
Depth of the working interval of injection and production wells [m a.s.l.] From −4200 to −4300 m a.s.l.
Distance between wells [m] 1000
Working length of injection and production wells [m] 600
Orientation of the working length of injection and production wells Horizontal
Natural temperature prior to the exploitation phase at injection/production depth [°C] 145.3
Natural reservoir pressure outside of the fractured zone, depth = −4225 m a.s.l. [MPa] 43.6
Fractured zone pressure prior to the exploitation phase, but after fracturing; depth = −4225 m a.s.l. [MPa] 64.89
Phase 1 setup
Model ID M.150.139.25M.150.139.50M.250.139.25M.250.139.50M.350.139.25M.350.139.50M.400.139.25M.400.139.50
Simulation time [yrs] 2.0
Injection mass flowrate [kg/s] 150250350400
Injection temperature at the reservoir depth [°C] 139.5
Δz—layer thickness [m]2550255025502550
Table 3. Results for various variants of CO2 saturation of the fractured zone in the Gorzów Block, phase 1 (initial 2 years).
Model IDM.150.139.25M.150.139.50M.250.139.25M.250.139.50M.350.139.25M.350.139.50M.400.139.25M.400.139.50
Average flow rate in the production well during phase 1 [kg/s]127.78126.59227.35225.91327.38325.61377.01375.68
Production-to-injection flow rate ratio [-]0.850.840.910.900.940.930.940.94
Production temperature after 2 years of phase 1 [°C]145.70145.74145.75145.88145.36145.69144.88145.65
Maximum pressure difference between injection and production blocks during phase 1 [bar]13.5915.8225.3028.9438.5642.9545.5049.88
Total CO2 injected to reach full CO2 saturation in production blocks [tons]full saturation not achievedfull saturation not achievedfull saturation not achievedfull saturation not achieved1.86 × 1072.20 × 1071.85 × 1072.18 × 107
Time passed to reach full CO2 saturation in production well [yrs]full saturation not achievedfull saturation not achievedfull saturation not achievedfull saturation not achieved1.681.991.471.73
Total CO2 injected in phase 1 [tons]9.46 × 1069.46 × 1061.58 × 1071.58 × 1072.21 × 1072.21 × 1072.52 × 1072.52 × 107
Total CO2 extracted in phase 1 [tons]4.68 × 1064.54 × 1068.77 × 1068.49 × 1061.45 × 1071.34 × 1071.75 × 1071.64 × 107
Total CO2 stored at the end of phase 1 [tons]4.78 × 1064.92 × 1067.00 × 1067.28 × 1067.58 × 1068.70 × 1067.72 × 1068.84 × 106
Cumulative CO2 storage ratio after phase 1 [-]0.510.520.460.460.340.390.310.35
Table 4. Distribution of CO2 in the formation at the end of phase 1.
Rock Type\Model IDM.150.139.25M.150.139.50M.250.139.25M.250.139.50M.350.139.25M.350.139.50M.400.139.25M.400.139.50
CAPRK gas [-]0.0%0.0%0.0%0.0%0.0%0.0%0.0%0.0%
CAPRK aqueous [-]0.0%0.0%0.0%0.0%0.0%0.0%0.0%0.0%
CAPRK total [-]0.0%0.0%0.0%0.0%0.0%0.0%0.0%0.0%
FRACT gas [-]64.9%63.4%65.6%64.3%66.0%64.9%66.0%65.0%
FRACT aqueous [-]2.8%3.1%1.9%2.2%1.4%1.5%1.3%1.3%
FRACT total [-]67.6%66.5%67.5%66.4%67.5%66.4%67.3%66.3%
VOAUT gas [-]22.0%20.5%22.2%20.7%22.3%20.9%22.5%21.0%
VOAUT aqueous [-]10.4%13.0%10.3%12.9%10.2%12.7%10.2%12.7%
VOAUT total [-]32.4%33.5%32.5%33.6%32.5%33.6%32.7%33.7%
Table 5. Results of various exploitation variants of CO2-EGS in the Gorzów Block, phase 2.
Model IDM.50.45M.100.45M.150.45M.50.60M.100.60M.150.60M.50.75M.100.75M.150.75
Average flow rate in the production well during phase 2 [kg/s]38.3988.13137.9738.4388.20138.0538.4688.26138.13
Production-to-injection flow rate ratio during phase 2 [-]0.770.880.920.770.880.920.770.880.92
Production temperature after 32 years [°C]144.49122.2791.17144.52125.1098.20144.61127.80104.90
Production temperature after 52 years [°C]136.9496.2376.18138.04102.6086.17139.15109.1196.13
Pressure difference between injection and production well after 52 years [bar]1.344.237.011.394.086.671.443.966.38
Total CO2 injected in 52 years [tons]1.01 × 1081.80 × 1082.59 × 1081.01 × 1081.80 × 1082.59 × 1081.01 × 1081.80 × 1082.59 × 108
Total CO2 extracted in 52 years [tons]7.50 × 1071.53 × 1082.32 × 1087.51 × 1071.54 × 1082.32 × 1087.51 × 1071.54 × 1082.32 × 108
Total CO2 stored in rocks in 52 years [tons]2.59 × 1072.63 × 1072.65 × 1072.58 × 1072.62 × 1072.64 × 1072.58 × 1072.61 × 1072.63 × 107
Ratio of CO2 extracted to injected in phase 2 only [-]0.770.880.920.770.880.920.770.880.92
Cumulative CO2 storage ratio after 52 years [-]0.2570.1460.1030.2560.1460.1020.2550.1450.102
Average annual CO2 storage in phase 2 [tons]3.66 × 1053.74 × 1053.79 × 1053.65 × 1053.72 × 1053.77 × 1053.64 × 1053.70 × 1053.74 × 105
Average daily replenishment of CO2 from the pipeline as a result of geological storage [tons]1003.41025.41039.21000.11019.81032.7997.41014.41025.3
Table 6. Distribution of CO2 in the formation at the end of phase 2.
Model IDM.50.45M.100.45M.150.45M.50.60M.100.60M.150.60M.50.75M.100.75M.150.75
CAPRK gas [-]1.1%1.1%1.1%1.1%1.1%1.1%1.1%1.1%1.1%
CAPRK aqueous [-]1.0%0.9%0.9%1.0%0.9%0.9%1.0%0.9%1.0%
CAPRK total [-]2.0%2.0%2.0%2.1%2.0%2.1%2.1%2.0%2.1%
FRACT gas [-]11.7%12.3%12.4%11.5%12.0%12.1%11.4%11.8%11.8%
FRACT aqueous [-]0.0%0.0%0.0%0.0%0.0%0.0%0.0%0.0%0.0%
FRACT total [-]11.7%12.3%12.4%11.5%12.0%12.1%11.4%11.8%11.8%
VOAUT gas [-]70.6%70.3%70.2%70.7%70.5%70.4%70.9%70.6%70.6%
VOAUT aqueous [-]15.6%15.4%15.4%15.7%15.5%15.4%15.7%15.5%15.5%
VOAUT total [-]86.3%85.7%85.6%86.4%86.0%85.8%86.5%86.2%86.1%
Disclaimer/Publisher’s Note: The statements, opinions and data contained in all publications are solely those of the individual author(s) and contributor(s) and not of MDPI and/or the editor(s). MDPI and/or the editor(s) disclaim responsibility for any injury to people or property resulting from any ideas, methods, instructions or products referred to in the content.