Article

Co-Pyrolysis Behavior of Energetic Materials and Pine Sawdust

School of Energy and Power Engineering, Xi’an Jiaotong University, Xi’an 710049, China
*
Author to whom correspondence should be addressed.
Energies 2025, 18(17), 4768; https://doi.org/10.3390/en18174768
Submission received: 9 August 2025 / Revised: 30 August 2025 / Accepted: 3 September 2025 / Published: 8 September 2025

Abstract

Incineration is a widely adopted method for the disposal of waste energetic materials (SP). Nevertheless, this approach is associated with considerable thermal energy loss and significant environmental pollution. To address these limitations, this study proposes a co-pyrolysis process incorporating pine sawdust (SD) with SP. This technique utilizes the exothermic decomposition of energetic substances and the endothermic pyrolysis of biomass. Through this synergistic thermal interaction, the process enables efficient energy recovery and facilitates the resource valorization of SP. The pyrolysis kinetics and thermodynamics of SP, SD, and their blends were investigated. Synchronous thermal analysis examined the co-pyrolysis reaction heat at varying blend ratios, while the temperature’s effects on the gas–liquid–solid product distribution were explored. The results indicate that the apparent activation energy (Ea) required for co-pyrolysis of the SP and SD exhibits an initial increase followed by a decrease in both Stage 1 and Stage 2. Furthermore, the mean apparent activation energy (Eavg) during Stage 1 (FWO: 101.87 kJ/mol; KAS: 94.02 kJ/mol) is lower than that in Stage 2 (FWO: 110.44 kJ/mol; KAS: 100.86 kJ/mol). Co-pyrolysis reaction heat calculations indicated that SD addition significantly mitigates the exothermic intensity, shifts decomposition to higher temperatures (the primary exothermic zone shifted from 180–245 °C to 265–400 °C), and moderates heat release. Elevated temperatures increase the gas yield (CO and H2 are dominant). High temperatures promote aromatic bond cleavage and organic component release; the char’s calorific value correlates positively with the carbon content. Higher co-pyrolysis temperatures increase the nitrogenous compounds in the oil, while the aldehyde content peaks then declines. This work proposes a resource recovery pathway for SP, providing fundamental data for co-pyrolysis valorization or the development of catalytic conversion precursors.

1. Introduction

Waste energetic materials primarily originate from failed propellants in explosives or rocket motors and defective products or scrap generated during the production and testing of initiating explosive devices [1]. As a military power, China generates thousands or even tens of thousands of tons of waste energetic materials annually, and this quantity continues to increase year by year. This massive volume of energetic waste poses significant challenges. If not promptly disposed of, it not only poses safety hazards, such as a risk of explosion and combustion during storage, but the leaching of components like ammonium perchlorate (AP) and hydroxyl-terminated polybutadiene (HTPB) can also cause harm to the environment and human health [2,3]. The current disposal methods for energetic waste include open burning, component recovery, and reformulation into new explosives. However, these methods suffer from drawbacks such as high pollution levels, energy wastage, high costs, and complex processes [4,5]. Open burning is a mainstream treatment method for discarded SP. However, this approach results in significant energy waste and considerable environmental pollution. SP contains a high proportion of ammonium perchlorate (AP) (exceeding 60%). The pyrolysis of AP is an exothermic process. When incineration is used to treat SP alone, the substantial heat release imposes stringent safety requirements on the furnace structure, posing potential risks [2,5].
As a traditional renewable energy source, biomass can be converted into high-quality clean energy or high-value-added chemicals through pyrolysis, representing a crucial pathway for biomass utilization [6,7,8]. Biomass pyrolysis is an endothermic reaction. By co-pyrolyzing biomass with SP, the energy released during the decomposition of SP residues can be effectively utilized. Moreover, this process can reduce the nitrogen oxides generated from the pyrolysis of energetic materials [9,10,11]. Research on the reaction kinetics of co-pyrolysis forms the foundation for studying its resource recovery potential. However, due to the distinct composition of energetic materials, which differs significantly from that of conventional solid fuels, systematic investigations into their co-pyrolysis with biomass remain scarce. Dong et al. [12] investigated the interaction mechanisms during the co-pyrolysis of biomass and waste plastics. Their results demonstrated significant synergistic interactions between the biomass and waste plastics. In the initial stage of pyrolysis, the heated and softened plastic enveloped the biomass particles, inhibiting the release of volatile components. In a later stage, free radicals generated from the biomass decomposed the polymer chains in the plastic, releasing hydrogen radicals which exerted a promoting effect. These hydrogen radicals, in turn, impacted the pyrolysis of the biomass, enhancing the production of aromatic hydrocarbons. Kinetic and thermodynamic analyses further revealed that synergistic co-pyrolysis reduced both the activation energy and the Gibbs free energy. Jin et al. [9] studied the reaction kinetics during the pyrolysis of energetic materials, pine sawdust, and their blends at different ratios. The results indicated significant interactions between the energetic materials and pine sawdust. Kinetic analysis using both the Friedman and Kissinger–Akahira–Sunose (KAS) methods showed that the average activation energy for all the blend ratios was lower than that of the energetic material alone, suggesting that the addition of pine sawdust enhanced the reactivity of the co-pyrolysis process. Furthermore, they also found that co-pyrolysis of biomass such as pine sawdust with SP can reduce the emissions of NOx generated during energetic material pyrolysis. This result is consistent with the findings reported by Zha [13], Mao [14], and Fu [15].
Based on this, the present study investigates the interactions during co-pyrolysis of SP and SD using thermogravimetric analysis and determines the co-pyrolysis kinetics and thermodynamics, as well as the reaction heat of the process. This paper aims to examine the influence of the temperature on the component distribution of co-pyrolysis products from SP and SD, with the goal of providing optimized conditions and a theoretical basis for the resource utilization of SP and SD through co-pyrolysis or further catalytic conversion.

2. Materials and Methods

2.1. Materials

Energetic materials (hereinafter referred to as SP) are composite solids composed of ammonium perchlorate (AP), aluminum (Al) powder, a high-molecular-weight organic binder, and other additives such as plasticizers and anti-aging agents. Pine sawdust (hereinafter referred to as SD) was obtained from a furniture factory in Xi’an, China. Prior to the experiments, SP was cut into 5 mm × 5 mm sheets. SD was pulverized using a crusher and sieved through a 60-mesh sieve for subsequent use. The contents of C, H, N, S, and O in the SP and SD samples were determined using an elemental analyzer (vario EL cube, Frankfurt, Germany). The oxygen (O) content was obtained using the subtraction method. Triplicate samples were tested for each material, and the average values were taken. The results are presented in Table 1.

2.2. Thermogravimetric Analysis

The pyrolysis characteristics of the SP, SD, and their mixtures were analyzed using a thermogravimetric analyzer (DTG-60, Shimadzu, Japan). For measurement, 6–8 mg of the sample was weighed into an alumina crucible under a nitrogen flow rate of 75 mL/min. The temperature was increased to 700 °C at a heating rate of 10 °C/min. For the combustion characteristic analysis of the co-pyrolysis char, 6–8 mg of the sample was weighed into an alumina crucible under an oxygen flow rate of 75 mL/min. The temperature was increased to 700 °C at a heating rate of 20 °C/min.

2.3. Co-Pyrolysis Interaction Assessment

To further evaluate the interactions (synergistic/antagonistic effects) during the co-pyrolysis of the SP and SD, a synergy parameter (Δw) was introduced [16]. Utilizing the thermogravimetric (TG) data obtained from the pyrolysis of SP and SD individually using a DTG-60 analyzer (Shimadzu, Japan), the theoretical mass loss rate, WCal, during pyrolysis for different blend ratios (2:1, 1:1, 1:2, 1:4) was calculated according to Equation (2). The WCal was then compared with the experimental value Wexp using Equation (3). If Δw was less than 0, it would indicate that a synergistic effect existed during the co-pyrolysis of SP and SD and the pyrolysis reaction was enhanced. Conversely, an antagonistic effect was observed during the co-pyrolysis of SP and SD.
W Exp = W t W 0 × 100 % ,
W cal = x a W a + x b W b ,
where W0 is the initial weight of the mixed sample at time zero, in mg; Wt represents the weight of the mixed sample at time *t*, in mg; xa denotes the mass fraction of SP in the mixed sample, in %; and xb is the mass fraction of SD in the mixed sample, in %.
w = W Exp     W Cal

2.4. Kinetic Analysis Method for Co-Pyrolysis

The heating rates were set to 10, 20, and 30 °C/min. The Flynn–Wall–Ozawa (FWO) and Kissinger–Akahira–Sunose (KAS) methods were employed to calculate the kinetic parameters of the SP and SD blend (1:1 mass ratio) during pyrolysis, in order to determine the variation in the activation energy at different stages of the pyrolysis process [17]. The chemical reaction rate kinetic equation is
d α d t = k T f ( α ) ,
where t is the time (min); k is the apparent reaction rate constant (min−1), expressed as a function of the temperature.
The conversion degree can be defined by the following equation:
k T = A e E R T ,
where A is the pre-exponential factor (min−1); E represents the activation energy of the reaction (kJ/mol); R is the molar gas constant, 8.314 J·(mol·K)−1; and T denotes the thermodynamic temperature (K).
Equation (6) can be obtained from Equations (4) and (5).
d α d t = A e E R T f ( α ) ,
For a non-isothermal process with a constant heating rate, the heating rate is denoted as β.
β = d T d t ,
The kinetic equation under non-isothermal conditions is obtained by substituting Equation (6) into Equation (7).
d α d T = A β e E R T f ( α ) ,
The KAS method assumes that α is a constant, and its expression equation is
l n β T 2 = l n A R g α E E R T ,
The Flynn–Wall–Ozawa (FWO) method assumes that the apparent activation energy (E) remains constant during the pyrolysis process. The FWO method can be expressed as
l n β = l n A R g α E 5.331 1.052 E R T ,
For a given conversion degree, α, during the co-pyrolysis process, the apparent activation energy (E) of the sample at that specific conversion degree is calculated from the slope of the fitted curve obtained by plotting lnβ or ln(β/T2) (as the Y-axis value) against 1/T (K−1).

2.5. Determination of Enthalpy Change in Co-Pyrolysis

The enthalpy changes during co-pyrolysis of SP and SD were monitored using simultaneous thermal analysis (STA, METTLER TOLEDO TGA/DSC3, Zurich, Switzerland). Samples weighing 3–5 mg were loaded into a furnace under a nitrogen atmosphere with a flow rate of 100 mL/min. After purging for 10 min, the temperature was increased from ambient to 600 °C at a heating rate of 10 °C/min. The heat flow (DSC) curves were segmented into endothermic and exothermic regions based on DTG peak identification. The co-pyrolysis reaction enthalpy for each decomposition stage was quantified through numerical integration of the partitioned DSC curves.

2.6. Fixed-Bed Co-Pyrolysis Experiment

SP and SD co-pyrolysis experiments were conducted using the fixed-bed pyrolysis reactor shown in Figure 1. To harness the heat released by the SP, this study employed a blend ratio of SP to SD of 1:4 and a heating rate of 20 °C/min, investigating the influence of the pyrolysis temperature (400–700 °C) on the distribution characteristics of co-pyrolysis products derived from the SP and SD. The gas composition and content were determined by gas chromatography (GC7900). The composition of the co-pyrolysis oil was analyzed by gas chromatography–mass spectrometry (Agilent 6890/5973, Santa Clara, CA, USA) with an HP-5MS column. The detection results were compared with the NIST spectral library within the GC-MS system to identify the compounds in the co-pyrolysis oil. The co-pyrolysis oil was diluted with dichloromethane at a ratio of 1:50. During the analysis, the column temperature was initially held at 40 °C for 4 min, then increased to 280 °C at a heating rate of 4 °C/min and held for 5 min. Helium was used as the carrier gas at a flow rate of 30 mL/min, with a split ratio of 50:1. The injector temperature was set to 220 °C, and the sample injection volume was 1 µL. The mass spectrometry scan range was set from 50 to 500 m/z. The elemental composition (C, H, N, S) of the char residue was measured using an elemental analyzer. The calorific value of the char residue was determined by oxygen bomb calorimetry. Additionally, the combustion characteristics of the co-pyrolysis char were investigated through thermogravimetric analysis.

3. Results

3.1. Thermogravimetric Analysis of SP and SD Pyrolysis

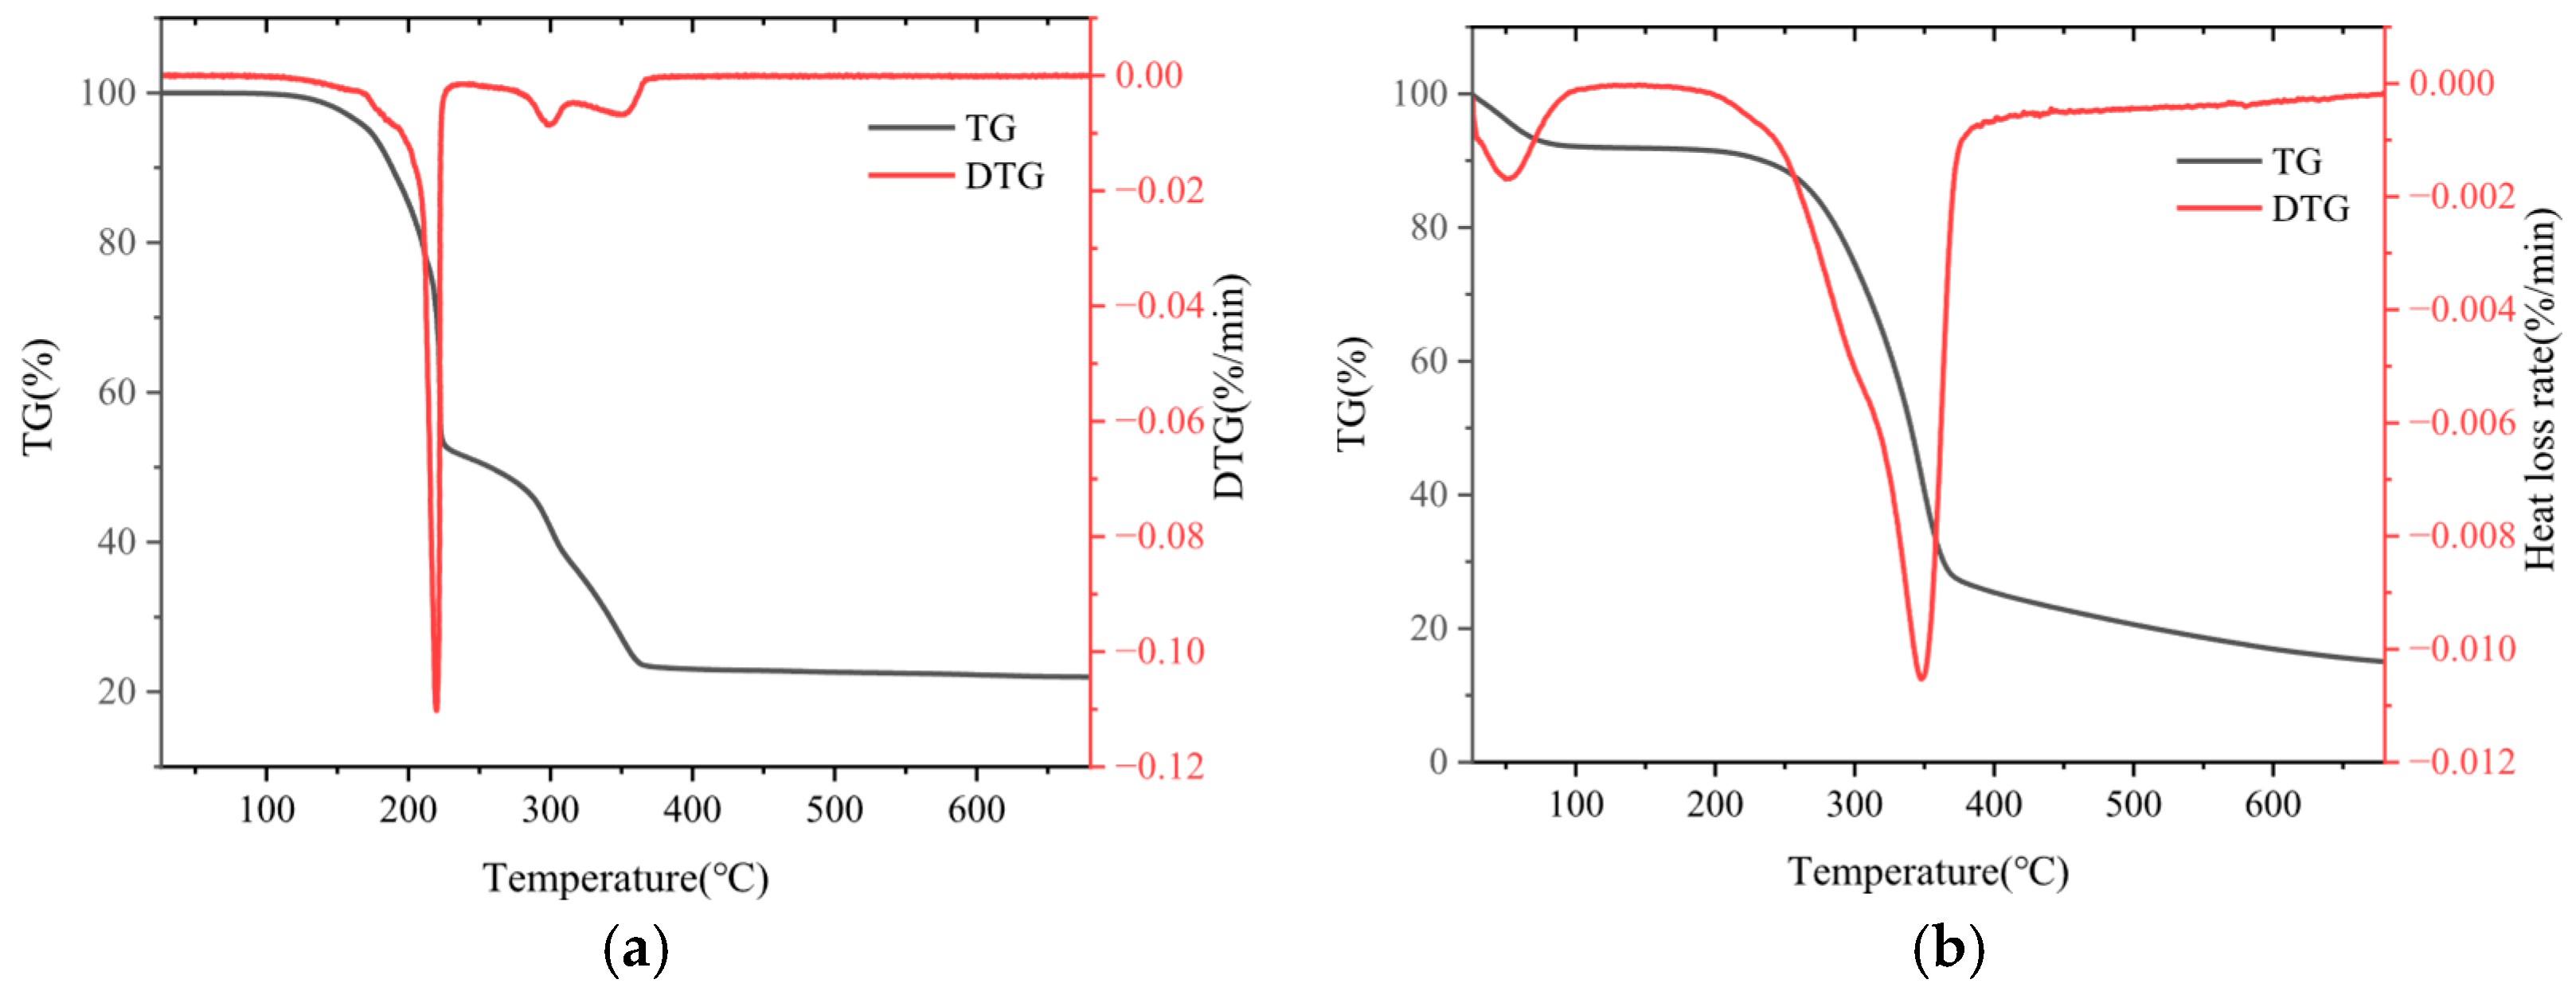
As shown in Figure 2a, the TG-DTG curves represent the pyrolysis of SP. Due to the short residence time below 140 °C and moisture distributed among the AP, Al powder, and binder particles, only approximately 3% mass loss is exhibited below this temperature. Above this temperature, SP decomposition occurs primarily in two stages: The first stage (140–230 °C) constitutes the main pyrolysis zone with approximately 46% mass loss, where HMX and residual AP decompose rapidly, generating a substantial amount of gaseous products. The second stage (230–365 °C) shows about 29% mass loss, which is likely caused by thermal decomposition of incompletely decomposed AP, the HTPB binder, and other crosslinking agents in the SP [18,19].
As shown in Figure 2b, the pyrolysis reaction of SD can be divided into three stages: The first stage (room temperature–105 °C) primarily involves the volatilization of moisture and adsorbed gases, resulting in a mass loss of approximately 7.5%. The second stage (210–390 °C) is the main pyrolysis zone, during which a large amount of volatiles are released. This is mainly due to the thermal decomposition of cellulose and hemicellulose in SD, leading to a mass loss of about 63%. The peak mass loss rate occurs at around 350 °C, which is consistent with the findings reported by Li et al. [20] (a mass loss of 64.2%, with the peak mass loss rate occurring at around 362 °C). The third stage (390–700 °C) represents the pyrolytic carbonization phase, where residual volatiles are slowly released, semi-char gradually carbonizes into char, and lignin undergoes slow decomposition, showing approximately 12% mass loss without distinct peaks in the DTG curve due to the relatively slow reaction rates [21].
Figure 3 shows the DTG curves for pyrolysis of SP and SD at blend ratios of 1:0, 0:1, 2:1, 1:1, 1:2, and 1:4. The presence of SD shifts the primary mass loss peak for SP toward higher temperatures and significantly reduces the mass loss rate. As the proportion of SD increases in the blend system, the peak mass loss rate at the first mass loss peak (around 225 °C) decreases, while the peak mass loss rate at the second mass loss peak (around 300 °C) increases, and the thermal decomposition temperature range of the blended system broadens with an increasing SD proportion. This suggests potential inhibitory interactions between SP and SD near the terminal stage of thermal decomposition.
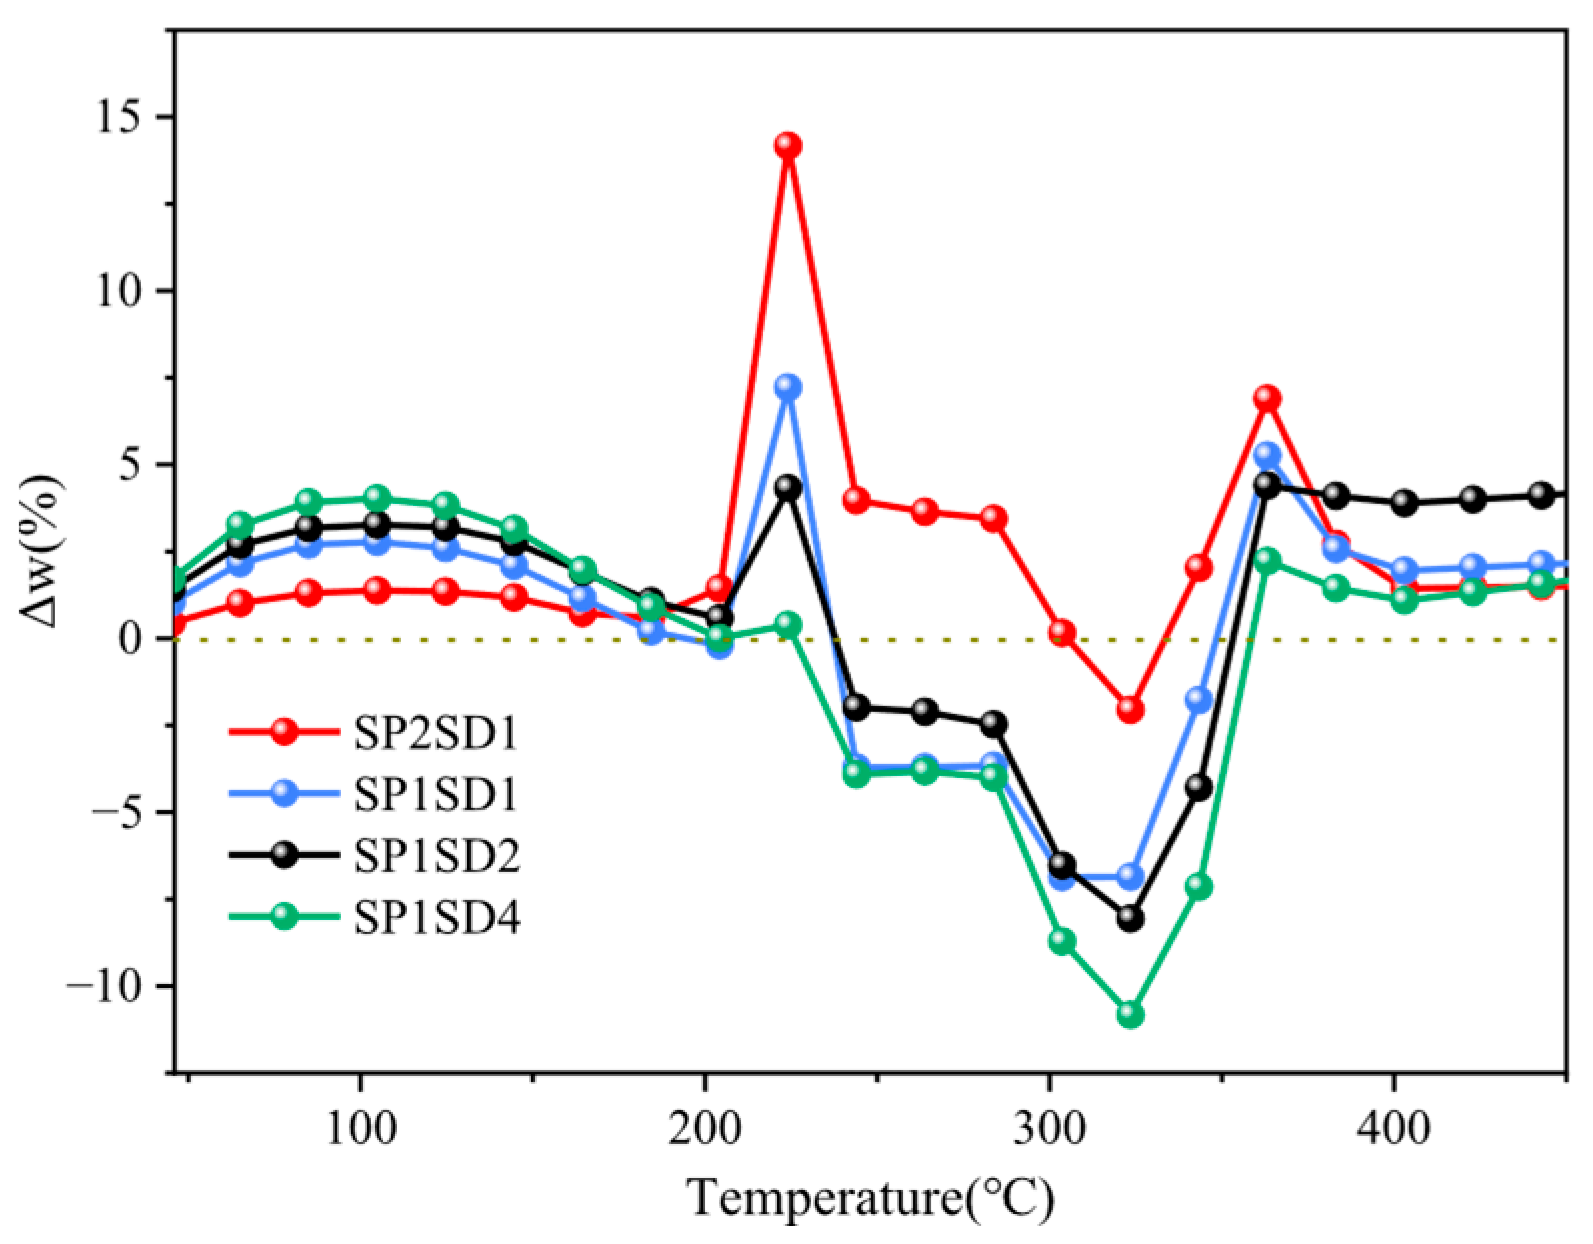
Figure 4 shows the synergistic parameter curves for pyrolysis of SP and SD blends at ratios of 2:1, 1:1, 1:2, and 1:4. Below 200 °C, inhibitory interactions occur for all the ratios, with enhanced inhibition at higher SD proportions. For the 2:1 blend, co-pyrolysis exhibits promotive effects (increasing the co-pyrolysis reaction rate) only within 300–340 °C, while showing inhibitory interactions in other temperature ranges. Except for the blend with the 2:1 ratio, all the other blends demonstrate promotive effects between 250 and 350 °C, with stronger promotion at increased SD proportions. Additionally, all the ratios exhibit inhibitory interactions near 225 °C and above 365 °C, consistent with the DTG results in Figure 3. Overall, the higher the proportion of SD, the greater the overall heat capacity and endothermic capacity of the system. This enables it to more effectively mitigate localized overheating caused by the decomposition of SP, resulting in a more uniform and stable temperature throughout the reaction system. This moderate and controllable thermal environment facilitates the preservation of primary pyrolysis products and promotes more orderly secondary reactions, thereby demonstrating more significant interaction effects.

3.2. Kinetic Analysis of the Co-Pyrolysis Process

Figure 5 shows the TG-DTG curves for the pyrolysis of the SP/SD blend (1:1 mass ratio) at different heating rates (10 °C/min, 20 °C/min, 30 °C/min). As seen in Figure 5, the DTG peak temperature shifts towards higher temperatures with an increasing heating rate. This is because a high heating rate can create significant temperature gradients within the sample, where the surface may already have reached the target temperature, initiating a reaction, while the core temperature exhibits a noticeable lag [22]. Simultaneously, higher heating rates increase the pyrolysis rate for SP and SD, leading to an increase in the DTG peak height. The pyrolysis of the SP/SD blend (1:1) occurs primarily in two stages. Moisture evolution is minimal (approximately 3%) below 140 °C. The first stage (140–250 °C) mainly involves the thermal decomposition of HMX (octahydro-1,3,5,7-tetranitro-1,3,5,7-tetrazocine) and residual AP within SP, accounting for a mass loss of 28%. The second stage (250–415 °C) involves the thermal decomposition of the remaining AP and HTPB within SP and SD, accounting for a mass loss of 43%.
Figure 6 presents the fitting curves for the apparent activation energy (Ea) calculated using the FWO and KAS methods during different pyrolysis stages (Stage 1: 140–260 °C; Stage 2: 260–420 °C) in the blended system. The fitting curves for both models exhibit high linearity and a good fit.
The apparent activation energies at different conversion degrees calculated using the FWO and KAS methods are presented in Table 2. As shown in the table, during both the first and second stages of co-pyrolysis, the apparent activation energies calculated using both models generally exhibit an initial increase followed by a decrease with an increasing conversion degree. The lower activation energy in the first stage is attributed to the lower temperature required for the onset of SP decomposition compared to that required for SD decomposition. The reactive species generated initially during SP decomposition are promptly consumed by the volatile components released during the initial pyrolysis of SD. In contrast, the increase in the activation energy during the second stage results from the growing complexity of the reactions as the major processes of SD decomposition proceed [9].
Co-pyrolysis Stage 1 (140–260 °C) primarily involves the thermal decomposition of components such as AP and HMX within SP, alongside the thermal decomposition of hemicellulose and lignin within SD. The decomposition of AP produces NH3 and HClO4, which catalyze the depolymerization of hemicellulose in SD. Combined with the heat released by AP decomposition, this results in lower initial thermal decomposition energy requirements. As AP decomposition continues, HClO4 may participate in crosslinking reactions with cellulose, increasing the reaction energy barrier and consequently raising the apparent activation energy. Co-pyrolysis Stage 2 primarily involves the thermal decomposition of HTPB within SP and lignin within SD. During this stage, the Al oxidation reaction provides an additional driving force for the pyrolysis reactions. During the first stage of co-pyrolysis, the apparent activation energy for the blended system (1:1) calculated using the Flynn–Wall–Ozawa (FWO) method ranged from 46.07 to 128.19 kJ/mol, while that determined using the Kissinger–Akahira–Sunose (KAS) method ranged from 38.88 to 120.21 kJ/mol. In the second co-pyrolysis stage, the apparent activation energy for the blended system (1:1) derived using the FWO method ranged from 95.31 to 118.62 kJ/mol, and that calculated using the KAS method ranged from 86.38 to 109.14 kJ/mol.

3.3. Enthalpy Change of the Co-Pyrolysis Reaction

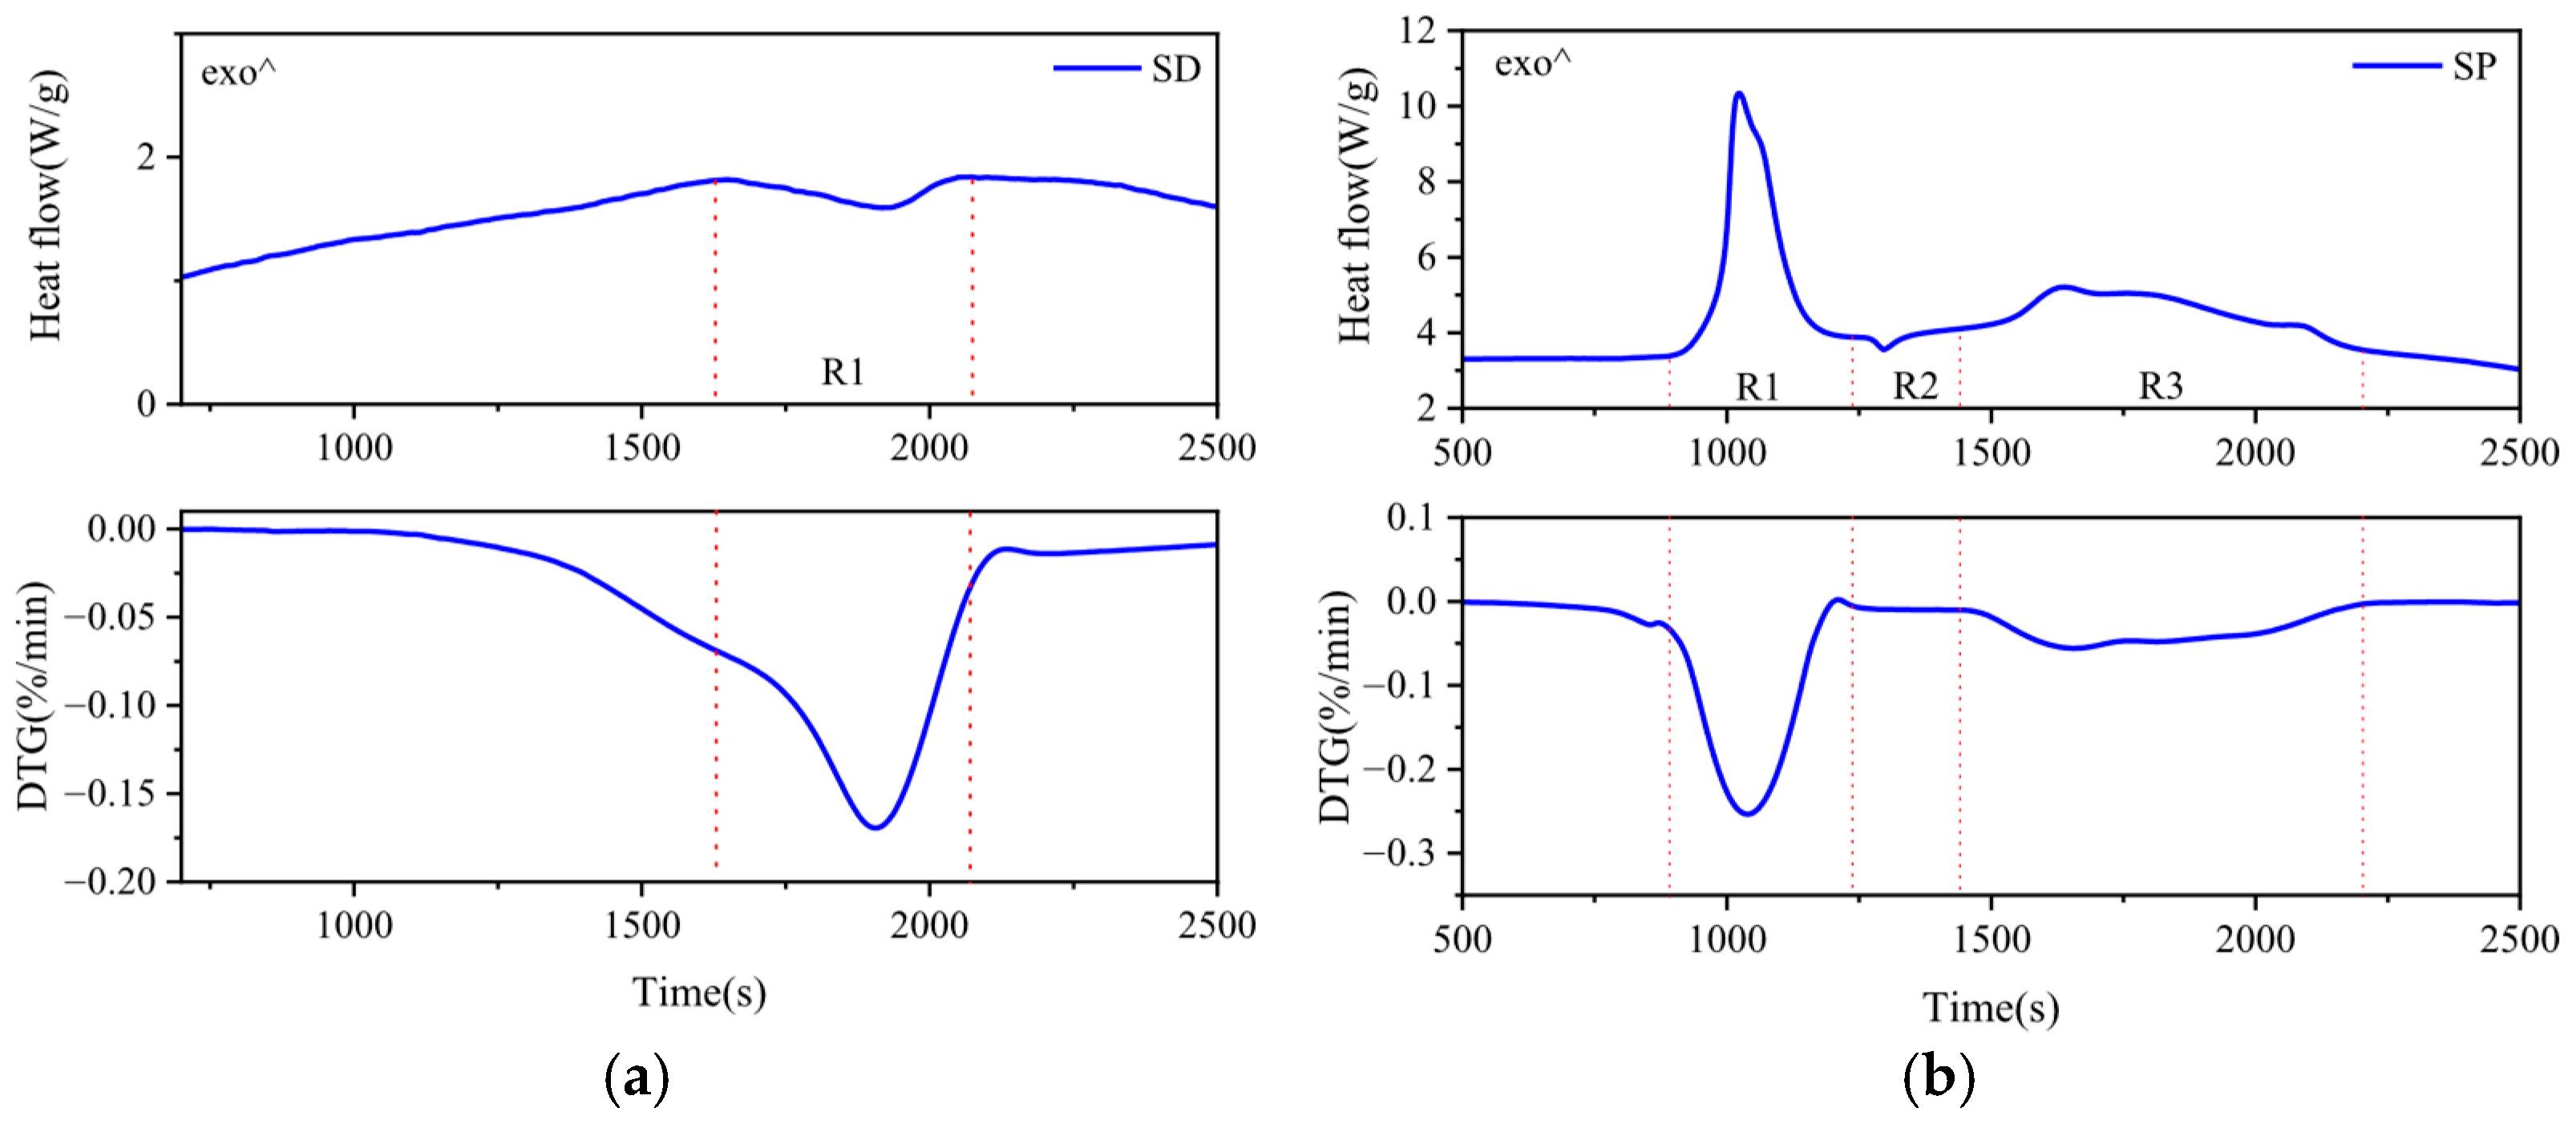
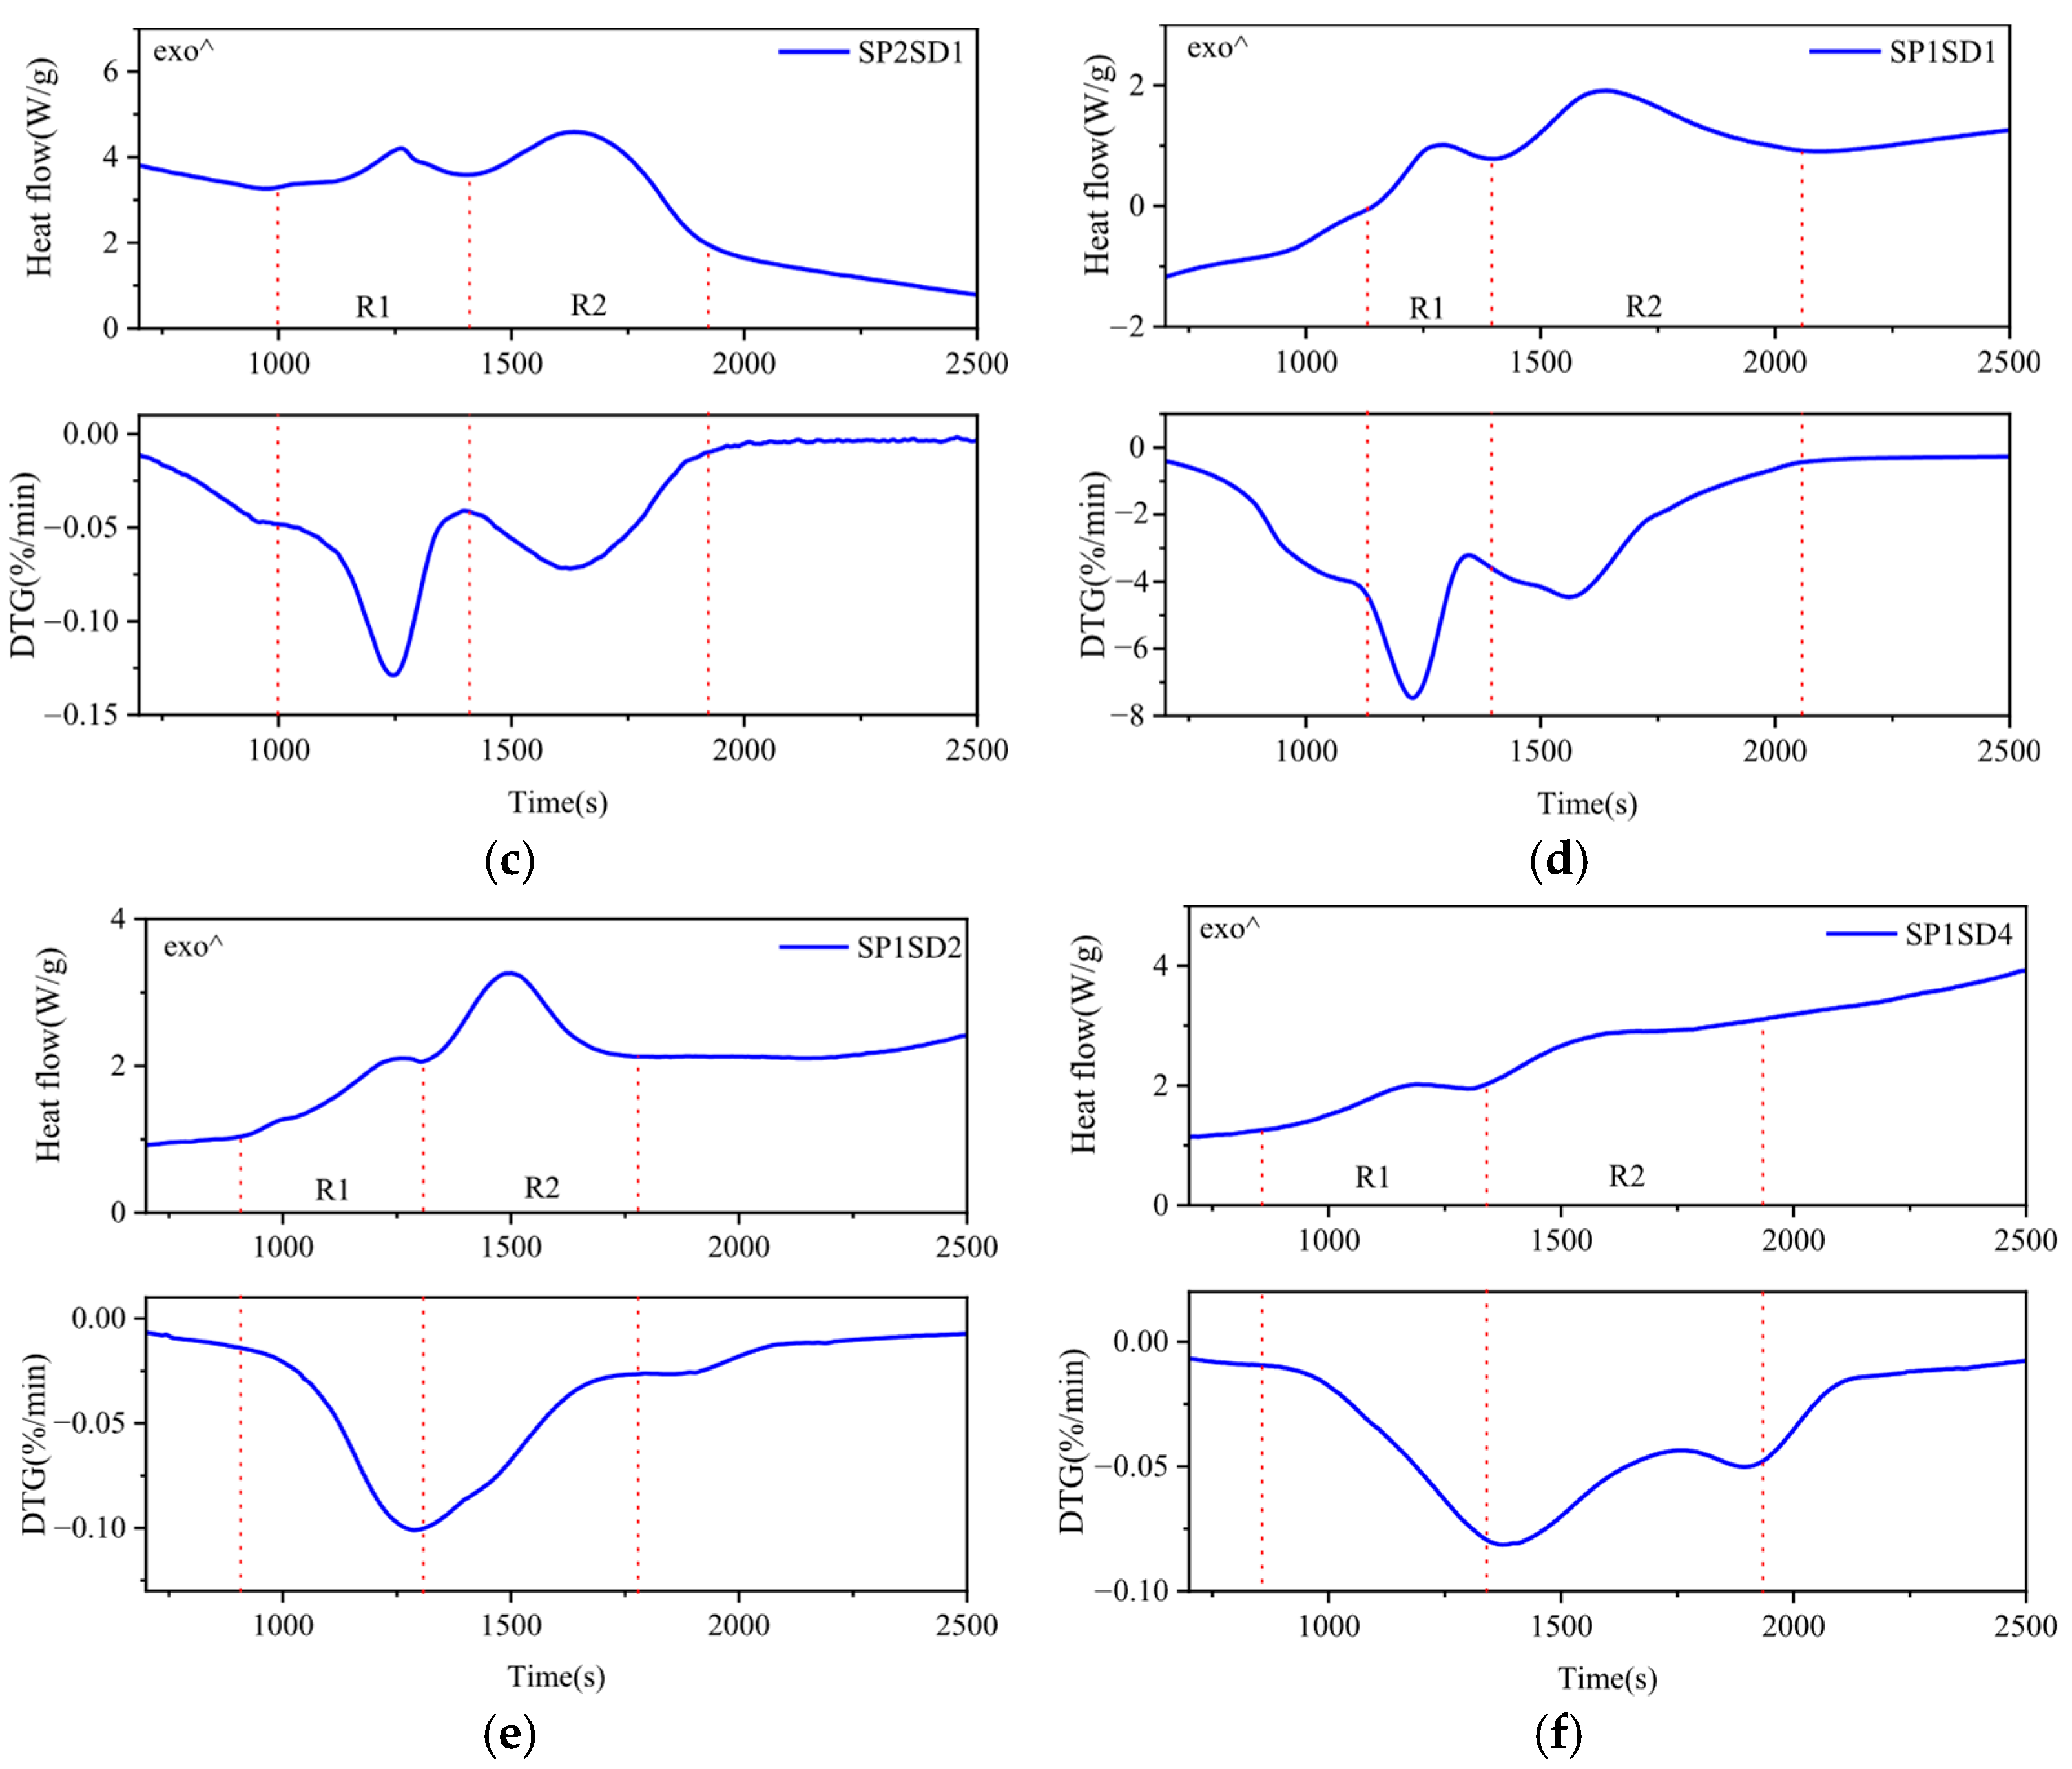
Figure 7 displays the profiles of the heat flow versus the time (temperature) during pyrolysis of SP, SD, and their blends. Herein, “exo^” denotes an exothermic reaction, represented by an upward peak in the DSC curve during pyrolysis. Endothermic/exothermic regions are delineated based on the DTG data. In Figure 7a, SD exhibits one mass loss peak corresponding to an endothermic DSC peak (R1). Figure 7b shows two SP decomposition peaks aligned with two exothermic DSC peaks (R1 and R3): R1 is sharp and narrow, reflecting rapid decomposition of AP and HMX [23]; R3 features broad, gradual exothermicity attributed to HTPB, binders, and residual AP. A minor endothermic crystal transition peak for AP (R2) appears without significant DTG changes due to minimal mass loss. Figure 7c,d,f each show two mass loss peaks corresponding to two endothermic DSC peaks (R1 and R2). Overall, Figure 8 demonstrates that biomass blending reduces the decomposition intensity, delays the mass loss peaks, and broadens the exothermic peaks compared to when using pure SP.
Table 3 presents the calculated pyrolysis reaction heat for SP, SD, and their blends at different ratios across specific temperature intervals. The key results show that during the pyrolysis of SP alone, the low-temperature zone (below 245 °C) constitutes the primary exothermic region, with a total exothermic heat of 1080.24 kJ/kg. SD exhibits an endothermic peak at 351 °C with an absorption of 53.98 kJ/kg. As the SD proportion increases, the total exothermic heat of the co-pyrolysis reaction decreases progressively. Concurrently, the exothermic heat in the low-temperature zone diminishes significantly, while the high-temperature interval (265–400 °C) becomes the dominant exothermic region.

3.4. Co-Pyrolysis Product Analysis

3.4.1. Three-Phase Product Distribution

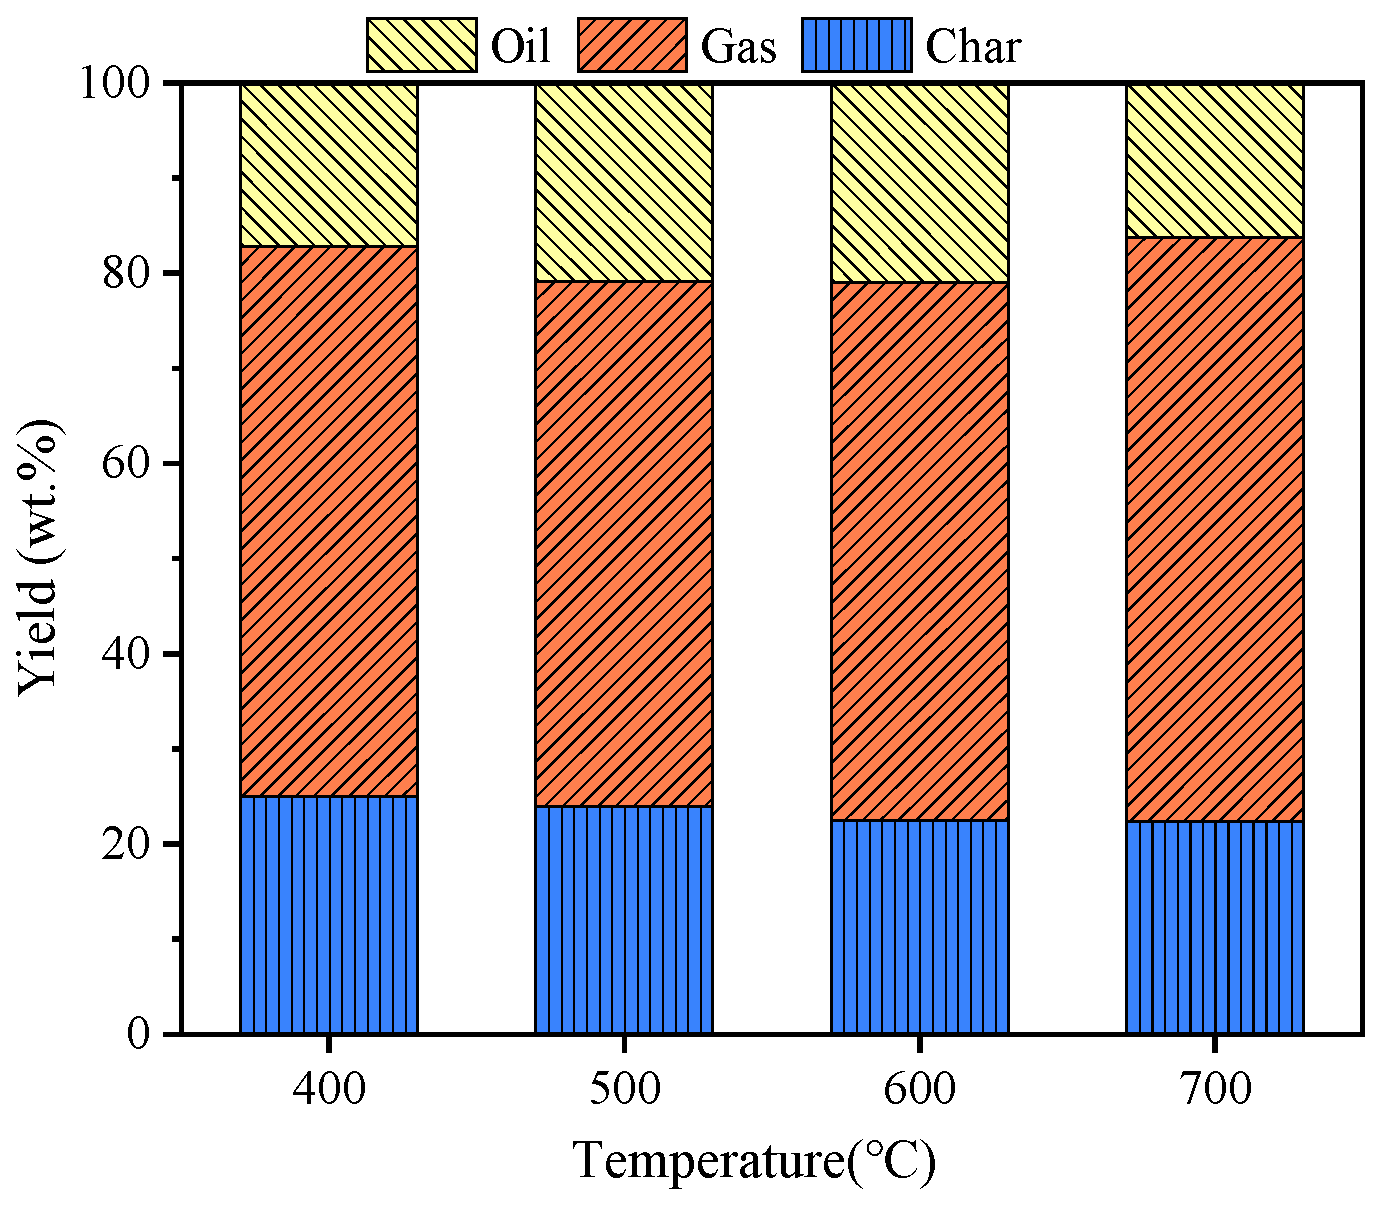
Figure 9 displays the distribution of three-phase products from co-pyrolysis of SP and SD at temperatures ranging from 400 to 700 °C. As the pyrolysis temperature increases, the char yield shows a slight decreasing trend, while the pyrolysis oil yield first increases and then decreases, reaching 16.30 wt.% at 700 °C. The gas yield rises from 57.83 wt.% to 61.39 wt.%. The primary yield shift occurs between the gas and pyrolysis oil phases, which results from enhanced volatile release and secondary reactions at elevated temperatures that promote cracking of tar precursors, thereby generating more gaseous products.

3.4.2. Co-Pyrolysis Gas Composition Analysis

Figure 10a displays the composition distribution of gaseous products from co-pyrolysis of SP and SD at a 1:4 blend ratio across different temperatures. As the pyrolysis temperature increases, the proportion of H2 in the gas gradually rises because SD’s macromolecular structures become more susceptible to cleavage, generating more free radicals that preferentially recombine into hydrogen. SP/SD co-pyrolysis primarily yields CO, H2, and CO2, with CO being the most abundant component. The lower heating value (LHV) ranges between 12.41 and 13.08 MJ/m3. Figure 10b demonstrates increased yields of combustible gas components with a rising temperature, attributable to enhanced decomposition of macromolecules in the tar and char residue at elevated temperatures. This process elevates the content of small-molecule gases in the pyrolysis gas, consequently increasing the LHV of the SP/SD co-pyrolysis gas with the temperature.

3.4.3. Characterization of Co-Pyrolysis Char

  • FTIR analysis of co-pyrolysis char.
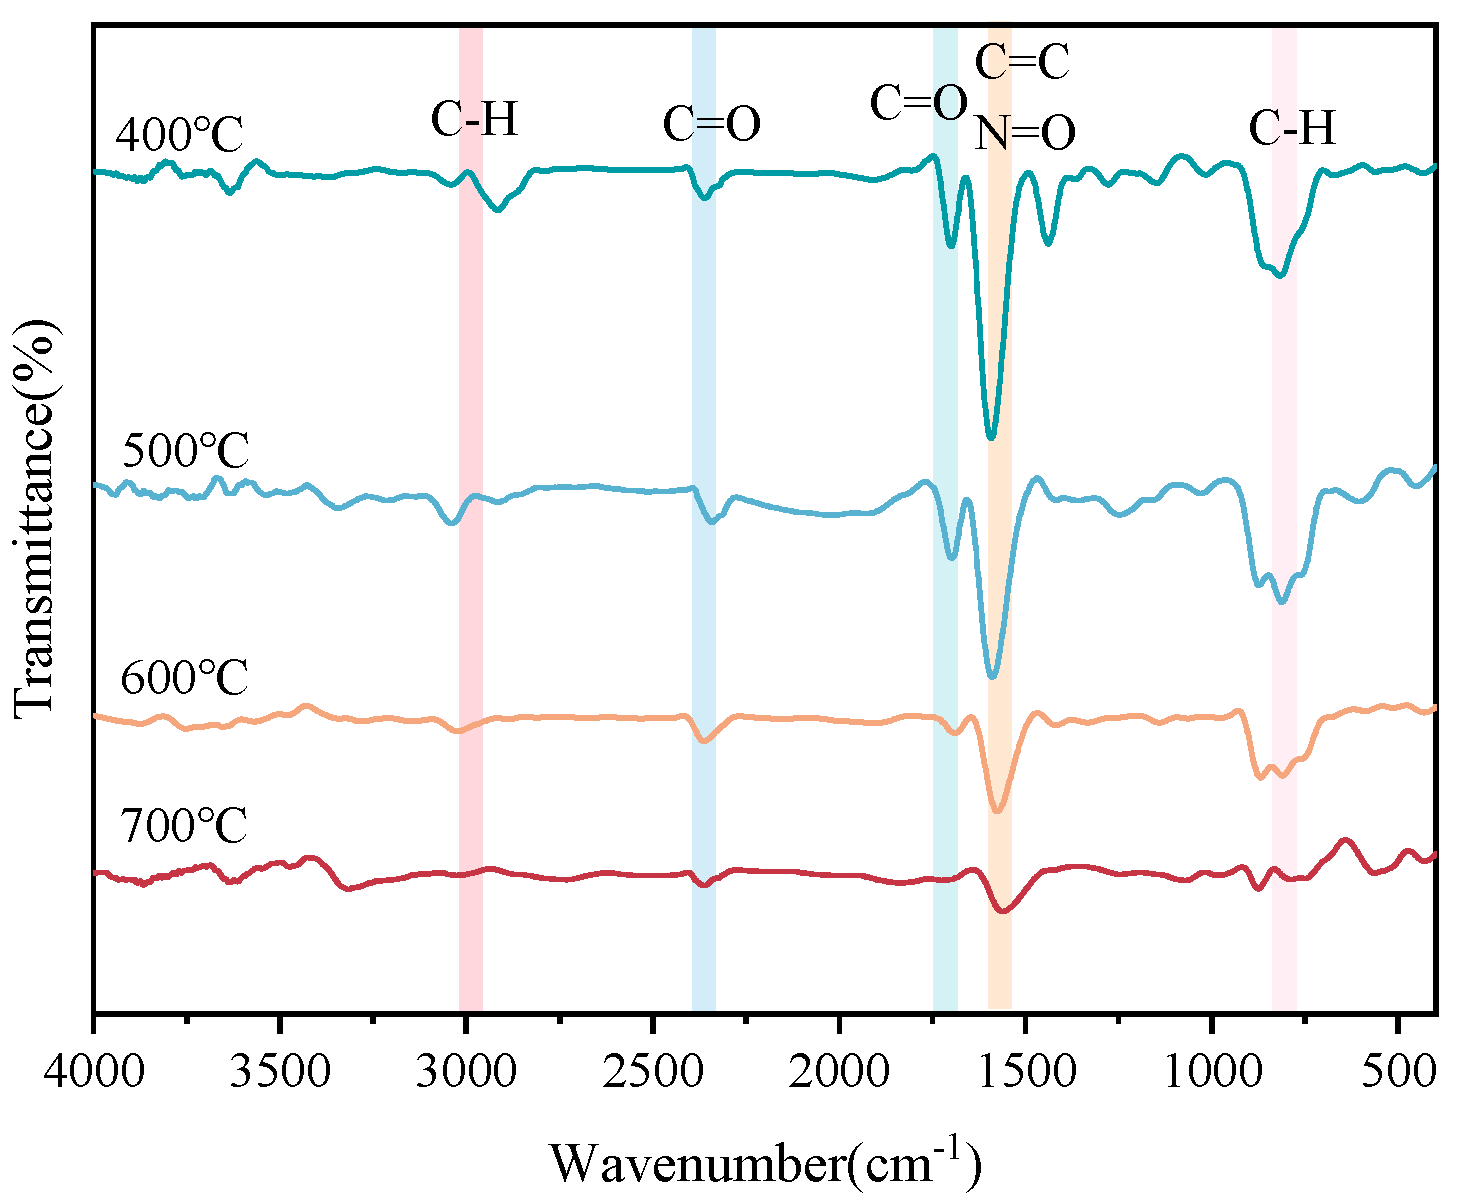
Figure 11 shows the functional group changes in the char produced through the high-temperature pyrolysis of SP and SD at different temperatures. The data indicate that higher pyrolysis temperatures gradually weaken the characteristic C=C peak of aromatic compounds at 1570 cm−1 and the C-H out-of-plane bending vibration peak of benzene rings in the fingerprint region. This is attributed to the reorganization of aromatic structures from disordered small-ring systems into larger, more ordered graphite-like structures as the temperature increases. This process causes the FTIR peaks to become broader, weaker, or even disappear, as highly ordered symmetric structures exhibit reduced infrared activity. Furthermore, the characteristic carbonyl peak at 1620 cm−1 gradually weakens with an increasing temperature, which may be due to enhanced decarboxylation and dehydrogenation effects in the pyrolysis char at elevated temperatures [24].
  • Combustion characteristic analysis of co-pyrolysis char.
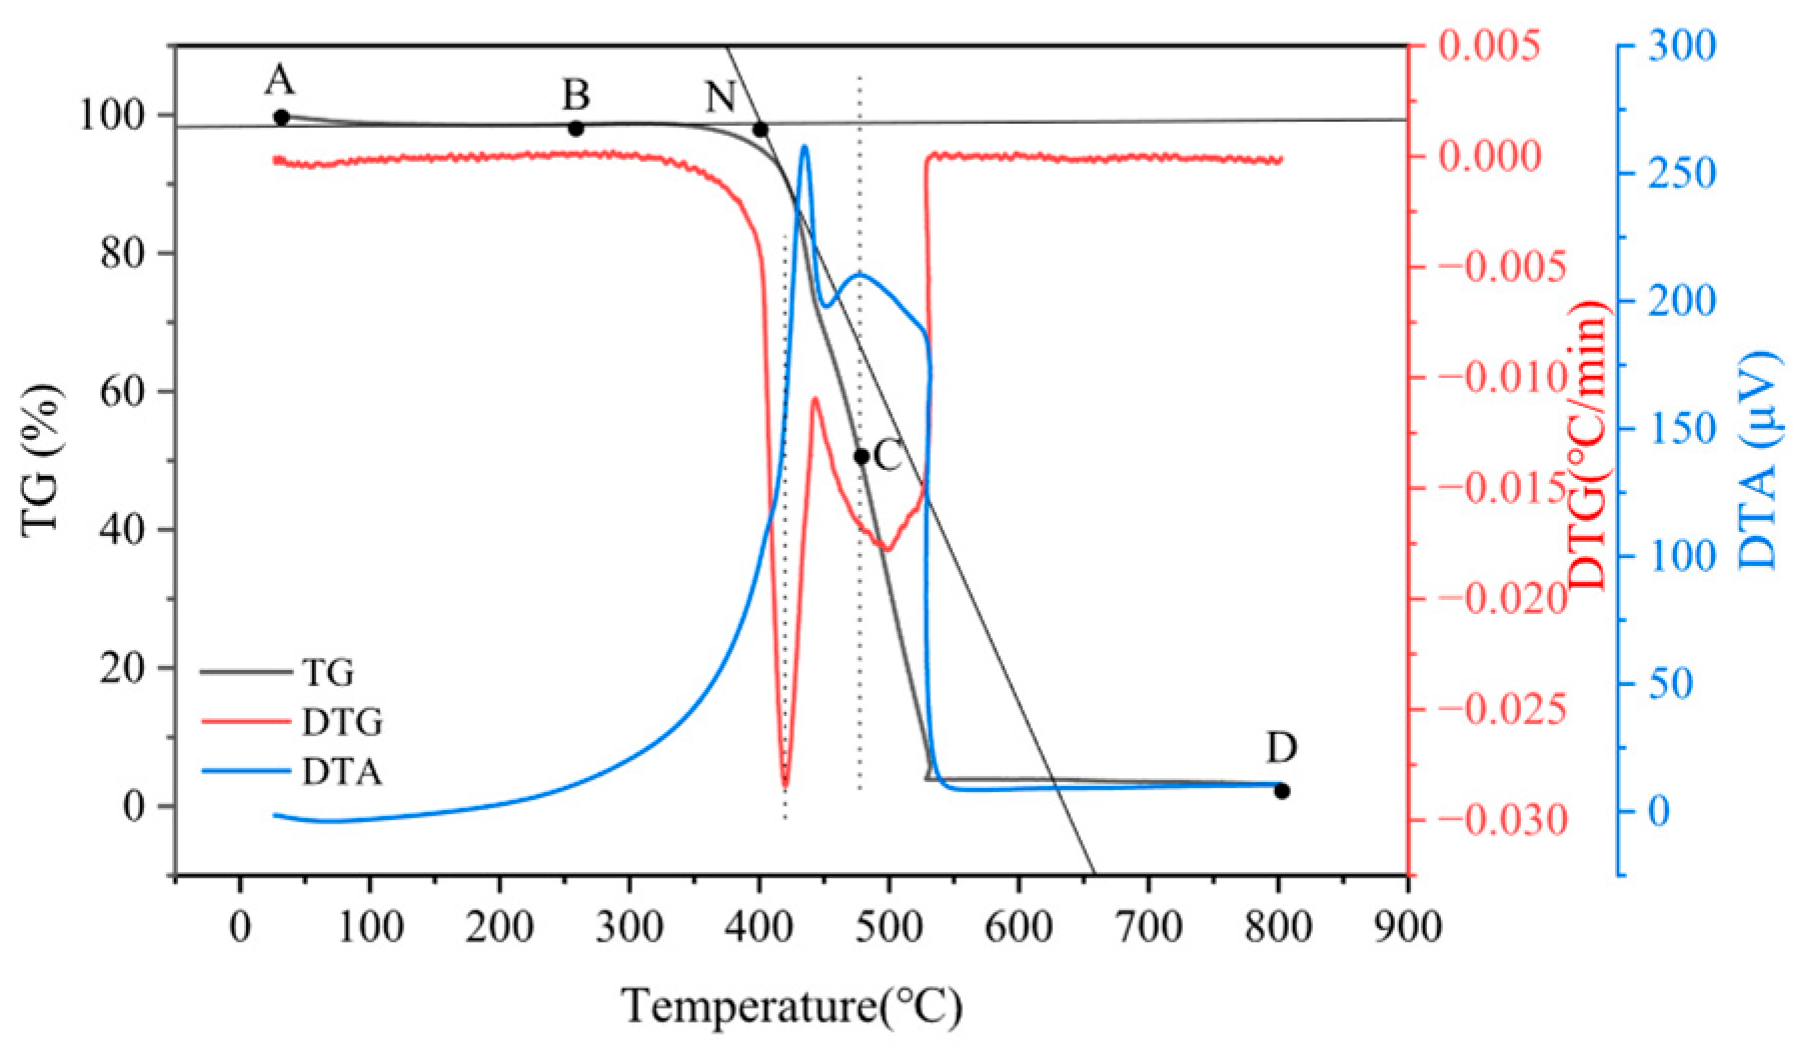
Combustion parameters and proximate analysis parameters were determined based on the TGA, DTG, and DTA curves. In Figure 12, the combustion curve is divided into three segments—the AB segment (moisture volatilization phase), BC segment (volatile matter loss phase), and CD segment (fixed carbon combustion phase)—where the ash content corresponds to the residual mass at Point D. Specifically, Point A is the initial sample mass point; Point B is the intersection of the tangential line to the initial mass loss and the TGA curve when determining the ignition temperature (Ti) at Point N; Point C is the intersection of the vertical line passing through the maximum point of the second DTA exothermic peak and the TGA curve; and Point D is the termination point of the TGA curve [25].
The burnout temperature (Tf) is defined as the temperature corresponding to a combustion rate of −1%/min, representing complete sample combustion; a lower Tf indicates better burnout performance. The combustion time is the duration from Ti to Tf. The maximum combustion rate (dx/dtmax) corresponds to the peak value of the DTG curve, with a higher dx/dtmax signifying more intense combustion. The average combustion rate (dx/dtavg) equals the ratio of the combustible material’s mass to the combustion time. The comprehensive combustibility index (S) is calculated using Equation (1); higher S values denote superior overall combustion performance [26].
S = d x d t m a x · d x d t a v g T i 2 · T f ,
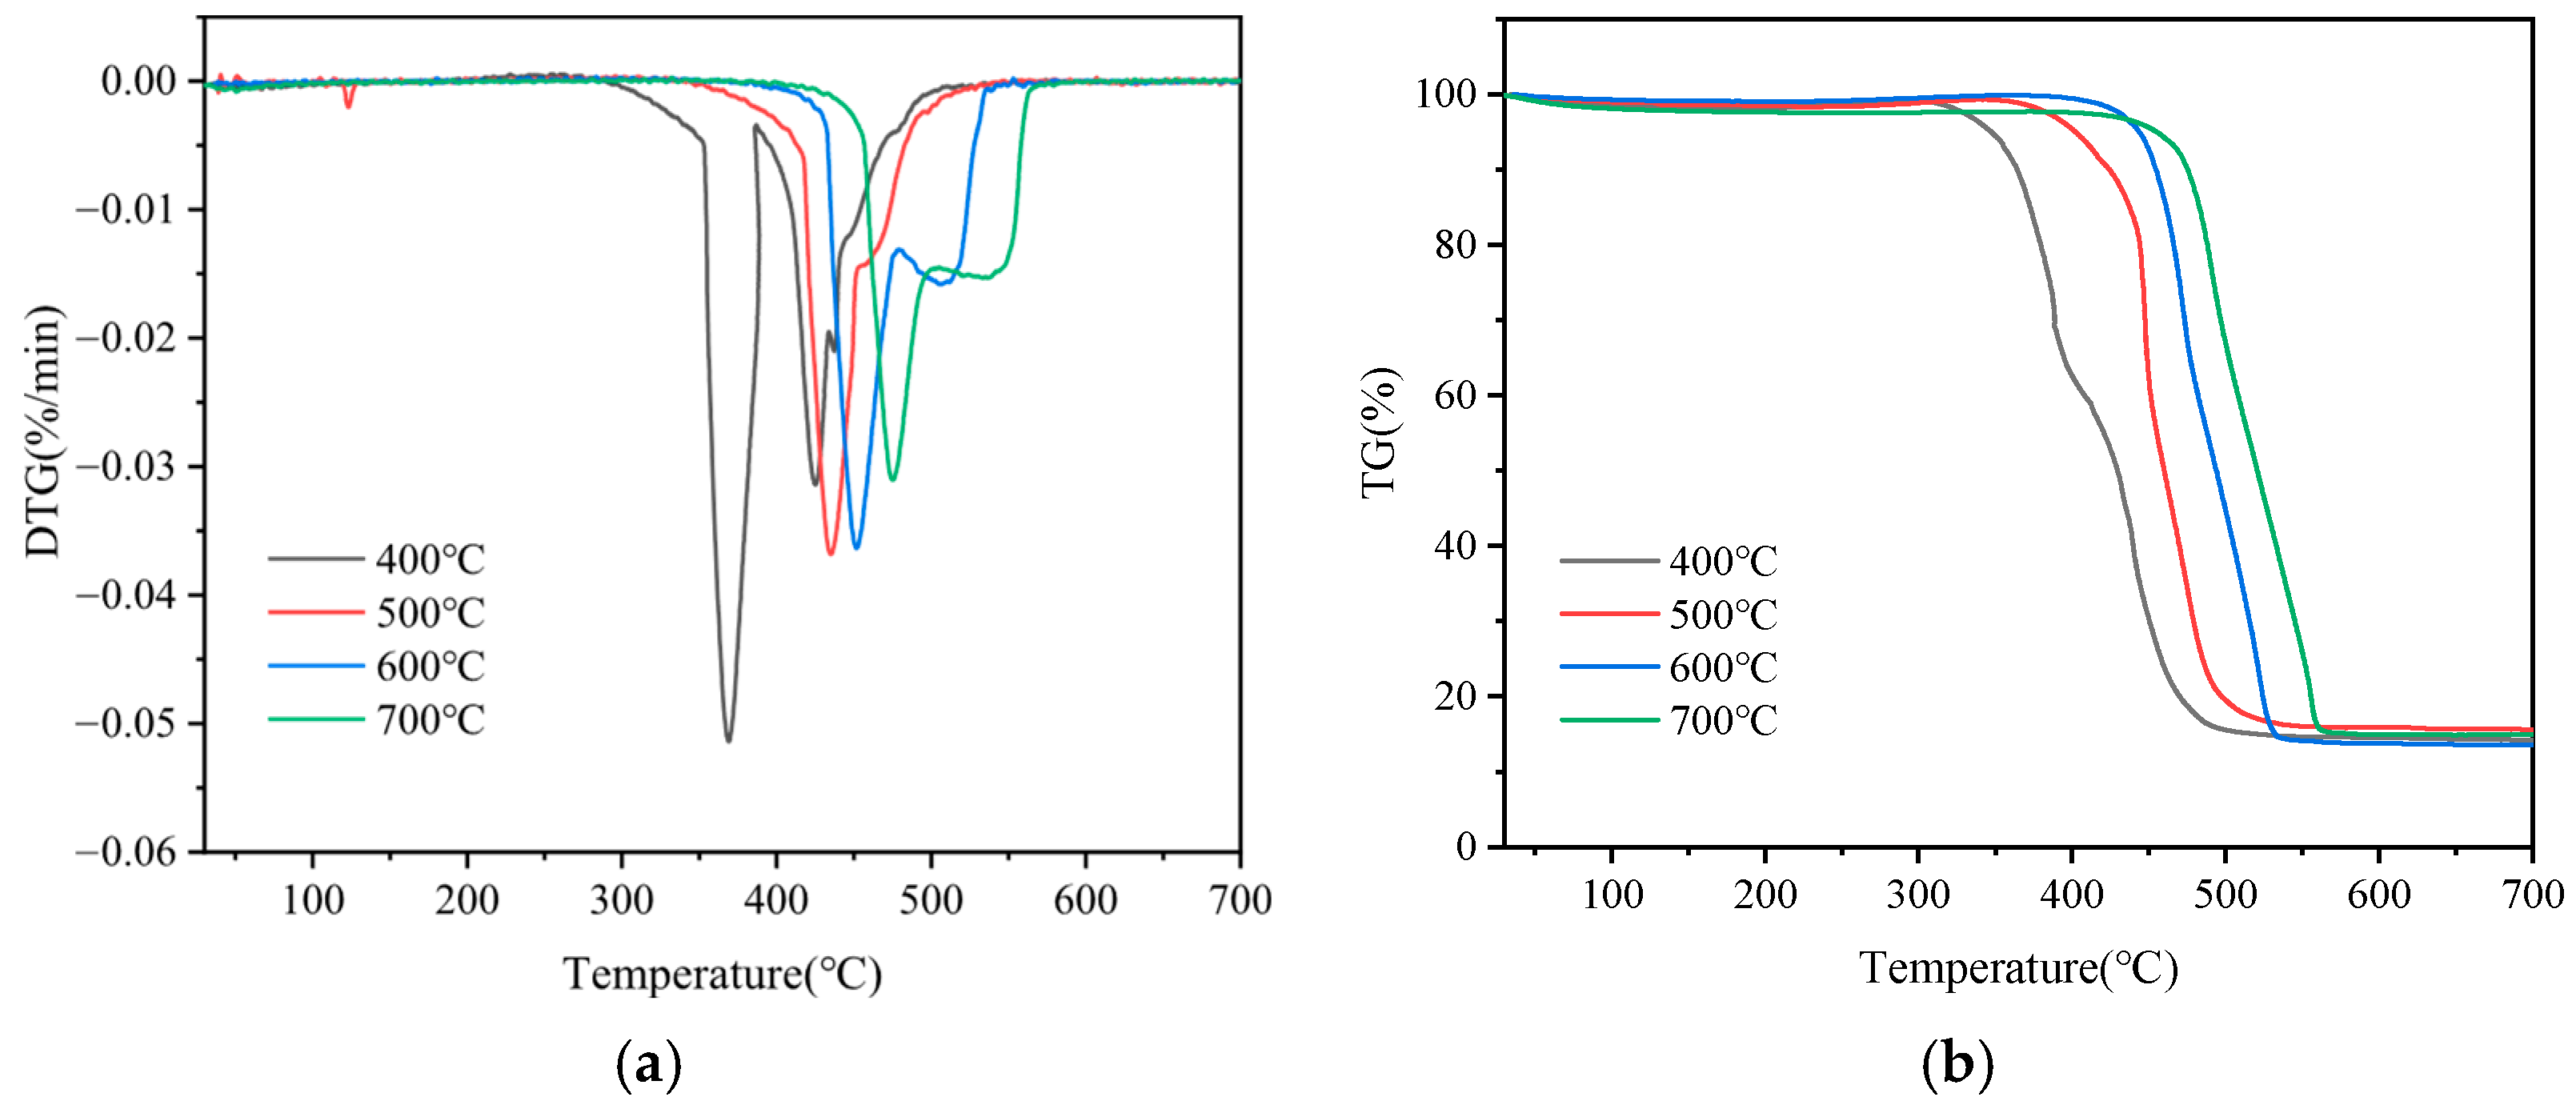
Figure 13 displays TG-DTG curves of combustion for co-pyrolysis char derived from SP and SD at different pyrolysis temperatures. As observed in Figure 13a, the combustion TG curve for the SP/SD co-pyrolysis char (1:4 ratio) shifts towards higher temperatures with an increasing pyrolysis temperature. This shift indicates an increase in the Ti and Tf. The ash content of the co-pyrolysis char produced at different pyrolysis temperatures ranges between 13.00% and 16.00%. The primary component of the ash in the co-pyrolysis char is Al2O3, which could be further separated and recovered for utilization as a catalyst support or for metal recovery. At lower pyrolysis temperatures, organic matter decomposes incompletely, resulting in the retention of more volatile matter (such as aliphatic compounds and tar) and oxygen-containing functional groups (e.g., carboxyl and hydroxyl groups) in the co-pyrolysis char. These components are more prone to oxidation when heated, leading to lower ignition temperatures and lower temperatures corresponding to the maximum combustion rate.
As can be seen from Table 4 and Table 5, increasing the pyrolysis temperature reduces the comprehensive combustion characteristic index of the co-pyrolysis char. This occurs in the terminal phase of combustion, shown for the co-pyrolysis char in the curve in Figure 13b, when the ash content of the char is approximately 15%. Furthermore, the pyrolysis temperature has little influence on the calorific value of the co-pyrolysis char derived from SP and SD, with values ranging from 27.34 to 29.55 MJ/kg. As shown in Table 5, when the pyrolysis temperature ranges between 400 and 600 °C, an increase in the temperature primarily promotes carbonization reactions (aromatization and condensation) and deoxygenation reactions (decarbonylation) within the co-pyrolysis char. During this stage, the oxygen content decreases rapidly, while the carbon content shows an increasing trend [27]. As the pyrolysis temperature further increases, the carbon content exhibits a slight decrease, which may be attributed to the reaction between oxidizing gases (such as NO2, O2, and HCl) produced from the decomposition of SP and the previously formed carbon matrix at 700 °C. These reactions release small-molecule hydrocarbons, resulting in minor carbon loss. Notably, the co-pyrolysis char obtained at 600 °C demonstrates the highest calorific value, reaching 29.55 MJ/kg.

3.4.4. Co-Pyrolysis Oil Composition Analysis

Figure 14 reveals that the pyrolysis oil produced from SP/SD (1:4) blends at different temperatures comprises nitrogen-containing compounds, alcohols, aldehydes, esters, furans, ketones, and minor acids/ethers. With an increasing co-pyrolysis temperature, the nitrogen-containing compound content rises, indicating enhanced nitrogen migration into the oil phase. This nitrogen-enriched bio-oil shows potential to replace urea/ammonia as a denitrification agent. The aldehyde content initially increases then decreases with the temperature, while the alcohols and ketones decline due to bond cleavage/recombination at higher temperatures. The furan content rises progressively, whereas the acids/ethers show negligible variation.

4. Conclusions

This study systematically investigated the reaction kinetics, thermodynamics, co-pyrolysis reaction heat, and effects of the temperature on the three-phase product distribution during co-pyrolysis of energetic materials (SP) and pine sawdust (SD). Our key findings demonstrate that the mean apparent activation energy (Eavg) in Stage 1 of co-pyrolysis is lower than that in Stage 2. Incorporating SD enables ordered energy release from SP, shifting its primary exothermic zone to higher temperatures with moderated heat release rates. Elevated pyrolysis temperatures drive a yield transfer primarily between the gas and oil phases. H2 and CO dominate the gaseous products, with their yields increasing proportionally to the temperature. Pyrolysis char produced at lower temperatures contains abundant oxygen-containing functional groups, facilitating oxidation reactions upon heating and consequently lowering the ignition temperature. The calorific value of co-pyrolysis char correlates positively with its carbon content. Aldehydes constitute the primary components of SP/SD co-pyrolysis oil, while high temperatures suppress alcohol/furan formation and promote nitrogenous compound generation.

Author Contributions

Conceptualization, methodology and supervision, N.G.; writing—original draft, Y.W.; writing—review and editing, C.Q. All authors have read and agreed to the published version of the manuscript.

Funding

This research received no external funding.

Data Availability Statement

The datasets presented in this article are not readily available due to privacy restrictions and the ongoing nature of the study. Requests to access the datasets should be directed to nbogao@xjtu.edu.cn.

Acknowledgments

Thanks for the support from the Instrument Analysis Center at Xi’an Jiaotong University.

Conflicts of Interest

The authors declare no conflict of interest.

References

  1. Naseem, H.; Yerra, J.; Murthy, H.; Ramakrishna, P.A. Ageing studies on AP/HTPB based composites solid propellants. Energetic Mater. Mater. Front. 2021, 2, 111–124. [Google Scholar] [CrossRef]
  2. Fei, Z.; Sun, M.; Song, Q.; Li, X.; Liu, Y. Freezing-assisted sugaring-out liquid-liquid extraction coupled with LC-MS/MS for quantitative determination of perchlorate in honey. Food Chem. 2024, 435, 137604. [Google Scholar] [CrossRef]
  3. Liao, J.; Ge, Y.; Liu, C.; Sun, L.; Li, M.; Lu, S. Perchlorate and chlorate in aquatic products from Shenzhen, China, and their implications for human exposure. J. Food Compos. Anal. 2024, 132, 106294. [Google Scholar] [CrossRef]
  4. Abdelaziz, A.; Trache, D.; Tarchoun, A.F.; Boukeciat, H.; Kadri, D.E.; Hassam, H.; Ouahioune, S.; Sahnoun, N.; Thakur, S.; Klapötke, T.M. Application of co-crystallization method for the production of ammonium perchlorate/ammonium nitrate oxidizer for solid rocket propellants. Chem. Eng. J. 2024, 487, 150654. [Google Scholar]
  5. Dhabbe, K.I.; Kumari, A.; Manoj, V.; Singh, P.P.; Bhattacharya, B. Development of an eco-friendly method to convert life expired composite propellant into liquid fertilizer. J. Hazard. Mater. 2012, 205–206, 89–93. [Google Scholar] [CrossRef] [PubMed]
  6. He, Z.; Zhao, A.; Liu, S.; Chen, Y.; Liu, J.; Zhao, W.; Yin, M.; Dong, Q.; Zhang, J.; Zhang, G.; et al. Preparation of nitrogen-containing chemicals from lignocellulosic biomass and nitrogen-rich organic solid waste by pyrolysis: Characteristics, reaction mechanisms, and feedstock interactions. Chem. Eng. J. 2024, 496, 153793. [Google Scholar] [CrossRef]
  7. Rajput, G.; Liu, B.; Pan, M.; Kumar, A.; Kumari, L.; Farooq, M.Z.; Li, D.; Lin, F.; Ma, W. Valorizing polymeric wastes and biomass through optimized co-pyrolysis for upgraded pyrolysis oil: A study on TG-FTIR and fixed bed reactor. J. Anal. Appl. Pyrolysis 2024, 182, 106686. [Google Scholar] [CrossRef]
  8. Jiang, P.; Wang, C.; Fan, J.; Ji, T.; Mu, L.; Lu, X.; Zhu, J. Hybrid residual modelling of biomass pyrolysis. Chem. Eng. Sci. 2024, 293, 120096. [Google Scholar] [CrossRef]
  9. Jin, G.; Wang, M.; Zhang, J.; Chen, L.; Liao, X.; He, W. Efficient reduction of NOx emissions from waste double-base propellant in co-pyrolysis with pine sawdust. Arab. J. Chem. 2023, 16, 104647. [Google Scholar] [CrossRef]
  10. Islam, A.; Teo, S.H.; Ng, C.H.; Taufiq-Yap, Y.H.; Choong, S.Y.T.; Awual, M.R. Progress in recent sustainable materials for greenhouse gas (NOx and SOx) emission mitigation. Prog. Mater. Sci. 2023, 132, 101033. [Google Scholar] [CrossRef]
  11. Zhang, Z.; Xi, H.; Zhou, S.; Zhou, W.; Shreka, M. Efficient removal of NOx from simulated marine exhaust by using O3-Na2SO3, Experimental factors and optimization analysis. Fuel 2022, 313, 122659. [Google Scholar] [CrossRef]
  12. Dong, R.; Tang, Z.; Song, H.; Chen, Y.; Wang, X.; Yang, H.; Chen, H. Co-pyrolysis of vineyards biomass waste and plastic waste: Thermal behavior, pyrolytic characteristic, kinetics, and thermodynamics analysis. J. Anal. Appl. Pyrolysis 2024, 179, 106506. [Google Scholar] [CrossRef]
  13. Zha, Z.; Li, F.; Ge, Z.; Lu, Q.; Ma, Y.; Zeng, M.; Wu, Y.; Hou, Z.; Zhang, H. Reactivity and kinetics of biomass pyrolysis products for in-situ reduction of NOx in a bubbling fluidized bed. Chem. Eng. J. 2024, 483, 149138. [Google Scholar] [CrossRef]
  14. Mao, T.; Liu, Z.; Zhang, X.; Feng, H.; Huang, Y.; Xu, Y.; Lin, X.; Zheng, J.; Chen, Z. Interaction evolution and N product distribution during biomass co-pyrolysis for endogenous N-doping bio-carbon. J. Energy Inst. 2025, 118, 101902. [Google Scholar] [CrossRef]
  15. Fu, Y.; Yu, Y.; Qiang, J.; Deng, Y.; Ren, S.; Elshareef, H.; Li, H.; Dong, R.; Zhou, Y. Experimental study on the regulation of NOx in co-pyrolysis of maize straw and woody biomass. Fuel 2024, 357, 129481. [Google Scholar] [CrossRef]
  16. Luo, Y.; Mei, W.; Zhou, W.; Gu, J.; Yuan, H.; Yang, G. Co-pyrolysis of hybrid pennisetum and food waste solid digestate: Synergistic effect, products distribution and kinetics. J. Anal. Appl. Pyrolysis 2025, 192, 107243. [Google Scholar] [CrossRef]
  17. Li, S.; Qu, R.; Hu, E.; Liu, Z.; Xiong, Q.; Yu, J.; Zeng, Y.; Li, M. Co-pyrolysis kinetics and enhanced synergy for furfural residues and polyethylene using artificial neural network and fast heating. Waste Manag. 2025, 195, 177–188. [Google Scholar] [CrossRef]
  18. Qian, Y.; Wang, Z.; Chen, L.; Liu, P.; Jia, L.; Dong, B.; Li, H.; Xu, S. A study on the decomposition pathways of HTPB and HTPE pyrolysis by mass spectrometric analysis. J. Anal. Appl. Pyrolysis 2023, 170, 105929. [Google Scholar] [CrossRef]
  19. Arisawa, H.; Brill, T.B. Flash pyrolysis of hydroxyl-terminated polybutadiene (HTPB) I: Analysis and implications of the gaseous products. Combust. Flame 1996, 106, 131–143. [Google Scholar] [CrossRef]
  20. Li, J.; Yao, X.; Ge, J.; Yu, Y.; Yang, D.; Chen, S.; Xu, K.; Geng, L. Investigation on the pyrolysis process, products characteristics and BP neural network modelling of pine sawdust, cattle dung, kidney bean stalk and bamboo. Process Saf. Environ. Prot. 2022, 162, 752–764. [Google Scholar] [CrossRef]
  21. Chai, S.; Kang, B.S.; Valizadeh, B.; Valizadeh, S.; Hong, J.; Jae, J.; Lin, K.-Y.A.; Khan, M.A.; Jeon, B.-H.; Park, Y.-K.; et al. Fractional condensation of bio-oil vapors from pyrolysis of various sawdust wastes in a bench-scale bubbling fluidized bed reactor. Chemosphere 2024, 350, 141121. [Google Scholar] [CrossRef]
  22. Cai, Z.; Chen, S.; Wang, X.; Sun, J.; Liu, J.; Wu, T.; Song, X. Evolution of pyrolysis behaviour of agroforestry biomass waste following bio-board formation. J. Environ. Chem. Eng. 2025, 13, 118763. [Google Scholar] [CrossRef]
  23. Ye, L.; Zhang, Z.; Wang, F.; Wang, X.; Lu, Y.; Zhang, L. Reaction mechanism and kinetic modeling of gas-phase thermal decomposition of prototype nitramine compound HMX. Combust. Flame 2024, 259, 113181. [Google Scholar] [CrossRef]
  24. Kai, X.; Wang, L.; Yang, T.; Zhang, T.; Li, B.; Liu, Z.; Yan, W.; Li, R. Structure characteristics and gasification reactivity of co-pyrolysis char from lignocellulosic biomass and waste plastics: Effect of polyethylene. Int. J. Biol. Macromol. 2024, 279, 135185. [Google Scholar] [CrossRef] [PubMed]
  25. Wang, R.; Tian, Y.S.; Zhao, L.X.; Yao, Z.; Meng, H. Industrial analysis and determination of calorific value for biomass based on thermogravimetry. Trans. Chin. Soc. Agric. Eng. 2014, 30, 169–177. [Google Scholar]
  26. Deng, S.; Xu, K.; Xia, Z.; Yu, S.; Wang, X.; Tan, H.; Ruan, R. Characteristics analysis of char from sewage sludge pyrolysis: Char properties, combustion behavior and ash fusion. J. Environ. Chem. Eng. 2025, 13, 115638. [Google Scholar] [CrossRef]
  27. Sakurai, Y.; Kameda, R.; Hiratsuka, M.; Kobayashi, J. Initial pyrolysis behavior and char formation characteristics of lignin based on reactive molecular dynamics simulation. Chem. Eng. Sci. 2025, 310, 121531. [Google Scholar] [CrossRef]
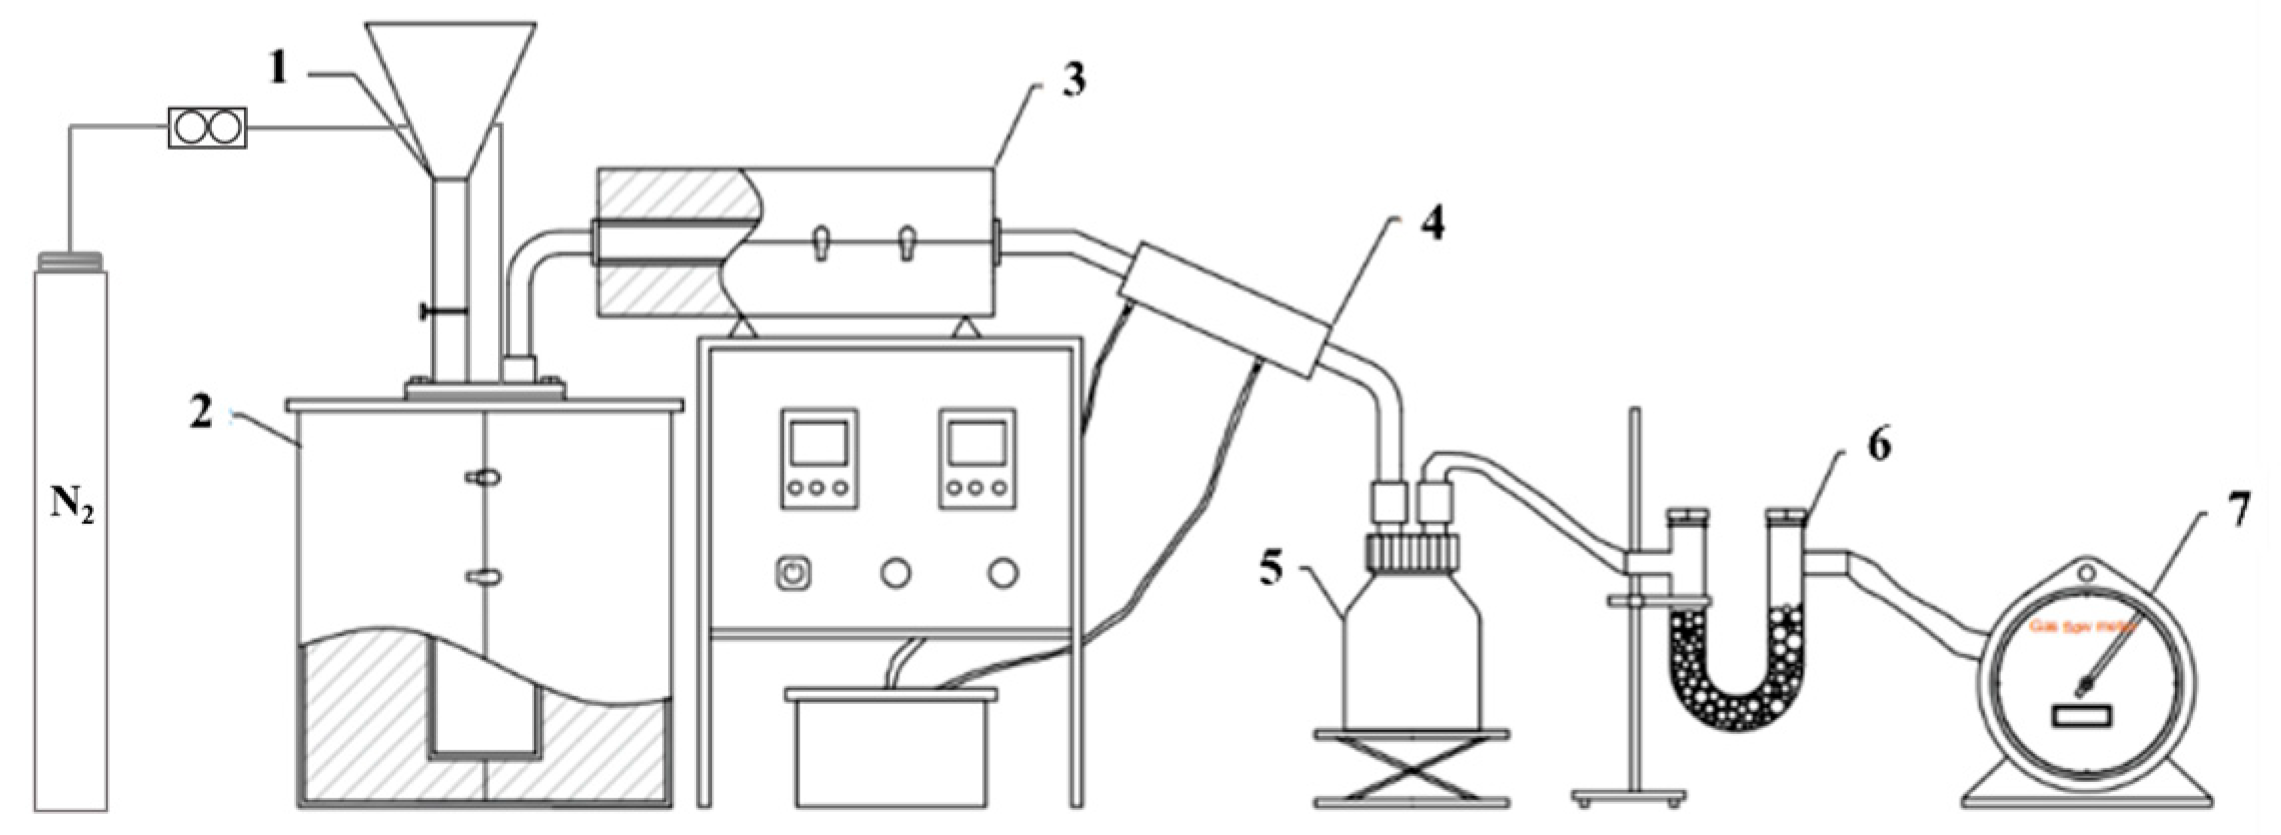
Figure 1. Fixed-bed pyrolysis furnace temperature acquisition system (1: feed inlet; 2: pyrolysis unit; 3: catalytic unit; 4: condensate refluxer; 5: skimmer bottle; 6: drying unit; 7: flowmeter).
Energies 18 04768 g001
Figure 2. (a) TG-DTG curves for SP pyrolysis; (b) TG-DTG curves for SD pyrolysis.
Energies 18 04768 g002
Figure 3. DTG curves for SP and SD blends at different ratios.
Energies 18 04768 g003
Figure 4. Δw curves of SP and SD at different blend ratios.
Energies 18 04768 g004
Figure 5. TG (a) and DTG (b) curves for the pyrolysis of the SP/SD blend (1:1 mass ratio) at different heating rates.
Energies 18 04768 g005
Figure 6. Fitting curves of Ea for SP/SD (1:1) co-pyrolysis via FWO and KAS methods. (a) Ea at the stage 1 (140–260 °C)-FWO; (b) Ea at the stage 2 (260–420 °C)-FWO; (c) Ea at the stage 1 (140–260 °C)-KAS; (d) Ea at the stage 2 (260–420 °C)-KAS.
Energies 18 04768 g006
Figure 7. DSC-DTG curves for SP/SD co-pyrolysis: (a) SD; (b) SP; (c) SP2SD1 (SP:SD = 2:1); (d) SP1SD1; (e) SP1SD2; (f) SP1SD4.
Energies 18 04768 g007aEnergies 18 04768 g007b
Figure 8. Heat flow–temperature curves for co-pyrolysis of SP and SD at different mixing ratios.
Energies 18 04768 g008
Figure 9. Distribution of the three-phase co-pyrolysis products at different temperatures.
Energies 18 04768 g009
Figure 10. (a) Composition distribution of co-pyrolysis gaseous products at different pyrolysis temperatures; (b) yield of co-pyrolysis gaseous products at different pyrolysis temperatures.
Energies 18 04768 g010
Figure 11. FTIR curves for co-pyrolysis char at different pyrolysis temperatures.
Energies 18 04768 g011
Figure 12. Combustion characteristic parameters and proximate analysis plot for co-pyrolysis char.
Energies 18 04768 g012
Figure 13. (a) TG curves for co-pyrolysis char combustion; (b) DTG curves for co-pyrolysis char combustion.
Energies 18 04768 g013
Figure 14. Composition distribution of co-pyrolysis oil from SP/SD at different pyrolysis temperatures.
Energies 18 04768 g014
Table 1. Primary components of SP and SD (M: moisture; A: ash; V: volatile; FC: fixed carbon).
MaterialsProximate Analysis (wt.%, ad)Ultimate Analysis (wt.%, ad)HHV (MJ/kg)
AVMFCCHO *NSCl
SP13.6373.9010.8412.4715.423.3640.0219.390.178.0112.52
SD0.5582.446.7817.0150.756.7840.561.190.17-18.31
* Determined using difference.
Table 2. Apparent activation energy of the SP/SD blend (1:1 mass ratio) determined using the FWO and KAS methods.
αFWOKAS
Stage 1 (140–260 °C)Stage 2 (260–420 °C)Stage 1 (140–260 °C)Stage 2 (260–420 °C)
E
(kJ/mol)
R2E
(kJ/mol)
R2E
(kJ/mol)
R2E
(kJ/mol)
R2
0.146.070.999995.310.999938.880.999986.380.9999
0.262.040.9975102.420.997654.530.996693.260.9986
0.384.250.9978109.930.995876.580.9947100.680.9976
0.4109.460.9979112.300.9921101.480.9952103.060.9907
0.5121.550.9994118.620.9840113.650.9986109.140.9812
0.6128.191117.120.9933120.210.9999107.480.9921
0.7125.970.9999110.800.9999117.830.9999100.920.9999
0.8122.810.9999111.120.9995114.670.9999100.920.9997
0.9116.570.9963116.330.9980108.350.9915105.900.9976
Eavg101.87 110.44 94.02 100.86
Table 3. Pyrolysis reaction heat of SP, SD, and their blends at different ratios.
SamplesTemperature Interval (°C)Pyrolysis Reaction Heat (kJ/kg)Sum
SPR1180–245−720.37−1080.24
R2245–265+15.30
R3290–400−375.17
SDR1310–380+53.98+53.98
SP2SD1R1220–265−70.80−565.87
R2265–350−495.07
SP1SD1R1220–265−75.48−412.88
R2265–320−337.40
SP1SD2R1220–265−32.18−273.72
R2265–375−241.54
SP1SD4R1210–260−58.79−165.01
R2260–360−106.22
Table 4. Combustion characteristic parameters of SP and SD at different pyrolysis temperatures.
TemperaturesTi (°C)Tf (°C)Tm (°C)dx/dtmaxS (10−9)
400 °C357.29454.00368.970.05116.00
500 °C424.93473.00434.770.03713.00
600 °C445.76522.95451.090.0367.49
700 °C468.22554.85475.150.0314.73
Table 5. Results of ultimate analysis and proximate analysis and calorific value of co-pyrolysis char at different pyrolysis temperatures.
TemperaturesUltimate Analysis (wt.%, ad)Proximate Analysis (wt.%, ad)HHV
(MJ/kg)
CHSNO *MAVFC
400 °C70.042.900.021.9611.351.8713.7355.3929.0125.95
500 °C76.962.610.012.452.361.6215.6153.3229.4527.51
600 °C80.362.080.032.721.170.9313.6453.4032.0329.55
700 °C77.302.610.012.053.102.4414.9353.1829.4527.34
* Determined using difference.
Disclaimer/Publisher’s Note: The statements, opinions and data contained in all publications are solely those of the individual author(s) and contributor(s) and not of MDPI and/or the editor(s). MDPI and/or the editor(s) disclaim responsibility for any injury to people or property resulting from any ideas, methods, instructions or products referred to in the content.