Abstract
The circular economy (CE) aims to reduce environmental degradation by ensuring the continuous use of materials and energy resources, aligning with the decarbonization agenda. However, despite the rising acceptance of CE concepts, the economic and managerial aspects remain underexplored in policy and practice. Therefore, this study seeks to bridge the knowledge–practice gap by studying how technology-driven innovation, renewable energy, and energy efficiency interact with CE principles to advance sustainable environmental connections in a detailed manner. The economic analysis of this study was conducted using two base and moderation models, utilizing global data from 78 developing and developed countries, and applying Fixed Effect, Random Effect, and Generalized Method of Moments estimates. The samples were selected based on data availability from internationally recognized databases from 2010 to 2021. The key findings suggest that technology-driven innovation and renewable energy reduce carbon emissions, whereas gross domestic product (GDP) growth and energy efficiency show no standalone positive effects. Notably, moderation effects reveal that the integration of technology with GDP promotes sustainability outcomes, but energy efficiency and renewable energy interact negatively with emissions, a contradictory result warranting further policy investigation. CE-driven innovation promotes decarbonization by striking a balance between environmental preservation, economic expansion, and technology uptake. This study emphasizes region-specific techniques and offers policy insights for combining the CE with natural capital and green GDP. It increases the knowledge of how circular business models powered by technology support sustainable growth and the shift to a circular economy.
1. Introduction
The economic components of sustainability concerns are increasingly crucial in global policy debates. Growing environmental concerns, including waste management, resource depletion, and climate change, necessitate solutions that combine economic growth with ecological preservation. The CE concept, which emphasizes resource reduction, reuse, and recycling, offers a framework to reconcile these competing priorities through market processes and regulatory interventions.
Technology-driven innovation, predominantly artificial intelligence (AI), provides unparalleled opportunities to support sustainability initiatives through its extensive capabilities in data processing, automation, and predictive analytics. The founder of AI, McCarthy, defined it in 1990 as the science and engineering of creating intelligent devices, a capability now being harnessed to optimize resource economics [1].
The immense growth of technology-driven innovation is integrated into a wide range of fields, particularly addressing critical issues related to the CE, such as supply chain management [2], waste management [3,4,5,6], reverse logistics [7], energy source optimization [8], sustainable manufacturing systems [9], and the design of smart cities to enhance their resilience and adaptability to environmental changes. These applications highlight how technological innovation can drive both environmental sustainability and economic competitiveness. Technology-driven innovation prediction models can anticipate energy supply and demand, thereby increasing the efficiency of renewable energy systems and reducing environmental pollution [10,11]. Additionally, there has been a continuous movement in recent years to integrate AI into every aspect of the CE as a tool to meet both ecological and economic objectives.
Organizations have become more cautious in their attempts to adopt CE principles to increase circularity and further extend the lifespan of resources. This caution generally originates from economic factors, including upfront investment expenses and uncertain returns. China, the EU, Japan, and the USA are among the countries that have recently started implementing CE principles [12], typically through policy frameworks that mix environmental control with economic incentives. Since the CE is still in its infancy, most businesses are focusing on recycling rather than reusing [13,14], a tendency that matches present economic realities where recycling usually indicates clearer short-term financial gains. The current use of technology, supply chain complexity, operations strategy, planning and control, regulations, and people’s consciousness are several crucial factors that must be considered when implementing and promoting the CE [15,16], all of which have major economic dimensions.
According to Roberts, Zhang [17], technology-driven innovation greatly aided the CE. It may enable innovative circular business models, help create durable goods, and provide the wider infrastructures required to grow circularity. These advances have substantial consequences for employment generation and new market formation. The findings by Burmaoglu, Ozdemir Gungor [18] stated that to ensure industrial circularity, circular business models have to be created. Digital manufacturing should be applied within the framework of industrial ecology and remanufacturing principles to boost productivity, efficiency, and traceability in the CE. The decarbonization agenda’s fundamental goals are inherently associated with CE methods, which guarantee the continued use of materials and energy resources, hence reducing carbon emissions dramatically. A study from Alamelu, Sudha and Purushothaman [19] highlights the pressing need for policies that not only boost economic expansion but also tackle climate change, enhance resource conservation and waste management, and demonstrate how technology-driven innovation may help make the shift from a linear to a CE model.
However, the role that technology-driven innovation models play in engendering the actualization of the decarbonization agenda through the improved performance of the CE within the built environment context is still insufficiently researched.
This study distinguishes itself by providing a widespread experimental exploration of the growing body of economic literature on sustainable development. First, by employing advanced econometric methods, such as Fixed Effect and GMM estimates, where the FE model enhances causal inferences by accounting for time-invariant variables within a panel dataset, thus adjusting for unobserved variability.
Meanwhile, by using instrumental variables and lag structures to provide accurate estimates, the GMM model addresses potential endogeneity issues, which are common in research related to sustainability. These models deliver a comprehensive analysis of the effects of technology-driven innovation deployment on environmental sustainability. Second, this study offers empirical evidence for the relationship between the global adoption of technology-driven innovation and sustainable environmental outcomes, with a particular emphasis on the economic aspects influencing this relationship. It addresses an important gap in the literature, as prior research has primarily focused on theoretical benefits with limited empirical validation from robust econometric techniques, by answering the following research question: What is the connection between technology-driven innovation and the sustainable environment, and what are the economic implications of this connection?
The results show that technology-driven innovation supports environmental sustainability. From an economic perspective, GDP and energy efficiency are not prioritized. The moderation effects of technology-driven innovation with high-tech manufacturing and GDP are in favour of environmental sustainability. Interestingly, there was a negative relationship between the interaction of EE and REN on carbon emissions, highlighting significant economic trade-offs in sustainability transitions. The findings of this study provide important new information on how technology-driven innovation projects might improve the effectiveness of circular economy practices, especially in reaching decarbonization targets and increasing resource efficiency while preserving economic viability.
This paper makes numerous contributions to the economics of sustainability. First, it offers a detailed view of the role technology-driven innovation may play in furthering CE principles by examining a large global dataset that includes economic components, environmental sustainability indices, and technology-driven innovation adoption measures across various geographical and economic situations. This is especially important for academics, companies, and governments that want to create plans that support sustainable resource management and the decarbonization agenda [15,20].
Second, by emphasizing the economic factors of CE implementation, it adds to the conversation on circular business models. This study highlights the potential of technology-driven innovation to enable creative circular business models that create, deliver, and capture value in a regenerative economic system [18], although a large portion of the current research on business models is based on linear “take-make-dispose” paradigms [21]. To address the difficulties of assessing and controlling value in a CE setting, the findings highlight the necessity of new accounting rules and procedures designed for circular firms [22].
This study emphasizes the systemic shift needed to go from linear to circular economic models. It illustrates how technology-driven innovation may act as a catalyst for overcoming the managerial, organizational, and technological obstacles that businesses have while implementing CE principles [14]. This work serves the larger objective of slowing down climate change and lowering the long-term repercussions by offering empirical data on the efficacy of technology-driven innovation in boosting CE [22], a major institutional prerequisite for successful economic systems.
Numerous aspects of technology-driven innovation adoption, environmental sustainability indices, and economic components from different countries are included in this study. Using this large dataset, the study aims to provide detailed insights into how technology-driven innovation initiatives could help achieve the goals of a circular economy in many regional and economic contexts. This comparative economic research is particularly useful for policymakers looking to balance environmental and economic objectives. The findings of this study show that technology-driven innovation leads to environmental sustainability in the sample countries regardless of their economic status. However, there is a need to reduce the primary energy use in existing energy intensity to improve the environmental quality. This provides crucial directions for energy economics studies and policy. The findings will also have important implications for those in government, business, and academia who are dedicated to creating a more resilient and sustainable future while maintaining economic growth.
The remaining sections consist of a literature review and theoretical framework, then the methodology and the results and discussion, followed by the conclusion, policy implications, and future directions for research.
2. Literature Review and Hypothesis Development
We have divided this section into two to show the existing gap in the literature and make it easy to understand. The first part reviews the circular economic perspective and technology-driven innovation, while the second part reviews the nexus of technology-driven innovation and a sustainable environment.
2.1. CE Perspective and Technology-Driven Innovation
The CE has the potential to balance natural resource supply and demand by recycling, reducing, and reusing. As a result, it is attracting researchers, businesses, and government agencies. As a fascinating idea, the CE has demonstrated encouraging possibilities for adoption at the commercial and institutional levels. However, standard linear production lines cannot solve broad challenges such as waste creation and a shorter lifespan of a good cycle. The CE seeks to close the life cycle of a product loop by maximizing the value of raw materials during the design phase and then reusing, recycling, and remanufacturing them afterwards. Technology-driven innovation like machine learning (ML) and AI offers crucial support for successfully embracing and applying the CE in practical settings.
According to the World Bank [23], the prevailing economic structure’s linear flow results in 2 USD worth of social, economic, and environmental expenditures for every USD 1 worth of consumable food products. The existing structure of production is detrimental to ecology and soil health, but between 60 and 70 per cent more food will be required by 2050. By then, garbage is predicted to have grown to almost 3.40 billion tons. The primary source of waste creation is the economy displaying its linearity and the manufacturing mechanism that goes along with it [24]. The CE, the concept of reducing waste creation and disassembly, is the main remedy for these shortcomings. Therefore, organizations are being guided to become more efficient and environmentally friendly by using sustainable technology-driven innovation like the Internet of Things (IoT) and the CE.
In recent years, there has been a growing body of research focusing specifically on how AI contributes to the implementation of CE principles, particularly in environmental sustainability. Supply chain optimization benefits from technology-driven innovation, as it enables real-time decision-making, predictive analytics, and demand forecasting, which helps reduce excess inventory and minimize resource wastage; thus, minimizing carbon footprints.
In today’s volatile, uncertain, complex, and ambiguous (VUCA) business environment, companies are planning their operations with the CE and technology-driven innovations such as IoT in mind. Thus, the study by Persis, Venkatesh [25] aims to evaluate the CE-IoT-based component and its impact on the food processing industry. Their study evaluates the organization’s adoption intention and takes a close look at CE-IoT’s numerous aspects, with the aim of making ML-based analysis efficient and reliable in the food processing industry. Meantime, using an iterative, step-by-step methodology, Çetin, De Wolf and Bocken [26] examined the built environment, one of the biggest, most material- and energy-intensive industries in the world, and explored the type of digital technologies that could facilitate a CE in the built environment. They identified ten enabling digital technologies to facilitate a CE.
Furthermore, Ramchandani, Rughwani [27] developed a resource value loop that complements the product life cycle theory and advances the CE theory by utilizing new technology to improve waste packaging issues. The research enabled the utilization of a longitudinal case study in emerging markets by large multinational enterprises using digitalization and emerging technologies like blockchain and AI to promote a comprehensive framework based on incentives. In the meantime, in the context of construction management, Rakhshan, Morel and Daneshkhah [28] showed how predictive supervised machine learning systems could enhance circular economics. The AI-driven circularity index employs machine learning algorithms that provide practical suggestions and predictive insights to improve product circularity.
The study by Özsoy [29] presented a summary of the CE idea, highlighting its potential advantages, including maximizing resource use, reducing waste, and enhancing the effectiveness of resource recovery and recycling procedures by utilizing AI. It discusses the difficulties that exist now in putting circular methods into practice in general.
Dhanya, Kumar [30] discussed data analytics and AI in the CE, including better supply chain management, longer product life cycles, less waste, higher-quality products, and cost savings. A sustainable CE might be shaped by data analytics and technology-driven innovation by bettering processes, maximizing resource use, and facilitating well informed decision-making.
An empirical representation of a systematic analysis of links between drivers in urban circular economies is given by trained causal network maps. It highlights how crucial “economic development” and “affordability” are to the network structure. The network provides important information for creating strategies and regulations at the city level to encourage the shift to a more CE. The data-driven visualization of driver interactions provides stakeholders with information about the best course of action [31].
Technology-driven innovation also has a significant impact on increasing the effectiveness of resource recycling. Through sophisticated image recognition, robotics, and data analytics, AI improves the accuracy of waste sorting, lowers contamination in recycling streams, and finds valuable materials that would otherwise be thrown away. These enhancements reduce the requirement for extracting virgin resources by boosting the quantity and quality of recovered materials, which is directly in line with CE goals. For example, Alamelu, Sudha and Purushothaman [19] demonstrated how technology-driven innovation, AI-powered solutions help the industry find ways to recycle and reuse materials at the design stage, reducing waste production. AI-driven solutions improve resource efficiency and encourage sustainable consumption behaviours. These studies highlight AI’s capacity to bridge the gap between the abstract concepts of the CE and their real-world applications.
Hernández-Romero et al. [3] emphasized how technology-driven innovation can be used to develop waste management plans that balance economic and environmental goals. For instance, in Mexico City, technology-driven innovation has been employed to improve energy output and reduce CO2 emissions through advanced technologies like gasification and incineration. This innovation helps enterprises and municipalities achieve significant economic and environmental benefits by analyzing large datasets and identifying the optimal waste processing methods. These outcomes demonstrate that technology-driven innovation can make waste management systems more sustainable and effective. It also enhances waste-to-energy conversion processes [4]. Discussions by Oldfield, White and Holden [24] have shown how technology-driven innovation improves energy output predictions, process monitoring, and waste sorting. AI-powered systems maximize energy production while reducing the environmental impacts of waste-to-energy plants by optimizing operations and data management. By converting waste into useful resources, this integration supports the circular economy and promotes sustainable energy practices. The study highlights the importance of technology-driven innovation in balancing environmental sustainability with energy generation.
Significant progress has been made in technology-driven innovative plastic waste management in the packaging sector. Farghali and Osman [32] stated that technology-driven innovation lowers plastic waste and streamlines recycling procedures, promoting sustainable resource use. Real-world applications demonstrate how technology-driven innovation can transform plastic waste management by increasing sorting accuracy, identifying recyclables, and reducing contamination in recycling streams. By minimizing resource extraction and waste production, these technologies foster a more sustainable packaging environment and align with the principles of a circular economy. The study by Singh [33] highlights how AI can optimize resource life cycles, leading to substantial improvements in waste reduction and overall efficiency in circular economy practices. This suggests that technology-driven innovation can be crucial for sustainable resource management.
The study by Nwokediegwu, Ugwuanyi [34] demonstrated the use of technology-driven innovation in waste management systems. They demonstrate the way the United States makes use of cutting-edge infrastructures to automate sorting procedures, optimize garbage collection routes, and improve recycling efficiency using robotic sorting systems and machine learning algorithms. This method improves resource allocation by using data analytics to forecast trash generation trends. With less developed waste management infrastructures, Africa, on the other hand, uses technology-driven innovation applications that prioritize scalable and adaptive solutions, according to the report. However, the possible environmental effects of deploying innovation-driven waste management systems in the USA and Africa are not specifically discussed in their study. Meanwhile, Poonkuzhali, Karamath [35] discuss how to improve waste management efficiency: the Smart Waste Management (SWM) system uses IoT sensors to collect data from garbage bins in real time. This data enables the dynamic optimization of collection routes and schedules. Informed decision-making that limits fuel consumption, saves expenses, and lowers carbon emissions is made possible by ML algorithms that assess data on fill levels and environmental conditions to forecast waste generation trends.
Bodislav et al. [36] assessed how the consumption of recyclable materials is affected by trade, GDP, renewable energy, material footprint, and investment in circular economy sectors in 27 EU nations between 2013 and 2021, using a two-stage panel model. The use of recyclable materials is positively impacted by most variables, except for greenhouse gas emissions. The findings show that investment and innovation lower environmental harm. Crucially, the circular economy must be completely embraced for Europe to experience sustainable development.
Scheel & Aguiñaga [37] presented a new framework for sustainability, known as the systems approach to the circular economy. It encourages a change in focus from short-term economics to long-term, stakeholder-inclusive growth by using disruptive innovation and circular, systemic thinking. The strategy aims to create sustainable prosperity and positive impacts on the environment, society, and economy. Case studies show how this idea enhances sustainability in Mexico and encourages economic growth to be separated from environmental degradation.
Erdoğdu et al. [38] examined ways to improve energy efficiency, renewable energy, and circular economy principles to fight climate change. To improve energy efficiency, it assesses smart systems, genetic algorithms, and technologies like solar, wind, and geothermal power. Under environmental restrictions, a dual-model approach, one with and one without environmental factors, projects that the share of renewable energy in worldwide consumption might reach 82.4% by 2025. But issues like droughts that impact hydropower continue to exist. The study provides important insights for sustainable energy transitions and highlights the necessity of coordinated strategies to reconcile environmental protection with energy expansion.
Činčikaitė [39] emphasized developments and persistent problems in material consumption and waste stream management with a focus on the EU and Lithuania. The study prioritizes trash avoidance, reuse, recycling, and landfill optimization while identifying important elements influencing urban waste management using descriptive statistics and the analytic hierarchy process.
The theoretical benefits of technology-driven innovation in promoting a circular economy are well known. There are still a few empirical studies that use valid econometric techniques to quantify the effects of technology-driven innovation in promoting a CE. The literature emphasizes technology-driven innovation in waste reduction, resource efficiency, and supply chain optimization. Based on this theoretical, methodological foundation, this study will answer the following research hypotheses:
H1:
Economic growth, resource use, and energy efficiency significantly improve the environment through circular economy adoption.
H2:
Innovation (high-tech manufacturing, and renewable energy consumption) improves the environment through circular economy adoption.
H3:
Integrating innovation with economic growth, resource use, and energy efficiency significantly improves the environment.
2.2. Technological Innovation and Sustainable Environment
Technology-driven innovation holds great promise for addressing some of the most pressing environmental crises facing the globe. The technique is already being used, among other things, to track and analyze methane emissions, greenhouse gases, and Earth’s temperature, providing immediate insights for focused interventions. Technology-driven innovation plays a crucial role beyond monitoring in supporting the principles of the CE, which emphasizes the reduction, reutilization, and recycling of resources throughout production and consumption. Achieving long-term environmental sustainability necessitates a transition from linear to circular models, which AI can optimize and minimize.
For instance, a study on Chinese agricultural firms by Lin, Zeng [40] shows that technology-driven innovation positively impacts environmental performance through green innovation. It also finds that a green culture of the organizations enhances the effect on green product innovation, further strengthening its role in improving environmental performance. It should be emphasized that in promoting green technology-driven innovation, those involved in the technology-driven innovation life cycle should be morally responsible for any reasonably foreseeable negative environmental impact and must ensure that the positive gain is higher than the negative consequences [10,41].
Increasing the lifespan of products and reducing the use of virgin materials directly contribute to CE goals. Furthermore, the study highlights the importance of green organizational culture in creating green products, showing how technology and institutional readiness interact.
A fundamental component of the CE, supply chain optimization, is one of the main ways AI promotes sustainability. Demand forecasting, real-time inventory management, and smarter logistics are made possible by technology-driven innovation, which also help to cut down on material and energy waste and overproduction. Additionally, technology-driven innovation, such as robotics and AI-powered image identification in waste management systems, increases the efficiency of resource sorting and recycling, improving the recovery of valuable materials from waste streams and supporting the CE principle of closing resource loops.
However, Van Wynsberghe [11] suggested that “Sustainable AI is not about how to sustain the development of AI per se, but it is about how to develop AI that is compatible with sustaining environmental resources for current and future generations”, besides other impacts on the economy and society. The growing use of technology-driven innovation, with AI as an integral part, leads to an inevitable increase in energy consumption. In addition, an increasing amount of research into the life cycle of AI [11,41,42,43,44] indicates that the usage of technology-driven innovation and its related infrastructure harms the environment. Increasing numbers of data centres that house technology-driven innovation servers produce electronic waste and use a lot of water to cool down the system. Besides that, the production of hardware depends on rare and essential minerals, which are frequently extracted in an unsustainable manner.
Additionally, training technology-driven innovation, such as AI, especially deep machine learning, consumes enormous amounts of electricity, which contributes to the release of greenhouse gases that warm the Earth. In contrast to the typical human brain, which uses only about 20 W of energy, a digital simulation of an artificial neural network of the same size uses 7.9 MW [45]. In 2020, the ICT industry accounted for approximately 4% of worldwide power consumption and 1.4% of global GHG emissions. Electricity consumption and GHG emissions are linked to technology-driven innovation applications, entertainment and media, paper media, and cryptocurrencies [46]. According to estimates from the International Energy Agency (Paris, France), data centres and data transmission networks contributed between 1 and 1.5% of the world’s electricity consumption and 330 million tons of carbon dioxide equivalent (tCO2e), or about 1% of greenhouse gas emissions connected to energy, in 2020 [46]. Furthermore, Konya and Nematzadeh [47] reported that compared with other programmes, AI uses 2.57 times as much power on a standard computer. Besides that, the cost involved in creating, refining, and running AI models can amount to millions of dollars in a few weeks. Moreover, Strubell, Ganesh and McCallum [44] highlight the financial and environmental implications of developing several successful AI models, specifically the NPL algorithm, and they discovered that the process could produce about 626,000 pounds of carbon dioxide equivalent, which is over five times the emissions of a typical American car over its lifespan (including manufacturing). According to Patterson, Gonzalez [48] the geographic location of the data centre and its infrastructure matters in contributing to CO2 emissions.
On the other hand, Wu, Raghavendra [43] investigate the AI carbon footprint not only from ML model development and deployment but also from the life cycle of the system hardware, which includes hardware manufacturing and use. The study discovers that both training and inference at Facebook can have a considerable impact on the overall AI carbon footprint. The impact varies depending on the type of ML used. Ligozat, Lefevre [41] further emphasize the importance of considering the life cycle of AI in evaluating the impact of AI on the environment. They suggest that the total impact should include each device life cycle phase and the tasks involved in AI services.
Although the development of technology-driven innovation and computational tools presents enormous prospects to improve research efficiency, they also have environmental consequences of their own. Coulson-Thomas [49] studied the carbon footprints of the computational tools employed in life science research and highlighted that while the environmental impact of wet lab operations is obvious because of the usage of a large amount of equipment, plastic, and reagents, the implications of computational tools are frequently overlooked. Meng and Norman (2022) [50] highlight that selecting the best strategies to cut CO2 emissions requires accurate CO2 emission projections. They propose that a variety of other external influence variables that contribute to CO2 emissions be included for more precise forecasting.
Li et al. [51] examined the recycling issues of decommissioned wind turbines (WTs) in China, suggesting a hybrid model that combines deep learning, dynamic material flow analysis, and a sustainability framework known as 3E1S (Energy–Economy–Environment–Society). According to the study, WT retirements are expected to increase after 2030, with Xinjiang and Inner Mongolia experiencing the highest recycling demands. It is anticipated that retirements and installations will balance by 2050. Recycling WTs might save CO2 emissions by up to 8.14 billion tons and provide economic benefits of about CNY 198.5 billion. The paper offers a workable framework for promoting a circular economy in the field of wind energy.
Javed et al. [52] assessed the economic and environmental effects of managing construction and demolition (C and D) waste in developing nations. It contrasts recycling and landfill options using life cycle assessment and life cycle costing techniques. According to the results, recycling construction and demolition debris is more cost-effective, saving USD 2.53/ton in Lahore and reducing greenhouse gas emissions by 37 kg CO2/ton, and lowering the demand for raw materials. To promote sustainability, economic efficiency, and advancement toward SDGs 11, 12, and 13, the report exhorts governments to give recycling top priority.
The theoretical relationship between technology-driven innovation and the CE is still not well defined in empirical literature, despite the growing awareness of these problems. Few studies specifically examine how technology-driven innovation processes impact CE outcomes like resource efficiency, material circularity, or sustainable product design, even though many highlight the advantages or disadvantages of technology-driven innovation for the environment. Our comprehension of how technology-driven innovation can be used to generate net environmental benefits is constrained by this gap. Given the dual role of AI (sustainability benefits vs. energy costs), we hypothesized the following:
H4:
Integrating innovation with cleaner energy and energy efficiency will lead to positive effects on improved environmental quality.
By providing fresh perspectives on the connection between technology-driven innovation and environmental sustainability, especially from the perspective of the circular economy, this study helps to bridge the knowledge gap. It examines the structural and contextual elements that mediate this relationship, including energy efficiency, renewable energy, economic growth, and material footprint, across different countries, in addition to the potential for technology-driven innovation to lower emissions and enhance resource management.
3. Materials and Methods
3.1. Data and Variable Description
To investigate the relationship between technology-driven innovation and a sustainable environment, this study included the following variables in the analysis: bio-capacity, material footprint, Frontier Technology Readiness Index, renewable energy consumption, energy efficiency, medium- and high-tech manufacturing value added, GDP per capita, and employment. These variables were used as explanatory variables, where carbon dioxide emissions represent the dependent variable. Data were collected from World Bank (WB) databases, the United Nations Conference for Trade Development (UNCTAD), and the United Nations Environment Program UNEP Global Material Flows Database, as described in Table 1.

Table 1.
Variable definition and data sources.
CO2 acted as the dependent variable. The material footprint is a consumption-based indicator of resource use, representing the distribution of raw materials gathered for economic purposes to meet the resulting demand. Thus, the material footprint serves as an indicator of resource consumption and optimizations across the entire value chain of products and ingredients, exemplifying the principles of a CE. Furthermore, we utilize the bio-footprint to illustrate the sustainable environment in this study. The Frontier Technology Readiness Index (FTRI) signifies technology-driven innovation utilization in various economies. The FTRI is a composite index created to evaluate a nation’s ability and readiness to integrate, advance, and profit from modern innovations like biotechnology, robotics, artificial intelligence, and green technologies. The score sheds light on a country’s capacity to incorporate innovative ideas into its society and economy, and it consists of five components: ICT deployment, skills, research and development, industrial activities, and finance. ICT deployment typically refers to the availability, use, and integration of digital technologies such as internet infrastructure, computer systems, mobile networks, and software. Additionally, we accounted for renewable energy (REN), which indicates a shift in energy sources from fossil fuels to green energy due to technology-driven innovation advancements in the energy sector. Moreover, we incorporated a variable for medium- and high-tech manufacturing value added (% manufacturing value added) to reflect technology-driven innovation’s influence in the manufacturing sector. We also included GDP to indicate the status of the economies.
3.2. Sample
This research examines a balanced panel of 78 countries from 2010 to 2021, chosen through a meticulous three-stage process to guarantee representativeness, data reliability, and conformity with the research framework. Initially, countries were included only if they provided complete data for all key variables: GDP growth, CO2 emissions, FTRI, MFP, EE, REN, and HTM. This criterion guaranteed methodological consistency and excluded nations with substantial data gaps.
Secondly, in terms of developmental diversity, the sample is designed to cover a wide range of economic contexts. As classified by the World Bank, it encompasses low-income economies (e.g., Uganda, Zambia), middle-income economies (e.g., India, Brazil), and high-income economies (e.g., Norway, the United States). The sample encompasses a range of economic structures, including industrial powerhouses (e.g., Germany, Japan), resource-dependent nations (e.g., Saudi Arabia, Botswana), and emerging tech hubs (e.g., South Korea, Singapore). This variety enables the research to investigate if AI’s contribution to furthering circular economy principles differs according to developmental stage or economic specialization.
Third, the sample guarantees extensive geographical representation from Africa, Asia, Europe, the Americas, and Oceania. It is essential to include regional aspects to consider the variations in institutional quality, policy frameworks, and resource endowments. The sample, for example, contrasts regions with advanced circular economy adopters (e.g., the Netherlands and Sweden) with those where infrastructure gaps persist (e.g., Mozambique and Kenya). It encompasses countries with strict environmental regulations (e.g., EU members) as well as those with less formal governance structures (e.g., Bangladesh, Nigeria). This method enhances the external validity of results by mirroring global diversity.
Although the sample’s size and diversity are advantages, two limitations are observed. Initially, certain countries were left out because of data gaps, especially in Africa and the Caribbean, which might lead to an underrepresentation of fragile economies. Secondly, the period from 2010 to 2021 excludes the possibility of examining trends in AI adoption after the pandemic. The chosen countries offer a solid basis for cross-country comparisons, striking a balance between empirical feasibility and theoretical rigour. Table 2 presents a detailed list of the nations that were used in the analysis.
Table 2.
List of countries.
3.3. Model Specification and Estimation Procedure
We utilized the STAT 13 software as an analytical tool for all the models. The baseline empirical model of this study can be expressed as follows:
where subscripts i and t stand for country and year, respectively. After transforming the variables into their natural logarithm, the static model of this study is specified as follows:
where is the intercept, are the parameters to be estimated, and is the error term.
3.3.1. Static Panel Estimators: FE and RE
First, FE and RE methods were employed to estimate the parameters. The FE estimator controls for unobserved country-specific variables influencing the dependent variable, allowing the intercept to differ across countries. The FE model is beneficial for controlling time-invariant characteristics, such as the quality of institutions or geographical factors, which may vary among countries but remain constant over the years [53]. The RE estimator assumes that these unobserved effects are uncorrelated with the explanatory variables, thereby preserving the efficacy of the estimates [53].
The FE model specification is as follows:
where is the country’s specific intercept.
The RE model specification is as follows:
where is the stochastic ingredient that differs across countries.
3.3.2. Dynamic Panel Estimators: GMM
To enhance the analysis, the static model is expanded to a dynamic specification utilizing [54] a difference GMM (DGMM) estimate approach and [55] a system GMM (SGMM) estimation method. The GMM estimator is significant for this study due to the properties of the panel dataset, which includes a large cross-section (N = 79) and a short time length (T = 12), both of which satisfy the requirements for applying the GMM technique.
Dynamic GMM estimators are particularly valuable because they consider the following aspects: (i) Address endogeneity, which may arise from reverse causality, measurement error, or omitted variable bias through internal instruments derived from the lag structure of the regressors. It uses lagged levels (for DGMM) and both lagged levels and lagged differences (for SGMM) of the explanatory variables. This approach is based on the premise that past values of the regressors are correlated with current endogenous shocks yet uncorrelated with contemporaneous idiosyncratic errors, satisfying the relevance and exogeneity conditions for valid instruments. (ii) Control for unobserved heterogeneity and error structure, both DGMM and SGMM estimators effectively control for unobserved country-specific heterogeneity, heteroscedasticity, and serial correlation in the error terms. (iii) Avoid instrument proliferation and, to guard against instrument proliferation, we implement Roodman’s two-step “collapse” procedure [54,56].
The dynamic specification is given as follows:
3.3.3. Moderation Analysis
In addition to the baseline and dynamic specifications, this study examines whether technology-driven innovation moderates the relationship between the explanatory variables and CO2 emissions. Interaction terms between the Frontier Technology Readiness Index (FTRI) and each key variable (MFP, REN, EE, GDP) were introduced into the model. The general moderating specification can be expressed as follows:
where denotes the baseline explanatory variables, and represents the interaction terms capturing the moderating effect of technology. Each interaction term was tested separately to assess how FTRI alters the influence of GDP, energy efficiency, renewable energy, and material footprint on CO2 emissions. This step allows us to test whether technological readiness amplifies or mitigates the influence of core economic and environmental drivers on CO2 emissions, thereby providing deeper insights into the role of innovation in shaping sustainability outcomes.
3.3.4. Diagnostic and Robustness Checks
To ensure the validity and robustness of the GMM estimators, this study conducts the Arellano–Bond test for autocorrelation to confirm the absence of second-order serial correlation in the differenced residuals [54,57] and the Hansen and Sargan tests of over-identifying restrictions are also applied to assess the validity of the instruments [58,59].
3.3.5. Methodological Framework
The methodological procedure of FE, RE, and GMM estimations is summarized in Figure 1. This multi-step framework ensures robustness by comparing static and dynamic estimators, addressing potential biases, and validating the reliability of the results through diagnostic tests.
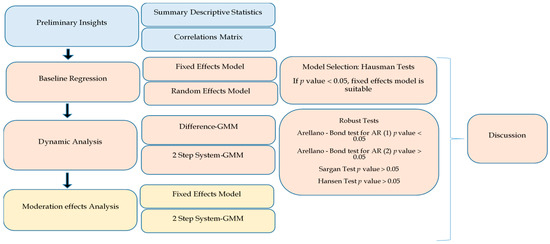
Figure 1.
Methodology procedure developed by the authors.
4. Results and Discussion
Before starting the discussion of the results, this study provides a summary of statistics on the selected variables and their correlations. As presented in Table 3, the summary statistics contain the number of observations as well as the mean, standard deviation, minimum, and maximum values for each variable. The results in Table 3 show that the average CO2 emission is roughly 1.2 per year. The bio-capacity average is 17.1, while the Frontier Technology Readiness Index reveals a modestly negative average of 0.66. The other variables have the following values: material footprint of 17.3, energy efficiency average of 1.4, renewable energy consumption of 2.5, economic growth of 9.1, medium- and high-tech manufacturing value added to 3.2, and employment of 4.0. The results show that there is no significant variation between countries.
Table 3.
Descriptive analysis.
Table 4 summarizes the correlation coefficients for each variable. The correlation analysis shows that FTRI (0.77), MFP (0.36), MHT (0.49), and GDP (0.80) have a positive relationship with CO2 emissions. However, BC (−0.11), EE (−0.08), REN (−0.60), and EMP (−0.08) have a negative correlation with CO2 emissions. Furthermore, the coefficients of association between the exogenous variables were found to be less than 0.8, indicating that there are no multicollinearity problems.
Table 4.
Correlation analysis.
4.1. The Baseline Regression Findings
According to the Hausman’s test p-value of (0.000), which is less than (0.05), the null hypothesis is rejected and affirms that FE is preferred to RE for this analysis. The FE model, which makes use of within-group estimators, provides for the control of missing and unobserved variables that are fixed over time and vary across countries, as well as missing and unobserved factors that are fixed across countries but vary over time [60].
Table 5 shows the results of base regression analyses performed using four models. These four models serve two key functions: first, to ensure the robustness and consistency of results across different estimation techniques, and second, to account for potential endogeneity and dynamics in the panel structure, particularly addressed through the GMM frameworks. In addition, they offer a framework for comparisons to evaluate the reliability of the primary results. Before considering the parameter values obtained using the four models, some critical tests must be performed to check the robustness. AR (1), AR (2), Sargan’s, and Hansen’s tests are employed to confirm model validity and instrument relevance in GMM estimations. These diagnostics, as shown in the last four rows of Table 5, confirm the absence of second-order serial correlations and the instruments’ validity.
Table 5.
Fixed Effect, Random Effects, System GMM, Difference GMM, and robust test results.
The variables EE and GDP consistently exhibited positive and statistically significant coefficients across all four base models (FE, RE, SGMM, and DGMM). The results indicate a robust and positive relationship between these factors and CO2 emissions. The coefficients for EE are 1.01%, 0.90%, 0.67%, and 0.75%, indicating that a 1% increase in EE corresponds to a rise in CO2 emissions of 1.01%, 0.90%, 0.67%, and 0.75% across all four models, FE, RE, SGMM, and DGMM, respectively. This result is consistent with the study by [61] and can be explained as confirmation of the rebound effect, a phenomenon in which energy efficiency advancements reduce the effective cost of energy services, causing consumers to use more energy and eventually cancelling out any possible environmental benefits [57].
This study does not examine the industry-specific data or policy mechanisms behind this effect, but the presence of positive EE coefficients across multiple econometric models indicates that efficiency gains alone may not result in emission reductions. This backs up the perspective that it is inadequate for environmental sustainability to depend only on energy efficiency and economic growth within a linear “take–make–dispose” economy. Rather, these results underscore the necessity of embracing circular economic models that separate growth from resource use and emissions, promoting structural transformation over incremental improvements. Future studies ought to confirm the rebound mechanism via sector-specific case analyses, like those in transport or manufacturing, and assess policy measures (e.g., energy efficiency subsidies) that could unintentionally increase energy consumption.
This finding is consistent with Kuznut’s theory. It emphasizes that an increase in GDP correlates favourably with CO2 emissions. A 1% increase in GDP is equivalent to 0.97%, 0.82%, 0.22%, and 0.61% increases in CO2 emissions. The positive correlation between EE and CO2 emissions may be the result of a “rebound effect,” in which better efficiency raises energy consumption because of reduced prices or more economic activity. The difficulties of switching from linear to circular business models, which call for reconsidering value generation and delivery to optimize resource productivity and reduce waste, are consistent with this issue. The necessity for circular business models that emphasize closed-loop systems and regenerative practices rather than continuing the linear economy’s reliance on resource extraction and disposal is further highlighted by the significant association between GDP and CO2 emissions.
In contrast, we found a substantial negative correlation between the REN and HTM variables and CO2 emissions in three out of the four models (FE, RE, and DGMM). This demonstrates that REN and HTM are feasible options to mitigate CO2 emissions. The coefficients for REN imply that a 1% increase in REN reduces CO2 emissions by 0.14%, 0.14%, and 0.06% in all three models, FE, RE, and D.GMM, respectively. There is a negative correlation between HTM and CO2 emissions. A 1% rise in HTM corresponds to 0.03%, 0.02%, and 0.05% reductions in CO2 emissions. These results demonstrate how the CE transition may be facilitated using renewable energy sources and industrial technology advancements. By encouraging the use of renewable energy sources and lowering the dependency on fossil fuels, REN closely complies with CE standards. In a similar vein, HTM signifies a move toward sophisticated, knowledge-intensive manufacturing techniques that can facilitate resource-efficient production systems and circular supply chains. These results highlight how crucial it is to incorporate CE principles into business strategies, especially in sectors with significant material and energy footprints. For instance, circular business models in manufacturing may prioritize recycling, remanufacturing, and product life extension, which would lower emissions and resource consumption in line with previous studies [30].
Furthermore, FTRI and MFP have been found to have a positive association with CO2 emissions in the FE and RE models, with a 1% rise in FTRI resulting in a 0.09% and 0.10% increase in CO2 emissions, respectively. A 1% rise in MFP leads to 0.05% and 0.06% increases in CO2 emissions, respectively. These results imply that, although material consumption and technical preparedness are essential for economic growth, they may also worsen environmental stresses if not handled responsibly. These findings are supported by [62].
These findings emphasize the necessity for creative circular business models that use cutting-edge technology to reduce emissions and material footprints from a CE standpoint. For example, supply chain transparency may be improved and more effective resource utilization made possible by digital technologies like blockchain and the IoT. But incorporating these technologies into circular business models necessitates carefully weighing their effects on the environment and making sure that they adhere to CE guidelines. This finding is in line with the study by [63].
BC and EMP showed no significant association with CO2 in all models. Although EMP and BC do not significantly correlate with CO2 emissions in this study, their potential contributions to facilitating the shift to a circular economy should not be disregarded. Policymakers and companies may open new avenues for cutting emissions and attaining long-term sustainability by incorporating bio-capacity into circular business models and shifting employment toward sustainable industries. To completely comprehend and utilize the potential of these factors in the framework of the CE, future study and creative accounting techniques will be essential.
4.2. Moderation Effect Regression Findings
Followed by the base model estimates, estimates of the moderation effect of technology-driven innovation on a sustainable environment were employed. The prior investigation examined how each factor affected CO2 emissions and then environmental sustainability individually. This paper further investigated the moderation effects of these individual variables on the technology-driven innovation that may influence CO2 emissions. We used both the FE model and SGMM estimation techniques to better understand these moderating effects. The Fixed Effect models were selected considering the result of the Hausman test, whereas the SGMM was decided based on criteria from [54]. Moreover, [55] argues that the system GMM estimator offers greater reliability than the difference GMM, as it overcomes the latter’s weakness in capturing future dynamics, particularly in cases where lagged levels of the variables are weak instruments for the differenced equations.
While the FE model is initially employed to control for unobserved, time-invariant heterogeneity across countries, it does not adequately address endogeneity stemming from simultaneity or dynamic relationships between the variables [64]. Furthermore, FE estimators can be biased in dynamic settings, especially when the time dimension is short due to the correlation between the lagged dependent variable and the error term [65]. In contrast, the SGMM approach not only controls for unobserved heterogeneity but also efficiently handles potential endogeneity by combining equations in levels and first differences, thereby improving estimator precision and reducing small sample bias. The inclusion of SGMM, therefore, complements the FF model by allowing for a more robust identification of causal relationships in the presence of endogenous regressors and dynamic feedback effects.
The moderating regression analysis in Table 6 and Table 7 investigates the interaction between FTRI and MFP, REN, EE, and GDP and its impact on CO2 emissions. The analysis is separated into two tables. Table 6 focuses on the coefficients of the FE model, while Table 7 focuses on the coefficients of the SGMM model.
Table 6.
Results: moderate effects from FF model.
Table 7.
Results: moderate effects from SGMM model.
When FTRI serves as a moderating element, the connections between the four major factors and CO2 emissions show diverse patterns. First, there is a negative correlation between MFP and CO2 emissions. This shows that MFP, when combined with technology-driven innovation, could help reduce CO2 emissions. There is a negative association between CO2 emissions and the interaction between FTRI and MFP. This implies that technology-driven innovation can improve resource efficiency and lessen the negative effects of material consumption on the environment. AI, for instance, may facilitate circular business models that place a high priority on recycling and reuse, streamline supply networks, and enhance waste management [3]. This result is consistent with the CE concept of reducing material footprints through closed-loop systems and technological innovation.
Similarly, when FTRI is used to control the link between GDP and CO2 emissions, it becomes negative. This negative link could result from technology developments being used largely for economic expansion, possibly via increasing resource efficiency. This suggests that by increasing resource productivity and facilitating sustainable manufacturing methods, technology-driven innovation can separate economic expansion from environmental deterioration. AI, for example, may support data-driven decision-making, energy-efficient infrastructure, and smart manufacturing, all of which support a more circular and sustainable economy. These findings highlight technology-driven innovation’s potential to play a significant role in facilitating the CE transition. Businesses may increase resource efficiency, lower emissions, and generate profit in ways that support sustainability objectives by incorporating technology-driven innovation into circular business models.
Table 7 shows that improving technology significantly moderates the relationship between MFP, EE, REN, and GDP with CO2 emissions. Interestingly, in Models 1 and 4, the interaction variables (FTRI × MFP) and (FTR × GDP) are negative and significant, with coefficients of 0.1293 and 0.2237, respectively, indicating that upgrading technology amplifies the influence of MFP on mitigating CO2 emissions and environmental sustainability. The coefficients of the interaction terms (FTRI × EE) and (FTR × REN) exhibit a positive and significant impact on CO2 emissions, implying that the findings for EE and REN are less clear-cut. A positive connection between CO2 emissions and the moderating effect of FTRI on REN would suggest that the data does not yet completely capture or reflect technology-driven innovation’s potential to increase the adoption of renewable energy. Innovation might, however, improve renewable energy systems like energy storage and smart grids, which could eventually cut emissions even further.
A positive correlation between CO2 emissions and the interaction between FTRI and EE might depend on the energy intensity of primary energy. As it increases, CO2 emissions also increase. Therefore, reinforcing the energy intensity of renewable energy would lead to a negative correlation between EE and CO2 emissions. The “rebound effect,” in which efficiency improvements result in higher energy use, counteracting possible emission reductions, might be reflected in this. This might be addressed by using technology-driven innovation to create circular business models that emphasize absolute resource reductions as opposed to relative efficiency gains.
This study is further extended to investigate the reasoning for a positive relationship between the (FTRI × EE) and (FTR × REN) on CO2 emissions. Then, energy efficiency and renewable energy consumption were integrated (EE × REN). Surprisingly, there was a negative relationship with CO2 emissions in GMM. It shows that a continuous decrease in energy intensity and CO2 emissions will be observed in nations that embrace energy-efficient technologies and switch to renewable energy sources as global energy transition efforts pick up speed. This highlights the crucial role that technology plays in mitigating climate change.
This study further performed a suite of Arellano–Bond diagnostics to evaluate the robustness of the system GMM estimations and the validity of the chosen instruments (see Table 7). The AR (1) test for first-order serial correlation in the first-differenced residuals yields highly significant p-values (<0.001 for Models 1–3 and 5; p = 0.001 for Model 4), confirming the anticipated presence of first-order autocorrelation. By contrast, the AR (2) test returns p-values of 0.467, 0.372, 0.284, 0.192, and 0.422 for Models 1–5, respectively, indicating no second-order serial correlation and thus satisfying the moment condition assumption of no serial dependence beyond lag 1. Finally, both the Sargan (p = 0.578, 0.310, 0.702, 0.425, 0.483) and Hansen (p = 0.426, 0.256, 0.531, 0.432, 0.269) over-identification tests across all five models exceed conventional significance thresholds, providing no evidence of over-identifying restrictions and thereby affirming instrument validity.
The differences in the results of the FE and SGMM models can be attributed to the distinct nature of each approach. The FE model controls for unobserved heterogeneity across entities and assumes the strict exogeneity of the regressors [64]. It provides a baseline estimate but does not account for potential endogeneity or the dynamic nature of the relationship among variables. In contrast, the SGMM estimator, as developed by [54,57], is designed to address endogeneity and allows for dynamic panel modelling by using internal instruments (lagged levels and differences). It captures feedback effects and provides more efficient and consistent estimates, especially when explanatory variables are potentially endogenous. Figure 2 shows the main findings and the suggested policy implications.
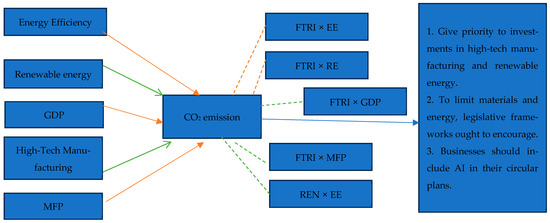
Figure 2.
Main findings and the suggested policy implications. Orange straight lines indicate that an increase in these (EE, GDP, MFP) variables increases the CO2 (do not improve the environment); green straight lines show that an increase in these (RE, HTM) variables decreases the CO2 (improve the environment); orange dashed lines show the moderating effects, where an increase in these (FTRI × EE, FTRI × RE) variables increases the CO2 (do not improve the environment); and green dashed lines show the moderating effects, where an increase in these (FTRI × GDP, FTRI × MFP, and REI × EE) variables increases the CO2 (improve the environment).
In summary, Hypotheses H1 and H3 are not accepted in this study. Meantime, Hypotheses H2 and H4 are accepted. This study confirms that while economic growth, resource use, and energy efficiency do not improve the environment through circular economy adoption and innovation, high-tech manufacturing and renewable energy consumption improve the environment through circular economy adoption. Moreover, integrating innovation with cleaner energy and energy efficiency will lead to positive effects on improved environmental quality. The base model shows that renewable energy and high-tech manufacturing are in favour of environmental sustainability. Meanwhile, energy efficiency and GDP are not favoured. The moderation effects show that high-tech manufacturing and GDP are in favour of environmental sustainability, but renewable energy and energy efficiency are not. The reduction in energy intensity that results from integrating technology into energy systems is expected to have a negative correlation with CO2 emissions. This is because new policies, digitization, cleaner energy sources, and increased energy efficiency allow economies to generate more with less energy, which lowers carbon emissions and the reliance on fossil fuels. Then, this study extended its investigation by integrating energy efficiency and renewable energy. Surprisingly, there was a negative relationship that was in favour of a sustainable environment (Refer to Table 8).
Table 8.
Structure of the developed hypothesis and relationships.
5. Conclusions
New digital technologies, such as AI and IOT, have the potential to contribute significantly to sustainability transitions by creating economic value through streamlined resource flows, enhancing waste management processes, and enabling more economical energy consumption. Therefore, this study aims to investigate the influence of technology-driven innovation on environmental sustainability. This study employed two base and moderation models to investigate.
When considering environmental sustainability, specific consideration was given to to renewable energy, high-tech manufacturing, material footprint, and economic growth. Using static (FE/RE) and dynamic (DGMM/SGMM) panel models, the analysis tested four hypotheses regarding the direct and moderating effects of innovation.
The results disclose that while economic growth, material footprint, and energy efficiency remain emission-intensive, renewable energy and high-tech manufacturing contribute positively to environmental sustainability. Moreover, the moderating investigation demonstrates that technology boosts the environmental advantages of renewable energy and energy efficiency, but its integration with growth and resource use does not produce the same effect. In summary, Hypotheses H2 and H4 were supported, while H1 and H3 were rejected.
Overall, this research highlights that technological improvement alone is not satisfactory to attain sustainability achievements without being complemented by essential policy changes that safeguard innovations and are applied in ways that decouple growth from emissions.
6. Policy Implications
This study adds to the current discussion on technology-driven innovation’s involvement in circular business models and decarbonization initiatives by examining a worldwide dataset that includes economic aspects, environmental sustainability indices, and technology-driven innovation adoption. Policymakers, companies, and scholars looking to create plans that improve sustainability with AI-powered solutions will find the findings useful.
This study’s findings have several significant policy ramifications for furthering the CE goal. To promote circular innovation and reduce emissions, authorities must give priority to investments in high-tech manufacturing and renewable energy. Especially in sectors that utilize a lot of materials and energy, legislative frameworks ought to encourage the development of circular business models. Regulations that encourage the creation of accounting guidelines and procedures specific to circular enterprises are required.
The inverse relationship between FTRI, MFP, and CO2 emissions shows how technology-driven innovation may support circular business models that reduce waste and material consumption. AI, for instance, may help with recycling, remanufacturing, and product life extension by forecasting demand and streamlining operations. To improve sustainability and competitiveness, businesses should investigate how to include technology-driven innovation in their circular plans.
Policymakers should prioritize investments in AI technologies like digital twins, the Internet of Things, and blockchain, which support the transition to a CE. These technologies can enhance material usage, improve resource tracking, and increase transparency in the supply chain. Legislative frameworks should also encourage the adoption of AI-driven circular methods, particularly in energy- and material-intensive sectors.
New accounting and measurement frameworks are needed to fully capture the value generated by these advances as AI is incorporated into circular business models. For instance, metrics that measure the economic and environmental advantages of AI-driven resource efficiency may help improve reporting and decision-making. To create standards that represent the role of AI in sustainability and are consistent with CE principles, managers and accounting experts must work together.
To maximize innovation in the circular economy, various strategies can be implemented across different sectors. The application of AI in waste reduction enhances resource efficiency by anticipating material demand and waste production, improving resource allocation and recycling processes, while AI-driven smart sorting systems aid in waste reduction. With smart manufacturing technologies such as digital twins and IoT integration, material usage is optimized and industrial waste is minimized, while energy consumption in smart manufacturing is reduced through AI-powered predictive maintenance.
In sustainable supply chains, blockchain technology, when combined with artificial intelligence to monitor material flows and product life cycles, enhances transparency and reduces inefficiencies. Furthermore, AI-driven smart grids can improve the efficiency of renewable resources by dynamically adjusting energy distribution in response to demand. Additionally, technology-driven innovation supports circular business model innovation, facilitating the transition for businesses from linear to circular models through the implementation of product-as-a-service strategies. AI-driven eco-design solutions also enhance product recyclability and durability, ultimately promoting a more sustainable business model. Moreover, these eco-design solutions improve product durability and recyclability, further supporting a more sustainable economic model.
Despite its potential, several hazards and obstacles must be considered when implementing AI in the CE. AI-driven sustainability initiatives are hindered by data and infrastructure issues, as many CE-related industries lack organized, high-quality data, and the adoption of AI is constrained by financial and technological limitations, particularly in developing nations. High energy and computational costs also present a barrier, as AI models require significant processing power, which may increase carbon emissions if powered by fossil fuels. Concerns regarding ethics and regulations also arise, as decision-making in technology-driven innovation must comply with sustainability laws to avoid unforeseen negative consequences. Furthermore, there is a risk of monopolization, where large companies dominate CE data and solutions, limiting accessibility.
Additionally, there are issues with workforce migration and socioeconomic ramifications because AI-driven automation in circular processes may replace traditional jobs, requiring reskilling programmes and well balanced policymaking to guarantee social equality. Future studies should concentrate on sector-specific technology-driven innovation applications in CE, provide trustworthy metrics to evaluate technology-driven innovation’s sustainability impact, and investigate legislative frameworks that properly regulate technology-driven innovation’s role in reducing these dangers. Businesses and policymakers can maximize technology-driven innovation while reducing its unexpected consequences in the shift to a more sustainable economy by removing these obstacles.
7. Directions for Future Studies
This study is also subject to a few limitations. While there are positive moderating effects of technology-driven innovation on EE and RE, the current study was unable to capture the short- and long-term effects. Therefore, we propose that future studies focus on using the ARDL approach to capture these effects. Moreover, countries can be categorized based on income level or region, which may enhance the discussion on the diverse impacts. Exploring the influence of unconsidered variables such as FDI and government initiatives can provide a more comprehensive understanding of the relationship between CO2 emissions and technology-driven innovation adaptation. Future studies should examine the factors that encourage and hinder the adoption of circular business models, particularly across various sectors and geographical areas. Studies might also investigate how scalable circular business models are and whether they possess the capacity to influence systemic change. Research on legislative frameworks and circular supply chain management may yield important insights for accelerating the transition to a circular economy.
We recognize that various technology-driven innovations, including machine learning, blockchain, IoT, and digital twins, may have unique and sometimes conflicting effects on environmental sustainability. This study depicts technology-driven innovation adoption using the Frontier Technology Readiness Index (FTRI) as a composite measure. FTRI offers a globally comparable and standardized index that allows us to assess overall technical preparedness and its broad correlation with CO2 emissions and sustainability outcomes in different nations.
Nevertheless, we acknowledge that combining different technologies into a single index could obscure the subtle impacts of certain technologies. Blockchain, for instance, might enhance supply chain transparency, while machine learning could improve energy efficiency by utilizing predictive analytics. To enhance accuracy, future studies should dissect FTRI into its components or employ a more detailed dataset that distinguishes between various kinds of AI technologies and their industry-specific applications. In addition to aiding in the customization of more effective policy recommendations, this approach would provide a deeper understanding of which technologies promote or hinder sustainability.
Finally, future research could extend this analysis by conducting subgroup estimations based on geographic location to maximize the contribution of innovation to the circular economy and climate mitigation goals. Such stratified analysis would allow for a deeper understanding of regional dynamics and enhance the policy relevance of the findings by tailoring recommendations to specific country contexts.
Author Contributions
Conceptualization, M.S. and M.E.; methodology, M.S. and M.E.; validation, M.S., M.E. and A.C.M.K.; formal analysis, M.S., M.E., H.Z.A., A.C.M.K. and N.H.; investigation, M.S., M.E., H.Z.A., A.C.M.K. and N.H.; resources, M.S.; data curation, M.S. and M.E., writing—original draft preparation, M.S., M.E., H.Z.A., A.C.M.K. and N.H.; writing—review and editing, M.S., M.E., A.C.M.K. and N.H.; visualization and supervision, M.S. and M.E.; project administration, M.S. and M.E.; funding acquisition, M.E. All authors have read and agreed to the published version of the manuscript.
Funding
This research project was funded by the Princess Nourah bint Abdulrahman University Researchers Supporting Project Number (PNURSP2025R866), Princess Nourah bint Abdulrahman University, Riyadh, Saudi Arabia.
Data Availability Statement
The data was collected from various open databases: https://databank.worldbank.org/source/world-development-indicators (accessed on 2 January 2025), https://unctadstat.unctad.org/datacentre/dataviewer/US.FTRI, (accessed on 5 January 2025), and https://www.unep.org/publications-data. (accessed on 10 January 2025).
Acknowledgments
The authors extend their appreciation to Princess Nourah bint Abdulrahman University Researchers Supporting Project Number (PNURSP2025R866), Princess Nourah bint Abdulrahman University, Riyadh, Saudi Arabia.
Conflicts of Interest
The authors declare no conflicts of interest.
References
- McCarthy, J.; Minsky, M.L.; Rochester, N.; Shannon, C.E. A proposal for the dartmouth summer research project on artificial intelligence, august 31, 1955. AI Mag. 2006, 27, 12. [Google Scholar]
- Awan, U.; Kanwal, N.; Alawi, S.; Huiskonen, J.; Dahanayake, A. Artificial intelligence for supply chain success in the era of data analytics. In The Fourth Industrial Revolution: Implementation of Artificial Intelligence for Growing Business Success; Springer: Cham, Switzerland, 2021; pp. 3–21. [Google Scholar]
- Hernández-Romero, I.M.; Niño-Caballero, J.C.; González, L.T.; Pérez-Rodríguez, M.; Flores-Tlacuahuac, A.; Montesinos-Castellanos, A. Waste management optimization with NLP modeling and waste-to-energy in a circular economy. Sci. Rep. 2024, 14, 19859. [Google Scholar] [CrossRef]
- Melinda, V.; Williams, T.; Anderson, J.; Davies, J.G.; Davis, C. Enhancing waste-to-energy conversion efficiency and sustainability through advanced artificial intelligence integration. Int. Trans. Educ. Technol. (ITEE) 2024, 2, 183–192. [Google Scholar] [CrossRef]
- Nañez Alonso, S.L.; Reier Forradellas, R.F.; Pi Morell, O.; Jorge-Vazquez, J. Digitalization, circular economy and environmental sustainability: The application of Artificial Intelligence in the efficient self-management of waste. Sustainability 2021, 13, 2092. [Google Scholar] [CrossRef]
- Wilts, H.; Garcia, B.R.; Garlito, R.G.; Gómez, L.S.; Prieto, E.G. Artificial intelligence in the sorting of municipal waste as an enabler of the circular economy. Resources 2021, 10, 28. [Google Scholar] [CrossRef]
- Schlüter, M.; Lickert, H.; Schweitzer, K.; Bilge, P.; Briese, C.; Dietrich, F.; Krüger, J. AI-enhanced identification, inspection and sorting for reverse logistics in remanufacturing. Procedia CIRP 2021, 98, 300–305. [Google Scholar] [CrossRef]
- Lechner, G.; Reimann, M. Integrated decision-making in reverse logistics: An optimisation of interacting acquisition, grading and disposition processes. Int. J. Prod. Res. 2020, 58, 5786–5805. [Google Scholar] [CrossRef]
- Khayyam, H.; Naebe, M.; Milani, A.S.; Fakhrhoseini, S.M.; Date, A.; Shabani, B.; Atkiss, S.; Ramakrishna, S.; Fox, B.; Jazar, R.N. Improving energy efficiency of carbon fiber manufacturing through waste heat recovery: A circular economy approach with machine learning. Energy 2021, 225, 120113. [Google Scholar] [CrossRef]
- Trusilo, D.; Danks, D. Commercial AI, Conflict, and Moral Responsibility: A theoretical analysis and practical approach to the moral responsibilities associated with dual-use AI technology. arXiv 2024, arXiv:2402.01762. [Google Scholar] [CrossRef]
- Ligozat, A.-L.; Lefevre, J.; Bugeau, A.; Combaz, J. Unraveling the hidden environmental impacts of AI solutions for environment life cycle assessment of AI solutions. Sustainability 2022, 14, 5172. [Google Scholar] [CrossRef]
- Van Wynsberghe, A. Sustainable AI: AI for sustainability and the sustainability of AI. AI Ethics 2021, 1, 213–218. [Google Scholar] [CrossRef]
- Bag, S.; Yadav, G.; Dhamija, P.; Kataria, K.K. Key resources for industry 4.0 adoption and its effect on sustainable production and circular economy: An empirical study. J. Clean. Prod. 2021, 281, 125233. [Google Scholar] [CrossRef]
- Ghisellini, P.; Cialani, C.; Ulgiati, S. A review on circular economy: The expected transition to a balanced interplay of environmental and economic systems. J. Clean. Prod. 2016, 114, 11–32. [Google Scholar] [CrossRef]
- Yang, Y.; Guan, J.; Nwaogu, J.M.; Chan, A.P.; Chi, H.-l.; Luk, C.W. Attaining higher levels of circularity in construction: Scientometric review and cross-industry exploration. J. Clean. Prod. 2022, 375, 133934. [Google Scholar] [CrossRef]
- Lin, K.-Y. User experience-based product design for smart production to empower industry 4.0 in the glass recycling circular economy. Comput. Ind. Eng. 2018, 125, 729–738. [Google Scholar] [CrossRef]
- de Mattos Nascimento, D.L.; Garcia-Buendia, N.; Moyano-Fuentes, J.; Maqueira, J.M. Unlocking the potential of industry 4.0 for supply chain flexibility and agility: A systematic literature review. Eng. Manag. J. 2024, 37, 433–451. [Google Scholar] [CrossRef]
- Caiado, R.G.G.; Scavarda, L.F.; Vidal, G.; de Mattos Nascimento, D.L.; Garza-Reyes, J.A. A taxonomy of critical factors towards sustainable operations and supply chain management 4.0 in developing countries. Oper. Manag. Res. 2023, 18, 744–767. [Google Scholar] [CrossRef]
- Roberts, H.; Zhang, J.; Bariach, B.; Cowls, J.; Gilburt, B.; Juneja, P.; Tsamados, A.; Ziosi, M.; Taddeo, M.; Floridi, L. Artificial intelligence in support of the circular economy: Ethical considerations and a path forward. AI Soc. 2024, 39, 1451–1464. [Google Scholar] [CrossRef]
- Burmaoglu, S.; Ozdemir Gungor, D.; Kirbac, A.; Saritas, O. Future research avenues at the nexus of circular economy and digitalization. Int. J. Product. Perform. Manag. 2023, 72, 2247–2269. [Google Scholar] [CrossRef]
- Alamelu, R.; Sudha, M.; Purushothaman, R. Adoption of Circular Economy Strategies With Artificial Intelligence: Technology to Hasten the Shift. In Impacts of Technology on Operations Management: Adoption, Adaptation, and Optimization; IGI Global: Hershey, PA, USA, 2025; pp. 179–204. [Google Scholar]
- Geissdoerfer, M.; Pieroni, M.P.; Pigosso, D.C.; Soufani, K. Circular business models: A review. J. Clean. Prod. 2020, 277, 123741. [Google Scholar] [CrossRef]
- Scarpellini, S.; Marín-Vinuesa, L.M.; Aranda-Usón, A.; Portillo-Tarragona, P. Dynamic capabilities and environmental accounting for the circular economy in businesses. Sustain. Account. Manag. Policy J. 2020, 11, 1129–1158. [Google Scholar] [CrossRef]
- Kaza, S.; Yao, L.; Bhada-Tata, P.; Van Woerden, F. What a Waste 2.0: A Global Snapshot of Solid Waste Management to 2050; World Bank Publications: Washington, DC, USA, 2018. [Google Scholar]
- Oldfield, T.L.; White, E.; Holden, N.M. The implications of stakeholder perspective for LCA of wasted food and green waste. J. Clean. Prod. 2018, 170, 1554–1564. [Google Scholar] [CrossRef]
- Persis, D.J.; Venkatesh, V.; Sreedharan, V.R.; Shi, Y.; Sankaranarayanan, B. Modelling and analysing the impact of Circular Economy; Internet of Things and ethical business practices in the VUCA world: Evidence from the food processing industry. J. Clean. Prod. 2021, 301, 126871. [Google Scholar] [CrossRef]
- Çetin, S.; De Wolf, C.; Bocken, N. Circular digital built environment: An emerging framework. Sustainability 2021, 13, 6348. [Google Scholar] [CrossRef]
- Ramchandani, M.; Rughwani, H.; Inavolu, P.; Singh, A.P.; Tevethia, H.V.; Jagtap, N.; Sekaran, A.; Kanakagiri, H.; Darishetty, S.; Reddy, D.N. Diagnostic yield and therapeutic impact of novel motorized spiral enteroscopy in small-bowel disorders: A single-center, real-world experience from a tertiary care hospital (with video). Gastrointest. Endosc. 2021, 93, 616–626. [Google Scholar] [CrossRef]
- Rakhshan, K.; Morel, J.-C.; Daneshkhah, A. A probabilistic predictive model for assessing the economic reusability of load-bearing building components: Developing a Circular Economy framework. Sustain. Prod. Consum. 2021, 27, 630–642. [Google Scholar] [CrossRef]
- Özsoy, T. The role of artificial intelligence in facilitating the transition to a circular economy. Nişantaşı Üniversitesi Sos. Bilim. Derg. 2023, 11, 369–389. [Google Scholar] [CrossRef]
- Dhanya, D.; Kumar, S.S.; Thilagavathy, A.; Prasad, D.; Boopathi, S. Data Analytics and Artificial Intelligence in the Circular Economy: Case Studies. In Intelligent Engineering Applications and Applied Sciences for Sustainability; IGI Global: Hershey, PA, USA, 2023; pp. 40–58. [Google Scholar]
- Gue, I.H.V.; Tan, R.R.; Ubando, A.T. Causal network maps of urban circular economies. Clean Technol. Environ. Policy 2022, 24, 261–272. [Google Scholar] [CrossRef]
- Farghali, M.; Osman, A.I. Revolutionizing waste management: Unleashing the power of artificial intelligence and machine learning. In Advances in Energy from Waste; Elsevier: Amsterdam, The Netherlands, 2024; pp. 225–279. [Google Scholar]
- Singh, J.P. Artificial Intelligence in Circular Economies: A Pathway to Sustainable Resource Management. Int. J. Sci. Res. (IJSR) 2023, 12, 1128–1130. [Google Scholar] [CrossRef]
- Nwokediegwu, Z.Q.S.; Ugwuanyi, E.D.; Dada, M.A.; Majemite, M.T.; Obaigbena, A. AI-driven waste management systems: A comparative review of innovations in the USA and Africa. Eng. Sci. Technol. J. 2024, 5, 507–516. [Google Scholar] [CrossRef]
- Poonkuzhali, R.; Karamath, M.; Sugumaran, P.; Tharun, M.; Arun, S. Recycling as a Service: IoT Enabled Smart Waste Management System with Machine Learning. In Proceedings of the 2024 International Conference on Knowledge Engineering and Communication Systems (ICKECS), Chikkaballapur, India, 18–19 April 2024; pp. 1–6. [Google Scholar]
- Bodislav, D.A.; Moraru, L.C.; Georgescu, R.I.; Grigore, G.E.; Vlăduț, O.; Staicu, G.I.; Chenic, A.Ș. Recyclable Consumption and Its Implications for Sustainable Development in the EU. Sustainability 2025, 17, 3110. [Google Scholar] [CrossRef]
- Scheel, C.; Aguiñaga, E. A Systems View of Circular Economy. Sustainability 2025, 17, 1268. [Google Scholar] [CrossRef]
- Erdoğdu, A.; Dayi, F.; Yanik, A.; Yildiz, F.; Ganji, F. Innovative solutions for combating climate change: Advancing sustainable energy and consumption practices for a greener future. Sustainability 2025, 17, 2697. [Google Scholar] [CrossRef]
- Činčikaitė, R. Assessment of sustainable waste management: A case study in Lithuania. Sustainability 2025, 17, 120. [Google Scholar] [CrossRef]
- Lin, J.; Zeng, Y.; Wu, S.; Luo, X.R. How does artificial intelligence affect the environmental performance of organizations? The role of green innovation and green culture. Inf. Manag. 2024, 61, 103924. [Google Scholar] [CrossRef]
- Raman, R.; Lathabai, H.H.; Mandal, S.; Das, P.; Kaur, T.; Nedungadi, P. ChatGPT: Literate or intelligent about UN sustainable development goals? PLoS ONE 2024, 19, e0297521. [Google Scholar] [CrossRef]
- Wu, C.-J.; Raghavendra, R.; Gupta, U.; Acun, B.; Ardalani, N.; Maeng, K.; Chang, G.; Aga, F.; Huang, J.; Bai, C. Sustainable ai: Environmental implications, challenges and opportunities. Proc. Mach. Learn. Syst. 2022, 4, 795–813. [Google Scholar]
- Strubell, E.; Ganesh, A.; McCallum, A. Energy and policy considerations for modern deep learning research. In Proceedings of the AAAI Conference on Artificial Intelligence, New York, NY, USA, 7–12 February 2020; pp. 13693–13696. [Google Scholar]
- Mehonic, A.; Kenyon, A.J. Brain-inspired computing needs a master plan. Nature 2022, 604, 255–260. [Google Scholar] [CrossRef]
- Malmodin, J.; Lövehagen, N.; Bergmark, P.; Lundén, D. ICT sector electricity consumption and greenhouse gas emissions–2020 outcome. Telecommun. Policy 2024, 48, 102701. [Google Scholar] [CrossRef]
- Konya, A.; Nematzadeh, P. Recent applications of AI to environmental disciplines: A review. Sci. Total Environ. 2024, 906, 167705. [Google Scholar] [CrossRef]
- Patterson, D.; Gonzalez, J.; Le, Q.; Liang, C.; Munguia, L.-M.; Rothchild, D.; So, D.; Texier, M.; Dean, J. Carbon emissions and large neural network training. arXiv 2021, arXiv:2104.10350. [Google Scholar] [CrossRef]
- Coulson-Thomas, C. Building purpose-driven business organisations and their boards. Eff. Exec. 2024, 27, 13–38. [Google Scholar]
- Meng, Y.; Noman, H. Predicting CO2 Emission Footprint Using AI through Machine Learning. Atmosphere 2022, 13, 1871. [Google Scholar] [CrossRef]
- Li, J.; He, J.; Xu, Z. Sustainability and Material Flow Analysis of Wind Turbine Blade Recycling in China. Sustainability 2025, 17, 4307. [Google Scholar] [CrossRef]
- Javed, M.H.; Ahmad, A.; Rehan, M.; Farooq, M.; Farhan, M.; Raza, M.A.; Nizami, A.-S. Advancing Circular Economy Through Optimized Construction and Demolition Waste Management Under Life Cycle Approach. Sustainability 2025, 17, 4882. [Google Scholar] [CrossRef]
- Bajrami, R.; Tafa, S.; Gashi, A.; Hashani, M. Analysing the impact of money supply on economic growth: A panel regression approach for Western Balkan countries (2000–2023). Reg. Sci. Policy Pract. 2025, 17, 100159. [Google Scholar] [CrossRef]
- Arellano, M.; Bond, S. Some tests of specification for panel data: Monte Carlo evidence and an application to employment equations. Rev. Econ. Stud. 1991, 58, 277–297. [Google Scholar] [CrossRef]
- Blundell, R.; Bond, S. Initial conditions and moment restrictions in dynamic panel data models. J. Econom. 1998, 87, 115–143. [Google Scholar] [CrossRef]
- Roodman, D. A note on the theme of too many instruments. Oxf. Bull. Econ. Stat. 2009, 71, 135–158. [Google Scholar] [CrossRef]
- Arellano, M.; Bover, O. Another look at the instrumental variable estimation of error-components models. J. Econom. 1995, 68, 29–51. [Google Scholar] [CrossRef]
- Hansen, L.P. Large sample properties of generalized method of moments estimators. Econom. J. Econom. Soc. 1982, 50, 1029–1054. [Google Scholar] [CrossRef]
- Sargan, J.D. The estimation of economic relationships using instrumental variables. Econom. J. Econom. Soc. 1958, 26, 393–415. [Google Scholar] [CrossRef]
- Banik, B.; Akter, T.; Roy, C.K.; Hossain, R. Trade openness and manufacturing growth of asian economies: Investigating linear and non-linear effect. J. Econ. Sustain. 2025, 7, 76–94. [Google Scholar] [CrossRef]
- Elhaj, M. Do Energy Efficiency and Technology Boost Sustainable Environment: Evidence from GCC Countries. J. Ecohumanism 2024, 3, 2545–2565. [Google Scholar] [CrossRef]
- Sarabdeen, M.; Elhaj, M.; Alofaysan, H. Do Digital Adaptation, Energy Transition, Export Diversification, and Income Inequality Accelerate towards Load Capacity Factors across the Globe? Energies 2024, 17, 3981. [Google Scholar] [CrossRef]
- Sarabdeen, M.; Elhaj, M.; Alofaysan, H. Exploring the influence of digital transformation on clean energy transition, climate change, and economic growth among selected oil-export countries through the panel ARDL approach. Energies 2024, 17, 298. [Google Scholar] [CrossRef]
- Baltagi, B.H. Econometric Analysis of Panel Data; John Wiley: Hoboken, NJ, USA, 2008. [Google Scholar]
- Nickell, S. Biases in dynamic models with fixed effects. Econom. J. Econom. Soc. 1981, 49, 1417–1426. [Google Scholar] [CrossRef]
Disclaimer/Publisher’s Note: The statements, opinions and data contained in all publications are solely those of the individual author(s) and contributor(s) and not of MDPI and/or the editor(s). MDPI and/or the editor(s) disclaim responsibility for any injury to people or property resulting from any ideas, methods, instructions or products referred to in the content. |
© 2025 by the authors. Licensee MDPI, Basel, Switzerland. This article is an open access article distributed under the terms and conditions of the Creative Commons Attribution (CC BY) license (https://creativecommons.org/licenses/by/4.0/).