Abstract
Multistage pumps serve as the core power source for fluid transportation, and runaway conditions of multistage pumps as turbines (PATs) may lead to severe consequences. This study investigated the pressure pulsation, flow structure, and impeller transient characteristics of an 11-stage petrochemical pump under runaway conditions. Full-flow numerical simulations at varying speeds analyzed head, efficiency, and entropy production via the entropy diagnostic method. The results showed that total entropy production generally increases with rotational speed, while efficiency first rises then declines, peaking at 78.48% at 4000 r/min. Maximum/minimum pressure pulsation peaks consistently occur at identical stages, with dominant peak amplitudes overall increasing with speed. Pressure coefficient amplitudes decrease with frequency growth, with larger pulsation magnitudes observed at monitoring points closer to impeller outlets. Dominant pressure pulsation peaks exhibit upward trends with increasing rotational speed. Both the blade-passing frequency and its harmonics were detected at 5100 r/min, including the impeller inlet/outlet side and the region near the cutwater within the guide vanes. This study identified the critical threshold of 4800 r/min and pinpointed fatigue risk zones, providing a theoretical foundation for designing and manufacturing high-performing multistage PAT systems under runaway conditions.
1. Introduction
“Runaway conditions” refers to an operational state where a PAT (pump as turbine) generating unit experiences sudden load rejection due to system failures, leading to zero generator output power. When control valves or pressure regulation mechanisms fail to respond promptly, the rotational speed escalates rapidly. The runaway speed is defined as the stabilized maximum rotational speed achieved when the input fluid energy balances the mechanical friction losses induced by speed acceleration. As core power sources for fluid transportation, multistage PAT systems can lead to catastrophic outcomes under runaway scenarios.
Currently, researchers worldwide have conducted extensive theoretical analyses, experimental investigations, and numerical simulations to explore transient flow characteristics in hydraulic machinery during processes.
Wang et al. [1] analyzed the energy loss distribution of each flow component of the guide vane centrifugal PAT under various flow conditions, and also investigated the transient fluctuation patterns of hydraulic loss within the passage components. Kan et al. [2] conducted a quantitative evaluation of energy loss characteristics in PATs based on entropy production theory, revealing strong correlations between velocity gradients, flow vorticity, turbulent intensity, and energy dissipation mechanisms. Song et al. [3] studied the hydraulic loss and the turbulent dissipation in boundary layers induced by vortex motion, revealing the influence of vortices on the energy loss. They established a mathematical model between entropy production induced by the vortex and vortex strength. An et al. [4] employed a methodology of the entropy production theory in hydro turbine flows to analyze the hydraulic loss characteristics quantitatively. Li et al. [5] proposed a novel energy conversion and loss analysis methodology for multistage centrifugal pumps operating as PATs to investigate internal energy transformation mechanisms within impellers and inter-stage energy transfer characteristics. Ghorani et al. [6] and Lin et al. [7] analyzed energy dissipation and its mechanisms in PAT systems under varying flow velocities using the entropy production method. The results demonstrated that rotor–stator interaction induces substantial energy loss near the volute tongue region, while swirling flows, flow reversals, and vortex shedding constitute the primary causes of hydraulic losses within the discharge passages. Feng et al. [8] characterized the energy dissipation distribution within the flow field of flow passage components during centrifugal pump runaway conditions. Ge et al. [9] postulated that large-amplitude flow fluctuations prior to runaway conditions and periodic pressure pulsations during runaway operation may induce cavitation inception and compromise system stability. Xu et al. [10] investigated operational discrepancies in bidirectional pumping systems during forward/reverse runaway transitions. Through Volume of Fluid (VOF) analysis of upstream/downstream air–water two-phase distributions and torque-balance-derived impeller acceleration modeling, they established a novel framework for characterizing transient fluid–structure interactions integrating with entropy production.
The operational stability of centrifugal pumps used as PATs is inherently linked to pressure fluctuations and unstable flow regimes. Si et al. [11] developed a rotational speed prediction method during pump shutdown processes based on impeller rotational equilibrium equations, systematically analyzing internal flow characteristics of multistage pumps during unexpected trip events. Concurrently, Ouyang [12] employed a deterministic flow decomposition methodology to identify the main causes of flow instabilities within multistage turbine geometries across operational conditions. Cui et al. [13] conducted FLUENT-based investigations on pressure pulsation characteristics in self-priming pump volutes and impeller passages under low-flow conditions. The result showed that monitoring points near the impeller outlet had larger pressure pulsation amplitudes as the rotational speed increased. Yu et al. [14] conducted numerical simulations on unsteady flow-induced excitation characteristics of a centrifugal pump under low-flow conditions using dynamic mesh and sliding mesh techniques, the result indicated that periodic flow blockage in the guide vane region induces low-frequency pressure pulsations within the flow field.
Zhou et al. [15] investigated the energy dissipation mechanisms of recirculating vortex structures at flow passage inlets and the impact on runaway instability in PATs, proposing that geometric optimization of runner blade profiles could significantly attenuate runaway oscillation amplitudes. Furthermore, Tchada et al. [16] analyzed the influence of impeller leading-edge chamfering in PAT. Zhao et al. [17] achieved peak efficiency with minimized energy losses in axial-flow pumps operating as hydraulic turbines with the guide vane inlet angle adjusted to 10°. Wei et al. [18] investigated the unsteady flow field evolution mechanisms in ultra-low specific speed in PATs, unveiling flow field dynamic characteristics in low-power hydraulic PAT systems. Binama et al. [19] explored the formation mechanisms of PAT flow structures, revealing that both velocity and pressure fields undergo significant distortion as flow velocity decreases. Their findings further indicated that increased impeller rotational speeds suppress pressure pulsation amplitudes under high-flow conditions. Trivedi et al. [20] conducted research on unsteady pressure pulsations within the vaneless space, runner, and draft tube. The results demonstrated substantial pressure pulsations during transient operations, with maximum amplitudes observed specifically under runaway conditions. In parallel, Zhang et al. [21] employed numerical simulation methods to investigate the flow characteristics and pressure pulsation signals within the impeller region of a centrifugal pump under high-flow-rate conditions. It was discovered that the pressure pulsation at the impeller outlet was dominated by the blade-passing frequency (BPF), while governed by the rotor–stator interaction between the impeller and the volute tongue on the blades under cavitation conditions. Additionally, vortex shedding phenomena within the flow passages also significantly influence pressure pulsation. Shi [22] analyzed pressure pulsation characteristics in axial-flow pump-turbines, identifying rotor–stator interaction between impellers and guide vanes as the dominant excitation source of pressure fluctuations.
Li et al. [23] investigated pressure pulsation amplitudes and frequency spectra across flow domains of PATs under varying guide vane openings during runaway conditions, with particular emphasis on vortex rope patterns in draft tubes and their hydrodynamic impacts. Concurrently, Miao et al. [24] explored transient flow characteristics of axial-flow PATs during runaway transitions, demonstrating critical correlations between impeller power output, internal flow conditions, and geometric configurations under differential flow velocities [25]. Wang et al. [26] conducted simulations of tubular turbine runaway processes, revealing flow field anomalies and runner load characteristics under fault-induced conditions. Zhang et al. [27] performed numerical investigations on pipeline pumps operating as PATs during runaway operations. Their results demonstrated elevated velocity curl magnitudes at blade inlet regions compared to trailing edges, with vortex cores predominantly localized near pressure sides and trailing edge zones.
Recent advancements in computational fluid dynamics (CFD) have significantly enhanced the analysis of complex flow phenomena in hydraulic machinery. For instance, soft abrasive flow finishing (SAF) methods are widely applied in multiphase fluid dynamics modeling and material surface processing/removal mechanisms. Govender [28] leveraged CFD simulations to analyze flow behavior under various conditions, including laminar and turbulent states. Meanwhile, studies on multiphase free-settling vortex flows integrate fluid-induced vibration models with multi-source sensor fusion techniques, revealing the coupling mechanisms between vortex shedding and structural resonance. Based on a validated numerical model employing the Navier–Stokes equations and the k-epsilon turbulence model, the study analyzes hydrodynamic processes and flow characteristics within aircraft piping systems, providing a theoretical foundation for research on aircraft hydraulic processes [29]. These methodologies align with the entropy-based loss quantification approach adopted in this study, demonstrating CFD’s pivotal role in transient flow characterization.
Current research on runaway processes in PATs remains limited, with a particular scarcity of studies addressing multistage PAT systems. To address this knowledge gap, this study focuses on a multistage PAT configuration, utilizing CREO software for 3D parametric modeling, investigating transient flow characteristics within the flow domain under runaway conditions. The findings provide theoretical and practical references for enhancing PAT unit design and ensuring operational safety.
2. Methodology
2.1. Research Subject
A PAT is capable of being a working machine and a prime mover, playing a pivotal role in recovering energy from high-pressure media in petrochemical processes. As illustrated in Figure 1, this study focuses on an 11-stage PAT system implemented in petrochemical applications. The system comprises 11 impellers, 11 double-tongue diffusers, a volute, and an outlet conduit. Designed with a back-to-back BB3-type configuration, this architecture effectively balances axial thrust forces. Parametric 3D modeling of the inlet volute, impellers, diffusers, and outlet conduit under pump-mode conditions was conducted using CREO software. Design parameters for turbine operational modes are detailed in Table 1.
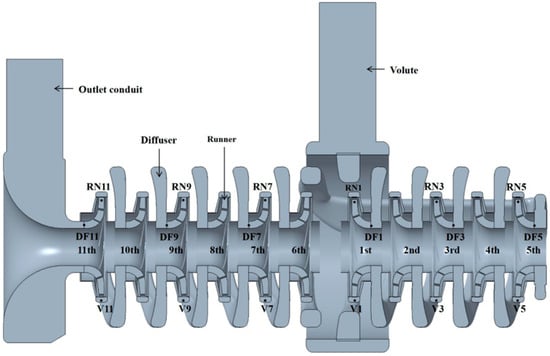
Figure 1.
The 11-stage PAT hydraulic model and measuring point distribution.

Table 1.
Main design parameters of the 11-stage PAT.
To monitor pressure pulsations, pressure monitoring points are set at the diffuser inlet near the tongues of the first, third, fifth, seventh, ninth, and eleventh stages, as well as at the turbine and diffuser outlets. These three different locations measure the pressure pulsations at the turbine inlet, the turbine flow channel, and the turbine outlet, observing the evolution patterns of the pressure pulsations.
Numerical simulations conducted via ANSYS CFX software reveal the following characteristics under runaway conditions: Inlet pressure is 15 MPa, Outlet pressure is 2.5 MPa, Frictional torque loss 5 kW. The multistage pump operating as a turbine exhibits rapid rotational speed escalation following external load rejection, accompanied by progressive flow rate reduction during runaway conditions, As shown in Table 2, the efficiency reaches its peak value at 4000 r/min, beyond which it demonstrates a sharp decline as rotational speed further increases.

Table 2.
Numerical simulation results of a multistage pump operating as a PAT at variable rotational speeds.
2.2. Research Method
Hydraulic losses in multistage PATs can be quantified through entropy production analysis. This methodology enables clear visualization of flow loss distribution patterns and precise quantification of hydraulic dissipation. The entropy production total rate (EPTR) comprises the local entropy production wall rate (LEPWR) and the local entropy production total rate (LEPTR), while the LEPTR is further decomposed into the local entropy production direct rate (LEPDR) and the turbulent entropy production rate (TEPR). Given the minimal contribution of the direct entropy production rate, this study focuses exclusively on the turbulent entropy production rate. The entropy production equations are defined as follows [30]:
where is the entropy production total rate (EPTR), is the local entropy production direct rate (LEPDR), is the turbulent entropy production rate (TEPR), is the local entropy production wall rate (LEPWR), is the turbulent effective viscosity, , , represent the mean velocity components along the three coordinate directions, , , represent the fluctuating velocity components along the three coordinate directions, is the wall shear stress, is the velocity at the center of the wall-adjacent grid cell, is the thermodynamic temperature in Kelvin (273 K).
Mesh generation was performed using ANSYS software, employing adaptive tetrahedral unstructured grids. To balance computational efficiency with accuracy, distinct grid sizing strategies were applied to different flow components [31,32].
The local encryption processing was carried out for the runner blade area and blade inlet, boundary layers were added to the blade surface, and consistent grid sizes were adopted at each interface. Grid independence verification of the PAT was conducted by calculating the head changes under the design conditions with different grid numbers, as shown in Table 3. When the grid number exceeded 15 million, the variation range of the PAT head was less than 0.5%. Finally, the total grid number of the PAT was determined to be approximately 15.72 million, with the grid node number being 3.09 million.

Table 3.
Grid independence verification of the PAT.
In the present study, ANSYS-CFX software was utilized to conduct unsteady simulations of the three-dimensional viscous internal flow within a centrifugal pump, where the results of steady-state simulations were employed as the initial field. Boundary conditions were specified as the pressure inlet and mass flow outlet, with the wall boundaries treated under the no-slip condition; the standard wall function was applied in the near-wall regions. The solution convergence was monitored with all residual tolerances set to 10−6.
Figure 2 shows the local grid distributions of key components such as the runner, diffuser, and inlet–outlet flow passages.

Figure 2.
Mesh specifications for critical fluid domains in an 11-stage centrifugal pump.
By comparing the CFD results with the experimental data of the 11-stage PAT, the numerical method was verified [33]. Table 4 shows a comparison between numerical simulations and on-site experimental measurements of an operational 11-stage PAT. Inlet and outlet pressures were measured using pressure transmitters, flow rates were monitored via calibrated flow meters, and rotational speed and output shaft power were determined using high-precision torque transducers. It can be seen from Figure 3 that at the rated operating point, the numerical simulation predicted a head of 1658 m and an efficiency of 79.3%. The output error between numerical and experimental results was 2.3% at the tested flow rate of 180 m3/h, confirming the accuracy of the numerical approach.

Table 4.
Comparison between experimental and numerical simulation results at the rated operating point.
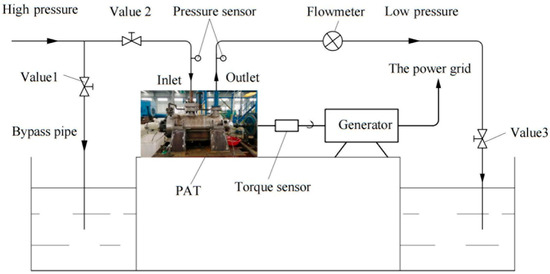
Figure 3.
Schematic diagram of the experimental apparatus.
In this study, while numerical simulation (CFD methodology) provides significant value, the Reynolds-Averaged Navier–Stokes (RANS) approach, as a widely adopted numerical method in turbomachinery (PAT) research, demonstrates satisfactory engineering reliability in predicting PAT performance based on the κ-ε turbulence model [34,35,36]. However, inherent limitations persist: the κ-ε model exhibits constrained capability in capturing transient vortical structures (e.g., flow separation, vortex shedding), potentially underestimating local energy dissipation. Furthermore, under extreme runaway conditions, its resolution of localized flow separation may prove inadequate, and the standard wall functions could lose accuracy in regions with strong pressure gradients or separated flows—all contributing to deviations between experimental measurements and numerical predictions. To address these challenges, subsequent investigations will employ advanced scale-resolving models such as Scale-Adaptive Simulation (SAS).
3. Results and Analysis
3.1. Entropy Production Characteristics Analysis of the Multistage PAT Under Runaway Conditions
Figure 4 presented the entropy production distribution of the multistage PAT across rotating and stationary flow passage components under varying rotational speeds, including the runner (RN), diffuser (DF), hub chamber (HC), and shroud chamber (SC). The RN exhibited the highest total entropy production ratio among the flow passage components, followed by the DF, then the SC, with the HC demonstrating the minimal contribution. As detailed in Figure 4, the wall entropy production (LEPWR) and fluctuating entropy production (LEPTR) within the RN and DF flow passages were explicitly visualized, with entropy contributions from the SC and HC consolidated into the impeller domain. Total entropy production exhibited a monotonically increasing trend with rotational speed escalation in the multistage PAT under runaway conditions, dominated by LEPWR; the impeller flow passages accounted for majority of total entropy, with LEPWR increasing from 2980 to 5100 r/min. Adverse flow phenomena in the impeller passages drove energy dissipation. LEPTR minima occurred at 4000 r/min in RN/DF passages, coinciding with peak efficiency, as shown in Table 1. The positive correlation between LEPTR and rotational speed remained consistent in both the SC and rear HC pump chambers.
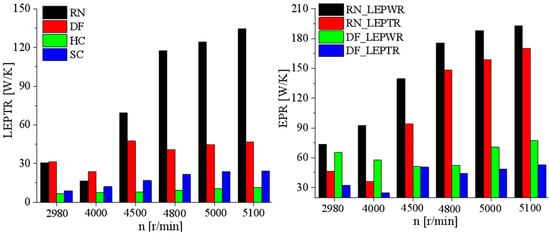
Figure 4.
Entropy distribution across rotating and stationary flow passage components.
Figure 5 illustrates the distribution of LEPTR and LEPWR across multistage impellers under varying rotational speeds. Both LEPTR and LEPWR exhibited a progressive increase with rotational speed escalation across all stages. Stages 1–5 and 7–10 demonstrated minimal entropy variation below 4500 r/min. Beyond 4500 r/min, the flow regime deteriorated significantly, leading to pronounced disparities in both LEPTR and LEPWR across all stages. Notably, the Stage 6 impeller exhibited exceptional entropy production variations compared to other stages due to structural deviations in its diffuser vanes. The LEPTR and LEPWR within the Stage 6 impeller showed an increasing trend at speeds of 2980 r/min, 5000 r/min, and 5100 r/min, meaning that the losses within the Stage 6 impeller would increase at speeds of 4000 r/min, 4500 r/min, and 4800 r/min; the LEPTR and LEPWR decreased, showing that the losses within the Stage 6 impeller would decrease at three speeds.
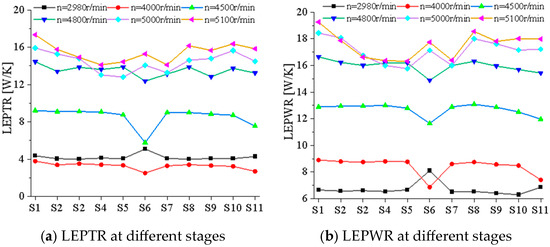
Figure 5.
Entropy production distribution at different impeller stages.
Figure 6 presents the distribution of LEPTR and LEPWR across diffuser stages under varying rotational speeds, where Stage 12 denotes the inlet section. Figure 6 reveals significant variations in LEPTR and LEPWR at the Stage 6 and Stage 11 diffuser stages: LEPTR surged at the Stage 6 and decreased at Stage 11. Under rotational speeds of 2980 r/min and 4000 r/min, the flow regime remained relatively stable, with LEPWR in diffuser stages (excluding Stage 6) demonstrating minimal variation. The Stage 6 diffuser exhibited a substantial increase in LEPWR, while the multistage turbine inlet demonstrated lower LEPWR values than all diffuser stages. Under rotational speeds of 4500 r/min and 4800 r/min, the flow regime deteriorated, the LEPWR surged at the Stage 6 diffusers, but decreased at the Stages 11 diffuser; the others remained unstable; the LEPWR of the multistage turbine inlet was increased compared with that at Stage 11, reaching the average level of each guide vane. Under rotational speeds of 5000 r/min and 5100 r/min, the flow regime deteriorated significantly, the LEPWR increased at Stages 1–5, kept stabilized at Stages 8–10, and decreased at Stage 11. The LEPWR at the multistage turbine inlet exceeded that of the Stage 11 diffuser.
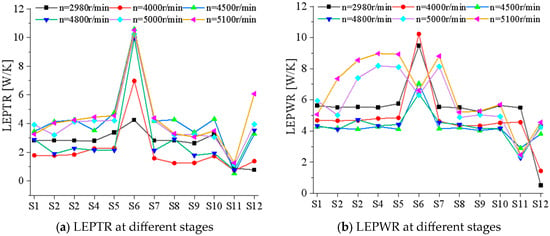
Figure 6.
Entropy production distribution at different diffuser stages.
Figure 7 illustrates the variation of pulsating entropy production distribution in HC and SC across different rotational speeds. The LEPTR in the first-stage SC—influenced by rotational speed and flow state—was significantly higher than in other stages due to its distinct structural configuration. The LEPTR in the SC exhibited a monotonic increase with rotational speed, while stage-specific flow variations caused divergent LEPTR responses across stages at identical speeds. Conversely, LEPTR in the HC demonstrated non-monotonic speed dependency, with flow regime characteristics exerting greater influence than rotational speed. Notably, LEPTR reductions occurred at 2980 r/min, 4000 r/min, and 4500 r/min.
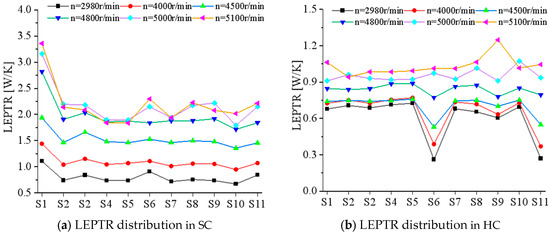
Figure 7.
Entropy production distribution at different diffuser stages in the HC and SC.
3.2. Flow Structure Analysis of the Multistage PAT Under Runaway Conditions
Figure 8 reveals the distribution of vorticity in the axial plane of the full flow field at different speeds under runaway conditions. High vorticity regions were concentrated at the interface between the RNs and the DFs. As rotational speed increases, vorticity decreased at the inlet pipe shoulder but increased at the outlet pipe wall and in the HC/SC. When reaching 5100 r/min, the high-vorticity band in the impeller-diffuser zone expanded into the volute casing, indicating intensified stage-to-stage flow instability within the multistage pump. This was the cause of the efficiency plummeting to 2.35%. Figure 9 presents the turbulence kinetic energy (TKE) distribution on impeller blades and Q-criterion vortex isosurfaces, which redistributed dynamically with rotational speed changes. It decreased from 2980 r/min to 4000 r/min and gradually increased from 4000 r/min to the runaway speed of 5100 r/min. The main structure of the vortices in the guide vanes was a long-curve vortex along the flow path of the guide vanes. Below 4000 r/min, high-TKE regions predominantly concentrated on the blade suction side, while above 4800 r/min, high-TKE zones shifted to the blade pressure side. The trailing edges remained the TKE hotspot at all speeds.
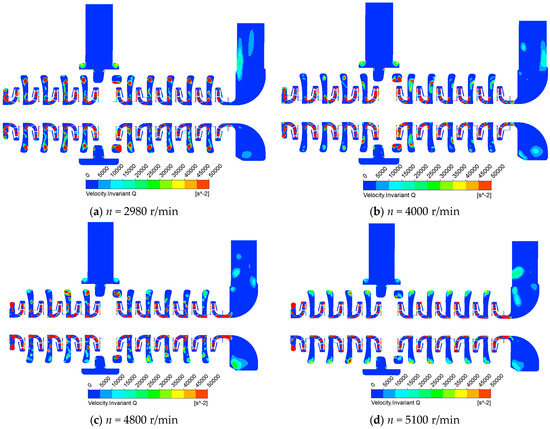
Figure 8.
Distribution of vorticity in the axial plane at different runaway stages.
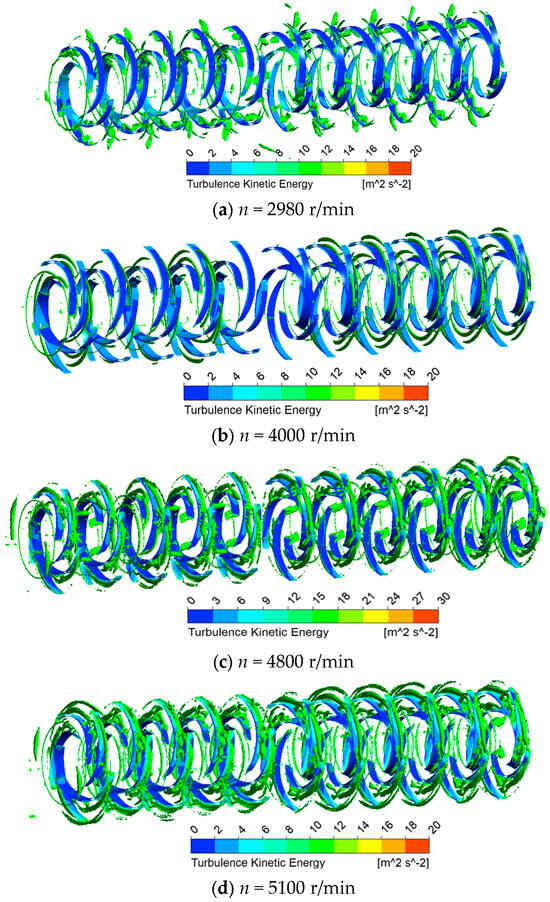
Figure 9.
TKE distribution of the QISO = 1000 s−2 isosurface at different runaway stages.
Figure 10 presents LEPWR distribution and LEPTR isosurfaces (EPTR = 10,000 W/m2/K). Figure 11 shows that when EPTR was 30,000 W/m2/K, the LEP reached the minimum at 4000 r/min, and the maximum at 5100 r/min. The LEP decreased from 2980 r/min to 4000 r/min, and gradually increased from 4000 r/min to 5100 r/min; it gradually increased at the outlet of the impeller, and mainly concentrated in the impeller flow channel. The LEPWR on the impeller blades mainly appeared in the backside near the inlet edge at 2980 r/min and 4000 r/min, while LEPTR was primarily located on the backside of the impeller blades; at speeds of 4800 r/min and running speed of 5100 r/min, the LEPWR mainly concentrated at the working surface near the outlet edge, with LEPTR primarily located at the impeller outlet.
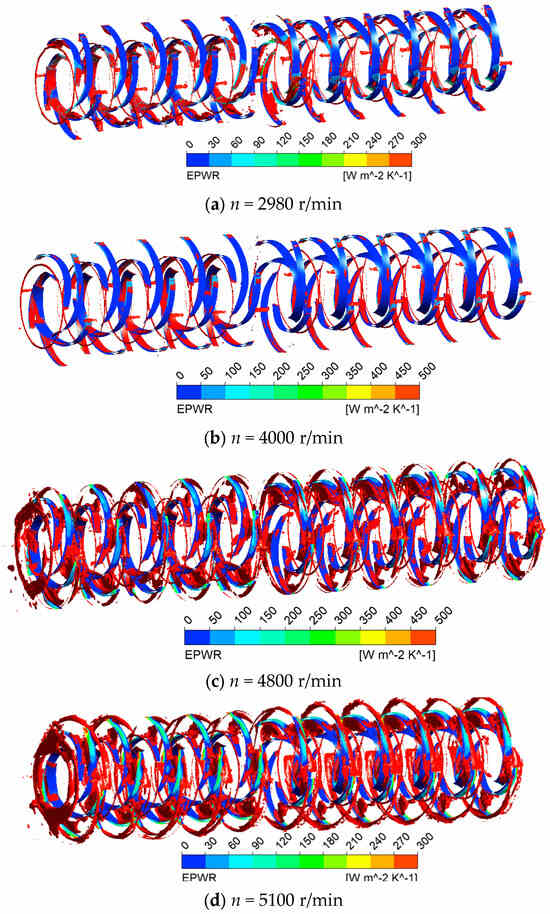
Figure 10.
LEPWR distribution of the EPTR = 10,000 W.m−2.K−1 isosurface at different runaway stages.
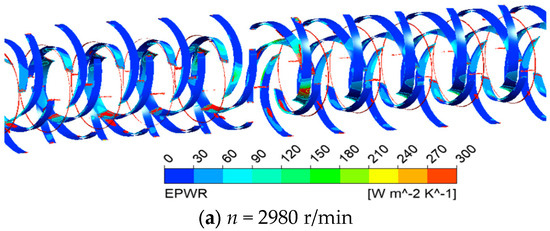
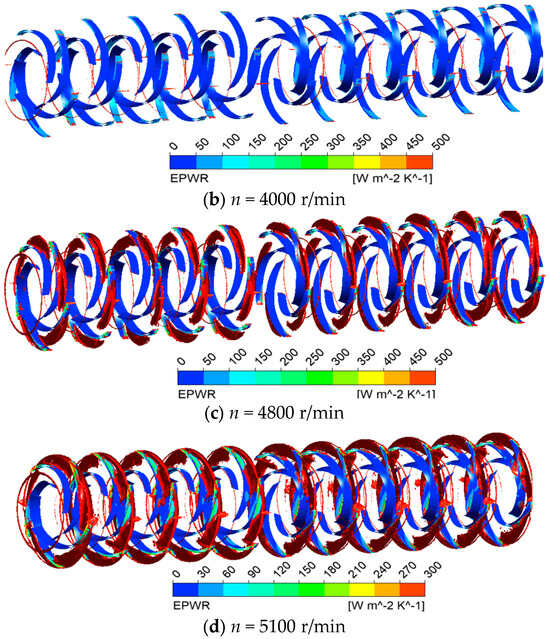
Figure 11.
LEPWR distribution of the EPTR = 30,000 W.m−2.K−1 isosurface at different runaway stages.
Aiming to analyze the internal flow causes of loss, the streamline distribution in the 1st, 3rd, intermediate (6th), 7th, 9th and last stages of the impeller were selected for comparison at different speeds, as shown in Figure 12. When comparing the flow streamline smoothness across different speeds, 4000 r/min provides the best performance, followed by 2900 r/min. Beyond that, smoothness deteriorates—4800 r/min is less optimal, and 5100 r/min performs the worst. Vortices were observed in all impeller flow passages at 2900 r/min, with vortex cores predominantly concentrated on blade suction surfaces. The Stage 6 impeller exhibited the largest vortex structures and the highest LEPTR; at 4000 r/min, the flow streamlines within the impeller passages exhibited optimal smoothness, with vortex structures reduced, hydraulic loss minimalized, and the lowest LEPTR. The streamline became chaotic with the flow of the medium. However, after the flow fully developed through the Stage 6 diffuser, the fluid dynamics within the Stage 6 impeller exhibited significant improvement, with streamlines regaining smoothness. Subsequently, the streamlines gradually deteriorated again downstream of Stage 6 due to cumulative flow disturbances; thus, Stage 6 and Stage 11 exhibited the smoothest streamlines. This correlated with the lowest LEPTR and LEPWR. At 4800 r/min, the impeller flow passages exhibited enhanced flow disorder, characterized by persistent vortex structures and strong cross-flows, which reduced the flow rate. The flow characteristics within the Stage 6 impeller passage demonstrated optimal hydrodynamic performance at this rotational speed, exhibiting the lowest LEPTR and LEPWR. At 5100 r/min, the flow regime reached its most severe state across all tested speeds, characterized by dominant full-passage vortices, escalating hydraulic losses and reducing work capability.
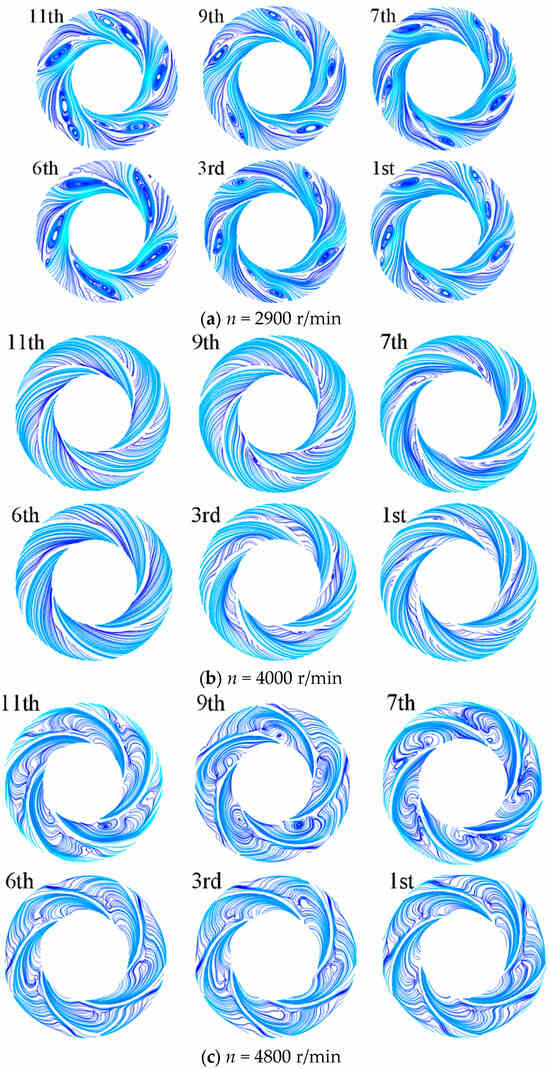
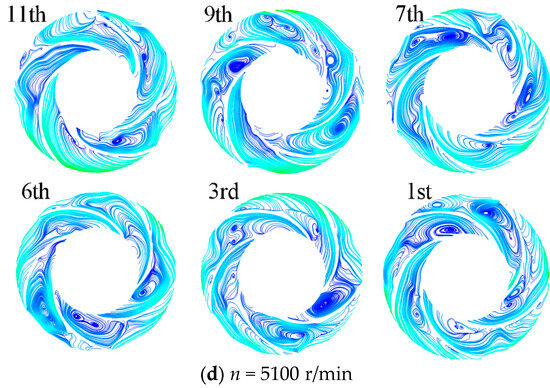
Figure 12.
Flow structure inside the impellers at different runaway stages.
3.3. Transient Characteristics Analysis of the Multistage PAT Under Runaway Conditions
Figure 13 presents the axial thrust variation across stages at different rotational speeds; under constant rotational speed, the impeller axial thrust exhibited an approximately linear increase with stage number, demonstrating dominant pressure-driven load accumulation. As the pressure energy of the high-pressure medium progressively converted into rotational kinetic energy across stages, the impeller axial force exhibited a stage-wise decrease corresponding to the reduced pressure levels in successive stages. Figure 14 illustrated the influence of rotational speed on radial force characteristics. As the rotational speed increased from 2980 r/min to 5100 r/min, the fluctuation amplitude of the radial force was significantly amplified. This amplification stemmed from enhanced rotor–stator interactions between the impeller and the volute, which intensified periodic excitation forces. Figure 15 demonstrates the effect of rotational speed on torque characteristics. The fluctuation amplitude of the torque increased drastically with rising rotational speed. Notably, the amplitude at 5100 r/min far exceeded that observed at 2980 r/min. In addition, higher rotational speeds were correlated with increased axial force on blades at a given stage, though the magnitude of this change remained limited. This behavior likely stemmed from the rising pressure differential between the impeller’s inlet and outlet at reduced flow rates, which correspondingly amplified the pressure difference acting on the blades.
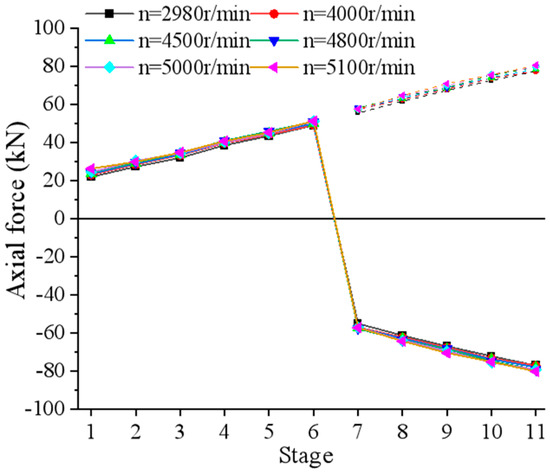
Figure 13.
Axial thrust variation across stages at different rotational speeds.
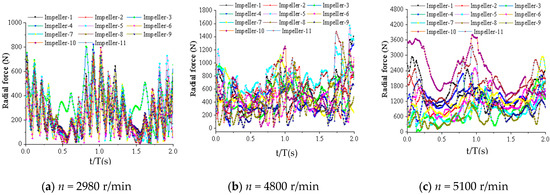
Figure 14.
Radial force time-domain plots for impeller stages at different rotational speeds.
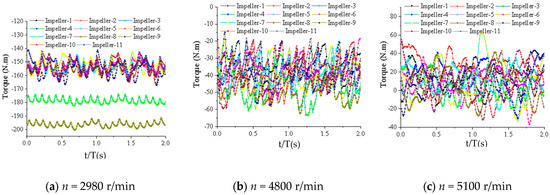
Figure 15.
Torque time-domain plots for impeller stages at different rotational speeds.
To precisely characterize the transient pressure fluctuations within the PAT, the pressure pulsation amplitude was employed to represent the periodic transient results. The pressure amplitude was expressed as follows:
where is the deviation of the instantaneous pressure from the cycle-averaged pressure, and is transient pressure value at monitoring point.
Figure 16, Figure 17 and Figure 18 show the time-domain characteristics of pressure pulsation at different monitoring locations on the impeller and guide vanes under various rotational speed conditions.
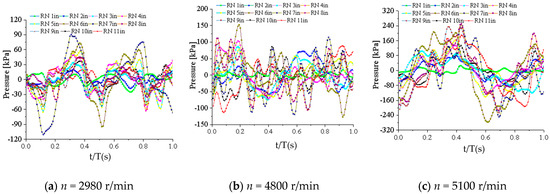
Figure 16.
Time-domain pressure pulsation at the impeller inlet region under different rotational speeds.
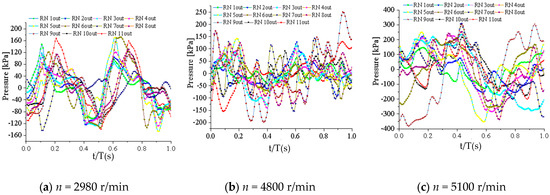
Figure 17.
Time-domain pressure pulsation at the impeller outlet region under different rotational speeds.
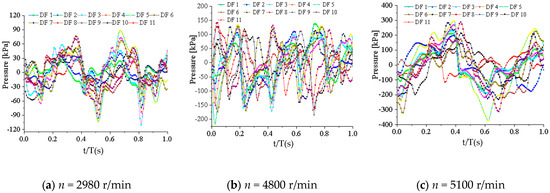
Figure 18.
Time-domain pressure pulsation in the guide vane tongue region under different rotational speeds.
As evident from Figure 16, the maximum peak pressure pulsation amplitude within the impeller’s inlet region occurred at Stage 6 (4800 r/min) or Stage 7 (2980 r/min and 5100 r/min). Conversely, the minimum peak pressure pulsation amplitude was consistently observed in Stage 1.
Figure 17 demonstrates that the maximum peak pressure pulsation amplitudes at the impeller outlet region occurred at Stage 5 (2980 r/min operation) and Stage 9 (4800 r/min and 5100 r/min). Conversely, the minimum peak pressure pulsation amplitudes were observed at Stage 1 (4800 r/min and 5100 r/min) and Stage 7 (2980 r/min).
As evidenced in Figure 18, the maximum peak pressure pulsation amplitudes at the guide vane tongue region consistently occurred at Stage 5 across all operational speeds. However, the minimum peak pressure pulsation amplitudes manifest at Stage 2 during 4800 r/min operation or Stage 11 under both 2980 r/min and 5100 r/min conditions. The peak amplitudes of the medium followed an “increase-then-decrease” trend from the guide vane to the impeller monitoring points at 2980 r/min and 5100 r/min, while demonstrating monotonic growth along the flow path at 4800 r/min operation. Moreover, the peak pressure pulsation amplitudes exhibited a consistent positive correlation with rotational speed across all monitoring locations. At runaway speed, the maximum pressure pulsation amplitudes simultaneously migrate to posterior stages (Stage 7 for impeller inlet; Stage 9 for outlet), while the minimum amplitude in the guide vane tongue region shifts to the final stage (Stage 11). The guide vane tongue region at Stage 5 consistently exhibited the most intense pressure pulsations across all rotational speeds.
To identify the dominant factors inducing pressure pulsations in the PAT system and characterize their spectral features, FFT was applied to the time-domain pressure signals acquired from the multistage PAT. The resultant frequency spectra at the monitored locations—including impeller inlet/outlet and guide vane passages, are presented in Figure 19, Figure 20 and Figure 21.

Figure 19.
Frequency-domain pressure pulsation at the impeller inlet region under different rotational speeds.

Figure 20.
Frequency-domain pressure pulsation at the impeller outlet region under different rotational speeds.

Figure 21.
Frequency-domain pressure pulsation in the guide vane tongue region under different rotational speeds.
Figure 19 reveals that in the impeller inlet region, the dominant pressure pulsation frequencies exhibited a staged variation pattern. At a rotational speed of 2980 r/min, the frequency spectrum was 4fn at Stage 1 and Stage 2, decreased to 3fn from the 3rd to 10th stages, and changed back to 4fn at Stage 11. The frequency spectrum exhibited remarkable stability at 4800 r/min. At 5100 r/min, spectral analysis revealed that Stage 1 exhibited the highest dominant frequency, 3fn. Both the blade passing frequency fBPF (5fn) and its harmonics were consistently observed at 2980 r/min and 5100 r/min. Notably, Stage 1 demonstrated the minimum pressure pulsation amplitudes among all stages, showing remarkable insensitivity to rotational speed variations.
In the impeller near the outlet side, at a rotational speed of 2980 r/min, except for Stage 7 where the dominant frequency was 4fn, the other stages were at 2fn. At 4800 r/min, the dominant frequency of each stage first decreased to 2fn and then increased to 3fn. At 5100 r/min, except for Stage 6 and Stage 9 with a dominant frequency of 2fn, the other stages were at the rotating frequency, the dominant rotational frequency at the impeller outlet, indicated prevailing low-frequency rotational energy, inducing substantial mechanical resonance risks. Both at 2980 r/min and 5100 r/min, the blade passing frequency fBPF (5fn) and its harmonics were consistently detected.
As for the guide vane near the tongue region, frequency migration occurred from 3fn (Stages 1–7) to 2fn (Stages 8–10) at 2980 r/min, finally locking onto fBPF (5fn) at Stage 11. Under 4800 r/min, the system exhibited fn dominance in early stages (Stages1–2), while fBPF (5fn) prevailed in most later stages. For 5100 r/min, despite minimal stage-to-stage variations, both fBPF (5fn) and its harmonics remained clearly detectable across all stages. The pressure pulsation evolution exhibited two distinct regimes. It increased slightly from a rotational speed of 2980 r/min to 4800 r/min, and then increased rapidly from 4800 r/min to the runaway speed of 5100 r/min. A comparison of the pressure pulsations at three different measurement points revealed that the pressure pulsation near the outlet side of the impeller was the largest among the three measurement points. The inflection point in amplitude growth signifies the onset threshold of flow instability at 4800 r/min, demarcating the operational safety envelope.
4. Conclusions
During the runaway process of a multistage PAT, the impeller rotational speed rises sharply within an extremely short time, the flow rate continuously decreases, and the efficiency first increases slightly before continuously decreasing. The peak efficiency of 78.48% occurs at 4000 r/min, whereas the efficiency plunges to a minimum of merely 2.35% at 5100 r/min.
Compared with the turbine operating condition, the flow in the impeller passage is unstable under the runaway condition. As the rotational speed increases, the total entropy production of the impeller generally increases continuously, and the variation trend of pulsating entropy production is consistent with that of wall entropy production. The total entropy production of the guide vane varies significantly with the rotational speed: it increases significantly at Stage 6 but decreases at Stage 11. The deterioration of the flow pattern at high rotational speeds leads to intensified fluctuations in entropy production. The pulsating entropy production in the front pump cavity of Stage 1 is significantly higher than that of the other stages due to structural differences, and the entropy production increases with the increase in rotational speed. In contrast, the rear pump cavity is dominated by flow, and the entropy production decreases at low and medium rotational speeds.
In this study, the Stage 6 guide vane, located in close proximity to the volute, experiences a reduced flow passage area due to volute convergence effects. To better accommodate the volute-induced flow field characteristics, an asymmetric throat configuration should be implemented. The circumferential flow non-uniformity induced by the volute causes significant inflow angle deviations, leading to anomalous entropy production characteristics.
During the runaway process, the high-vorticity region is located at the impeller outlet and primarily concentrated on the suction side of the blades. As the rotational speed increases, the streamlines become less stable, leading to a non-monotonic trend in local entropy production—first decreasing and then increasing. When comparing flow streamline smoothness across different speeds, 4000 r/min provides the best performance, followed by 2900 r/min. Beyond that, smoothness deteriorates—4800 r/min is less optimal, and 5100 r/min performs the worst. At 4000 r/min, the streamlines exhibit the smoothest pattern, corresponding to the minimum energy loss.
Within the impeller, the minimum pressure pulsation amplitude on the inlet side occurs at the first stage and remains unaffected by rotational speed. The maximum amplitude appears near the stage closest to the inlet volute. As speed increases, pressure pulsations initially rise significantly before gradually decreasing. On the outlet side of the impeller, the monitored pressure first decreases and then increases with rising frequency. In the guide vanes, pressure pulsations near the tongue region initially decrease and then increase with rotational speed.
Author Contributions
Conceptualization, X.L. and Y.L.; methodology, P.L., Y.X., X.L., Y.L. and W.L.; validation, P.L. and W.L.; formal analysis, P.L. and Y.X.; investigation, P.L., X.L., Y.L. and J.P.; data curation, P.L. and Y.X.; writing—original draft preparation, P.L., Y.X., X.L. and D.H.; writing—review and editing, X.L. and D.H.; visualization, P.L., Y.X. and W.L.; supervision, X.L., D.H. and J.P.; project administration, Y.L. and J.P.; funding acquisition, P.L. All authors have read and agreed to the published version of the manuscript.
Funding
This research was funded by the Science and Technology Innovation Program of Hunan Province, grant number 2022RC1140, the Natural Science Foundation of Hunan Province, grant number 2023JJ50088, the Hunan Provincial Department of Education Project, grant number 22A0607, and the key R&D program of Hunan Province, grant number 2024AQ2001.
Data Availability Statement
The original contributions presented in this study are included in the article. Further inquiries can be directed to the corresponding author(s).
Conflicts of Interest
Authors Wei Lu and Jin Peng were employed by the company Huaneng Lancangjiang River Hydropower Inc. The remaining authors declare that the research was conducted in the absence of any commercial or financial relationships that could be construed as a potential conflict of interest.
Abbreviations
The following abbreviations are used in this manuscript:
| PAT | Pumps as turbines |
| SAF | Soft abrasive flow finishing |
| CFD | Computational fluid dynamics |
| VOF | Volume of Fluid |
| BPF | Blade-passing frequency |
| LEPTR | Flow entropy production |
| LEPWR | Wall entropy production |
| TEPR | Turbulent entropy production rate |
| EPWR | Entropy production wall rate |
| LEPDR | Local entropy production direct rate |
| LEPWR | Local entropy production wall rate |
| LEPTR | Local entropy production total rate |
| EPTR | Entropy production total rate |
| TKE | Turbulence kinetic energy |
| RN | Runner |
| DF | Diffuser |
| HC | Hub chamber |
| SC | Shroud chamber |
References
- Wang, Z.Q.; Wang, W.J.; Wang, D.X.; Song, Y. Numerical analysis of energy loss characteristics of guide vane centrifugal pump as turbine. Front. Energy Res. 2024, 12, 1410679. [Google Scholar] [CrossRef]
- Kan, K.; Zhao, F.; Xu, H.; Feng, J.G.; Chen, H.X.; Liu, W.D. Energy performance evaluation of an axial-flow pump as turbine under conventional and reverse operating modes based on an energy loss intensity model. Phys. Fluids 2023, 35, 015125. [Google Scholar] [CrossRef]
- Song, X.J.; Wang, Z.W.; Jin, Y.; Liu, C.; Presas, A.; Tang, F.P.; Lu, Y.G. Research on the mechanism of the effect of vortex on the hydraulic loss of pump as turbine units based on entropy production theory. Renew. Energy 2025, 239, 122048. [Google Scholar] [CrossRef]
- Yu, A.; Tang, Y.B.; Tang, Q.H.; Cai, J.G.; Zhao, L.; Ge, X.F. Energy analysis of Francis turbine for various mass flow rate conditions based on entropy production theory. Renew. Energy 2022, 183, 447–458. [Google Scholar] [CrossRef]
- Li, X.J.; Cao, Z.T.; Wei, Z.C.; Ren, Q.L. Theoretical model of energy conversion and loss prediction for multi-stage centrifugal pump as turbine. Energy Convers. Manag. 2025, 325, 119379. [Google Scholar] [CrossRef]
- Ghorani, M.M.; Haghighi, M.H.S.; Maleki, A.; Riasi, A. A numerical study on mechanisms of energy dissipation in a pump as turbine (PAT) using entropy generation theory. Renew. Energy 2020, 162, 1036–1053. [Google Scholar] [CrossRef]
- Lin, T.; Li, X.J.; Zhu, Z.C.; Xie, J.; Li, Y.; Yang, H. Application of enstrophy dissipation to analyze energy loss in a centrifugal pump as turbine. Renew. Energy 2021, 163, 41–55. [Google Scholar] [CrossRef]
- Feng, J.J.; Zhang, Y.; Zhu, G.J.; Li, J.Z.; Li, W.F. Transition process characteristics of centrifugal pump with power-off based on entropy production theory. Trans. Chin. Soc. Agric. Eng. 2020, 36, 10–17. [Google Scholar]
- Ge, Z.G.; Feng, J.J.; Wu, Y.J.; Yang, Z.B.; Zhang, Y.; Zhu, G.J.; Luo, X.Q. Numerical analysis on characteristics of transient process in centrifugal pumps during power failure under large flow initial condition. Chin. J. Hydrodyn. 2022, 37, 452–458. [Google Scholar] [CrossRef]
- Xu, Z.; Zhen, Y.; Kan, K.; Huang, J.C. Runaway characteristics of bidirectional horizontal axial flow pump with super low head based on entropy production theory. Trans. Chin. Soc. Agric. Eng. 2021, 37, 49–57. [Google Scholar]
- Si, Q.; Xia, X.; Wu, K.; Deng, F.; Yuan, S. Transient characteristics of the hydraulic transition process of emergency water supplymulti-stage pump with unexpected shutdown. Trans. Chin. Soc. Agric. Eng. 2024, 40, 72–81. [Google Scholar] [CrossRef]
- Ouyang, T. Interstage Flow Characteristics and Deterministic Analysis of Multistage Centrifugal Pump as Turbine. Master’s Thesis, Zhejiang Sci-Tech University, Hangzhou, China, 2023. [Google Scholar] [CrossRef]
- Cui, M.M.; Shen, J.W. Influence of Rotational Speeds on Pressure Pulsation Under Low Flow Conditions. Heilongjiang Sci. 2025, 16, 37–42. [Google Scholar]
- Yu, T.; Shuai, Z.J.; Wang, X.; Jian, J.; Li, W.Y.; Jiang, C.X.; Xiao, Q. A study on instability mechanism of a pump-valve coupling system in low flow rate. J. Vib. Shock 2023, 42, 137–144. [Google Scholar] [CrossRef]
- Zhou, Q.; Xia, L.S.; Zhang, C.Z. Internal mechanism and improvement criteria for the runaway oscillation stability of a pump-turbine. Appl. Sci. 2018, 8, 2193. [Google Scholar] [CrossRef]
- Tchada, M.; Tchoumboué, K.; Mesquita, A. Enhancing Pump as Turbine (PAT) performances: A numerical investigation into the impact of impeller leading edge rounding. Heliyon 2024, 10, e34663. [Google Scholar] [CrossRef]
- Zhao, Z.L.; Guo, Z.W.; Qian, Z.D.; Cheng, Q. Performance improvement of an axial-flow pump with inlet guide vanes in the turbine model. Proc. Inst. Mech. Eng. Part A J. Power Energy 2020, 234, 323–331. [Google Scholar] [CrossRef]
- Wei, Y.Y.; Shi, Y.H.; Zhang, Q.; Shi, W.D. Numerical investigation of unsteady pressure pulsation characteristics in an ultra-low specific-speed centrifugal pump as a turbine. Front. Energy Res. 2023, 10, 1026886. [Google Scholar] [CrossRef]
- Binama, M.; Kan, K.; Chen, H.X.; Zheng, Y.; Zhou, D.Q.; Su, W.T.; Ge, X.F.; Ndayizigiye, J. A Numerical Investigation into the PAT Hydrodynamic Response to Impeller Rotational Speed Variation. Sustainability 2021, 13, 7998. [Google Scholar] [CrossRef]
- Zhang, R.; Chen, L.; Zeng, Y. Numerical simulations of cavitation flow characteristics of centrifugal pump impeller under large flow conditions. J. Hydroelectr. Eng. 2025, 44, 10–21. [Google Scholar]
- Trivedi, C.; Cervantes, M.J.; Gandhi, B.K. Investigation of a high head Francis turbine at runaway operating conditions. Energies 2016, 9, 149. [Google Scholar] [CrossRef]
- Shi, Z.X. Research on the Effect of Tip Clearance and Guide Vanes on the Performance of Axial Pump as Turbine. Master’s Thesis, Lanzhou University of Technology, Lanzhou, China, 2021. [Google Scholar] [CrossRef]
- Li, Q.F.; Zhao, C.B.; Long, S.C.; Quan, H. A study on the evolution of vortex in the draft tube of pump-turbine under the runaway condition. J. Vib. Shock 2019, 38, 222–228. [Google Scholar] [CrossRef]
- Miao, S.C.; Li, G.Z.; Zhang, Q.L.; Wang, X.H. Research on Transient Flow Characteristics of Axial-flow Pump as Hydraulic Turbine during Runaway Transition. J. Eng. Therm. Energy Power 2024, 39, 22–29. [Google Scholar]
- Miao, S.C.; Zhang, H.B.; Tian, W.L.; Li, Y.Q. A Study on the Unsteady Flow Characteristics and Energy Conversion in the Volute of a Pump-as-Turbine Device. Fluid Dyn. Mater. Process. 2021, 17, 1021–1036. [Google Scholar] [CrossRef]
- Wang, P.; Gao, J.W.; Luo, X.; Lu, J.L.; Xue, Q.Y.; Zhu, G.J. Study on runaway characteristics of tubular turbine for residual pressure power generation. J. Hydroelectr. Eng. 2022, 41, 122–134. [Google Scholar]
- Zhang, C.Y.; Pei, J.; Yuan, S.Q.; Wang, W.J.; Gan, X.C. Analysis of internal flow characteristics during runaway transition of inline pump turbine as turbine. Chin. J. Hydrodyn. 2021, 36, 830–834. [Google Scholar] [CrossRef]
- Govender, M.; Ikegwuoha, C.D.; Seyam, M. A CFD-Based Study of Pipe Leakage Dynamics and Water Management Impacts. Water Resour. Manag. 2025, 1–14. [Google Scholar] [CrossRef]
- Karpenko, M. Aircraft hydraulic drive energy losses and operation delay associated with the pipeline and fitting connections. Aviation 2024, 28, 1–8. [Google Scholar] [CrossRef]
- Lu, Y.G.; Xin, L.C.; Hu, N.M. Influences of floating ice on the water entry process of slender body on the cavity evolution and hydrodynamic characteristics. Phys. Fluids 2025, 37, 0261877. [Google Scholar] [CrossRef]
- Chen, X.X.; Hou, T.Y.; Liu, S.L.; Guo, Y.X.; Hu, J.P.; Xu, G.M.; Ma, G.X.; Liu, W. Design of a Micro-Plant Factory Using a Validated CFD Model. Agriculture 2024, 14, 2227. [Google Scholar] [CrossRef]
- Chen, H.Z.; Liu, X.S.; Li, H.R.; Zhu, R.S.; Fu, Q.; Lu, Y.G. Pressure distribution characteristics in pump chamber and axial force optimization of reactor coolant pump. Phys. Fluids 2025, 37, 015159. [Google Scholar] [CrossRef]
- Liu, Z.W.; Lu, Y.G.; Li, X.L.; Wang, Z.W.; Alexandre, P. Research on the influence mechanism of operating characteristics of an 11-stage pump as turbine under turbine mode. Proc. Inst. Mech. Eng. Part A J. Power Energy 2025, 239, 501–513. [Google Scholar] [CrossRef]
- Lu, Y.G.; Liu, Z.W.; Zhao, Y.; Wang, Z.W.; Presas, A. Study on evolution characteristics of energy dissipation and vortex in pump- turbine during load rejection transition process. Phys. Fluids 2025, 37, 025104. [Google Scholar] [CrossRef]
- Xu, L.Z.; Hansen, A.C.; Li, Y.M.; Liang, Z.W.; Yu, L.J. Numerical and experimental analysis of airflow in a multi-duct cleaning system for a rice combine harvester. Trans. ASABE 2016, 59, 1101–1110. [Google Scholar] [CrossRef]
- Jiang, Y.; Li, H.; Hua, L.; Zhang, D.M. Three-dimensional flow breakup characteristics of a circular jet with different nozzle geometries. Biosyst. Eng. 2020, 193, 216–231. [Google Scholar] [CrossRef]
Disclaimer/Publisher’s Note: The statements, opinions and data contained in all publications are solely those of the individual author(s) and contributor(s) and not of MDPI and/or the editor(s). MDPI and/or the editor(s) disclaim responsibility for any injury to people or property resulting from any ideas, methods, instructions or products referred to in the content. |
© 2025 by the authors. Licensee MDPI, Basel, Switzerland. This article is an open access article distributed under the terms and conditions of the Creative Commons Attribution (CC BY) license (https://creativecommons.org/licenses/by/4.0/).