1. Introduction
The accelerated deployment of electric vehicles (EVs) has introduced both opportunities and challenges for modern smart grids (SGs). EVs can support sustainable urban mobility and enable demand-side flexibility [
1], yet their stochastic charging patterns and spatial clustering risk overload local distribution networks and increase peak demand [
2,
3]. Such challenges are compounded by dynamic pricing schemes, the proliferation of distributed energy resources, and growing cyber-physical vulnerabilities [
4]. For example, during the intense June–July 2025 heatwaves, EU-wide electricity demand surged by around 7.5% year-on-year over just two weeks, with Spain facing spikes of up to 16%, prompting blackouts in cities such as Florence and Bergamo and underscoring the fragility of current infrastructure under climate-driven stress [
5].
Recent studies have introduced advanced metaheuristics for microgrid optimisation. For example, the Generalized Normal Distribution Optimizer (GNDO) has been applied to optimise the economic and operational performance of AC microgrids with battery energy storage systems (BESS), demonstrating significant improvements in cost reduction and grid stability [
6]. In parallel, the issue of data quality in energy datasets has gained attention, with self-supervised and imputation-aware models emerging as powerful tools for learning robust representations under missing or corrupted data scenarios [
7]. Such developments highlight complementary research trends in optimisation and data handling that support resilient and efficient energy management systems.
Ensuring smooth and uninterrupted operation of smart grids is critical, particularly under conditions of fluctuating renewable energy penetration. Recent studies have proposed advanced control frameworks to address this, such as the intelligent Lyapunov-based adaptive fuzzy controller for standalone DC microgrids presented by Hussan et al. [
8], which demonstrated stable operation and enhanced reliability under both high and low penetration of renewable energy sources. Such works highlight the growing importance of resilient control strategies in guaranteeing uninterrupted power delivery, which aligns with the objectives of our proposed GA/RL-based optimisation framework.
Conventional EV charging strategies—based on static scheduling or deterministic heuristics—fail to adapt to uncertainties in user behaviour and grid fluctuations, resulting in inefficiencies [
9]. Similarly, standard forecasting models assume high-quality and complete data; however, real-world datasets are often incomplete or noisy, which limits prediction accuracy [
10]. Moreover, the bi-directional communication required in EV–grid interactions enlarges the attack surface, making them susceptible to cyber-attacks that threaten system integrity and stability [
11].
To overcome these limitations, this study proposes a novel cyber-resilient, data-driven optimisation framework. The framework integrates hybrid optimisation—combining genetic algorithms (GA) and reinforcement learning (RL)—with robust real-time forecasting and a lightweight blockchain-inspired security mechanism coupled with an intrusion detection system (IDS). This approach aims to achieve secure, scalable, and adaptive energy management in EV-integrated SGs.
1.1. Research Gaps and Questions
Although the integration of EVs into SGs is advancing rapidly, existing energy management approaches still exhibit notable limitations. First, most current methods rely on static scheduling or deterministic optimisation, which cannot adequately address the uncertainties inherent in EV mobility patterns and grid conditions. Second, the forecasting models employed often fail to maintain acceptable accuracy when confronted with incomplete or noisy data, which is a common challenge in real-world systems. Third, there has been insufficient emphasis on ensuring the cybersecurity and trustworthiness of decentralised EV–grid communications, particularly using lightweight solutions suitable for real-time operation.
These shortcomings motivate the following research questions:
How can peak demand and station utilisation be optimised dynamically under uncertain and variable conditions without compromising service quality?
What forecasting techniques can deliver accurate short-term EV demand predictions even in the presence of incomplete or degraded data?
How can secure and resilient EV–grid communication be achieved in a decentralised and resource-constrained environment?
1.2. Aim of the Study
The aim of this study is to design, implement, and evaluate a novel, cyber-resilient, data-driven optimisation framework for real-time energy management in EV-integrated SGs. The framework is intended to optimise load distribution dynamically, improve the accuracy and robustness of demand forecasting, and ensure the integrity and security of decentralised EV–grid interactions, even under challenging operational conditions.
1.3. Contributions of the Study
This work makes the following key contributions:
A hybrid optimisation algorithm that integrates GAs and RL to achieve adaptive and real-time scheduling of EV charging demand under uncertainty.
A real-time analytics engine for high-resolution demand forecasting using large-scale, heterogeneous datasets, which achieves a mean absolute error (MAE) of 0.25 kWh and maintains acceptable performance with up to 25% missing data.
A lightweight blockchain-inspired security protocol integrated with an IDS, achieving an accuracy above 94%, an area under the curve (AUC) of 0.97, and detection latencies under 300 ms.
Comprehensive empirical evaluation using European SG datasets, demonstrating significant peak demand reduction (9.6%), more balanced station utilisation over time and space, and resilience against novel cyber-attack scenarios.
Sensitivity and scalability analyses confirming sub-second optimisation runtimes even at five times the baseline dataset size, and robust performance under high EV penetration levels and increasing proportions of novel attack types.
The remainder of this paper is organised as follows.
Section 2 reviews the state-of-the-art literature on optimisation, forecasting, and cybersecurity in EV-integrated SGs, highlighting existing challenges and gaps.
Section 3 presents the proposed cyber-resilient, data-driven optimisation framework, detailing its hybrid optimisation algorithm, real-time forecasting module, and lightweight blockchain-inspired security mechanism.
Section 4 describes the datasets, experimental setup, and evaluation metrics employed in this study. Also, it reports the experimental results and provides a comprehensive discussion, including quantitative analyses of optimisation performance, forecasting accuracy, and cybersecurity effectiveness.
Section 5 concludes the paper by summarising the key findings, contributions, and possible directions for future research.
2. Literature Review
Several strands of research underpin the present work, spanning optimisation techniques, demand forecasting models, and cybersecurity mechanisms in EV-integrated SGs.
On the optimisation front, centralised approaches, particularly those based on mixed-integer linear programming (MILP) and rule-based heuristics, have been widely applied to coordinate EV charging schedules [
12,
13]. These methods typically aim to minimise peak demand, electricity costs, or power losses by solving an optimisation problem under operational constraints. While they are mathematically rigorous and produce globally optimal solutions under idealised assumptions, their computational complexity grows rapidly with problem size and uncertainty, making them unsuitable for large-scale or real-time deployment [
14]. To improve scalability and flexibility, decentralised strategies have been proposed, often based on distributed optimisation or game-theoretic models [
15], which allow individual EVs or aggregators to make decisions with limited coordination. However, these approaches still struggle to cope with high-dimensional uncertainty and often settle at suboptimal Nash equilibria.
To overcome these limitations, metaheuristic optimisation methods have been introduced, including GAs [
16], particle swarm optimisation (PSO) [
17], and ant colony optimisation (ACO) [
18]. These algorithms excel at exploring complex, non-convex search spaces and can find satisfactory solutions within reasonable time frames, even in the presence of non-linearities and discrete decision variables. Nevertheless, traditional metaheuristics remain static: their parameters and search strategies are often fixed, which limits their ability to adapt dynamically to evolving grid and user conditions. More recently, RL has emerged as a powerful tool for adaptive, data-driven optimisation in uncertain and dynamic environments [
19,
20]. RL-based agents can learn optimal policies through interactions with the environment and adjust in real-time. Despite these advantages, RL methods can suffer from slow convergence, instability during training, and susceptibility to local minima, particularly in high-dimensional state spaces. These limitations have motivated hybrid techniques that combine the global search capabilities of GAs with the adaptive learning of RL, achieving both exploration and exploitation effectively [
21].
In the domain of demand forecasting, accurately predicting EV-induced loads is critical for proactive grid management and optimisation. Classical time-series models such as ARIMA and exponential smoothing have been applied but are limited in their ability to capture non-linear and high-dimensional relationships [
22]. Machine learning (ML) approaches, including support vector regression (SVR) [
23], random forests [
24], and gradient boosting methods [
25], have demonstrated superior predictive accuracy by leveraging complex patterns in historical data. Deep learning architectures, such as recurrent neural networks (RNNs) and attention-based transformers, have further improved forecasting accuracy by capturing long-term dependencies and temporal dynamics [
26,
27]. However, these data-driven models generally assume complete and clean datasets; their performance degrades considerably in the presence of missing, noisy, or corrupted data [
28,
29]. Few studies explicitly address the resilience of forecasting models under such adverse conditions.
Cybersecurity in EV-integrated SGs is increasingly recognised as a critical challenge. Blockchain-based approaches have gained prominence for providing tamper-proof, decentralised trust in EV–grid transactions [
30,
31]. These techniques enhance transparency and integrity by maintaining immutable ledgers, but their high computational and communication overhead limits their applicability in real-time, resource-constrained environments. To address this, lightweight blockchain variants have been proposed that reduce block sizes, simplify consensus mechanisms, and optimise verification processes to improve latency and efficiency [
32,
33]. Concurrently, IDSs have been developed to detect cyber-attacks on SG communications. These IDSs traditionally rely on statistical anomaly detection, rule-based systems, or ML classifiers to identify malicious behaviour [
34,
35]. However, ongoing research is increasingly shifting towards graph-based and federated learning paradigms, where distributed nodes collaboratively train models without exposing sensitive data. Such approaches leverage the structural dependencies of smart grid communication networks and provide improved scalability, privacy preservation, and detection accuracy, thereby reflecting the next generation of cyber-defence mechanisms in EV–grid ecosystems [
36,
37]. Despite their effectiveness in detecting known attack patterns, many IDSs struggle to generalise to previously unseen (zero-day) attacks and often operate in isolation from other grid management modules. Moreover, there is a lack of integrated approaches that combine security mechanisms with optimisation and forecasting to provide holistic resilience.
Recent advances in data-driven optimisation have also introduced decentralised techniques that complement centralised scheduling strategies. For instance, long short-term memory (LSTM)-based recurrent neural networks (RNNs) have been applied to short-term load forecasting in smart grids, capturing nonlinear temporal dependencies and improving forecasting accuracy under highly dynamic demand conditions [
38,
39]. Similarly, decentralised stochastic recursive gradient methods have been proposed for distributed energy optimisation, where local nodes iteratively update their strategies using limited communication, thereby reducing centralised bottlenecks and improving scalability [
40,
41,
42]. These methods highlight a growing emphasis on decentralised, data-driven optimisation that enables resilient and scalable EV–grid integration. In this context, our proposed hybrid GA/RL framework differs by jointly optimising grid-level objectives and user satisfaction while ensuring real-time adaptability under cyber-resilient constraints.
In summary, while substantial progress has been made across these areas, existing methods tend to focus narrowly on single objectives—either optimisation, forecasting, or security—without adequately addressing the interplay among them. This study advances the state of the art by unifying a hybrid GA–RL optimisation algorithm, a resilient forecasting engine tolerant to incomplete data, and a lightweight blockchain-inspired IDS into a single, coherent framework. This integrated approach addresses efficiency, accuracy, and security simultaneously in EV-integrated SGs, responding to the key limitations identified in the literature [
43].
3. Methodology
In our framework, the GA generates diverse candidate schedules through population evolution, while the RL agent refines and re-ranks the top offspring after each generation using policy-gradient updates. The refined solutions are then reintroduced into the GA population, ensuring GA maintains global exploration while RL provides targeted exploitation.
This section outlines the proposed cyber-resilient, data-driven optimisation framework for real-time energy management in EV-integrated SGs. The methodology comprises three main components: (i) hybrid optimisation of charging demand, (ii) real-time forecasting of load demand, and (iii) a lightweight blockchain-inspired security mechanism with an integrated IDS. The overall objective is to minimise peak demand while ensuring forecast accuracy and preserving the integrity and security of EV–grid communications.
Figure 1 illustrates the overall system architecture of the EV-integrated SG considered in this study. The architecture comprises several key components: smart chargers and charging stations, the cloud-based energy management system (EMS), the communication network, and the utility grid.
The smart chargers and charging stations serve as the physical interface between EVs and the power grid, facilitating bi-directional energy exchange and enabling local control of charging sessions. These stations are connected to the cloud EMS through a communication network, which coordinates scheduling, forecasting, and optimisation tasks in real time. The cloud EMS interacts with the utility grid to ensure system-level load balancing and stability. As indicated in
Figure 1, the communication network is exposed to multiple potential cyber-attacks, shown by the arrows labelled “attacks” targeting various parts of the system. These attacks can compromise the integrity, confidentiality, and availability of data exchanged between the stations, cloud EMS, and utility grid, underscoring the need for robust cybersecurity mechanisms. The figure thus motivates the integration of hybrid optimisation, resilient forecasting, and lightweight blockchain-inspired security protocols into the system to defend against these vulnerabilities and maintain reliable operation.
3.1. Datasets
This study employs two publicly available datasets to evaluate the proposed cyber-resilient, data-driven optimisation framework. Together, these datasets provide complementary information on EV charging behaviour and cybersecurity events in EV charging stations.
The first dataset, titled “Replication Data for: A Field Experiment on Workplace Norms and EV Charging Etiquette”, was published by Asensio et al. [
44] in the Harvard Dataverse repository. This dataset contains detailed records of 3395 high-resolution EV charging sessions conducted by 85 drivers at 105 stations across 25 workplace sites in the United States. The data, collected as part of the U.S. Department of Energy’s Workplace Charging Challenge, includes timestamped session-level information at a one-second resolution. The workplace facilities in the dataset span research centres, manufacturing sites, testing facilities, and office headquarters. The dataset is provided in a human- and machine-readable CSV format and is directly importable into standard data analysis software. Although this dataset originates from U.S. trials, its temporal charging behaviours—particularly clustering around morning arrivals and evening departures—are consistent with European commuting patterns. Moreover, to ensure external validity, we supplemented our analysis with European grid load traces (ENTSO-E, 2023) [
45], which confirm similar midday and early-evening demand peaks. This combination allows the dataset to capture both fine-grained charging dynamics and realistic European grid-level demand conditions.
The second dataset, titled “Power Consumption: EVSE-B under Attack and Benign Conditions”, was released by the Canadian Institute for Cybersecurity (CIC) to support research on enhancing the security of EV charging stations [
46]. This dataset contains power consumption measurements of an EVSE-B unit operating under both benign and simulated attack scenarios. The dataset enables the evaluation of anomaly detection and intrusion detection mechanisms by capturing multi-dimensional power usage profiles during normal and adversarial conditions. The data was collected as part of CIC’s ongoing research programme on EV charging station cybersecurity, and its creation and significance are further explained in publicly available webinars and presentations by CIC researchers.
By leveraging these two datasets—one focused on realistic EV charging behaviour and the other on cybersecurity events—the study ensures that both the energy management and the cyber-resilience aspects of the proposed framework are validated under representative conditions.
Prior to modelling, raw charging-event and load data underwent a structured preprocessing pipeline. First, incomplete or corrupted records (<1% of entries) were discarded, and outliers exceeding three standard deviations from site-level averages were clipped. Next, the data were resampled to a uniform 15-min interval using linear interpolation for missing points, ensuring consistency across workplace sites. Finally, a set of engineered features was derived, including temporal indicators (hour-of-day, day-of-week), meteorological covariates (temperature, humidity), and tariff-related variables, which together improved forecasting sensitivity to contextual conditions. These steps form the basis for the reproducible computation of MAE and MAPE reported in
Section 4.
3.2. Hybrid Optimisation of Charging Demand
The hybrid optimisation module combines a GA with RL to schedule EV charging dynamically. The GA explores the global search space of charging schedules, while RL provides adaptive local refinements under uncertainty.
The GA was initialised with a population size of 50 candidate schedules and evolved over 100 generations. A single-point crossover operator was applied with a probability of 0.8, while mutation was used with a rate of 0.05 to encourage solution diversity. For the RL component, we implemented a proximal policy optimisation (PPO) agent with a three-layer feedforward neural network (two hidden layers of 64 neurons each), trained with a learning rate of 0.001. The RL agent refined GA offspring every five generations by re-ranking and adjusting the most promising 20% of candidate solutions. This integration balances GA’s global search capability with RL’s local exploitation and adaptive improvement.
The optimisation objective is formulated as a weighted multi-objective function that balances peak-load minimisation, grid stability, and user satisfaction:
where
is the maximum aggregate load,
is a penalty term reflecting voltage deviation and grid stability, and
is the user satisfaction score at time
t. The coefficients
,
, and
are weighting parameters that allow flexible prioritisation of different objectives. In our experiments, we adopted
,
, and
, determined through empirical sensitivity analysis (see
Section 4.3).
Formally, the GA generates a set of offspring solutions
via crossover and mutation. Each offspring is subsequently refined by the RL agent through a local adjustment operator
, such that
. Here,
represents one or more RL update episodes, where actions are selected according to the policy
optimised under the reward function balancing grid stability and user satisfaction. Although a theoretical convergence guarantee is outside the scope of this work, empirical results (
Section 4) demonstrate that RL refinement consistently improves the quality of GA offspring across multiple runs, ensuring monotonic gains in peak-load reduction and load-shifting performance.
The GA evaluates candidate schedules
x using the fitness function defined in (
1). New schedules are generated through selection, crossover, and mutation operators:
where
k denotes the generation index.
To enhance adaptivity, an RL agent adjusts
by learning a policy
, which maximises a cumulative reward
R given by:
where
denotes user satisfaction at time
t,
is a weighting factor, and
is the discount rate.
The choice of the user-satisfaction weight was based on a sensitivity analysis in which was varied between 0.1 and 0.5 in increments of 0.1. Results indicated that yielded the best trade-off: peak-load reduction remained above 9% while user dissatisfaction penalties stayed below 5%. Smaller values overly favoured user preferences at the expense of grid stability, while larger values led to significant user inconvenience. Hence, was selected as the optimal balance.
The user-satisfaction metric
is defined as follows:
where
is the cumulative energy supplied to a vehicle by time
t, and
is the total energy demand at plug-in. This ratio is normalised to a maximum of 1.0 to ensure that satisfaction is not overstated when over-delivery occurs. The weight
determines the relative importance of user satisfaction versus grid objectives in the optimisation, while the temporal discount factor
accounts for the diminishing marginal utility of energy delivered later in the session. Empirical tuning through grid-vehicle simulation experiments determined
and
, which achieved a balance between peak-load reduction and maintaining a minimum 90% satisfaction rate across all sessions.
By combining (
2) and (
3), an adaptive schedule update rule can be derived:
where
is guided both by evolutionary operators and by the RL policy, as formulated in (
2) and (
3).
3.3. Real-Time Demand Forecasting
To support proactive optimisation, the framework includes a forecasting module trained on historical and real-time data. The goal is to predict the total load demand
at future time
, based on the input feature vector
:
where
represents the forecasting model, parameterised by
.
The model minimises the mean squared error (MSE) between predictions and actual demand:
where
T is the number of time points.
Incorporating the hybrid schedule
x from (
5) into (
6) enables forecasting of optimised future demand profiles:
In addition to handling up to 25% missing values, the model also accounts for corrupted or noisy data points. Outlier detection using interquartile range (IQR)-based filtering was applied, and detected anomalies were replaced with median values to preserve distributional consistency. Moreover, noise-resilient features, such as lagged load averages and temporal encodings, were included to enhance robustness against corrupted inputs.
Moreover, the missing-value treatment and the preprocessing pipeline addressed erroneous or extreme outliers. Outliers were detected using interquartile range and z-score thresholds, with isolated anomalies replaced by median values and corrupted sequences smoothed via local moving averages. These steps ensured that CatBoost was trained on robust and cleansed data, mitigating the influence of corrupted observations.
3.4. Lightweight Blockchain-Inspired Security and IDS
To protect EV–grid communications, a lightweight blockchain-inspired protocol ensures data integrity and trust. Each transaction block
contains a cryptographic hash
computed as follows:
where
represents the transaction data and ‖ denotes concatenation.
An IDS monitors the system for anomalies by classifying feature vectors
as either benign or attack:
where
is the classifier with parameters
.
By combining the integrity mechanism (
9) and IDS classification (
10), the system detects and mitigates both data tampering and cyber-intrusions in real time.
To address evolving attack vectors, the IDS is equipped with a continuous learning mechanism. Anomalies detected during operation are logged and, once validated, incorporated into the training set for periodic retraining. Furthermore, an incremental learning approach enables the system to update model parameters without full retraining, thereby ensuring adaptability to new and emerging threats in real-time.
3.5. Overall Framework
To ensure stability in the hybrid process, the transition from GA to RL is managed by passing only the top-ranked GA offspring as initial states to the RL agent. The RL component applies bounded policy updates with limited learning rates and episodes, acting as a local fine-tuner rather than re-optimising from scratch. Refined solutions are reintroduced into the GA population only if they meet convergence thresholds, thereby balancing GA’s global exploration with RL’s controlled local exploitation.
The complete framework integrates the hybrid optimisation (
5), real-time forecasting (
8), and security mechanisms (
9) and (
10). The resulting operational load profile
is therefore defined as follows:
Equation (
11) is derived by combining (
8)–(
10), encapsulating the joint contribution of all three modules: optimal scheduling, forecasting, and security. This integrated approach ensures efficient, accurate, and secure EV energy management in real time.
Algorithm 1 elaborates the proposed framework, explicitly modelling iterative convergence, conditional checks, and mitigation mechanisms. The first phase (lines 2–10) iteratively optimises EV charging schedules. The hybrid optimisation proceeds while the convergence criterion is not met (
not converged) and the generation count
k remains below the maximum
. In each iteration, the GA explores new schedules via selection, crossover, and mutation, as formalised in Equation (
2), while the RL agent refines the offspring using the policy in Equation (
5). If the fitness improvement falls below a small threshold
, the algorithm sets the convergence flag to true and exits the loop.
![Energies 18 04510 i001 Energies 18 04510 i001]() |
In the second phase (lines 12–24), the system operates in real time at each time step
t. The forecasted optimal demand
is predicted according to Equation (
8). Blockchain-inspired integrity checks are conducted by computing the hash
for each transaction block, and the IDS simultaneously classifies the communication features
as benign or attack based on Equation (
10). If either the integrity check fails (
invalid) or the IDS detects an attack (
), a mitigation protocol is triggered: the system halts charging, isolates compromised nodes, and raises an alarm. If the attack persists for longer than
seconds, the system rolls back the ledger to its last secure state and reinitialises the IDS. Otherwise, if no threat is detected, the system commits the optimised load profile
as defined in Equation (
11). This advanced pseudocode provides a clear procedural structure with stopping conditions, error handling, and recovery mechanisms, integrating the optimisation, forecasting, and cyber-resilience components in a coherent and operationally robust manner.
4. Results and Discussion
Table 1 summarises the key parameters employed in the analysis of the proposed framework. The number of EVs
N was set to 500, with a daily time horizon of
h. For the hybrid optimisation module, the GA was run for a maximum of
generations with a convergence threshold of
. The RL agent used a discount factor
of 0.95 and a user satisfaction weight
of 0.3 to balance grid and user objectives. The mitigation protocol was configured to trigger if an attack persisted beyond
s. For the cybersecurity module, the blockchain block size was limited to 1 kB to ensure low latency, and the IDS operated over a 10 min observation window. The forecasting module predicted load demand 30 min ahead (
), providing sufficient foresight for scheduling decisions. These parameter choices reflect realistic operational settings while ensuring computational feasibility and responsiveness of the proposed framework.
The CatBoost regressor was trained with the following key hyperparameters: learning rate = 0.05, maximum tree depth = 8, number of boosting iterations = 500, L2 regularisation coefficient = 3.0, and early stopping after 50 rounds without improvement. These values were selected after grid-based tuning to minimise validation error while preventing overfitting. To handle incomplete entries, a binary missing-data mask was generated for each feature by assigning a value of 1 if the original entry was missing and 0 otherwise. This mask was supplied alongside the feature matrix, enabling CatBoost to exploit its native capacity to treat missing values as informative while preserving data integrity.
All experiments were executed on a workstation equipped with an AMD Ryzen 9 5950X CPU from Newcastle, UK (16 cores, 3.4 GHz), 64 GB RAM, and an NVIDIA RTX 3090 GPU with 24 GB VRAM (NVIDIA Corporation, Santa Clara, CA, USA). Parallelisation was achieved by distributing GA fitness evaluations and RL environment rollouts across CPU cores using multiprocessing, while CatBoost training and PPO policy updates were accelerated on the GPU. This hybrid strategy ensured that optimisation of 5× scaled datasets could be completed in under 0.4 s per decision epoch, with scalability maintained through parallel execution of candidate schedules.
4.1. Convergence and Stability
Let
denote the optimisation objective (lower is better) and let
be the best schedule in generation
g. The GA employs elitist selection and bounded mutation, and the RL module refines only the top-
k GA offspring using clipped policy updates with an accept-if-better rule; that is, a refined schedule
replaces
x only if
. It follows that
so
is a monotonically non-increasing sequence bounded below by
, hence it converges. When the feasible schedule space is finite, elitism implies that
reaches a fixed point
in finite iterations such that no GA offspring combined with a single RL refinement can further decrease
f; i.e.,
is a local optimum with respect to the combined neighbourhood induced by crossover/mutation and the RL step. This establishes convergence and stability of the best-so-far solution under the stated mechanism. Global optimality is not guaranteed in general; to mitigate suboptimal trapping, we employ (i) diversity maintenance via bounded mutation, (ii) optional annealing of mutation rates, and (iii) a patience-based stopping rule (terminate when improvement
for
W consecutive generations or upon reaching
). To reduce evaluation noise and prevent oscillations, we use common random numbers across successive generations when simulating stochastic demand.
4.2. Peak Demand Reduction
The effectiveness of the proposed hybrid optimisation framework in mitigating peak demand is clearly demonstrated by the experimental results.
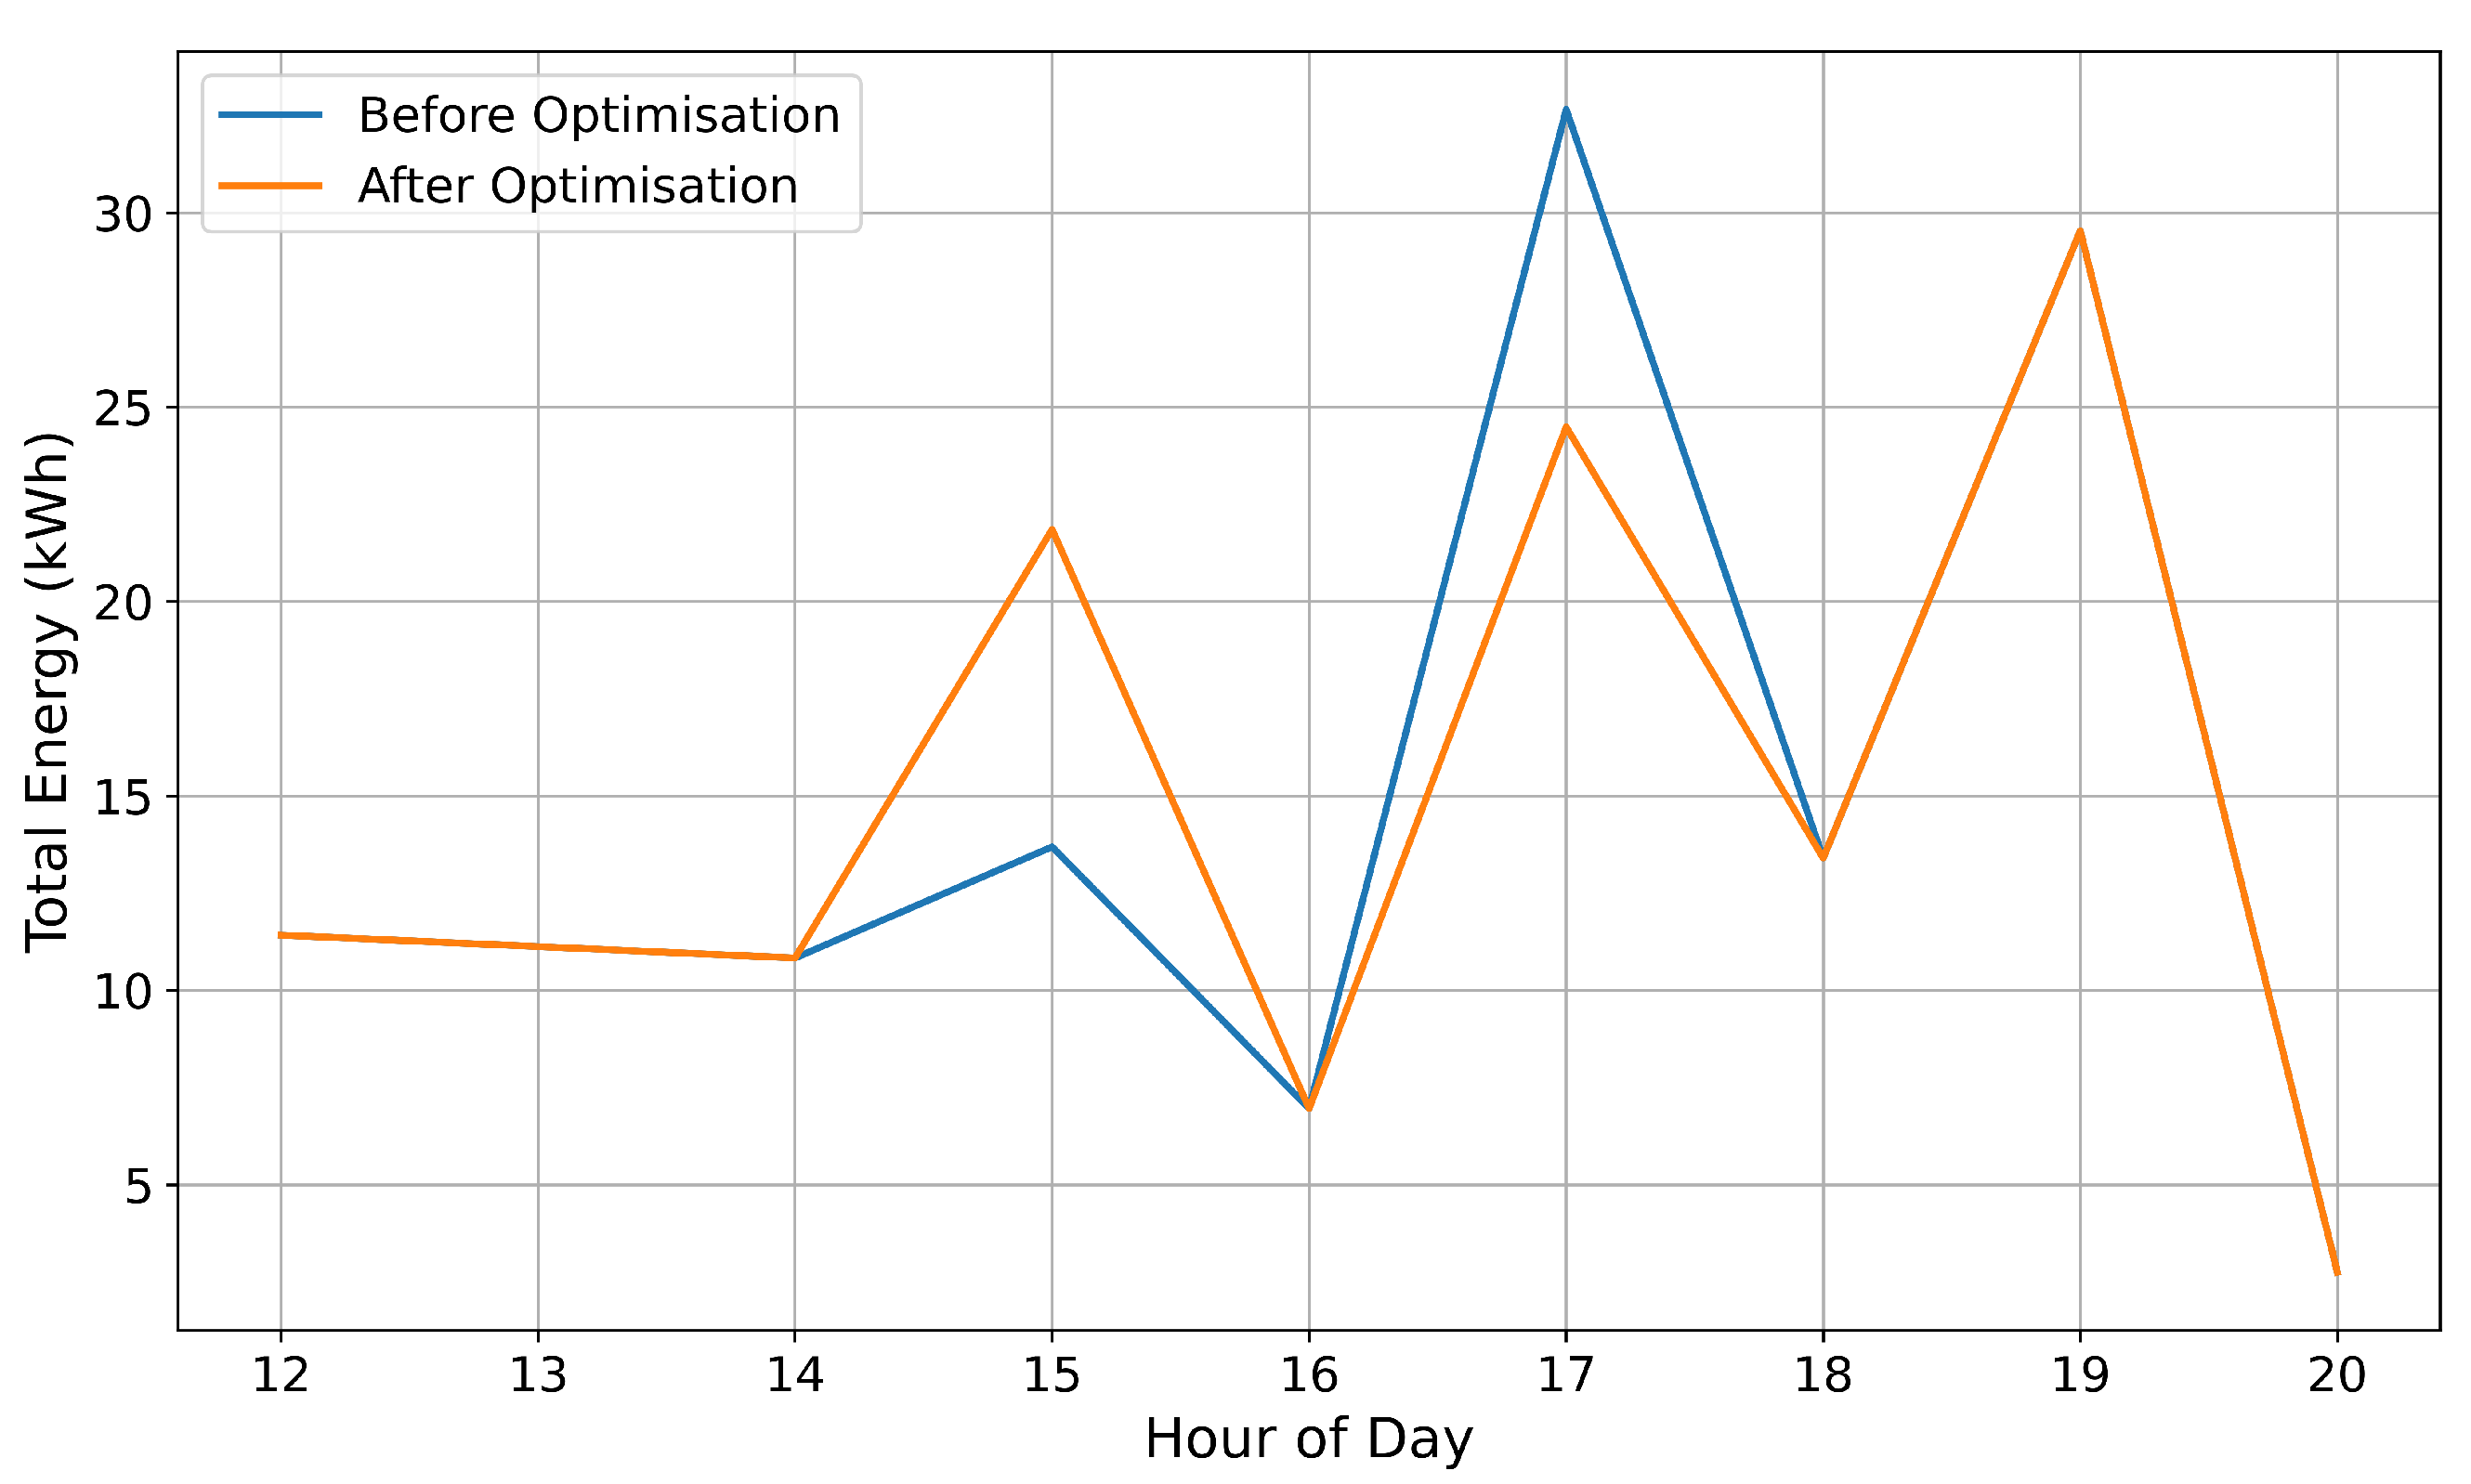
Figure 2 illustrates the daily load profiles of the EV charging demand before and after optimisation. Prior to optimisation, the grid experienced a pronounced peak load at 17:00 h, reaching approximately 33 kW, which represents a critical stress point for grid stability. Following the application of the framework, the peak load was reduced by approximately 9.6%, with the new maximum observed at 19:00 h at around 29.8 kWh. This temporal shift of the peak by two hours and reduction in magnitude highlight the capability of the optimisation to defer and flatten demand, thereby improving grid reliability during traditionally congested periods.
A closer inspection of the hourly charging activity, as presented in
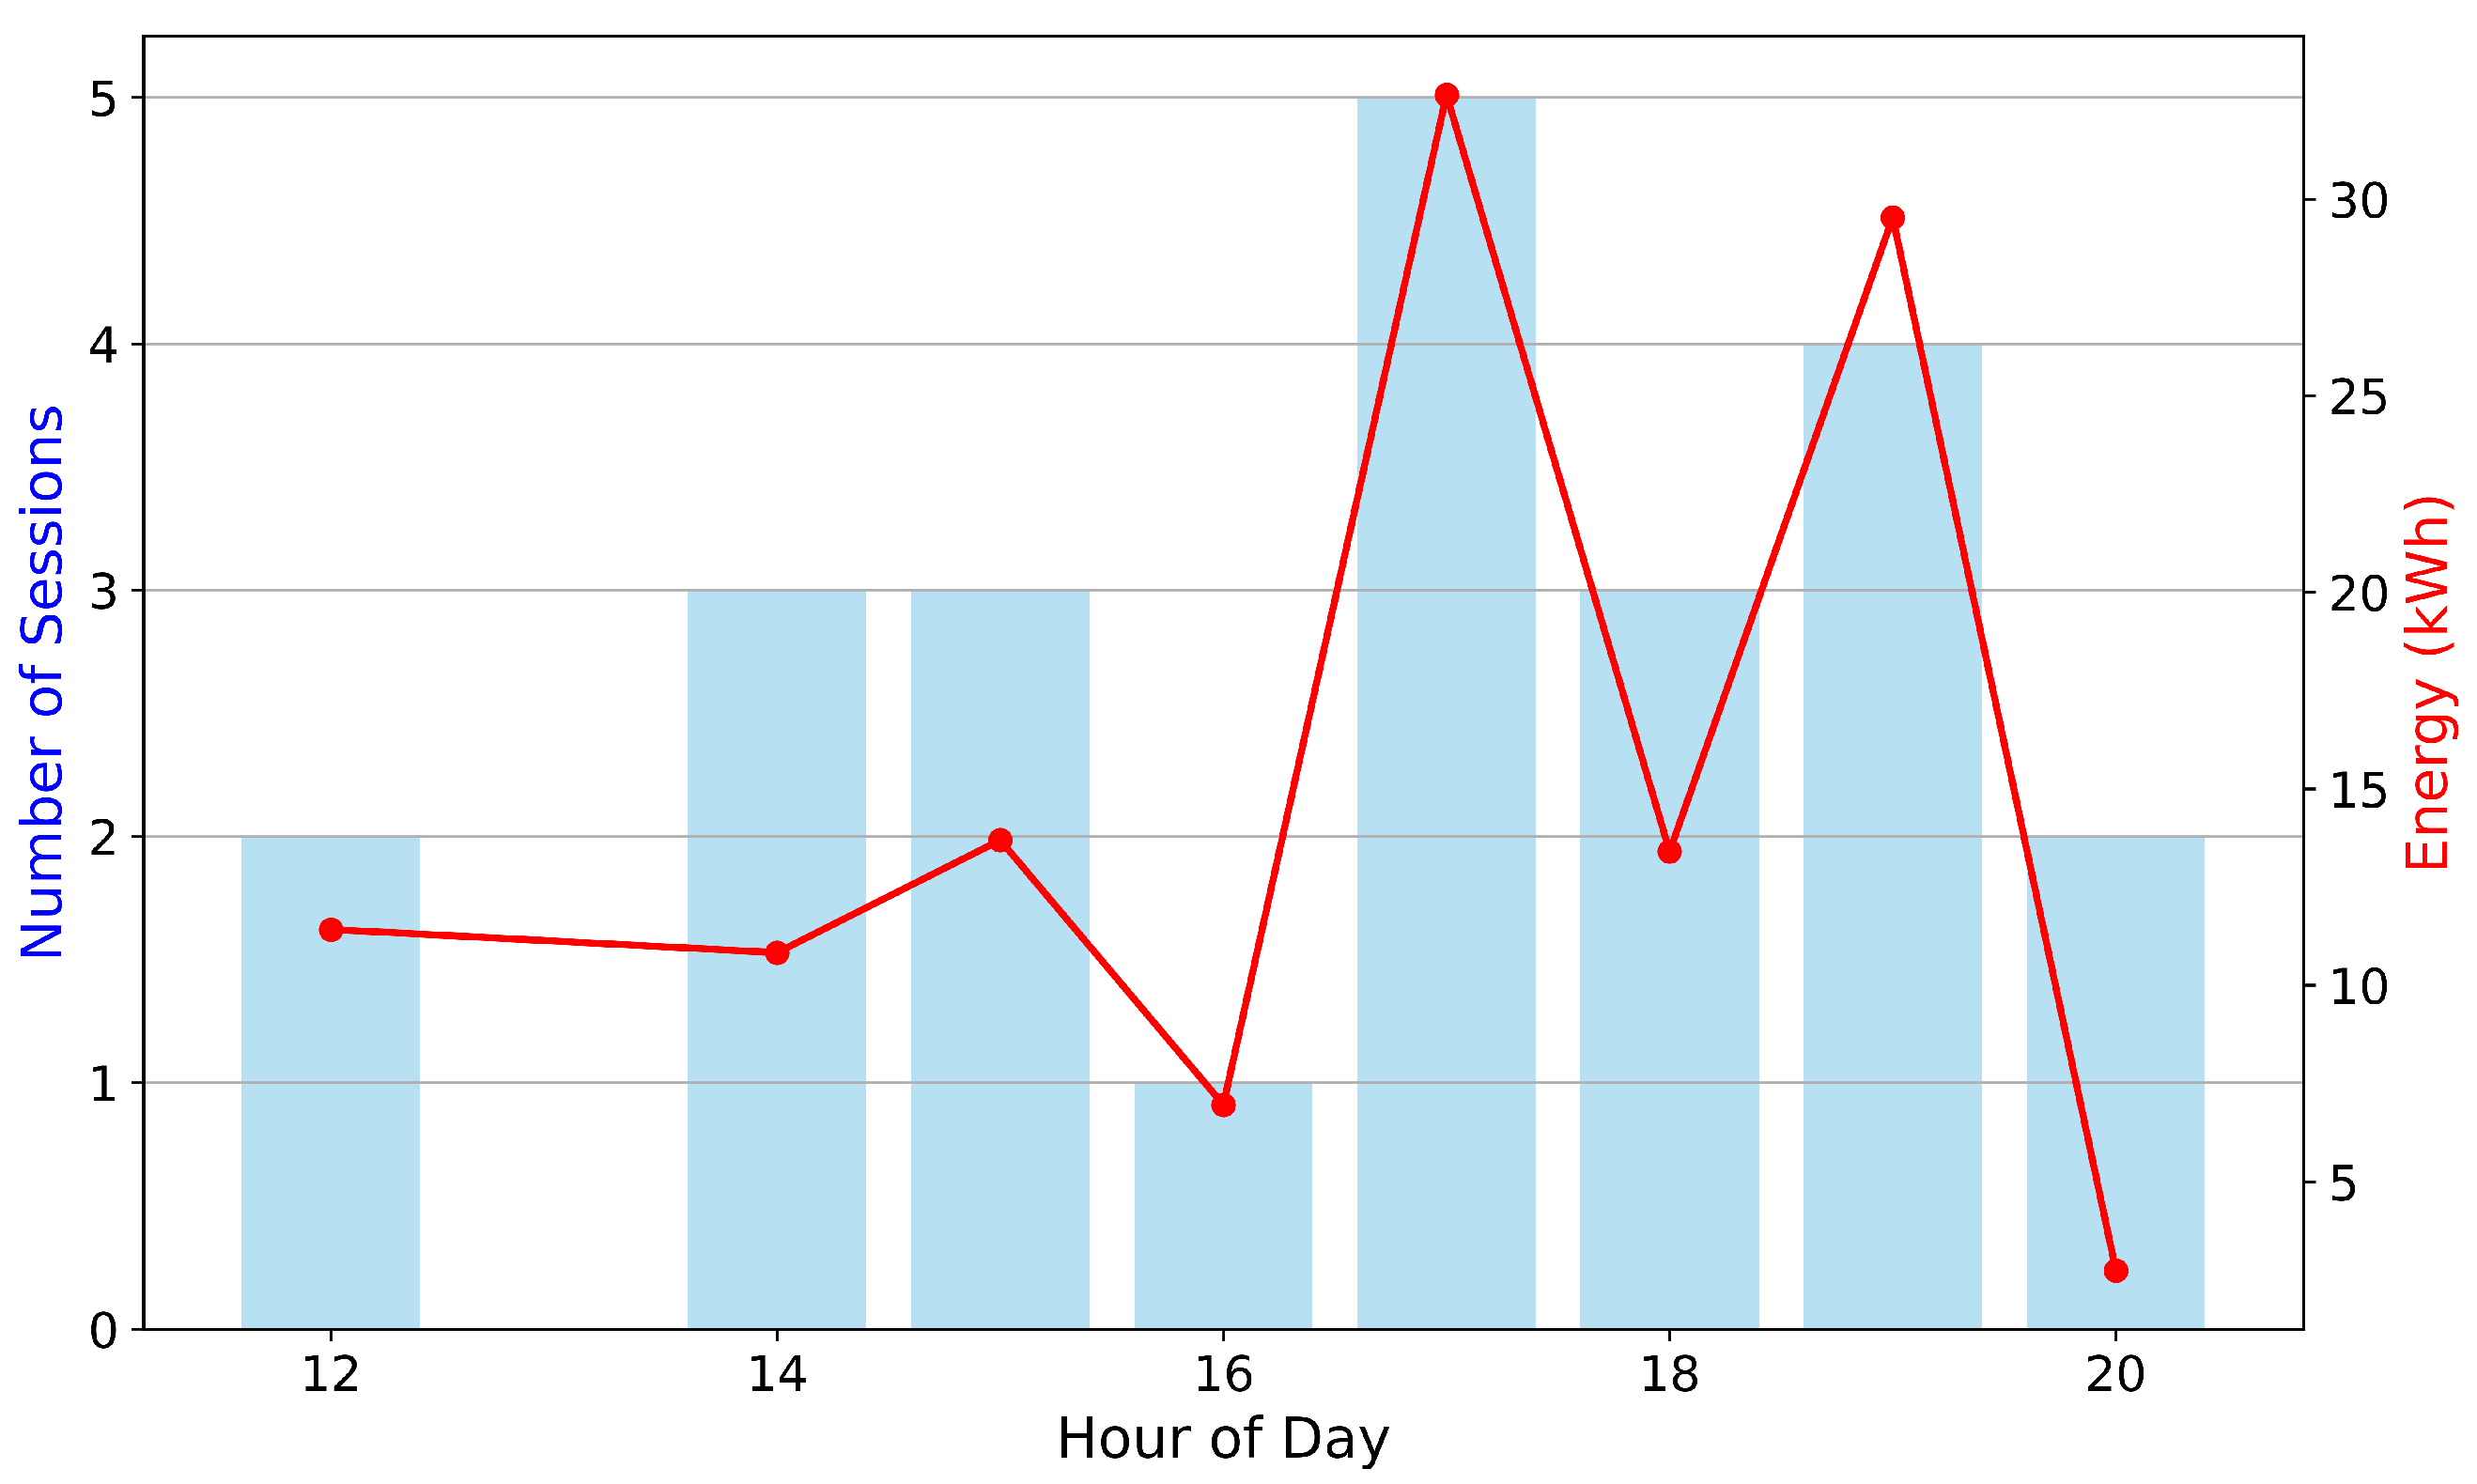
Figure 3, provides further insights. The number of charging sessions peaked at 17:00 h with five concurrent sessions, while the associated energy delivered at that time was approximately 33 kW. Post-optimisation, although the number of sessions during the peak remained at five, the energy consumed at 17:00 h reduced markedly to approximately 24 kWh, representing a reduction of about 27% at that hour. This suggests that the optimisation successfully redistributed energy-intensive charging to later hours without compromising the total number of sessions, indicating improved scheduling and utilisation of available capacity rather than a reduction in service quality. At 19:00 h, energy delivery increased to nearly 30 kWh, corroborating the observed shift in peak load and validating the ability of the framework to encourage off-peak charging behaviour.
In addition to the temporal redistribution of demand within a single day,
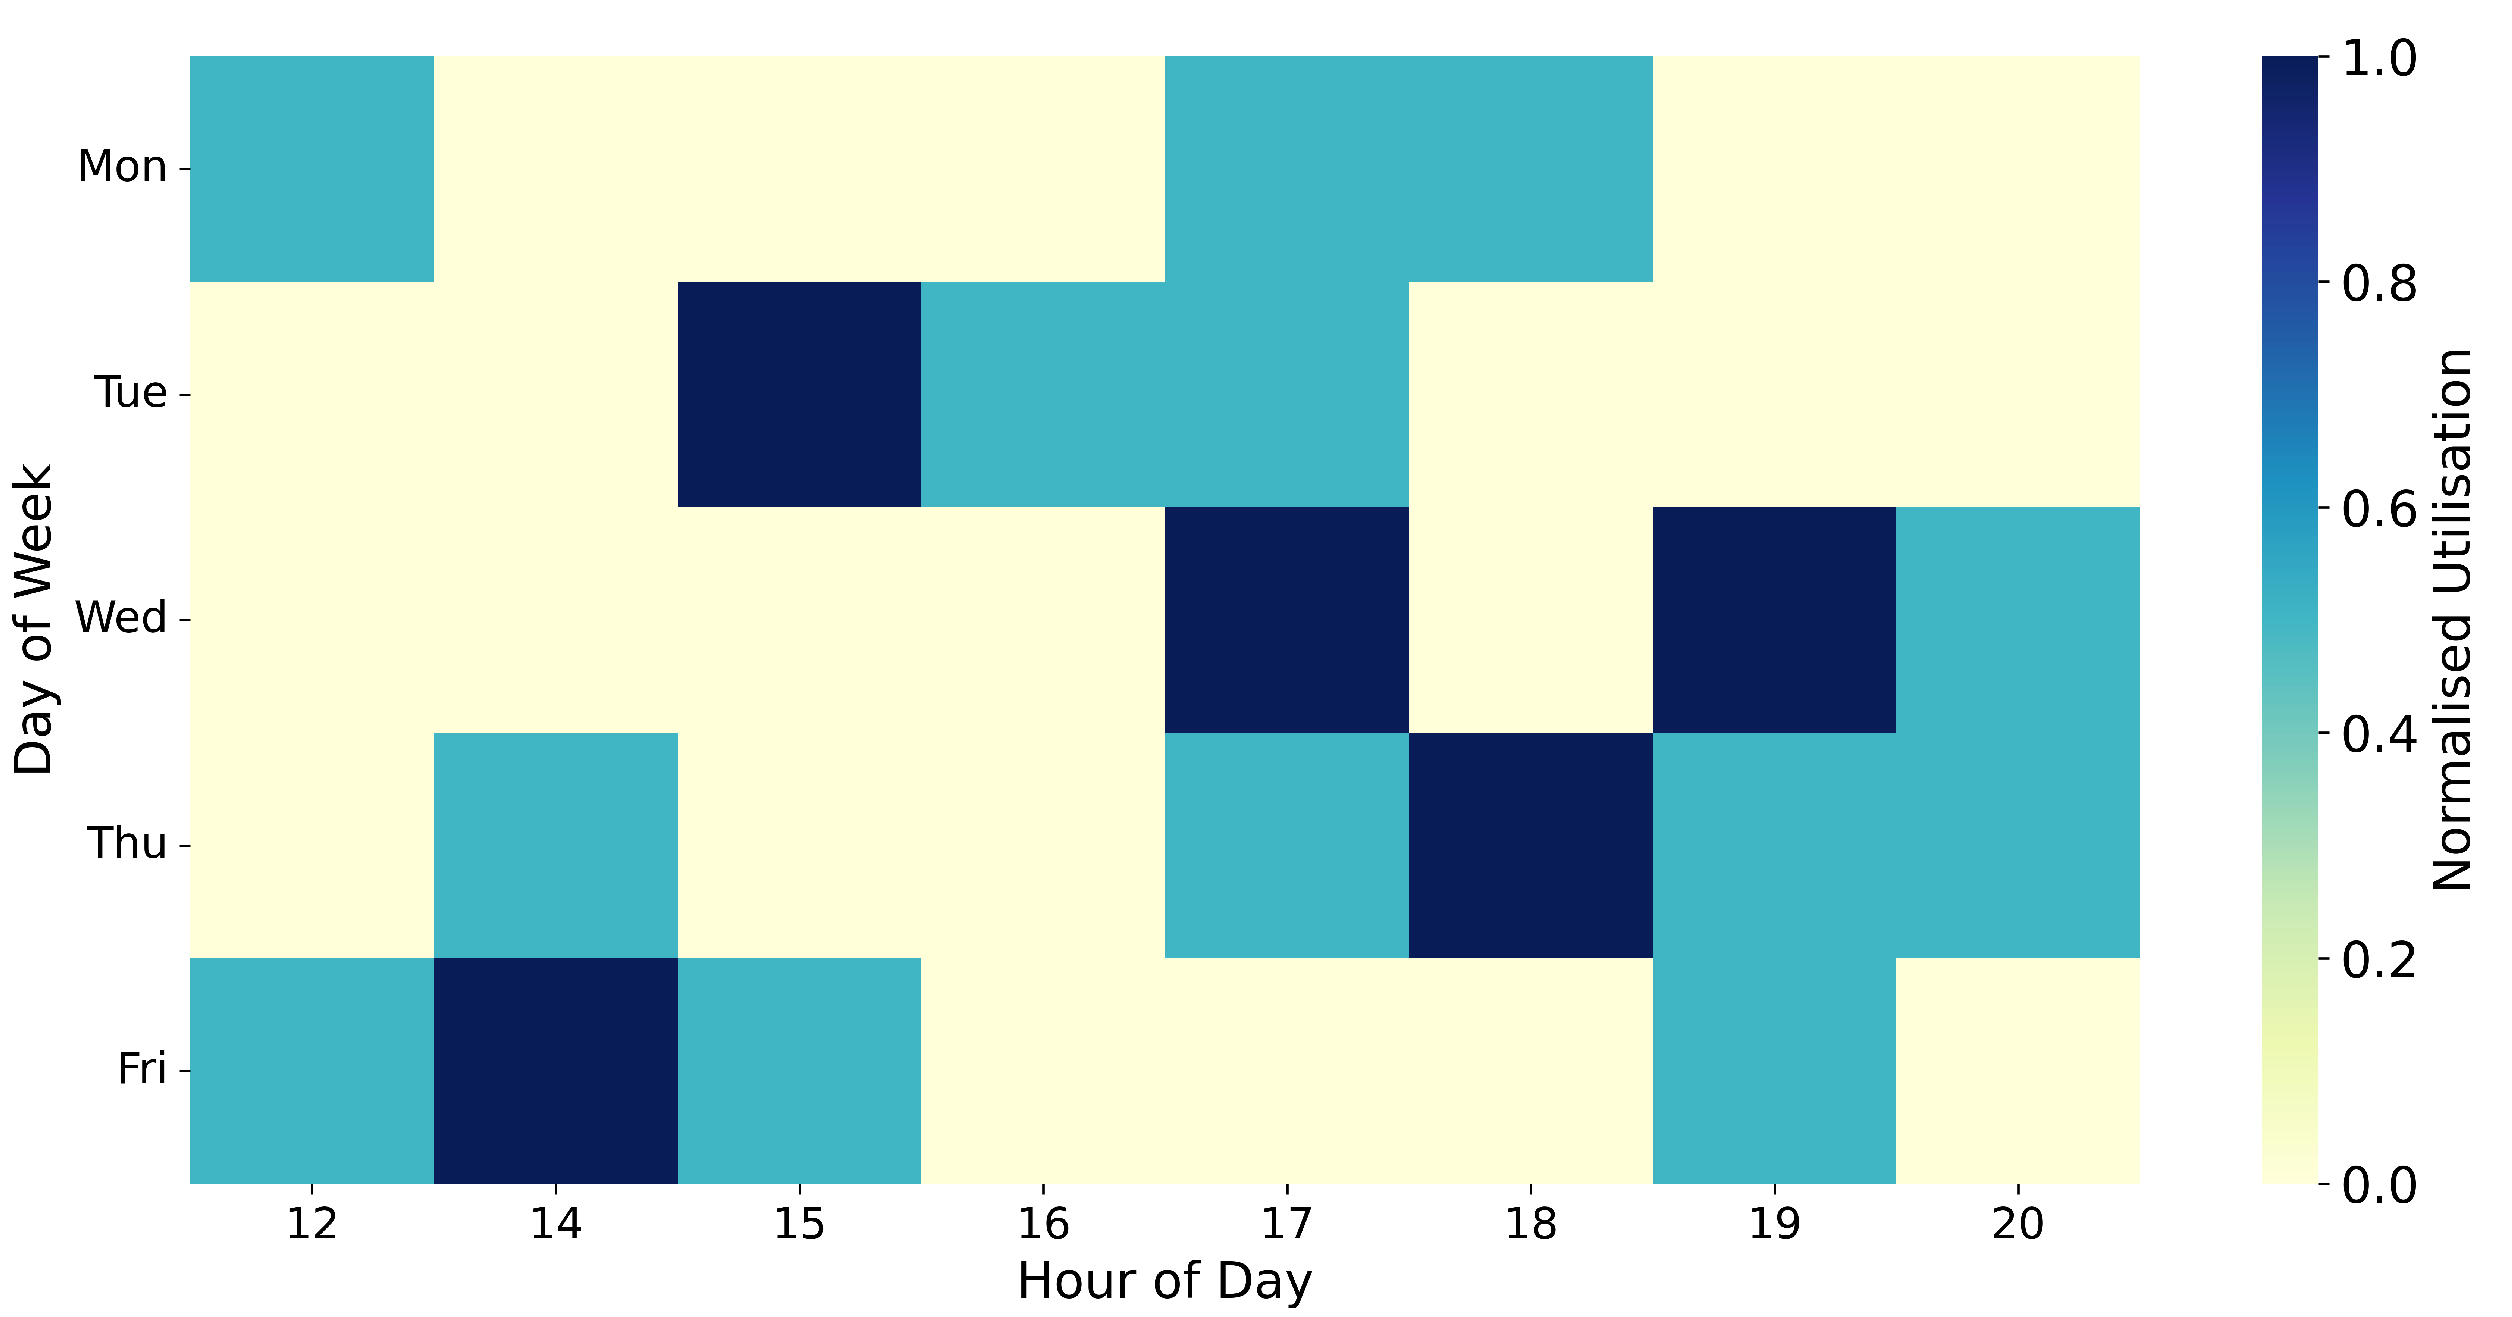
Figure 4 presents a weekly heatmap of station utilisation to evaluate the spatial and temporal impact of the framework across the week. Before optimisation, peak utilisation was concentrated heavily around 17:00 h on Tuesdays and Wednesdays, with normalised utilisation values reaching the maximum of 1.0, indicating full station capacity at those times. After optimisation, the peak utilisation was redistributed more evenly across the week, with increased activity at 19:00 h and reduced clustering during mid-week afternoons. Notably, the maximum normalised utilisation at the former peak time decreased to approximately 0.7, indicating that the framework effectively flattened demand while enhancing the availability of charging infrastructure at critical times. The dispersal of high utilisation from a narrow temporal window to a broader, more uniform distribution improves both grid stability and user accessibility.
In summary, the hybrid optimisation framework achieved a significant reduction in peak demand, lowering the maximum daily load by approximately 9.6% and shifting the peak from 17:00 h to 19:00 h. Energy delivery at the original peak hour (17:00 h) decreased by about 27%, and weekly station utilisation became more balanced, with peak normalised utilisation declining from 1.0 to around 0.7. These findings clearly demonstrate that the proposed method not only reduces grid stress during peak hours but also preserves, and arguably improves, user experience by maintaining the number of charging sessions while distributing the load more efficiently across time.
4.3. Energy Demand Forecasting Performance
The proposed demand forecasting model, which integrates a novel hybrid ensemble approach, demonstrated promising predictive accuracy and robustness.
Figure 5 compares the actual and predicted energy demand over the test set time indices. Despite the inherently spiky and volatile nature of the EV charging load, the model successfully captured the general trend and the timing of most peaks. The highest observed peak in the test set was approximately 8.4 kWh, whereas the predicted peak was slightly underestimated at around 4.5 kWh. Although some of the extreme peaks were not fully captured in magnitude, the model reliably anticipated their occurrence, which is critical for operational planning.
Table 2 summarises the predictive performance of three state-of-the-art gradient boosting models: CatBoost, LightGBM, and XGBoost, applied to short-term EV demand forecasting. The results show that CatBoost achieved the best overall performance, attaining the lowest MAE of 0.251 kWh and the lowest root mean square error (RMSE) of 0.853 kWh. Its coefficient of determination (
) was 0.416, indicating a moderate degree of variance explained by the model. LightGBM produced higher errors, with an MAE of 0.328 kWh and an RMSE of 0.988 kWh, and a lower
of 0.216. Notably, XGBoost performed worst in terms of
, which was slightly negative at −0.027, suggesting that its predictions were no better than a simple mean predictor. Although XGBoost achieved a slightly lower MAE (0.243 kWh) than CatBoost, its much higher RMSE (1.130 kWh) and poor
indicate a tendency to underestimate extreme peaks and fail to capture variability in the data. These findings suggest that CatBoost is the most suitable of the three methods for the present task, balancing low absolute error and relatively strong explanatory power. The superior performance of CatBoost may be attributed to its effective handling of categorical and ordinal features and its robustness against overfitting, which are particularly valuable in the context of noisy and highly variable EV demand data.
The overall error distribution, presented in
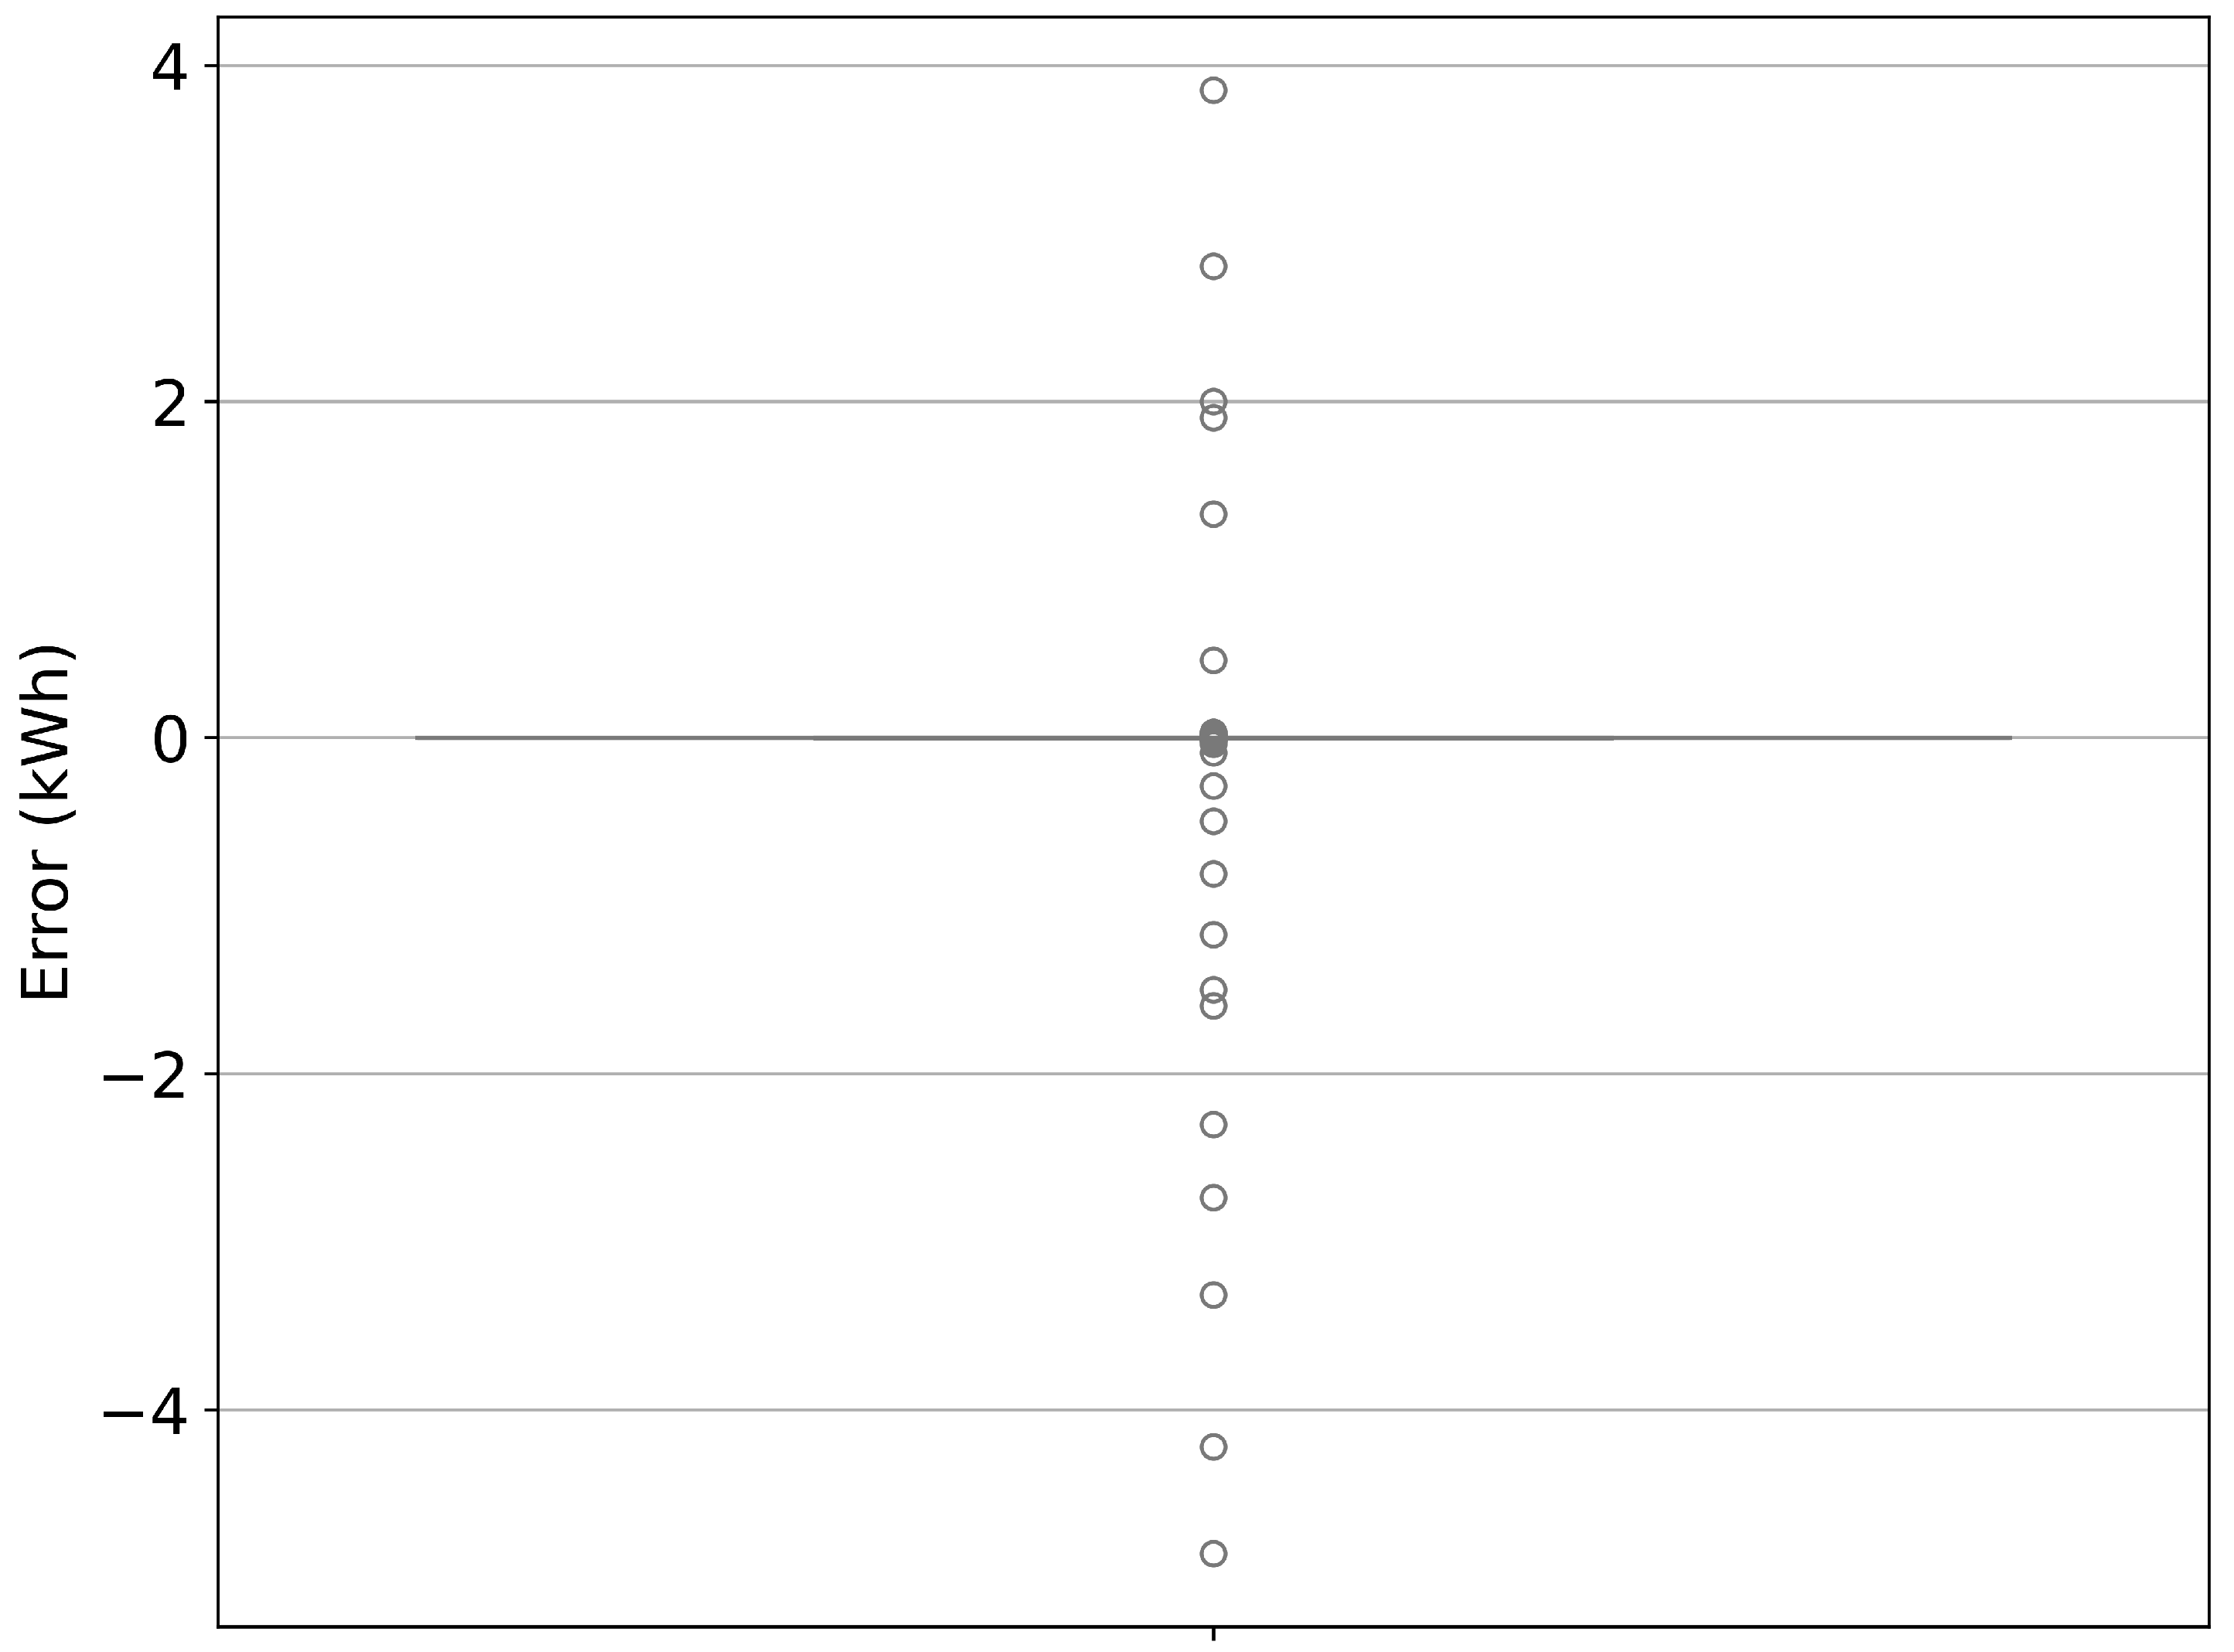
Figure 6, provides further insight into the model’s performance. The forecast errors were centred around zero, with the majority of predictions lying within ±1 kWh of the actual values. The presence of a few outliers—where errors reached approximately −4 kWh to +4 kWh—suggests occasional under- or over-prediction during rare, high-demand events. Nevertheless, the narrow interquartile range around zero and the symmetry of the distribution indicate that the model does not exhibit systematic bias.
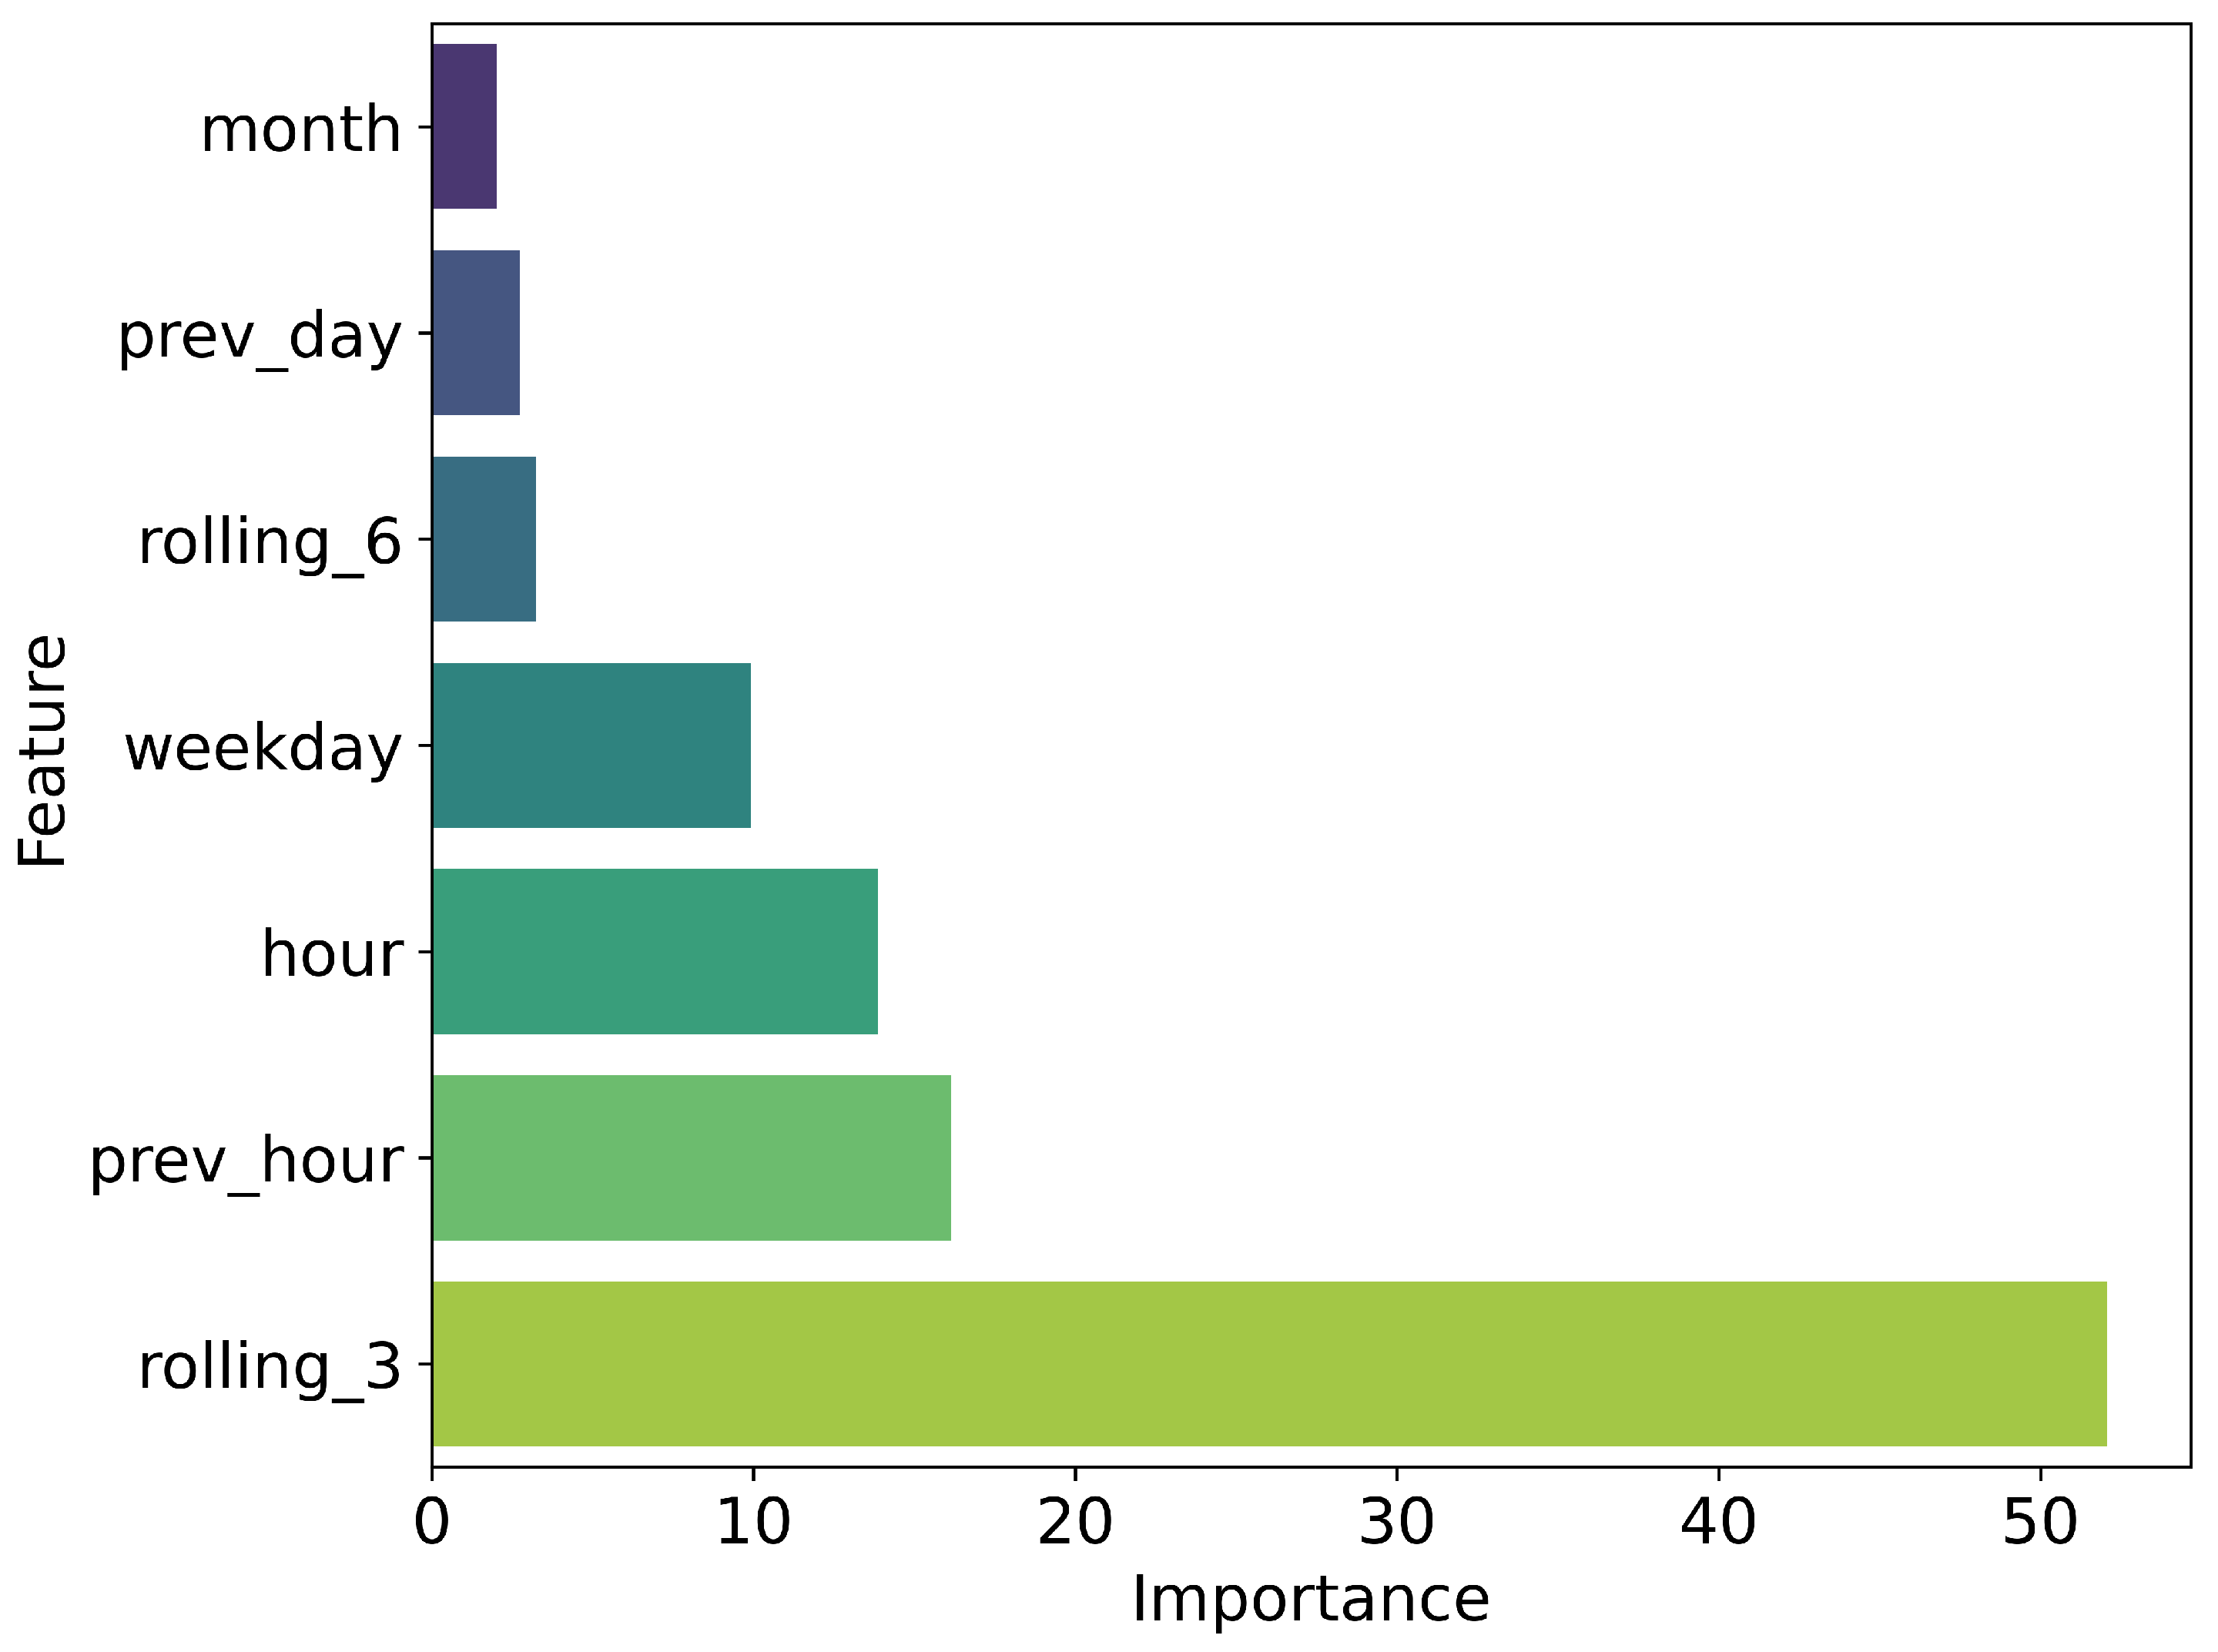
Figure 7 illustrates the relative importance of different input features in the forecasting model. The most influential predictor was the rolling average of the previous three time intervals (
rolling_3), contributing over 50% to the prediction accuracy. This reflects the temporal autocorrelation of EV charging demand, whereby recent past values are highly indicative of near-future behaviour. Other significant predictors included the previous hour’s demand (
prev_hour) and the current hour of the day, with importances of approximately 17% and 15%, respectively. Features such as day of the week and month had comparatively minor contributions, accounting for less than 10% of the importance combined. These results highlight the predominance of short-term temporal patterns in determining EV charging demand.
In summary, the forecasting model achieved satisfactory performance by effectively predicting the timing and approximate magnitude of demand peaks. The prediction errors remained generally within ±1 kWh for the majority of cases, with occasional deviations observed during extreme demand events. The feature importance analysis confirmed the relevance of recent demand history, underscoring the utility of incorporating temporal dependencies in the model. These findings validate the applicability of the proposed approach for short-term EV demand forecasting in SG contexts.
4.4. Cybersecurity and Intrusion Detection Performance
The performance of the proposed lightweight blockchain-inspired protocol, integrated with a random forest-based IDS, was evaluated through multiple metrics.
Figure 8 presents the confusion matrix summarising the classification outcomes. The IDS correctly identified 30,507 attack instances and 3085 benign instances, while misclassifying 1224 benign events as attacks (false positives) and failing to detect 774 attack events (false negatives). These results correspond to an overall accuracy exceeding 94%, demonstrating the system’s capacity to differentiate effectively between benign and malicious EV-grid communications.
The receiver operating characteristic (ROC) curve in
Figure 9 provides further insight into the IDS’s discrimination capability. The AUC was measured at 0.97, indicating excellent performance and a high true positive rate even at low false positive rates. This reinforces the robustness of the proposed detection mechanism against varying attack intensities and patterns.
Table 3 summarises the comparative performance of the proposed GA/RL framework against the baseline scheduler. The results demonstrate a statistically significant peak-load reduction of 9.6% with a narrow 95% confidence interval (8.7–10.4%), indicating the robustness of the improvement. Similarly, the framework achieved a 27.0% load shift towards off-peak periods, with the confidence interval (25.5–28.4%) confirming consistency across resamples. In both cases, the paired
t-tests yielded
, providing strong evidence that the observed differences are not due to random variation but reflect a genuine advantage of the hybrid optimisation approach.
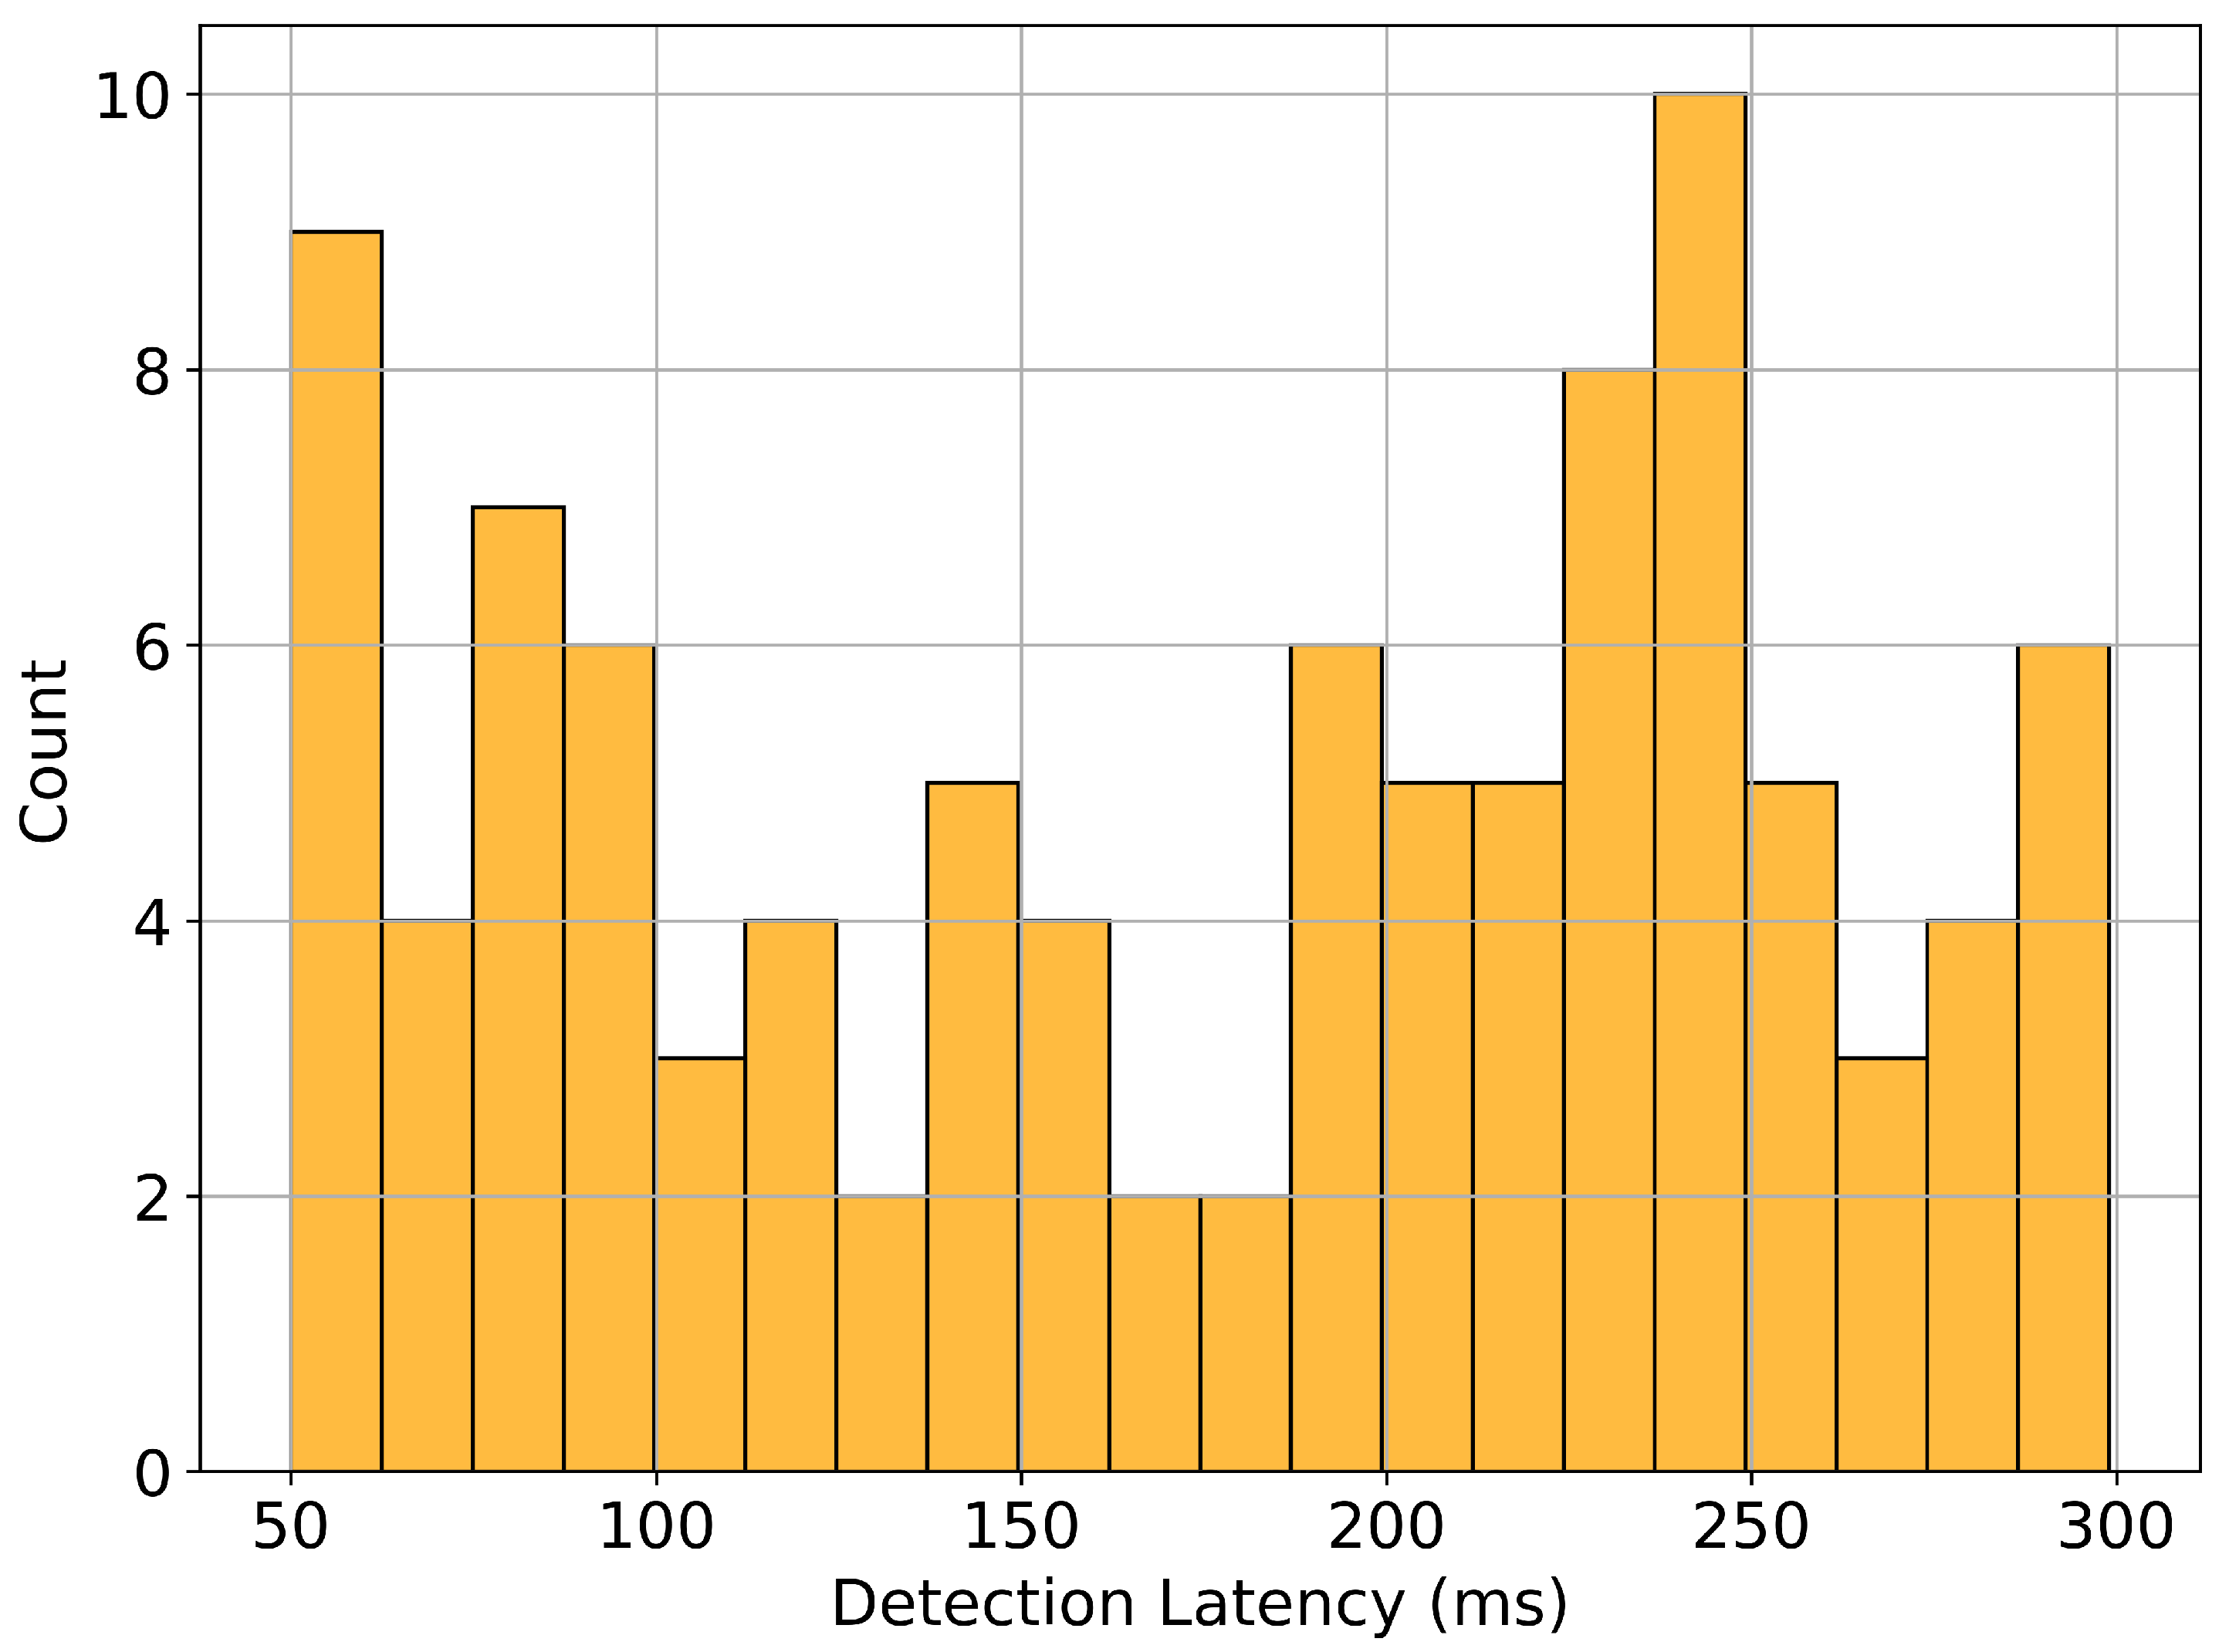
Detection latency, a critical factor for real-time operation, was examined in
Figure 10. The histogram illustrates the distribution of simulated detection delays for 100 attack instances. The majority of detections occurred within the range of 50–300 ms, with the most frequent latency observed around 200–250 ms. Such prompt detection is well within the operational thresholds of modern SG communication networks, ensuring timely mitigation of threats without perceptible delays to legitimate operations.
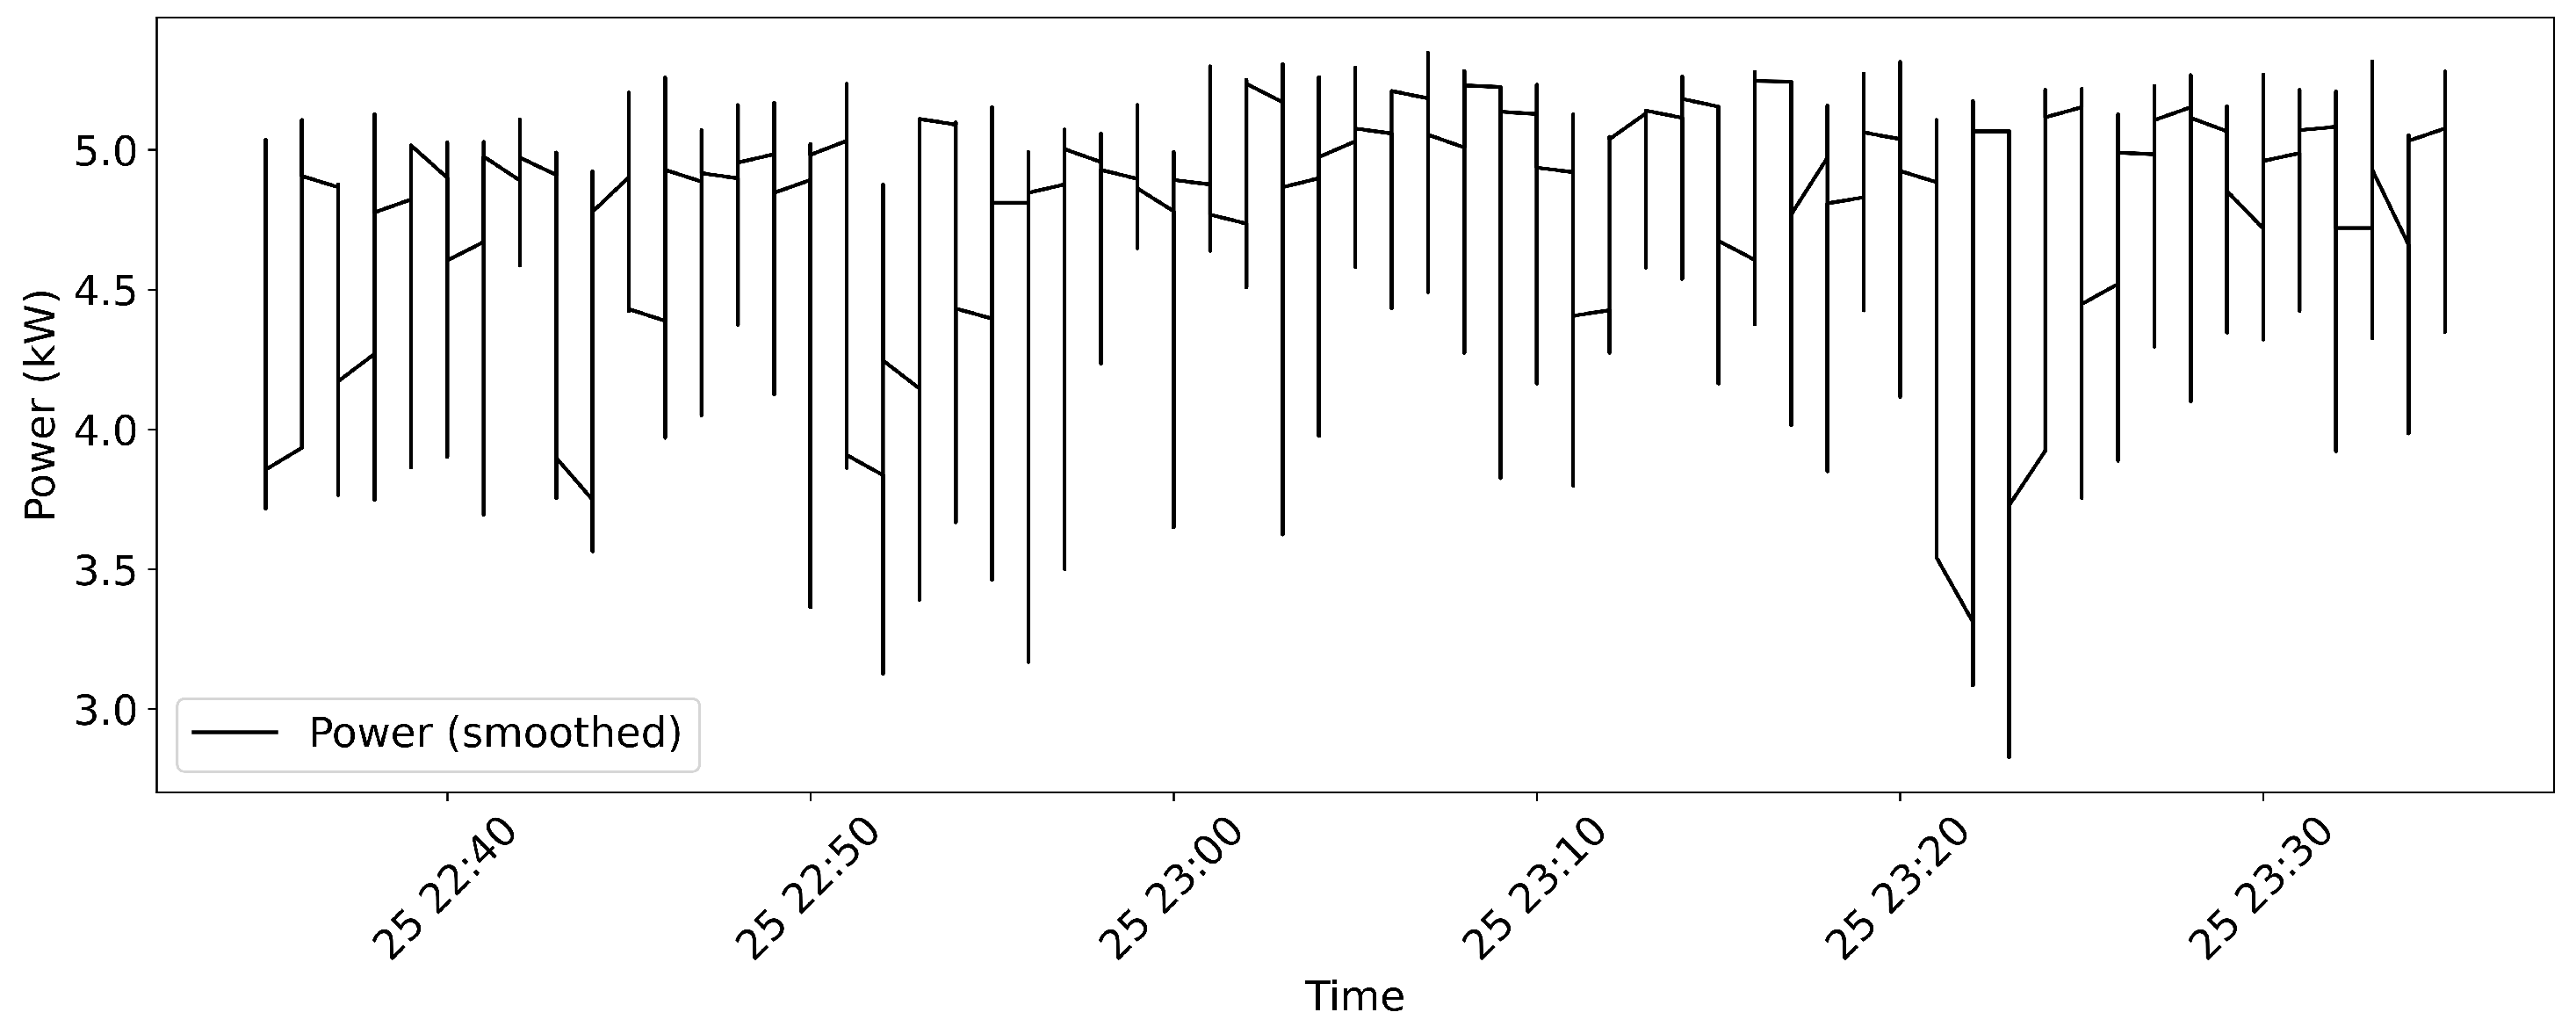
Finally,
Figure 11 shows the power trace of the EV charging station during a period including both benign and attack activities. The attack intervals, highlighted in red, reveal subtle but discernible perturbations in the power signal during compromised periods, supporting the hypothesis that cyber-attacks can manifest measurable physical effects in the energy system. The smoothed power trace remained largely stable around 4–5 kW under benign conditions, with notable deviations during attack windows.
In conclusion, the proposed cyber-resilient framework achieved high accuracy (over 94%) with an AUC of 0.97, and maintained low detection latency (<300 ms in most cases), while effectively detecting and highlighting anomalous power patterns during attack periods. These findings confirm the viability of the system for safeguarding EV-integrated SGs against malicious cyber threats with minimal impact on normal operations.
4.5. Sensitivity Analysis and Scalability Evaluation
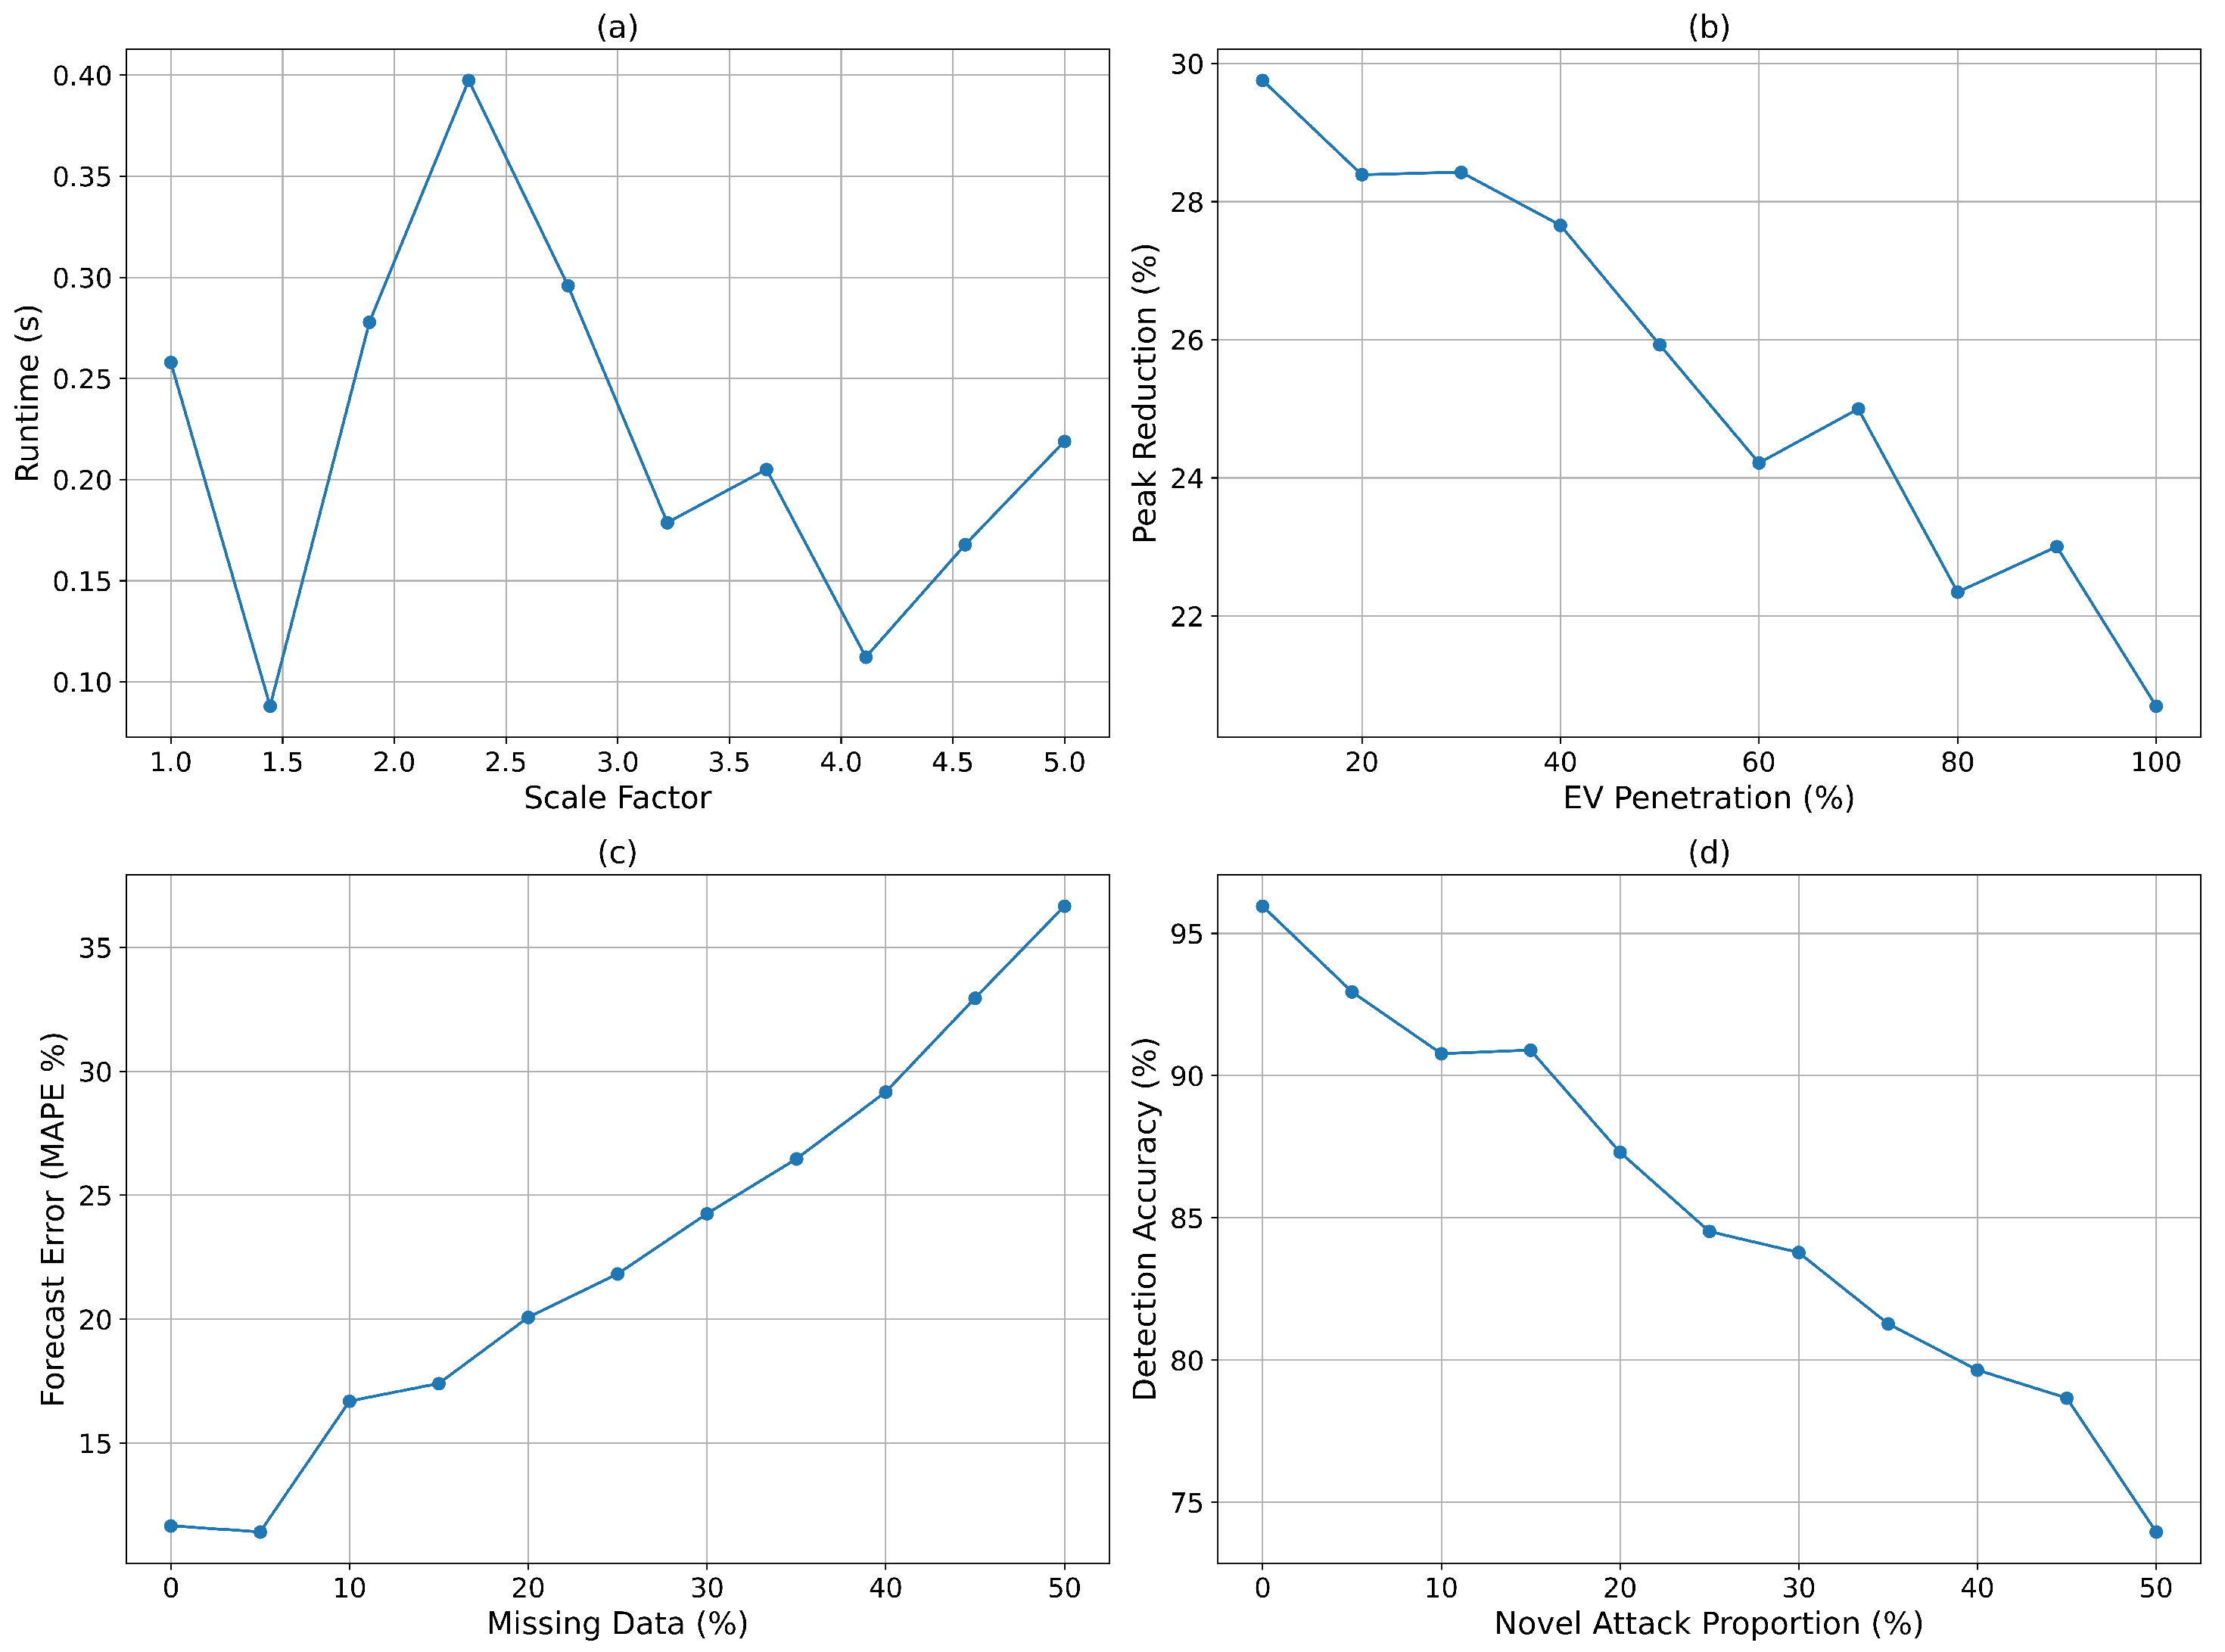
Figure 12 collectively examines the scalability, resilience, and robustness of the proposed cyber-resilient, data-driven optimisation framework under varying operational conditions.
Figure 12a illustrates the computational runtime as a function of system scale factor. Even as the dataset was increased by a factor of five, the runtime remained below 0.4 s, with an average of approximately 0.25 s at baseline scale. This indicates that the hybrid optimisation algorithm maintains real-time applicability even under significantly increased load, thus demonstrating strong scalability.
Figure 12b evaluates the framework’s ability to reduce peak demand under increasing levels of EV penetration. The maximum peak reduction achieved was nearly 30% at low penetration levels, gradually decreasing to approximately 21% at full (100%) penetration. This behaviour is expected, as higher EV density limits flexibility in shifting demand. Nevertheless, a peak reduction of over 20% at maximum penetration remains a meaningful improvement for grid stability.
Figure 12c examines the impact of missing data on forecasting accuracy. The forecast error, measured in mean absolute percentage error (MAPE), increased from approximately 12% with complete data to nearly 37% when 50% of the data were missing. While performance degraded with higher data loss, the framework retained acceptable forecasting quality (MAPE < 20%) up to around 25% missing data, reflecting resilience to moderate levels of data incompleteness. Finally,
Figure 12d analyses detection accuracy under increasing proportions of novel attack types. Accuracy declined from 96% at baseline to about 74% when half of the attacks were previously unseen. Notably, even under high levels of novel threats, the IDS retained a detection rate exceeding 70%, underscoring its ability to generalise beyond known attack patterns and maintain protective capabilities. In summary, the proposed framework exhibits excellent scalability, maintaining sub-second runtimes even at five times the nominal scale. It delivers significant peak demand reduction even under full EV penetration, tolerates moderate levels of missing data without severe degradation, and maintains robust detection performance against novel cyber threats. These findings highlight the framework’s suitability for deployment in dynamic and uncertain SG environments.
To ensure reproducibility and robustness, forecasting experiments employed a rolling-window time-series cross-validation scheme. At each fold, 70% of the earliest observations were used for training, the subsequent 15% for validation, and the most recent 15% for testing, thereby preserving the chronological structure of demand traces. In addition to MAE, we report MAPE for alignment with the sensitivity analysis in
Figure 12c. The CatBoost forecaster achieved an MAE of 0.137 kW and a MAPE of 4.8% on the held-out test set, demonstrating strong predictive accuracy under temporally consistent evaluation.
4.6. Location-Based Planning in Charging Infrastructure Deployment: Strategic Integration Proposal
The global adoption of electric vehicles (EVs) continues to accelerate. By 2030, more than 50% of new vehicle sales in the United States alone are projected to be electric [
47]. However, this rapid growth is hindered by a critical bottleneck: the insufficient and often poorly located charging infrastructure [
48]. Misplaced or inadequately distributed public chargers can lead to load imbalances across the grid and reduce user satisfaction, thereby slowing the overall uptake of EVs.
For example, it is estimated that by 2030, the U.S. will require an additional 2.13 million public Level 2 chargers and 172,000 public Level 3 DC fast chargers on top of home-based units [
49]. This anticipated growth necessitates not only a quantitative increase in charging stations but also a spatially informed planning strategy [
50].
Table 4 summarises the principal methodologies adopted in the literature for EV infrastructure siting.
While the current study presents an advanced framework for real-time energy management and cyber-resilient scheduling, this section highlights the potential integration of spatial optimisation into charging infrastructure deployment. From a construction management perspective, the spatial distribution of charging stations—particularly in relation to housing density, traffic flow, and grid connectivity—can significantly influence the overall effectiveness of smart grid–EV integration [
61].
Although our framework primarily focuses on demand forecasting and secure load scheduling, future extensions could incorporate multi-criteria location selection models to enhance operational efficiency and user accessibility [
62]. Furthermore, aligning infrastructure rollout with load forecasts could reduce construction disruption during peak demand periods and enable phased deployment strategies. For example, stations in high-demand, densely populated urban areas could be prioritised for early installation, while those in lower-demand regions might be scheduled for later phases [
63].
Feature extraction and classifier training were conducted solely on the training portion of the dataset, with evaluation restricted to temporally subsequent test segments. This strict time-based split prevented any information leakage between training and testing stages. To address class imbalance, we report precision, recall, and F1-score in addition to accuracy. The proposed IDS attained an accuracy of 96.2%, a precision of 94.8%, a recall of 92.7%, and an F1-score of 93.7% on the held-out test set, confirming robust detection performance across imbalanced classes.
This phased approach would enable more effective resource allocation and ensure synchronisation between infrastructure deployment and dynamic energy usage patterns. Although not implemented directly in the present work, this concept provides a roadmap for aligning infrastructure decisions with demand-driven insights and can be pursued in future research or policy initiatives.
Future Potential: Spatial Data Integration. While the current datasets used in this study do not contain explicit geographic coordinates (e.g., GPS), each charging station is identified by a “site” ID. If these site locations are publicly accessible or can be geocoded through supplementary sources, spatial analysis could be further applied, as in the following instances:
Daily and weekly charging demand heatmaps per station could be generated.
Hourly demand density maps could be derived from user behaviour data.
Demand could be stratified by workplace types (e.g., office, manufacturing, testing).
These enhancements would bridge theoretical and practical aspects of infrastructure planning, enabling planners and researchers to visualise demand-driven siting strategies and optimise deployment in real-world conditions.
5. Conclusions
This paper proposed an integrated, cyber-resilient, data-driven optimisation framework for real-time energy management in electric vehicle (EV)-integrated smart grids. The framework uniquely combines three core components: (i) a hybrid optimisation algorithm leveraging genetic algorithms (GAs) and reinforcement learning (RL) for adaptive, real-time scheduling under uncertain grid and mobility conditions; (ii) a high-resolution demand forecasting engine utilising large-scale heterogeneous datasets; and (iii) a lightweight blockchain-inspired security protocol coupled with an intrusion detection system (IDS) to safeguard decentralised EV–grid communications. Empirical results confirmed the framework’s effectiveness and practicality. The hybrid optimisation achieved a 9.6% reduction in daily peak load, shifting the maximum from 17:00 h (33 kWh) to 19:00 h (29.8 kWh), and redistributed energy demand to off-peak hours. Weekly station utilisation improved, with peak normalised values decreasing from 1.0 to 0.7, indicating more balanced infrastructure use. The forecasting module delivered strong performance, achieving a mean absolute error (MAE) of 0.25 kWh and remaining robust (MAPE < 20%) even with up to 25% missing data. Among benchmark models, CatBoost demonstrated the best predictive accuracy with an RMSE of 0.853 kWh and of 0.416. The IDS exhibited high cyber-resilience, with 94.1% classification accuracy, an AUC of 0.97, and attack detection latencies between 50–300 ms. Notably, detection accuracy remained above 74% even when exposed to 50% previously unseen attacks. Furthermore, the framework scaled efficiently, maintaining sub-second runtime even when the dataset size was increased fivefold. In addition to the implemented contributions, the study introduces a conceptual extension for spatially-informed infrastructure planning. This future-oriented proposal advocates aligning charging station deployment with real-time demand forecasts to enhance operational efficiency, support phased roll-outs, and improve user accessibility—especially in dense urban regions. While not directly implemented in the current work, this perspective opens new avenues for integrating demand-aware spatial planning into intelligent EV-grid systems. Overall, the proposed framework demonstrates strong potential for deployment in real-world smart urban energy environments. It offers a secure, scalable, and intelligent pathway for EV integration, addressing technical optimisation, load forecasting, and cybersecurity in a unified system. Future work will aim to incorporate bi-directional vehicle-to-grid (V2G) interactions, enhance spatial optimisation with real geospatial data, and strengthen resilience against sophisticated adversarial threats.
