1. Introduction
Hydrogen, as a clean and versatile energy carrier, plays a pivotal role in global decarbonization efforts and the transformation of energy systems. Its potential for widespread use in transportation, industrial processes, and power generation has been increasingly recognized by international initiatives, such as the IEA Hydrogen Technology Collaboration Program, and national strategies, including China’s “Medium-Term and Long-Term Plan for Hydrogen Energy Industry Development (2021–2035)”. Within this context, the transportation of hydrogen-blended natural gas (HBNG) has emerged as a key strategy for cost-effective hydrogen delivery. This is primarily achieved through three main approaches: overhead pipelines, buried pipelines, and underground utility tunnel [
1], as specified in GB50838-2015 [
2], in which statistics show that 35% of urban gas pipelines in China are now integrated into utility tunnels.
In contrast to open-space configurations, utility tunnels are confined environments where spatial constraints significantly alter risk profiles. Pipeline leakage within these enclosed gas compartments can quickly result in the hazardous accumulation of combustible mixtures, thereby substantially increasing explosion risks due to limited dispersion pathways. This risk is further amplified in the case of HBNG, as hydrogen’s flammability range (4–75% vol) is significantly wider than natural gas (5–15% vol), increasing the likelihood of explosive mixtures by approximately 40% under identical leakage conditions [
3]. As the deployment of HBNG in utility tunnels expands globally, understanding the dynamics of leakage in confined spaces and developing effective ventilation strategies have become urgent safety priorities.
To date, both domestic and international scholars have conducted extensive research on the leakage and diffusion behaviors of natural gas pipelines, covering a wide range of installation scenarios, including direct-burial and utility tunnel installations. Quantitative analyses have been performed on the diffusion behavior following leakage in underground utility tunnels [
4,
5] and buried natural gas pipelines [
6,
7,
8]. Additionally, researchers [
9,
10,
11,
12] have examined various factors influencing pipeline leakage, such as leak size, pipeline pressure, leak location, installation conditions, and environmental parameters like wind speed and temperature.
Regarding HBNG pipelines, research by experts and scholars [
13,
14,
15,
16,
17,
18] has primarily focused on leakage and diffusion of HBNG in buried pipelines. Computational fluid dynamics (CFD) simulations have been employed to study the influence of factors such as HBR, soil properties, pipeline pressure, and leak size on gas leakage and explosion [
19,
20]. For instance, Wang and Tian [
21] numerically studied the leakage and diffusion of hydrogen-blended natural gas in soil, revealing that hydrogen diffuses faster than methane. The diffusion risk in sandy soil is significantly higher than that in clay soil, and multiple leakage points as well as slit-shaped leakage holes will exacerbate the diffusion hazard. Lu et al. [
22] investigated the leakage and diffusion behavior of HBNG in soil–brick gutter coupling spaces, analyzing the influence of multiple factors through CFD simulations and establishing a leakage rate calculation model, providing valuable insights for the safe operation of buried pipelines.
Additionally, Han [
23] investigated the leakage and diffusion behavior of HBNG in utility tunnels and proposed a dynamic ventilation strategy to effectively reduce explosion risk, filling the research gap in dynamic regulation and precise prediction of HBNG leakage in utility tunnels. Furthermore, Wang [
24] established a diffusion coefficient model for HBNG based on the Fuller model and Fick’s law, exploring the influence of ventilation mode, initial pipeline pressure, HBR, and leak size on gas leakage and diffusion, and evaluating factors affecting the leakage and diffusion patterns of HBNG in utility tunnels. Xu et al. (2024) [
25] also explored HBNG leakage behavior in utility tunnels, identifying critical factors such as pipeline pressure and leak location that influence diffusion patterns, and proposed ventilation strategies tailored to worst-case leakage scenarios Nevertheless, a notable research gap exists in that these previous studies have not conducted systematic investigations into the leakage and diffusion characteristics under accident ventilation conditions, which are crucial for safety engineering applications.
In summary, existing research predominantly focuses on the diffusion of natural gas and buried HBNG pipelines. However, comprehensive studies on the leakage and diffusion characteristics of HBNG within confined utility tunnel spaces, particularly under emergency ventilation scenarios, remain scarce. Current engineering codes (e.g., GB50838-2015 and GB51354-2019 [
26]) explicitly focus on pure natural gas systems and do not include provisions for HBNG, leading to potential underestimation of ventilation requirements. This oversight may lead to safety risks in ventilation design and operation, particularly as HBNG use in utility tunnels becomes more widespread.
This paper focuses on the gas compartment of a utility tunnel as the primary research subject. By constructing a detailed three-dimensional numerical model, the study systematically simulates and analyzes the leakage and diffusion patterns of HBNG under accident ventilation conditions. It explores the impact of key factors, such as leakage orifice size and HBR, on the dispersion and concentration distribution of the leaked gas. The research further investigates the dynamic behavior of HBNG in confined spaces, highlighting the significant differences in diffusion characteristics when compared to pure natural gas. Based on the findings, this study proposes a graded ventilation prevention and control strategy tailored to different leakage scenarios, aiming to enhance safety in utility tunnels. The strategy includes recommendations for real-time adjustments in ventilation systems, such as varying fan speeds and optimizing air exchange rates, to mitigate explosion risks and ensure effective containment of hazardous gas concentrations. This approach bridges critical gaps in existing engineering codes and provides a foundation for future safety measures in HBNG-utilized utility tunnels.
2. Materials and Methods
2.1. Physical Model
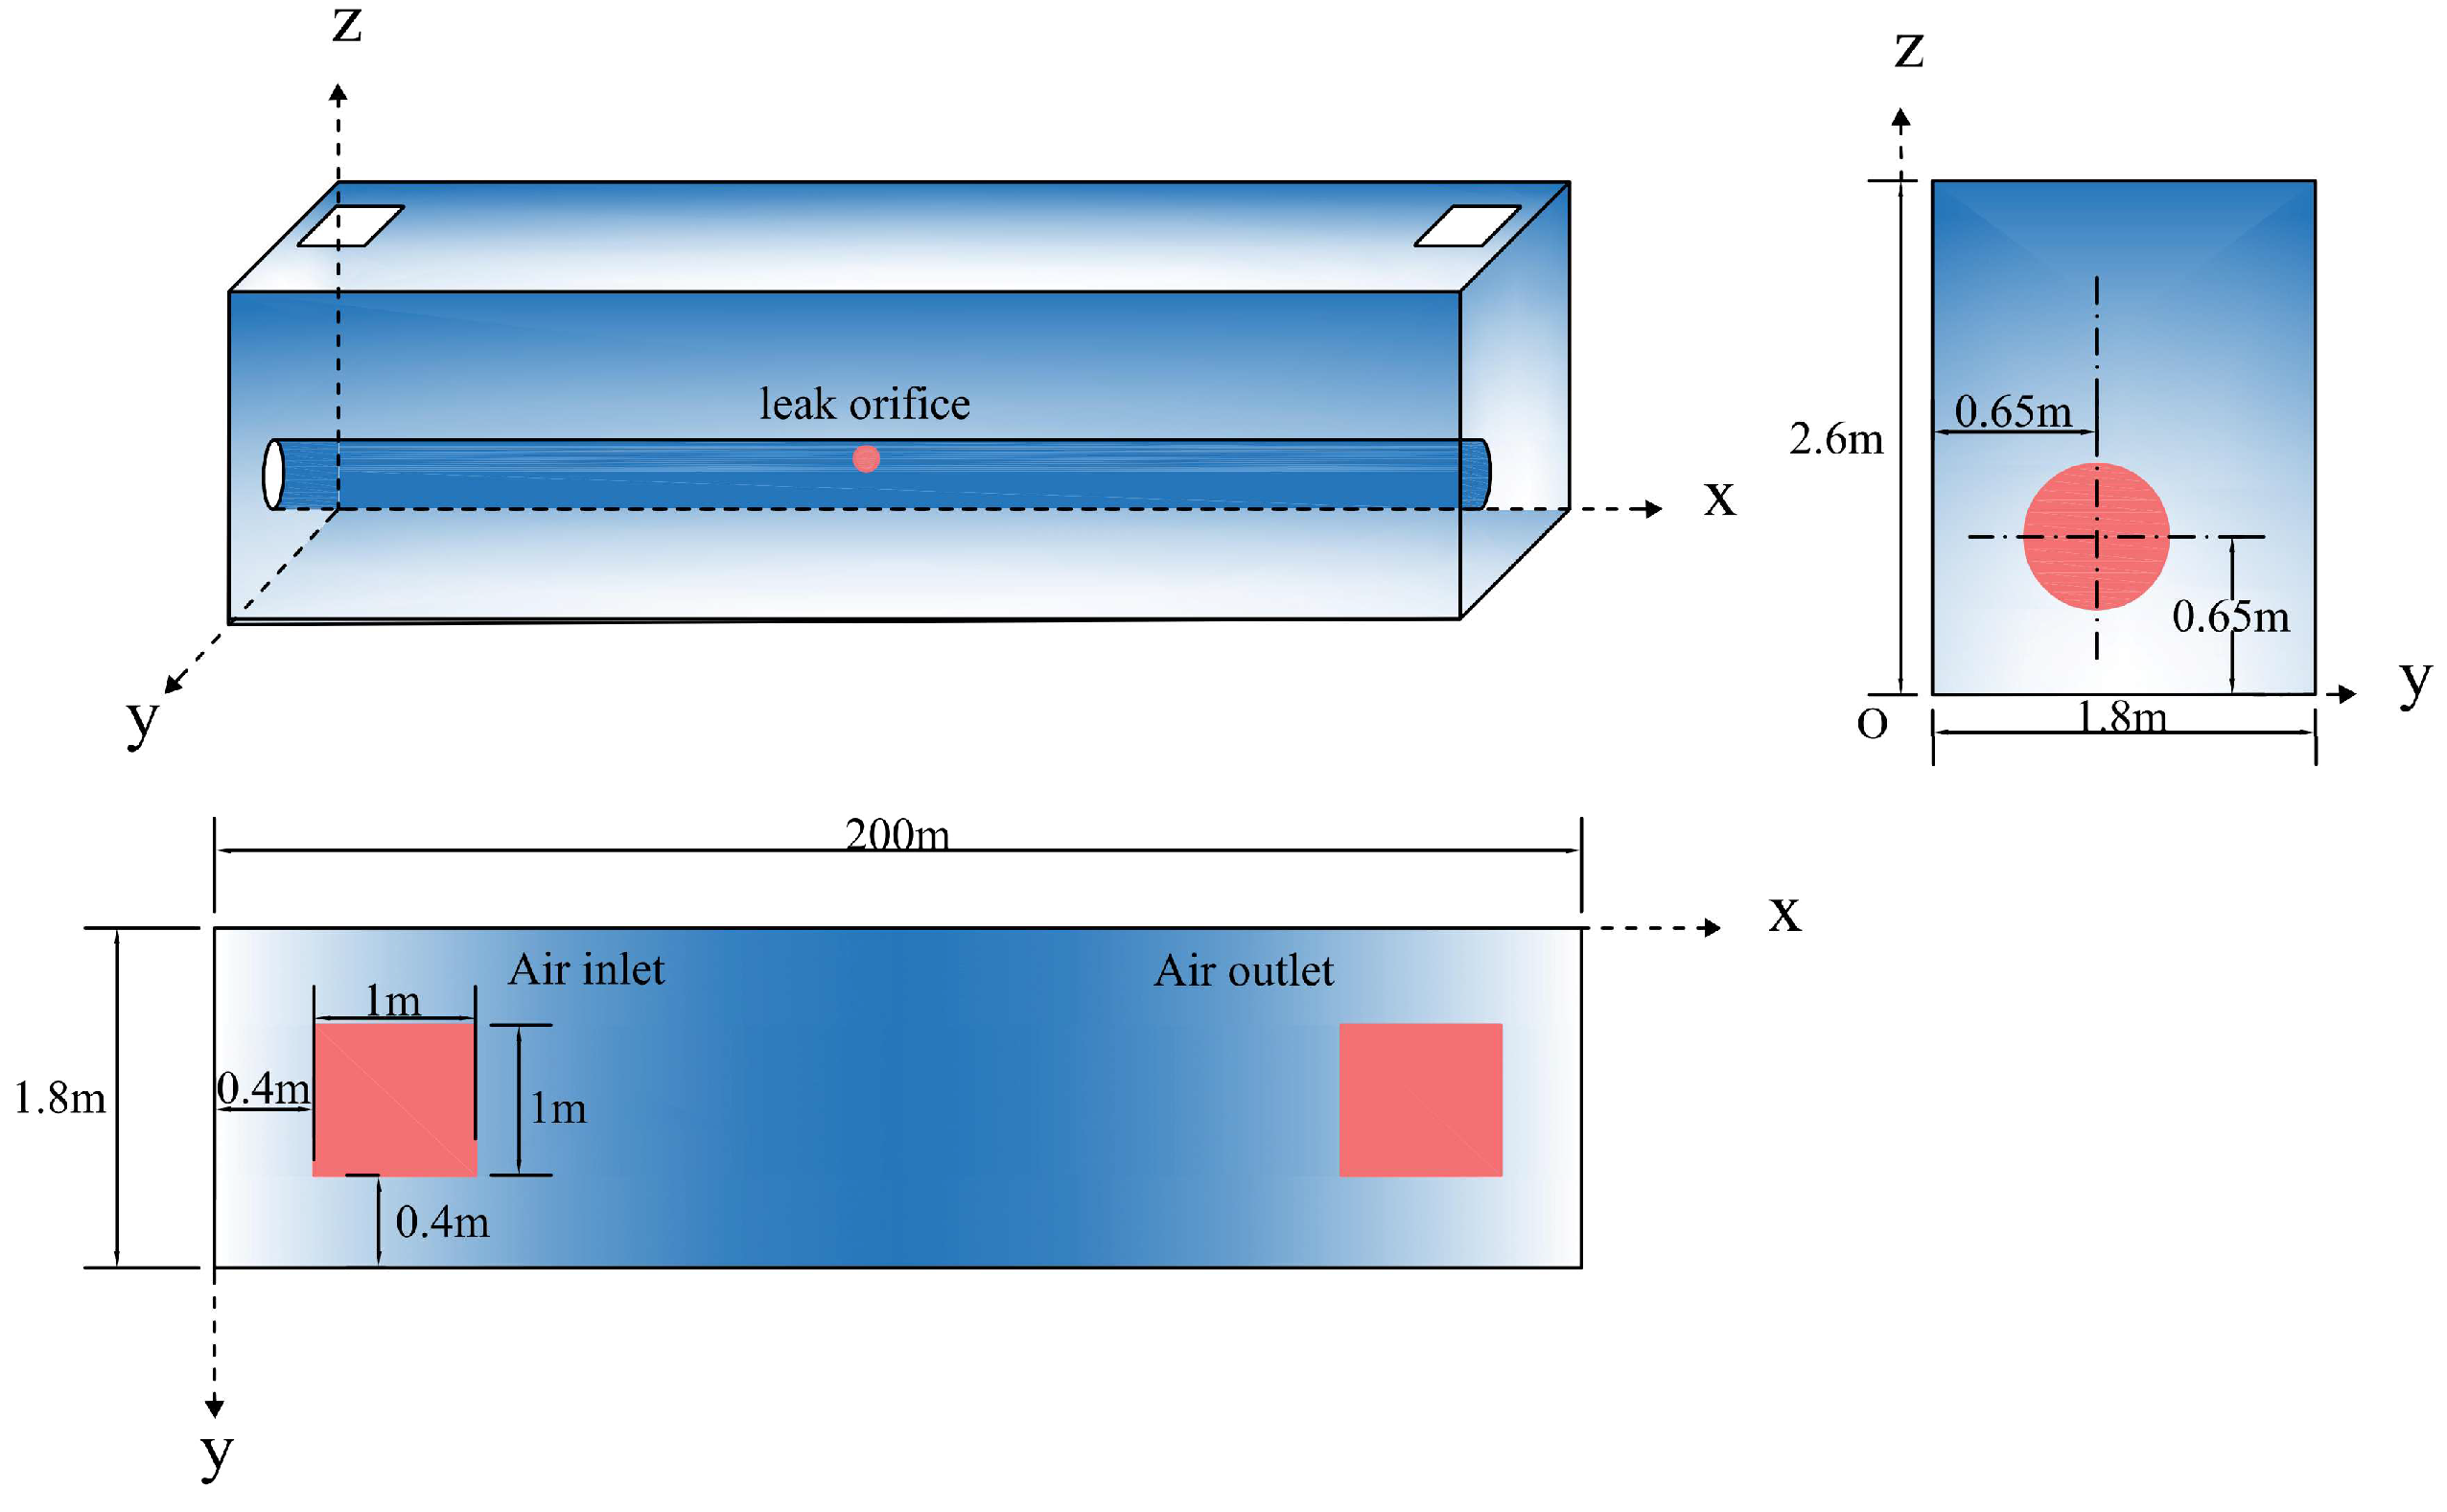
In accordance with the “Technical Specification for Urban Utility Tunnel Engineering” (GB50838-2015), firewalls are required to be installed at intervals of 200 m within natural gas pipeline compartments to ensure proper fire separation. This study focuses on a single fire compartment as defined by these specifications. The model is designed with dimensions of 1.8 m in width, 2.6 m in height, and 200 m in length—consistent with GB50838-2015 requirements that natural gas compartments in utility tunnels be divided into 200 m fire segments by firewalls, with a pipeline diameter of 300 mm. To simulate real-world conditions, the air inlet and outlet vents are positioned symmetrically on the left and right sides of the tunnel, each with a cross-sectional area of 1 m × 1 m. These vents are intended to represent both natural and forced ventilation conditions typically encountered in utility tunnel engineering.
As shown in
Figure 1, the pipeline is placed in the gas compartment in the utility tunnel. The leakage orifice is located directly above the pipeline at the coordinate x = 100 m. For the purpose of simplifying the model and reducing computational complexity, the leakage orifice is idealized as a circular shape, which allows for the focused analysis of the diffusion behavior of HBNG under controlled conditions. The symmetry of the model and the fixed positioning of the leakage orifice enable a clear evaluation of the gas dispersion patterns under both natural and mechanical ventilation scenarios.
In accordance with the CJJ/T 146-2011 “Technical Specification for Urban Gas Alarm Control Systems” [
27], which stipulates that “when gas transmission and distribution facilities are located in enclosed or semi-enclosed spaces, gas detectors must be installed at intervals of no more than 15 m, with the maximum distance from any detector to a gas release source not exceeding 4 m”, the monitoring points in this study are arranged following these guidelines. Specifically, monitoring points are positioned 0.1 m below the ceiling, spaced 15 m apart along the pipeline axis. The monitoring point directly above the leakage orifice is designated as P7. The coordinates of all other monitoring points are provided in
Table 1.
2.2. Mathematical Model
Given the inherent complexity of the HBNG leakage and diffusion process within the utility tunnel, the numerical model was developed based on several fundamental assumptions to ensure computational feasibility and accuracy. HBNG is modeled as an ideal gas mixture of methane and hydrogen. During leakage, only the transport of gas components is considered, with no chemical reactions or heat exchange occurring between the gases. A steady-state leakage assumption is applied, meaning that the pressure at the leak orifice is in dynamic equilibrium with the internal pipeline pressure, and the influence of internal flow on the leakage process is neglected.
Under these assumptions, the mixing process of HBNG and air within the compartment is governed by the mass conservation equation, momentum conservation equation, energy conservation equation, and the species transport equation, all without any source terms. These equations are coupled with the mixture gas density equation for solving the problem. To model turbulence, the standard k-ε turbulence model was employed, which is widely used for simulating turbulent flow behavior in complex fluid dynamics systems [
28].
Additionally, the effect of gravity on density stratification is taken into account, with gravitational acceleration set to 9.8 m/s2. The SIMPLE (Semi-Implicit Method for Pressure-Linked Equations) algorithm was utilized for pressure–velocity coupling, ensuring that the solution remains physically consistent and accurate. A time step of 1 s was chosen for the simulation, with a maximum of 20 iterations per step. Preliminary calculations verified that this parameter setting ensured convergence of the computational process.
By applying this modeling approach, the diffusion and evolution patterns of HBNG within the confined tunnel space were systematically investigated over a time period of 200 s, providing a comprehensive understanding of the gas dispersion under various conditions.
2.3. Initial and Boundary Conditions
2.3.1. Initial Conditions
At the start of the simulation, the utility tunnel is assumed to be filled with air, containing no natural gas. The initial conditions are set with an absolute pressure of 0.1 MPa and a temperature of 300 K. The natural gas leakage begins at the moment the simulation starts, with the leak originating from the designated leakage orifice above the pipeline.
2.3.2. Boundary Conditions
- (1)
Leakage Orifice Boundary Conditions
In this study, three typical orifice diameters (4 mm, 6 mm, and 8 mm) were selected to represent different leakage scenarios—these sizes fall into the category of “small orifice leakage”, corresponding to common leakage scenarios in utility tunnel natural gas pipelines caused by corrosion, minor damage, or loose joints, which account for a high proportion of actual operational incidents and are key targets for risk prevention and control. The range is consistent with existing studies [
29] on natural gas pipeline leakage, ensuring result comparability, and the 4 mm to 8 mm gradient effectively captures the relationship between leakage volume and diffusion range—with a focus on small orifice leakage characteristics. As the HBNG mixture is assumed to be an ideal gas, its leakage dynamics can be characterized by existing mathematical models. The HBNG leakage process was set as a constant-pressure steady-state leakage mode, meaning that the mass flow rate at the leak orifice remains dynamically constant. The mass flow rate
, at the leakage orifice can be calculated using the following equation:
where
is the leakage flow rate, kg/s;
is the area of the leak hole,
;
is the molecular mass in mixed gas, kg/mol;
is the external environmental pressure, Pa;
is the internal pipeline pressure, Pa;
is gas constant, 8.314 J/(mol⋅K);
is the coefficient of leakage, when the leak hole is the circle,
is 1;
is the adiabatic exponent in mixed gas, dimensionless quantity;
T is mixed gas temperature, K;
is mixed gas leakage velocity, m/s;
is gas compressibility factor;
is mixed gas density, kg/m
3.
This study examines the impact of different HBRs and leak orifice sizes on HBNG within the utility tunnel under accident ventilation conditions. Seven typical leakage scenarios were defined to cover a range of possible real-world situations. The HBNG leakage flow rates for each scenario were calculated using Formula (2), with specific parameter values provided in
Table 2.
- (2)
Vent Boundary Conditions
The supply vent is modeled as a velocity inlet boundary condition, while the exhaust vent is defined as a pressure outlet boundary condition. The air velocity at the supply vent is calculated using the following formula:
where
is the average wind velocity of the air inlet, m/s;
is the ventilation frequency, times/h;
is the volume of the tunnel, m
3;
is the area of the air inlet, m
2.
Theoretical calculations based on the ventilation formula were used to derive the supply air velocity parameters for different ventilation modes. The rated ventilation mode (6 h−1) and accident ventilation mode (12 h−1) are specified in GB51354-2019 (“Technical Standard for Operation, Maintenance, and Safety of Urban Underground Utility Tunnels”), corresponding to inlet velocities of 1.56 m/s and 3.12 m/s, respectively. To achieve a high-fidelity simulation of the ventilation system’s dynamic response, dynamic boundary conditions were configured in Fluent software (2024R1). Specifically, when the HBNG volume concentration at monitoring point P8 reaches the preset alarm threshold of 1%vol, the ventilation system automatically adjusts the ventilation frequency from the base value of 6 h−1 to 12 h−1 or to another specified exchange rate, according to a predefined function. This adjustment activates the accident ventilation intensity.
Table 3 presents the specific parameters of all simulated working conditions, and all working conditions discussed in the result analysis below are derived from this table.
- (3)
Internal Cell Zone and Surface Boundaries
The leaked HBNG and the air initially present within the utility tunnel are both treated as fluids. Therefore, the internal cell zone is defined as a fluid domain. The pipeline walls, tunnel walls, and firewalls are all modeled as solid boundaries, represented by wall conditions.
2.4. Grid Independence Verification and Model Validation
Given the regular geometric structure of the physical model, a structured mesh was used for grid generation, offering significant advantages in computational efficiency and accuracy. Local mesh refinement was applied around the leakage orifice and the inlet/outlet vents to capture the flow dynamics and concentration gradients in these critical regions.
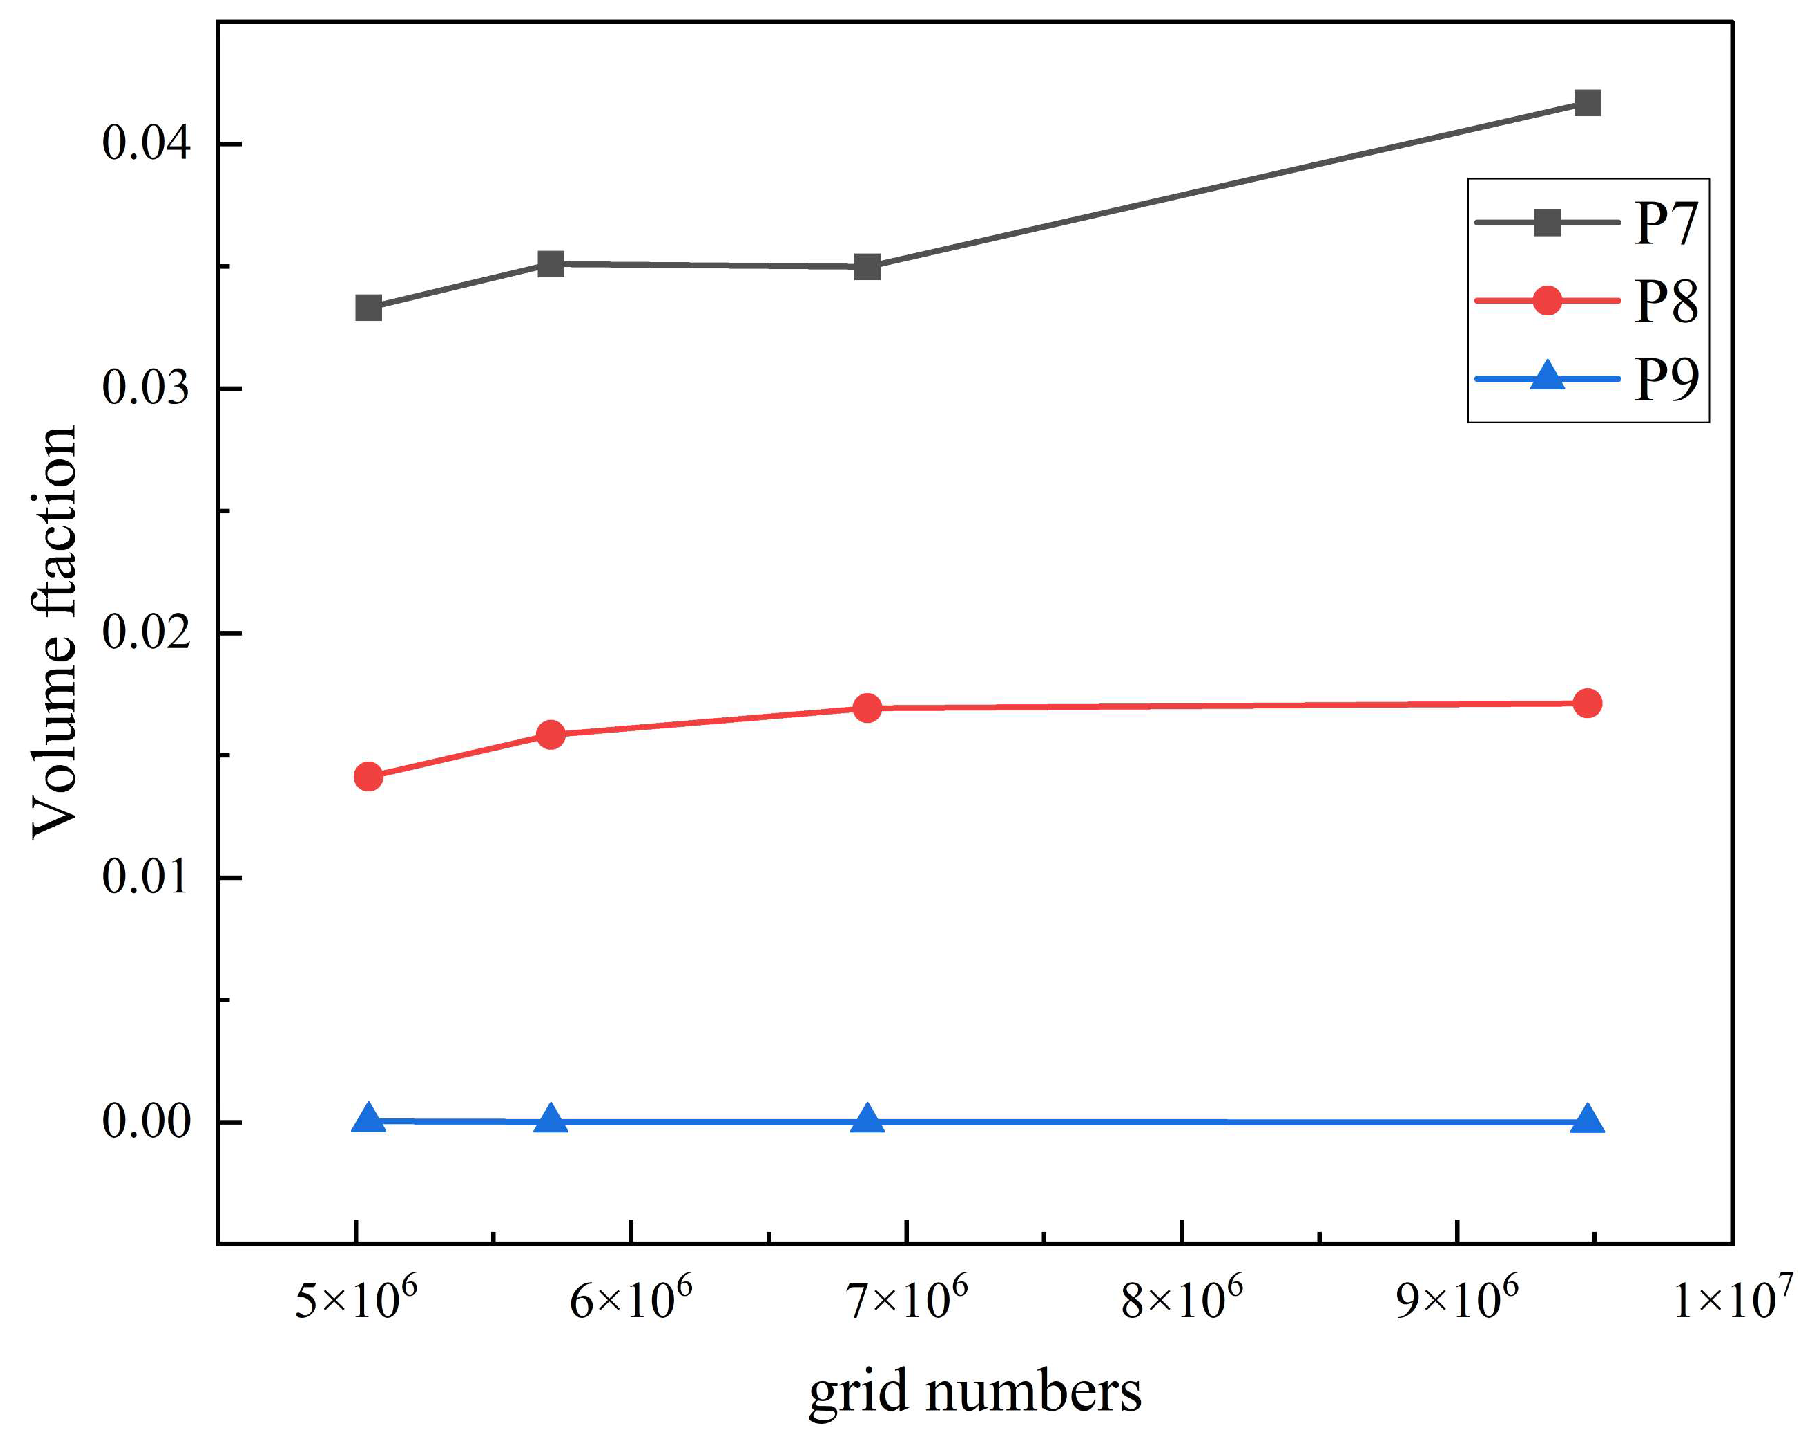
It is important to note that for the same physical model, increasing mesh density typically improves the accuracy of the simulation results but also increases computational time. As a result, a balance must be struck between computational accuracy and efficiency. To achieve this balance, several mesh configurations with node counts of 9.47 million, 6.85 million, 5.70 million, and 5.00 million were tested.
Figure 2 presents the HBNG volume fraction at a leakage time of 30 s for monitoring points P7, P8, and P9 under Case 6.1. It can be observed that when the mesh count exceeds 6.85 million, the HBNG volume fraction changes very little at each monitoring point. Based on the results from the mesh independence test, it was concluded that a mesh count of 6.85 million is sufficient to ensure mesh independence, meaning that further increases in mesh density would not significantly enhance the accuracy of the simulation.
To validate the accuracy of the numerical model, the experimental setup for gas leakage in a utility tunnel described in reference was adopted [
30]. The experimental test rig had dimensions of 16 m in length, 0.38 m in width, and 0.88 m in height.
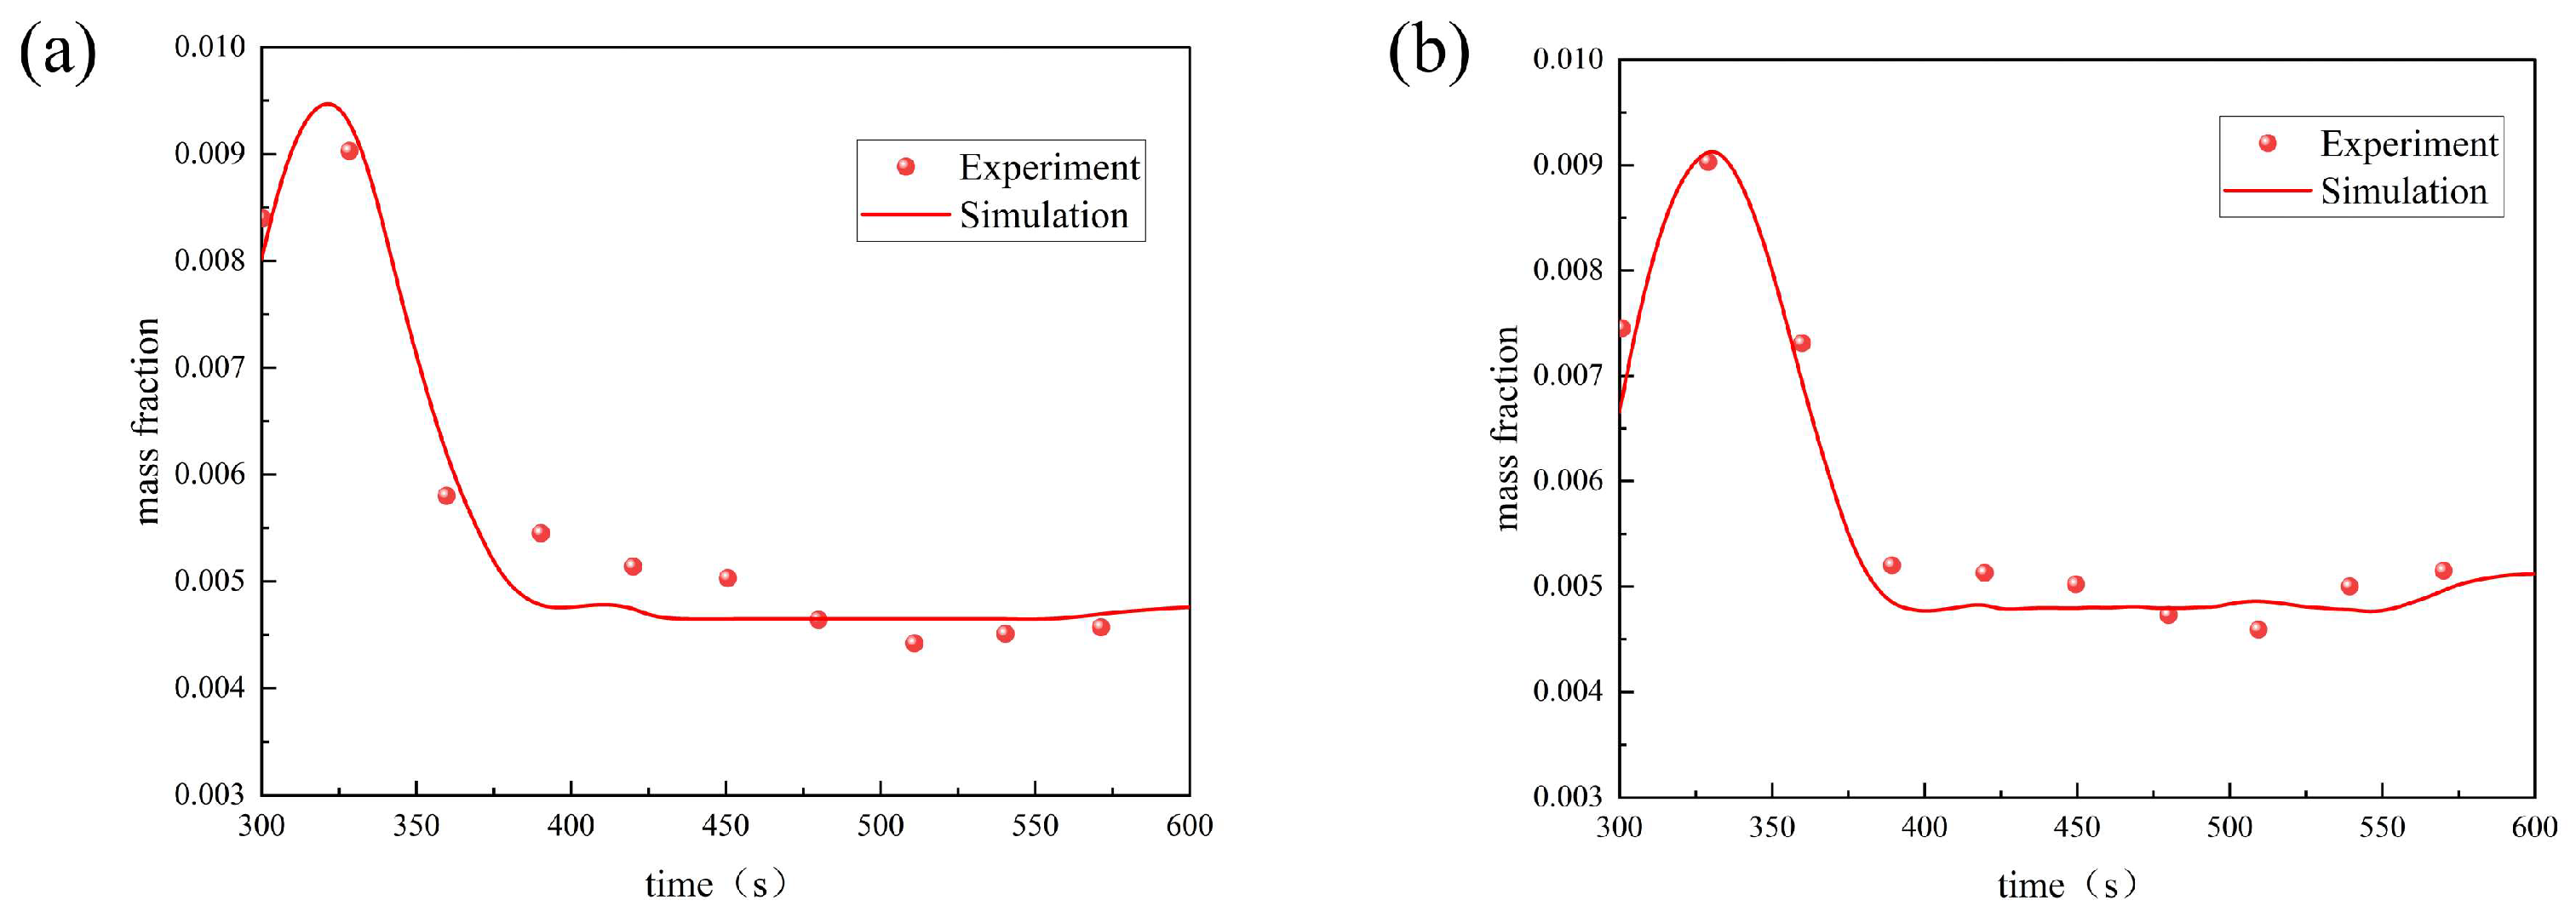
Both the air inlet and outlet vents were square, measuring 0.32 m × 0.32 m, while the gas pipeline had a diameter of 40 mm. The inlet and outlet vents were located at both ends of the tunnel, with the leakage orifice positioned 6.2 m downstream from the inlet vent. A full-scale (1:1) physical model of the utility tunnel was constructed based on this experimental setup. The experimental conditions were applied as boundary conditions, and the numerical methodology outlined in this study was employed for simulation. Validation was carried out by comparing the simulation results with experimental data from monitoring points 5 and 7, located 0.5 m and 2.8 m downwind of the leakage orifice, respectively. The simulation was conducted under the operational case of low wind speed (0.13 m/s) and a leak size of 0.5 mm.
As shown in
Figure 3, the variation trends of the simulated data at monitoring points 5 and 7 are fundamentally consistent with the experimental data. The maximum deviations between the simulation and experimental results are 13.76% and 10.36%, respectively, both of which fall within an acceptable range. This comparison confirms the reliability of the numerical model developed in this study.
3. Results
3.1. HBNG Concentration Distribution Under Minimum Accident Ventilation
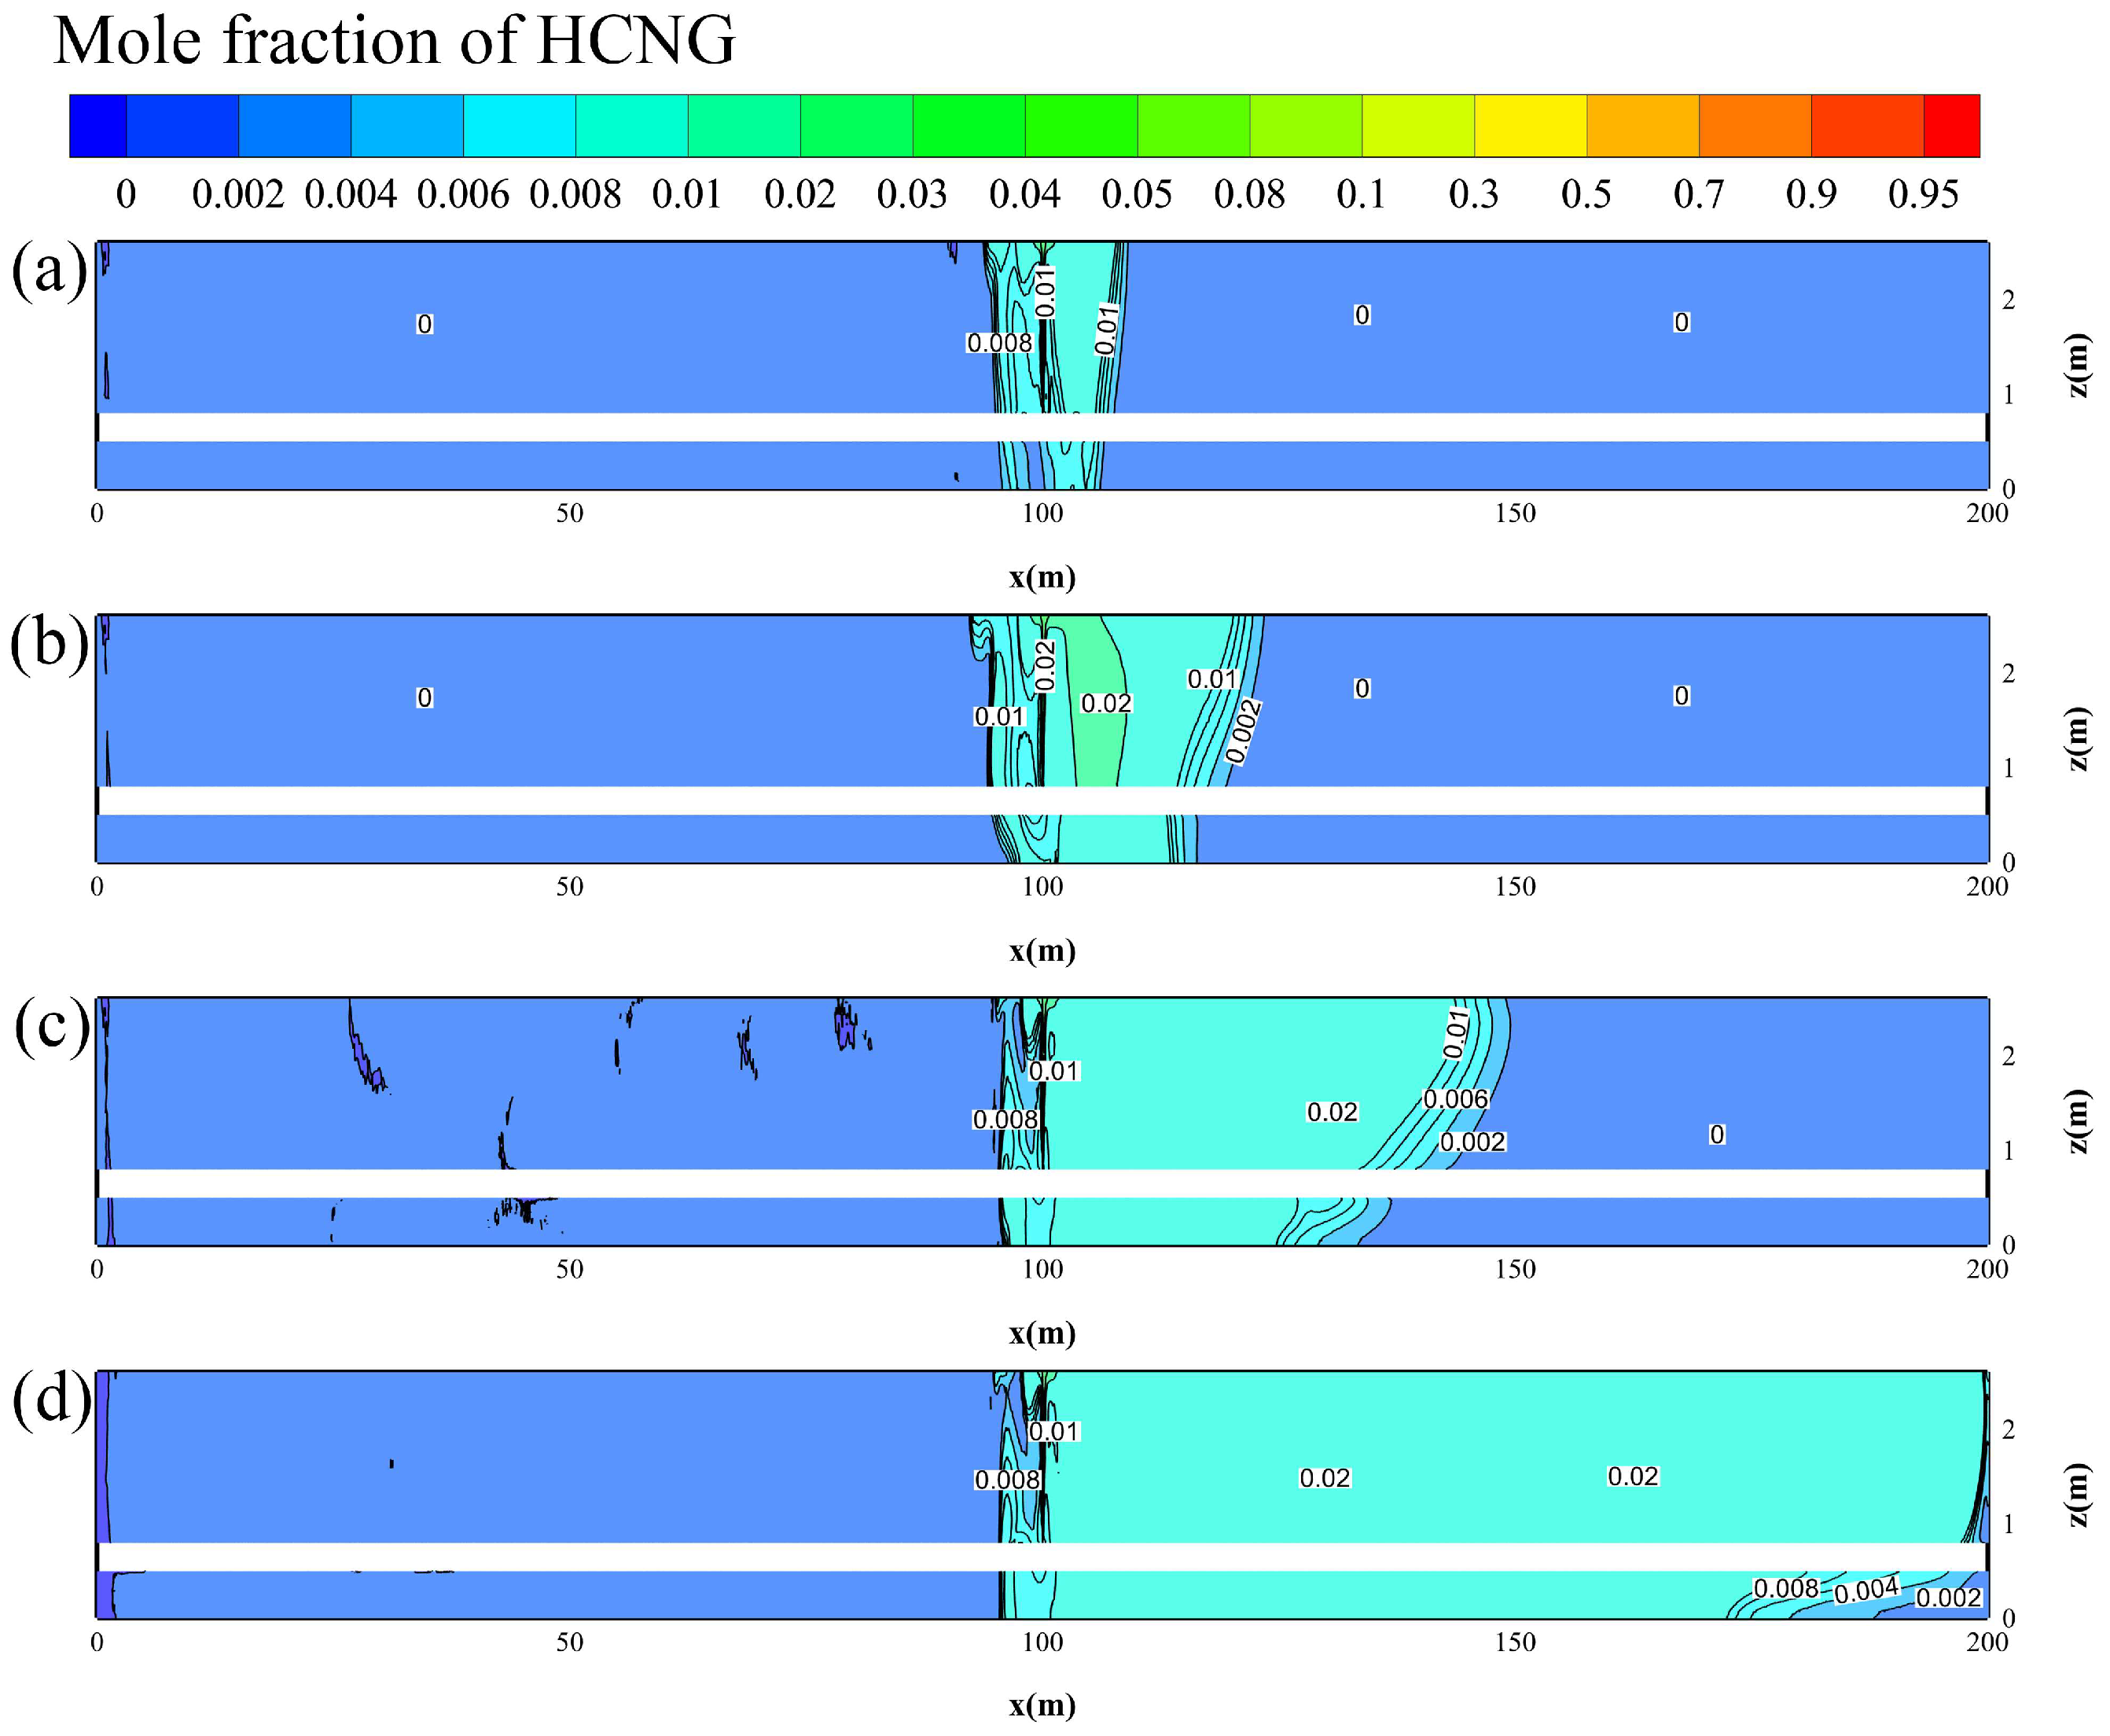
Figure 4 shows the HBNG concentration change over time at the longitudinal Y = 0.65 m section of the utility tunnel (case 6.1 in
Table 3). During the initial stage of leakage, the air change rate is maintained at 6 h
−1. At 24 s, the HBNG concentration at monitoring point P8 reaches the predefined alarm threshold (1% vol), triggering an automatic switch to accident ventilation. Monitoring points are spaced 15 m apart along the tunnel; regardless of the leak’s horizontal position within the segment, the distance to the nearest downstream monitoring point will not exceed 15 m. P8 was selected as the alarm trigger point to represent the worst-case scenario, ensuring conservative safety control.
In the accident ventilation phase, the simulation results indicate that the left half of the tunnel—upwind of the leakage source—remains nearly free of detectable HBNG. In contrast, the right half of the tunnel, downwind of the leakage source, becomes progressively filled with HBNG as the leakage continues. Within this region, most of the gas concentrations exceed the alarm threshold, with the concentration eventually stabilizing around 2% vol. This stabilization suggests that the ventilation system, although effective at increasing the air change rate, reaches a limit in diluting the gas once the concentration in the tunnel reaches a critical threshold.
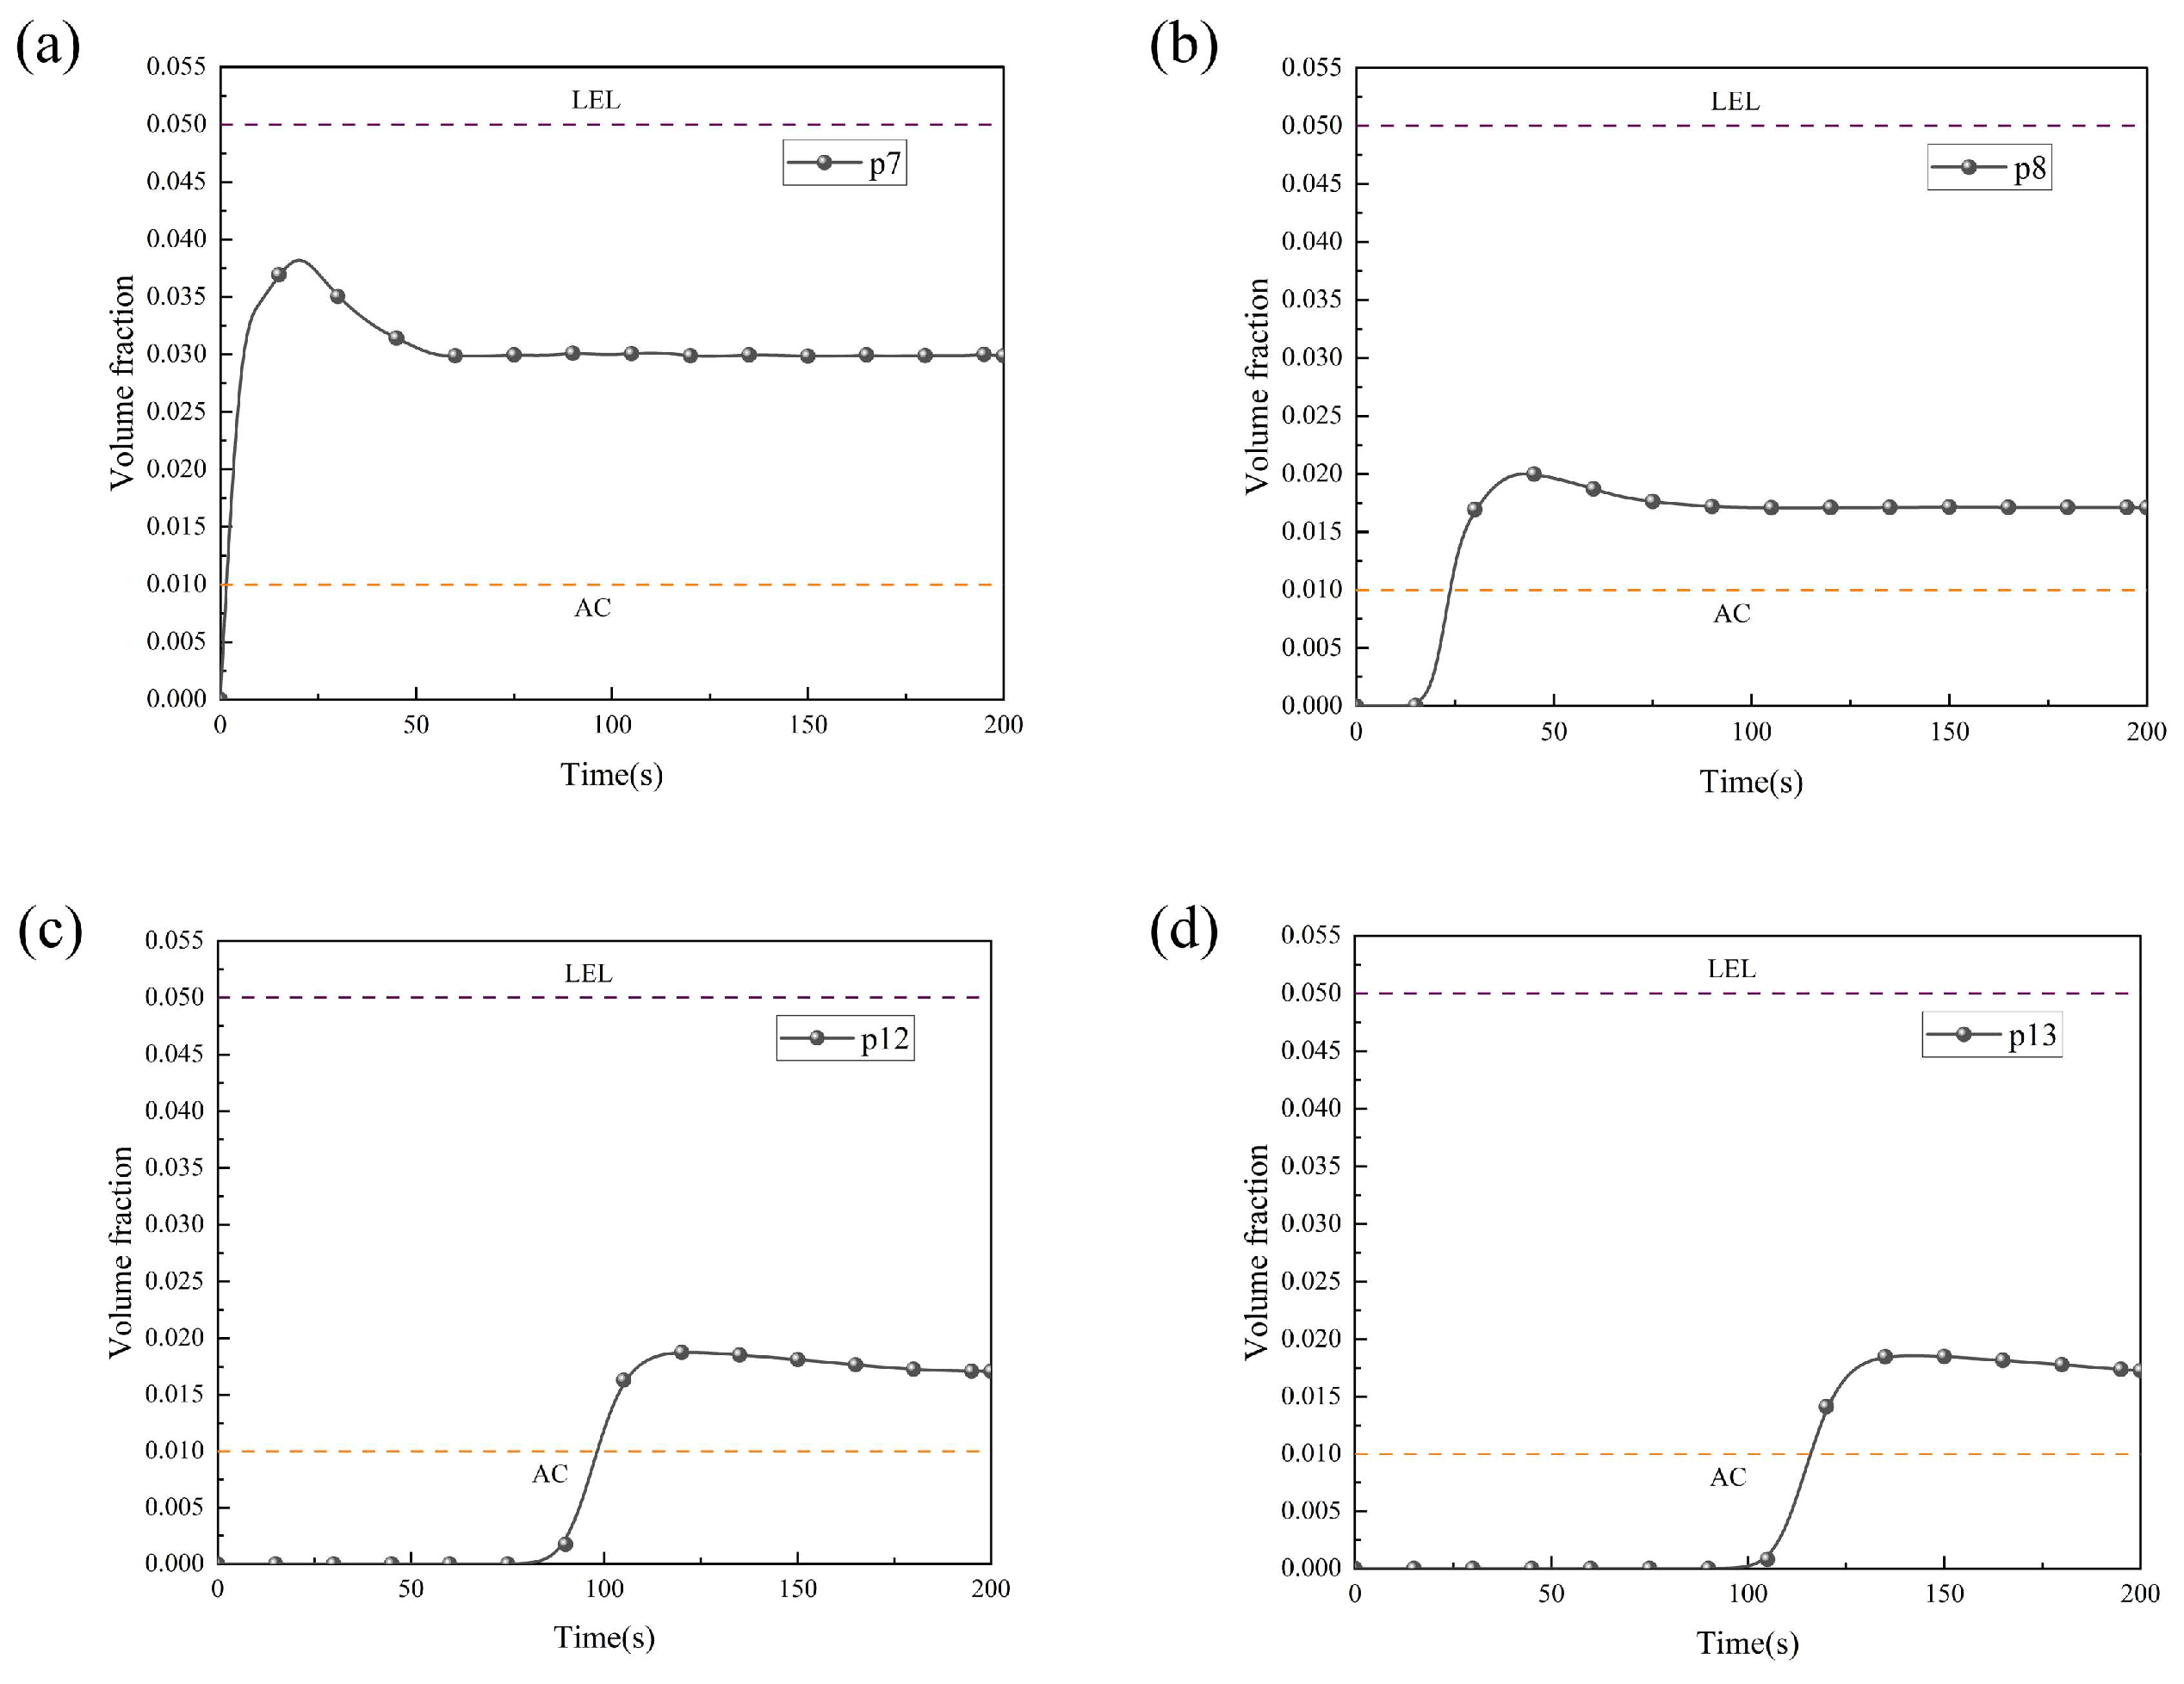
Figure 5 illustrates the temporal evolution of HBNG volume fraction at monitoring points under minimum accident ventilation (orifice diameter: 6 mm, pipeline pressure: 0.8 MPa, HBR: 10%). The concentration profiles clearly show that HBNG propagates downstream along the direction of the supply air in a wave-like manner, demonstrating a distinct delay and attenuation effect as the gas moves away from the leakage source. The concentration variation at all monitoring points follows a similar pattern, which can be divided into three distinct stages: (1) a rapid initial increase in concentration upon the onset of leakage; (2) a gradual attenuation phase in the middle term, driven by the activation of accident ventilation; and (3) a dynamic equilibrium stage, where the concentration eventually stabilizes.
Notably, the monitoring point directly above the leakage source (P7), which remains continuously exposed to the gas release, stabilizes at a concentration of 3.2%, which is significantly higher than the 2% concentration observed at the other monitoring points. This disparity reflects the complex interaction between the local intensity of the leakage and the global dilution effect of the ventilation system. The higher concentration at P7 illustrates that, despite the increased ventilation, the local effects of the leak—particularly in proximity to the source—still dominate, limiting the effectiveness of the ventilation in quickly reducing the concentration in the immediate vicinity of the leak. These results suggest that although the ventilation system effectively dilutes the HBNG concentration over time, the proximity to the leakage source plays a critical role in the concentration levels. This interaction highlights the need for more localized control strategies, especially in areas closer to the leak, where the dilution effect of the ventilation is less pronounced.
3.2. Influential Factors of HBNG Leakage Diffusion and Concentration Distribution
3.2.1. Effect of Leak Orifice Sizes
Figure 6 illustrates the cloud diagrams of HBNG distribution along the pipeline axis at 60 s of leakage for different leak orifice sizes (4 mm, 6 mm, and 8 mm), under the conditions of a pipeline pressure of 0.8 MPa, an HBR of 10%, and minimum accident ventilation. As shown in
Figure 6, the size of the leakage orifice has a significant impact on the spatial distribution of HBNG diffusion. At 60 s after the onset of leakage, the diffusion range of the HBNG mixture is 40.6 m for a 4 mm orifice, increasing to 50 m for a 6 mm orifice, and further extending to 53.4 m for an 8 mm orifice. Specifically, the diffusion range shows a 23.15% increase when the orifice diameter is increased from 4 mm to 6 mm, while the increase narrows to 6.8% when transitioning from 6 mm to 8 mm. This non-linear trend arises because leakage mass flow rate is proportional to the square of the orifice diameter, leading to diminishing returns in diffusion range expansion. This indicates that the diffusion rate follows a non-linear growth pattern with respect to the orifice size.
In general, before the tunnel space is completely filled, the diffusion distance is positively correlated with the leak orifice size. However, as the orifice diameter increases, the rate of increase in diffusion distance begins to diminish. This suggests that while a larger leak orifice increases the range of HBNG diffusion, the efficiency of diffusion diminishes at higher orifice sizes, potentially due to limitations in ventilation or other factors influencing gas dispersion.
Figure 7 presents the variation of HBNG volume concentration over time at the corresponding monitoring points for different orifice sizes. The figure further reveals that while the alarm trigger times show slight differences among the various orifice sizes, the overall concentration evolution patterns exhibit similar characteristics. After a brief initial rise in concentration following the activation of the alarm, the HBNG concentration gradually decays and stabilizes due to the dilution effect provided by the accident ventilation system.
Notably, in the case of the 8 mm orifice, the equilibrium concentration at monitoring point P7 reached 5.1 vol%, exceeding the lower explosion limit (LEL) of 5 vol%. In contrast, the cases with 6 mm and 4 mm orifices stabilized at 3.5 vol% and 2 vol%, respectively, which are between the 1 vol% alarm threshold and the LEL. This highlights the increased explosion risk associated with larger orifice sizes. Furthermore, the peak concentrations at monitoring point P7 for each orifice size were 2.4 vol%, 4.1 vol%, and 6.3 vol%, respectively, showing a significant positive correlation with the orifice size.
The research results indicate that increasing the leak orifice size not only accelerates the initial expansion of the hazardous area but also contributes to the prolonged maintenance of higher concentrations of combustible gas within the tunnel. Particularly, larger orifice leakage has the potential to surpass the explosion concentration threshold, thereby posing significant safety hazards. As a result, the minimum air change rate specified in the current accident ventilation standard is insufficient to completely mitigate the explosion risk. It is therefore recommended to develop graded ventilation enhancement strategies specifically tailored for scenarios involving large orifice leaks.
3.2.2. Effect of HBRs
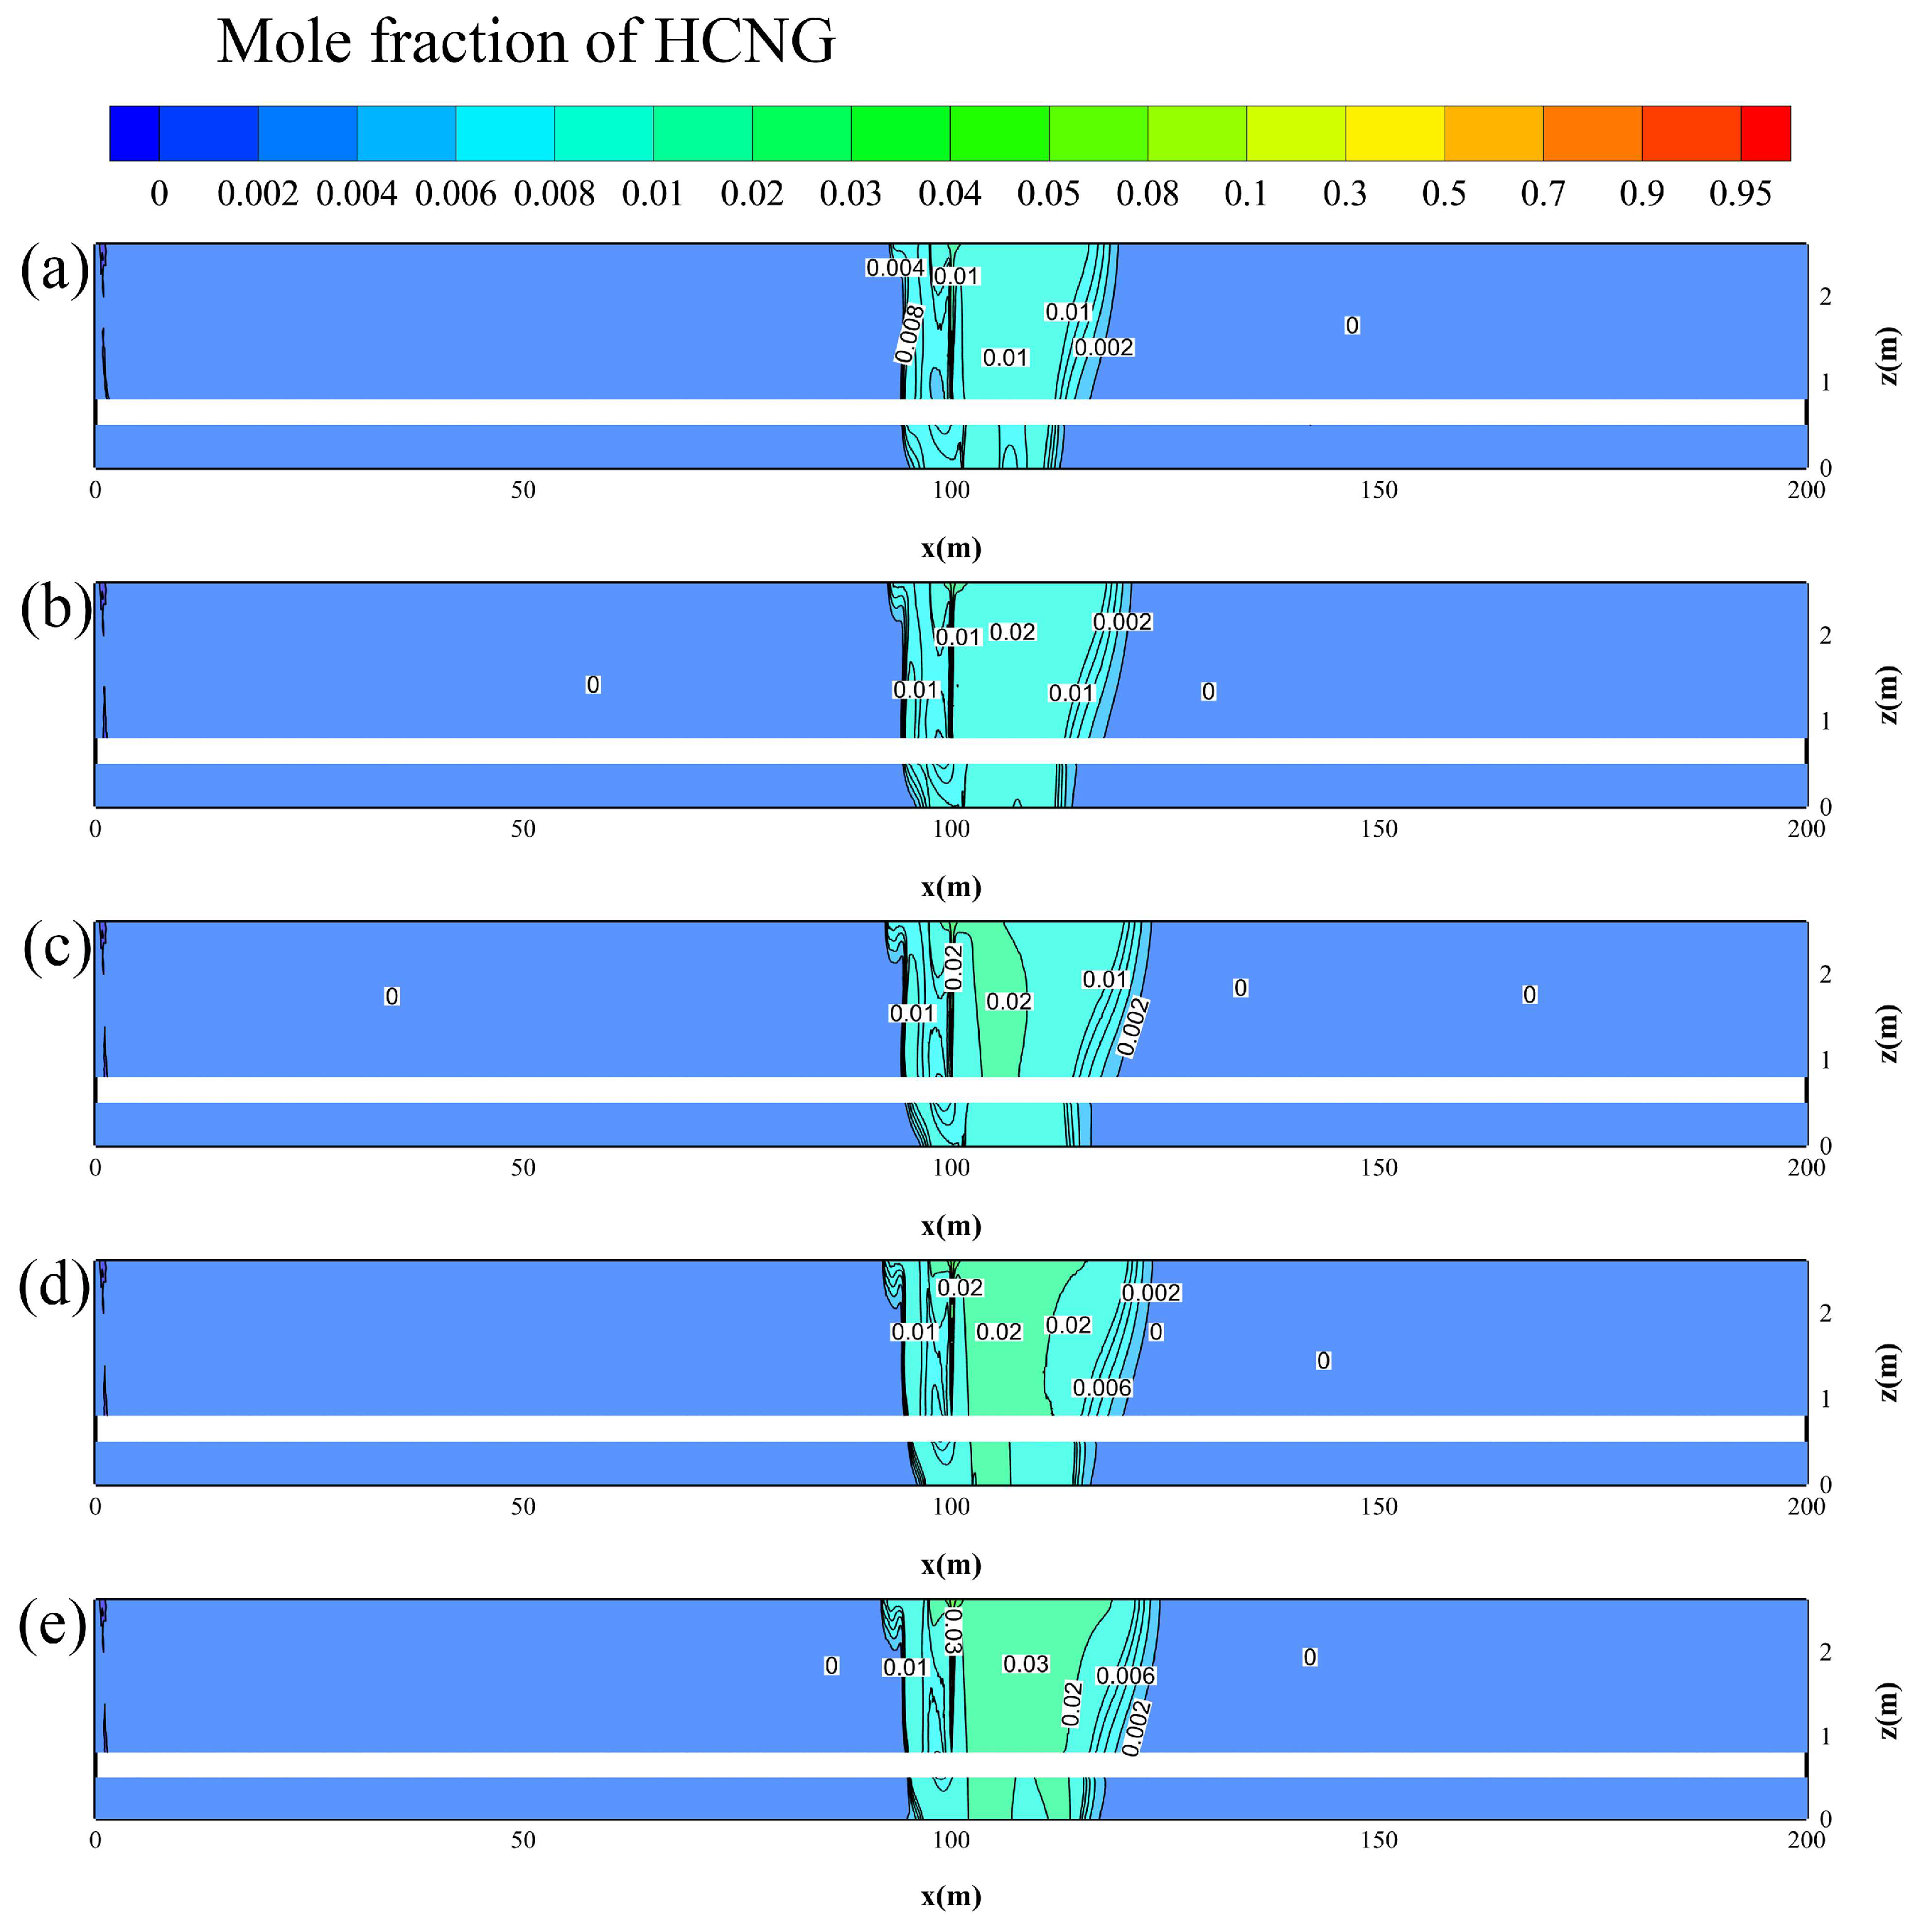
Figure 8 shows cloud diagrams of HBNG distribution along the tunnel axis at 30 s under different HBRs (pipeline pressure 0.8 MPa, leak orifice 6 mm, minimum accident ventilation). As the HBR increases, the diffusion range of HBNG slightly expands, while the concentration of HBNG within the diffusion range increases significantly.
In
Figure 8a, with an HBR of 0%, the diffusion is confined to a smaller region with lower concentrations near the leakage source. As the HBR rises to 5% in
Figure 8b, the diffusion range extends, and higher concentrations are observed downstream. At 10% HBR (
Figure 8c), the concentration increases significantly, with a broader spread of HBNG throughout the tunnel. With HBRs of 15% (
Figure 8d) and 20% (
Figure 8e), the diffusion range continues to expand, and the concentration levels rise further, especially near the ceiling of the tunnel.
This trend demonstrates that higher HBRs lead to both a wider diffusion range and higher concentrations of HBNG. The lighter molecular weight of hydrogen accelerates the diffusion process, contributing to the increased spread and concentration. These results highlight the need for more effective ventilation strategies to manage the increased explosion risks and ensure safety in the tunnel, particularly under higher HBR conditions.
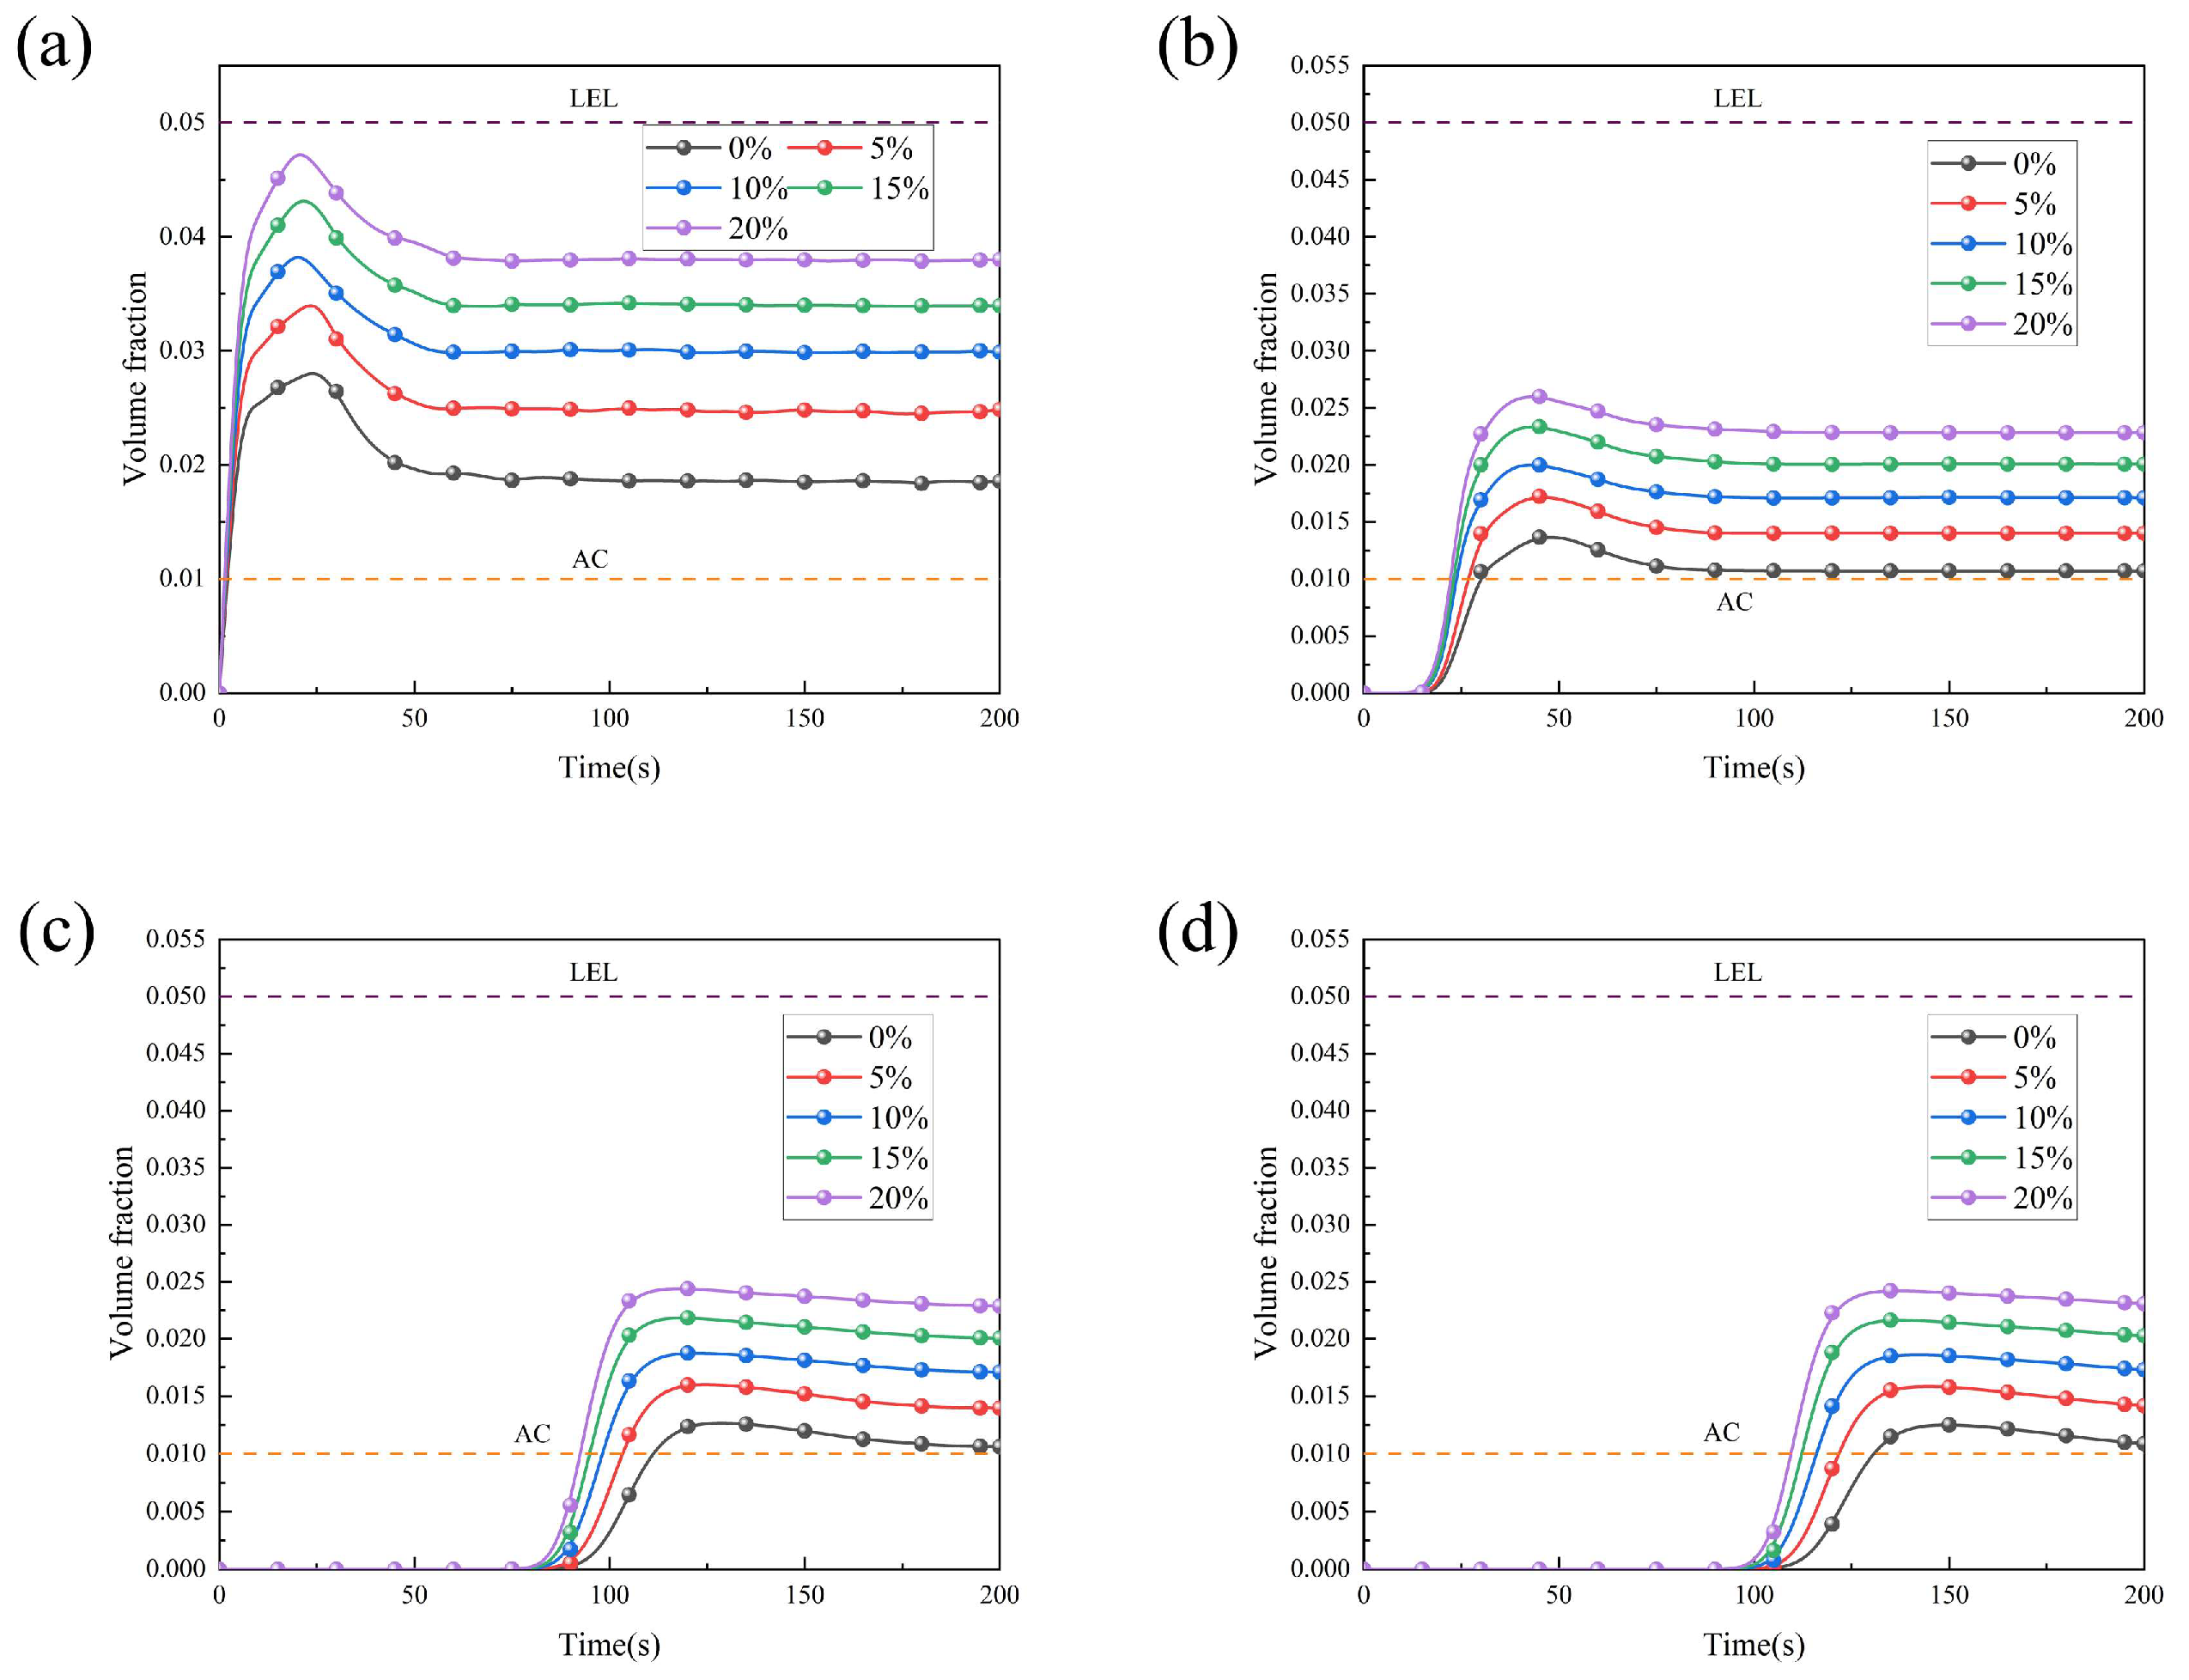
Figure 9 shows the corresponding variation curves of HBNG volume fraction over time at monitoring points. As shown in
Figure 9b, when the HBR increases from 0% in 5% increments up to 20%, the corresponding alarm times decrease progressively from 30 s to 22 s at P8, with intermediate times of 27 s, 24 s, and 24 s for HBRs of 5%, 10%, and 15%, respectively. This indicates an overall downward trend in alarm times as the HBR increases. The final equilibrium concentrations stabilize at approximately 1.07%, 1.40%, 2.02%, 2%, and 2.28% as the HBR increases from 0% to 20%, demonstrating a clear upward trend. This increase emphasizes the effect of hydrogen blending on raising the steady-state concentration under the same ventilation conditions. Notably, as the HBR rises from 0% to 20%, the time required for the monitoring point to reach the 1% alarm threshold decreases by 26.7%, from 30 s to 22 s.
More significantly, once the ventilation system and leakage process reach dynamic equilibrium, the stable concentration shows an approximately linear increase with the HBR, rising from 1.07% to 2.28%, a 113% increase. This highlights the substantial impact of hydrogen blending on both the equilibrium concentration and the overall ventilation efficiency. The lower molecular weight of hydrogen accelerates the diffusion process, while the density differences in the gas mixture facilitate the formation of high-concentration stagnation zones, particularly in the upper regions of the tunnel. These dual effects not only increase the risk exposure time but also raise the intensity of the risk.
It is important to note that this study focuses specifically on hydrogen-blended natural gas (HBNG) scenarios, which align with current utility tunnel operations where hydrogen integration remains incremental. While 100% hydrogen systems represent a future direction, their distinct safety profiles—including a ~4 × higher diffusion coefficient compared to HBNG—and separate regulatory frameworks place them beyond the scope of the present work. As pure hydrogen infrastructure matures and its deployment in utility tunnels becomes more prevalent, subsequent studies will systematically address these scenarios.
The simulation results indicate that even under the minimum accident ventilation conditions, the equilibrium concentration of HBNG exceeds the alarm threshold, even when the HBR is as low as 0% or at its minimum value of 5%. This demonstrates that current ventilation design standards have not fully accounted for the incremental risk introduced by hydrogen blending. The presence of hydrogen significantly weakens the dilution efficiency of the ventilation system by altering the gas diffusion dynamics. Therefore, in practical engineering applications, ventilation strategies must be adjusted according to the HBR to ensure they match the diffusion characteristics and risk thresholds of the blended gas.
3.3. Accident Ventilation Strategy
Based on the previous simulation results, the current 12 h−1 accident ventilation standard is insufficient to maintain the HBNG equilibrium concentration below the 1% alarm threshold when the leak orifice size is ≥4 mm or when hydrogen is blended with natural gas. To determine the minimum air change rate required to ensure safety, this study manually set incremental adjustments to the ventilation rate in simulations: starting from the baseline of 12 h−1, the air change rate was increased by 3 h−1 in successive test cases until concentrations at all monitoring points remained below the 1% alarm threshold.
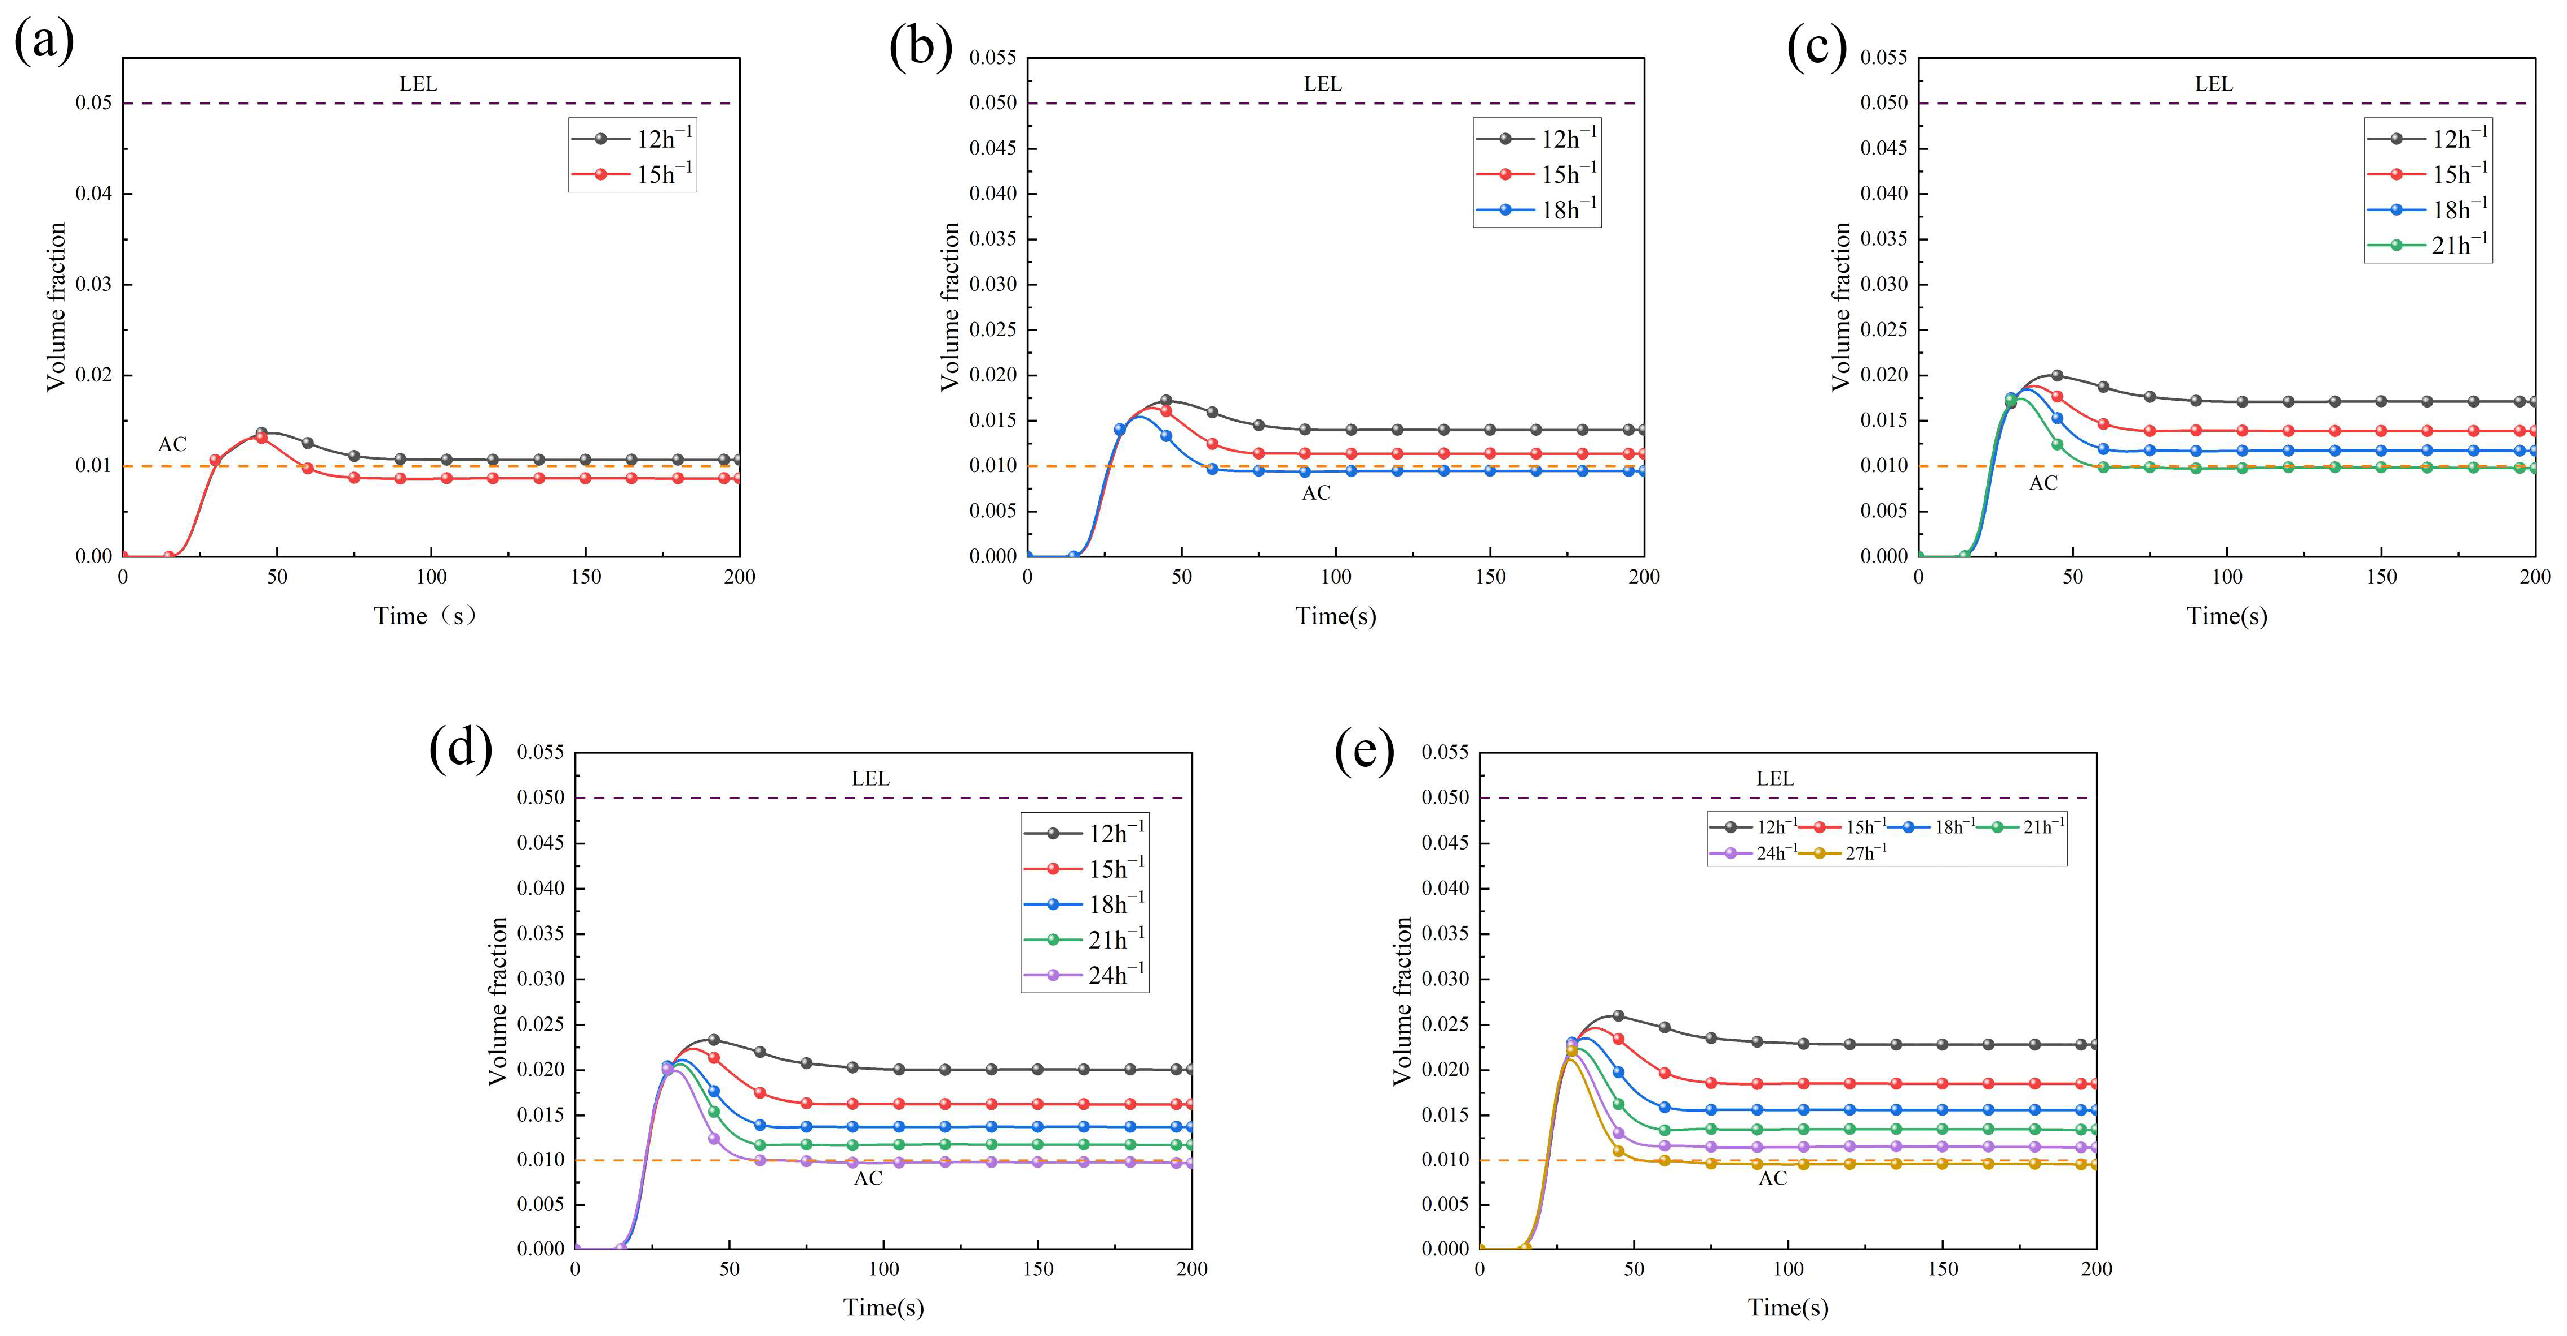
Figure 10 and
Figure 11 show the variation curves of HBNG concentration at monitoring point P8, located downwind of the leak orifice, for different HBRs and leak orifice sizes, respectively. The results clearly indicate that both increasing HBR and increasing leak orifice size significantly raise the minimum required air change rate, demonstrating the need for ventilation strategies to be adjusted based on these factors to maintain safe conditions.
HBR-dominated control: As seen in
Figure 10, when the HBR increases from 0% to 20%, the required minimum air change rates are 15 h
−1, 18 h
−1, 21 h
−1, 24 h
−1, and 27 h
−1, respectively. This shows a nearly linear relationship, with each 5% increase in HBR necessitating a 3 h
−1 increase in air change rate. This linear pattern reflects the growing impact of hydrogen blending on the diffusivity and concentration of the gas, where a higher HBR accelerates the diffusion process and increases the risk of elevated concentrations within the tunnel, requiring a proportional increase in ventilation.
Orifice-size-dominated control:
Figure 11 demonstrates that, with a fixed HBR of 10%, as the leak orifice size increases from 4 mm to 6 mm and then to 8 mm, the required minimum air change rates are 12 h
−1, 21 h
−1, and 36 h
−1, respectively. Notably, when the orifice size increases from 6 mm to 8 mm, the required air change rate surges by 71.4%. This non-linear increase arises because leakage mass flow rate scales with the square of the orifice diameter, a trend expected to continue for larger orifices, though limited by practical ventilation system capacities. As the orifice size grows, the leakage intensity increases exponentially, necessitating a significant increase in ventilation to dilute the gas and prevent hazardous concentrations.
These results emphasize the need for a dynamic and adaptive ventilation system capable of adjusting to both HBR and leak orifice size to effectively manage the risks associated with HBNG leakage. In scenarios where both hydrogen blending and larger leak sizes are present, the ventilation system must be capable of delivering significantly higher air change rates to ensure that HBNG concentrations stay below the safety thresholds. Therefore, practical engineering solutions should incorporate flexible ventilation strategies, such as variable-speed fans and real-time monitoring, to respond to varying leakage conditions in real time and minimize the risk of explosion hazards. For example, the strategy uses P8 concentration: <1% triggers 12 h−1; 1–2% triggers 15 h−1; >2% triggers 18 h−1, controlled by VFD fans linked to real-time sensors.
4. Conclusions
To ensure the safe operation of hydrogen-blended natural gas pipelines in urban utility tunnels, this study analyzed the leakage and diffusion characteristics under accident ventilation conditions via numerical simulations and proposed targeted safety control strategies. The key conclusions are as follows:
Leak orifice size significantly affects diffusion risks. When the orifice diameter increases from 4 mm to 8 mm, the diffusion distance within 60 s increases by 31.5%, and the alarm response time shortens by 18.5%. For an 8 mm orifice, the equilibrium concentration at the leakage source reaches 5.1 vol%, exceeding the lower explosive limit, requiring focused prevention and control for large orifice leaks.
Increased hydrogen blending ratio exacerbates diffusion risks. For every 5% increase in the hydrogen blending ratio, the alarm time is shortened by an average of 1.6 s, and the steady-state concentration rises by 0.4%vol, which is related to hydrogen’s high diffusivity and accumulation characteristics in the upper part of the tunnel.
The current 12 h−1 accident ventilation standard is not applicable. When the hydrogen blending ratio exceeds 5% or the orifice diameter is larger than 4 mm, the concentration tends to exceed the 1% safety threshold. For an 8 mm orifice leak, the air change rate needs to reach 36 h−1, requiring the adoption of a dynamic ventilation scheme.
A graded adaptive ventilation strategy is proposed: real-time adjustment of the air change rate via variable-frequency drives, such as a 3 h−1 increase corresponding to every 5% increase in the hydrogen blending ratio, and a 71.4% higher rate for an 8 mm orifice compared to a 6 mm one. This fills the gap in current codes that do not consider its unique diffusion laws.
