Article

Study on the Failure Causes and Improvement Measures of Arresters in 10 kV Distribution Transformer Areas

1
Electric Power Research Institute, CSG, Guangzhou 510663, China
2
National Engineering Research Center of UHV Technology and New Electrical Equipment Basis, Kunming 651705, China
3
School of Electric Power, South China University of Technology, Guangzhou 510641, China
*
Author to whom correspondence should be addressed.
Energies 2025, 18(17), 4501; https://doi.org/10.3390/en18174501
Submission received: 25 June 2025 / Revised: 18 August 2025 / Accepted: 19 August 2025 / Published: 25 August 2025

Abstract

In recent years, arresters in 10 kV distribution transformer areas of the Guangdong power grid have exhibited a rising trend of premature failures, posing a serious threat to distribution network reliability. This paper studied the failure causes of arresters through performance tests on failed arresters and through deterioration tests on new arresters and their prorated sections under typical operating stresses. The failed arresters and their internal varistors displayed varying degrees of physical damage and pronounced degradation in electrical performance, characterized by a strong polarity effect on the DC reference voltage (U1mA), elevated DC leakage current (IL) and resistive current (iR), and excessive residual voltage (U5kV). In the lightning impulse test, varistors primarily showed pinhole-type damage and significant polarity effects on ΔU1mA. In the AC aging test, ΔU5kV increased markedly. In the water immersion test, varistors exhibited salt deposits and aluminum electrode blackening, with ΔU1mA decreasing, while IL and ΔiR increased significantly. Overall, internal moisture superimposed on other operating stresses was identified as a major internal cause of arrester failure, while pollution flashover of the housing was considered the primary external factor. Corresponding improvement measures in material optimization, testing and inspection, and operation and maintenance are proposed to enhance arrester reliability.

1. Introduction

The distribution network is a critical component of the power system, connecting substations to end-users and ensuring the efficient and reliable delivery of electricity [1,2]. As the terminal section of the distribution network, the distribution transformer area refers to the service zone supplied by a single distribution transformer, and its operational stability directly influences the overall reliability of the power supply. Since most distribution transformer areas are located outdoors and possess relatively low insulation levels, they are exposed to a high risk of lightning failure [3,4]. To improve the operational reliability of distribution transformer areas under lightning conditions, zinc oxide (ZnO) arresters are typically installed adjacent to distribution transformers to mitigate lightning overvoltage and ensure equipment protection [5,6,7]. However, in recent years, arresters in 10 kV distribution transformer areas of China’s Guangdong power grid have increasingly exhibited frequent failures after just a few years of service, significantly compromising the operational safety of both the affected transformer areas and the broader distribution network.
The current failure analysis of arresters in distribution networks primarily depends on qualitative assessments of failure phenomena, lacking supplementary explanations derived from the degradation characteristics of arresters [8]. This could result in discrepancies in determining the failure causes and formulating appropriate countermeasures. Operational experience indicates that lightning impulses are the primary cause of arrester failures in distribution networks. Therefore, existing studies have primarily concentrated on the failure mechanisms of arresters under lightning impulse stress. The failure causes can be categorized into two primary aspects: one is that a single lightning impulse can cause severe instantaneous electrical stress, resulting in the breakdown or explosion of an arrester [9,10,11]; the other is that repeated lightning impulses over time can gradually degrade the electrical performance of internal ZnO varistors or cause physical damage to them, ultimately resulting in overall arrester failure [12,13]. In addition, in actual operating environments, arresters are subjected not only to lightning impulses but also to operating stresses such as industrial frequency voltage, internal moisture, and surface contamination, all of which may contribute to failure [14]. Specifically, the long-term application of industrial frequency voltage can lead to increased power loss and deterioration of the dielectric properties of ZnO varistors [15,16], while internal moisture or surface contamination can cause an abnormal temperature rise and an increase in the arrester’s leakage current [17,18]. Although the aforementioned studies have comprehensively examined the failure mechanisms of distribution network arresters under single operating stresses, actual failures are typically caused by the combined effects of different operating stresses. Current research lacks a systematic comparative analysis of the degradation characteristics of arresters under different typical operating stress conditions, hindering the accurate identification of the underlying causes of actual arrester failures.
Therefore, the primary contribution of this paper lies in the comprehensive analysis of the fundamental causes of failure of arresters in 10 kV distribution transformer areas based on performance testing of failed arresters and degradation testing of brand-new arresters and their prorated sections under different typical operating stress conditions. Furthermore, based on the identified fundamental causes of failure, targeted improvement measures are proposed. The study results offer theoretical guidance for diagnosing arrester failure causes in distribution transformer areas, thereby helping reduce arrester failure rates and enhancing the reliability and safety of power supply in the distribution network.
The remainder of this paper is organized as follows. Section 2 describes the selection of test samples and the design of the testing methodology. Section 3 presents the performance testing of failed arresters and the degradation testing of brand-new arresters and their prorated sections, along with the test results. Section 4 discusses the failure causes of arresters and proposes corresponding improvement measures. Finally, Section 5 summarizes the main findings and contributions of this paper.

2. Materials and Methods

2.1. Test Samples

In this paper, five failed arrester samples from 10 kV distribution transformer areas were selected for analysis, designated as #A1 through #A5. The samples came from three different arrester manufacturers, and the specific specifications are shown in Table 1. These arrester failures occurred after less than three years in service, indicating a service life significantly shorter than the designed lifespan.
In addition, to investigate the root causes of these premature failures, the same batch of brand-new arresters, together with their internal parts and varistors supplied by one of the aforementioned three arrester manufacturers, were also selected as test samples. These samples were subjected to degradation tests under typical operating stress conditions to investigate degradation patterns and analyze potential failure mechanisms.
Between 2019 and 2024, the Guangdong power grid in China recorded 596 failures of arresters in 10 kV distribution transformer areas. The causes of these failures were primarily derived from preliminary qualitative results obtained by power companies through three methods: on-site failure analysis, daily routine inspections (appearance inspections), and preventive testing (including infrared temperature measurement, electrical performance testing, and discharge counter action detection). The statistical distribution of failure causes is shown in Figure 1, with the main causes being pollution flashover (30.87%), lightning damage (22.65%), and housing cracking (18.62%). Pollution flashover typically occurs in high-humidity environments, and its high proportion suggests that these arresters may have been operating outdoors in such conditions for extended periods. The high incidence of housing cracking indicates a greater likelihood of seal failure, leading to internal moisture ingress and accelerated performance degradation. Likewise, the high proportion of lightning damage implies that arresters are susceptible to failure from lightning impulses during operation. Other failure causes include abnormal heating (8.56%), explosion (6.21%), aging (5.20%), side flashover (4.53%), and breakdown or burnout (3.36%). These failures often occur suddenly under normal industrial frequency voltage, indicating that industrial frequency voltage stress may also contribute to arrester failure. In summary, the main failure causes of arresters in 10 kV distribution transformer areas are closely associated with moisture ingress, lightning impulses, and industrial frequency voltage stress [14]. Therefore, the subsequent degradation tests in this paper focused on analyzing these three typical operating stresses.
In the degradation tests, all arrester samples were of the same type, YH5WS-17/50, and the varistor samples used were D35 type (35 mm in diameter, 28 mm thick). The internal part samples were formed by stacking multiple varistors in series and encapsulating them with engineering plastic through injection molding, resulting in what is referred to as an injection molded structural internal part. As this engineering plastic is typically sourced from the Durethan brand produced by the German company Lanxess, it is commonly known in the industry as the “Durethan structural internal part.”

2.2. Test Methods

Tests on failed arrester samples included visual inspection of the arrester bodies and internal varistors, as well as electrical performance measurements. Tests on brand-new arresters and their prorated sections included lightning impulse test, AC aging test, and water immersion test.
The lightning impulse test was conducted with reference to the repetitive charge transfer test specified in IEC 60099-4:2014, applying a negative polarity impulse current with an 8/20 μs waveform to ten brand-new ZnO varistors [19]. The impulse current amplitude was calculated to be 22.32 kA based on the rated charge transfer of 0.3 C for the varistor. Each group of tests involved two impulses with an interval of 50–60 s. Sufficient cooling time was provided between test groups to ensure that the samples returned to room temperature. After each test group, once the varistor had cooled to room temperature, its appearance was examined for any visible signs of damage. If damage was observed, the specific damage mode was documented and the test was terminated. If no visible damage was detected, electrical performance measurements were conducted and the next test group commenced until the sample was damaged. It is worth noting that the repetitive charge transfer test specified in the IEC standard is applicable only to individual varistors. To better reflect the actual structure and operating conditions of the arrester, this paper extended the scope of testing by selecting five brand-new internal part samples with an injection molded structure for additional lightning impulse testing. The test setup for the internal parts and varistors was essentially identical, with the primary difference being that the electrical performance of the internal parts was measured after every three groups of tests. The lightning impulse test platform is illustrated in Figure 2.
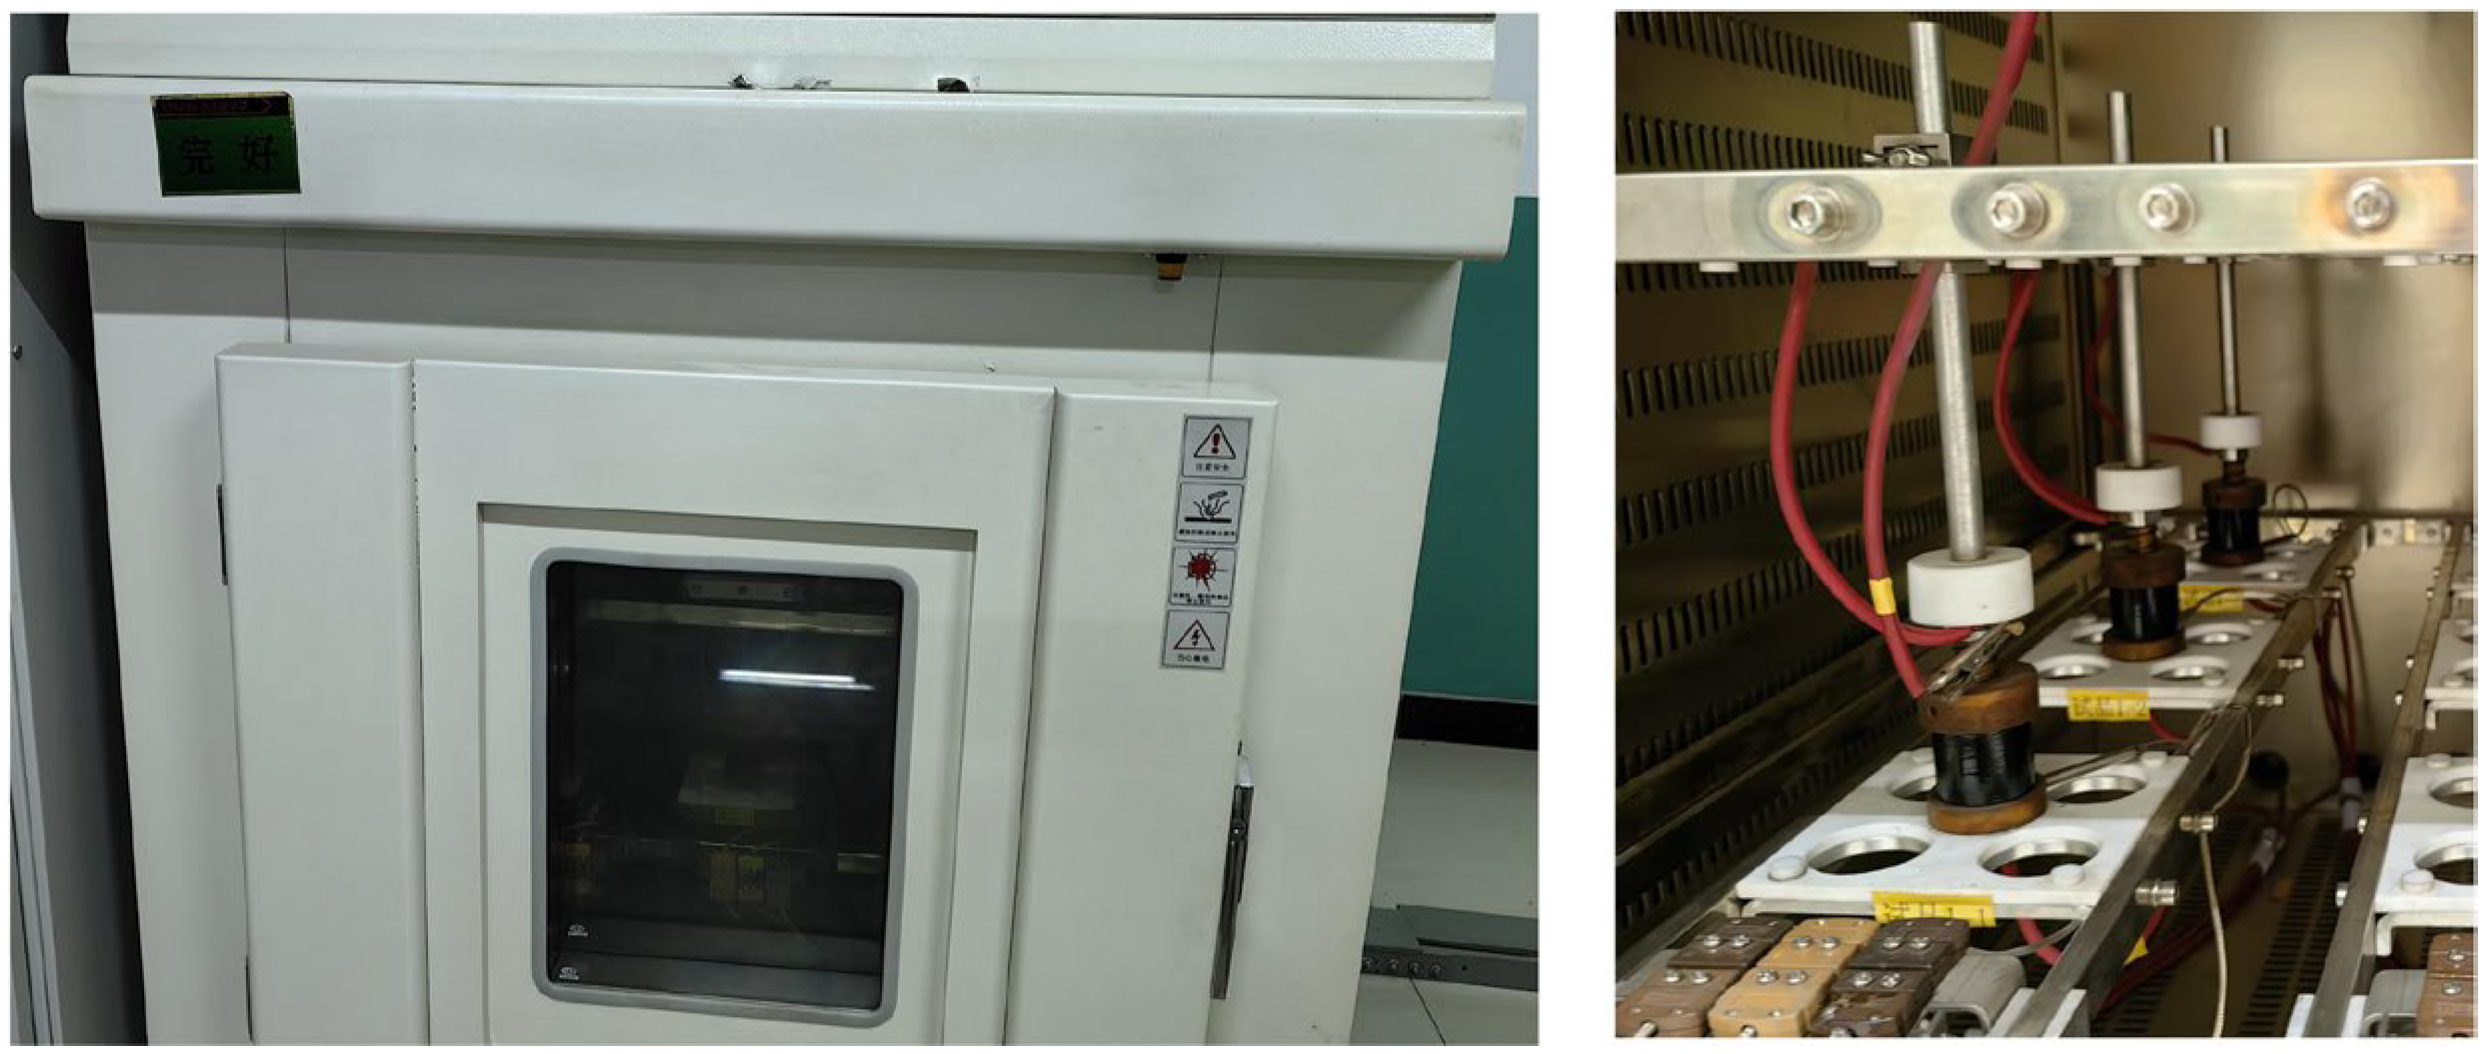
The test conducted under industrial frequency voltage is commonly referred to as the AC aging test. In this paper, an accelerated AC aging method was employed, wherein three brand-new ZnO varistors were heated to 135 °C and subjected to the AC voltage described by Equation (1) [20]. Ouyang et al. demonstrated that operating this test for 160 h is equivalent to conducting the long-term stability test specified in IEC 60099-4:2014 for 1000 h, which involves heating to 115 °C and applying a modified maximum continuous operating voltage [21]. Both methods yield equivalent results in terms of the AC aging characteristics of the varistors. This accelerated aging approach has since been adopted by several researchers and has yielded reliable results [22,23]. In this study, to further investigate the AC aging characteristics of varistors, the total test duration was extended from 160 h to 480 h (20 days) to observe potential long-term degradation phenomena beyond the standard equivalent period. During the test, the samples were removed every two days, cooled to room temperature, and subjected to visual inspection and electrical performance testing. If any damage was detected, the test was immediately terminated; otherwise, testing continued until the 20-day period was completed. The AC aging test platform is shown in Figure 3.
U = s U 1 m A 2
where U is the applied voltage, U1mA is the initial DC reference voltage, and s is the applied voltage ratio, which is assigned a value of 0.85, as recommended by the IEC standard [15].
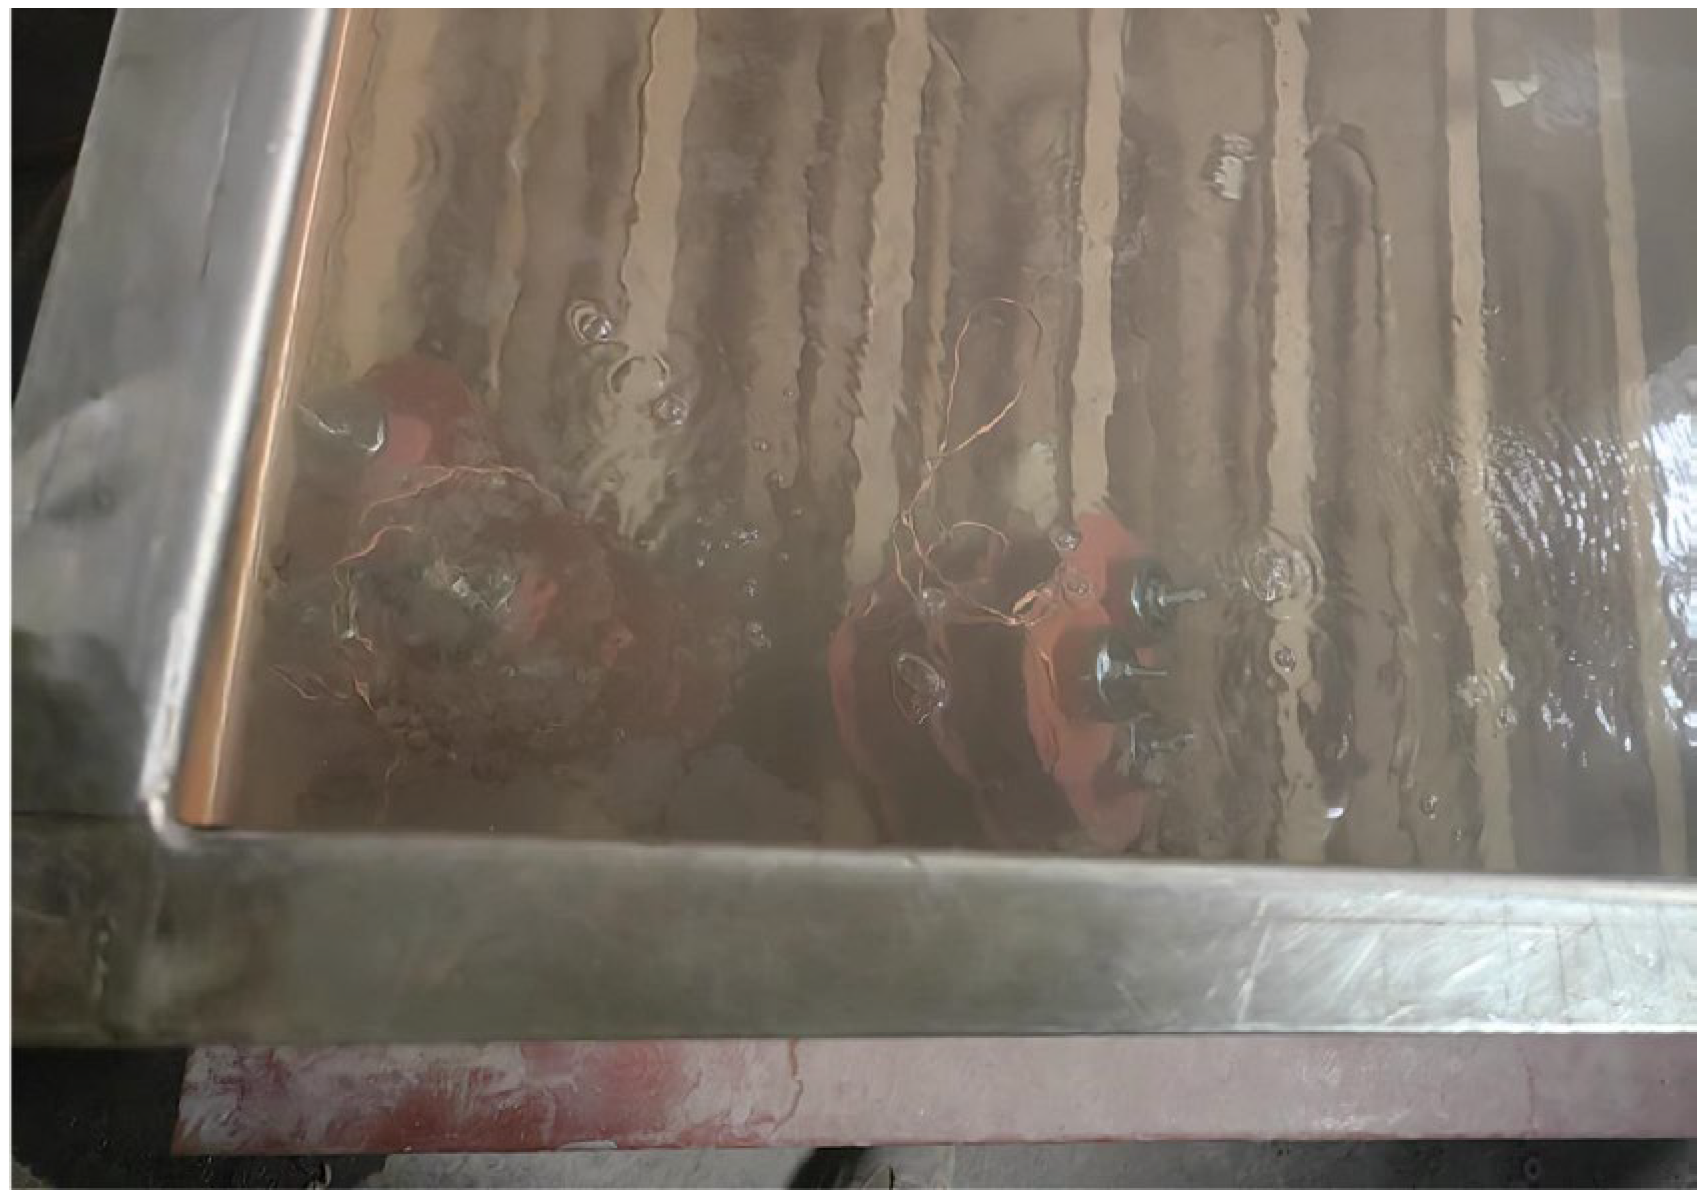
The water immersion test was conducted with reference to the relevant provisions of IEC 60099-4:2014, in which the standard immersion time is 42 h. To more comprehensively evaluate the withstand capacity of the samples under severe moisture conditions, the immersion period in this study was extended to 96 h. Three brand-new arrester samples were immersed in deionized water with a NaCl concentration of 1 kg/m3, following the IEC-recommended configuration [19]. Additionally, to simulate specific sealing failure scenarios, three brand-new internal part samples with an injection molded structure and three brand-new varistor samples were tested under identical immersion conditions. The internal parts were used to simulate sealing failure of the arrester’s silicone rubber housing, while the varistors were used to represent sealing failure within the internal part structure. At the end of the test, the samples were removed, cooled to room temperature, and subjected to electrical performance testing within 8 h. Subsequently, the samples were placed in a temperature-controlled oven at 60 °C for 4 h of drying time, then cooled to room temperature and tested again for electrical performance. The water immersion test platform is shown in Figure 4.
During the test, the environmental and stress conditions for each independent sample were strictly controlled and kept consistent to ensure the validity, reproducibility, and comparability of the results.
The type tests specified in IEC 60099-4:2014 are intended to verify the conformity of arrester products, but their results may not necessarily reflect the products’ failure characteristics. Although this paper was based on the type test framework for its test setup, it further adopted more stringent conditions (increasing the number of lightning impulses, extending the duration of AC aging and water immersion tests) and introduced a wider variety of test samples to more comprehensively reveal failure characteristics that may not be reflected in standard type tests.

2.3. Electrical Performance Measurement Methods

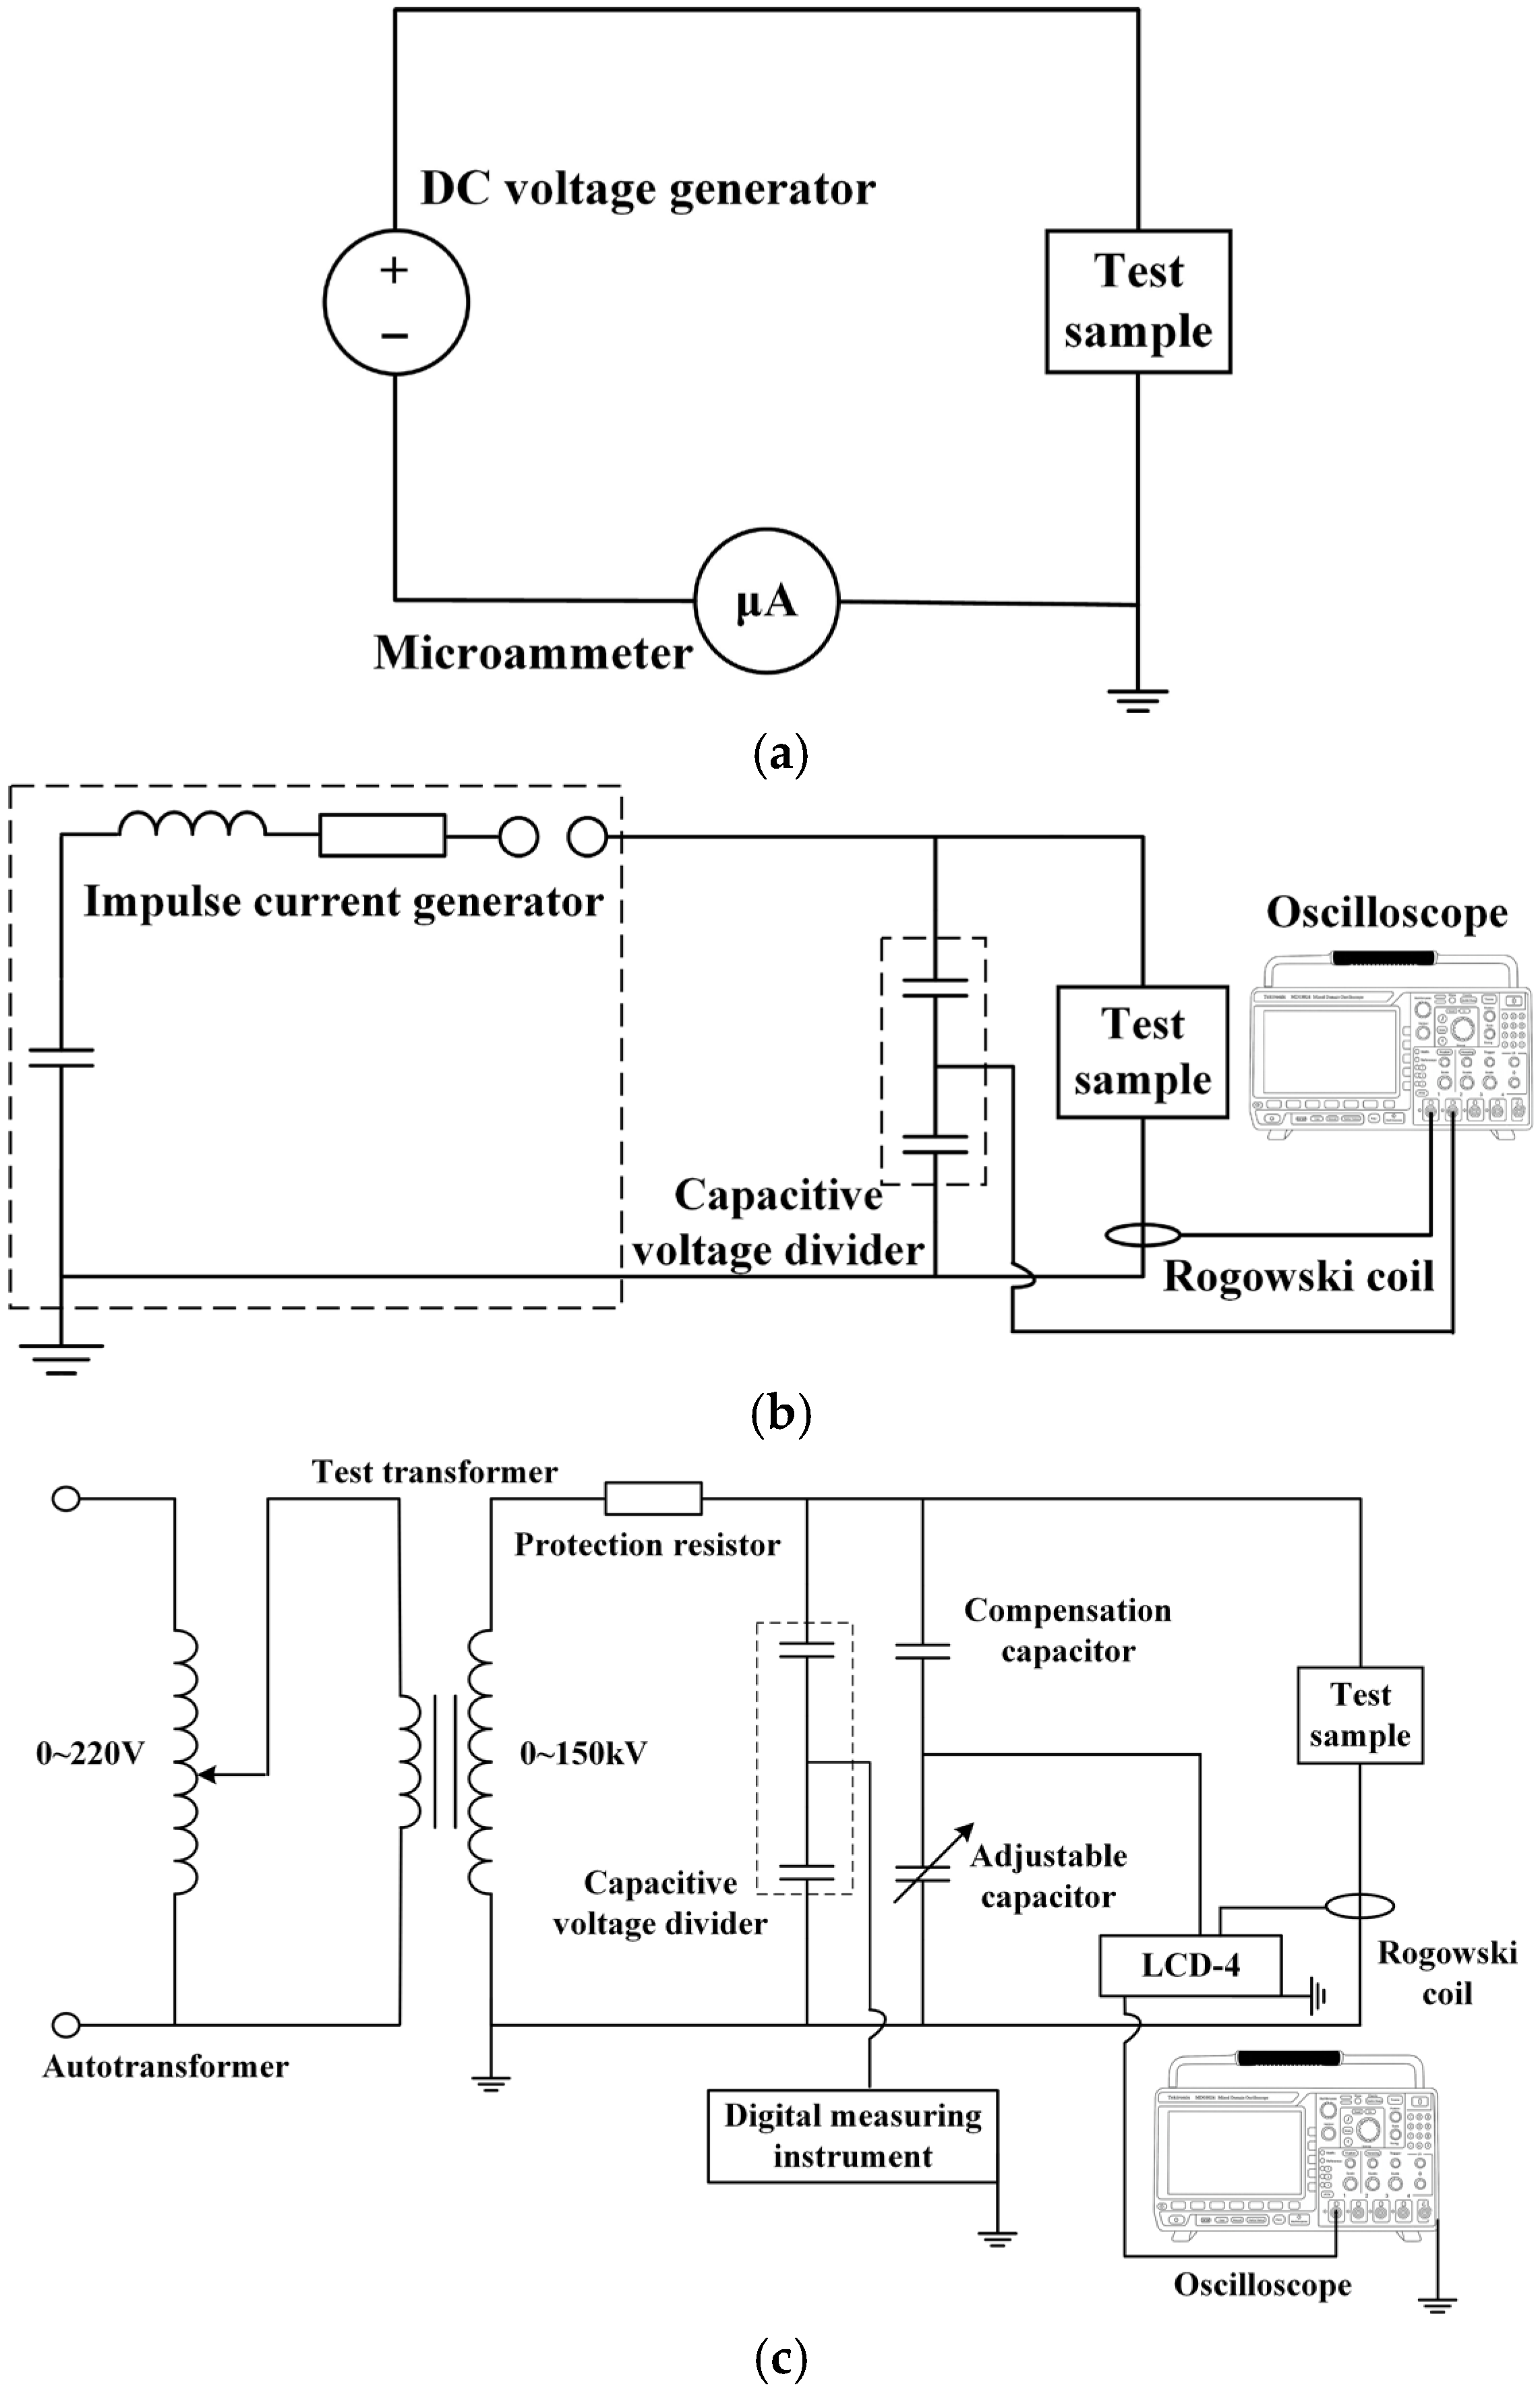
The electrical parameters measured included the forward DC reference voltage (U1mA–F), the reverse DC reference voltage (U1mA–R), the leakage current (IL) at 0.75 × U1mA–F, the residual voltage (U5kA), and the resistive current (iR) at the continuous operating voltage (approximately 0.8 times the rated voltage). The corresponding measurement circuit is illustrated in Figure 5. In practical applications, the nameplate end of the arrester is designated as the high-voltage end, while the opposite end serves as the ground. In degradation tests, the side of the test sample into which lightning impulse current and AC voltage are injected is defined as the high-voltage end, and the other side as the ground terminal. Accordingly, in this paper, the DC reference voltages measured by connecting the high-voltage and grounded terminals of the test sample to the high-voltage terminal of the DC voltage generator are defined as the forward DC reference voltage (U1mA–F) and the reverse DC reference voltage (U1mA–R), respectively. The leakage current (IL) at 0.75 × U1mA–F was also measured by connecting the high-voltage terminal of the test sample to the high-voltage terminal of the DC voltage generator.

3. Results

3.1. Performance Testing Results of Failed Arresters

The appearance of the failed arrester samples is shown in Figure 6. Sample #A1 appeared intact; sample #A2 exhibited obvious corrosion on the top metal component; sample #A3 showed severe contamination buildup on the silicone rubber housing; and samples #A4 and #A5 showed contamination buildup along with visible traces of side flashover on the silicone rubber housing.
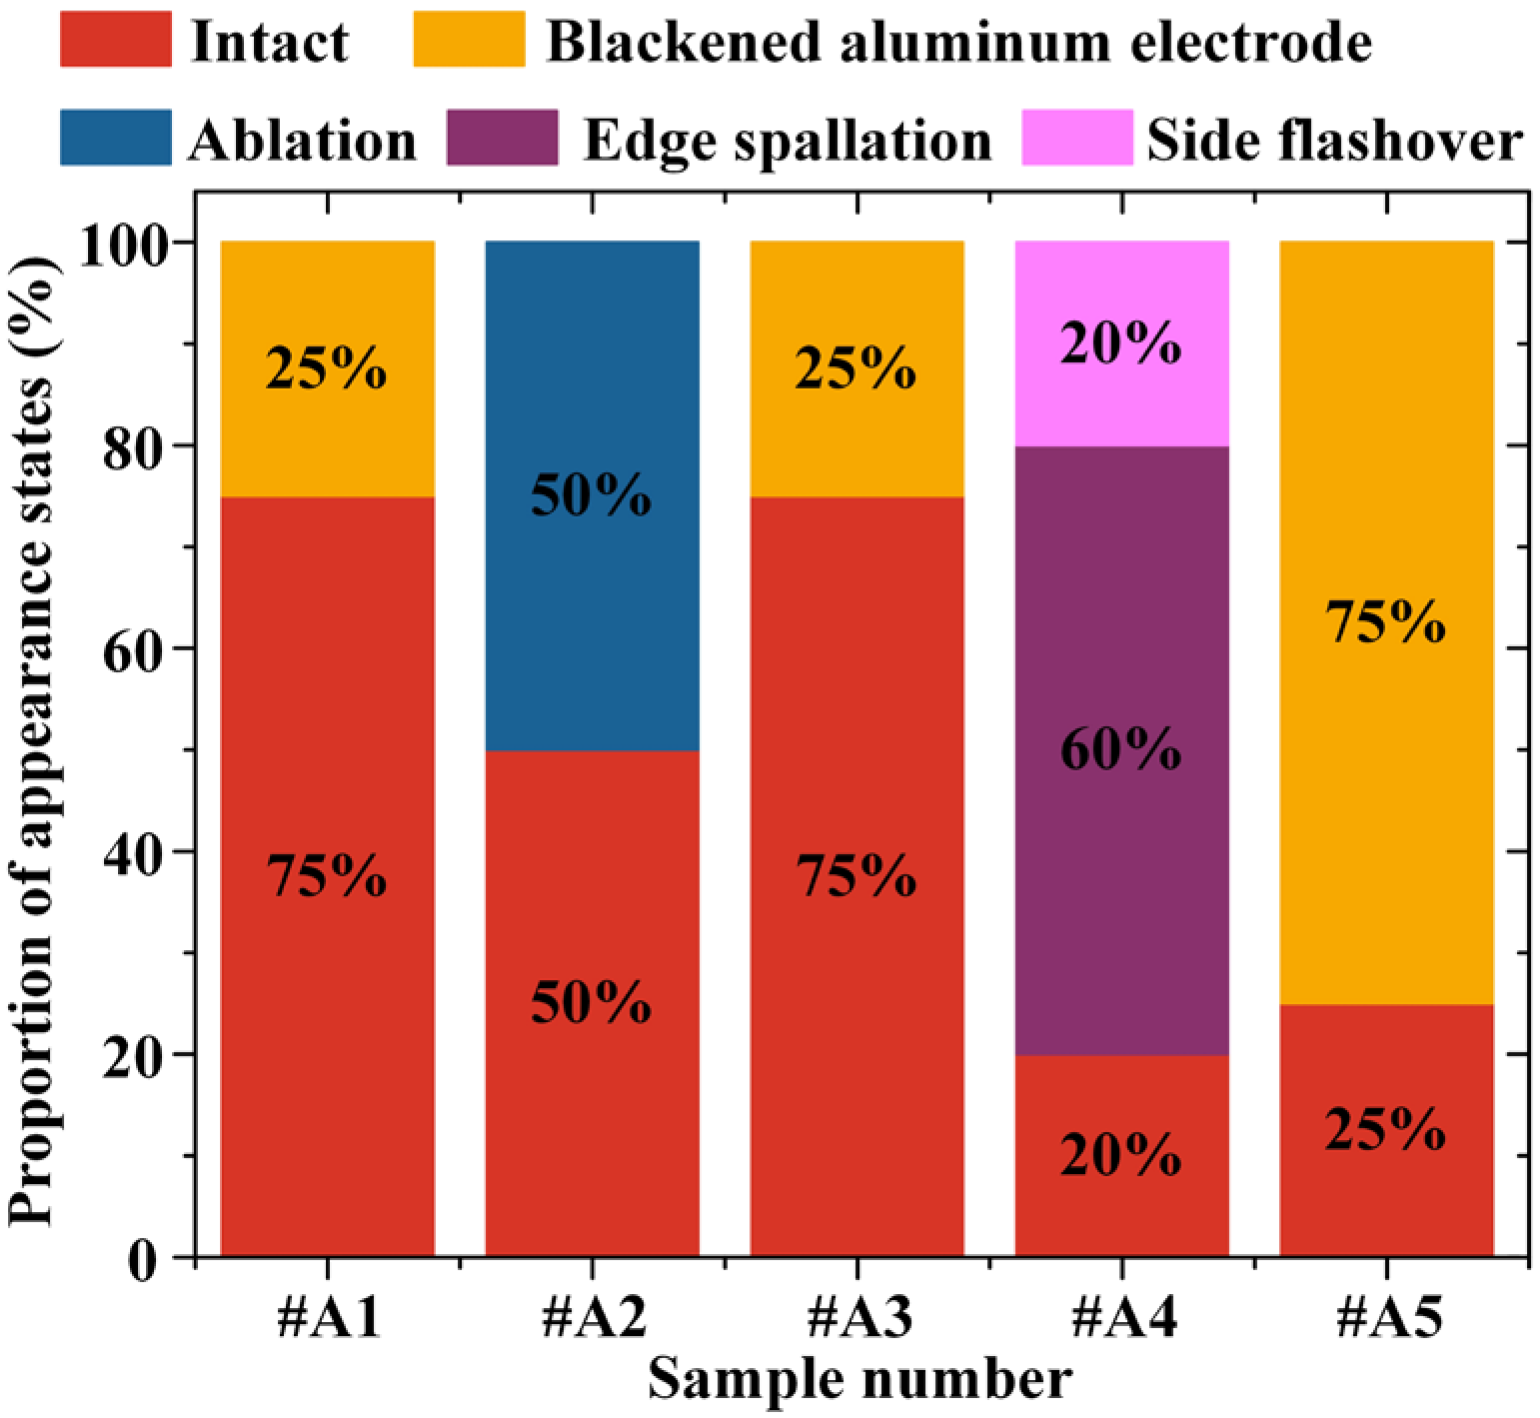
The failed arrester samples were further disassembled to analyze the damage modes and their proportions within the internal varistors, and the results are shown in Figure 7 and Figure 8. Typical damage modes included blackened aluminum electrode, ablation, edge spallation, and side flashover. Blackened aluminum electrodes were observed in some varistors from samples #A1, #A3, and #A5; ablation was present in sample #A2; and edge spallation and side flashover were identified in sample #A4.
The electrical performance test results are presented in Table 2. As shown in Table 2, the DC reference voltages U1mA–F and U1mA-R for samples #A1–#A5 all exceeded 25 kV, and the leakage current IL remained below 50 μA, falling within the specified range. However, the residual voltage U5kA of sample #A1 exceeded the specified value of 50 kV. Sample #A2 not only exceeded the U5kA limit but also exhibited a significantly elevated resistive current. Sample #A3 showed a difference between U1mA–F and U1mA–R, indicating a pronounced polarity effect [24,25], and its U5kA was close to the prescribed upper limit. The DC reference voltages of samples #A4 and #A5 also exhibited a polarity effect, and both IL and iR were notably elevated.
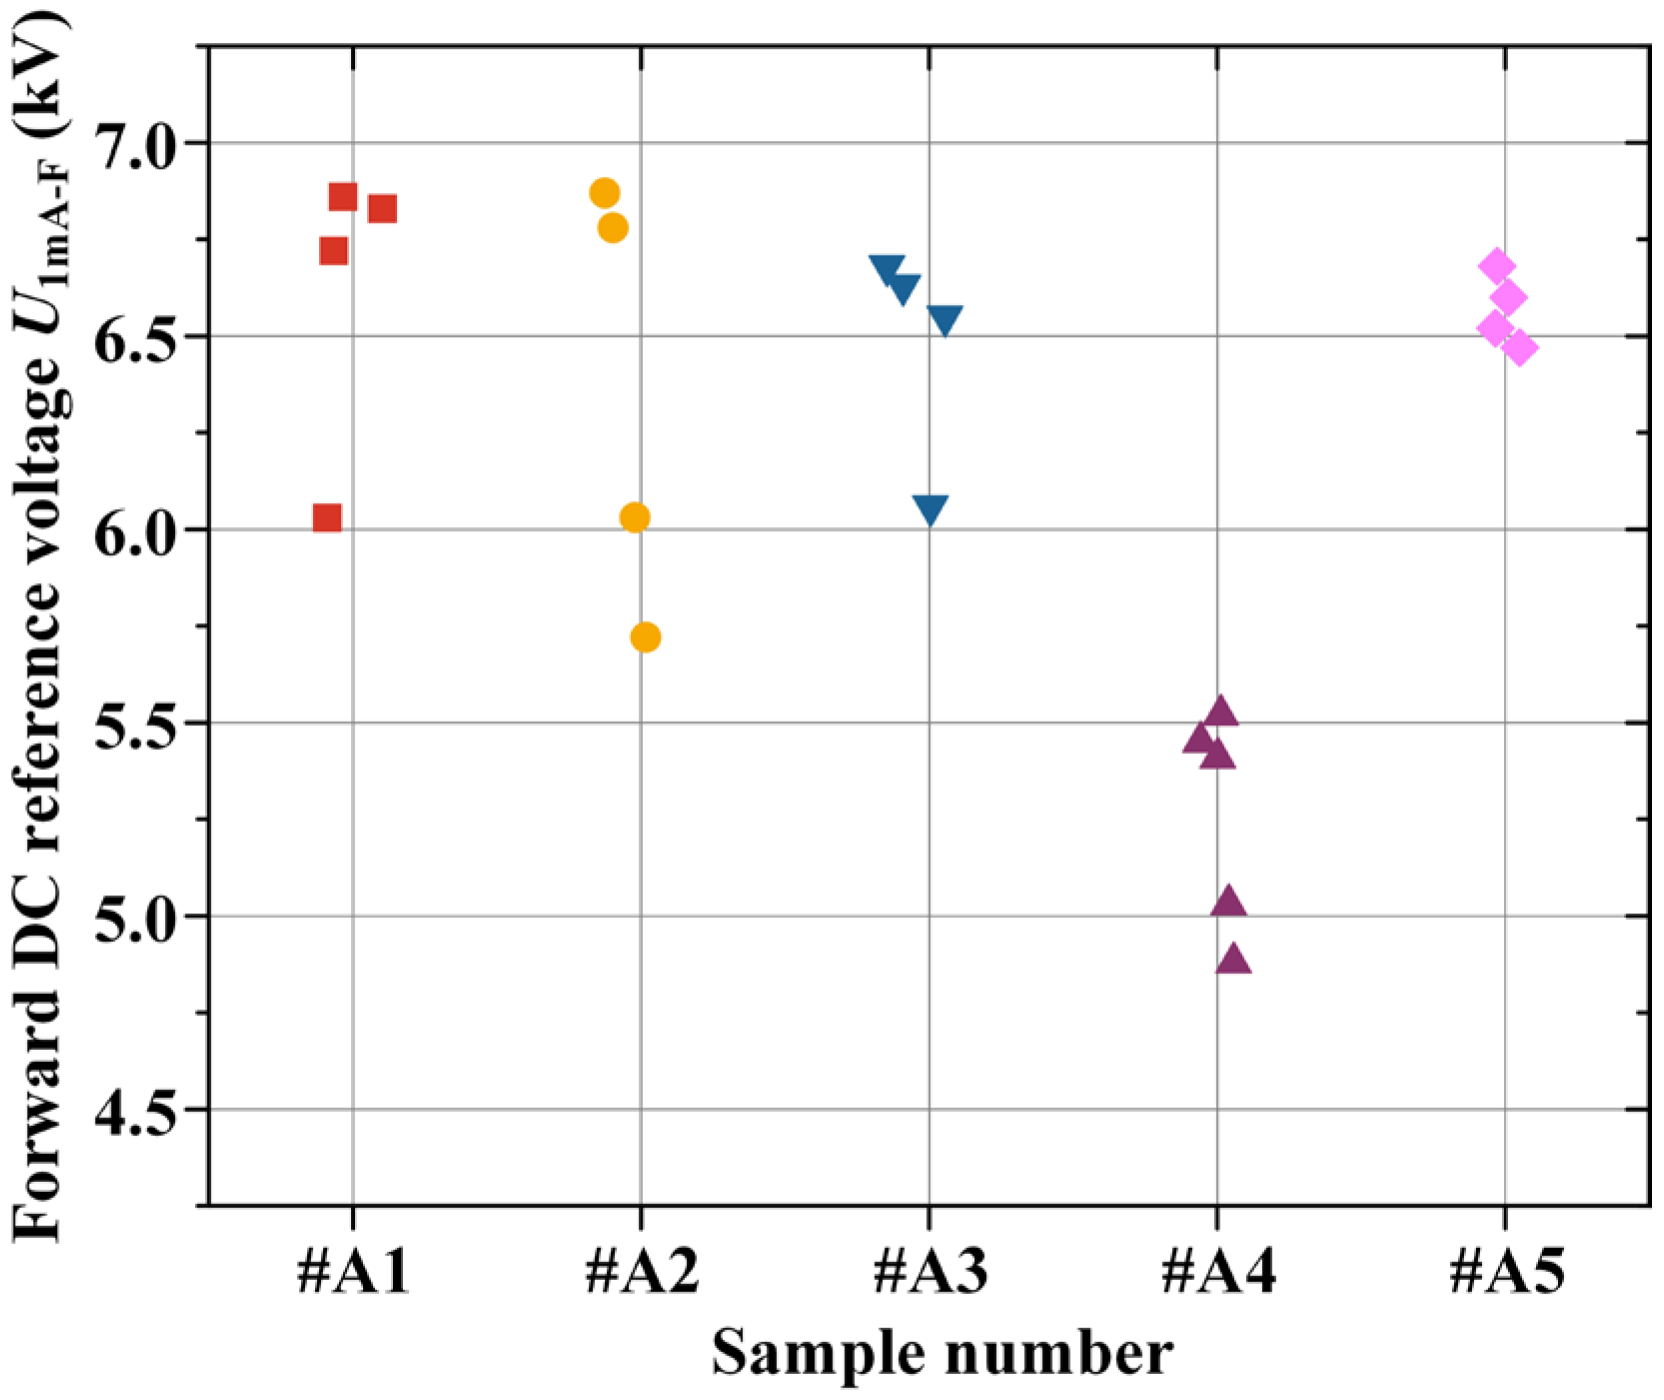
The dispersion in DC reference voltage among the internal varistors was further evaluated using the forward DC reference voltage U1mA–F as a representative parameter, and the results are shown in Figure 9. Except for sample #A5, all other samples exhibited low U1mA–F values in certain varistors, indicating relatively high voltage dispersion. Greater voltage dispersion leads to an increased operating burden on the remaining varistors, which in turn accelerates their aging process [26,27]. Notably, samples #A1–#A3 and #A5 each consisted of four varistors in series, whereas sample #A4 contained five, resulting in a relatively lower U1mA–F per varistor in sample #A4 compared to the others.

3.2. Lightning Impulse Test Results

Typical damage modes observed in varistor samples under lightning impulse included cracking with localized spalling, cracking along pinholes, severe ablation at pinholes, and severe ablation accompanied by side flashover, with the vast majority of damage falling under the pinhole damage category. The typical damage modes observed in the internal part samples included destruction of the injection molded structure, accompanied by cracking with localized spalling or melting of the internal varistors. Typical damage modes are illustrated in Figure 10.
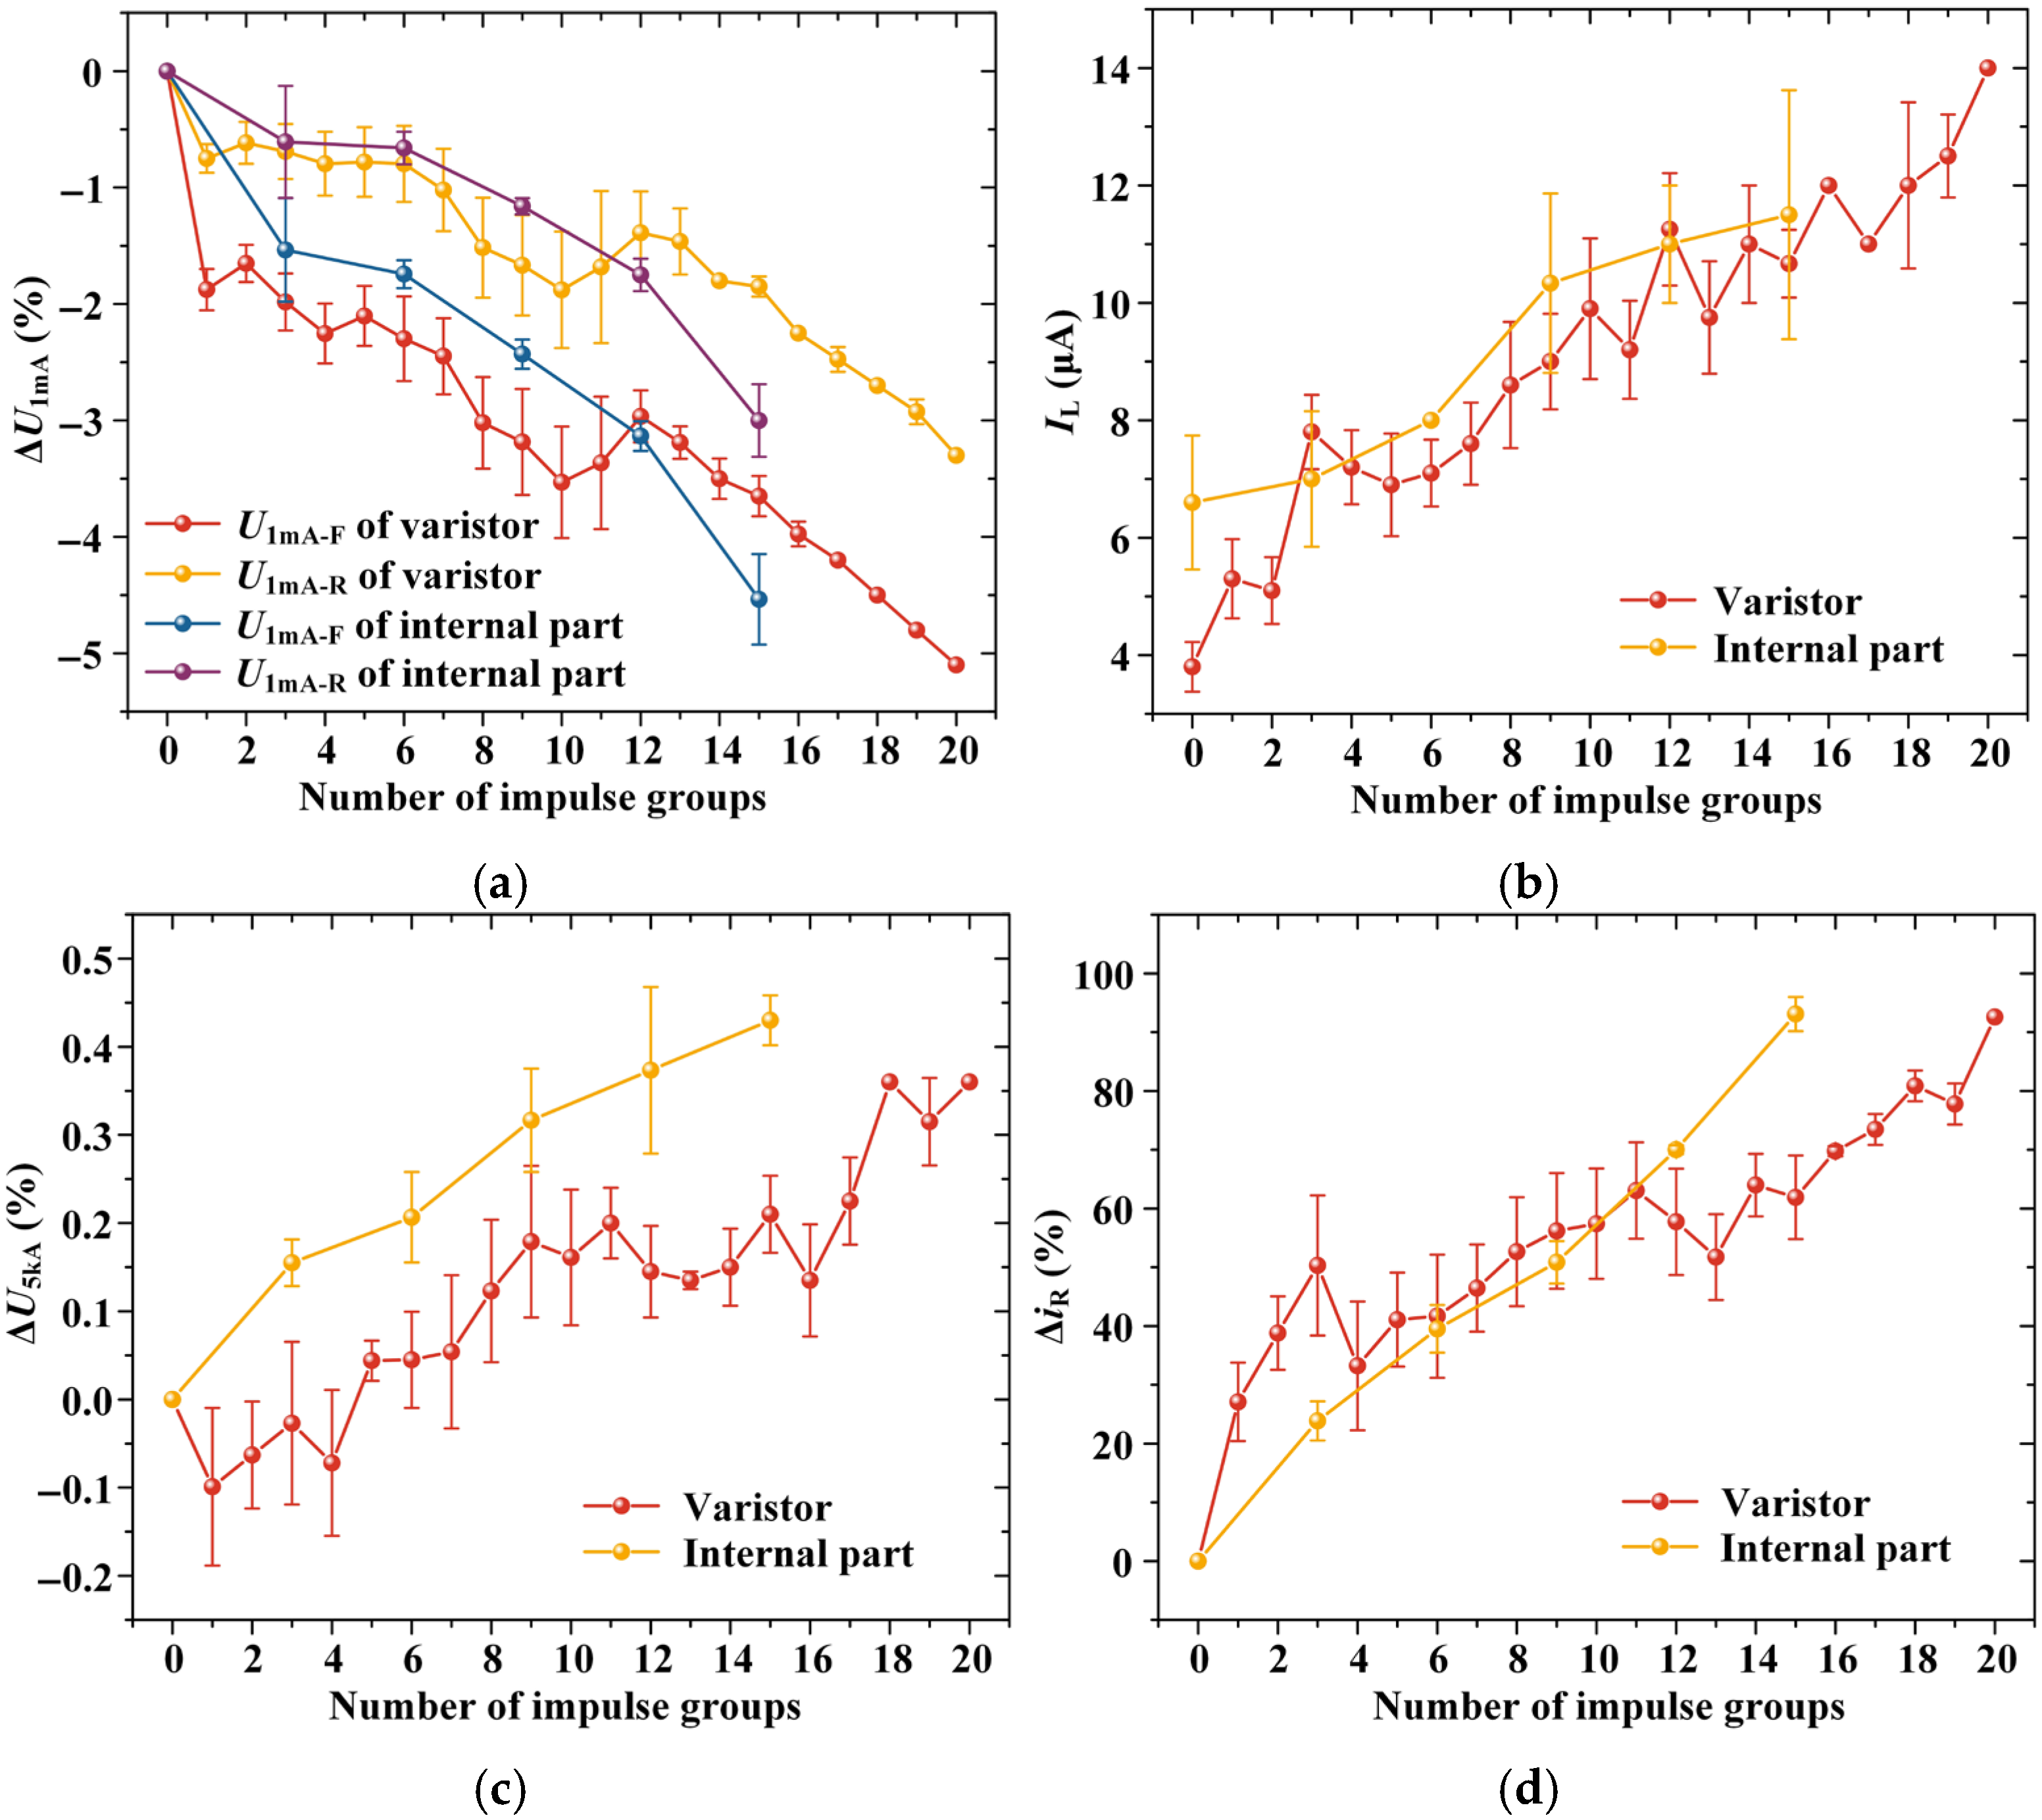
Figure 11 illustrates the trends in electrical performance of the varistor samples and internal part samples during the lightning impulse test. Here, ∆U1mA, ∆U5kA, and ∆iR represent the change rate of the DC reference voltage (U1mA), residual voltage (U5kA), and resistive current (iR), respectively, relative to their initial values. The error bars represent the standard deviations calculated from ten varistor samples and five internal part samples tested under identical lightning impulse conditions. As shown in Figure 11a, the change rate of the DC reference voltage, ∆U1mA, gradually decreased with increasing numbers of impulse groups. Notably, the change rate of the forward DC reference voltage (ΔU1mA–F) decreased significantly more than that of the reverse DC reference voltage (ΔU1mA–R), indicating a pronounced polarity effect. Moreover, during the first 12 impulse groups, ∆U1mA for the varistor samples decreased more rapidly than that of the internal part samples, suggesting that the varistors underwent faster degradation during the early to mid-aging stage. Figure 11b shows that the leakage current (IL) exhibited a continuous upward trend with increasing numbers of impulse groups, with the increase in IL being more pronounced for the varistor samples than for the internal part samples. From Figure 11c, it can be observed that the residual voltage change rate (ΔU5kA) also increased with the number of impulse groups, with a slightly larger increase observed in the internal part samples compared to the varistor samples. However, the overall change in ΔU5kA remained minimal, with values below 0.5%, indicating that the effect of lightning impulses on residual voltage is not significant. Figure 11d further demonstrates that the change rate of resistive current (∆iR) continued to rise with the number of impulse groups. During the first 12 impulse groups, the change rate of the resistive current (∆iR) for the varistor samples increased more than that of the internal part samples, further supporting the conclusion that the varistors degraded more rapidly during the early to mid-aging stage.
According to the requirements of IEC 60099-4:2014, samples subjected to the repetitive charge transfer test should not exhibit damage or severe deterioration in electrical performance after 10 groups of lightning impulses. In this paper, all 10 ZnO varistor samples successfully passed the test, whereas two out of five internal part samples failed due to structural damage. These results indicate that although ZnO varistors exhibit faster degradation in electrical performance under lightning impulse conditions, their structural stability is superior to that of internal parts. The encapsulated design of the internal parts restricts heat dissipation, leading to higher temperature rise during impulse conditions, which increases the likelihood of damage to the injection molded structure and the internal varistors. Further analysis reveals that the IEC standard adopts a single varistor as the prorated section, which can reasonably reflect the deterioration trend of electrical performance under lightning impulses. However, it does not fully account for potential failure modes of the complete encapsulated structure induced by the coupling effects of thermal, electrical, and mechanical stresses. As a result, the overall failure risk under actual operating conditions may be underestimated.

3.3. AC Aging Test Results

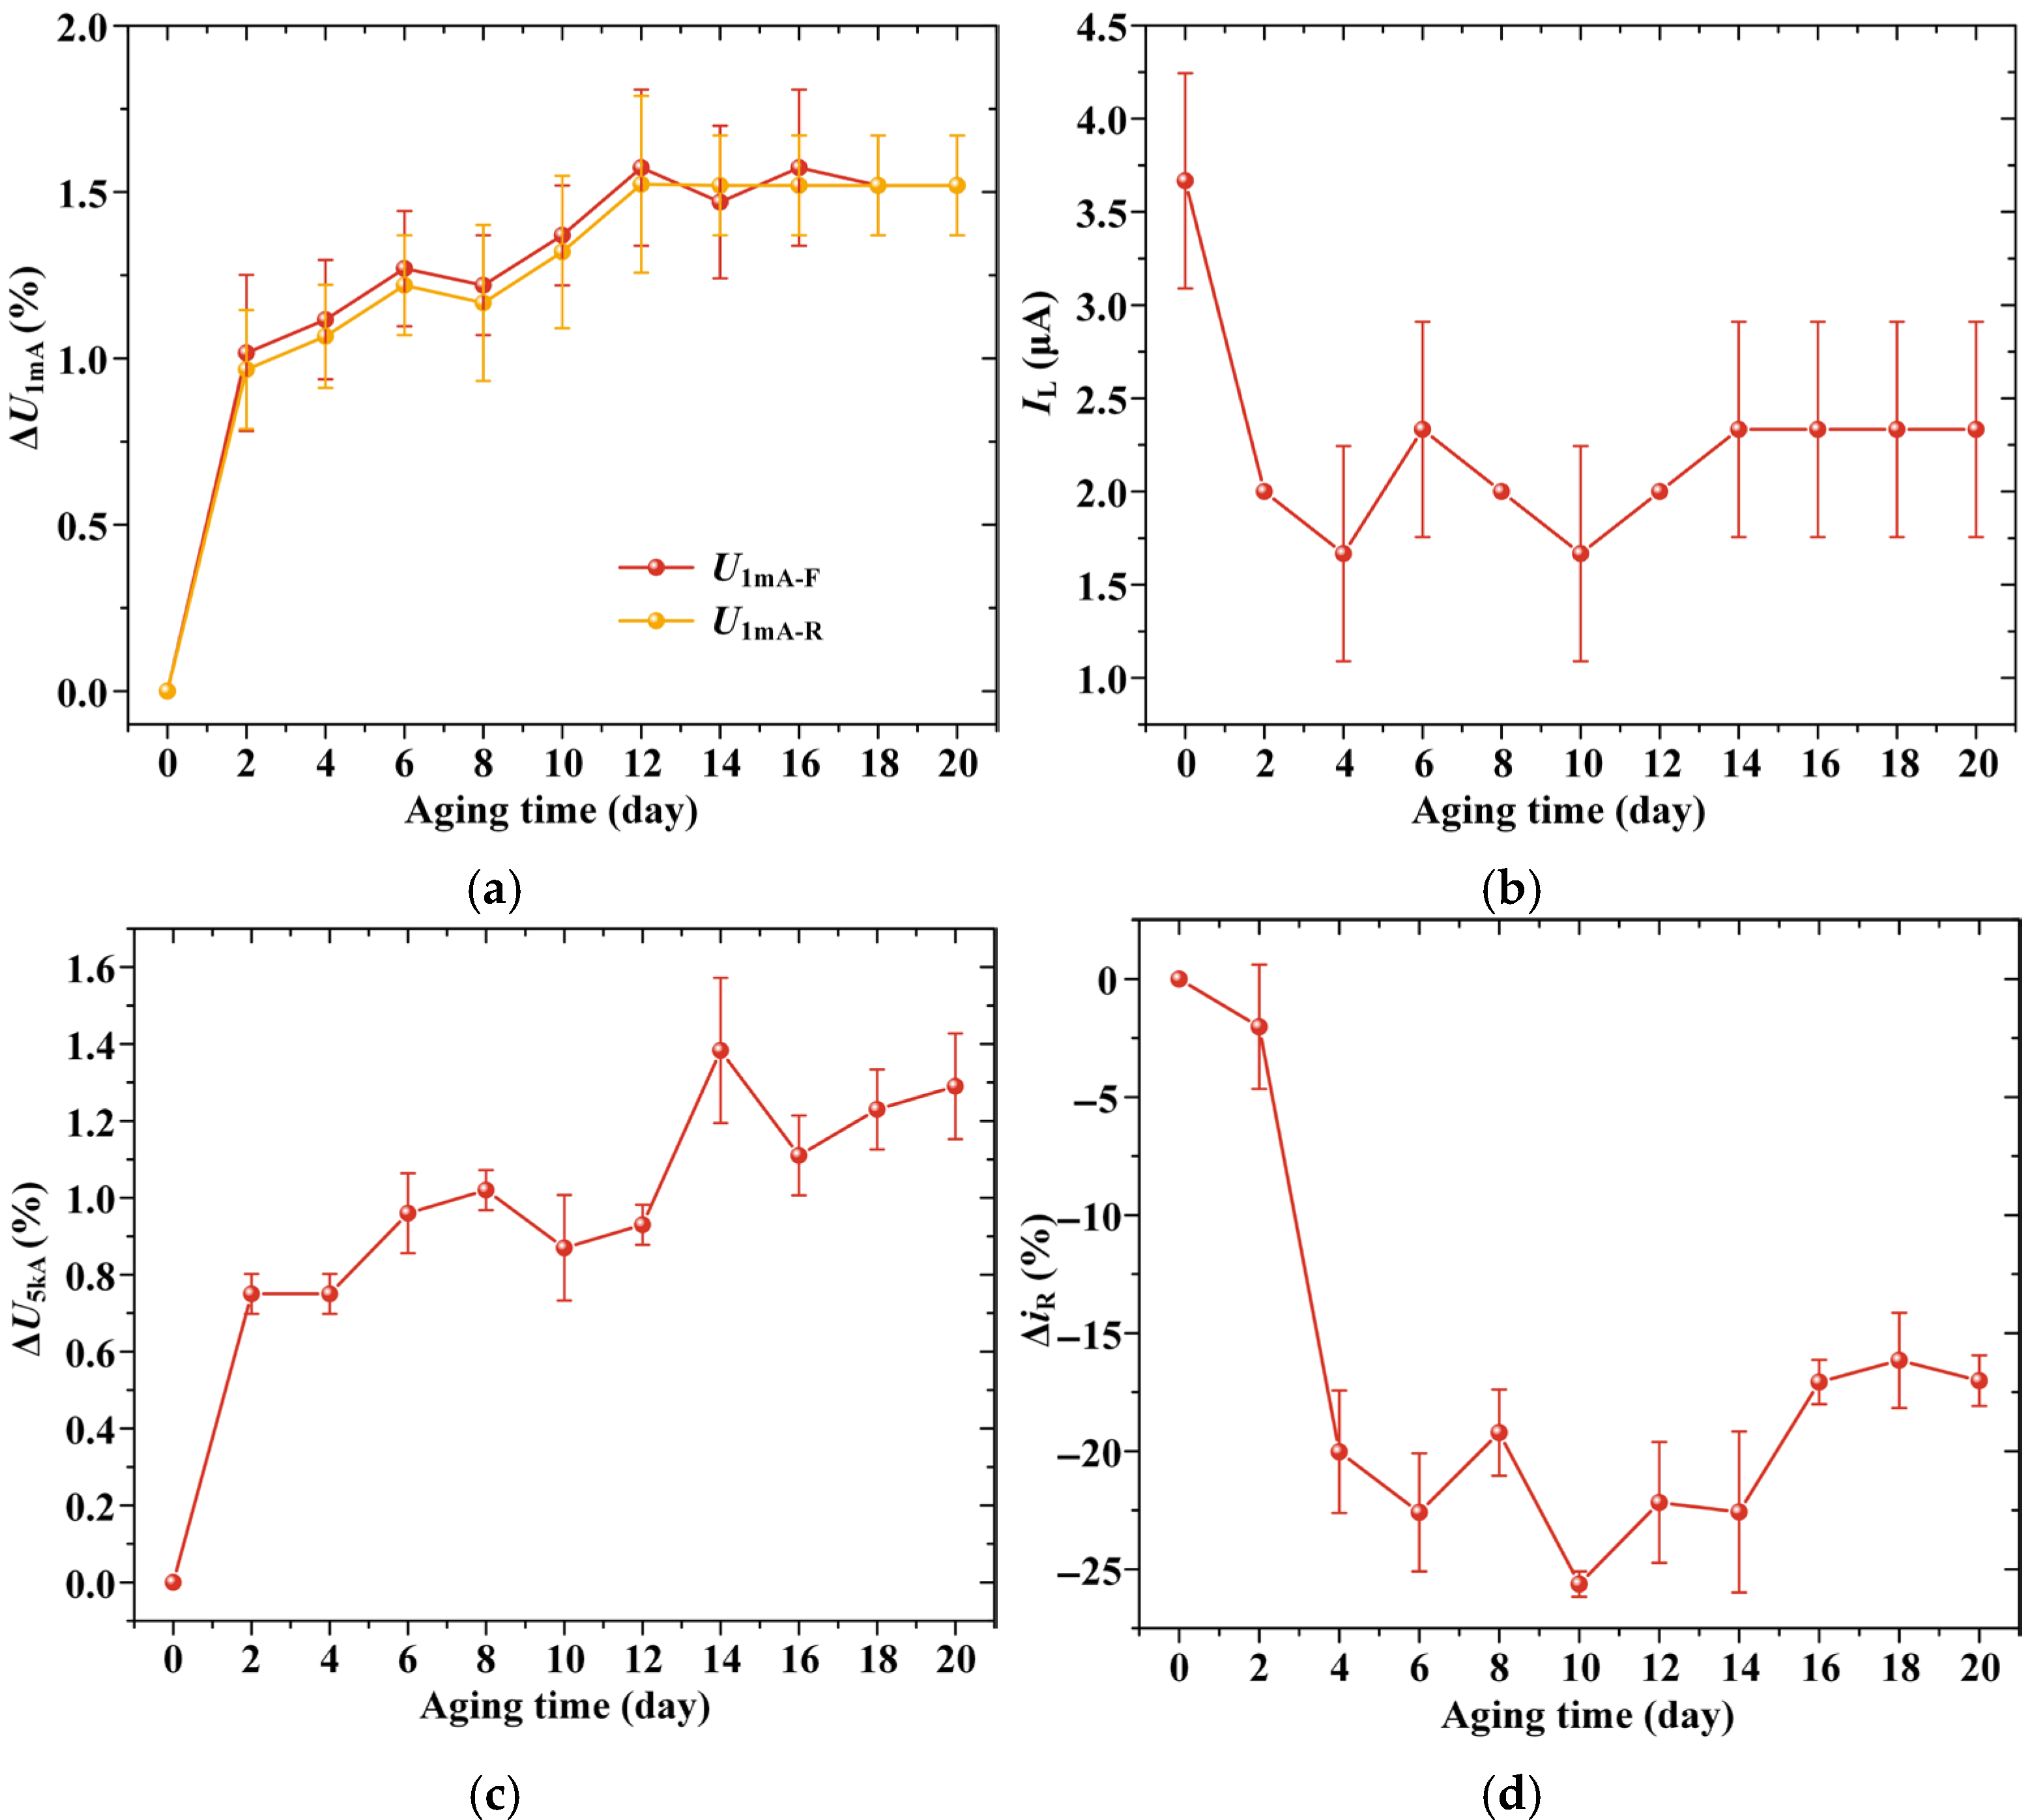
During the AC aging test, the varistor samples did not exhibit any physical damage, but showed only changes in electrical performance, as illustrated in Figure 12. The error bars represent the standard deviations based on three varistor samples tested under identical AC aging conditions. As shown in Figure 12a, with increasing aging time, the DC reference voltage change rate (ΔU1mA) followed a trend of rapid initial increase, followed by a slower rise, and eventually plateaued. Notably, the forward and reverse DC reference voltage change rates (ΔU1mA–F and ΔU1mA–R) exhibited similar trends without any significant polarity effect. Figure 12b shows that the leakage current (IL) decreased markedly at the beginning of the test and then stabilized. Figure 12c shows that the residual voltage change rate (ΔU5kA) exhibited a trend of rapid increase followed by slower growth as aging time progressed. Figure 12d illustrates that the trend of the resistive current change rate (ΔiR) closely resembled that of the leakage current (IL), with both parameters decreasing initially before stabilizing. In summary, the varistor samples exhibited stable electrical performance during the AC aging test, indicating that AC voltage operating stress alone is insufficient to initiate arrester failure.

3.4. Water Immersion Test Results

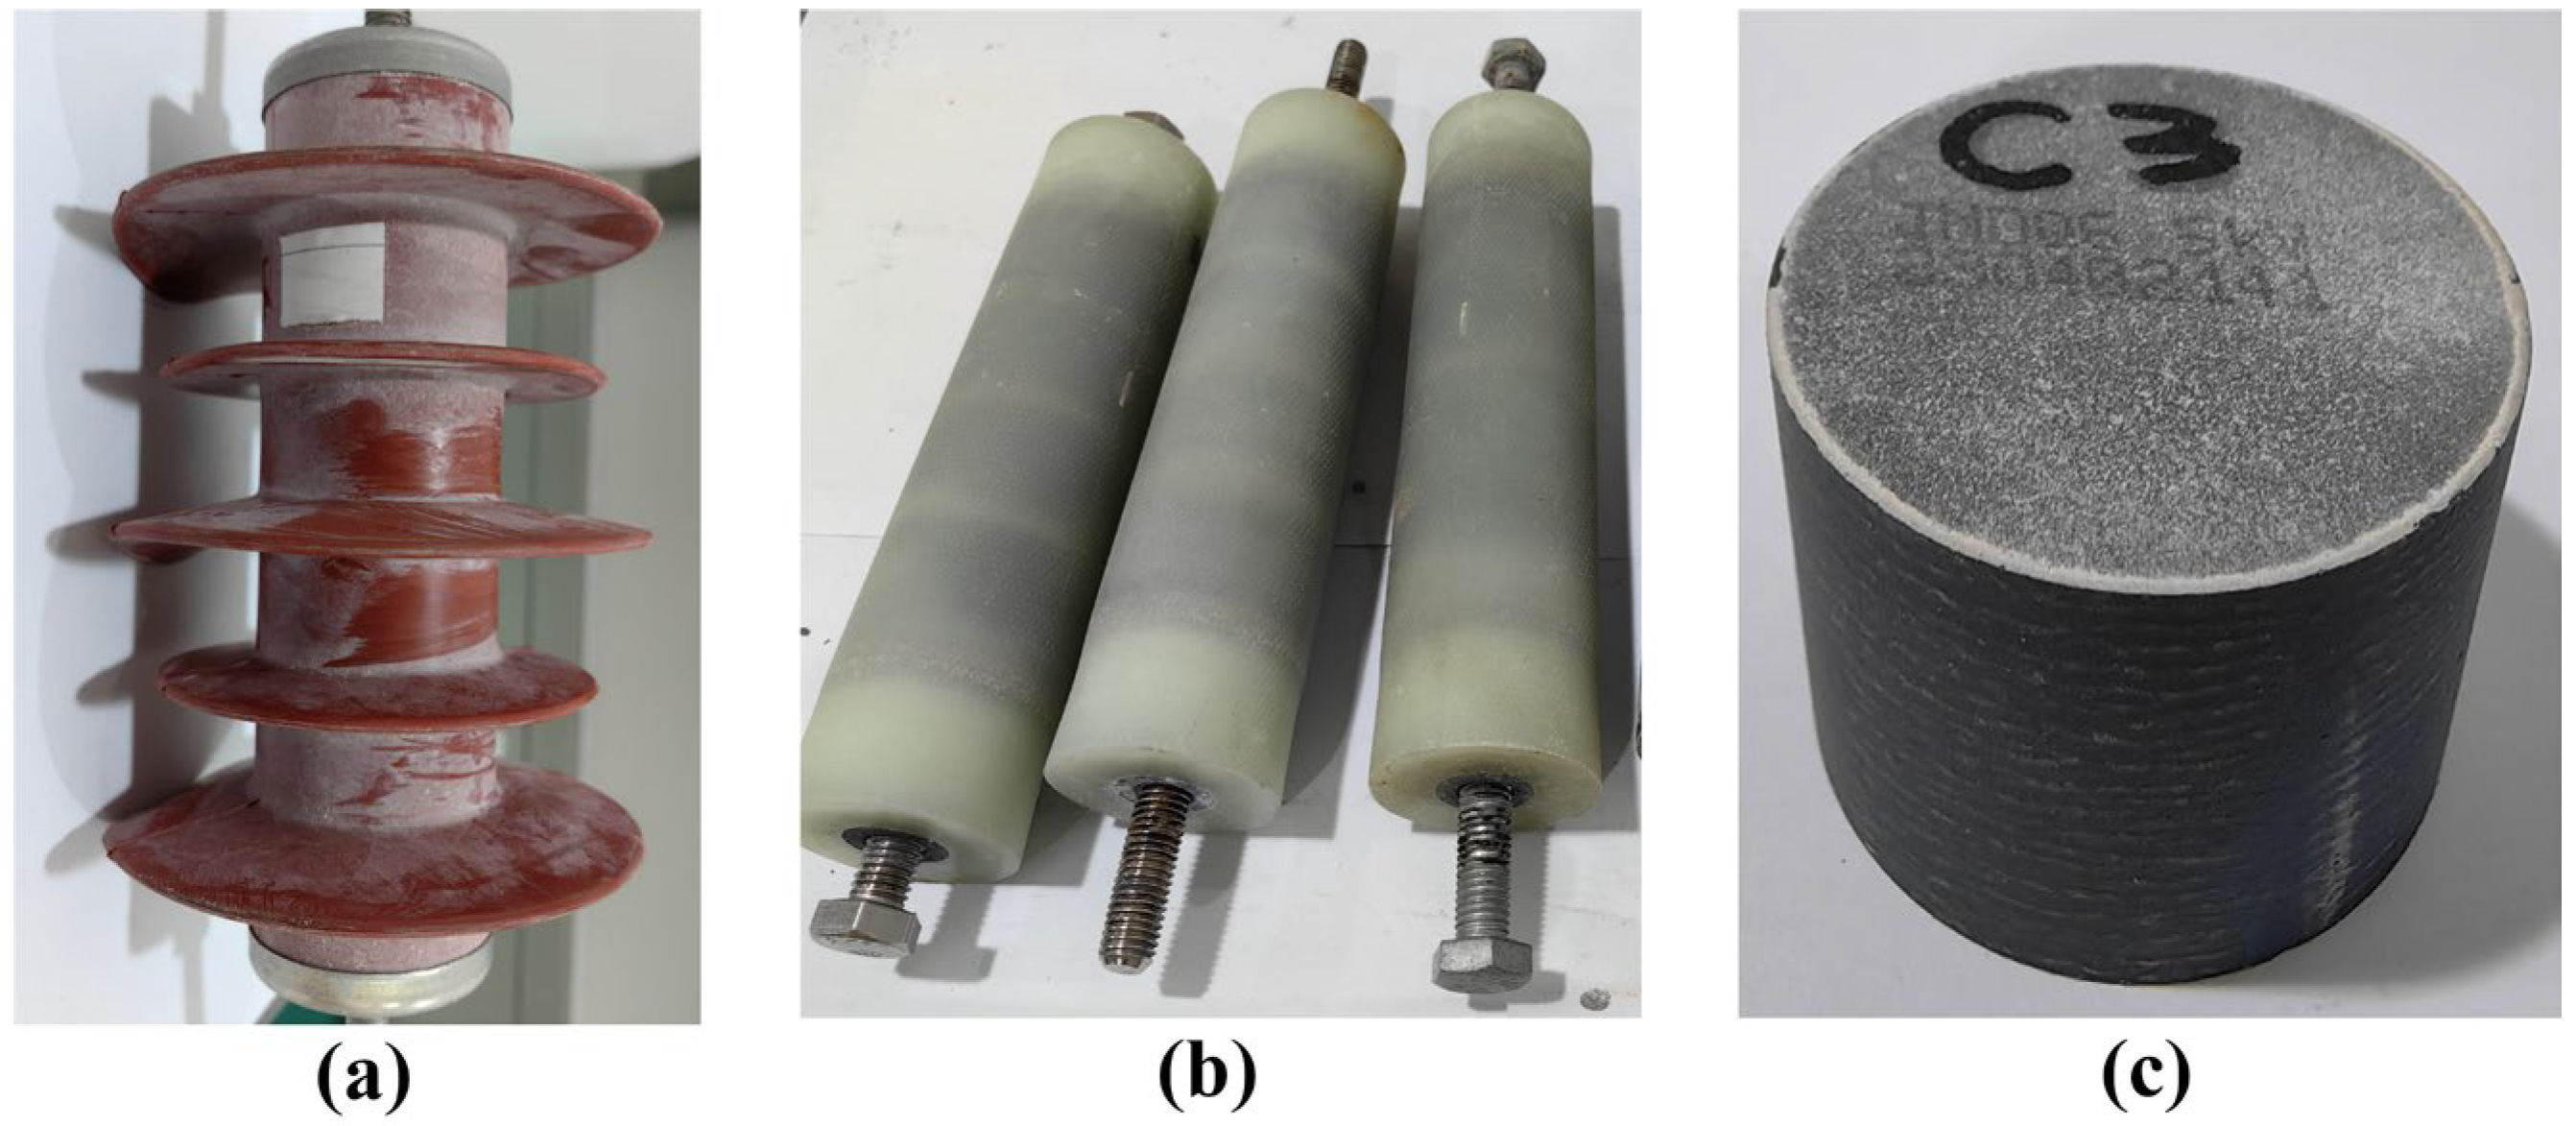
Figure 13 shows the appearance characteristics of various samples following the water immersion test. The surfaces of both the arrester and internal part samples were covered with a layer of white salt deposits. In contrast, the varistor samples not only exhibited white salt deposits but also showed blackening of the aluminum electrodes. This blackening is attributed to electrochemical reactions between the aluminum material and the boiling deionized water containing 1 kg/m3 of NaCl during moisture exposure, leading to the formation of grey–black corrosion products [28,29].
Figure 14 illustrates the trends in electrical performance for various sample types during the water immersion test. Since both ends of the samples were immersed in the same solution environment, a polarity effect was not expected; therefore, only the forward DC reference voltage (U1mA–F) was analyzed. The error bars represent the standard deviations obtained from three arrester samples, three internal part samples, and three varistor samples tested under identical water immersion conditions. As shown in Figure 14a, the change rate of U1mA-FU1mA–F) for the arrester and internal part samples decreased only slightly after immersion and nearly fully returned to the initial value following the drying process. In contrast, the ΔU1mA–F of the varistor samples showed a significant decline after immersion and, although partially restored after drying, remained considerably lower than the initial value. As shown in Figure 14b, the leakage current (IL) of the arrester samples increased slightly after water immersion and returned to its initial level following the drying process. In contrast, the IL of the internal part samples increased markedly after water immersion and, although it decreased after drying, remained higher than the initial value. The IL of the varistor samples also increased significantly after water immersion and showed no significant recovery after the drying treatment. As shown in Figure 14c, the change rate of residual voltage (ΔU5kA) increased moderately for all sample types after water immersion and only partially recovered following the drying treatment. However, the overall change remained minor, with values below 0.3%, indicating that moisture has a limited impact on the residual voltage. Figure 14d illustrates that the change rate of resistive current (ΔiR) increased significantly across all samples after water immersion. While the ΔiR of the arrester and internal part samples recovered to approximately 5% after drying, the varistor samples exhibited almost no recovery, suggesting a more severe and irreversible degradation.
After the test sample became damp, the magnitude of change differed significantly between the residual voltage and the leakage or resistive current. This difference stemmed from the sample’s distinct conductive properties in different current ranges. Moisture typically induced the formation of a highly conductive channel inside the sample, which connected in parallel with its intrinsic resistance, thereby reducing the equivalent resistance. The residual voltage measurement point lies in the high-current region of the voltage–current characteristic curve, where the intrinsic resistance is at the ohm level. In contrast, the leakage and resistive current measurement points lie in the low-current region, where the intrinsic resistance can reach the megohm to gigaohm range. When a highly conductive channel was connected in parallel with the intrinsic resistance, the equivalent resistance in the low-current region decreased substantially, whereas in the high-current region it changed very little. As a result, leakage and resistive currents in the low-current region fluctuated markedly, while the residual voltage in the high-current region remained relatively stable.
Based on the above analyses, it is evident that both the arrester samples and the internal part samples exhibited slight deterioration in electrical performance after water immersion, primarily manifesting as increases in leakage current (IL) and resistive current (iR). This degradation is mainly attributed to the enhanced surface conductivity caused by dense salt deposits on the sample surfaces. Following the drying treatment, the electrical performance of both sample types was largely restored to nearly their initial states. In contrast, the varistor samples exhibited significant degradation in electrical performance after water immersion, with minimal recovery following the drying treatment, indicating irreversible and permanent damage. These results suggest that, under normal conditions, arresters and their internal parts possess good sealing performance, reducing the likelihood of internal moisture ingress. Even in cases where sealing failure of the arrester leads to internal part moisture exposure, only slight performance deterioration is expected. The most critical scenario occurs when both the arrester and its internal part experience sealing failure, allowing moisture to penetrate the varistors. This results in severe moisture-induced degradation of the varistors and ultimately causes a significant decline in the arrester’s overall electrical performance.

4. Discussion

4.1. Failure Cause Analysis

This section presents a comprehensive analysis of the failure causes for samples #A1 to #A5 based on the preceding test results. Sample #A1 appeared intact, and its DC reference voltage (U1mA) did not exhibit a polarity effect, effectively ruling out lightning impulse as the primary failure cause. However, disassembly revealed blackening of the aluminum electrodes in the varistors, indicating moisture ingress. The residual voltage (U5kA) exceeded the specified limit of 50 kV. Given that moisture alone typically results in a ΔU5kA of less than 0.3%, which is insufficient to cause such a significant deviation, and that long-term exposure to AC voltage can induce a ΔU5kA exceeding 1%, it is inferred that the excessive residual voltage was due to the combined effects of moisture and prolonged AC voltage stress. In addition, the DC reference voltage (U1mA), leakage current (IL), and resistive current (iR) of this sample all fell within the normal range. Considering that moisture stress and AC voltage stress have opposing effects on these electrical performance parameters, their combined effects may have partially offset each other’s effects, further supporting the above inference.
The DC reference voltage (U1mA) of sample #A2 did not exhibit a polarity effect, thereby ruling out the possibility of failure due to lightning impulse. Appearance inspection revealed evident corrosion on the top metal connector, indicating compromised sealing performance and a risk of internal moisture ingress. Disassembly further revealed ablation of the internal varistors without the characteristic pinhole structure, distinguishing it from the pinhole-associated ablation typically caused by lightning impulses. Based on a comprehensive assessment, the observed phenomenon is likely due to increased local conductivity in the varistors following moisture ingress. Under prolonged exposure to AC voltage, heat accumulation subsequently led to ablation damage. The significantly elevated resistive current (iR) suggests that moisture stress has a greater impact on performance degradation than the AC voltage stress alone. Furthermore, the residual voltage (U5kA) of the sample exceeded the specified limit, which is attributed to the combined effects of moisture stress and prolonged AC voltage stress.
Sample #A3 exhibited surface contamination buildup without any visible signs of side flashover, effectively ruling out failure caused by pollution flashover of the silicone rubber housing. Disassembly revealed blackening of the aluminum electrodes in the internal varistors, indicating moisture ingress. Additionally, the DC reference voltage (U1mA) displayed a pronounced polarity effect, suggesting that the sample had been subjected to unipolar lightning impulses. The residual voltage (U5kA) of this sample also approached the specified limit. Based on test results, neither moisture exposure nor lightning impulse alone is sufficient to induce a significant increase in residual voltage, whereas prolonged AC voltage can cause ΔU5kA to exceed 1%. Therefore, it is inferred that the elevated residual voltage in this sample results from the combined effects of moisture, lightning impulse, and sustained AC voltage stress.
Samples #A4 and #A5 both exhibited contamination buildup and traces of side flashover on the silicone rubber housing. Considering their outdoor operating environment, the side flashover is presumed to result from the combined effects of surface contamination and humid conditions, which is characteristic of a typical pollution flashover. Disassembly of sample #A4 revealed side flashover and edge spallation in the internal varistors, with no obvious signs of moisture. In contrast, three varistors in sample #A5 exhibited blackened aluminum electrodes, indicating a clear presence of internal moisture. Both samples exhibited significant polarity effects in the DC reference voltage (U1mA), indicating exposure to unipolar lightning impulses. Additionally, both samples showed elevated leakage current (IL) and resistive current (iR). A comprehensive analysis suggests that the increased current in sample #A4 primarily resulted from insulation degradation caused by external pollution flashover, along with varistor deterioration induced by lightning impulses. In contrast, the elevated current in sample #A5 was further compounded by internal moisture ingress, leading to more severe deterioration of the varistors.
In addition, the DC reference voltage (U1mA) of certain varistors in samples #A1–#A4 was significantly lower than that of the others, indicating the formation of weak points and the occurrence of localized aging within the arresters. This voltage dispersion resulted in an increased operating burden on the remaining varistors, thereby accelerating their aging process. This reflects a typical vicious cycle, in which localized degradation progressively triggers overall performance deterioration.
In summary, the failure of arresters in 10 kV distribution transformer areas results from the combined effects of multiple operating stresses, rather than a single failure cause initially identified by the power grid company. Among these, compromised sealing performance is a common issue, often leading to moisture ingress into the internal varistors. This moisture exposure, when compounded by AC voltage stress, lightning impulse stress, or a combination of both, further accelerates varistor damage and electrical performance deterioration, constituting a primary internal cause of arrester failure. In addition, due to the harsh outdoor operating environment of distribution transformer areas, the silicone rubber housing of the arrester is prone to contamination buildup. Under humid conditions, the combined effects of surface pollution and moisture lead to a decline in its insulation performance, making it susceptible to side flashover under AC voltage or lightning impulses. This serves as a significant external factor contributing to the failure of certain arrester samples.

4.2. Improvement Measures

Based on the analysis of arrester failure causes, this paper proposes corresponding improvement measures. Some arresters in distribution transformer areas have failed due to improper selection of insulation housing materials or structural design defects, resulting in internal moisture ingress and pollution flashover. To enhance arrester quality and improve the overall performance of distribution networks, it is imperative to establish unified national standards that clearly define key design requirements and material specifications. Based on this, it is recommended to prioritize high-performance silicone rubber materials with excellent aging resistance, strong hydrophobicity, and low susceptibility to contamination buildup for the arrester housing. These materials can effectively retard the aging process, maintain sealing integrity, and reduce the risk of electrical performance degradation caused by internal moisture ingress. Furthermore, their superior surface properties, combined with an optimized umbrella skirt design, help suppress pollution flashover and reduce failures related to external insulation degradation.
In terms of testing and inspection, it is essential to strengthen the evaluation of the arrester’s sealing performance to ensure stable and reliable moisture resistance. It is recommended to use the complete arrester or its internal parts as the test object and incorporate test methods that simulate the combined effects of multiple typical operating stresses, such as moisture with AC voltage, moisture with lightning impulse, and the simultaneous action of all three. This approach enables a more comprehensive assessment of arrester reliability under complex real-world operating conditions. The above testing methods should be urgently incorporated into the type tests conducted by third-party institutions and the quality acceptance procedures of power grid companies upon delivery, with particular emphasis on implementation during the acceptance phase. Practical experience in many countries shows that systematic quality checks after the arrival of arresters can effectively identify products with poor initial quality before installation, preventing them from being put into operation and significantly enhancing the overall reliability of distribution network operations.
In terms of operation and maintenance, it is recommended to shorten the condition monitoring cycle for arresters deployed in distribution transformer areas. The inspection process should focus on key parameters such as sealing integrity, surface contamination of the housing, resistive current, and residual voltage. If sealing degradation is detected or if abnormal values are observed in resistive current or residual voltage, the arrester should be promptly replaced. In cases where significant dirt accumulation is identified on the housing, timely cleaning should be conducted to prevent insulation deterioration and reduce the risk of flashover. In addition, given that most arresters in distribution transformer areas are not yet equipped with online monitoring devices, it is recommended to accelerate the deployment of resistive current online monitoring systems. This would enable real-time tracking of arrester operating conditions and facilitate early detection of performance deterioration trends, thereby improving equipment maintenance efficiency.
It should be noted that the voltage applied during the AC aging test in this paper was an ideal pure sine wave. Under these conditions, the varistor samples showed no significant physical damage or noticeable deterioration in electrical performance. However, with the large-scale integration of renewable energy into distribution networks, power quality issues have become increasingly prominent, particularly the rise in higher harmonic components. The prolonged flow of higher harmonic currents can lead to excessive heat accumulation within ZnO varistors, potentially resulting in premature thermal breakdown. Therefore, future research should focus on the failure mechanisms of ZnO varistors under alternating voltage conditions with harmonic distortion. Meanwhile, it is recommended that power grid companies enhance continuous monitoring of power quality indicators. Upon detecting abnormal deterioration in power quality, they should simultaneously intensify monitoring of arrester conditions, particularly temperature rise, to enable early failure warning.
Through the implementation of the above multi-dimensional improvement measures, the failure risk of arresters in 10 kV distribution transformer areas during actual operation is expected to be effectively reduced, thereby significantly enhancing the operational reliability and safety of the distribution network.

5. Conclusions

Based on performance testing of failed arresters and deterioration tests conducted on brand-new arresters and their prorated sections under typical operating stresses, this paper systematically investigates the failure causes of arresters in 10 kV distribution transformer areas. The main conclusions are as follows:
(1)
Most failed arresters exhibit significant external deterioration, including corrosion on metal components, contamination buildup on the housing, and contamination accompanied by visible traces of side flashover. Internal inspection reveals that some varistors display typical damage modes, such as blackened aluminum electrodes, ablation, edge spallation, and side flashover.
(2)
Under lightning impulse stress, the varistor samples predominantly exhibit pinhole-type damage, whereas the internal part samples show damage to the injection molded structure as well as internal varistors. The electrical performance parameters of both types of samples deteriorate significantly. Although the varistor samples deteriorate more rapidly, their structural stability is superior to that of the internal part samples. In contrast, AC aging does not cause visible damage to the varistor samples. After initial fluctuations, the electrical performance of the varistor samples stabilizes, with deterioration primarily reflected in the increase in residual voltage. Water immersion induces minor, reversible degradation in arrester and internal part samples, but causes severe and irreversible degradation in varistor samples, characterized by blackening of aluminum electrodes and a sharp decline in electrical performance.
(3)
A critical internal cause of arrester failure is the widespread occurrence of moisture ingress into the internal varistors. Under the influence of AC voltage, lightning impulses, or the combined effect of both, the presence of moisture significantly exacerbates varistor damage and accelerates electrical performance degradation, ultimately manifesting as a decline in the arrester’s overall electrical characteristics. Externally, contamination buildup on the silicone rubber housing, particularly under harsh outdoor conditions, emerges as a major concern. In humid environments, this contamination is prone to triggering pollution flashovers, serving as a key external factor contributing to the failure of certain arrester samples. The findings provide a scientific basis for the optimization of the design, evaluation, and maintenance of arresters in distribution transformer areas.

Author Contributions

Conceptualization, T.H.; data curation, L.Q.; funding acquisition, Y.H.; investigation, G.L. and S.H.; methodology, Y.W.; project administration, L.L.; resources, L.L.; supervision, Y.H.; validation, Z.L.; writing—original draft, T.H.; writing—review and editing, Z.L. All authors have read and agreed to the published version of the manuscript.

Funding

This research was supported by National Engineering Research Center of UHV Technology and Novel Electrical Equipment Basis (NERCUHV-2023-KF-12).

Data Availability Statement

The original contributions presented in this study are included in the article. Further inquiries can be directed to the corresponding author.

Acknowledgments

The authors gratefully acknowledge the support of the Electric Power Research Institute, CSG.

Conflicts of Interest

Authors Taishan Hu, Gang Liu, Shangmao Hu, and Lu Qu are employed by Electric Power Research Institute, CSG, and the National Engineering Research Center of UHV Technology and New Electrical Equipment Basis. The authors declare that they have no known competing financial interest or personal relationships that could have appeared to influence the work reported in this paper.

Abbreviations

The following abbreviations are used in this manuscript:
ZnOZinc oxide
Nomenclature
ILLeakage current at the DC voltage of 0.75 × U1mA–F
iRResistive current at the continuous operating voltage
U1mADC reference voltage at the DC current of 1 mA
U1mA–FForward DC reference voltage at the DC current of 1 mA
U1mA–RReverse DC reference voltage at the DC current of 1 mA
U5kAResidual voltage at the amplitude of 5 kA and the waveform of 8/20 μs

References

  1. Li, D.J.; Sun, W.X.; Song, K.Y.; Zhu, R.F.; Zhong, Z.X.; Ding, T.S.; Gao, J.C. Research on Differentiated Lightning Protection of Overhead Distribution Lines under Continuous Lightning Strikes. Energies 2024, 17, 4568. [Google Scholar] [CrossRef]
  2. Kazim, M.; Khawaja, A.H.; Zabit, U.; Huang, Q. Fault Detection and Localization for Overhead 11-kV Distribution Lines with Magnetic Measurements. IEEE Trans. Instrum. Meas. 2020, 69, 2028–2038. [Google Scholar] [CrossRef]
  3. Barradas, R.P.d.S.; Rocha, G.V.S.; Muniz, J.R.S.; Bezerra, U.H.; Nunes, M.V.A.; Silva, J.S.E. Methodology for Analysis of Electric Distribution Network Criticality Due to Direct Lightning Discharges. Energies 2020, 13, 1580. [Google Scholar] [CrossRef]
  4. Cai, L.; Xu, C.F.; Wang, J.G.; Chu, W.X.; Zhou, M.; Fan, Y.D.; Cao, J.X. Three-Phase Overvoltage Induced on Overhead Distribution Line 40 m from Rocket-Triggered Lightning. IEEE Trans. Power Deliv. 2023, 38, 3782–3791. [Google Scholar] [CrossRef]
  5. Woodworth, J. Lightning Protection of Distribution Power Systems: Arrester Development and Application Over the Years. IEEE Power Energy Mag. 2023, 21, 51–60. [Google Scholar] [CrossRef]
  6. Cao, J.X.; Du, Y.P.; Ding, Y.X.; Qi, R.H.; Chen, M.L.; Li, Z.; Zhao, X.E.; Andreotti, A. Lightning Protection with a Differentiated Configuration of Arresters in a Distribution Network. IEEE Trans. Power Deliv. 2023, 38, 409–419. [Google Scholar] [CrossRef]
  7. Ravichandran, N.; Proto, D.; Andreotti, A. Surge arrester optimal placement in distribution networks: A decision theory-based approach. Electr. Power Syst. Res. 2024, 234, 110744. [Google Scholar] [CrossRef]
  8. Luo, D.Q.; Xu, Z.R.; Tang, J.; Liang, Z.Y.; Chen, D.Z. Present Situation and Problems Analysis for Lightning Protection of 10 kV Power Distribution Line Based on Historical Trip Records. Insul. Surge Arrester 2012, 2, 40–45+50. (In Chinese) [Google Scholar]
  9. Sabiha, N.A. Limiting surge arrester failure under direct lightning strokes for attaining service continuity of distribution networks. IET Gener. Transm. Distrib. 2020, 14, 4796–4804. [Google Scholar] [CrossRef]
  10. Cao, J.X.; Du, Y.P.; Ding, Y.X.; Qi, R.H.; Li, B.H.; Chen, M.L.; Li, Z. Practical Schemes on Lightning Energy Suppression in Arresters for Transformers on 10 kV Overhead Distribution Lines. IEEE Trans. Power Deliv. 2022, 37, 4272–4281. [Google Scholar] [CrossRef]
  11. Wang, L.L.; Huang, J.R.; Chen, L.; Wan, K.; Zuo, Z.Q. Influencing Factors of High Current Impulse Withstand Capability of 10 kV Distribution Arrester. Insul. Surge Arrester 2022, 5, 59–66. (In Chinese) [Google Scholar]
  12. Tsukamoto, N.; Ishii, M. Repetitive Impulse Withstand Performance of Metal-Oxide Varistors. IEEE Trans. Power Deliv. 2017, 32, 1674–1681. [Google Scholar] [CrossRef]
  13. Nogueira, T.A.; de Salles, C.; Neto, E.T.W.; Pinheiro, F.F. Short duration current impulse waveform effects on the degradation and energy absorption capability of zinc oxide varistors. Electr. Power Syst. Res. 2023, 220, 109336. [Google Scholar] [CrossRef]
  14. Ranjbar, B.; Darvishi, A.; Dashti, R.; Shaker, H.R. A Survey of Diagnostic and Condition Monitoring of Metal Oxide Surge Arrester in the Power Distribution Network. Energies 2022, 15, 8091. [Google Scholar] [CrossRef]
  15. Tu, Y.P.; Wang, Q.; He, J.; Li, X.; Ding, L.J. TSC characteristics of AC aged ZnO varistors. Sci. China Technol. Sci. 2013, 56, 677–682. [Google Scholar] [CrossRef]
  16. Du, L.; Tan, J.Y.; Wu, X.G.; Wang, D.S.; Chen, X.X. Study on Accelerated Electrical Aging Frequency Domain Feature of ZnO Valve Based on Extended Debye Model. High Volt. Eng. 2020, 46, 1759–1767. (In Chinese) [Google Scholar]
  17. Neto, E.T.W.; da Costa, E.G.; Maia, M.J.A. Artificial Neural Networks Used for ZnO Arresters Diagnosis. IEEE Trans. Power Deliv. 2009, 24, 1390–1395. [Google Scholar] [CrossRef]
  18. Lahti, K.; Kannus, K.; Nousiainen, K. Diagnostic methods in revealing internal moisture in polymer housed metal oxide surge arresters. IEEE Trans. Power Deliv. 2002, 17, 951–956. [Google Scholar] [CrossRef]
  19. IEC 60099-4; Surge Arresters—Part 4: Metal Oxide Surge Arresters Without Gaps for a.c. Systems. IEC: Geneva, Switzerland, 2014.
  20. Tu, Y.P.; Zheng, Z.H.; Li, X. AC ageing characteristics of Co-doped ZnO varistors. Sci. China Technol. Sci. 2013, 56, 1354–1360. [Google Scholar] [CrossRef]
  21. Ouyang, C.Y.; Wang, Z.L. Accelerated aging test of domestic and Hitachi zinc oxide valve sheets and operation load test after aging. Insul. Surge Arrester 1989, 4, 22–28. (In Chinese) [Google Scholar]
  22. He, J.L.; Liu, J.; Hu, J.; Zeng, R.; Long, W.C. Non-uniform ageing behavior of individual grain boundaries in ZnO varistor ceramics. J. Eur. Ceram. Soc. 2011, 31, 1451–1456. [Google Scholar] [CrossRef]
  23. Sun, G.Y.; Zhao, Y.; Zhang, L.; Tian, J.L. Study of the Effect of Ca on the Electrical Properties of SnO2 Varistor Based on the Voronoi Model. J. Electron. Mater. 2024, 53, 5433–5438. [Google Scholar] [CrossRef]
  24. Wang, M.Y.; Ren, X.; Zhou, Q.B.; Li, Z.Y.; Yang, H.X.; Jiang, H.B.; Yan, Y.; Ruan, X.J.; Yu, W.Q.; Jin, L.J.; et al. High improvement of degradation behavior of ZnO varistors under high current surges by appropriate Sb2O3 doping. J. Eur. Ceram. Soc. 2021, 41, 436–442. [Google Scholar] [CrossRef]
  25. Zhang, J.; Han, Y.X.; Yu, F.; Huang, W.T.; Li, L.C.; Luo, X.; Meng, Y.C.; Sun, Q. Study on Improving the Operating Lifespan of AC Filter Arresters in Converter Station Based on the Degradation Characteristics of ZnO Varistor Under Unipolar and Bipolar Polarity Impulse Currents. IEEE Trans. Power Deliv. 2024, 39, 3039–3049. [Google Scholar] [CrossRef]
  26. Christodoulou, C.A.; Vita, V.; Mladenov, V.; Ekonomou, L. On the Computation of the Voltage Distribution along the Non-Linear Resistor of Gapless Metal Oxide Surge Arresters. Energies 2018, 11, 3046. [Google Scholar] [CrossRef]
  27. Kumar, U.; Mogaveera, V. Voltage distribution studies on ZnO arresters. IEE Proc. Gener. Transm. Distrib. 2002, 149, 457–462. [Google Scholar] [CrossRef]
  28. Das, A.K.; Dalai, S.; Chatterjee, B. A Novel Approach to Estimate the Quantity of Ingressed Moisture Content Inside Metal Oxide Surge Arrester Using Dielectric Modulus Technique. IEEE Trans. Dielectr. Electr. Insul. 2021, 28, 2178–2185. [Google Scholar] [CrossRef]
  29. Guo, L.; Liu, C.; Huang, L.; Wang, D.Y.; Ma, Y.T. Effect of Moisture on the Multiple Lightning Strike Resistance of ZnO Valve Discs. High Volt. Eng. 2024, 50, 5368–5377. (In Chinese) [Google Scholar]
Figure 1. Statistics results of failure causes of arresters in 10 kV distribution transformer areas.
Energies 18 04501 g001
Figure 2. Lightning impulse test platform. (a) Varistor; (b) internal part.
Energies 18 04501 g002
Figure 3. AC aging test platform.
Energies 18 04501 g003
Figure 4. Water immersion test platform.
Energies 18 04501 g004
Figure 5. Electrical performance measurement circuit. (a) DC reference voltage and leakage current; (b) residual voltage; (c) resistive current.
Energies 18 04501 g005
Figure 6. Appearance of failed arrester samples. (a) #A1, intact; (b) #A2, corrosion; (c) #A3, contamination buildup; (d) #A4, contamination buildup and side flashover; (e) #A5, contamination buildup and side flashover.
Energies 18 04501 g006
Figure 7. Typical damage modes of internal varistors. (a) Blackened aluminum electrode; (b) ablation; (c) edge spallation; (d) side flashover.
Energies 18 04501 g007
Figure 8. Proportion of appearance states in internal varistors.
Energies 18 04501 g008
Figure 9. Dispersion of forward DC reference voltage U1mA-F among internal varistors.
Energies 18 04501 g009
Figure 10. Typical damage modes observed in lightning impulse test samples. (a) Cracking with localized spalling; (b) cracking along pinholes; (c) severe ablation at pinholes; (d) severe ablation at pinholes accompanied by side flashover; (e) destruction of the injection molded structure, accompanied by cracking with localized spalling of the internal varistors; (f) destruction of the injection molded structure, accompanied by melting of the internal varistors.
Energies 18 04501 g010
Figure 11. Trends in electrical performance of samples during lightning impulse test. (a) DC reference voltage; (b) leakage current; (c) residual voltage; (d) resistive current. Error bars indicate standard deviations based on multiple independently tested samples.
Energies 18 04501 g011
Figure 12. Trends in electrical performance of samples during AC aging test. (a) DC reference voltage; (b) leakage current; (c) residual voltage; (d) resistive current. Error bars indicate standard deviations based on multiple independently tested samples.
Energies 18 04501 g012
Figure 13. Appearance characteristics of samples after water immersion test. (a) Arrester; (b) internal part; (c) varistor.
Energies 18 04501 g013
Figure 14. Trends in electrical performance of samples during water immersion test. (a) DC reference voltage; (b) leakage current; (c) residual voltage; (d) resistive current. Error bars indicate standard deviations based on multiple independently tested samples.
Energies 18 04501 g014
Table 1. Specifications of arresters in 10 kV distribution transformer areas.
TypeRated Voltage (kV)DC Reference Voltage at 1 mA (kV)Residual Voltage at 5 kA, 8/20 μs (kV)
YH5WS-17/5017≥25≤50
Table 2. Electrical performance of failed arrester samples.
Sample
Number
U1mA-F (kV)U1mA-R (kV)IL (μA)U5kA (kV)iR (μA)
#A127.0327.03451.9036.56
#A226.2426.20352.2646.17
#A326.4827.05349.9034.31
#A426.7427.122447.8958.68
#A526.7227.081747.7755.78
Note: The preliminary failure causes confirmed by the power grid company for these samples are as follows: #A1—electrical performance degradation (commonly referred to as aging); #A2 and #A3—abnormal heating; and #A4 and #A5—pollution flashover.
Disclaimer/Publisher’s Note: The statements, opinions and data contained in all publications are solely those of the individual author(s) and contributor(s) and not of MDPI and/or the editor(s). MDPI and/or the editor(s) disclaim responsibility for any injury to people or property resulting from any ideas, methods, instructions or products referred to in the content.