Article

Influence of the Configurations of Fuel Injection on the Flame Transfer Function of Bluff Body-Stabilized, Non-Premixed Flames

1
Sichuan Gas Turbine Establishment, Aero Engine Corporation of China, Mianyang 621000, China
2
College of Energy and Power Engineering, Nanjing University of Aeronautics and Astronautics, Nanjing 210016, China
*
Author to whom correspondence should be addressed.
Energies 2025, 18(16), 4349; https://doi.org/10.3390/en18164349
Submission received: 13 July 2025 / Revised: 4 August 2025 / Accepted: 9 August 2025 / Published: 15 August 2025
(This article belongs to the Section I2: Energy and Combustion Science)

Abstract

Combustion instability poses a significant challenge in aerospace propulsion systems, particularly in afterburners that employ bluff-body flame stabilizers. The flame transfer function (FTF) is essential for characterizing the dynamic response of flames to perturbations, which is critical for predicting and controlling these instabilities. This study experimentally investigates the effect of varying the number of fuel injection holes (N = 3, 4, 5, 6) on the FTF and flame dynamics in a model afterburner combustor. Using acoustic excitations, the FTF was measured across a range of frequencies, with flame behavior analyzed via high-speed imaging and chemiluminescence techniques. Results reveal that the FTF gain exhibits dual-peak characteristics, initially decreasing and then increasing with higher N values. The frequencies of these gain peaks shift to higher values as N increases, while the time delay between velocity and heat release rate fluctuations decreases, indicating a faster flame response. Flame morphology analysis shows that higher N leads to shorter, taller flames due to enhanced fuel distribution and mixing. Detailed examination of flame dynamics indicates that different pulsation modes dominate at various frequencies, elucidating the observed FTF behavior. This research provides novel insights into the optimization of fuel injection configurations to enhance combustion stability in afterburners, advancing the development of more reliable and efficient aerospace propulsion systems.

1. Introduction

Afterburners allow military aircraft to rapidly increase their thrust in a very short time. However, due to their high energy density, elevated inlet velocities and temperatures, and non-uniform mixing of fuel and air, afterburners are more susceptible to combustion instabilities [1]. Combustion instability is recognized as a coupled interaction between acoustic field disturbances, flow perturbations, and an unsteady heat release rate (HRR) within the combustion chamber. This phenomenon manifests as intense pressure oscillations that may cause catastrophic damage to engines and generate combustion noise, which has remained a major challenge in aerospace propulsion development [2].
The Flame Transfer Function (FTF) [3,4,5] is a quantitative tool widely employed to characterize flame dynamic responses, mathematically expressed as follows:
FTF ( f ) = q / q ¯ u / u ¯ .
Here, f denotes the frequency of velocity fluctuations, u represents the velocity, and q signifies the HRR. The superscript ′ indicates fluctuating components, while the overline denotes time-averaged quantities. The FTF not only quantifies the flame’s response to velocity disturbances across various frequencies but also serves as a critical unsteady heat source term in low-order thermoacoustic network models or Helmholtz solvers for prediction of combustion instabilities [6,7,8]. The FTF can be obtained through experimental measurements, high-fidelity numerical simulations or theoretical modeling approaches.
In recent years, there has been growing attention on oscillation phenomena in premixed combustion systems, as thermoacoustic oscillations inherently conflict with low-emission objectives [9,10]. Lee et al. [11] experimentally investigated the FTF characteristics of swirl combustors with single-nozzle and twin-nozzle configurations. Their results demonstrated that flame-flame interactions during combustion introduce additional complexity to the system dynamics. Ahn et al. [12,13] conducted comparative experimental analyses of the nonlinear responses of non-premixed and premixed Burke–Schumann flames, identifying distinct flame separation phenomena under high-amplitude velocity perturbations. The HRR response characteristics of fuel-premixed flames under significant inlet velocity pulsations were systematically characterized by Kim et al. [14,15] using a centrally staged axial swirler stratified combustor. Mejia et al. [16] numerically investigated the influence of bluff-body temperature on methane/air premixed flames, revealing that variations in bluff-body temperature significantly alter both the flame anchoring location and flow dynamics, which constitute the primary mechanisms driving the pronounced sensitivity of FTFs to bluff-body temperature variations.
In afterburners, bluff-body flame stabilizers are the most commonly used structures for flame stabilization [17,18]. The stable vortex shedding formed downstream of the bluff body significantly influences the physical and chemical processes involved in combustion, ultimately affecting flame morphology and temperature distribution. Current research [19] consensus indicates that the primary driving mechanism of combustion instability in bluff body-stabilized flames arises from two coupled factors: (1) flame wrinkling induced by vortices originating from the bluff-body wake and (2) local equivalence-ratio fluctuations caused by unsteady fuel transport dynamics. Given that afterburners typically feature multi-nozzle configurations, changing the nozzle arrangements can alter both the fuel–air mixing efficiency and the interactions between different jet flows. By optimizing nozzle layouts, it is possible to control the flame structure and temperature distribution within the combustion chamber, thereby achieving stable and efficient combustion [20,21,22]. Concurrently, varying nozzle arrangements inherently modify the flame response characteristics, thereby influencing the overall combustion stability.
Recently, Liu et al. [3] comprehensively investigated the effects of bluff-body geometric parameters on thermoacoustic stability and FTFs. Building upon Liu et al.’s foundational work, this study aims to conduct a detailed investigation into how different fuel jet orifice arrangements on the lateral surfaces of bluff bodies influence the FTF characteristics of non-premixed flames. To achieve this objective, experimental studies were carried out on the dynamic behaviors of bluff body-stabilized non-premixed flames under varying numbers of fuel injection orifices. In these experiments, the total fuel mass flow rate was maintained constant across all nozzle configurations, while FTF measurements were performed under different fuel/air distribution scenarios. This research endeavors to elucidate the governing mechanisms associated with FTF variations under different fuel orificeconfigurations. Ultimately, this work establishes a fundamental framework for oscillation control strategies through targeted modulation of FTFs.

2. Experimental Setup

2.1. Combustion Rig

This study investigates the V-shaped bluff-body flameholder [3]. The schematic of the flameholder is shown in Figure 1a. The geometric dimensions of the bluff body in the study were referenced from a certain model of an aviation engine afterburner, maintaining a consistent overall shape, but the specific dimensions were scaled down. In real engines, the afterburner is located between the low-pressure turbine and the variable nozzle, where fuel is injected into the oxygen-rich exhaust to achieve thrust augmentation [21,22], a critical region where injection configurations significantly impact combustion stability and thermoacoustic oscillations [1,3]. To facilitate experiments under laboratory conditions, the model-scale bluff body in this study has an approximate scale ratio of 0.5 compared to the actual size. The placement of the fuel injection holes was determined based on this scaling ratio.
The flameholder has a leading-edge radius of 6.5 mm, a trailing-edge width of 20 mm, and a splitter-plate thickness of 2 mm. Fuel injection holes are symmetrically arranged along the centerline of the bluff body’s side walls, with a distance (L) of 5.5 mm between adjacent holes and a diameter (D) of 1.5 mm. The height of the bluff body is 45 mm, matching the height of the combustor.
Figure 1b presents a schematic diagram of the model afterburner combustor. The combustor has a width of 60 mm, which is three times the trailing-edge width of the bluff body (20 mm). The total length of the combustor is 240 mm, with the trailing edge of the bluff body positioned 190 mm upstream of the combustor exit. This arrangement ensures sufficient length for a fully developed flame. Additionally, three dynamic pressure measurement points are located along the streamwise direction, spaced 55 mm apart, to measure pressure fluctuations within the combustor.
Figure 2 illustrates the schematic layout of the overall experimental system, which includes an air supply duct, a propane fuel supply line, an acoustic excitation system, the combustor, and a diagnostic system. The primary air flows from left to right, entering the combustor after flow conditioning. Propane fuel is delivered to the interior of the bluff body through a 4 mm diameter fuel line located beneath it and is then injected into the combustion zone via holes on the bluff body’s side walls. The produced combustion gases are treated and exhausted, with the exit pressure kept at ambient levels.
A pair of loudspeakers installed on opposite sides of the upstream section of the air supply duct introduce acoustic excitation into the oncoming airflow with specified amplitude and frequency. Two acoustic pressure sensors, located 190 mm upstream of the bluff body’s trailing edge within the combustor, measure pressure fluctuations, from which velocity fluctuations are deduced. These sensors are spaced 30 mm apart axially.
The front and top walls of the combustor are fitted with quartz glass observation windows, enabling the measurement of the flame’s HRR response and the acquisition of dynamic flame images.

2.2. Diagnostic Techniques

The incoming air is supplied to the combustor by an upstream compressor, with its rotational speed regulated by a frequency converter to ensure precise control of the air mass flow rate. The mean inlet velocity is measured using a hot-wire anemometer, which is located approximately 2 m upstream of the speaker.
Fuel-grade propane is supplied from a high-pressure gas cylinder, with its flow rate controlled by a Mass Flow Controller (MFC, model AST10-HB, Asert Instruments, Beijing, China), featuring a rated capacity of 50 SLM and an uncertainty of ≤1% F.S. (Full Scale).
Dynamic pressure fluctuations are measured at three points (P1, P2, and P3) on the combustor wall using dynamic pressure sensors (Model: PCB 113B28, PCB Piezotronics, Inc., Depew, NY, USA). These sensors have a sensitivity of 15 mV/kPa, a measurement range of 34.47 kPa, and an uncertainty of ≤1% F.S. The tube section near the combustion chamber is a straight metal tube enclosed by a water-cooling jacket to maintain the sensor’s operational temperature. The other end of the tube is connected to a 20 m closed tube to minimize wave reflections [23].
To measure the flame transfer function of the model combustor, simultaneous measurements of velocity fluctuations and HRR fluctuations are required. Velocity fluctuations are measured using the two-microphone method [24,25]. Two acoustic pressure sensors (Model: MPA417A, located at Mic1 and Mic2 in Figure 2, BSWA Technology, Beijing, China), flush-mounted on the duct’s inner wall, are used. These sensors have a sensitivity of 50 mV/Pa, a dynamic range of 127 dB, and an uncertainty of ≤1% F.S.
Heat release-rate fluctuations are determined indirectly by measuring the chemiluminescence intensity of CH* and OH* radicals in the flame [26,27]. For OH* measurement, a photomultiplier tube (PMT) equipped with an optical bandpass filter centered at 310 nm (±10 nm bandwidth) is used. For CH* measurement, another PMT with a filter centered at 435 nm (±5 nm bandwidth) is employed. Both PMTs (Model: CH253, Hamamatsu Photonics K.K., Beijing, China) have a typical sensitivity of 250 µA/lm and an uncertainty of ≤1% F.S.
Flame CH* chemiluminescence images are captured using a PHANTOM VEO 1010 high-speed camera equipped with a 435 nm ± 10 nm bandpass filter. The camera is set to an exposure time of 19 µs and a frame rate of 5 kHz.
All dynamic measurement signals are acquired synchronously using an NI chassis with PXIe-4497 modules (National Instruments Corporation, Austin, TX, USA). A sampling rate of 10 kHz was employed for all dynamic signals throughout the experimental campaign.

2.3. Operating Conditions

To investigate the impact of fuel jet arrangements on the heat release response characteristics of bluff body-stabilized, non-premixed flames, four configurations with varying numbers of fuel injection holes (N) were designed. The number of holes on each side of the bluff-body wall was set to 3, 4, 5, or 6. The operating conditions for this study are summarized in Table 1. According to the scalification model, N4 is the reference configuration in this paper.
Experiments were conducted under ambient temperature and pressure conditions. The inlet air velocity (u) was maintained at 10.0 m/s for all cases. The global equivalence ratio was kept constant at ϕ = 0.068 across all configurations, corresponding to a propane flow rate of 4.4 SLPM (standard liters per minute, where the standard state refers to 25 °C, 1 atm.). An acoustic velocity perturbation with an amplitude of u / u ¯ = 0.02 was introduced into the inlet flow via loudspeakers. The excitation frequency was varied from 60 Hz to 310 Hz, and the frequency adjustment step is 10 Hz.

3. Results and Discussion

3.1. Flame Transfer Function

Based on the experimental apparatus and operating conditions described in Section 2, this study measured the FTFs for different numbers of fuel injection holes (N) at an inlet air velocity of 10 m/s and a velocity perturbation intensity of u / u ¯ = 0.02 . The results are presented in Figure 3.
Consistent with previous studies on bluff body-stabilized, non-premixed flames, the gain curves of the FTFs exhibit dual-peak characteristics and low-pass filter behavior. Specifically, local maxima in gain are observed within the frequency ranges of 90–120 Hz and 250–290 Hz, while a local minimum occurs between 160 and 220 Hz. The exact frequencies of these features depend on the number of nozzles (N).
When comparing across different nozzle counts, it is evident that the FTF gain initially decreases, then increases as N increases. This trend suggests that combustion stability first improves, then deteriorates with an increasing number of nozzles. Additionally, the frequencies corresponding to the local maxima and minima in the gain curves shift to higher values as N increases.
The phase of the FTF ( Φ ) is directly related to the time delay ( τ ) between the u and q . For a system with a pure time delay, the phase is given by Φ ( f ) = 2 π f τ , meaning that the slope of the phase curve with respect to frequency is d Φ / d f = 2 π τ . As illustrated in Figure 3, the phase generally decreases linearly with increasing frequency, indicating a constant time delay. However, within the frequency range of 160–220 Hz, a slight deviation from this linear trend is observed, with the phase showing a less steep decrease or even a slight increase in some cases. Notably, the frequencies at which this deviation occurs correspond closely to the frequencies of the gain minima for each configuration (e.g., 160 Hz for N3, 200 Hz for N4 and N5, and 220 Hz for N6).
To quantify the time delay, a first-order linear fit was applied to the phase data over the entire frequency range for each nozzle configuration. The time delay ( τ ) was then calculated using the relationship expressed as τ = m / ( 2 π ) , where m is the slope of the fitted phase curve. The resulting time delays are 4.01 ms for N3, 3.34 ms for N4, 2.95 ms for N5, and 2.93 ms for N6. These values were truncated to two decimal places from computational outputs and used for relative comparison of nozzle layout effects. These values demonstrate that the time delay decreases as the number of nozzles increases, indicating a faster response of the heat release to velocity fluctuations with more nozzles.

3.2. Analysis of Flame Morphology

To investigate the flame response characteristics and variations in the FTF induced by different nozzle configurations, we analyzed the flame morphology under various excitation frequencies and fuel jet arrangements.
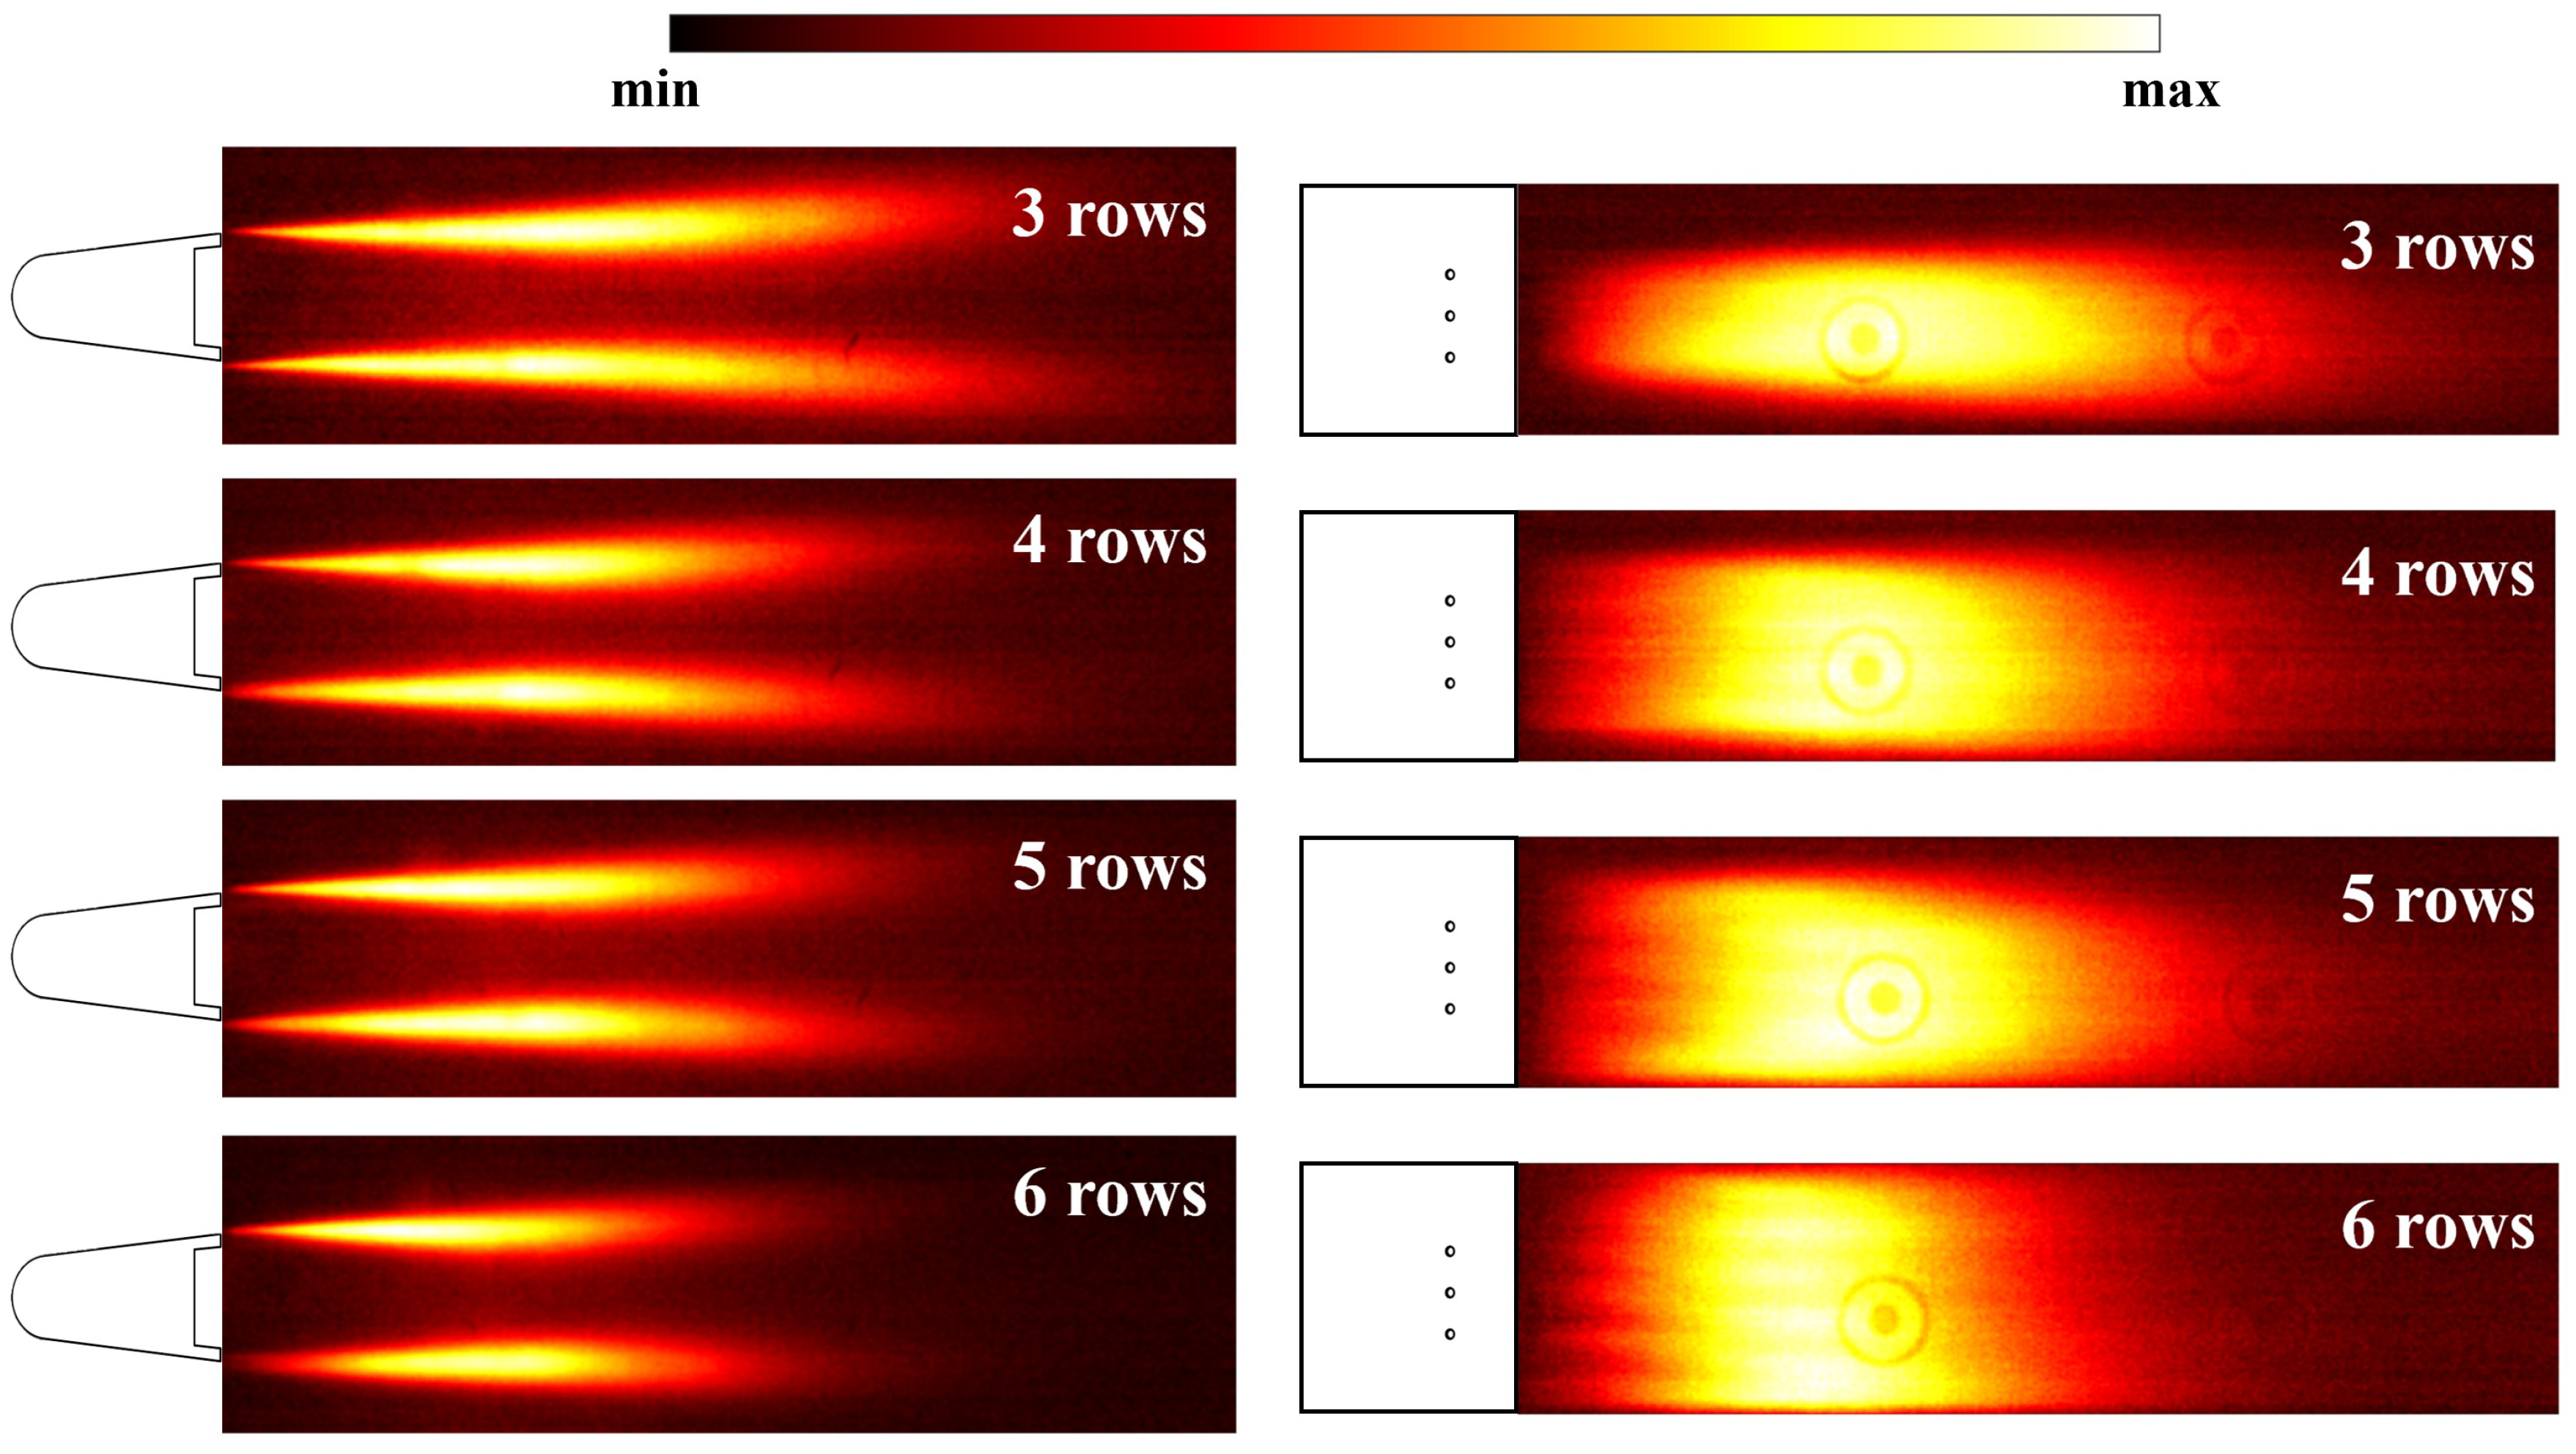
Figure 4 illustrates the time-averaged flame structures for different numbers of fuel injection holes (N) under unexcited conditions. The results were obtained by averaging 5000 CH* luminescence images, corresponding to 1 s of data. A clear trend emerges: as N increases, the flame length decreases progressively, while the flame height along the combustor’s vertical (y) direction increases significantly. This morphological shift results from enhanced propane distribution uniformity across the y direction with higher nozzle counts, which improves the combustion process, leading to increased vertical flame height and reduced streamwise flame length.
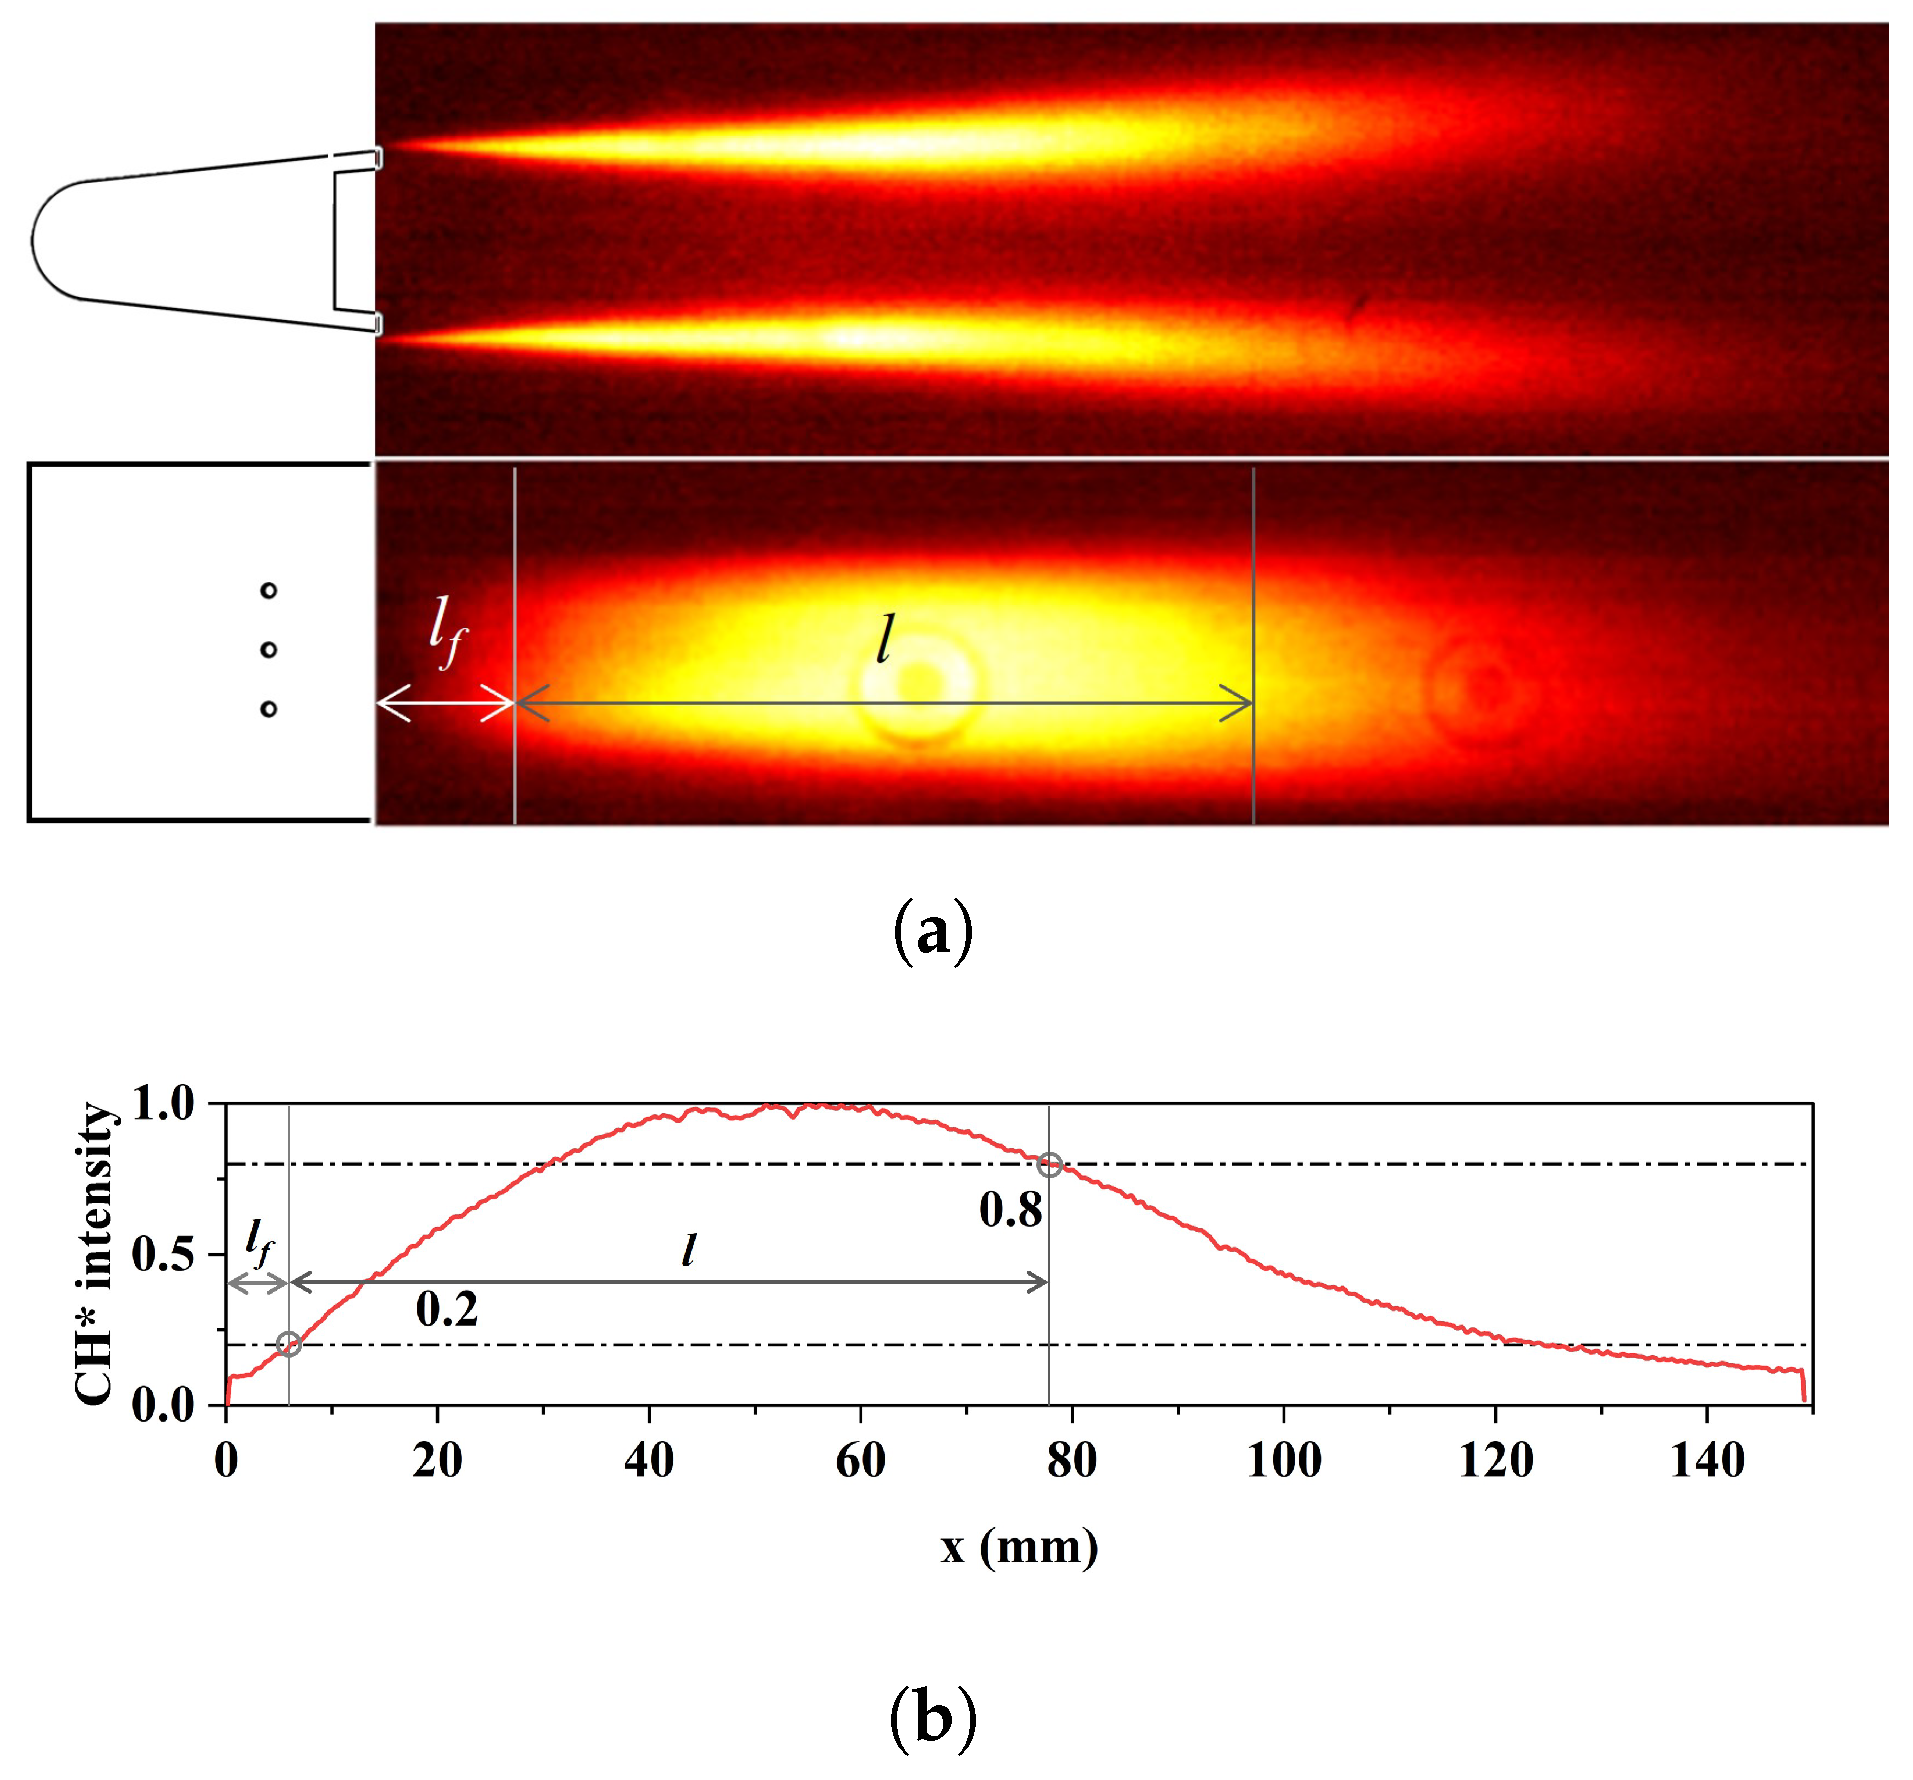
To quantify this phenomenon, we defined two parameters based on time-averaged flame images l f , the axial distance from the bluff-body trailing edge to the flame root (where the vertically integrated CH* chemiluminescence intensity reaches 20% of its maximum) and l, the streamwise flame length (the distance between the positions where the intensity is 20% and 80% of the maximum). The measurement methodology is depicted in Figure 5 and involves the following steps:
  • Obtain line-of-sight integrated time-averaged CH* chemiluminescence images along the z-axis.
  • Calculate the vertically integrated (y-direction) light intensity profile.
  • Define l f as the x-coordinate corresponding to 20% of the maximum intensity.
  • Define l as the axial distance ( Δ x ) between the locations corresponding to 20% and 80% of the maximum intensity.
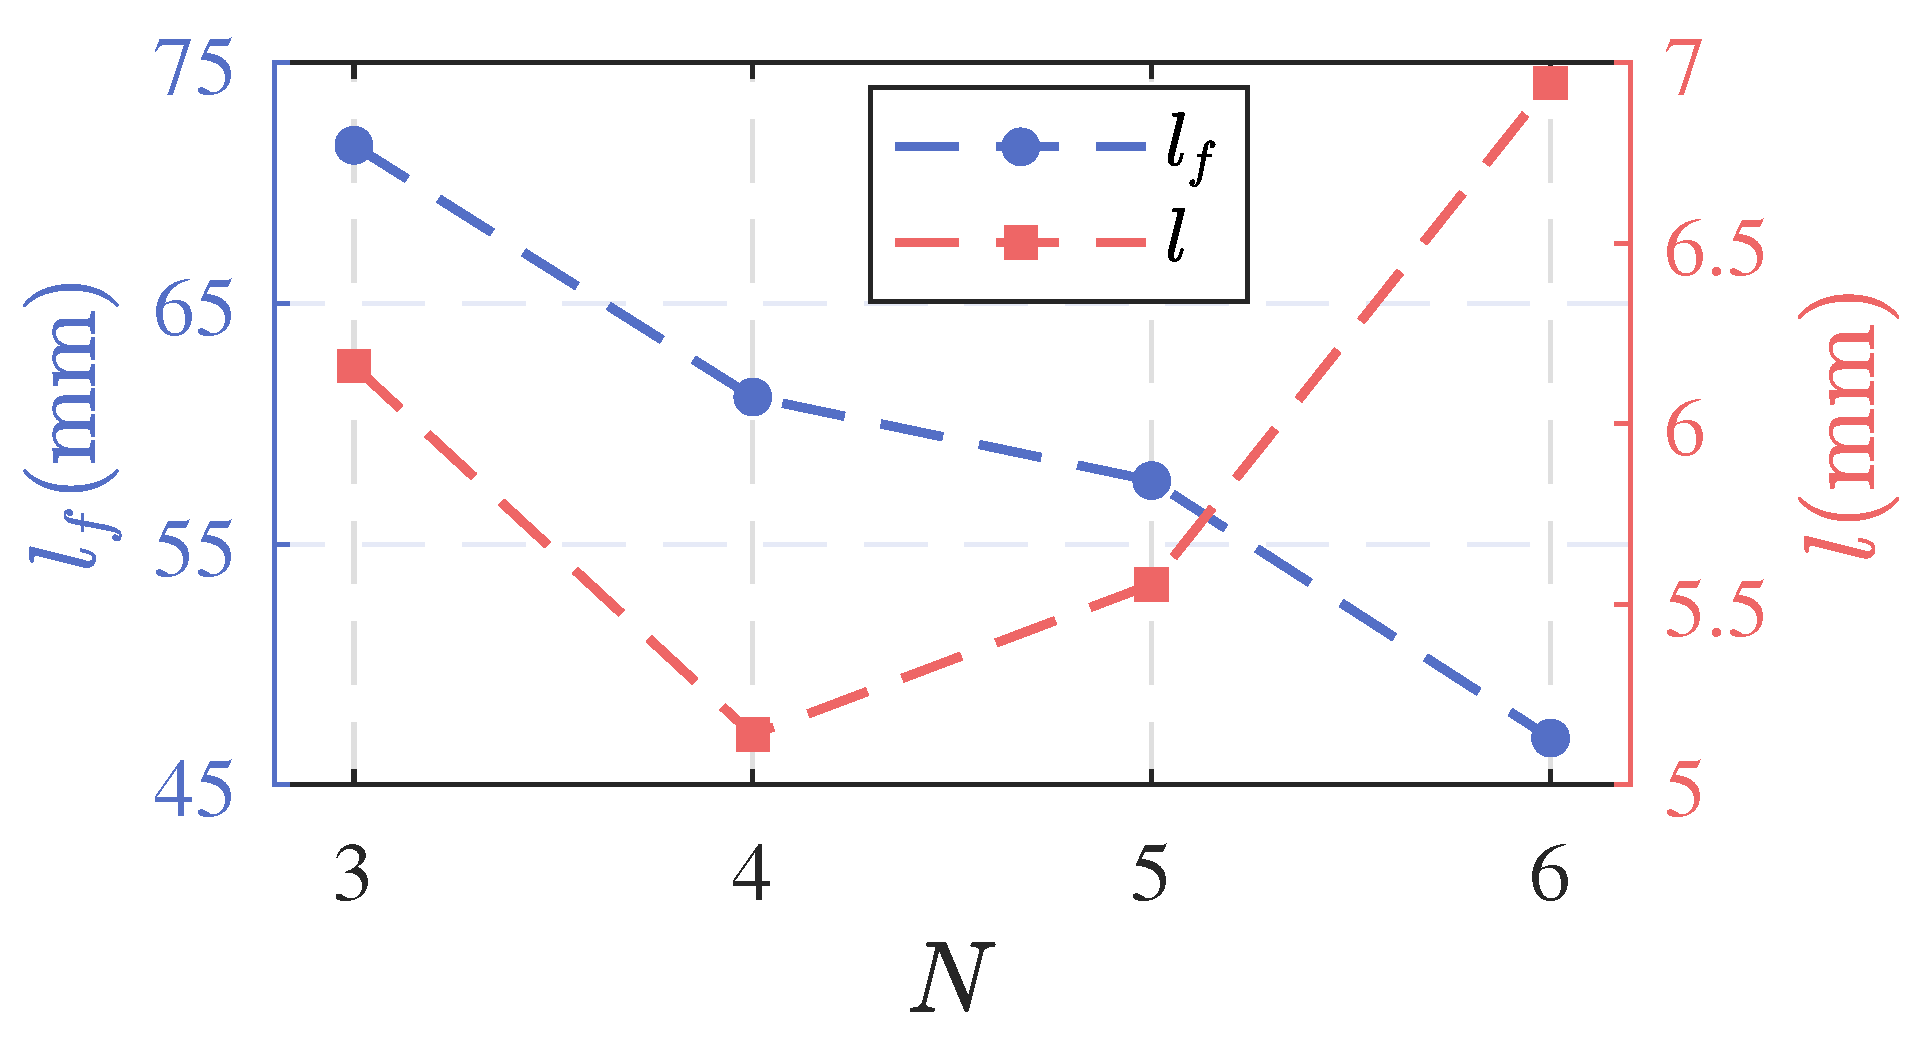
The results for l f and l are presented in Figure 6. The flame length (l) decreases with increasing nozzle count, with measured values of 71.57 mm for N3, 61.11 mm for N4, 57.64 mm for N5, and 46.94 mm for N6. This morphological change occurs under a fixed global equivalence ratio. Increasing the number of nozzles reduces the fuel flow rate per nozzle, thereby decreasing jet velocity and extending fuel residence time in the reaction zone. According to theoretical calculations, when N is 3, 4, 5, and 6, the fuel jet speeds are 7.42 m/s, 5.57 m/s, 4.45 m/s, and 3.71 m/s, respectively. Additionally, the broader spatial distribution of fuel injection ports along the y-direction enhances mixing homogeneity between propane (C3H8) and air, leading to higher flame propagation speeds and a faster flame response to flow perturbations.
This accelerated combustion process reduces the time delay ( τ ) between u and q , which manifests as a decrease in the magnitude of the FTF phase curve slope ( | d Φ / d f | = 2 π τ ). Furthermore, intensified combustion near the bluff-body trailing edge increases flame height while reducing streamwise flame length, resulting in a more compact flame structure.
These shorter flame lengths and reduced response times enhance the flame’s ability to track high-frequency perturbations, explaining the observed shift of FTF gain peak frequencies to higher values as N increases. Additionally, l f exhibits a non-monotonic trend, initially decreasing and then increasing with nozzle count, mirroring the variations in FTF gain. This correlation underscores the significant influence of nozzle arrangement on the flame-root stabilization position.
At lower nozzle counts (e.g., N = 3 ), high local equivalence ratios and elevated jet velocities near discrete injection points amplify turbulent fluctuations, disrupting flame stabilization and hindering reliable anchoring of the flame root near the bluff-body trailing edge. Conversely, at higher nozzle counts (e.g., N = 6 ), reduced local equivalence ratios and weaker jet momentum diminish the flame’s ability to resist aerodynamic disturbances, causing the primary flame anchoring zone to shift downstream, increasing l f .
Analysis of the experimental results in Figure 3 indicates that FTF gain for different N values exhibits local maxima or minima at frequencies of 100 Hz, 200 Hz, 250 Hz, or 290 Hz. Figure 7 shows the time-averaged flame structures under these excitation frequencies for each nozzle configuration, with corresponding HRR reflecting maximum and minimum ranges at these frequencies. The associated flame lengths (l) are presented in Figure 8.
Under consistent excitation intensity, the time-averaged flame structure at 100 Hz resembles the unforced flame across all nozzle configurations. However, as excitation frequency increases, the flame brush thickens, and the flame root moves closer to the bluff-body trailing edge, reducing flame length (l). Under the N3 and N4 fuel-nozzle configurations, the flame length remains essentially unchanged at acoustic excitation frequencies between 250 Hz and 290 Hz. In contrast, configurations N5 and N6 exhibit a marked decreasing trend (Figure 7). The flame fronts observed for the N5 and N6 nozzles are notably thinner. Consequently, their chemical reaction zones demonstrate significantly higher sensitivity to perturbations induced by velocity pulsations.
Figure 8 demonstrates that flames with higher nozzle counts are more sensitive to excitation frequency, exhibiting a thicker flame brush and a more pronounced reduction in flame length (l) under excitation. This enhanced response is attributed to increased flame compactness due to distributed fuel injection.
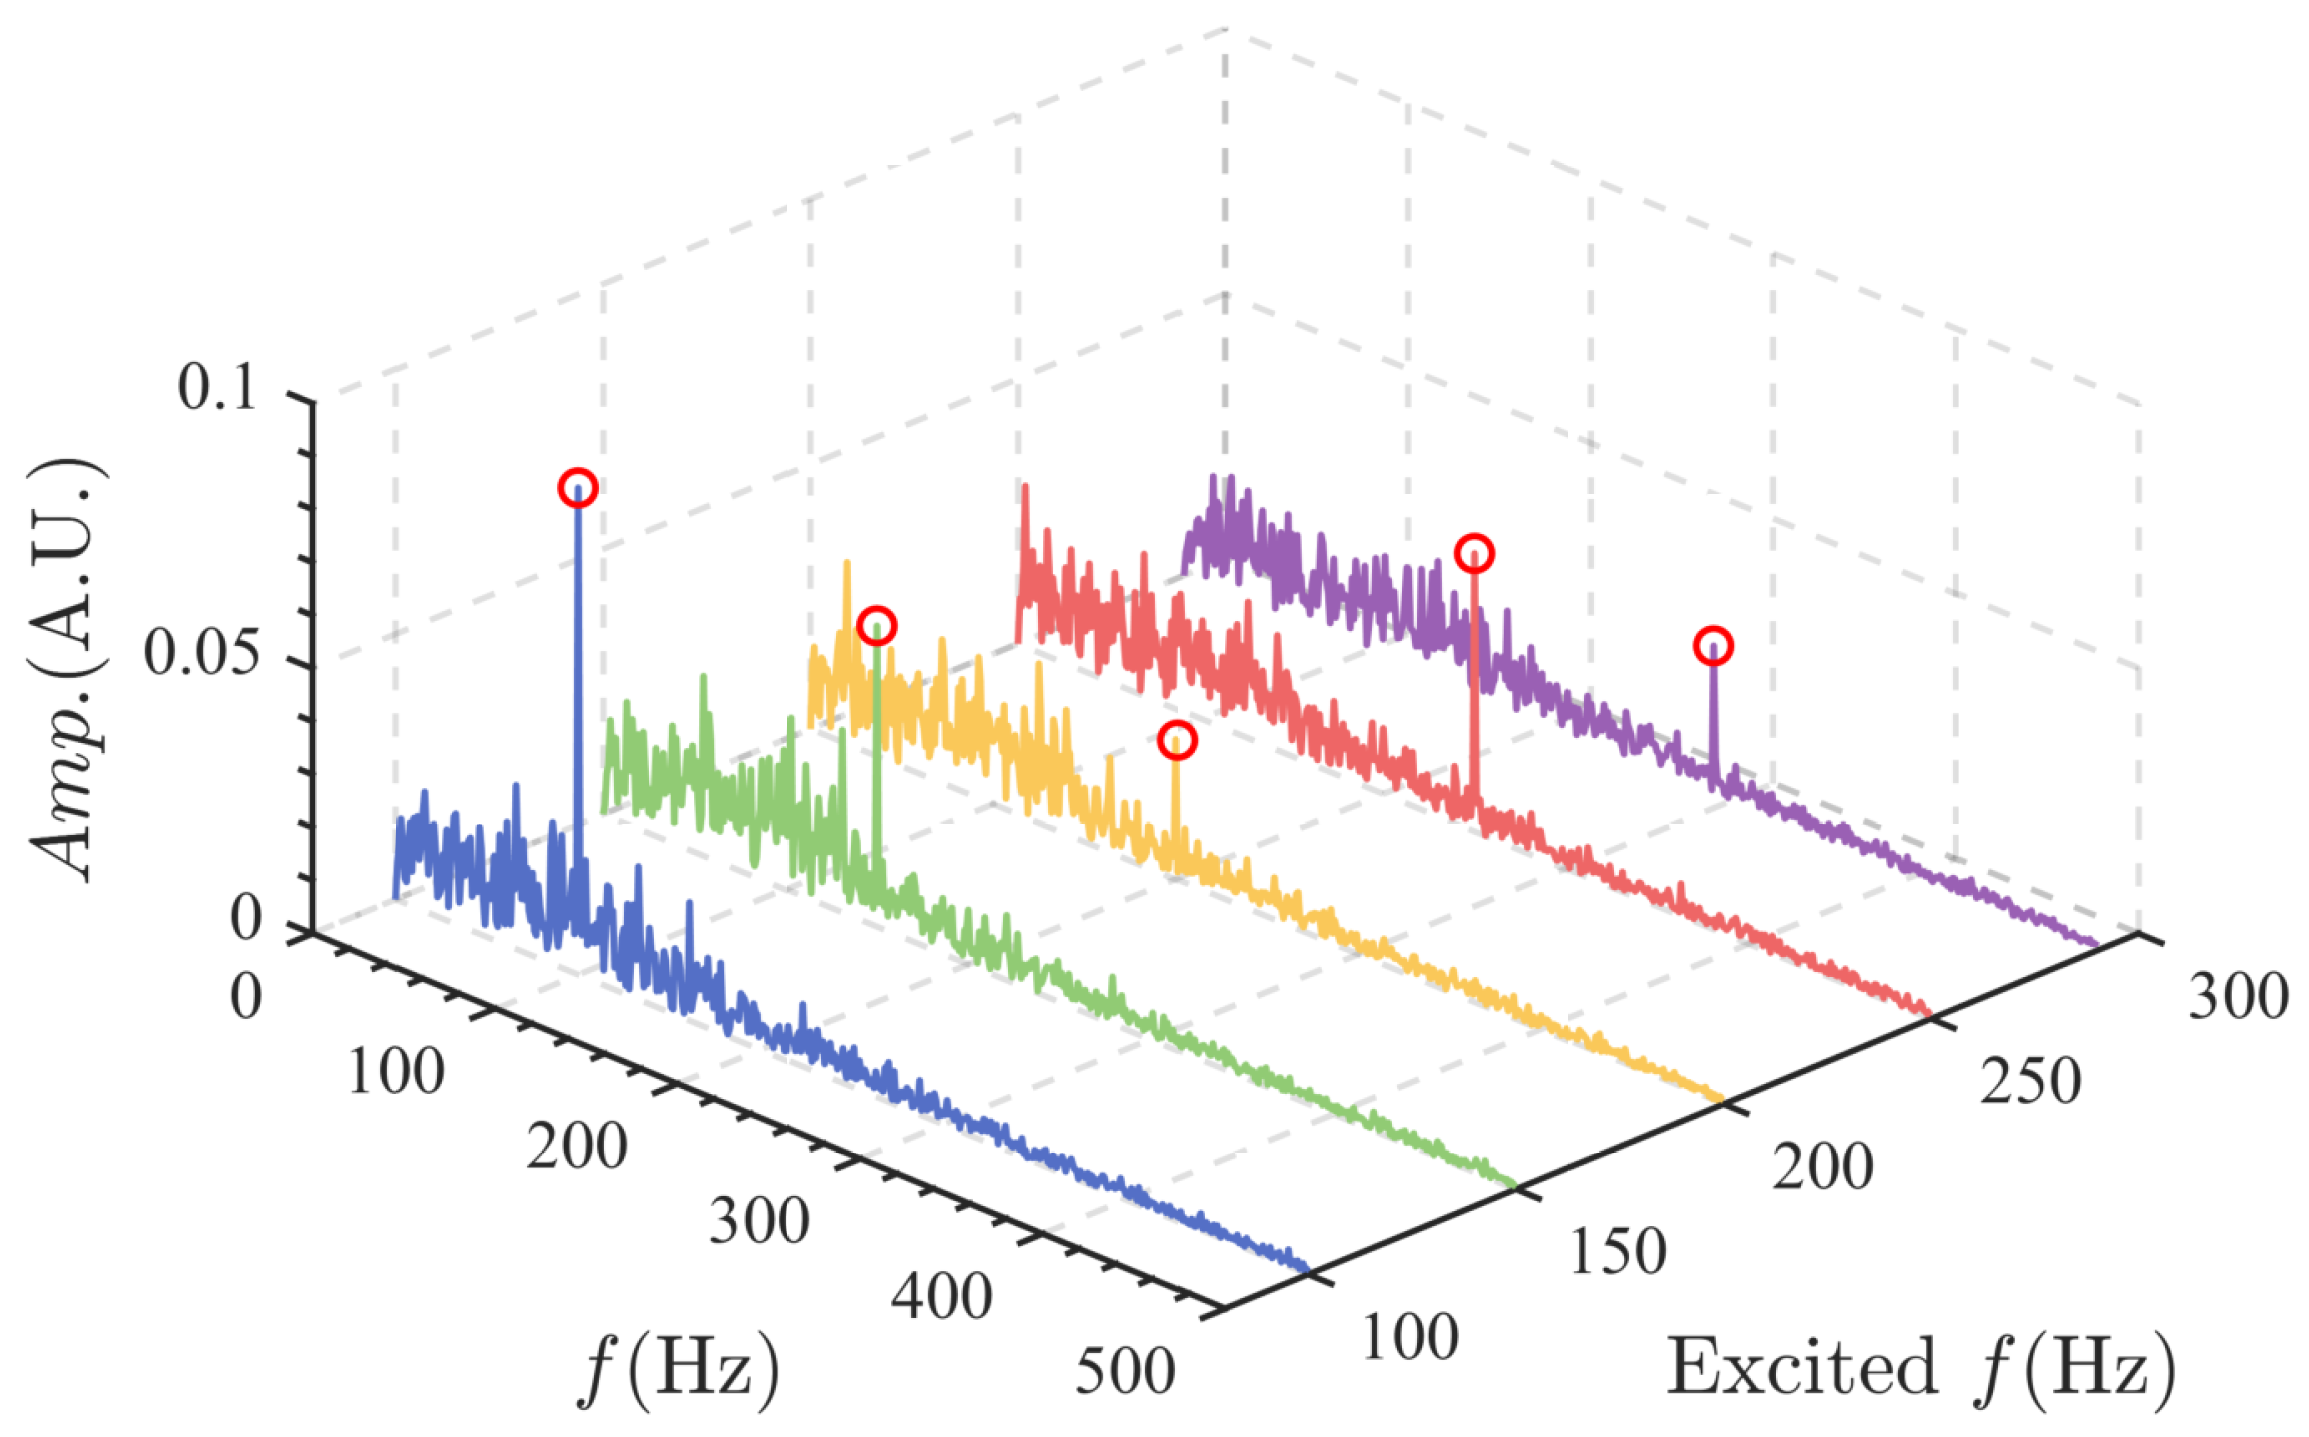
For the N4 configuration, the FTF gain shows distinct local maxima at 100 Hz and 250 Hz and a pronounced minimum at 200 Hz. Figure 9 presents the spectra of global OH* chemiluminescence fluctuations measured by the photomultiplier tube (PMT) system under different excitation frequencies. The dominant frequency in these spectra matches the applied velocity perturbation frequency, but the response amplitude varies significantly, with higher amplitudes at 100 Hz and 250 Hz compared to a lower amplitude at 200 Hz, reflecting the flame’s varying sensitivity to acoustic excitation frequencies.
Figure 7 further reveals that low-frequency excitation (100 Hz) produces a flame structure similar to the unforced flame, while high-frequency excitation (250 Hz) significantly reduces flame length. To elucidate the mechanisms driving the local maxima and minima in FTF gain at specific frequencies (e.g., 100 Hz, 200 Hz, and 250 Hz for N4), further detailed analysis of flame dynamics at each excitation frequency is required.

3.3. Analysis of Flame Dynamics

Experimental results indicate that the flame transfer functions (FTFs) for various fuel jet orifice configurations exhibit consistent response characteristics across different perturbation frequencies. To elucidate the dynamic response behavior of the flame, we selected the N4 configuration as a representative case for detailed characterization.
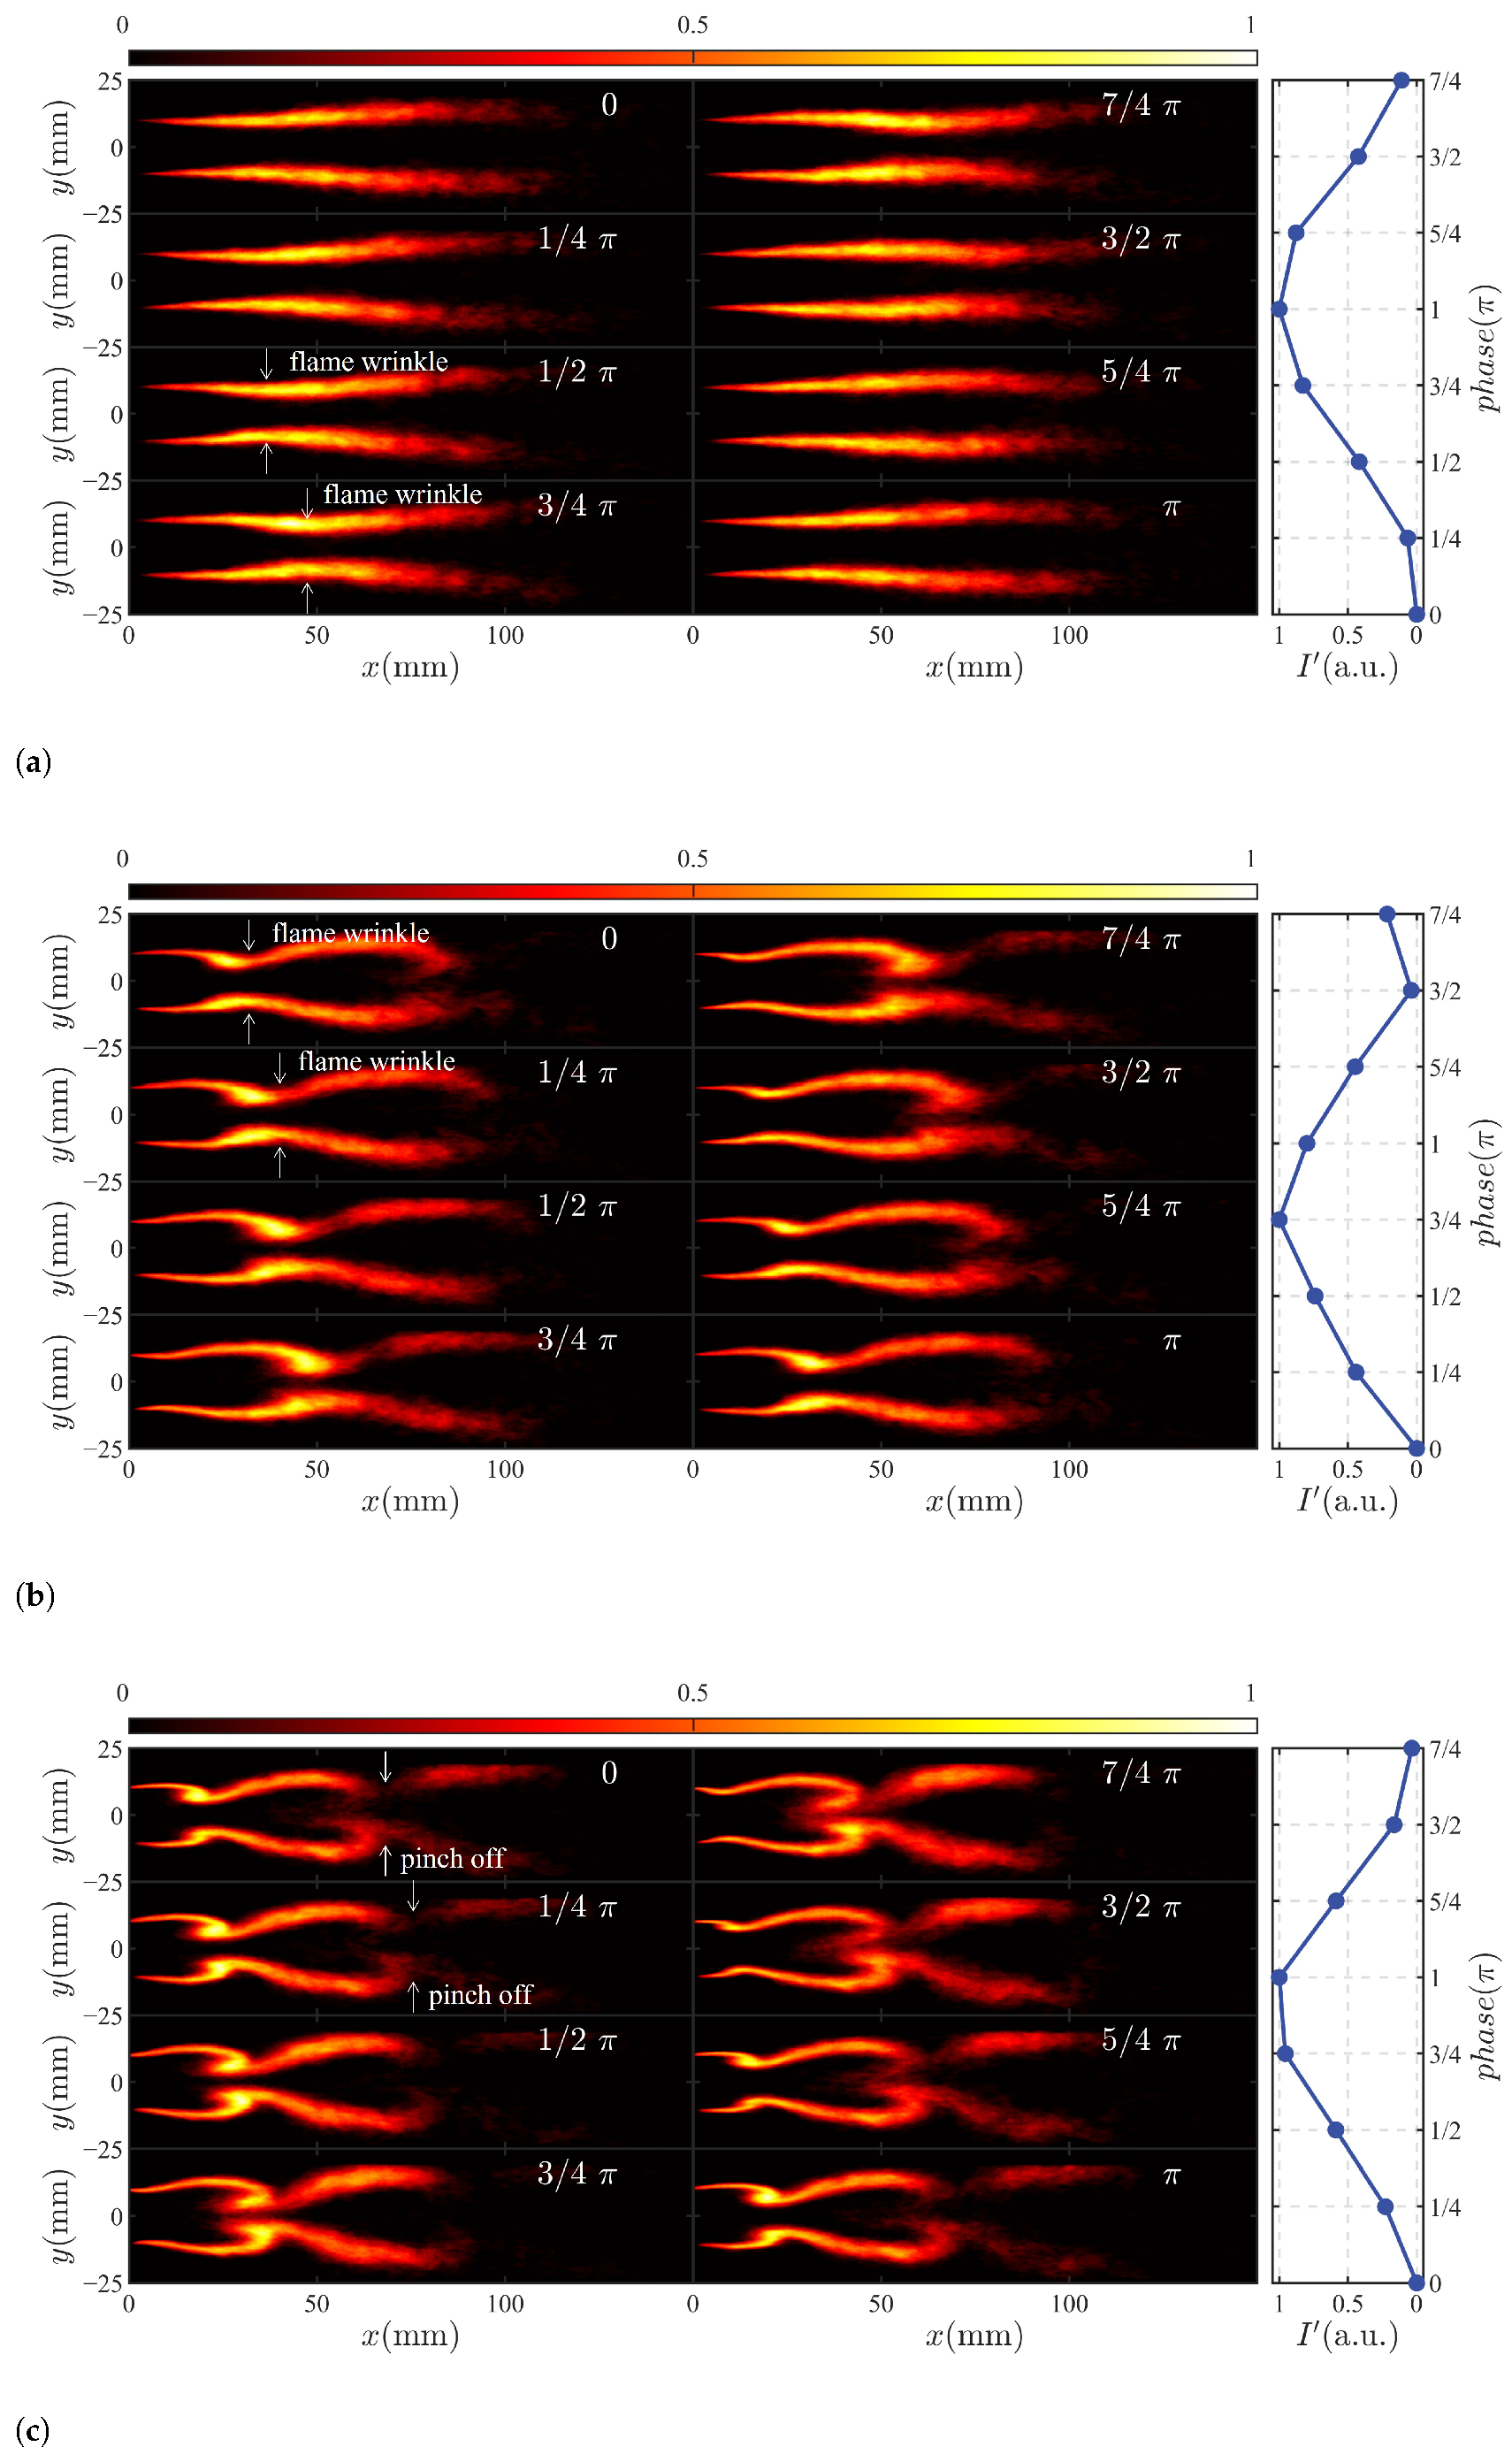
Figure 10 presents phase-averaged CH* chemiluminescence images for the N4 configuration under excitation frequencies of 100 Hz, 200 Hz, and 250 Hz. These images cover 20 cycles of the instability process, with the final column of each row showing the normalized HRR within one cycle. At 100 Hz excitation, velocity fluctuations in the intake flow induce minimal structural oscillations in the flame. However, a distinct flame-front corrugation appears at the phase angle of T = π / 2 , corresponding to the midpoint of the velocity perturbation cycle. As this corrugation propagates downstream, the two flame branches anchored by the bluff body primarily oscillate along the y direction. This behavior suggests that at lower frequencies, the longer wavelength of velocity fluctuations leads to synchronized flow pulsations on both sides of the bluff body, forming a rolled-up corrugation structure on the flame surface. This results in a localized contraction in the y direction. Due to the large spatial extent of this corrugation relative to the perturbation period, the flame branches exhibit a predominant y-directional oscillation pattern throughout the pulsation cycle.
At 200 Hz excitation, the phase-averaged flame structure reveals a distinct evolutionary pattern. At T = 0 , a prominent corrugation forms on the flame surface, undergoing inward rolling, increasing the HRR. By phase T = π / 4 , this corrugation reaches its maximum amplitude. Although the two flame branches do not interact, the intense rolling induces incipient breakage in both branches. By T = π / 2 , a new corrugation emerges near the flame base and propagates downstream. Notably, the HRR increase from the new corrugation is outweighed by the HRR reduction in the rear section due to flame breakage, which disrupts the continuous supply of unburned mixture to downstream regions, leading to a rapid decline in global HRR until the cycle resets.
Under 250 Hz excitation, a similar pulsation pattern emerges with distinct characteristics. At T = 0 , a well-defined corrugation forms at the flame base, while a detached flame segment persists in the rear section. By T = π / 4 , the corrugation undergoes inward rolling, increasing local HRR, while the broken segment convects downstream, reducing local HRR. The global HRR peaks at T = π / 2 , where both flame branches exhibit clear breakage tendencies, and a new upstream corrugation initiates. After T = π / 2 , the new corrugation evolves and propagates downstream, elevating local HRR, while the fragmented segment continues to convect, reducing local HRR. This competitive interaction drives a gradual reduction in global HRR, completing the cycle. The intense flame-surface modulation governs the pronounced observed HRR fluctuations.
As shown in Figure 10, when velocity pulsations occur at 200 Hz or 250 Hz, the local pressure gradient of the fluid medium oscillates periodically. This induces the formation of local reverse flows. These flows, in conjunction with the rotational motion generated by vortex structures, collectively drive periodic oscillations in the flame morphology. Under high strain rates, this dynamic process leads to flame pinch-off, resulting in variations in flame surface area. This phenomenon aligns with the observations made by Anh et al. [12,13] in Burke–Schumann flames.
To further investigate the spatiotemporal differences in HRR under varying excitation frequencies, we applied Proper Orthogonal Decomposition (POD) to CH* chemiluminescence images. POD extracts the spatial modes of flame fluctuations and their temporal distributions, a widely used technique in flame dynamics studies [28,29,30]. The employed POD algorithm was validated using data from Ref. [31].
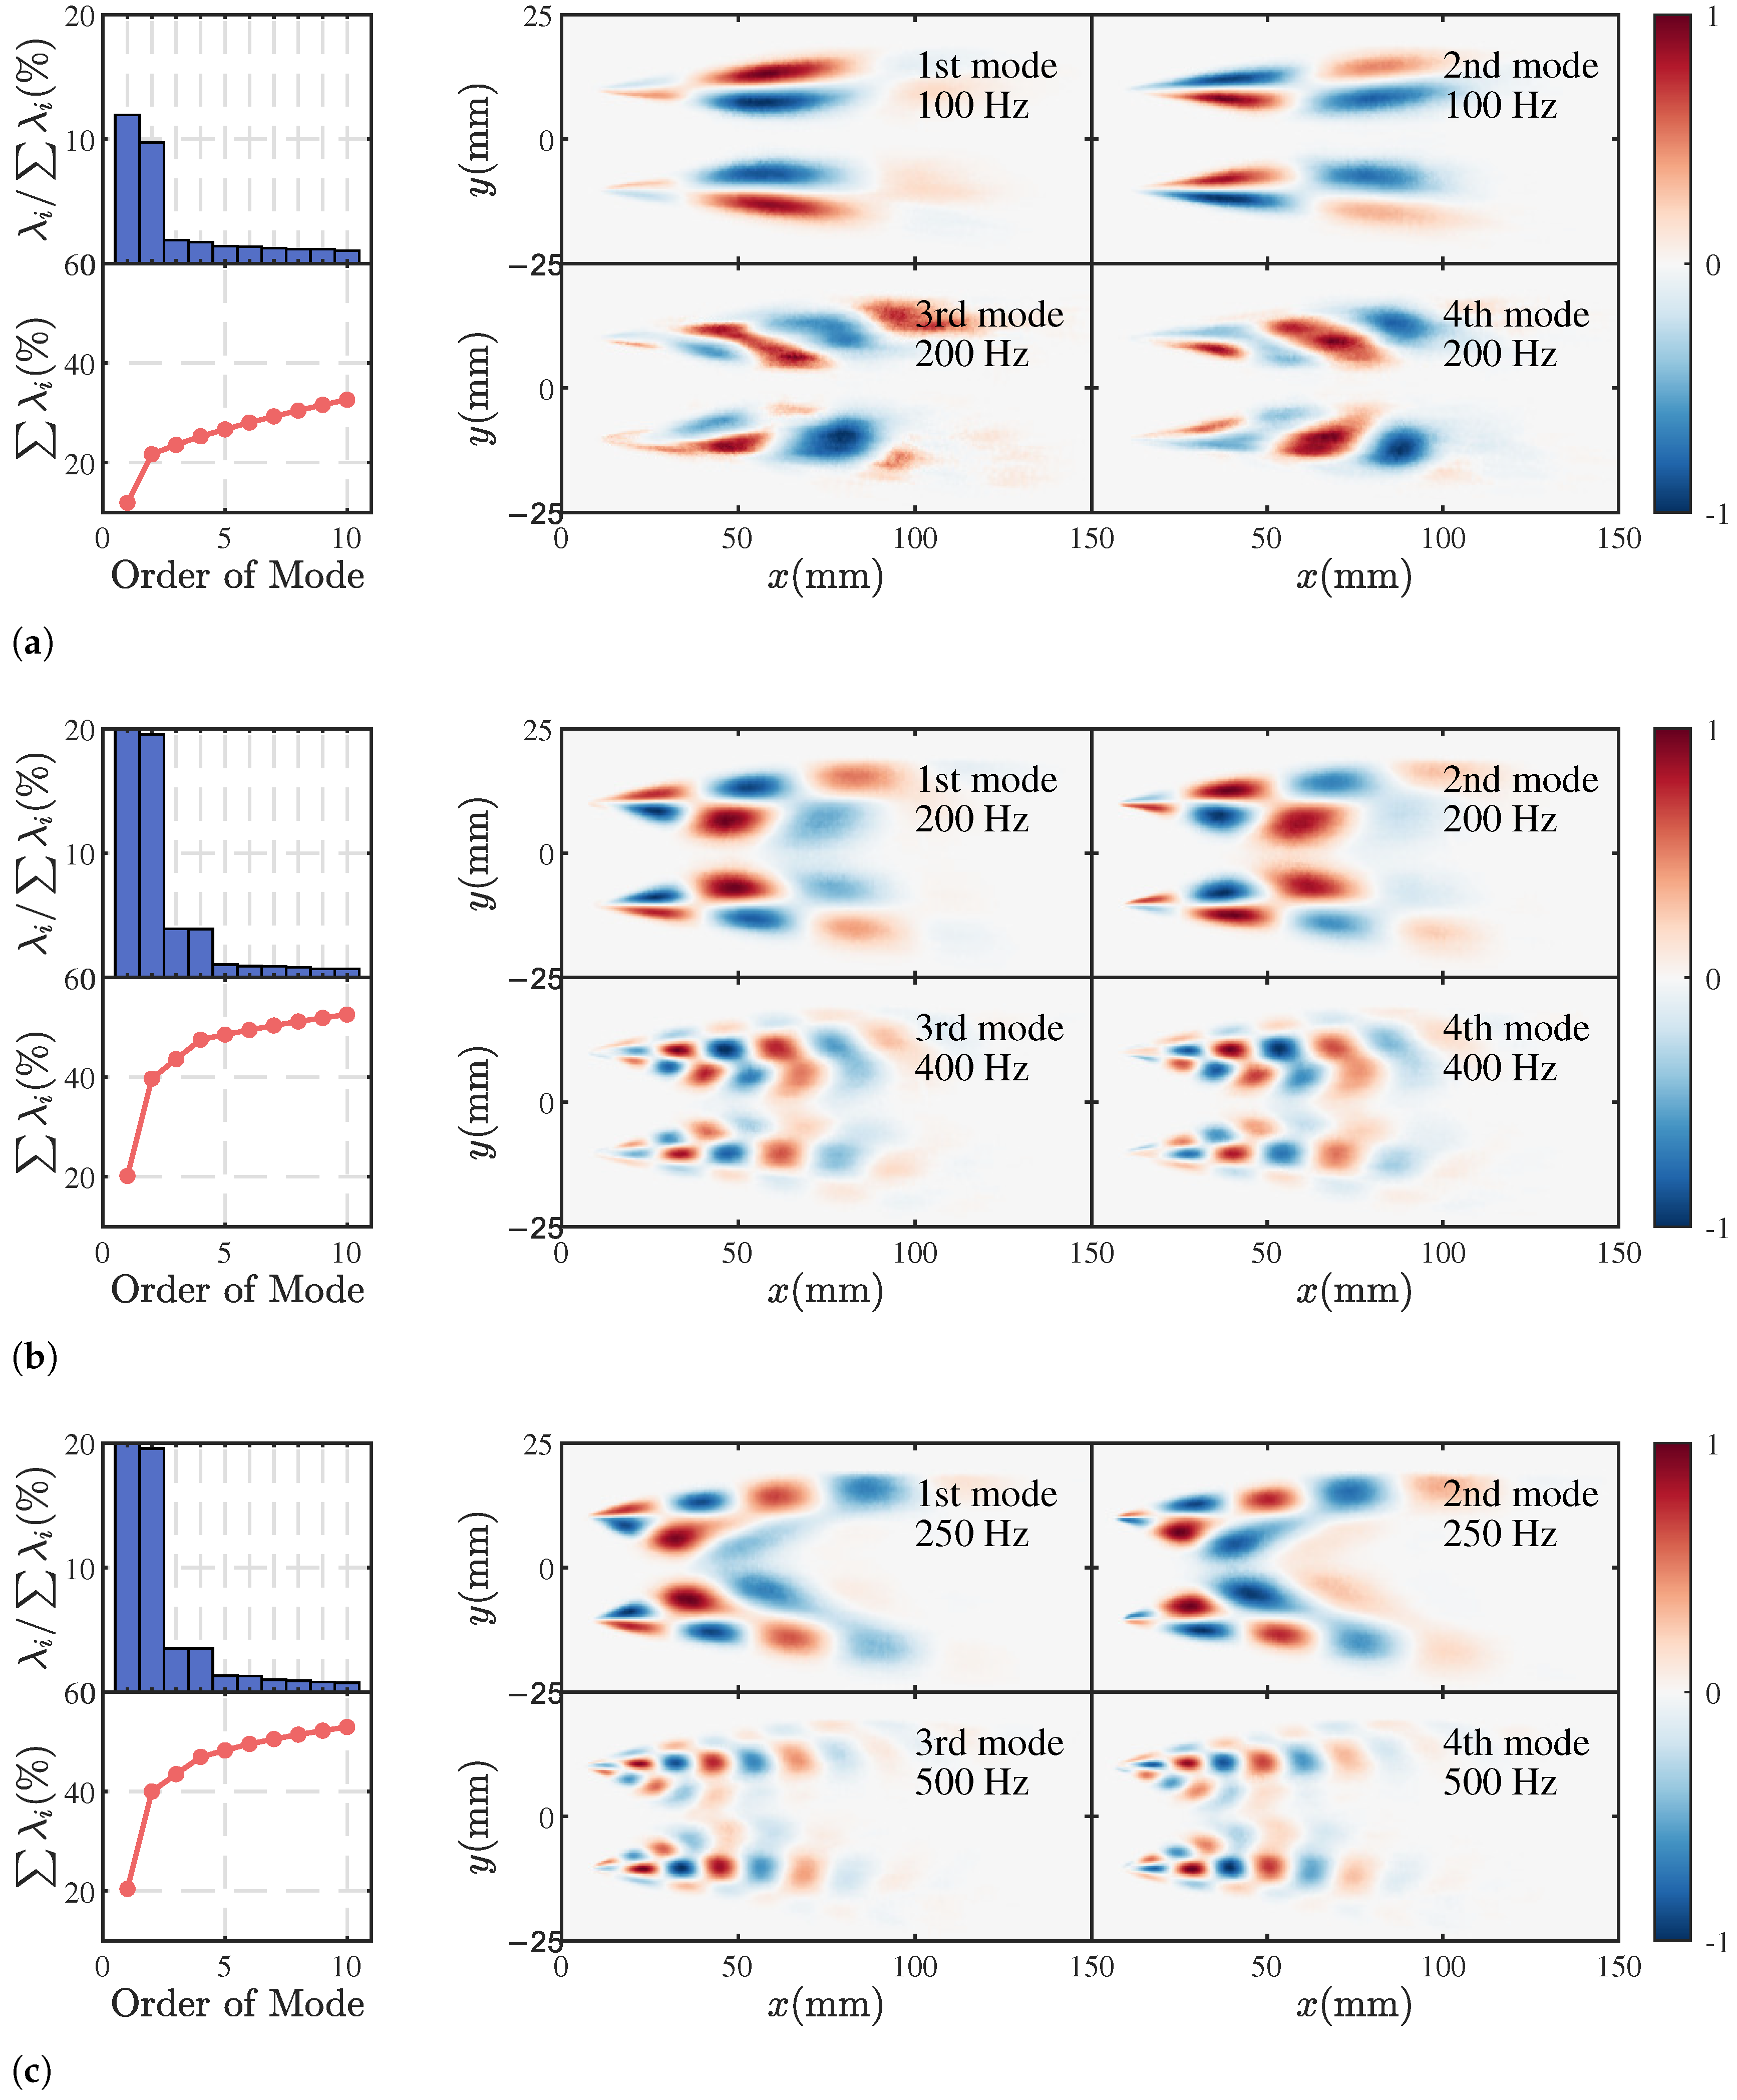
Figure 11 presents the POD results for CH* chemiluminescence images at excitation frequencies of 100 Hz, 200 Hz, and 250 Hz. Each set includes the energy fraction and cumulative sum of the first ten POD modes on the left and the normalized spatial distributions of the first four dominant modes on the right. Labels indicate the mode order and corresponding dominant frequency.
In Figure 11a, for 100 Hz excitation, the energy fractions of the first two modes significantly exceed those of other modes, with the third mode contributing less than 2%. This indicates that the first two modes dominate flame pulsation. Their spatial distributions show alternating positive and negative oscillation bands along both x and y directions, following the time-averaged flame front. For mode 1, significant pulsation contributions in both flame branches are concentrated at 25–75 mm in the x direction, primarily manifesting as y-directional structures. Comparative analysis with Figure 11a reveals spatial correspondence to flame corrugation formation zones, indicating radial flame oscillations. Additionally, the entire flame exhibits two radial pulsation structures along the x direction, reflecting flame deformation due to downstream-propagating corrugations.
For 200 Hz excitation (Figure 11b), the cumulative energy fraction of the first ten modes reaches 53.49% of the total energy, which is higher than the 100 Hz case. The first two modes account for 41.77% cumulatively, while the fifth mode contributes less than 2%. As the excitation frequency increases, the reduced perturbation wavelength results in smaller-scale and more numerous pulsation structures in the spatial distributions of the first two modes. Modes 3 and 4 exhibit increasingly fragmented pulsation patterns. At 250 Hz (Figure 11c), the spatial distributions of the first two modes under flame pinch-off dynamics show downstream coupling between the two bluff body-stabilized flame branches.
This analysis suggests that the two peaks in the FTF gain curve at 100 Hz and 250 Hz correspond to large-scale structural pulsations and HRR fluctuations driven by flame pinch-off dynamics, respectively. In contrast, at 200 Hz, the flame exhibits distinct pulsation structures but lacks pronounced global HRR fluctuations, indicating the absence of dominant thermoacoustic coupling mechanisms at this frequency.
To further quantify this phenomenon, we analyzed the variation in flame luminosity along the y direction through intensity integration, using the following three-step methodology:
  • Time-averaged HRR distribution: Calculate the line-of-sight integrated luminosity along the y direction for the time-averaged flame image to obtain the time-mean HRR distribution along the x direction, denoted as I x ¯ .
  • Phase-resolved HRR quantification: Compute the CH* chemiluminescence intensity distribution along the x-direction ( I x ) for each phase-averaged flame result.
  • HRR fluctuation derivation: Derive the HRR fluctuation distribution along the x direction by calculating I x I x ¯ .
Figure 12 presents the results for the N4 configuration under excitation frequencies of 100 Hz, 200 Hz, and 250 Hz. Red regions indicate positive values ( I x > I x ¯ ), where the phase-averaged HRR exceeds the time-mean value, while blue regions indicate negative values ( I x < I x ¯ ), representing sub-average phase-resolved HRR.
At 100 Hz excitation, at T = 0 , the flame exhibits an HRR below the time-averaged value across most regions. From T = π / 4 to T = 3 π / 4 , a flame corrugation forms upstream under the influence of flow pulsation structures and propagates downstream. Between T = π and T = 7 π / 4 , the corrugation’s HRR intensity diminishes, initiating the next cycle. Analysis of I x I x ¯ , combined with Figure 10a, shows negligible convective transport along the x direction, with y-directional HRR pulsations dominating the flame dynamics. In contrast, at 200 Hz and 250 Hz (Figure 12b,c), the I x I x ¯ distributions exhibit pronounced convective transport. At 200 Hz, flame corrugation initiates approximately at x = 22 mm downstream of the bluff body. Vortex structures induced by velocity pulsations enhance entrainment and mixing of C3H8 with air, increasing local combustion efficiency and elevating HRR above the average level. As the reactant-vortex structure convects downstream ( x 22 mm), the HRR intensity increases, reflected in rising I x I x ¯ magnitudes. At T = 5 π / 4 , a new corrugation forms, restarting the cycle.
At 250 Hz, the HRR pulsation mode remains dominated by corrugation roll-up and convective processes. The reduced perturbation wavelength allows more pulsation structures to coexist within the flame zone, contributing to the enhanced FTF gain magnitude at this frequency.

4. Conclusions

This study has comprehensively investigated the influence of the number of fuel injection holes (N) on the FTF and dynamic behavior of bluff body-stabilized, non-premixed flames in a model afterburner combustor. Through systematic experimentation and detailed analysis, the following key conclusions are drawn:
  • The FTF gain exhibits a dual-peak structure across all tested configurations, with local maxima and minima at specific frequencies.For all N conditions, the maximum FTF gain occurred between 90 Hz and 120 Hz, while the minimum gain values were distributed between 160 Hz and 220 Hz. As N increases, the gain initially decreases, then increases, indicating a non-monotonic effect on combustion stability. The frequencies corresponding to the gain peaks in the FTF shift to higher values with increasing N, attributed to reduced flame length and enhanced flame responsiveness.
  • The time delay between velocity fluctuations and heat release-rate fluctuations, derived from the FTF phase, decreases as N increases, signifying a quicker flame response to perturbations. Increasing N leads to shorter flame lengths and increased flame heights. Specifically, flame lengths for configurations of N = 3, 4, 5, and 6 are approximately 72 mm, 61 mm, 58 mm, and 47 mm, respectively. This trend arises from improved fuel distribution and mixing, which promote more compact and efficient combustion.
  • Analysis of phase-averaged images and proper orthogonal decomposition (POD) reveals distinct pulsation modes at different excitation frequencies. At lower frequencies, large-scale structural pulsations dominate, while at higher frequencies, flame pinch-off dynamics and convective transport of corrugations drive heat release rate fluctuations. Flames with higher N exhibit greater sensitivity to high-frequency excitations, as evidenced by more pronounced reductions in flame length and enhanced heat release-rate fluctuations under such conditions.
These findings highlight the critical role of fuel injection configuration in modulating the dynamic response of bluff body-stabilized, non-premixed flames. By optimizing the number of fuel injection holes, it is possible to tailor the FTF and enhance combustion stability in afterburners. However, it should be noted that the present study on the response characteristics of bluff-body flames was conducted using gaseous fuels under laboratory conditions. Therefore, caution must be exercised when extrapolating these results to real-world combustor operating scenarios.
Future research on flame stability in afterburners should prioritize investigations under engine-representative conditions across the flight envelope to yield insights of greater practical engineering relevance. This necessitates explicit consideration of the high-altitude, high-temperature, high-velocity gas inflow conditions typical of afterburner operation.

Author Contributions

Methodology, H.S.; investigation, H.S.; formal analysis, H.S. and X.Z.; visualization, H.S.; writing—original draft, H.S.,Y.Z. and X.Z.; data curation, Y.Z.; validation, Y.Z.; software, X.Z.; resources, S.W.; supervision, S.W.; writing—review and editing, S.W. and Y.L.; funding acquisition, Y.L.; project administration, Y.L. All authors have read and agreed to the published version of the manuscript.

Funding

This research was funded by the National Science and Technology Major Project (grant number J2022-III-0007-0016).

Data Availability Statement

The data that support the findings of this study are available from the corresponding author upon reasonable request.

Conflicts of Interest

Author Haitao Sun is employed by the Sichuan Gas Turbine Establishment, Aero Engine Corporation of China. The remaining authors declare that the research was conducted in the absence of any commercial or financial relationships that could be construed as a potential conflict of interest.

References

  1. Ma, Z.; Fan, Y.; Wang, Y.; Han, Q. Experimental and numerical investigation on oscillatory combustion characteristics of an integrated flameholder. Aerosp. Sci. Technol. 2024, 153, 109441. [Google Scholar] [CrossRef]
  2. Poinsot, T. Prediction and control of combustion instabilities in real engines. Proc. Combust. Inst. 2017, 36, 1–28. [Google Scholar] [CrossRef]
  3. Liu, Y.; Xu, L.; Cheng, R.; Guo, P.; Yan, Y. Experimental study on phase transfer of longitudinal mode combustion oscillations in bluff body diffusion flames. Aerosp. Sci. Technol. 2025, 159, 110014. [Google Scholar] [CrossRef]
  4. Dharmaputra, B.; Nagpure, P.; Impagnatiello, M.; Noiray, N. Flame transfer function measurement of a sequential combustor fuelled with natural gas and hydrogen. Combust. Flame 2025, 274, 113972. [Google Scholar] [CrossRef]
  5. Yang, C.; Liu, Y.; Zhang, X.; Li, H.; Ge, X.; Jin, F.; Liu, C. Experimental Study on Flame Response Characteristics of a Non-Premixed Swirl Model Combustor. Energies 2023, 16, 6834. [Google Scholar] [CrossRef]
  6. Han, X.; Li, J.; Morgans, A.S. Prediction of combustion instability limit cycle oscillations by combining flame describing function simulations with a thermoacoustic network model. Combust. Flame 2015, 162, 3632–3647. [Google Scholar] [CrossRef]
  7. Preetham; Santosh, H.; Lieuwen, T. Dynamics of Laminar Premixed Flames Forced by Harmonic Velocity Disturbances. J. Propuls. Power 2008, 24, 1390–1402. [Google Scholar] [CrossRef]
  8. Ni, F.; Nicoud, F.; Mery, Y.; Staffelbach, G. Including Flow–Acoustic Interactions in the Helmholtz Computations of Industrial Combustors. AIAA J. 2018, 56, 1–15. [Google Scholar] [CrossRef]
  9. Ahn, B.; Indlekofer, T.; Dawson, J.R.; Worth, N.A. Heat release rate response of azimuthal thermoacoustic instabilities in a pressurized annular combustor with methane/hydrogen flames. Combust. Flame 2022, 244, 112274. [Google Scholar] [CrossRef]
  10. Morgans, A.S.; Yang, D. Thermoacoustic Instability in Combustors. Annu. Rev. Fluid Mech. 2025, 57, 9–33. [Google Scholar] [CrossRef]
  11. Lee, T.; Park, J.; Han, D.; Kim, K.T. The dynamics of multiple interacting swirl-stabilized flames in a lean-premixed gas turbine combustor. Proc. Combust. Inst. 2019, 37, 5137–5145. [Google Scholar] [CrossRef]
  12. Ahn, M.; Lim, D.; Kim, T.; Yoon, Y. Pinch-off process of Burke–Schumann flame under acoustic excitation. Combust. Flame 2021, 231, 111478. [Google Scholar] [CrossRef]
  13. Ahn, M.; Kim, T.; Yoon, Y. Comparison of flame response characteristics between Non-premixed and premixed flames under acoustic excitation. Exp. Therm. Fluid Sci. 2022, 139. [Google Scholar] [CrossRef]
  14. Kim, K.T.; Hochgreb, S. The nonlinear heat release response of stratified lean-premixed flames to acoustic velocity oscillations. Combust. Flame 2011, 158, 2482–2499. [Google Scholar] [CrossRef]
  15. Kim, K.T.; Hochgreb, S. Effects of Nonuniform Reactant Stoichiometry on Thermoacoustic Instability in a Lean-Premixed Gas Turbine Combustor. Combust. Sci. Technol. 2012, 184, 608–628. [Google Scholar] [CrossRef]
  16. Mejia, D.; Miguel-Brebion, M.; Ghani, A.; Kaiser, T.; Duchaine, F.; Selle, L.; Poinsot, T. Influence of flame-holder temperature on the acoustic flame transfer functions of a laminar flame. Combust. Flame 2018, 188, 5–12. [Google Scholar] [CrossRef]
  17. Chen, Y.; Fan, Y.; Bai, X.S.; Xu, L.; Shan, X.; Bi, Y.; Deng, Y.; Han, Q. Experimental study on combustion and flow resistance characteristics of an afterburner with air-cooled bluff-body flameholder. Aerosp. Sci. Technol. 2022, 123, 107488. [Google Scholar] [CrossRef]
  18. Zhang, Y.; He, X.; Zhong, S.; Deng, Y.; Wang, J.; Zhang, F. Influence of incoming flow parameters on the flow field in a trapped vortex cavity with radial bluff-body. Aerosp. Sci. Technol. 2023, 132, 108050. [Google Scholar] [CrossRef]
  19. Manikandan, S.; Sujith, R.I. Rate dependent transition to thermoacoustic instability via intermittency in a turbulent afterburner. Exp. Therm. Fluid Sci. 2020, 114, 110046. [Google Scholar] [CrossRef]
  20. Dicholkar, A.; Lønbæk, K.; Madsen, M.H.A.; Zahle, F.; Sørensen, N.N. From bluff bodies to optimal airfoils: Numerically stabilized RANS solvers for reliable shape optimization. Aerosp. Sci. Technol. 2025, 161, 110153. [Google Scholar] [CrossRef]
  21. Wei, L.; Yu, L.; Bo, H.; Yunpeng, L.; Yingwen, Y. Method for calculating the combustion performance of an afterburner through gas components analysis. Aerosp. Sci. Technol. 2025, 164, 110400. [Google Scholar] [CrossRef]
  22. Wei, L.; Longchao, X.; Chaodi, Y.; Dong, D.; Yibo, W.; Yingwen, Y. Experimental investigation of the characteristics of direct injection nozzle sprays in an afterburner environment. Aerosp. Sci. Technol. 2025, 157, 109763. [Google Scholar] [CrossRef]
  23. Xu, L.; Liu, Y.; Cheng, R.; Yan, Y. Experimental and theoretical investigating on measurement of dynamic response characteristics of the semi-infinite pressure tube with non-uniform temperature. Appl. Acoust. 2025, 233, 110589. [Google Scholar] [CrossRef]
  24. Kim, K.T.; Lee, J.G.; Quay, B.D.; Santavicca, D.A. Spatially distributed flame transfer functions for predicting combustion dynamics in lean premixed gas turbine combustors. Combust. Flame 2010, 157, 1718–1730. [Google Scholar] [CrossRef]
  25. Zhao, D.; Ji, C.; Wang, B. Geometric shapes effect of in-duct perforated orifices on aeroacoustics damping performances at low Helmholtz and Strouhal number. J. Acoust. Soc. Am. 2019, 145, 2126–2137. [Google Scholar] [CrossRef] [PubMed]
  26. Liu, Y.; Tan, J.; Wang, H.; Lv, L. Characterization of heat release rate by OH* and CH* chemiluminescence. Acta Astronaut. 2019, 154, 44–51. [Google Scholar] [CrossRef]
  27. Zhang, X.; Wang, S.; Liu, Y. Heat release rate responses in self-excited thermoacoustic instabilities of tangential swirling non-premixed flames. Phys. Fluids 2025, 37, 035132. [Google Scholar] [CrossRef]
  28. Wang, X.; Han, X.; Sung, C.J. Transitions of thermoacoustic modes and flame dynamics in a centrally-staged swirl combustor. Energy 2023, 263, 125813. [Google Scholar] [CrossRef]
  29. Fu, P.; Wen, Q.; Hou, L.; Li, J.; Ma, H. Interaction among flame structures and thermoacoustic instabilities in a centrally staged combustor. Appl. Therm. Eng. 2024, 254, 123862. [Google Scholar] [CrossRef]
  30. Di, D.; Yan, Y.; Liu, Y. Study on the flow characteristics and oscillating mechanism of a swirl flame. Fuel 2021, 306, 121657. [Google Scholar] [CrossRef]
  31. Higham, J.E.; Brevis, W.; Keylock, C.J. Implications of the selection of a particular modal decomposition technique for the analysis of shallow flows. J. Hydraul. Res. 2018, 56, 796–805. [Google Scholar] [CrossRef]
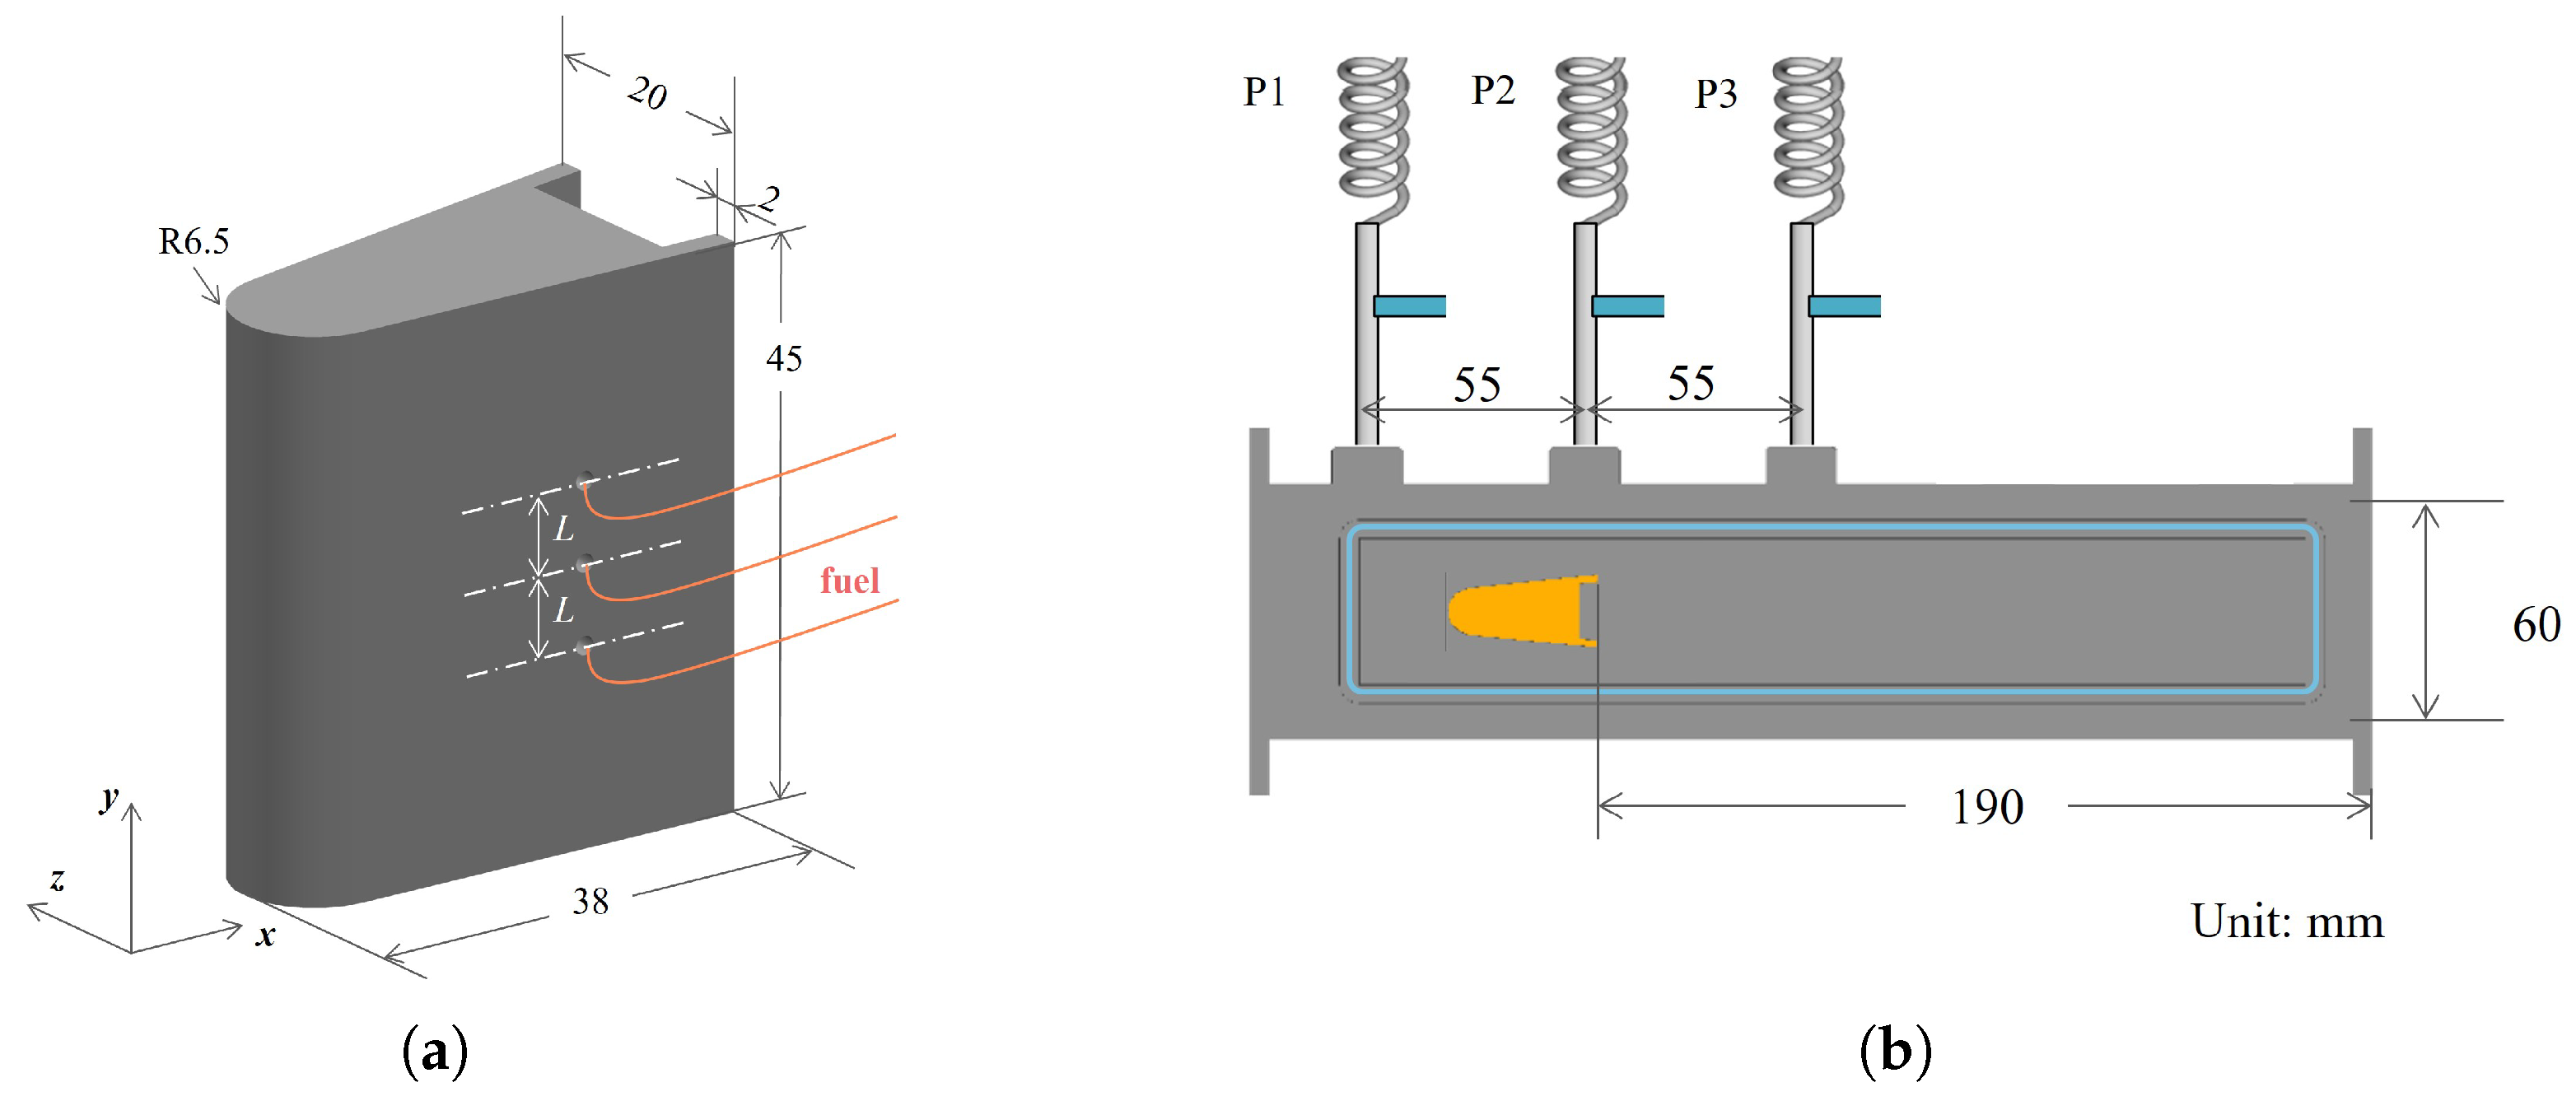
Figure 1. Schematic diagrams: (a) V-shaped bluff-body flameholder and (b) model afterburner combustor structure.
Energies 18 04349 g001
Figure 2. Schematic layout of the overall experimental system.
Energies 18 04349 g002
Figure 3. Flame transfer function gain and phase for different nozzle counts.
Energies 18 04349 g003
Figure 4. Time-averaged flame structures for different N values under unexcited conditions.
Energies 18 04349 g004
Figure 5. Schematic of the flame length measurement method: (a) the relative positions among L f , L, and the flame; (b) variation of the integrated CH* luminescence intensity along the y-direction with x.
Energies 18 04349 g005
Figure 6. Variation of l f and l with N.
Energies 18 04349 g006
Figure 7. Time-averaged flame structures under various excitation frequencies for each nozzle configuration: (a) N = 3; (b) N = 4; (c) N = 5; (d) N = 6.
Energies 18 04349 g007
Figure 8. Flame length under different excitation frequencies for each nozzle configuration.
Energies 18 04349 g008
Figure 9. Spectra of global OH* chemiluminescence fluctuations under different excitation frequencies for N4.
Energies 18 04349 g009
Figure 10. Phase-averaged CH* chemiluminescence images for the N4 configuration under excitation frequencies of (a) 100 Hz, (b) 200 Hz, and (c) 250 Hz.
Energies 18 04349 g010
Figure 11. POD results of CH* chemiluminescence images for the N4 configuration under excitation frequencies of (a) 100 Hz, (b) 200 Hz, and (c) 250 Hz. The color map on the right side represents the normalized spatial distribution of tge first four POD modes ([−1, 1]), and red/blue denotes positive/negative fluctuations.
Energies 18 04349 g011
Figure 12. Variation in flame luminosity along the y direction for the N4 configuration under excitation frequencies of (a) 100 Hz, (b) 200 Hz, and (c) 250 Hz.
Energies 18 04349 g012
Table 1. Operating conditions for the experimental configurations.
CaseNu ϕ Range of f u / u ¯
(-)(m/s)(-)(Hz)(-)
N33
N44
(Ref. Configure) 10.00.06860–3100.02
N55
N66
Disclaimer/Publisher’s Note: The statements, opinions and data contained in all publications are solely those of the individual author(s) and contributor(s) and not of MDPI and/or the editor(s). MDPI and/or the editor(s) disclaim responsibility for any injury to people or property resulting from any ideas, methods, instructions or products referred to in the content.