Article

Cost Implications for Collaborative Microgrids: A Case Study of Lean—Heijunka Microgrid Operations Mitigating Renewable Energy Volatility

School of Electrical and Mechanical Engineering, University of Portsmouth, Portsmouth PO1 2UP, UK
*
Author to whom correspondence should be addressed.
Energies 2025, 18(16), 4320; https://doi.org/10.3390/en18164320
Submission received: 7 July 2025 / Revised: 23 July 2025 / Accepted: 12 August 2025 / Published: 14 August 2025
(This article belongs to the Special Issue Intelligent Operation and Management of Microgrids, 2nd Edition)

Abstract

The volatility of renewable energy outputs is a well-known obstacle that has hindered the integration of more renewables in the UK’s energy mix, as the current network was not designed to handle such swings. Microgrids (MGs) may function as an effective means of integrating more renewables, particularly if they can effectively control the volatility of renewables at a smaller scale (the MG level) through a collaborative operational strategy. This paper focuses on the management of renewable energy fluctuations in MGs, proposing a pre-contract order update (COU) strategy based on the lean balancing (Heijunka) concept. The study compares the performance of collaborative and selfish MGs in terms of levelized cost of electricity (LCOE), order volatility, and carbon emissions. Two simulations models for the collaborative and selfish MGs were implemented, while considering two distinct backup generation scenarios within the MG system. The findings indicate a two-dimensional trade-off between the collaborative MG models, which are 61% more sustainable and reduce order volatility to the utility grid by 55%, and the selfish MGs, which incur lower energy consumption costs reduced by only 19%. These findings highlight the potential of collaborative MGs in enhancing grid stability and supporting broader renewable energy integration goals.

1. Introduction

Integrating more renewable resources into the national energy network is crucial for achieving the UK’s present net-zero objective [1]. Nevertheless, the incorporation of further renewable energy sources requires a viable solution to its primary issue of intermittency [2]. Management of the energy chain and its operations might provide insights to resolve this issue [3,4]. The notion of a collaborative MG was introduced to ensure stable orders from the MG to the utility grid [5], based on the initial idea by Sato et al. [4], who implemented the principle of Heijunka (level demand/production), an essential concept of lean thinking. The main objective of the collaboration is to design MGs that arrange in advance electricity purchase commitments and pre-contracted order updates (COU) and, hence, diminish the unplanned volatility of orders to the utility network. Feleafel et al. illustrate that this strategy leads to a substantial reduction in the unplanned volatility of orders to the utility grid and significantly decreases the MG’s carbon emissions [5,6]. In summary, collaborative MGs provide a straightforward and secure method to integrate additional renewable sources into the current design and infrastructure of the utility network, while minimising fluctuations in demand on the utility grid and simplifying the bigger system’s operational management.
The motivation behind this research is to expand on prior investigations regarding the collaborative strategy in MGs [5,6] by evaluating the economic value of the COU strategy at the MG level. The main aim is to analyse the influence of managing the volatility of renewable sources on the levelized cost of electricity (LCOE) in grid-connected collaborative MGs. This has been implemented by considering the differences between, first, collaborative and selfish MGs; second, two backup generation options; and third, Heijunka and the planned volatility strategies.

1.1. Collaborative Versus Selfish MG

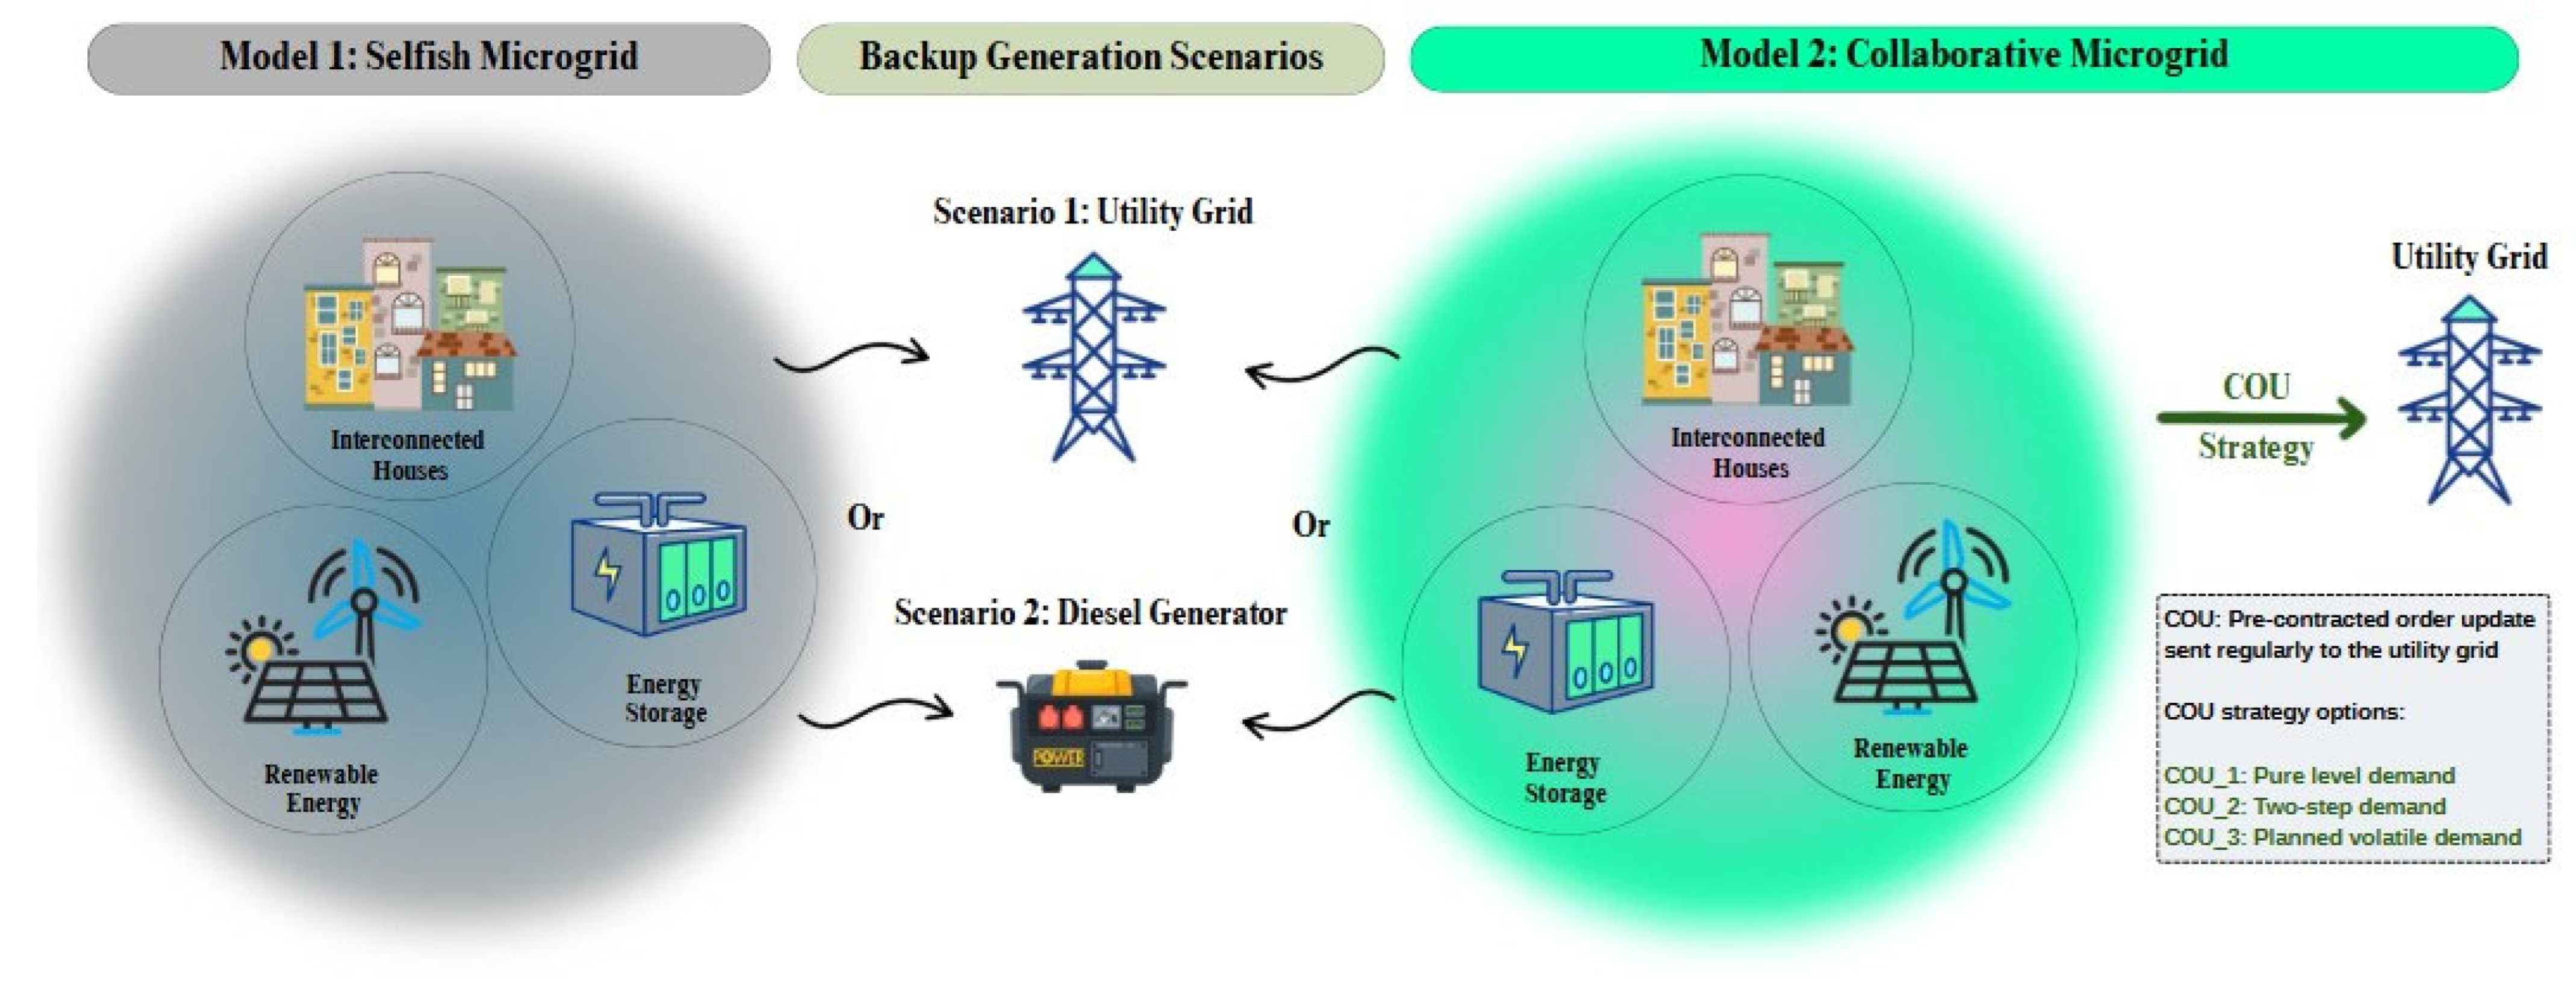
Figure 1 illustrates the collaborative MGs that apply the COU strategy, in contrast to selfish MGs that follow the traditional grid order update protocol and only place spot demand orders when necessary. In this paper, the two MG types have been simulated considering different backup generation scenarios.

1.2. Utility Grid Versus Diesel Generator as a Backup Generation Solution

The primary challenge posed by the sporadic nature of renewable sources outputs in the MG necessitates the establishment of backup generating capacity, prompting multiple researchers to explore various backup generation alternatives. This study assessed two backup generating alternatives, while having energy storage at the MG level when analysing the economic benefit of the COU method. Certain scholars utilized the utility grid as the exclusive backup generator for the MG system [7]. This strategy is self-serving, as it associates the MG’s demand from the utility grid with the variable outputs of renewable energy sources. Literature examples exist where the MG system prioritizes the utilization of diesel generators to attain MG independence from the utility grid [8,9]. In this case, the selfish nature of the MG is reinforced by seeking the lowest possible costs with a contradictory use of renewable energy and polluting backup sources and a desire to not interact with a utility grid in any way. Other researchers proposed an improved method by alternating the operation of the MG system between the diesel generator and the utility grid [10,11]. Another alternative strategy that is believed to be more environmentally friendly is using hydrogen as a green backup generation option [12]. However, using any of the mentioned backup generation options necessitates improved coordination to mitigate the adverse effects of volatility on the utility system.
This study examines the impact of employing the COU strategy in conjunction with two backup alternatives (the utility grid and the diesel generator) on the LCOE. Both backup generation options operate collaboratively with the COU strategy to mitigate order update volatility and avert system unloading. Despite its high carbon emission, this research investigated the diesel generator option, because it is one of the most popular distributed generation resources that can be used to enhance reliability of the MG system, since both solar photovoltaic cells and wind turbines are dependent on resources that are not available 24/7. By utilising diesel as a backup in the MG system, the orders to the utility grid are reduced to zero, which is regarded as a non-volatile order option for the grid, but also it is unloading the bigger system and significantly increases carbon emissions. This article compares collaborative versus selfish MGs reliant on diesel generators or the utility grid to illustrate the trade-off between LCOE and order volatility on one hand and carbon emissions on the other.

1.3. Heijunka Versus Planned Volatile Orders to the Utility Grid

Heijunka is a Japanese term denoting the levelling of production or the equitable distribution of volume [13]. Some researchers regard it as a fundamental principle of lean manufacturing, which focuses on assessing the value of each specific product in relation to customer needs and evenly distributing the production of various products over time [14]. Additionally, some depicted the Heijunka concept as the most efficient method for stabilizing inventory levels [15]. Nonetheless, the Heijunka concept has faced criticism from a few operations management scholars. Alvarez et al. [16] examined the effects of introducing Heijunka in a factory operating under a lean environment that encounters progressively unpredictable volatile demand. Their findings indicated that Heijunka is unsuitable for this factory, despite the effective implementation of other lean principles and technologies. Demonstrating that the successful implementation of Heijunka depends on factors such as demand prediction, product type, and production capacity. This article evaluates the efficacy of the pure Heijunka strategy as an operational method, considering that the fluctuating output of renewable energy sources renders the MG demand from the utility grid consistently volatile.
To investigate the impact of applying Heijunka in the operation strategy of the MG, this study examines three proposals for the COU strategy to identify the most effective option for implementation. All designs employ a pre-contracted grid order update as input, in conjunction with the actual supply from renewable sources and the demand to generate a stable uncontracted order update as output. The principal difference among these three options is in the value of the pre-contractual order update. In COU_1, an equal COU value was utilised for all hours within the analysed time horizon, determined by the average demand from the grid. COU_2 employs two-step COU values derived from the average of high and low demand. In COU_3, a pre-contracted grid order update is employed as input, informed by forecasts, actual supply from renewable sources, and demand, to yield a consistent uncontracted order update as output. The COU under this strategy is established by forecasting demand based on weather predictions and communicating those orders to the utility grid one week in advance. The first and second plans directly represent Heijunka (level demand), whereas the third plan suggests an enhanced application of Heijunka via what is referred to in this study as a planned volatile strategy. The challenge of managing the volatile demand is mostly rooted in the unpredictability of this volatility. Nevertheless, if the utility grid is aware of this volatility in advance, it could be efficiently managed.

1.4. Potential Impact of the COU Strategy on the LCOE

The COU strategy could have two major implications for energy costs, as shown in Figure 2. The first arises from the nature of orders; if the orders directed to the grid are unplanned (unpredictable) and highly volatile, the national grid can only accommodate that demand through responsive yet unsustainable sources, such as natural gas, which escalates power prices, and vice versa if the orders to the grid have planned (predicted) volatility, it could be handled by the grid utilising less responsive but more sustainable sources, such as nuclear power. The second implication relates to the feed-in tariff (FiT) price for the exported electricity. If there is surplus green electricity exceeding the storage capacity, the MG will export that power to the grid at the FiT price. This may serve as an incentive by elevating the FiT price for the collaborative MG above that of the selfish MG [7].
The cost models of the energy consumed in the collaborative and selfish MGs, considering two backup generation scenarios, are first carried out in the method section. Followed by the analysis and discussion of the results.

2. Method

2.1. Models and Scenarios Description

A mathematical model was developed to investigate the LCOE consumed in several scenarios, illustrating the cost of potential electricity flows in each case. The carbon emissions, volatility of orders to the utility grid, and the LCOE were examined for each model scenario.
This paper’s models are based on a hypothetical case study of a UK-based MG. The case study is organized as outlined in [5,6] and focuses on an MG (illustrated in Figure 3) that has 70 connected houses and uses 2800 kWh of energy per day. It consists of 380 solar panels, each having a maximum output of 320 W and a nominal efficiency of 21%, and one turbine with a maximum output of 450 kW. Additionally, a 1500 kWh energy storage system with efficiency 95% is integrated in to handle any excess power generated by renewable energy. As shown in Figure 3, two backup generation scenarios were examined for both MG types. Having the utility grid act as a backup generator if renewable output is insufficient is the first backup generation scenario. The diesel generator serves as a backup in the second backup generation scenario. For the collaborative MG, three different COU plans were investigated.
In the selfish MG model, it is assumed that the MG system functions by charging the battery storage solely by photovoltaic and wind turbine sources, dependent on the availability of surplus power that exceeds demand yet remains within storage capacity limits. When the electricity provided by photovoltaic and wind turbine sources is insufficient to meet load demand, the battery system will deplete. When renewable sources generate insufficient power and the battery system lacks adequate stored energy to meet demand, a diesel generator or the utility grid is employed to fulfil the load demand according to the backup generation scenario.
In the collaborative MG model, rather than solely depending on backup generation to mitigate renewable intermittency, the MG procures a supply from the utility grid one week in advance (COU), informed by weather forecasts, anticipated renewable outputs, and potential demand from the utility grid. Regularly transmitting forward order updates to the utility grid. Three distinct plans for the purchased COU were studied, as outlined in Section 1.3, to ascertain the optimal plan that enables the collaborative model to attain superior performance. In contrast, the selfish MG depends exclusively on dispatching spot orders to the backup generation option available. Thus, the collaborative MG employing the COU strategy mitigates unplanned orders directed to the utilised backup generating solution (including the utility grid), thereby enhancing the management of these orders effectively.

2.2. Cost Flows in the Studied Backup Generation Scenarios

2.2.1. Scenario 1: Utility Grid-Dependent MG

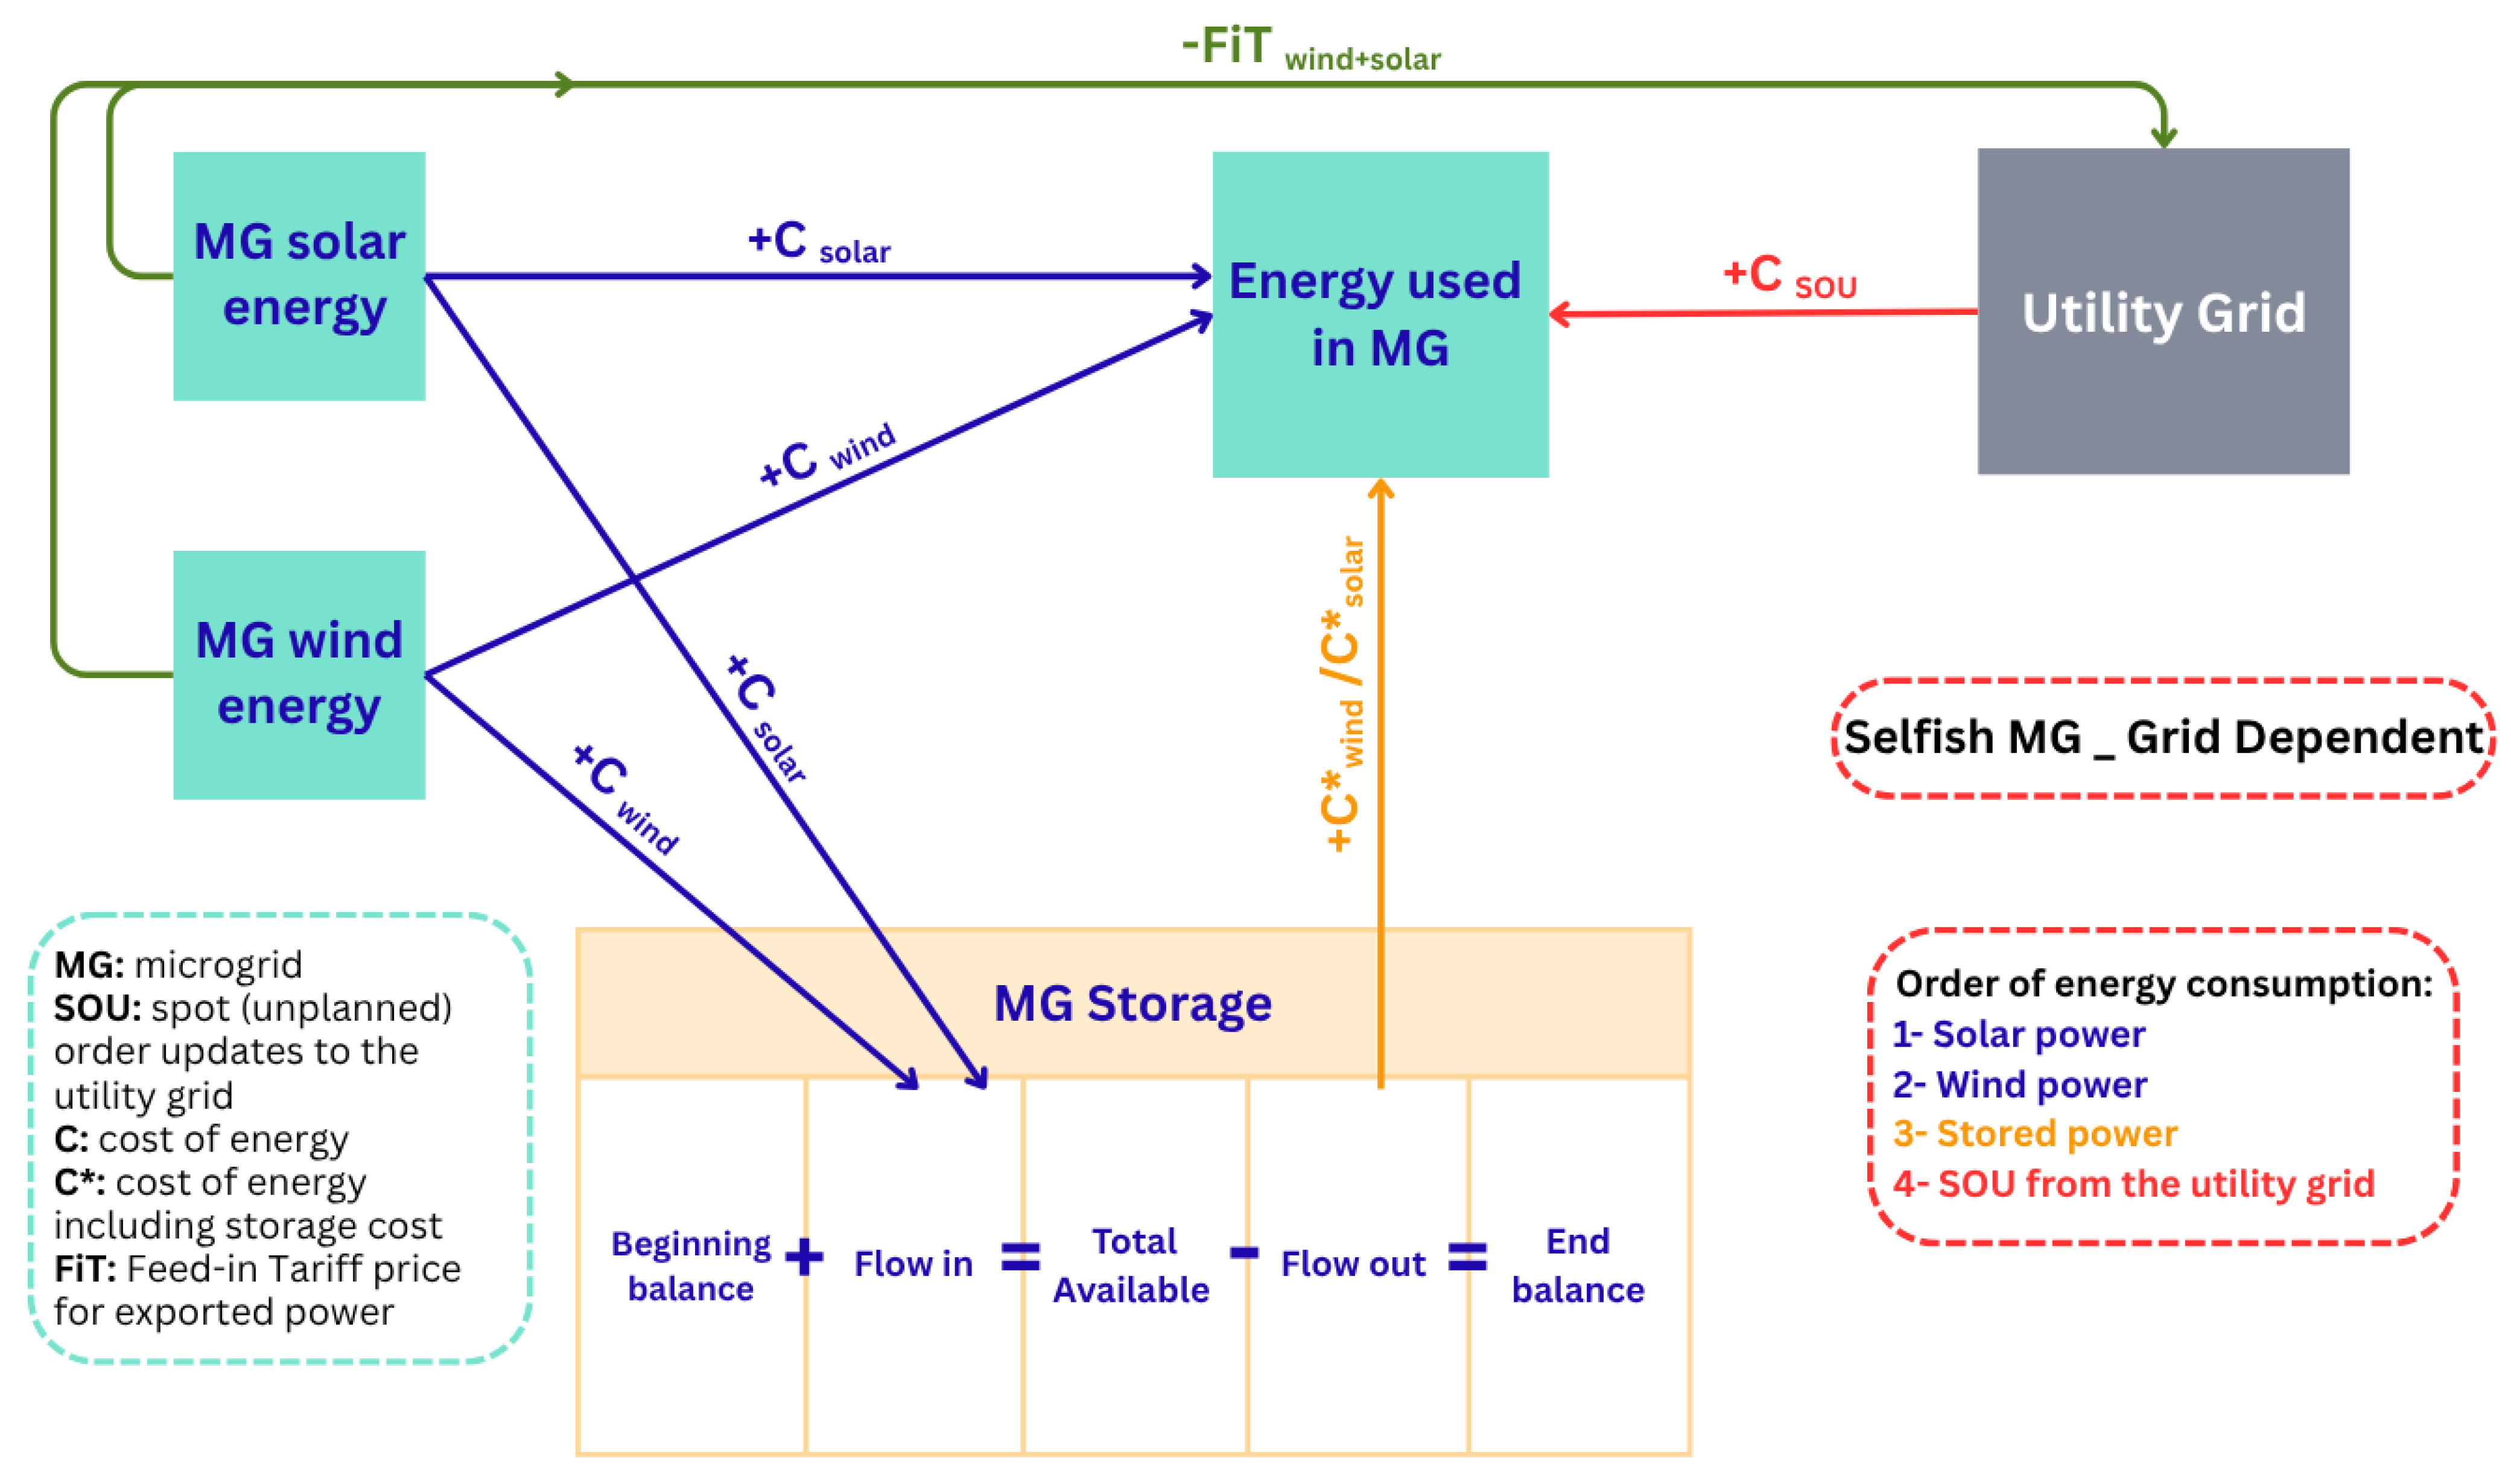
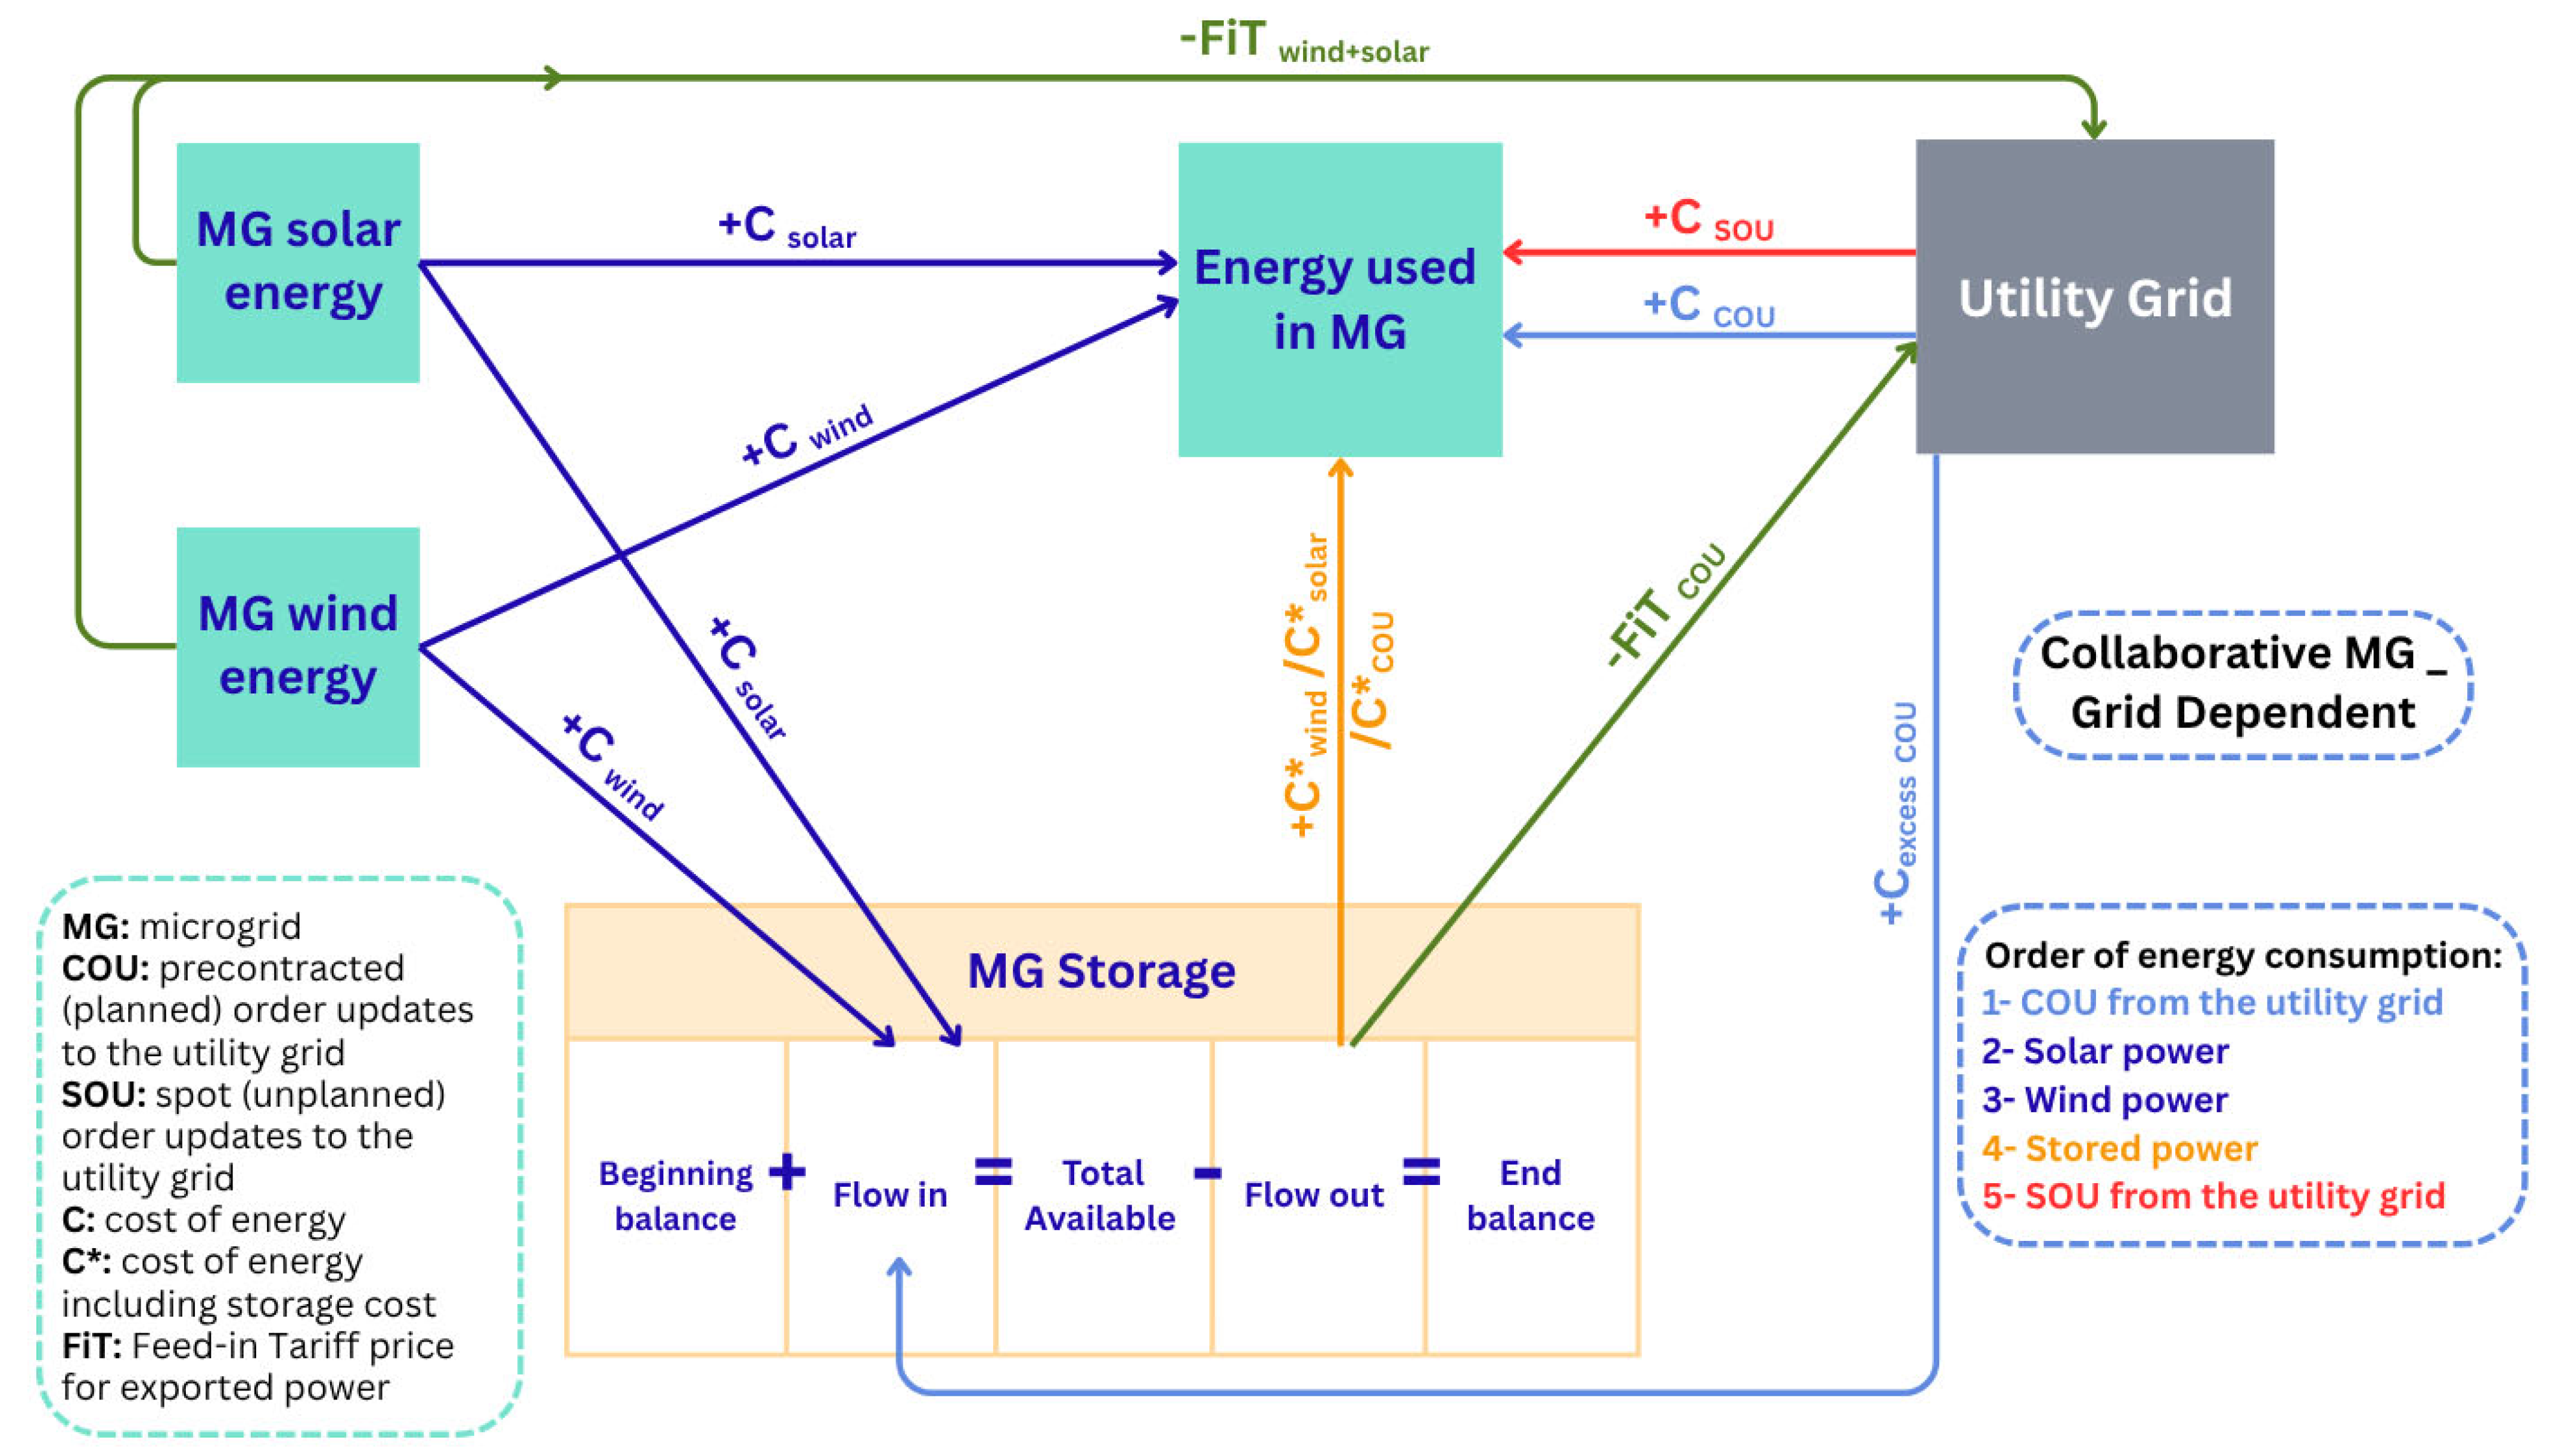
This study examined energy flows on an hourly basis depending on the type of MG (selfish or collaborative). Consequently, the linkages depicted in Figure 4; Figure 5 demonstrate the cost flows in selfish and collaborative MG models, respectively, when the utility grid serves as the backup generation scenario.
Figure 4 illustrates model 1 (selfish MG) for scenario 1 (the utility grid-dependent MG), assuming that the selfish MG utilises the utility grid solely as a backup generation source. In this scenario, the selfish MG consumes electricity only during shortages of renewable energy outputs and the stored energy at the MG level. When excess energy exceeds storage capacity, the MG exports this surplus to the utility grid. Figure 5 presents model 2 (collaborative MG), focusing on scenario 1 (the utility grid-dependent MG), where the collaborative MG depends on the utility grid for backup generation alongside the utility supply previously committed through the COU strategy. The COU supply is prioritized for use before the renewable energy available in the system, and in the event of a shortage, the MG acquires extra supply from the grid referred to in this paper as spot (unplanned) order update (SOU). The excess COU supply is retained in the storage system, while any renewable energy surpassing the storage capacity is exported to the utility grid.

2.2.2. Scenario 2: Diesel Generator-Dependent MG

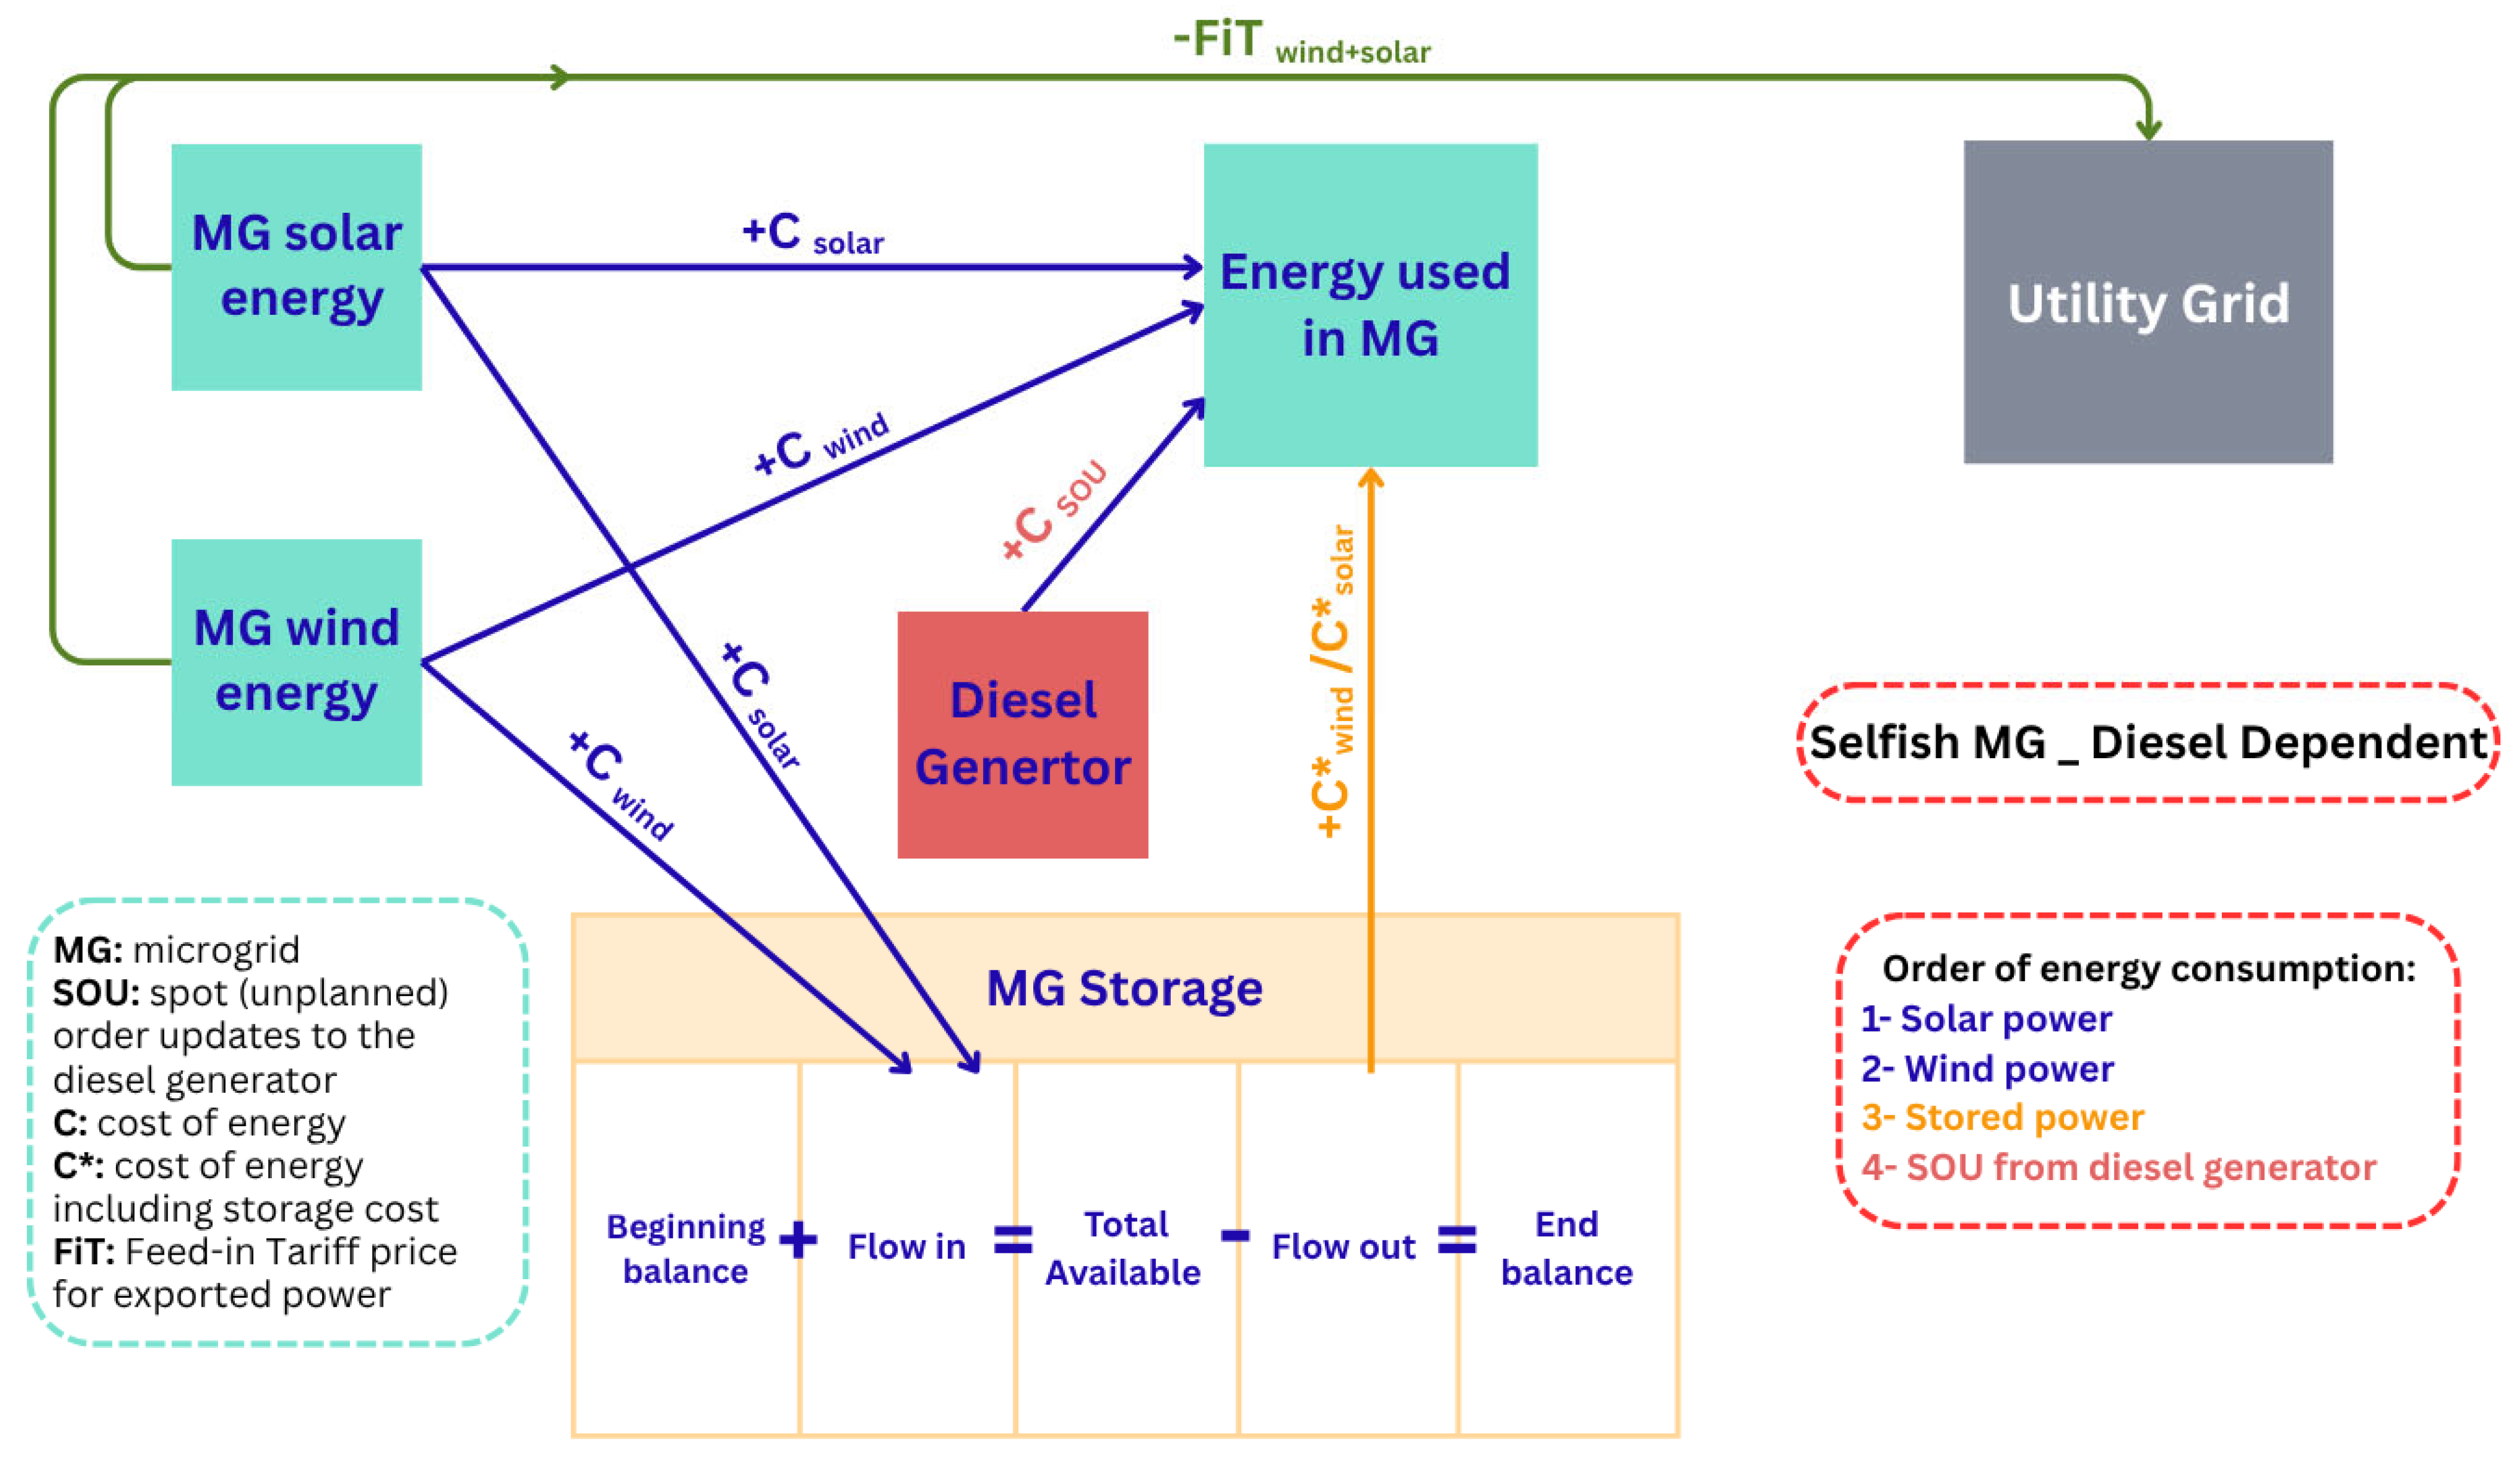
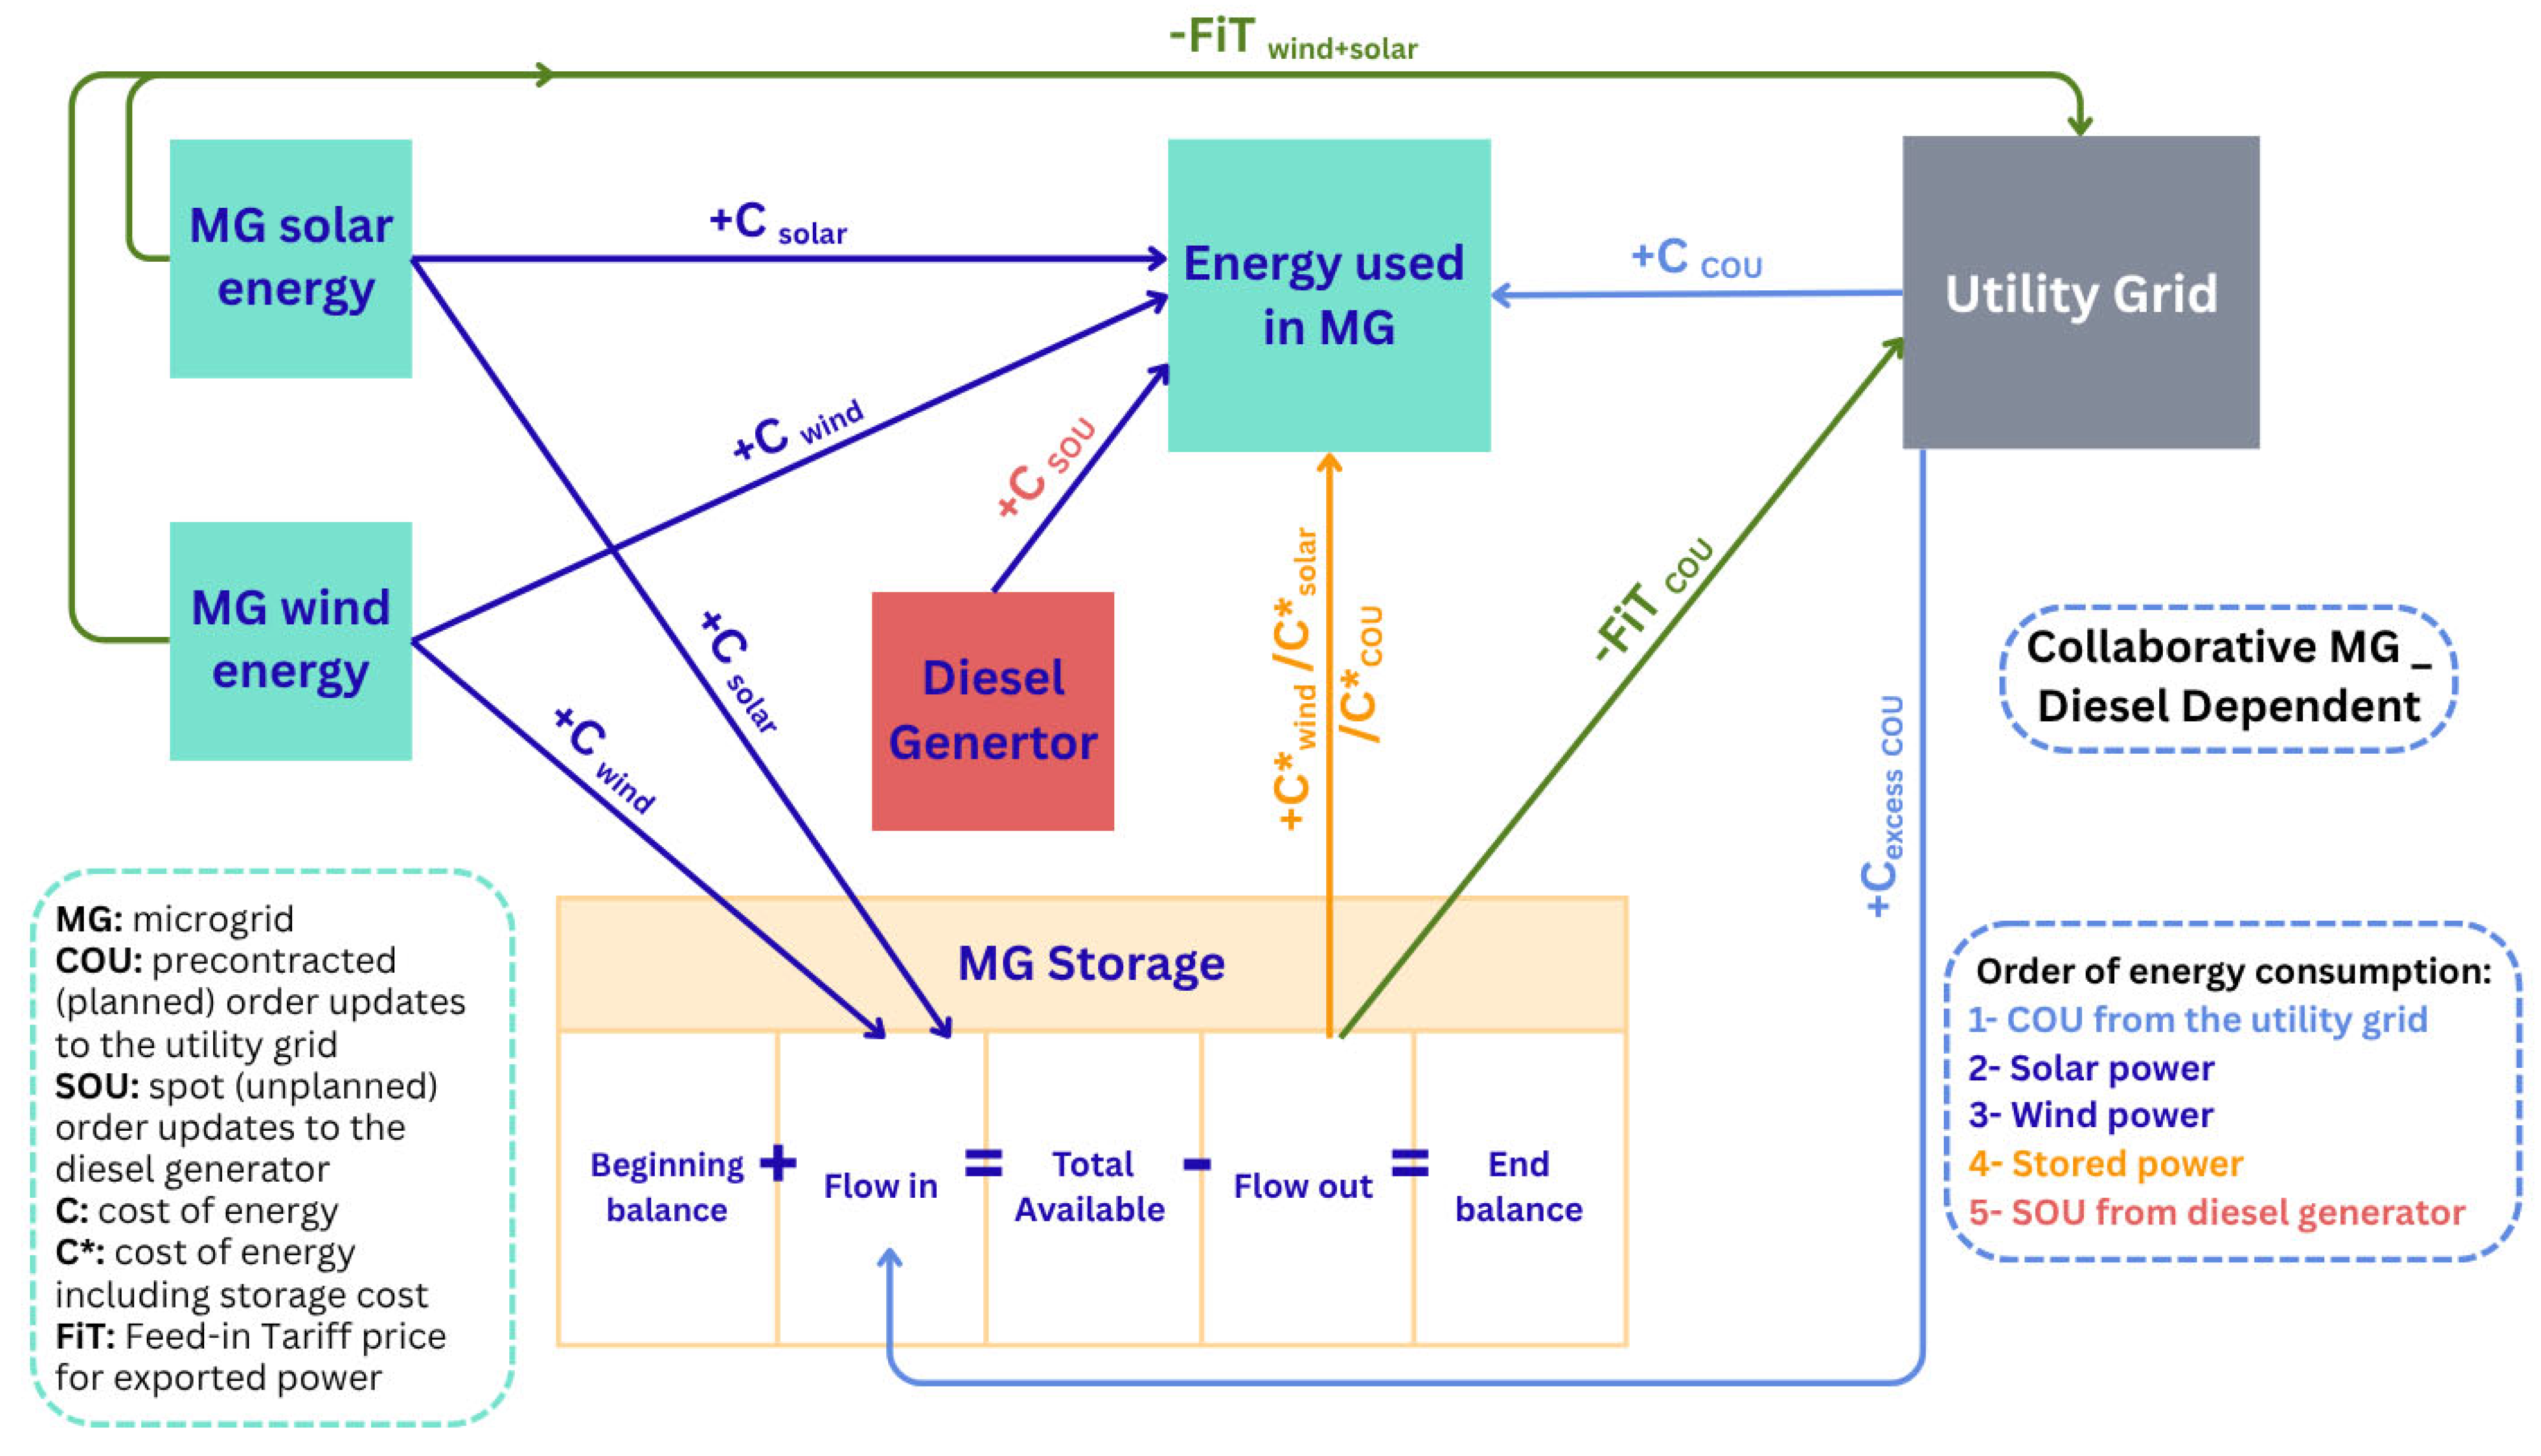
Figure 6 and Figure 7 depict the cost flows in selfish and collaborative MG models, respectively, under the scenario of utilizing a diesel generator as backup generation. Figure 6 illustrates the selfish MG design that relies on a diesel generator as the backup power source. In this situation, the selfish MG is seen as an isolated MG that depends on a diesel generator during shortages of stored renewable energy, while exporting surplus electricity to the utility grid. Figure 7 illustrates the collaborative MG model that relies on a diesel generator as a backup, supplemented by the COU from the utility grid during periods of insufficient renewable output. The COU supply is utilized first, followed by power from renewable sources, then stored energy, and finally, the diesel generator backup. In case of having renewables surplus that exceeded the storage capacity, the MG exports excess electricity to the utility grid.

2.3. Cost Model for the Power Consumed in the MG Systems

The levelized cost of energy (LCOE) metric is universally accepted as a tool for economic evaluations of generation technologies [17]. To determine the most economic MG model in this study, the LCOE in GBP/kWh is taken as the key parameters of interest. This research evaluates and compares six collaborative MG models with baseline cases (selfish MGs—one reliant on utility grid, and the other where the backup power is provided by a diesel generator) to ascertain the best cost-effective model. The LCOE in the MG is determined based on the cost of total energy consumed in the MG, the revenue from energy exported to the utility grid, and the total energy consumed in the MG, as illustrated in Equation (1), as follows:
L C O E M G = C M G P E e x p E M G
where L C O E M G is the levelized cost of energy consumed in the MG in GBP/kWh, C M G is the cost of total energy consumed in the MG in GBP, P E e x p is the price of the total exported power from the MG to the utility grid in GBP, and E M G is the total energy consumption in kW.
To model the cost in this paper, first the power consumption from each power source at each hour of the simulated period was calculated based on the flows described in Section 2.2, in Figure 4, Figure 5, Figure 6 and Figure 7 according to the used MG model and the backup generation scenario. Then the unit cost for each power source was estimated based on the literature as represented in Table 1. The cost of energy consumed in the MG was determined by aggregating the costs of energy used from each power source throughout the simulation period, as illustrated in Equation (2):
C M G = i 5 t = 1 N E i t c i
where C M G is the total cost of energy consumed from different sources in the MG in GBP, N is the number of hours for the simulated period, E i (t) is the energy consumed from each energy sources at each hour (i = 1 for utility grid energy (COU), i = 2 for solar, i = 3 for wind, i = 4 for energy from storage, i = 5 for SOU power from backup generation (diesel generator or utility grid)) in kWh, and c i is the unit cost of each energy source in GBP/kWh.

2.3.1. Modelling the Energy Consumed in the MG

  • Power consumed from utility grid as COU
As seen in Figure 5 and Figure 7, the collaborative MGs commit to purchase the COU from the utility grid, and they consumed this energy as the first priority. For the selfish MG model in Figure 4 and Figure 6, E C O U t = 0. The power consumed from the utility grid as COU is represented by Equation (3), as follows:
E C O U t =                                                                                       P C O U t                                         if                                             D t > P C O U t             D ( t )                                               if                                           D t < P C O U t    
where E C O U t is the power consumed from the utility grid at the MG level as COU in kWh, P C O U t is the power purchased from the grid in kWh, and D(t) is the demand at the MG level.
2.
Power consumed from solar
As seen in Figure 4 and Figure 6, the selfish MGs consume the power from the solar output first then the power from wind where P C O U   = 0. For the collaborative MG model (Figure 5 and Figure 7), the MG consumes power from solar after the purchased power from grid P C O U then the wind power. The power consumed from the solar is calculated according to Equation (4), as follows:
E p v t =                                                                                       P p v t                                           if                                                                             D t P C O U t > P p v t     D t P C O U t                                         if                                                 D t P C O U t < P p v t 0                                                                                                           if                                                               D t < P C O U t    
where E p v t is the power consumed from the solar output at the MG level, and P p v t is the solar power output, both in kWh.
3.
Power consumed from wind
The power consumed from the wind at time t is calculated according to Equation (5), as follows:
E w t =                                                                                       P w t                                                     if                                                                                   D t P C O U t   P p v t > P w t     D t P C O U t P p v t                       if                                                 D t P C O U t P p v t < P w t 0                                                                                                                       if                                                               D t < P C O U t + P p v t    
where E w t is the power consumed from the wind output at the MG level, and P w t is the wind output, both in kWh.
4.
Power consumed from storage
The power consumed from the storage at time t is calculated shown in Equation (6), as follows:
E s t t =                                                                                       P s t t                                                                                                                                                     if                                                   D t E C O U t   E p v t E w t > P s t t D t E C O U t   E p v t E w t                                                       if                                                 D t E C O U t   E p v t E w t < P s t t 0                                                                                                                                                                     if                                                                         D t < E C O U t   + E p v t + E w t    
where E s t t is the power consumed from the storage at the MG level in kWh, and P s t t is the power available in the storage.
5.
Power consumed from backup generation options
The volatility of the utility power order or the energy supply by a diesel generator could be adjusted through its operation management, affecting the quantity and pace of consumption of power provided by renewables sources, storage, diesel generator, and/or the utility grid (Equation (7)).
E S O U t =                                                                                       D t E C O U t   E p v t E w t P s t t E s t t       if           E C O U t   E p v t E w t P s t t E s t t < D t 0                                                                                                                                                                                 if             E C O U t   E p v t E w t P s t t E s t t > D t
where E S O U t is the power supply (spot order update) from the backup option (utility grid or diesel) in kWh.
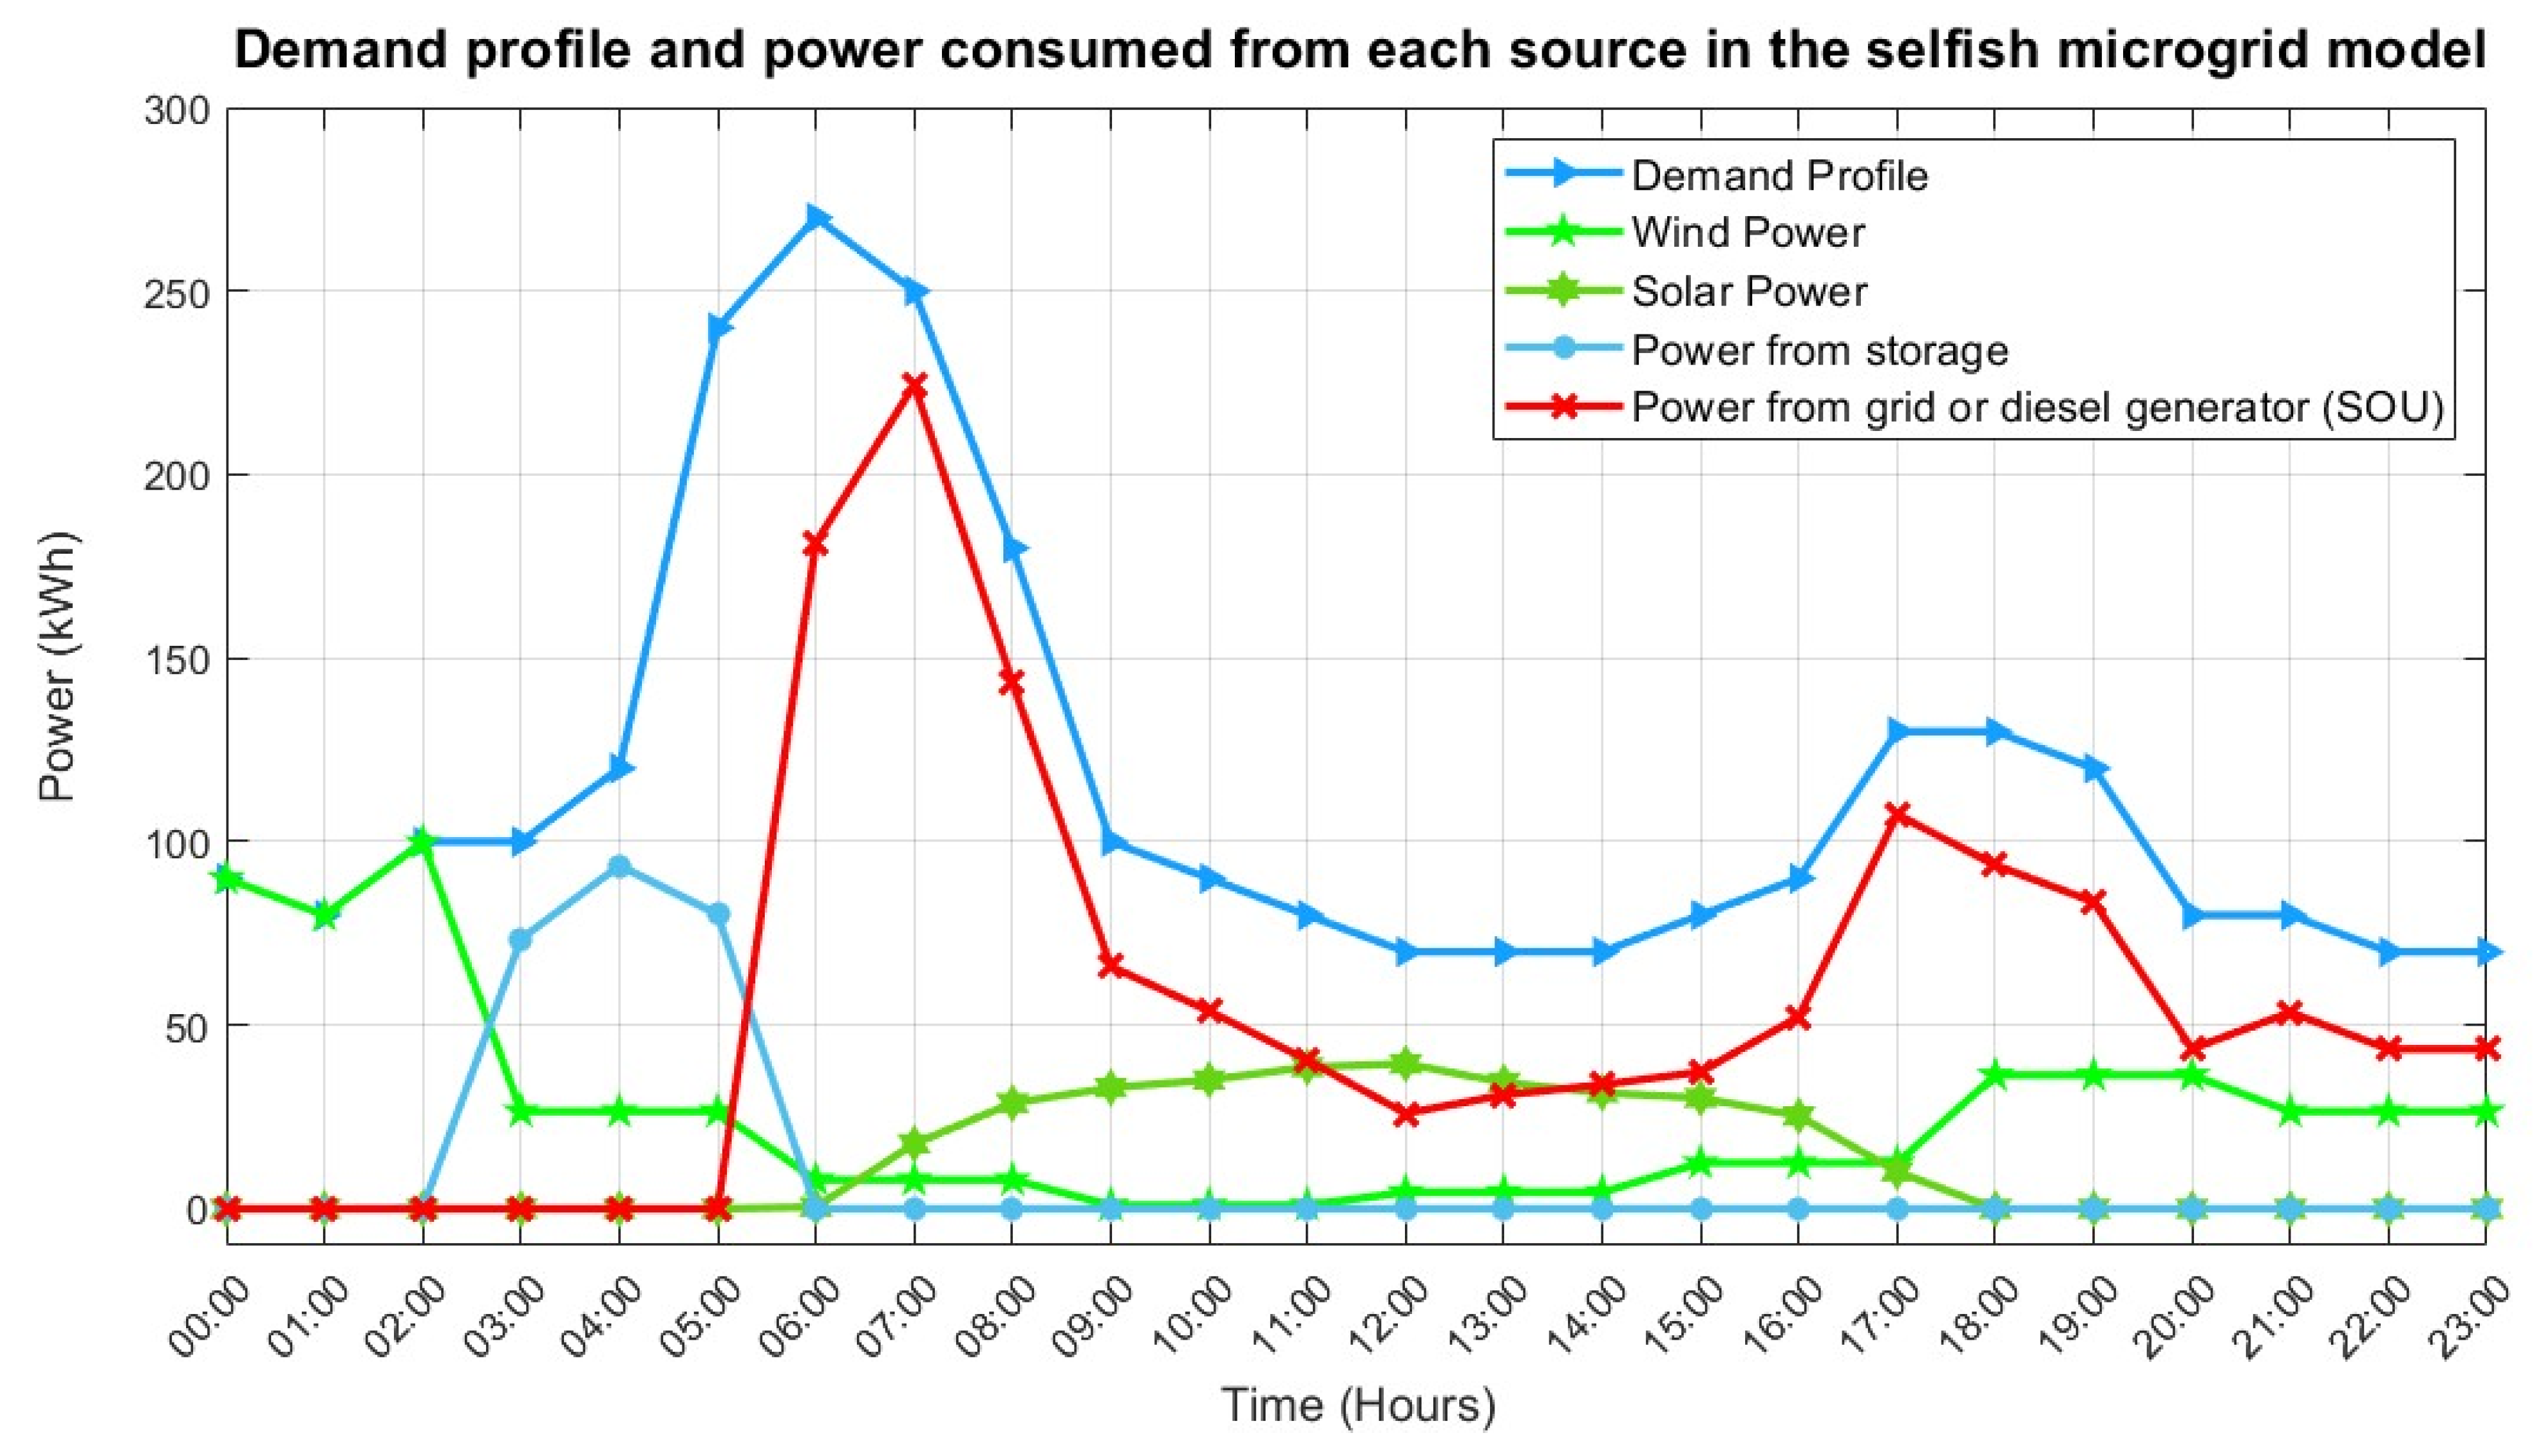
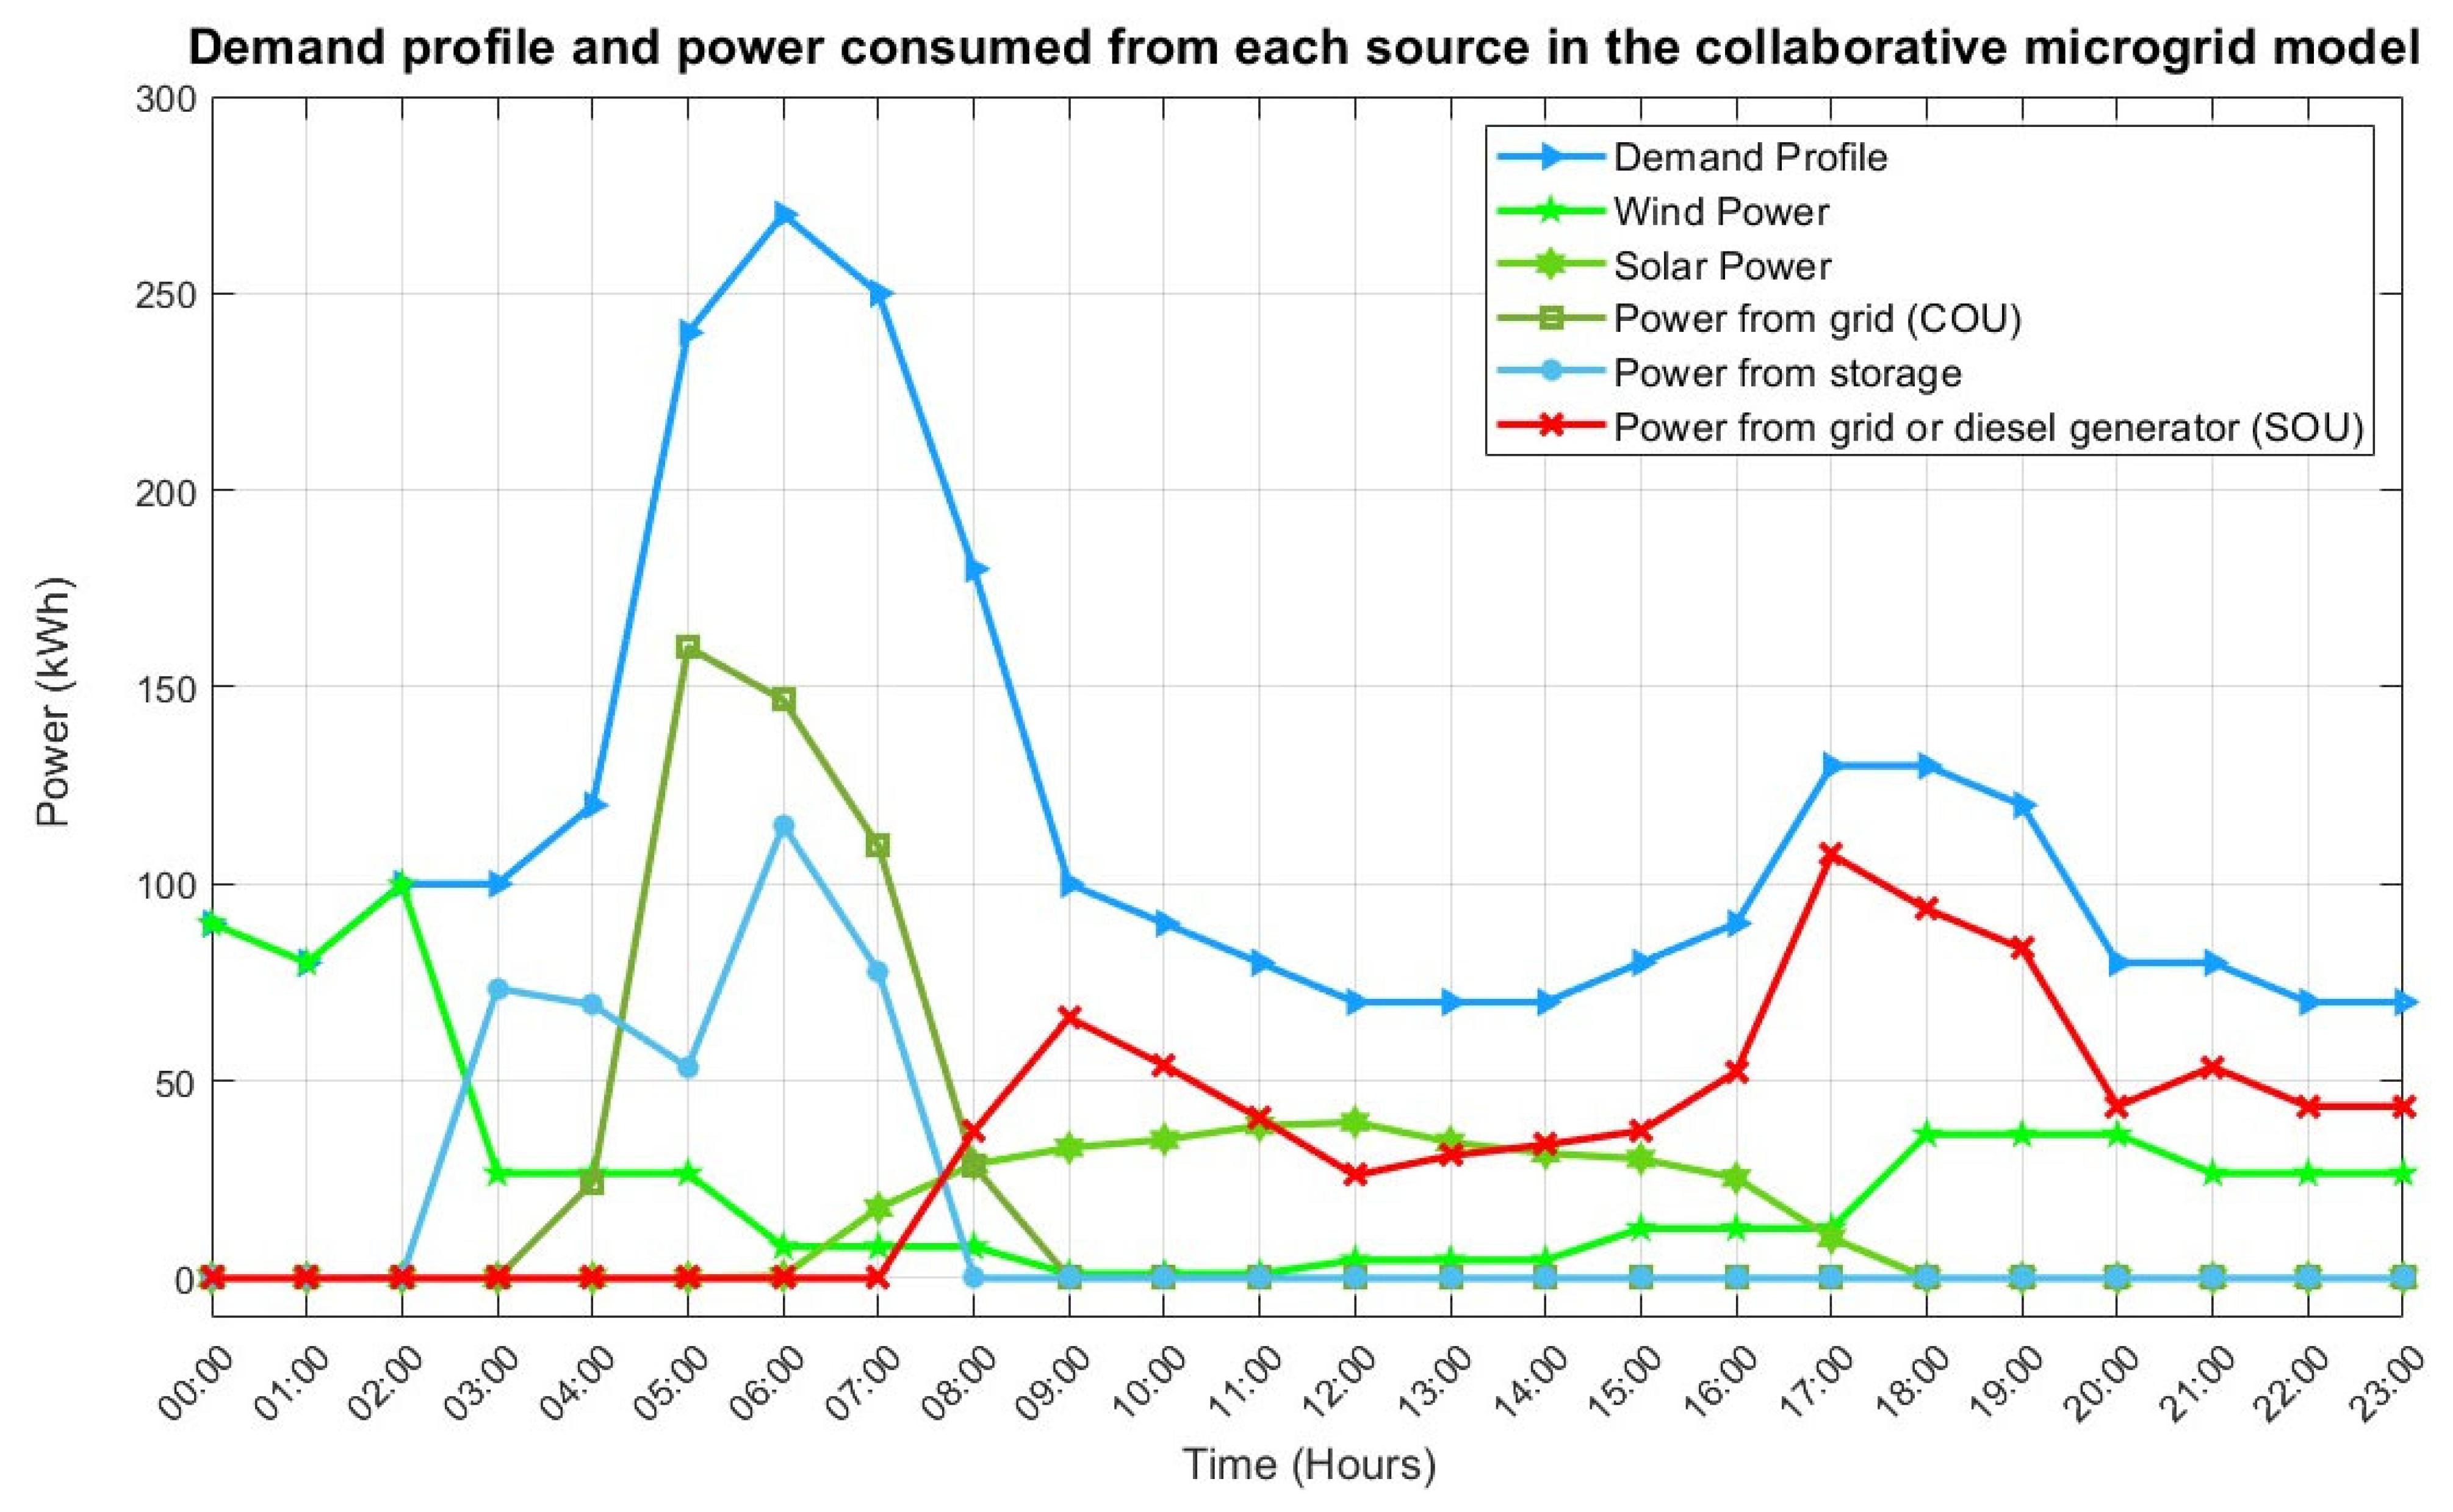
The design methodology in this study aimed to ensure that the average power supply would meet the daily consumption of the interconnected residences, amounting to 2800 kWh/day. Figure 8 and Figure 9 depict the hourly average demand for a single day (26 March 2024) in comparison to the electricity consumed from renewable sources, storage, and the backup option in the selfish and collaborative MG models, respectively. The sole distinction between the two figures lies in the power consumed from the purchased COU in the collaborative MG, where the shortage in renewable power supply is primarily covered by this COU in the collaborative MG. Conversely, the selfish MG mostly relies only on the spot order updates provided to the utility grid or the diesel generator to mitigate this shortage.

2.3.2. The Unit Cost for Each Power Source

The LCOE is a metric employed to assess the cost per kilowatt-hour of energy generated by a specific power plant. The upfront investment, annual operational, and maintenance expenses, along with the annual energy output, are essential statistics required to calculate the LCOE.
In this study, to obtain the LCOE in the investigated MG models, the unit cost for the different technologies used as power sources were extrapolated from the literature and the UK statistics for the residential installations, as presented in Table 1. Based on utilising the installation capacities referenced in Table 1 and the capacities of solar systems, wind turbines, diesel engines, and storage employed in this paper, the unit costs for each technology were determined.
The literature has a lot of studies that prove the correlation between the installation capacity of a certain technology and its unit cost. Veronese et al. [18] implemented a novel methodology for the anticipated Italian energy system and photovoltaic industry projected for the year 2030. They determined a low LCOE for utility-scale PV systems, both with and without storage solutions, while accounting for the volatility of renewable energy sources penetration. On the other hand, a different study [19] on an isolated MG with a solar capacity of 1000 kW, wind capacity of 414 kW, and 6760 kWh storage capacity revealed that the unit cost of the aforementioned technologies significantly exceeds that of the utility-scale installations referenced in [18]. Other researchers introduced an innovative cost evaluation metric termed levelized full system cost, which assesses the expenses associated with servicing the entire market utilizing a single renewable source in conjunction with storage [20]. This methodology resulted in significantly elevated unit costs for solar and wind technologies compared to the previously referenced studies. The above studies demonstrate that, with large renewable energy installations, the cost of electricity typically declines. Large renewable energy initiatives benefit from economies of scale. As the project scale expands, the cost per unit of energy generated tends to decrease. This is due to the ability to distribute fixed costs and infrastructure expenditures across a larger output. Therefore, for residential MGs, which is the case of this study, the cost for energy from renewables is more than that from the utility scale installations [21,22].
The expense of power generated by diesel generators in MGs in the UK can fluctuate considerably; however, it is often more expensive than grid-supplied electricity. Elements including fuel prices, generator efficiency, and maintenance expenses contribute to costs, which range from 20 to 40 p per kWh [19,23], or perhaps higher, contingent upon the specific circumstances.
The literature provided a diverse array of unit costs for each technology; therefore, this article extrapolated the unit costs depending on the utilized capacity, considering either the literature or the UK statistics. For example, the unit cost of stored energy was considered to be 0.20, given that the unit cost of residential battery storage in the UK is approximately 0.20 [21]. While the assumed unit costs for the used technologies are anticipated to be realistic, the primary emphasis is on the magnitude of these numbers rather than the precise unit cost for each technology. As the same unit costs are considered for the technologies used in both MG models, the differences between the total LCOE for the studied models is the focus of this study rather than the exact unit cost.
Table 1. Unit cost of the utilised energy sources within the MG based on the installation capacity.
Power SourceStudy Ref.Unit Cost in Literature (GBP/kWh)Installation Capacity (kW)Unit Cost in This Study (GBP/kWh)
Solar[18]0.02Utility scale PV0.09
[22]0.09Residential
[20]0.30__
Wind[24]0.02715000.06
[19]0.06414
[20]0.21__
Storage[18]0.023Utility scale0.20
[21]0.20Residential
Power from grid[25,26]0.26__0.27
[27]0.27__
Diesel generator[19]0.195360.40
[23]0.4015

2.3.3. The Exported Power from the Microgrid to the Utility Grid

Since the modelled MGs rely on renewable sources, there are instances where the output from renewables surpasses the demand. The surplus power is regarded as a source of revenue when transmitted to the utility grid. The FiT scheme in the UK, which compensated for electricity generated and exported to the grid, concluded in April 2019 and was succeeded by the Smart Export Guarantee (SEG) on 1 January 2020. The SEG is an initiative in which energy companies provide prices to compensate for surplus renewable electricity produced by residential properties. Whereas FiTs had predetermined rates, SEG prices are determined by individual energy suppliers and may fluctuate based on the supplier and the time of day. Originally, power exported from MGs benefited from generous FiTs; however, the current SEG tariffs are gradually reducing, potentially serving as a deterrent. The rationale for this is that the renewable technologies covered by the scheme have become more affordable and thus more accessible. The SEG tariff provides a flat rate of 4.1p/kWh for each unit of exported electricity [28]. Various export prices are available to accommodate the diverse requirements of customers; in certain instances, this tariff may reach 0.0739 [29] or even exceed 0.151 [27].
The exported tariff in this paper is considered as the flat rate of 0.041 GBP/kWh [28], and the price of the exported power was calculated as shown in Equation (8):
P E e x p = t = 1 t = N E e x p t P F i T
where P E e x p is the total price of exported energy to the utility grid in GBP, E e x p (t) is the exported energy to utility grid at each hour in kWh, and P F i T is the price of the feed-in tariff in GBP/kWh.

3. Results

3.1. Models’ Parameters

The results in this section are based on all the model parameters defined in [6], with MG parameters displayed in Table 2. The storage capacity of 1500 kWh is established based on the maximum quantity of excess power produced hourly during the 90-day period (starting from 22nd of March to 21st of June).

3.2. LCOE Consumed in Collaborative and Selfish MG Models

Table 3 illustrates the LCOE consumed in both MG models and its backup scenarios, which was obtained through the equations in Section 2.3. The supply carbon content and the unplanned volatility of orders to the backup generation option were obtained from the results for the models that depend on the utility grid and the diesel generator as backup generation in [6]. In case of using the diesel as backup generation, the spot order to the grid becomes zero. However, all the models using the diesel scenario have a significant amount of supply carbon content.
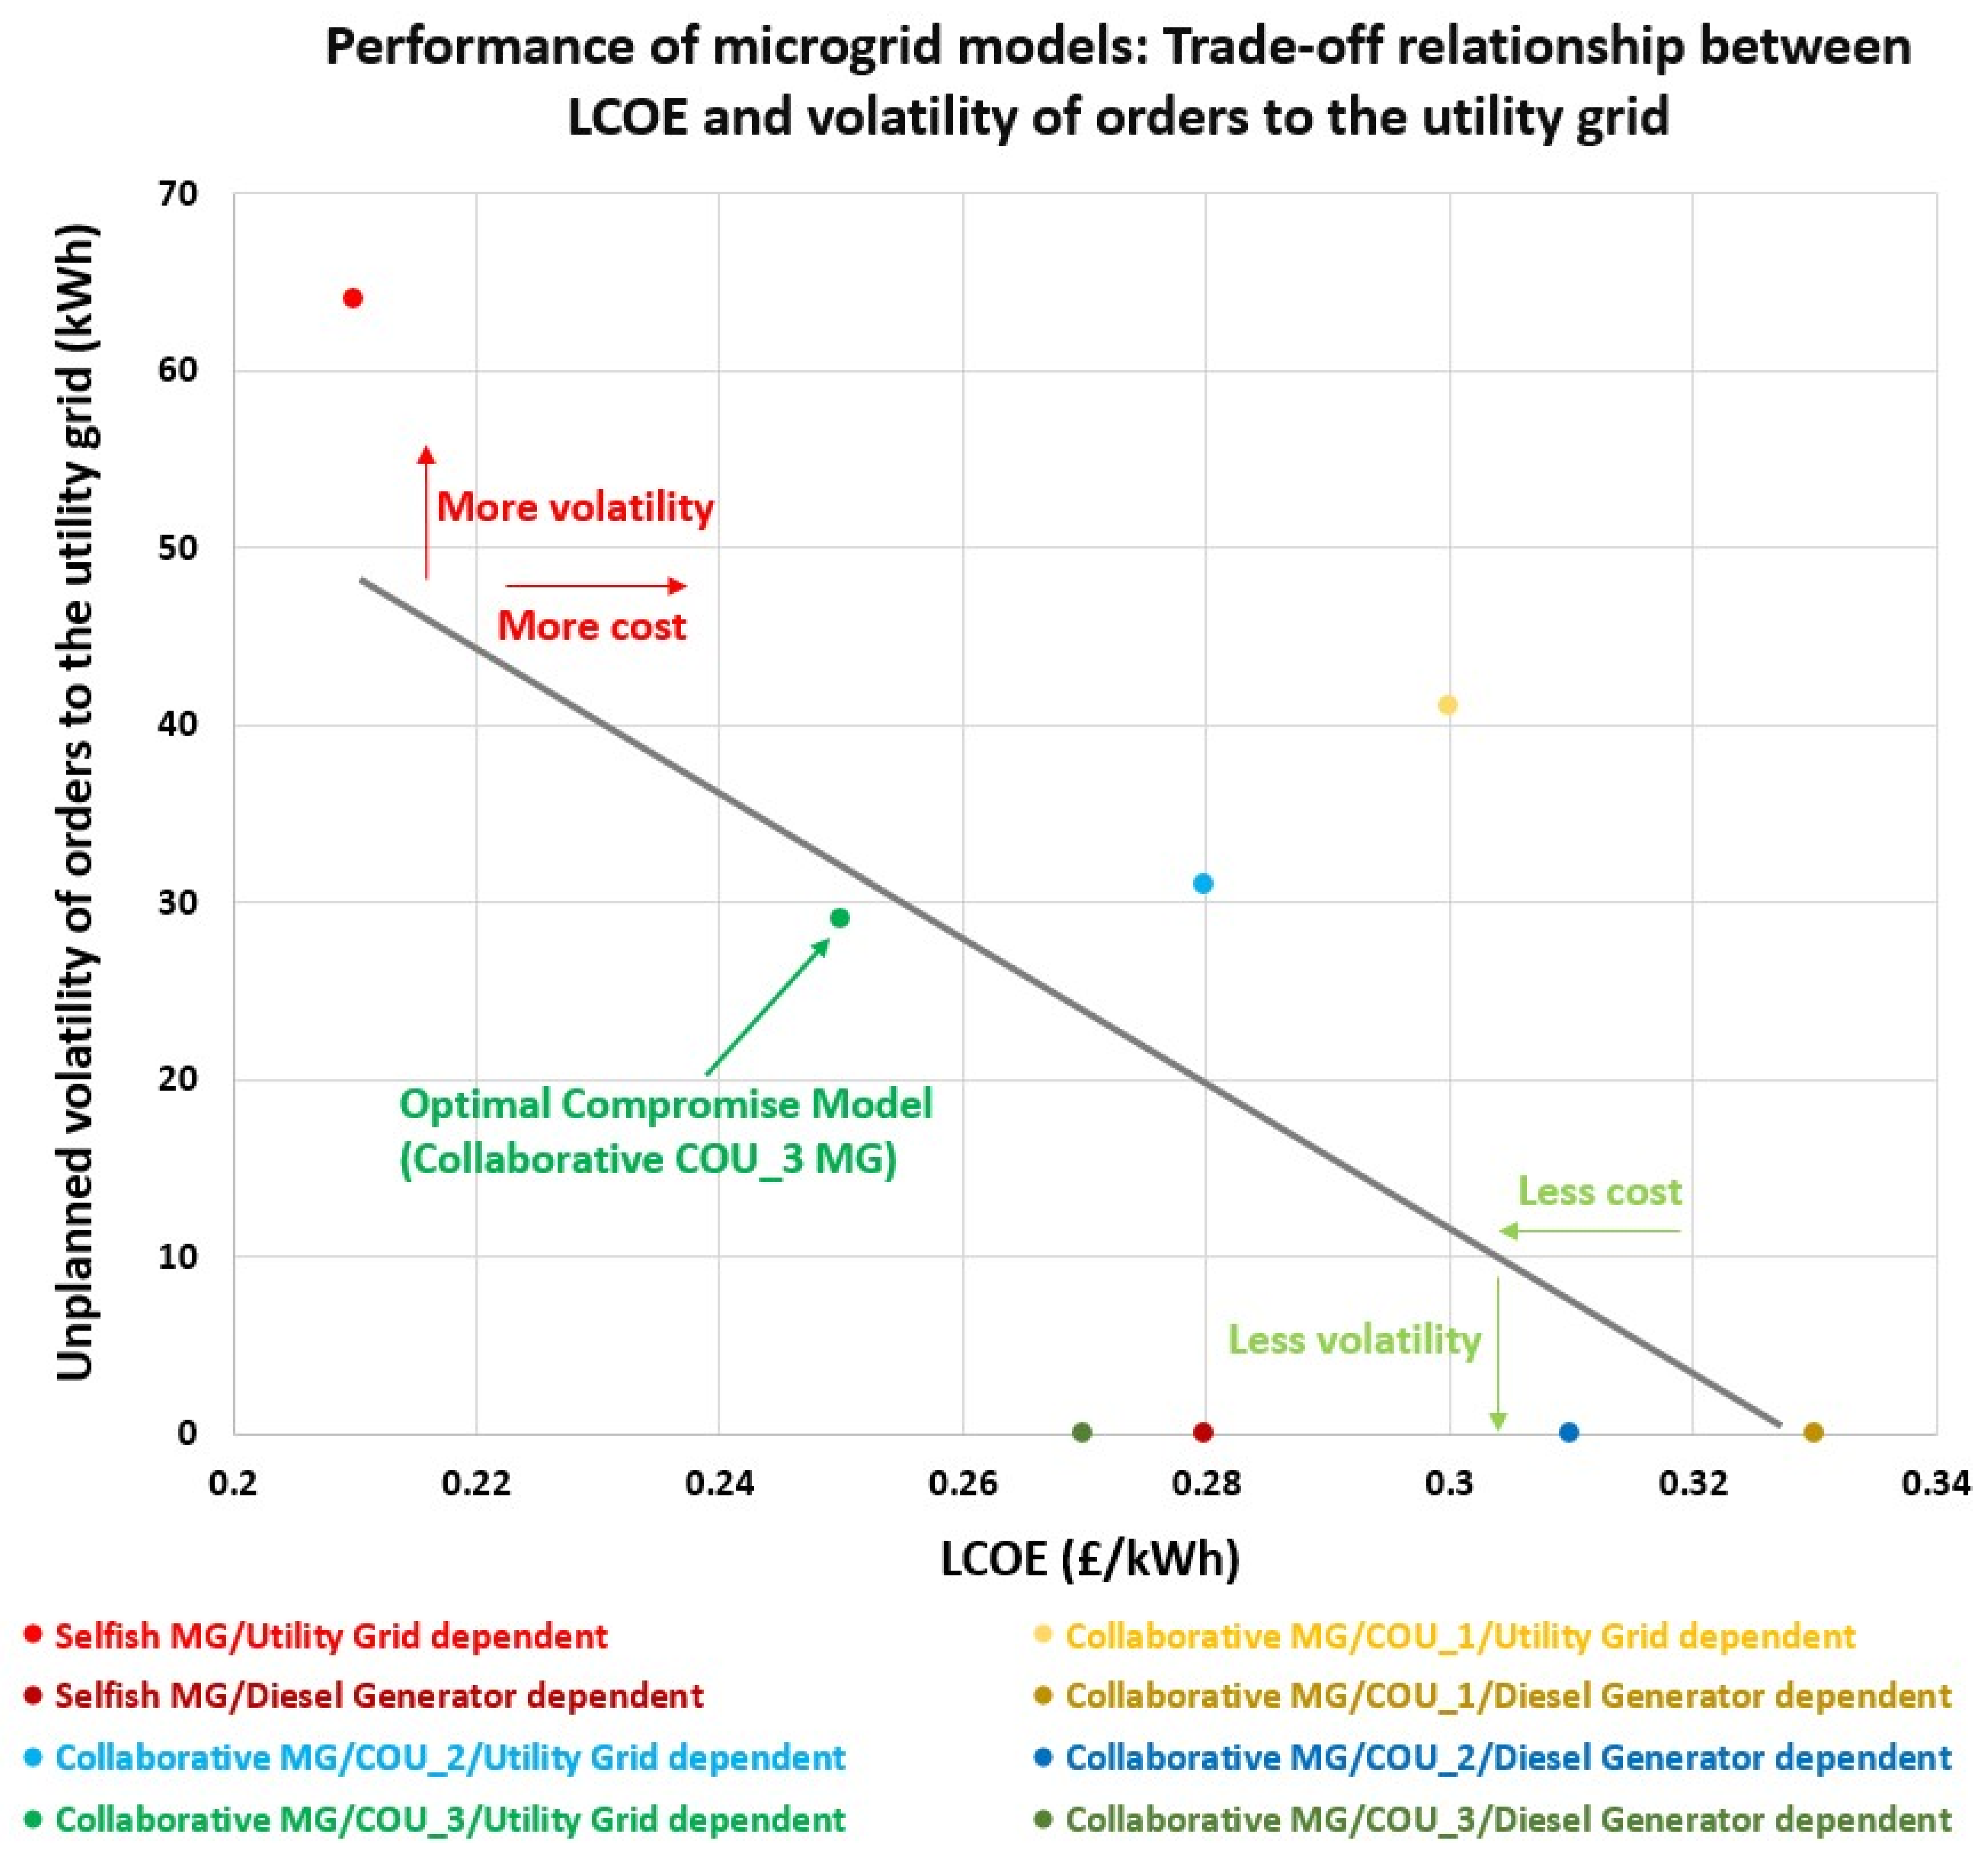
All the collaborative models have reduced by around 50% the spot orders to the backup generation option compared to the selfish models. The selfish MG model that uses the utility grid as backup scenario has the lower LCOE of only 0.21 GBP/kWh; nevertheless, it has the most spot orders to the grid with a significant amount of supply carbon content. The best compromise model (highlighted in green in Table 3) that has fewer spot orders and supply carbon content with a slightly higher LCOE of only 0.25 GBP/kWh is the collaborative MG (using COU_3) that depends on the utility grid for backup generation.

3.3. MG Models Performance

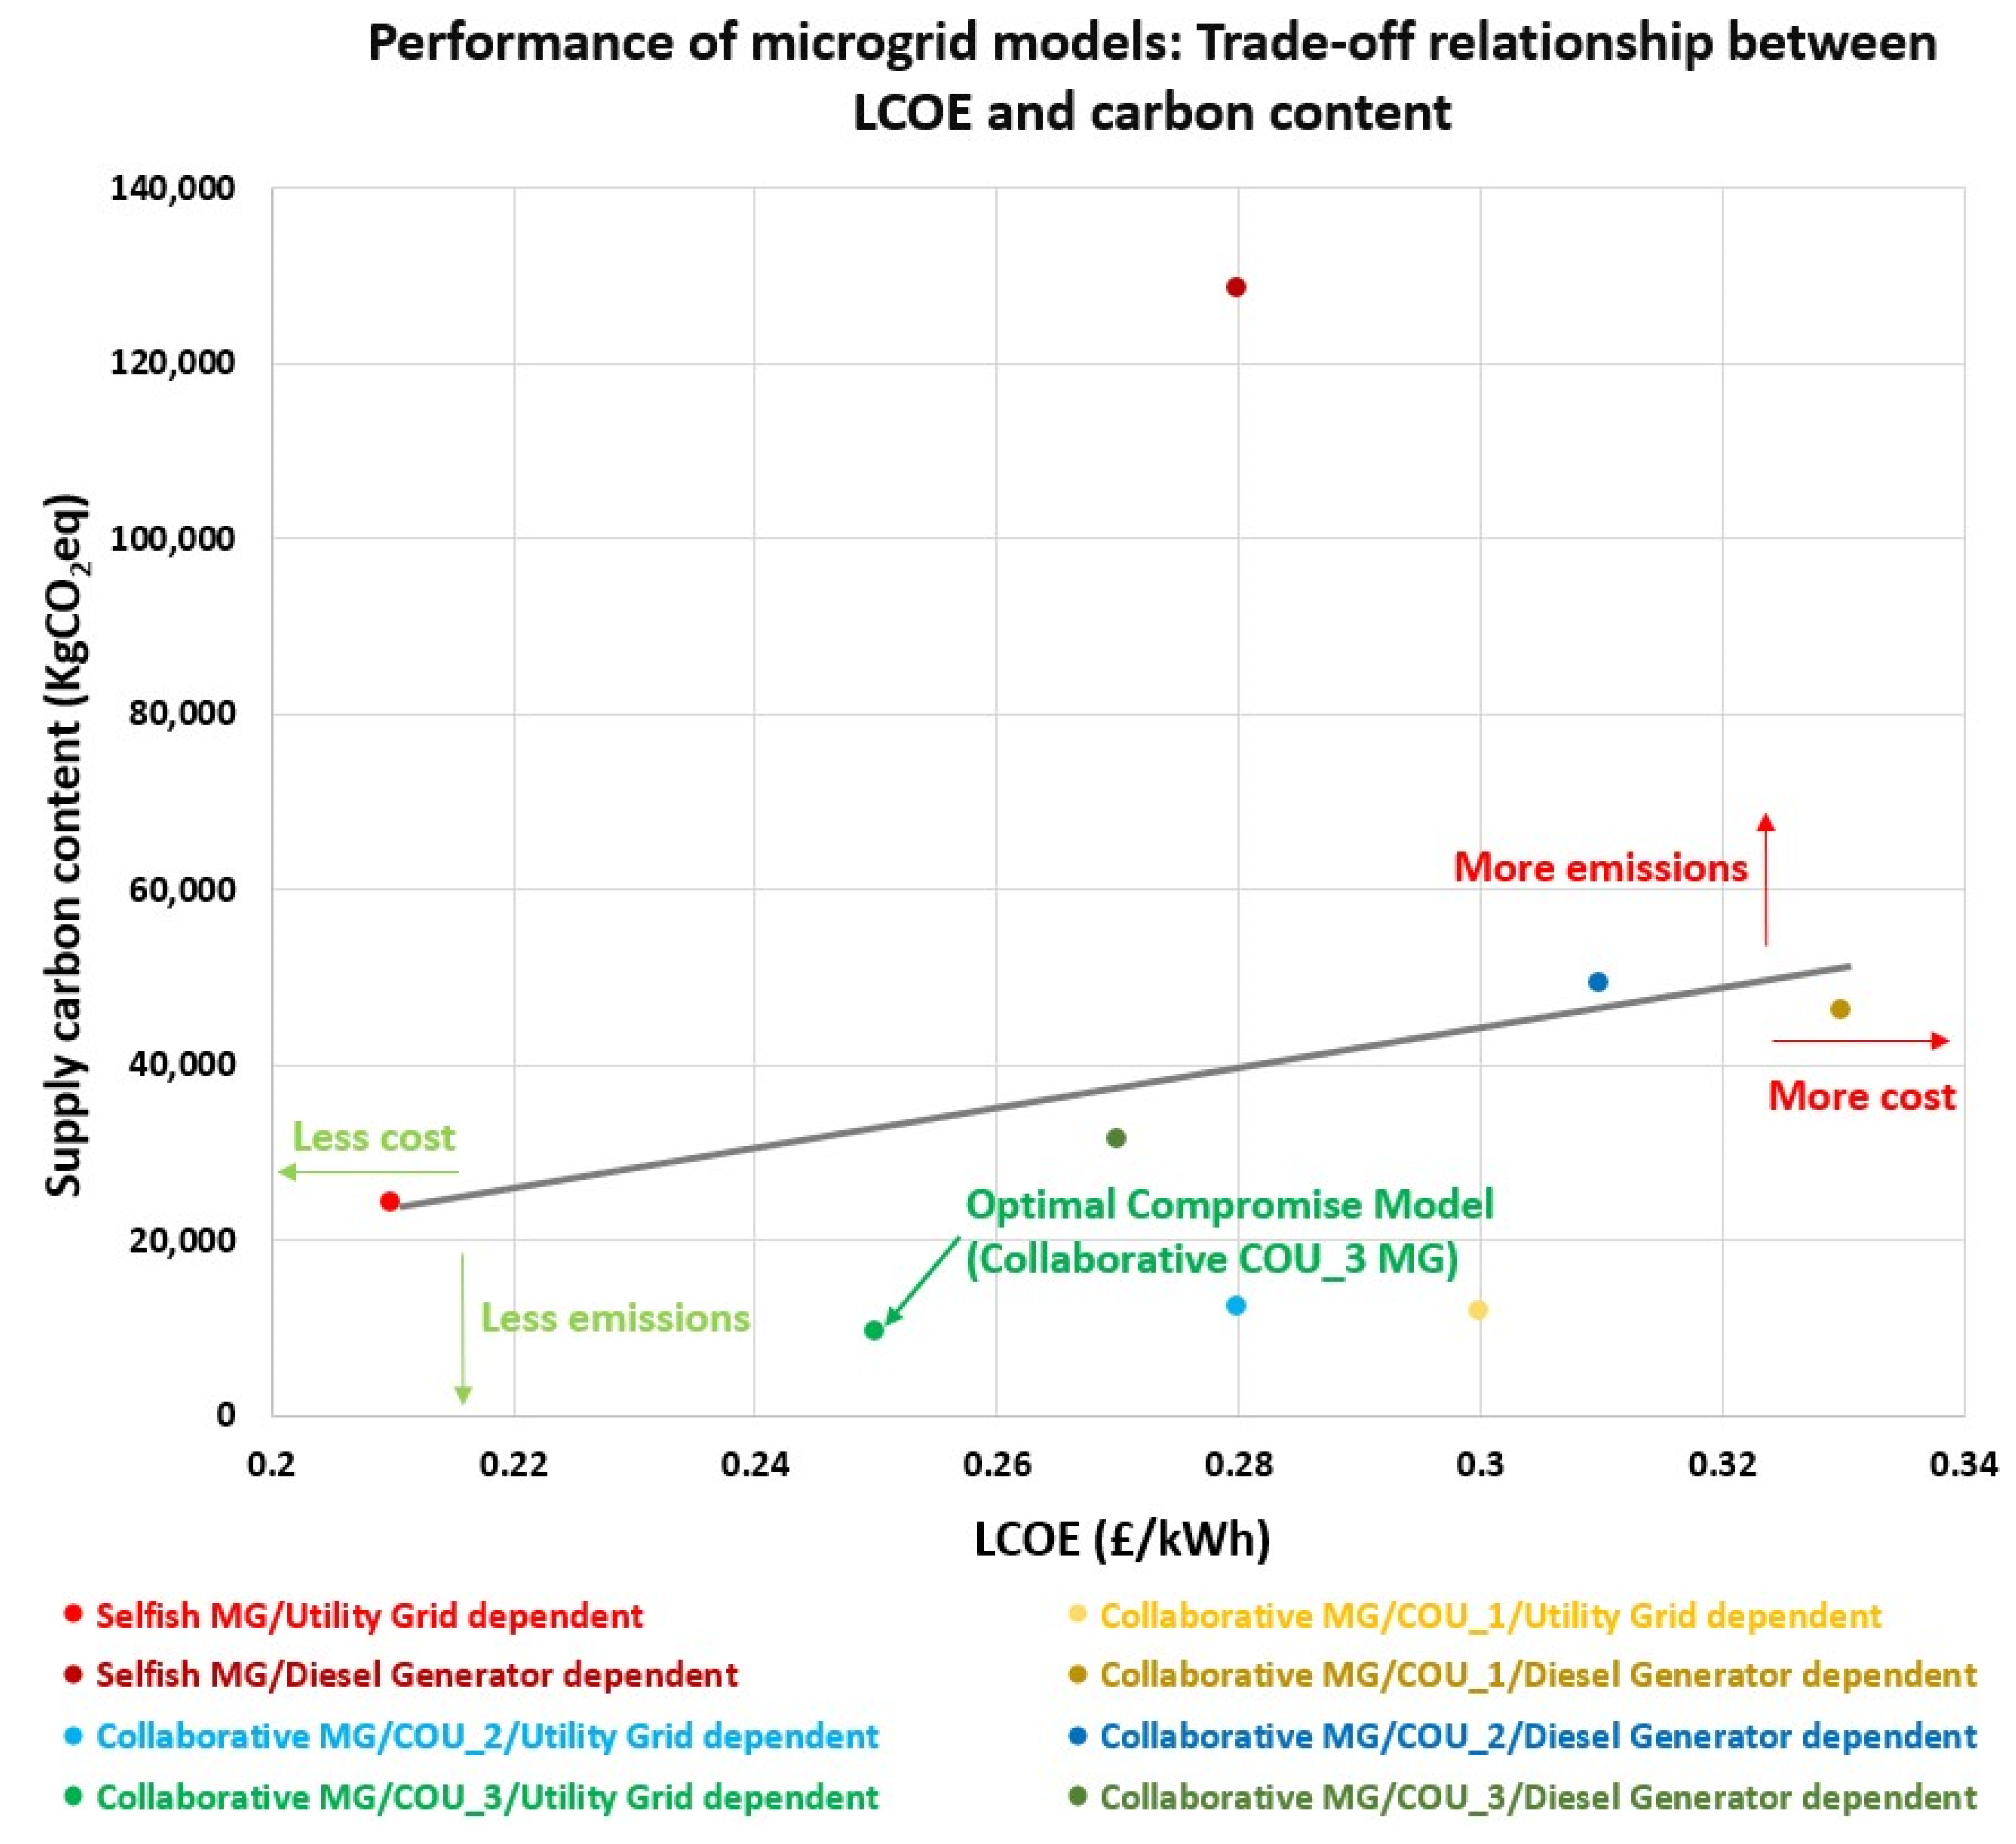
The previous findings define the performance of the MG models, where the two-dimensional trade-off between selfish and collaborative MG models is defined. One trade-off is between LCOE and supply carbon content, and the other trade-off is between LCOE and the unplanned/spot orders to the grid. In Figure 10, the trade-off between cost-effective, unsustainable selfish MG as opposed to marginally more costly, sustainable collaborative MG is clearly depicted. Figure 10 exhibits that the proposed approach provides the optimal collaborative MG model (COU_3), where it has an LCOE of 0.25 GBP/kWh, only 19% more than the selfish MG model, and a supply carbon emission of 9583 kgco2eq, which is 61% lower than that of the selfish MG model.
In Figure 11, the trade-off between LCOE and the volatility of orders to the utility grid for all the collaborative and selfish MG models is demonstrated. The selfish models have the lowest LCOE and the highest unplanned order volatility, while the collaborative models have a slightly higher LCOE but a lower order volatility to the grid. The optimal compromise is model (COU_3) of the collaborative MG with an LCOE of 0.25 GBP/kWh and unplanned volatility of orders 29 kWh. The volatility of orders to the utility grid are, therefore, reduced by 55% in the COU_3 model when compared to the selfish MG scenario volatility of 64 kWh.

4. Discussion

The findings defined that the optimal collaborative MG is achieving the best trade-off solutions between cost, sustainability, and less volatility of orders to the bigger system, with slightly higher costs than the selfish MG by only 19%. However, it could be argued that this difference in the LCOE between both MG models could be compensated by the price of the carbon emissions in the MGs, where the selfish MG has more than double the collaborative MG emissions.
Not only are the carbon emissions considered to be a difference in the cost, but also the volatility of renewable outputs is considered to be an additional cost related to the overproduction and additional efforts of existing fossil fuel power plants at the utility network to satisfy the electricity demand that is not instantly covered by the renewable volatile production. The study conducted in [18] proved that the volatility of the renewable sources is considered to be an extra source of energy cost at the MG level. However, our proposed strategy could eliminate the cost related to the renewable output volatility, where the collaborative MG reduces the volatility of orders to the utility grid by 55% compared to the selfish MG.
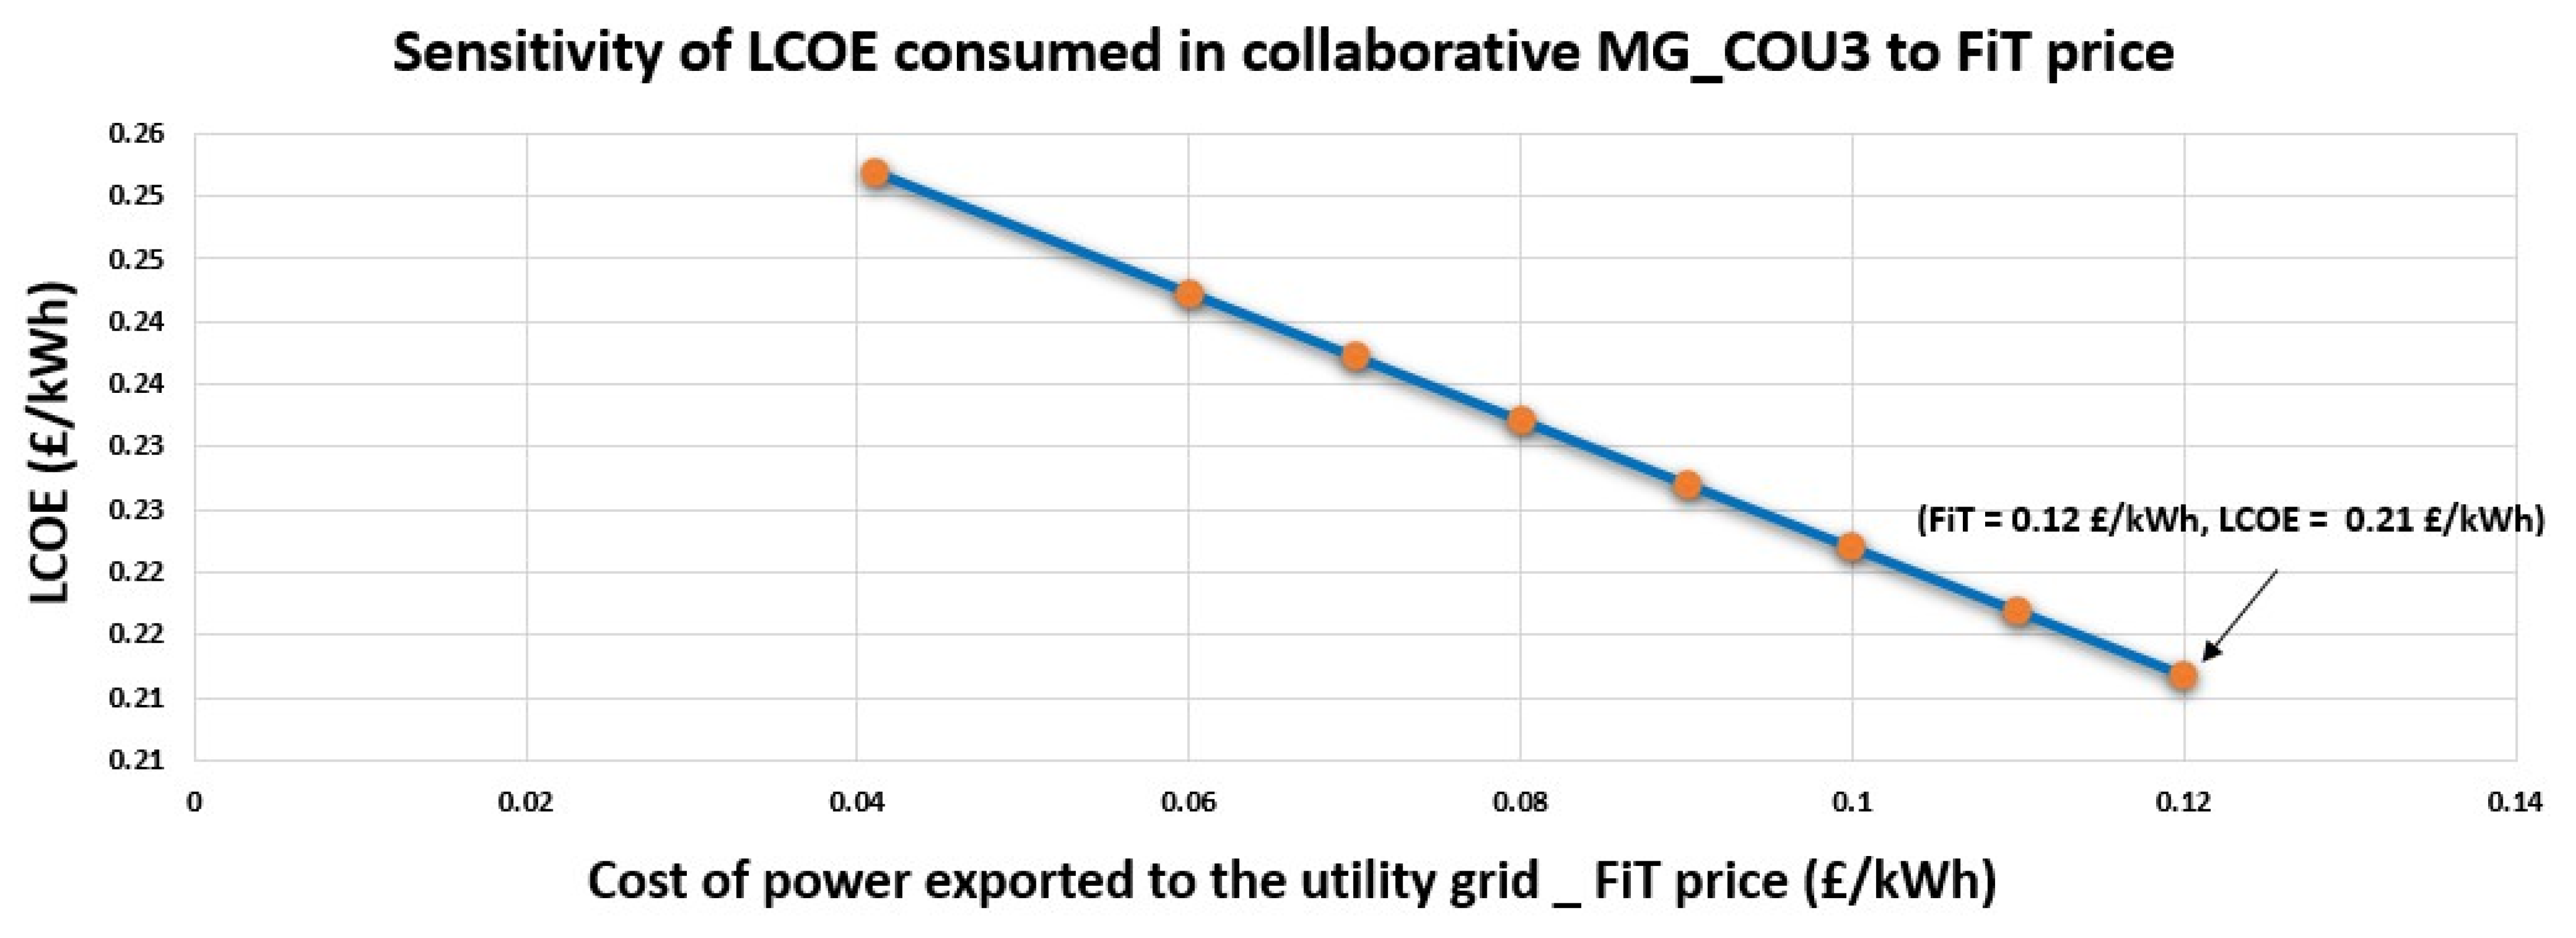
As described in Section 1.4, FiT price and COU cost could be tailored for the collaborative MG. The FiT price could be a game changer, as it could be used as an incentive for the collaborative MG. Figure 12 illustrates a one-way sensitivity analysis of the LCOE in the collaborative MG to the FiT price. This sensitivity analysis shows that the collaborative MG (COU_3) model could have the same LCOE as the selfish MG (0.21 GBP/kWh) when the FiT price increased to 0.12 GBP/kWh instead of the used tariff in this paper of 0.041 GBP/kWh.
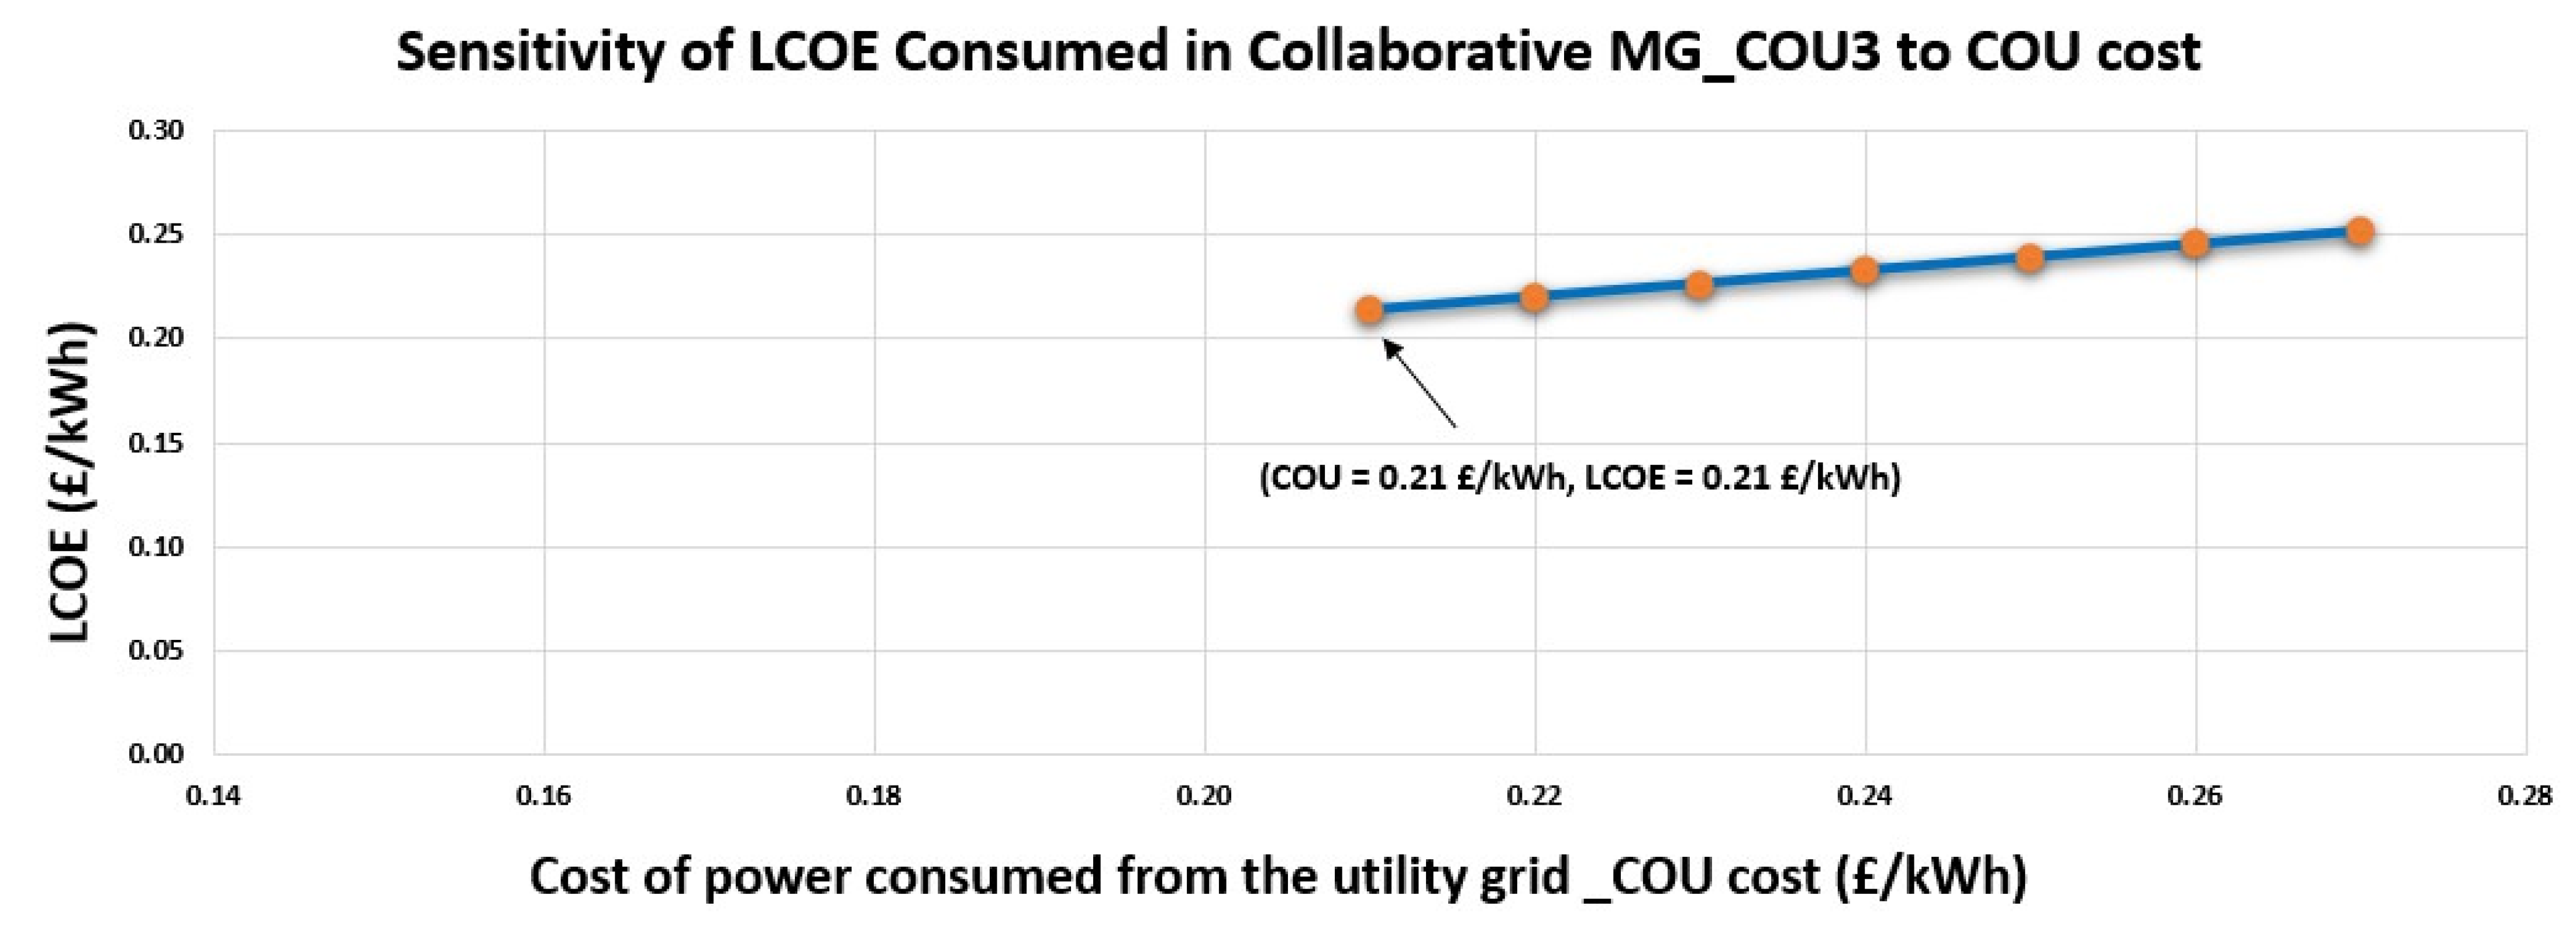
According to the COU strategy, the collaborative MG has the commitment to purchase electricity ahead from the utility grid, in contrast to the selfish MG that seeks autonomy from the utility grid. Therefore, the cost for the electricity consumed from the utility grid could be less for the collaborative MG as an inducement for the purchase commitment. Figure 13 depicts the sensitivity of the LCOE in the collaborative MG to the COU cost. This sensitivity analysis indicates that the collaborative MG (COU_3) model might achieve an equivalent LCOE of 0.21 GBP/kWh, contingent upon a reduction in the cost of the COU to 0.21 GBP/kWh instead of the value used in this paper of 0.27 GBP/kWh.
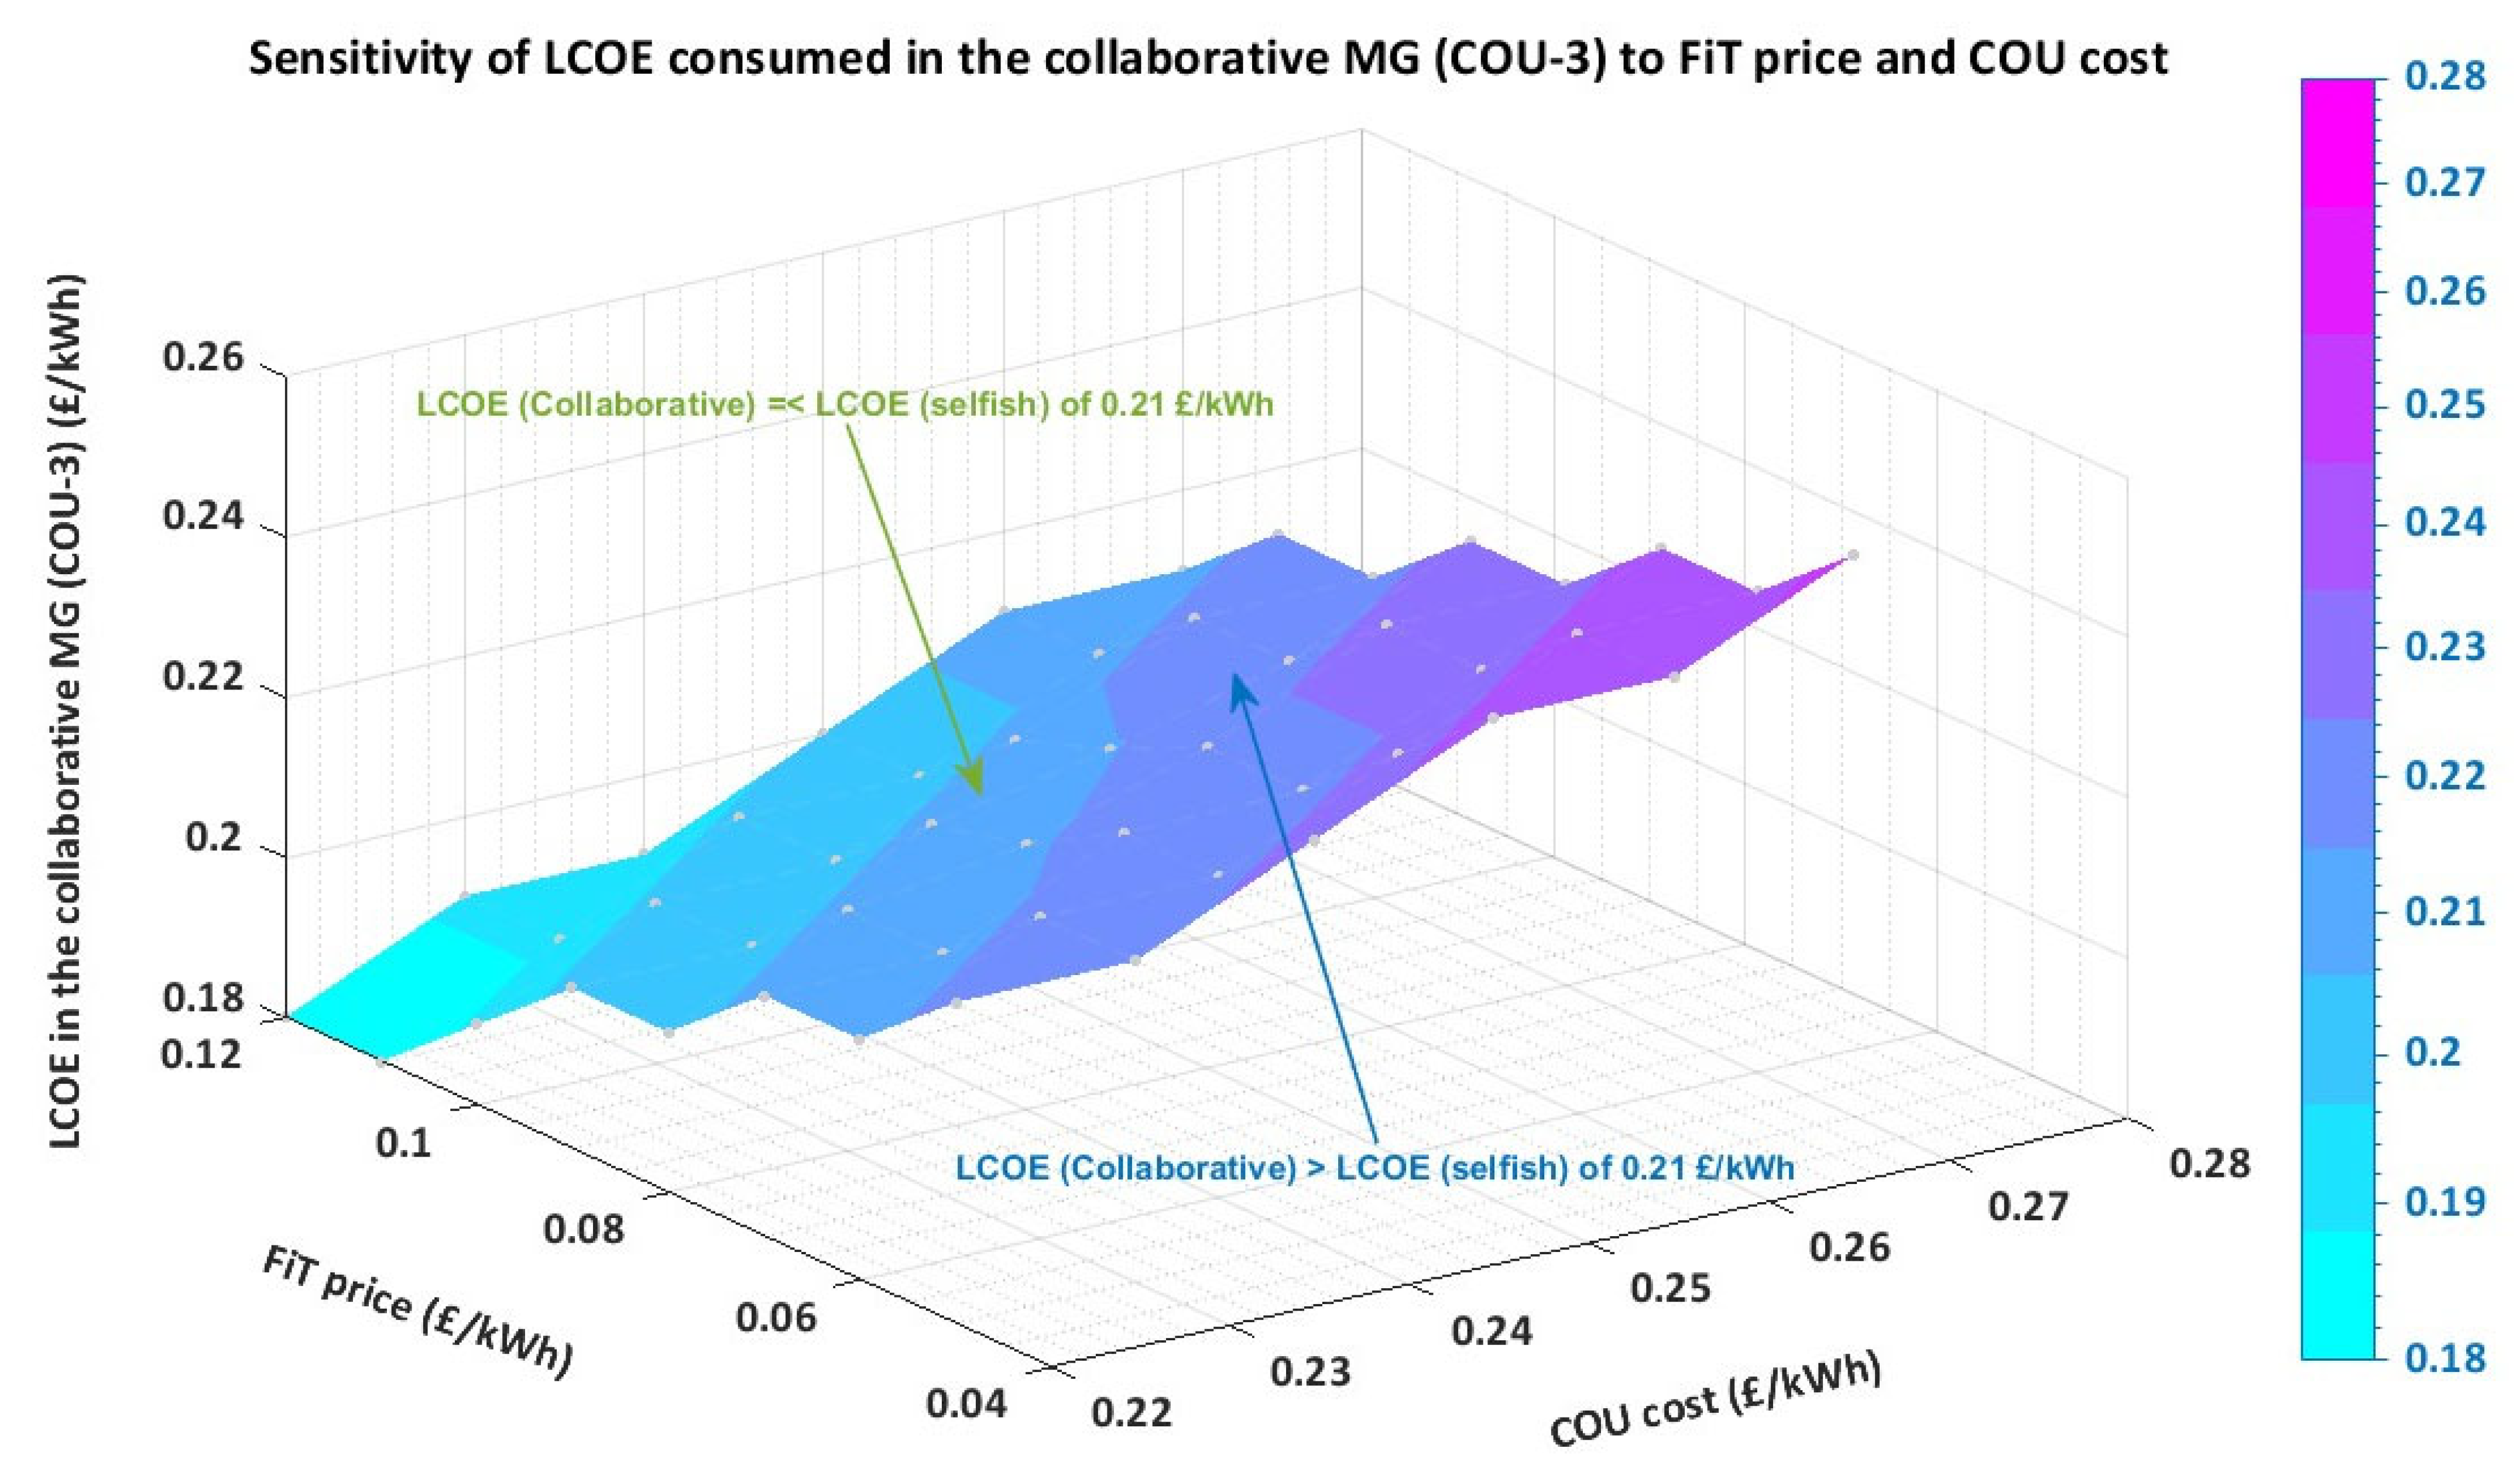
A two-way sensitivity analysis was conducted to examine the impact of simultaneous variations in the FiT price and the COU cost on the LCOE in the collaborative MG (COU_3) model. Figure 14 illustrates that the collaborative MG (COU_3) model might achieve an LCOE equivalent to the selfish MG (LCOE = 0.21 GBP/kWh) by selecting from the various options of FiT prices and cost of COU listed in Table 4.
As previously demonstrated, several solutions are available to bridge the gap between the LCOE of selfish MGs with that of collaborative MGs, given that collaborative MGs effectively diminish carbon emissions and alleviate order instability in the grid.
The volatility of the orders to the grid and the exported power to the grid could be interpreted as power quality issues [30] that impose costs on the broader (utility-scale) system. Consequently, integrating collaborative MGs into the utility grid might significantly increase the proportion of renewable energy, while mitigating costs associated with the power quality challenges they generate. Hence, promoting collaborative design through incentives like raising the FiT price and/or lowering COU costs would reduce the LCOE not only at the MG level but also at the utility level.
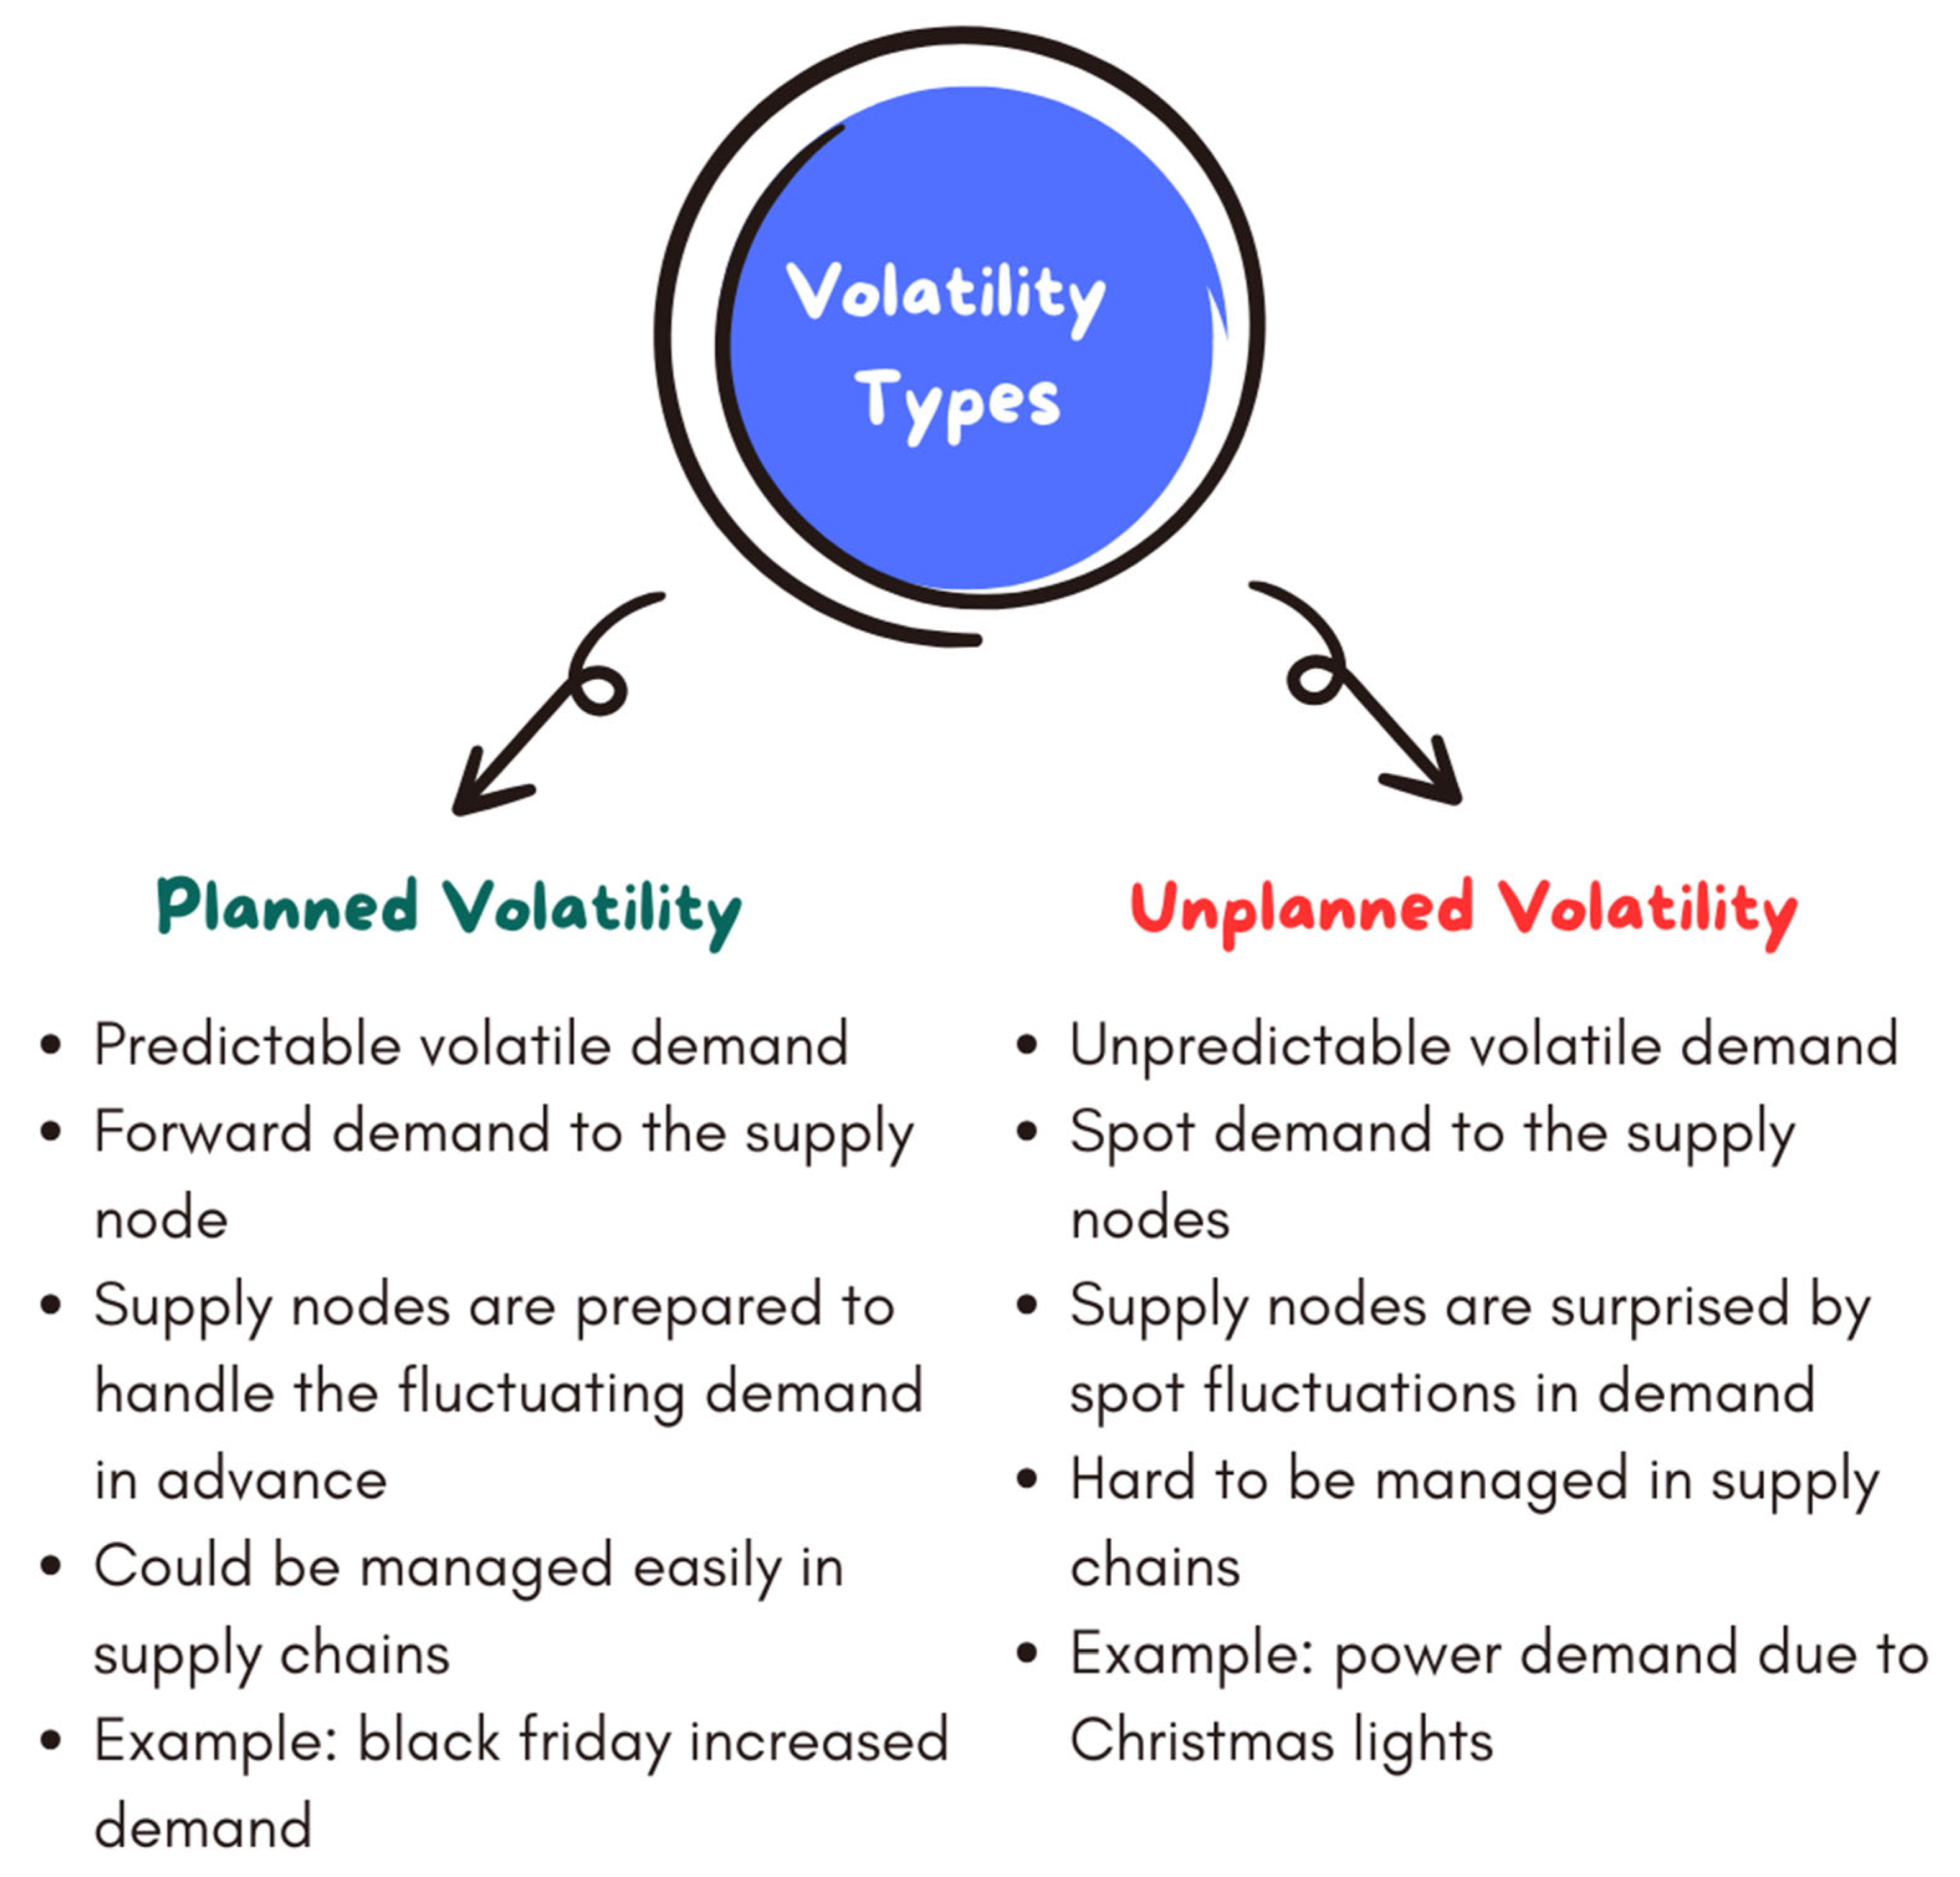
When discussing volatility, it is crucial to differentiate between two categories of volatility, as illustrated in Figure 15. In the collaborative MG utilizing COU_3, which exhibits superior performance compared to other collaborative strategies, the anticipated demand derived from weather forecasts was communicated to the utility grid one week in advance, categorized as planned orders with known volatility. Nevertheless, the outcomes for that scenario indicated less unplanned orders and less volatility in contrast to all other collaborative models reliant on submitting level (pure Heijunka) orders to the grid. The COU approach, being an in-advance order to the utility grid, renders volatility predictable, and the order does not need to be level (pure Heijunka); conversely, the volatile COU (COU_3) yields superior performance compared to the level COU (COU_1, COU_2). This indicates that the collaborative COU_3 attained Heijunka for unplanned orders, suggesting that the primary objective is no longer the direct application of Heijunka but rather the achievement of Heijunka specifically for unplanned (unpredictable) orders. Thus, alleviating the unplanned volatility complicates the management of the power grid, as elaborated in Section 1.4. The same concept may be used for conventional supply networks; during Black Friday, merchants, logistics, and other parts of the supply chain prepare for the projected (predictable) demand, ensuring that customer needs are met despite fluctuations. Unlike the nature of orders to the electricity grid at Christmas, the installation and activation of Christmas lights by consumers is seen as a fluctuating and unpredictable demand. Consequently, the supply becomes uncontrollable, potentially leading to network blackouts.
The surprising and unpredictable nature of volatility is challenging to manage; hence, lean production consistently favours levelled and smooth production. However, if its surprising (unpredictable) nature could be eliminated, volatile demand as planned (predictable) volatility could be maintained, thereby facilitating management of the system through controllable supply and demand nodes.

5. Conclusions

Previous research about collaborative MGs has demonstrated that they can reduce energy demand volatility for utility grid operators, while reducing carbon emissions. The collaborative approach requires local energy storage and the transfer of volatility risk from the utility to the MG. However, the cost implications of this collaborative approach were ignored in previous research. As a collaborative MG can order more than it needs and store that energy, it is expected that its operations will cost more. Why should an MG increase its operating cost (measured in this paper as a levelized cost of energy) just to make the operations of a utility grid easier? There is ample evidence that the cost of intermittence is an increasing burden for grid operators, and one reason why the potential of MGs to alleviate this problem has been ignored is that the objective of real-life MGs may be selfish rather than collaborative. This makes the collaborative concept presented in this paper an example of technology as a social good, i.e., the real economic benefits are achieved elsewhere than within the system itself.
However, this paper has shown that the cost difference between the operations of a collaborative versus a selfish MG is only a marginal increase. Given the value provided by the MG to the utility grid, this marginal increase in operations cost could be offset by reduced COU prices or increased FiT rates, making the proposed collaborative approach an example of a positive sum game, i.e., a win–win proposition for both parties.
To attain the most economical energy systems, it is essential to understand the implications of volatility and related power quality challenges on the broader system. Although the collaborative MG will consistently seem more costly to operate than a selfish MG, the economics of collaboration at the larger system level are considerably more complex. For instance, many selfish MGs could negatively affect utility grid operations and lead to power quality problems, potentially imposing costs up to millions of pounds to rectify these concerns. Consequently, to achieve an optimal equilibrium among renewable energy, stability, security, and cost-effectiveness, this research asserts that the collaborative MG concept is integral to future energy systems.

Author Contributions

Conceptualization, H.F. and M.L.; methodology, H.F., M.L. and J.R., software, H.F., formal analysis, H.F.; writing—original draft preparation, H.F.; writing—review and editing, H.F. and M.L.; visualization, H.F.; reviewing and further modifications, J.R. All authors have read and agreed to the published version of the manuscript.

Funding

This research received no external funding.

Data Availability Statement

The original contributions presented in this study are included in the article. Further inquiries can be directed to the corresponding author.

Conflicts of Interest

The authors declare no conflicts of interest.

Abbreviations

The following abbreviations are used in this manuscript:
MGMicrogrid
LCOELevelized cost of energy
COUPre-contracted order update
FiTFeed-in tariff
TTime (UK standard time)
D(t)The aggregate demand for the interconnected households at time t
Ppv(t)The power output from PV at time t
Pw(t)The power output from wind turbine at time t, kilowatts
LCOEMG The levelized cost of energy consumed in the MG in GBP/kWh
CMGThe cost of total energy consumed in the MG in GBP
PEexpThe price of the total exported power from the MG to the utility grid in GBP
EMGThe total energy consumed in the MG in kW
Ei(t)The energy consumed from each energy sources at each hour
ciThe unit cost of each energy source in GBP/kWh
ECOUThe power consumed from the utility grid at the MG level as COU in kWh
Epv(t)The power consumed from the solar output at the MG level in kWh
Ew(t)The power consumed from the wind output at the MG level in kWh
Est(t)The power consumed from the storage at the MG level in kWh
ESOU(t)The power supply (spot order update) from the backup option (utility grid or diesel) in kWh
Eexp(t)The exported energy to the utility grid at each hour in kWh
PFiTThe price of the feed-in tariff in GBP/kWh
Pst(t)The power available in storage system at time t, kilowatts
PCOU(t)Precontracted grid order update at time t

References

  1. Gudde, P.; Oakes, J.; Cochrane, P.; Caldwell, N.; Bury, N. The Role of UK Local Government in Delivering on Net Zero Carbon Commitments: You’ve Declared a Climate Emergency, so What’s the Plan? Energy Policy 2021, 154, 112245. [Google Scholar] [CrossRef]
  2. Ejuh Che, E.; Roland Abeng, K.; Iweh, C.D.; Tsekouras, G.J.; Fopah-Lele, A. The Impact of Integrating Variable Renewable Energy Sources into Grid-Connected Power Systems: Challenges, Mitigation Strategies, and Prospects. Energies 2025, 18, 689. [Google Scholar] [CrossRef]
  3. Feleafel, H.; Radulovic, J.; Leseure, M. Should We Have Selfish Microgrids? Energies 2024, 17, 3969. [Google Scholar] [CrossRef]
  4. Sato, T.; Murata, K.; Katayama, H. On Stability of Supply Performance by Work-in-Progress Management: A Case Analysis of Photovoltaics-Based Electricity Supply System with Storage Batteries. Procedia Manuf. 2017, 11, 1077–1084. [Google Scholar] [CrossRef]
  5. Feleafel, H.; Radulovic, J.; Leseure, M. Facilitating the Shift to More Collaborative Microgrids by Alleviating Demand Volatility Using a Precontracted Order Updates Strategy. Next Energy 2025, 8, 100269. [Google Scholar] [CrossRef]
  6. Feleafel, H.; Leseure, M.; Radulovic, J. Shifting Towards Greener and More Collaborative Microgrids by Applying Lean-Heijunka Strategy. Eng 2025, 6, 69. [Google Scholar] [CrossRef]
  7. Feleafel, H.; Leseure, M. Feed-in Tariff Policy for Microgrids: Past and Future a Case Study of the Option Value of Complementary Energy Assets in Turbulent Conditions. Int. J. Energy Sect. Manag. 2025; ahead-of-print. [Google Scholar] [CrossRef]
  8. Manandhar, U.; Zhang, X.; Beng, G.H.; Subramanian, L.; Lu, H.H.C.; Fernando, T. Enhanced Energy Management System for Isolated Microgrid with Diesel Generators, Renewable Generation, and Energy Storages. Appl. Energy 2023, 350, 121624. [Google Scholar] [CrossRef]
  9. Martinez-Bolanos, J.R.; Manito, A.R.A.; Almeida, M.P.; Almeida, J.C.; Torres, P.F.; Pinho, J.T.; Zilles, R. Improved Dynamic Model of Small Stand-Alone Diesel Generators to Assess the Stability of Autonomous Microgrids. AIP Adv. 2025, 15, 25118. [Google Scholar] [CrossRef]
  10. Singh, B.; Pathak, G.; Panigrahi, B.K. Seamless Transfer of Renewable-Based Microgrid Between Utility Grid and Diesel Generator. IEEE Trans. Power Electron. 2018, 33, 8427–8437. [Google Scholar] [CrossRef]
  11. Sanni, S.O.; Oricha, J.Y.; Oyewole, T.O.; Bawonda, F.I. Analysis of Backup Power Supply for Unreliable Grid Using Hybrid Solar PV/Diesel/Biogas System. Energy 2021, 227, 120506. [Google Scholar] [CrossRef]
  12. Cavalcanti, M.H.C.; Pappalardo, J.R.; Barbosa, L.T.; Brasileiro, P.P.F.; Roque, B.A.C.; da Rocha e Silva, N.M.P.; Silva, M.F.d.; Converti, A.; Barbosa, C.M.B.d.M.; Sarubbo, L.A. Hydrogen in Burners: Economic and Environmental Implications. Processes 2024, 12, 2434. [Google Scholar] [CrossRef]
  13. Aoki, R.; Katayama, H. Heijunka Operation Management of Agri-Products Manufacturing by Yield Improvement and Cropping Policy. In Lecture Notes on Multidisciplinary Industrial Engineering; Springer: Cham, Switzerland, 2018; Part. F43; pp. 1407–1416. [Google Scholar] [CrossRef]
  14. Helleno, A.L.; de Moraes, A.J.I.; Simon, A.T. Integrating Sustainability Indicators and Lean Manufacturing to Assess Manufacturing Processes: Application Case Studies in Brazilian Industry. J. Clean. Prod. 2017, 153, 405–416. [Google Scholar] [CrossRef]
  15. Shetty, D.K.; Abakari, G.; Rodrigues, D.L.L.R.; Oommen Mathew, A.; Motlagh, F.G. To Develop Lean Systems in Electronic Automotive Parts Manufacturing Industry: A System Dynamics Modelling Approach. In Proceedings of the 2019 International Conference on Automation, Computational and Technology Management, ICACTM, London, UK, 24–26 April 2019; pp. 277–283. [Google Scholar] [CrossRef]
  16. Alvarez, L.; Avella, L.; Martinez, R. Impact and Critical Factors in Heijunka Implementation an Action Research Study. J. Ind. Eng. Manag. 2024, 17, 753–776. [Google Scholar] [CrossRef]
  17. Kabeyi, M.J.B.; Olanrewaju, O.A. The Levelized Cost of Energy and Modifications for Use in Electricity Generation Planning. Energy Rep. 2023, 9, 495–534. [Google Scholar] [CrossRef]
  18. Veronese, E.; Manzolini, G.; Moser, D. Improving the Traditional Levelized Cost of Electricity Approach by Including the Integration Costs in the Techno-Economic Evaluation of Future Photovoltaic Plants. Int. J. Energy Res. 2021, 45, 9252–9269. [Google Scholar] [CrossRef]
  19. Graça Gomes, J.; Xu, H.J.; Yang, Q.; Zhao, C.Y. An Optimization Study on a Typical Renewable Microgrid Energy System with Energy Storage. Energy 2021, 234, 121210. [Google Scholar] [CrossRef]
  20. Idel, R. Levelized Full System Costs of Electricity. Energy 2022, 259, 124905. [Google Scholar] [CrossRef]
  21. Residential Battery Economics-Spirit Energy. Available online: https://www.spiritenergy.co.uk/kb-battery-storage-for-solar-residential-economics (accessed on 17 July 2025).
  22. Lifetime Cost of Solar Electricity vs the Grid. Available online: https://www.spiritenergy.co.uk/lifetime-cost-electricity (accessed on 17 July 2025).
  23. Rangel, N.; Li, H.; Aristidou, P. An Optimisation Tool for Minimising Fuel Consumption, Costs and Emissions from Diesel-PV-Battery Hybrid Microgrids. Appl. Energy 2023, 335, 120748. [Google Scholar] [CrossRef]
  24. Dong, M.; Li, Y.; Song, D.; Yang, J.; Su, M.; Deng, X.; Huang, L.; Elkholy, M.H.; Joo, Y.H. Uncertainty and Global Sensitivity Analysis of Levelized Cost of Energy in Wind Power Generation. Energy Convers. Manag. 2021, 229, 113781. [Google Scholar] [CrossRef]
  25. Average Cost of Electricity Per KWh in the UK. 2025. Available online: https://www.greenmatch.co.uk/average-electricity-cost-uk (accessed on 10 April 2025).
  26. Energy Prices by Region in 2025-Uswitch. Available online: https://www.uswitch.com/gas-electricity/guides/regional-energy-prices/ (accessed on 13 June 2025).
  27. What Are the Best SEG Rates?|All 28 Tariffs Ranked. 2025. Available online: https://www.sunsave.energy/solar-panels-advice/exporting-to-the-grid/best-seg-rates (accessed on 13 June 2025).
  28. Smart Export Guarantee|Octopus Energy. Available online: https://octopus.energy/smart/smart-export-guarantee/ (accessed on 13 June 2025).
  29. The Feed-in Tariff: Past & Current Rates. 2025. Available online: https://www.sunsave.energy/solar-panels-advice/exporting-to-the-grid/feed-in-tariff (accessed on 13 June 2025).
  30. Leseure, M.; Feleafel, H.; Radulovic, J. Collaborative Microgrids as Power Quality Improvement Nodes in Electricity Networks. Energies 2025, 18, 4197. [Google Scholar] [CrossRef]

Figure 1. Operational strategy for collaborative microgrid vs. selfish microgrid.
Energies 18 04320 g001
Figure 2. Potential effects of the pre-contracted order update (COU) strategy on the levelized cost of energy (LCOE) in collaborative microgrid.
Energies 18 04320 g002
Figure 3. Studied backup generation scenarios for both microgrid models (selfish and collaborative).
Energies 18 04320 g003
Figure 4. Cost flows in model 1: selfish microgrid_scenario 1: utility grid-dependent.
Energies 18 04320 g004
Figure 5. Cost flows in model 2: collaborative microgrid_scenario 1: utility grid-dependent.
Energies 18 04320 g005
Figure 6. Cost flows in model 1: selfish microgrid_scenario 2: diesel generator-dependent.
Energies 18 04320 g006
Figure 7. Cost flows in model 2: collaborative microgrid_scenario 2: diesel generator-dependent.
Energies 18 04320 g007
Figure 8. Demand profile vs. power consumed from different sources in the selfish microgrid model.
Energies 18 04320 g008
Figure 9. Demand profile vs. power consumed from different sources in the collaborative microgrid model.
Energies 18 04320 g009
Figure 10. Microgrid models’ performance: trade-off between LCOE and the supply carbon content.
Energies 18 04320 g010
Figure 11. Microgrid models’ performance: trade-off between LCOE and the unplanned volatility of orders to the utility grid.
Energies 18 04320 g011
Figure 12. Sensitivity of LCOE in collaborative MG (COU_3) to FiT price.
Energies 18 04320 g012
Figure 13. Sensitivity of LCOE in collaborative MG (COU_3) to COU cost.
Energies 18 04320 g013
Figure 14. Sensitivity of LCOE in collaborative MG (COU_3) to FiT price and COU cost.
Energies 18 04320 g014
Figure 15. Volatility types and its impact on the controllability of the supply/demand nodes.
Energies 18 04320 g015
Table 2. Models’ parameters.
Time HorizonStorage CapacityStorage Efficiency
90 days in spring1500 kWh95%
Table 3. LCOE consumed, volatility of orders to utility grid, and supply carbon content in microgrid (MG) models.
Microgrid ModelBackup Generation ScenarioLCOE (GBP/kWh)Unplanned Volatility of Orders to the Utility Grid (kWh)Supply Carbon Content (kgco2eq)
Selfish MGUtility grid0.216424,209
Diesel generator0.280128,594
Collaborative MG
(COU_1: pure level demand)
Utility grid0.304111,978
Diesel generator0.33046,176
Collaborative MG
(COU_2: two-step demand)
Utility grid0.283112,363
Diesel generator0.31049,379
Collaborative MG
(COU_3: planned volatile demand)
Utility grid0.25299583
Diesel generator0.27031,472
Table 4. Alternative values of FiT price and COU cost to equalise the LCOE in both MG models.
FiT price 0.120.110.100.090.080.07
COU cost0.270.260.250.240.230.22
Disclaimer/Publisher’s Note: The statements, opinions and data contained in all publications are solely those of the individual author(s) and contributor(s) and not of MDPI and/or the editor(s). MDPI and/or the editor(s) disclaim responsibility for any injury to people or property resulting from any ideas, methods, instructions or products referred to in the content.