Article

Effect of Low-Temperature Preheating on the Physicochemical Properties and Energy Quality of Pine Sawdust

1
Institute of Urban and Rural Mining, Changzhou University, Changzhou 213164, China
2
Changzhou Key Laboratory of Biomass Green, Safe and High Value Utilization Technology, Changzhou 213164, China
3
School of Aerospace and Flight College, Changzhou Institute of Technology, Changzhou 213032, China
*
Author to whom correspondence should be addressed.
Energies 2025, 18(14), 3875; https://doi.org/10.3390/en18143875
Submission received: 17 June 2025 / Revised: 12 July 2025 / Accepted: 15 July 2025 / Published: 21 July 2025

Abstract

The advantages of torrefaction preheating, including the production of a hydrophobic solid product, improved particle size distribution, enhanced fuel properties with fewer environmental issues, decreased moisture content, and reduced volatile content. In order to meet the technical requirements of biomass oriented value-added and energy saving and emission reduction, pine sawdust (PS) was taken as the research object, and the physicochemical properties of the PS samples preheated at a low temperature were analyzed by synchronous thermal analysis (TG-DSC), Fourier transform infrared spectroscopy (FT-IR), scanning electron microscope (SEM), and organic element analyzer (EA). The effect of preheating at a lower temperature on the physicochemical properties of PS was discussed. The results showed that, under the preheating condition of 200 °C, compared with PS, the water content of PS-200 decreased by 3.23%, the volatile content decreased by 3.69%, the fixed carbon increased by 6.81%, the calorific value increased by 6.90%, the equilibrium water content decreases from 7.06% to 4.46%, and the hydrophobicity increases. This research, based on the improvement of the quality of agricultural and forestry waste and the promotion of the strategy of converting waste into energy, has contributed to the advancement of sustainable energy production.

1. Introduction

With the continuous and rapid development of the global economy, the demand for energy is increasing day by day. The extensive use of fossil energy has led to a sharp decline in the reserves of this non-renewable resource, and the tension in its supply has also been intensifying [1]. In recent years, the excessive utilization of fossil fuels has caused serious environmental problems, such as acid rain, photochemical smog, and the greenhouse effect [2]. Therefore, the development and search for new alternative energy sources have become major issues that human society must address in the 21st century [3]. As a renewable energy source, biomass energy has attracted much attention due to its wide availability and renewability. The effective utilization of biomass energy is of great significance for solving energy and environmental problems, especially given its carbon neutrality, which provides a feasible approach for achieving the carbon peak and carbon neutrality (referred to as “dual carbon”) goals. The utilization of biomass energy aligns with the concept of green development in the current global policy context and can be widely applied in modern production [4].
Agricultural and forestry waste is one of the main sources of biomass. If not properly treated, it will lead to resource waste and even ecological pollution [5,6,7]. In China, pine wood is widely distributed in the northern regions, and PS has a low cost, making it a kind of forestry waste with high development value. However, the disadvantage of biomass is its high oxygen content, low calorific value, high moisture content, and easy moisture absorption [2]. Additionally, biomass resources are scattered, with low energy density, making collection and transportation difficult. Currently, methods that are tailored to local conditions and economically efficient are being adopted to improve the quality of biomass and further synthesize alcohols as a research hotspot [8]. Therefore, a suitable pretreatment technology is needed to overcome these disadvantages. The preheating treatment, as a method to improve the quality of biomass, can effectively remove the moisture and light volatile components in the biomass. Usually, the biomass is heated at a temperature of 200 to 300 °C in an inert atmosphere [9]. Yu et al. [10] observed that the energy density of wood chips after low-temperature preheating can reach 10.41 GJ/m3, while the energy density of unheated wood chips is 9.35 GJ/m3. After treatment, the biomass has advantages such as high calorific value, high grindability, corrosion resistance, and high volumetric energy density [9]. Niksa [11] found that low-temperature preheating also alleviates the difficulties in fuel processing and makes the particle shape uniform. The research by Azarpou et al. [12] found that low-temperature preheating technology partially destroys the structure of biomass fibers, thereby changing its properties from hygroscopicity to hydrophobicity and improving the grinding characteristics. Xu et al. [13] found that a preheating pretreatment can increase the carbon and fixed carbon content in corn straw, reduce the volatile content, and increase the quality of pyrolytic coke, and the preheating temperature has a greater influence than the preheating time. Moreover, some studies have found that, compared to preheating above 200 °C, low-temperature preheating can better control the temperature gradient, making the raw materials heated uniformly, with internal moisture gradually evaporating and maintaining a certain humidity, thereby improving the storage stability of the raw materials, reducing the generation of by-products, increasing the economic benefits, and reducing the environmental impact [4,14,15,16]. The low-temperature pretreatment of raw materials in this study is for the subsequent production of alcohol fuel. Higher preheating temperatures (>200 °C) will increase the energy consumption for raw material pretreatment, ultimately leading to excessively high production costs for subsequent alcohol fuel. Therefore, a temperature range of 120 to 200 °C was selected to initially improve the quality of the raw materials, while avoiding excessive production costs and not affecting the cost-effectiveness of the subsequent alcohol fuel. This provides new ideas for the development and application of low-temperature pretreatment technology.

2. Materials and Methods

2.1. Sample and Instruments

The raw material, pine sawdust (PS), used in this experiment was collected in Linyi City, Shandong Province, cut off after natural air drying, ground and crushed; screened particles with a particle size of about 0.45 mm were dried in an oven (105 °C, 24 h), put into a sealed bag, and placed in a dryer for later use.
The instruments used included the following: OTF-1200X High Temperature Tube Furnace, Hefei Kejing Material Technology Co., Ltd. (Hefei, China). HWS-50 Constant Temperature and Humidity Incubator, Shaoxing Shangcheng Instrument Manufacturing Co., Ltd. (Shaoxing, China). Sv2-5-12ltp ceramic fiber box-type resistance box by Shanghai Lichenbang. (Shanghai, China). Vario MACRO Cube Organic Element Analyzer, Elementar (Hanau, Germany). Nicolet iS50 Fourier Infrared Spectrometer, Thermo Fisher Scientific (Waltham, MA, USA). Discovery SDT 650 Synchronous Thermal Analyzer, TA, (Waltham, MA, USA). D8 ADVANCE, BRUKER type X-ray diffractometer; Pyris 1 TGA, Thermogravimeter, PerkinElmer (Waltham, MA, USA). TZL-900 Optical Water Contact Angle Instrument, Guangzhou Beto Science and Technology Co., Ltd. (Guangzhou, China).

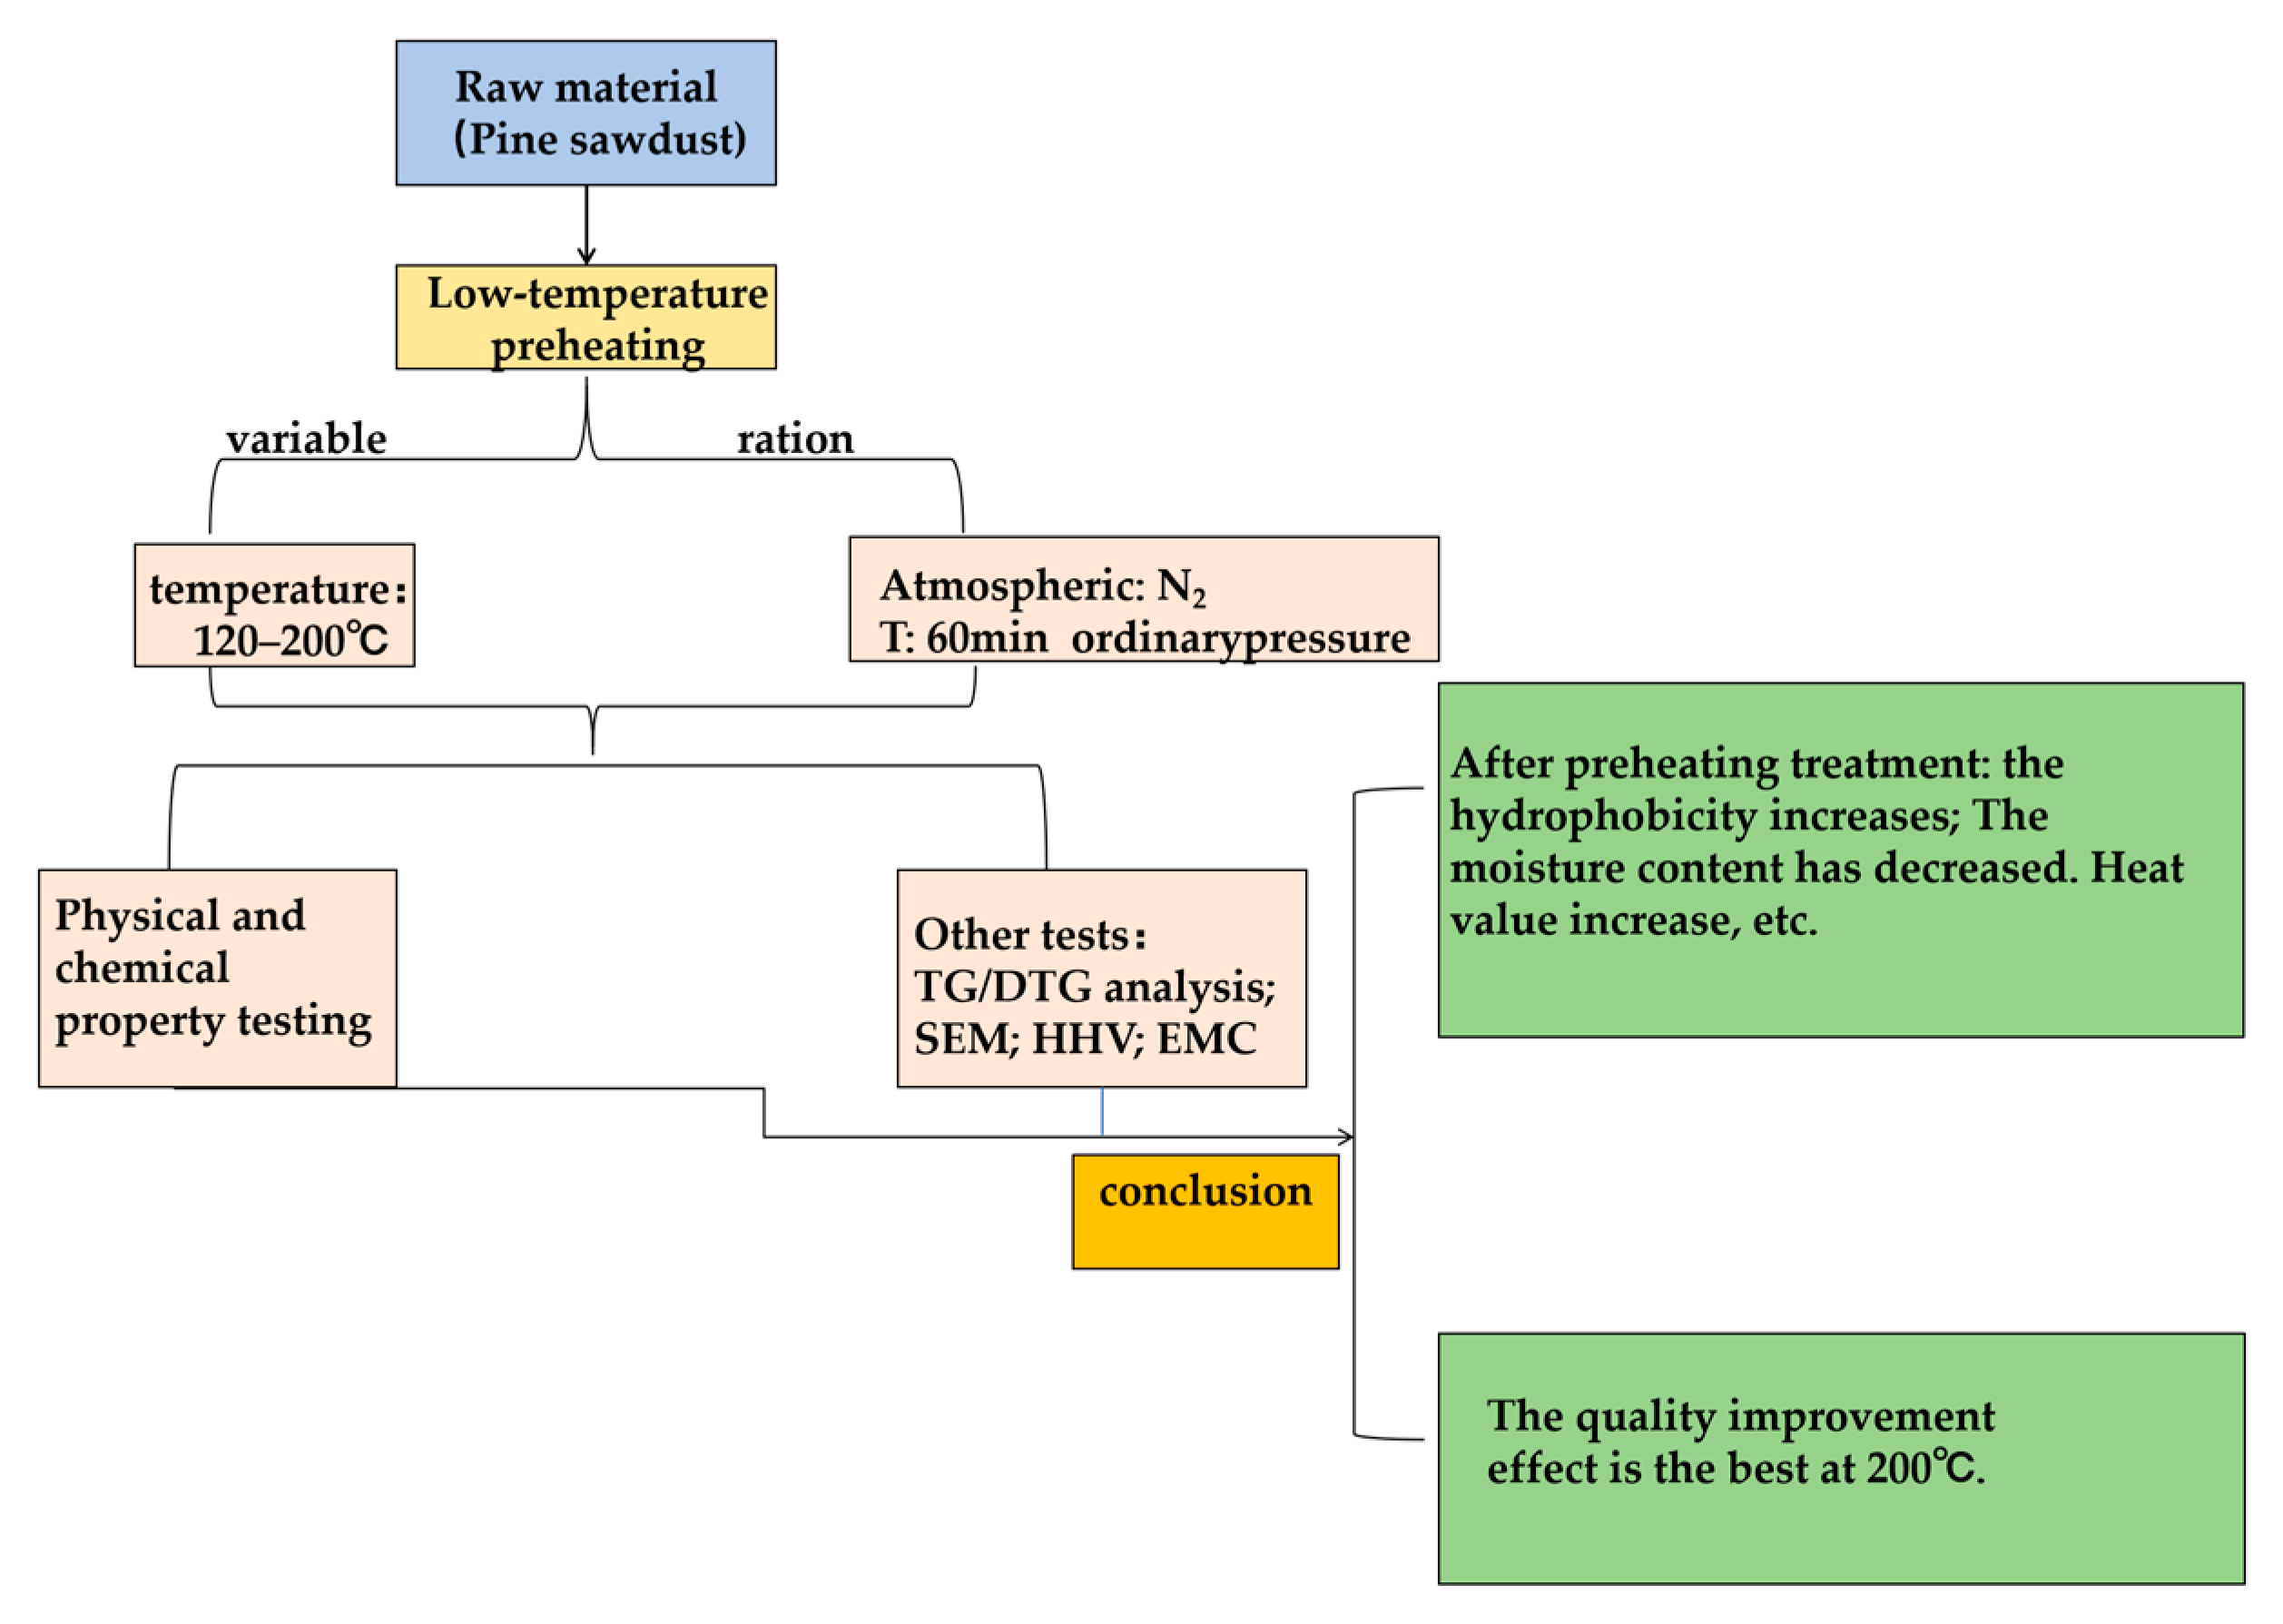
2.2. Low-Temperature Preheating Treatment of Samples

Weigh 10.00 g of prepared PS and place it in the Alumina tube, and push it into the heating zone in the middle section of the OTF-1200 X programmed heating horizontal reactor under 50 mL/min N2 atmosphere (Figure 1). The program was set to reach the target temperature T (120, 140, 160, 180, and 200 °C apply to all) at the heating rate of 5 °C/min, and kept at a constant temperature for 1 h [17]. After cooling to room temperature, the PS was put into sealed bags and stored in the dryer for subsequent experiments and characterization

2.3. Test and Characterization of PS

2.3.1. Detection of Physical and Chemical Properties of PS

  • Industrial Analysis and Elemental Analysis
The industrial analysis was carried out according to the “Solid Biomass Fuel Industrial Analysis Method (GB/T28731-2012)” [18], in which the fixed carbon mass fraction was calculated by difference subtraction. The C, H, and N mass fractions of the PS were measured by the element analyzer, and the O mass fractions were calculated by the difference subtraction method.
  • Component Analysis
According to the standards of the National Renewable Energy Laboratory (NREL) of the United States, the mass fractions of lignin, cellulose, and hemicellulose in the PS particles were determined by the template washing method.

2.3.2. Detection of PS Characteristics

  • Color Change
The color change was evaluated based on the CIE Lab color system [14], where L* represents the black and white axis. For black, L* = 0, and for white, L* = 100; a* indicates the red–green color (positive values to red and negative values to green), and b* indicates the yellow–blue color (positive values to yellow and negative values to blue). The total color change is in accordance with Equations (1)–(4) [15]:
Δ E * = [ Δ a * 2 + Δ b * 2 + Δ L * 2   ]
Δ a * = a f * a i *
Δ b * = b f * b i *
Δ L * = L f * L i *
where i represents the initial value before processing and f describes the final value after processing.
  • Thermogravimetric Analysis
A thermogravimetric analysis was conducted using a synchronous thermal analyzer. The N2 flow rate was 20 mL/min [19]. The pyrolysis temperature of the PS was raised from room temperature to 900 °C at a heating rate of 20 °C/min, and then cooled naturally. To better analyze and evaluate the pyrolysis characteristics, three concepts, namely the comprehensive pyrolysis index (CPI), volatile matter removal index (Ddev), and pyrolysis stability index (Rw), were introduced [20]. The calculation formulas are as follows (5)–(7) [21]:
CPI = dw / dt max × dw / dt mean × V T s × T max × T 1 / 2  
D dev = dw dt max T s × T max × T 1 2
R w = 8.5875 × 10 7 × dw / dt max T s × T max
where TS is the initial precipitation temperature of volatiles, °C; (dw/dt)max is the maximum weight loss rate of volatiles, %/min; Tmax is the peak temperature corresponding to (dw/dt)max, °C; (dw/dt)mean is the average weight loss rate of volatiles, that is, the ratio between the percentage of weight loss during pyrolysis and the pyrolysis time, %/min; V is the maximum weight loss rate of pyrolysis, %; ΔT1/2 is the temperature interval corresponding to (dw/dt)/(dw/dt)max = 1/2, that is, the half-peak width of the DTG peak, °C.
  • Calorific Value, Energy Yield and Energy Enhancement Factor
The calculation of the calorific value adopts the equation proposed by Soria-Verdugo et al. [22].
Where HHV is expressed in MJ/Kg:
HHV = 34.9 Y C , SR + 117.84 Y H , SR + 10.05 Y S , SR 10.34 Y O , SR 1.51 Y N , SR 2.11 Y Ash , SR
In order to comprehensively evaluate the influence of low temperature preheating on biomass energy change, three evaluation indexes are calculated [23].
Y mass (   % ) = m tor m raw × 100
E F (   % ) = Q   HHV , tor m HHV , raw × 100
Y energy = Y mass × E f
where mass is the biomass mass (tor is preheating biomass; raw is dry biomass), g and QHHV is the high calorific value, MJ/kg.
  • Hydrophobic Analysis
Hydrophobicity is assessed by measuring the water contact angle (WCA) and the equilibrium moisture content (EMC) [14]. The WCA, the raw material, and the pretreated biomass are pressed and measured using the TZL-900 optical WCA instrument.
The EMC is a way to evaluate the hydrophobic properties of a sample. Take a 5.00 g sample to dry in the oven for 12 h, and then place the sample in the constant temperature and humidity box (temperature set at 30 °C, relative humidity set at 50%) for more than 15 d. Then the sample is taken out and dried in the oven at 105 °C for 4 h, and the humidity content of the sample obtained at this time is the EMC of the experimental sample at this temperature and humidity. The calculation formula is as follows:
η EMC = m f m d m d × 100 %
where ηEMC is the sample equilibrium moisture content, %; mf is the mass of the sample after water absorption, g; and md is the mass of sample after drying, g.
  • SEM Analysis
The surface morphology and internal structure of the PS were photographed with magnifications of 750 nm, 500 nm, 1 μm, 10 μm, 20 μm, and 100 μm, respectively.
  • (FT-IR) Analysis
The sample was analyzed by Nicolet iS50 Fourier Infrared Spectrometer, Thermo Fisher Scientific (Waltham, MA, USA), and measured by the attenuated total reflection technique (ATR), in which the data interval was 0.482 cm−1, the scanning times were 16, and the resolution was 4.
  • Research Roadmap
The research roadmap (Figure 2) follows the design of the scientific paradigm. It includes experiments with the preheating temperature as the variable, carried out under an inert gas atmosphere, and based on the experimental results, including elemental analysis, industrial analysis, calorific value analysis, and hydrophobicity analysis, which serve as the basis for quality improvement. Thus, a comprehensive experimental study on biomass preheating is formed. This experimental design not only achieves our experimental goal of “exploring the impact of the low-temperature preheating on the quality of PS” but links various detection experiments together, forming a closely interlinked network, which better cultivates the comprehensive capabilities of the team.

3. Results

3.1. Effect of Low Temperature Preheating on Physical and Chemical Properties of PS

The physical and chemical properties of PS treated at different low-temperature preheating temperatures are shown in Table 1. According to the industrial analysis, the moisture content of the PS gradually decreases with the increase of the low-temperature preheating temperature, and the moisture content of samples at 180 °C and higher remains basically unchanged at about 1.7%, indicating that the free water on the surface of the PS and in the pores has been dried. When the temperature is 140 °C, the change of the volatile matter is not obvious, because the lower temperature will not cause volatilization of light components in the PS. As the preheating temperature further increases to above 160 °C, the content of the volatile matter begins to gradually decrease, and the rate of decrease shows a trend of gradually increasing. From 140 °C to 160 °C, the decrease range is 0.62%, while from 160 °C to 200 °C, the decrease range is 4.24%, which is 7.12 times larger than the previous decrease [24]. This indicates that, when the temperature exceeds 160 °C, a large amount of light volatile matter has begun to be decomposed and released. The fixed carbon mass fraction showed the trend of a gradual increase, and the increase amplitude also increased; PS to PS-140 increased by 1.84%, PS-160 to PS-200 increased by 4%, an increase of 117%. This was attributed to deepening. Ash always remains in the solid product, so its mass fraction will show a relative increase with the rise of the preheating temperature [25,26].
It can be seen from the elemental analysis that, with the change in the low-temperature preheating temperature, the change law of the mass fraction of the C element is not obvious before 180 °C. When the temperature is higher than 180 °C, the mass fraction of the C element increases. Compared with the raw material (PS) without preheating, PS-200 increases by 2.42%, while the mass fraction of the O element decreases [27], from 34.80% to 31.86%, a decrease of 2.94%. This indicates that decarboxylation and carbonylation of the PS occurred during the preheating process, and H2O, CO, CO2, and some oxygen-containing carbohydrates began to be generated and spilled inside. The mass fraction of H showed a decreasing trend in general, and the maximum decrease was 0.44% at 180 °C. This indicates that, at 180 °C and higher temperatures, the hydrocarbons represented by CH4 and C2H6 in the biomass begin to form and overflow. The O/C and H/C basically showed a downward trend, which was mainly due to the removal of a large amount of water and oxygen-containing functional groups in the PS by pretreatment. On the whole, it can be considered that the fuel quality of the biomass has been improved to a certain extent after low temperature preheating.
The main components of biomass generally include cellulose, hemicellulose, and lignin [16]. According to the component analysis in Table 1, as the low-temperature preheating temperature increases, the cellulose in the biomass decreases first and then increases, and the hemicellulose increases first and then decreases. At 200 °C, the mass fraction of hemicellulose and cellulose is 7.46% and 47.14%, respectively; compared with PS, the mass fraction of hemicellulose decreases 2.68%. This indicates that, before 200 °C, a small amount of cellulose decomposition occurs in the PS. As the preheating temperature increases, the decomposition rate of hemicellulose increases slightly. Lignin is a biological polymeride [17,28]. However, with the decomposition of hemicellulose, the mass fraction of lignin is also relatively improved. The PS-200 was 4.34% higher than the PS. Congyu Zhang et al. [29] pointed out that the hemicellulose reduction and lignin increase are limited at 250 °C and lower temperatures, which can only release some water and light volatiles. Similar to the conclusion of this experiment, the change trend of cellulose and hemicellulose is inversely proportional in the range of the low-temperature preheating temperature.

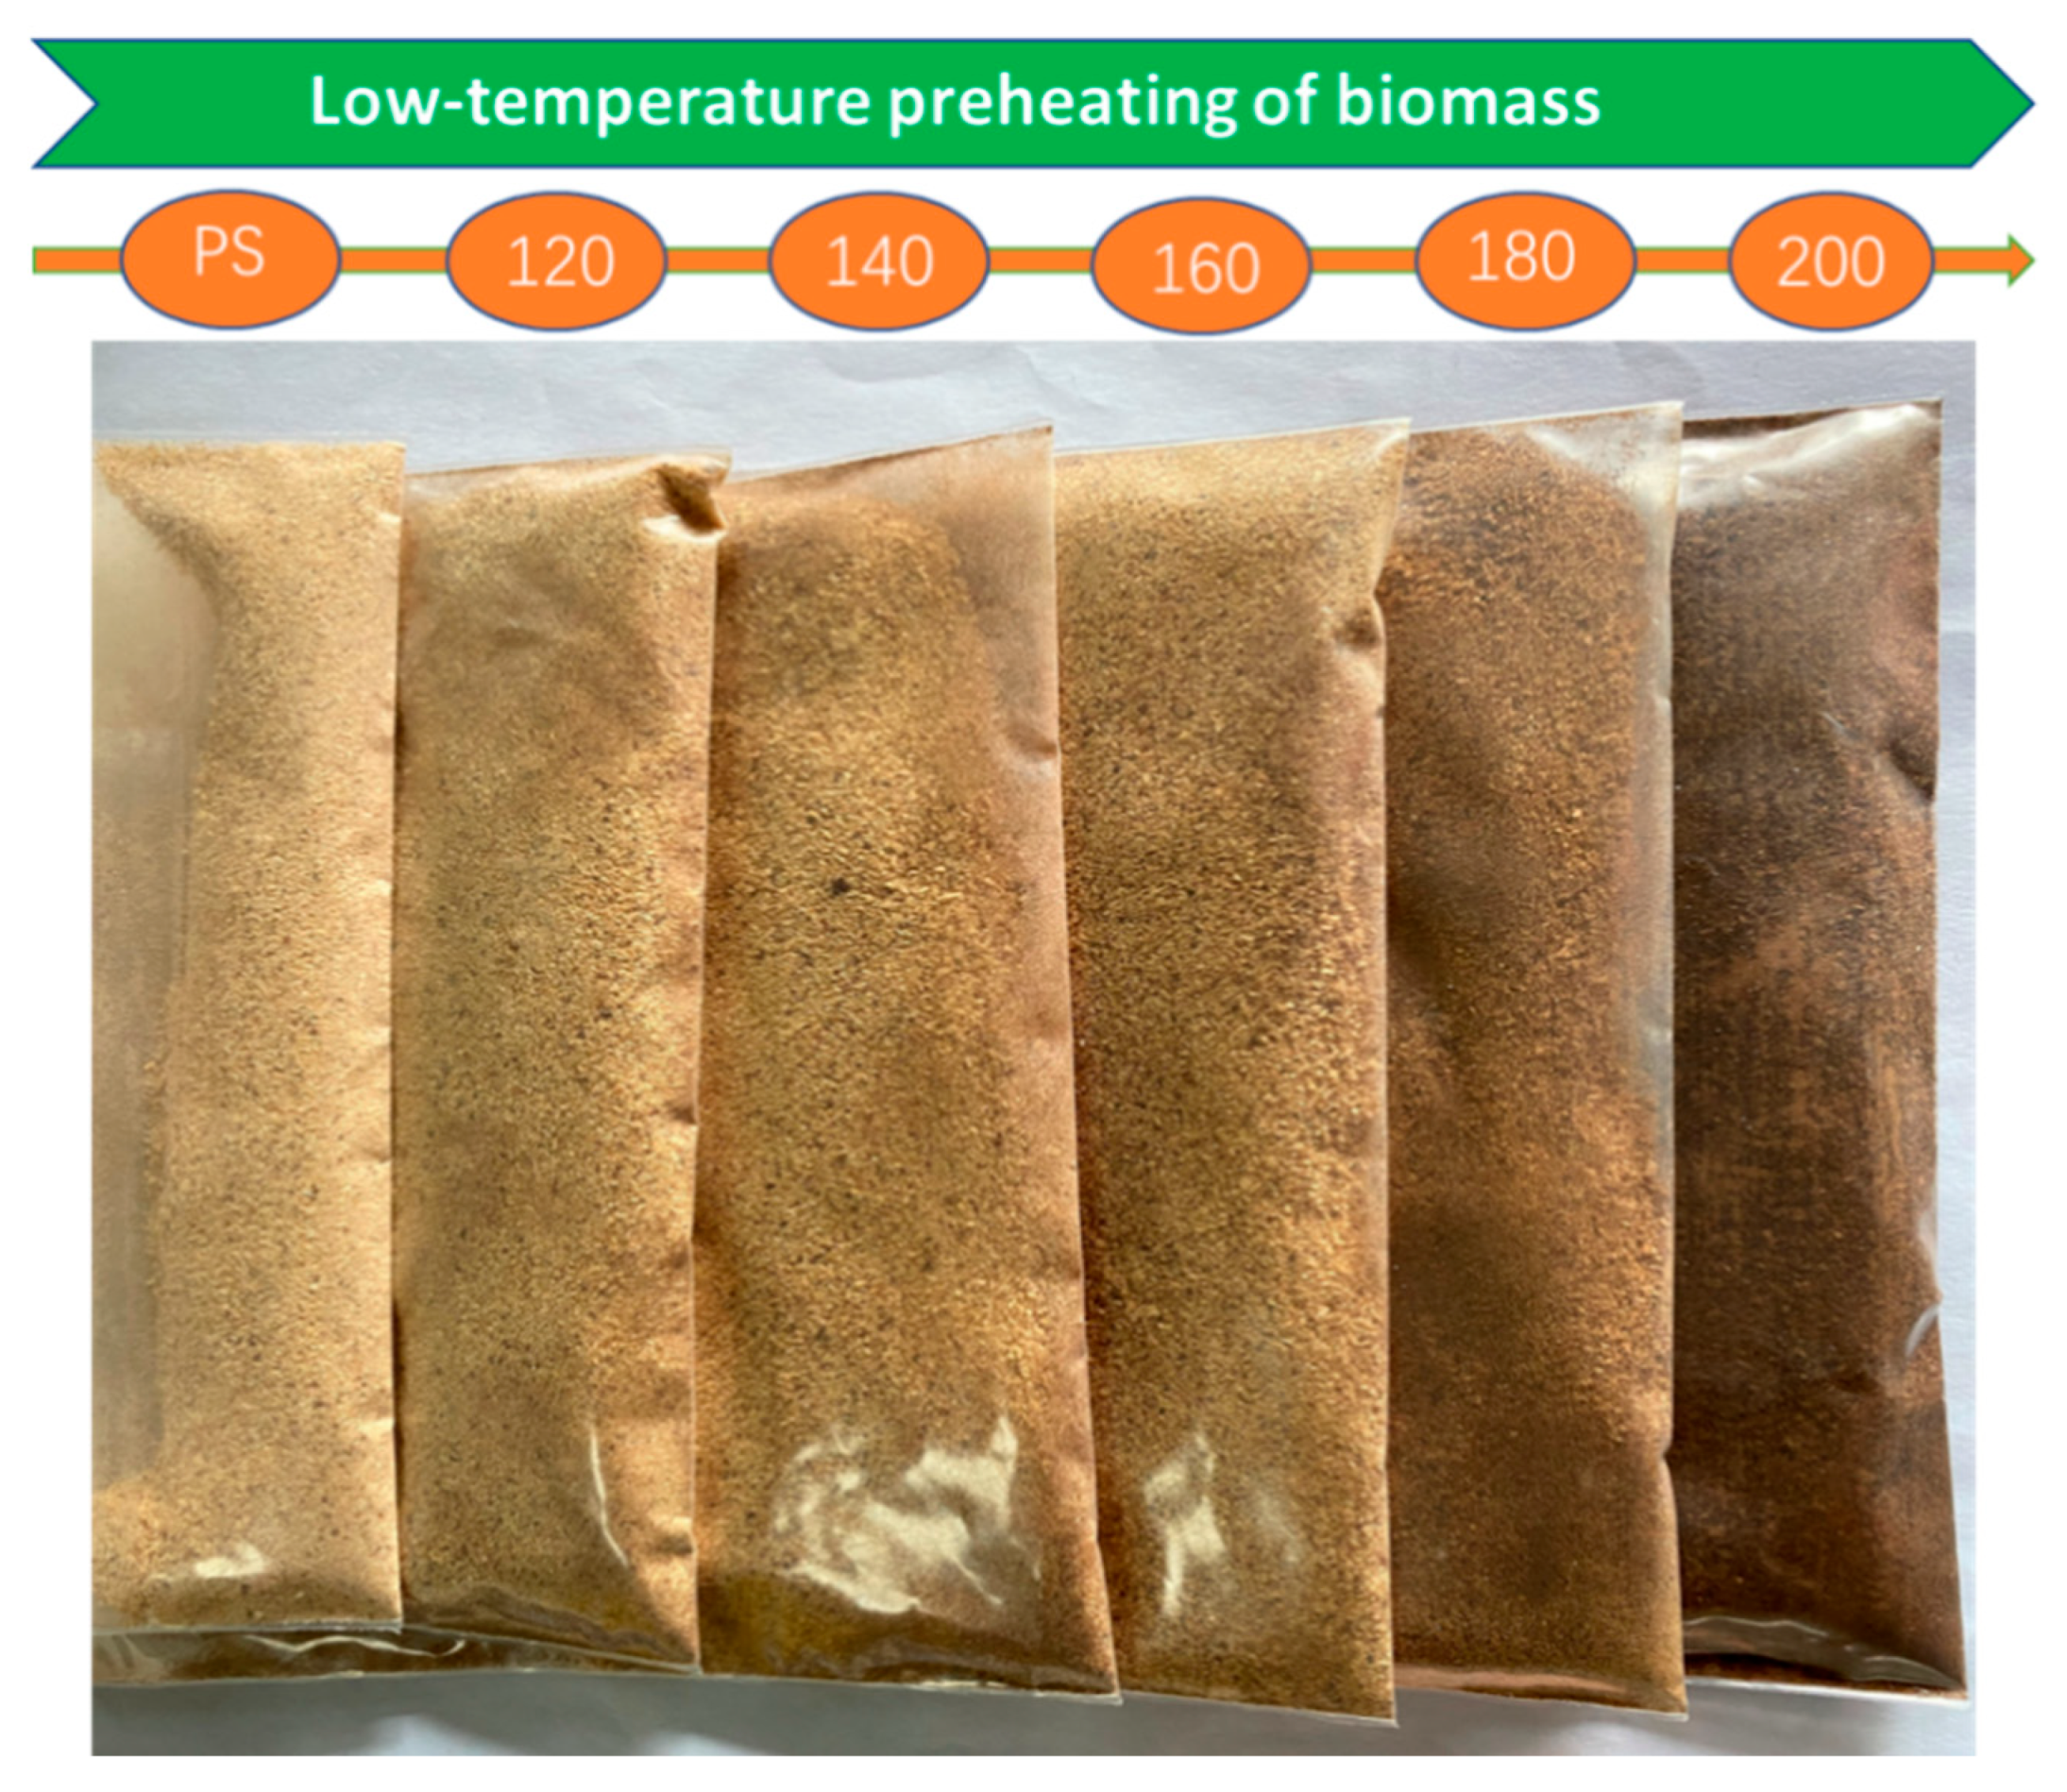
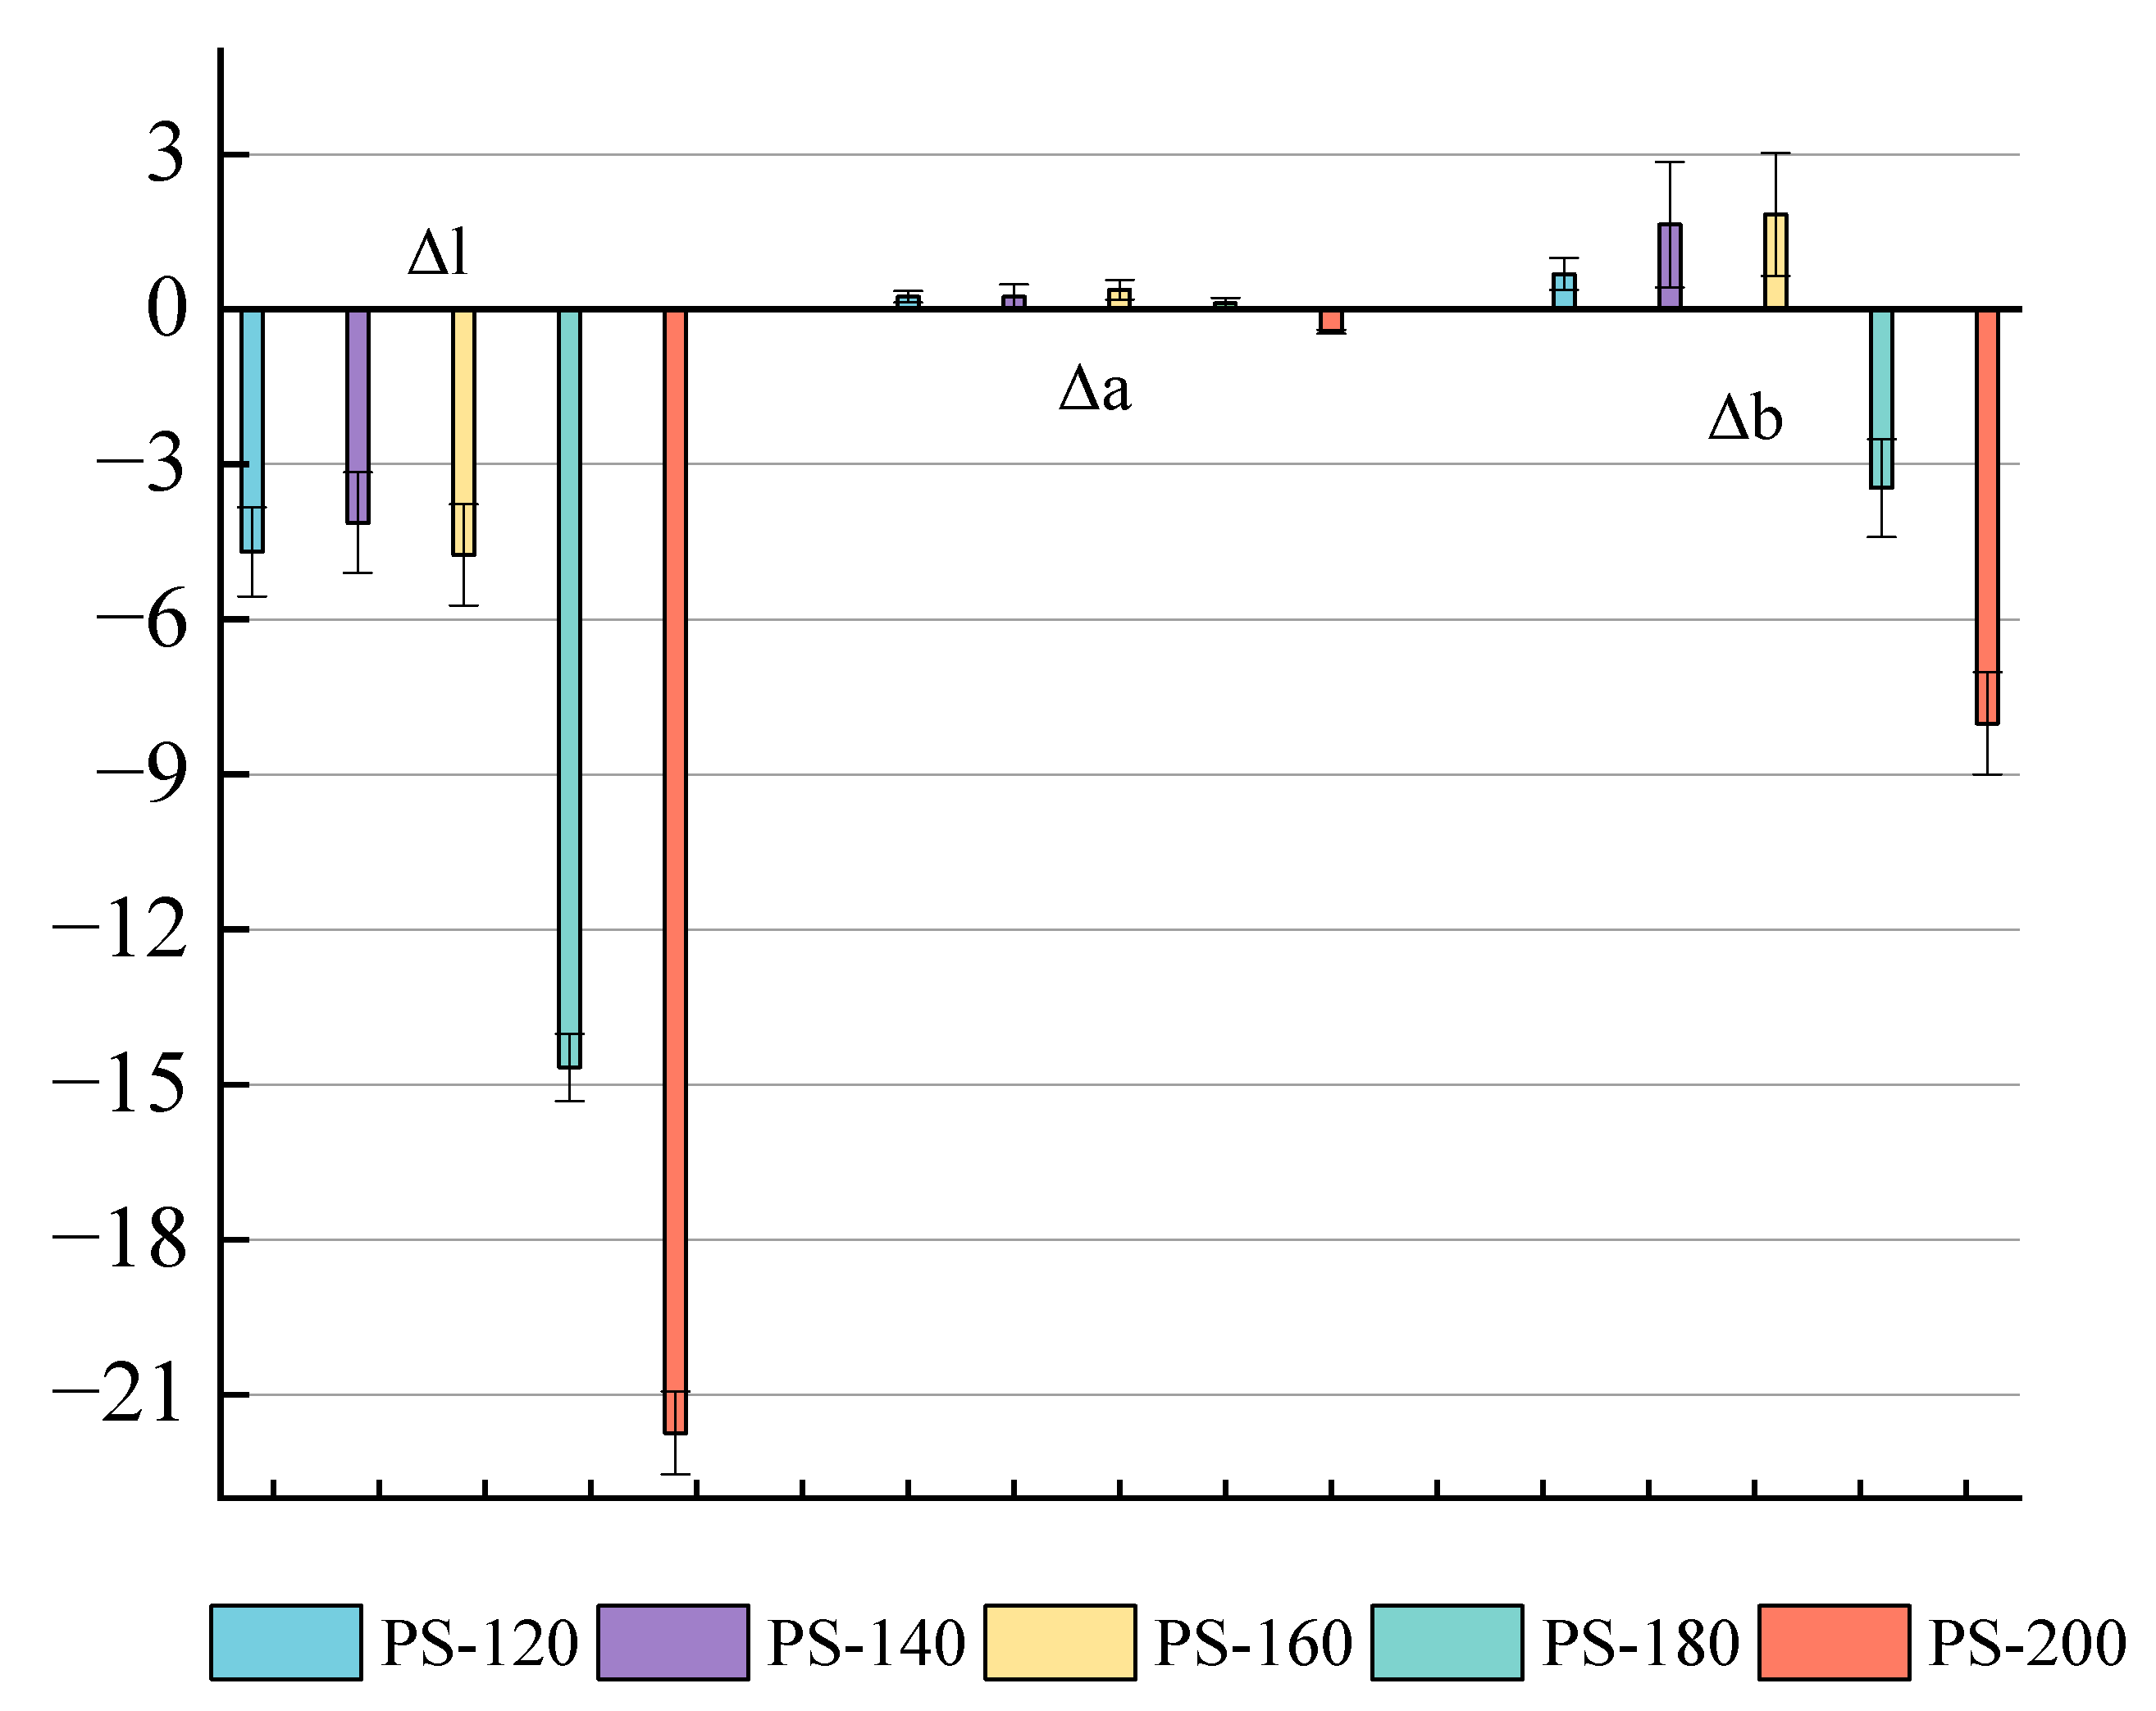
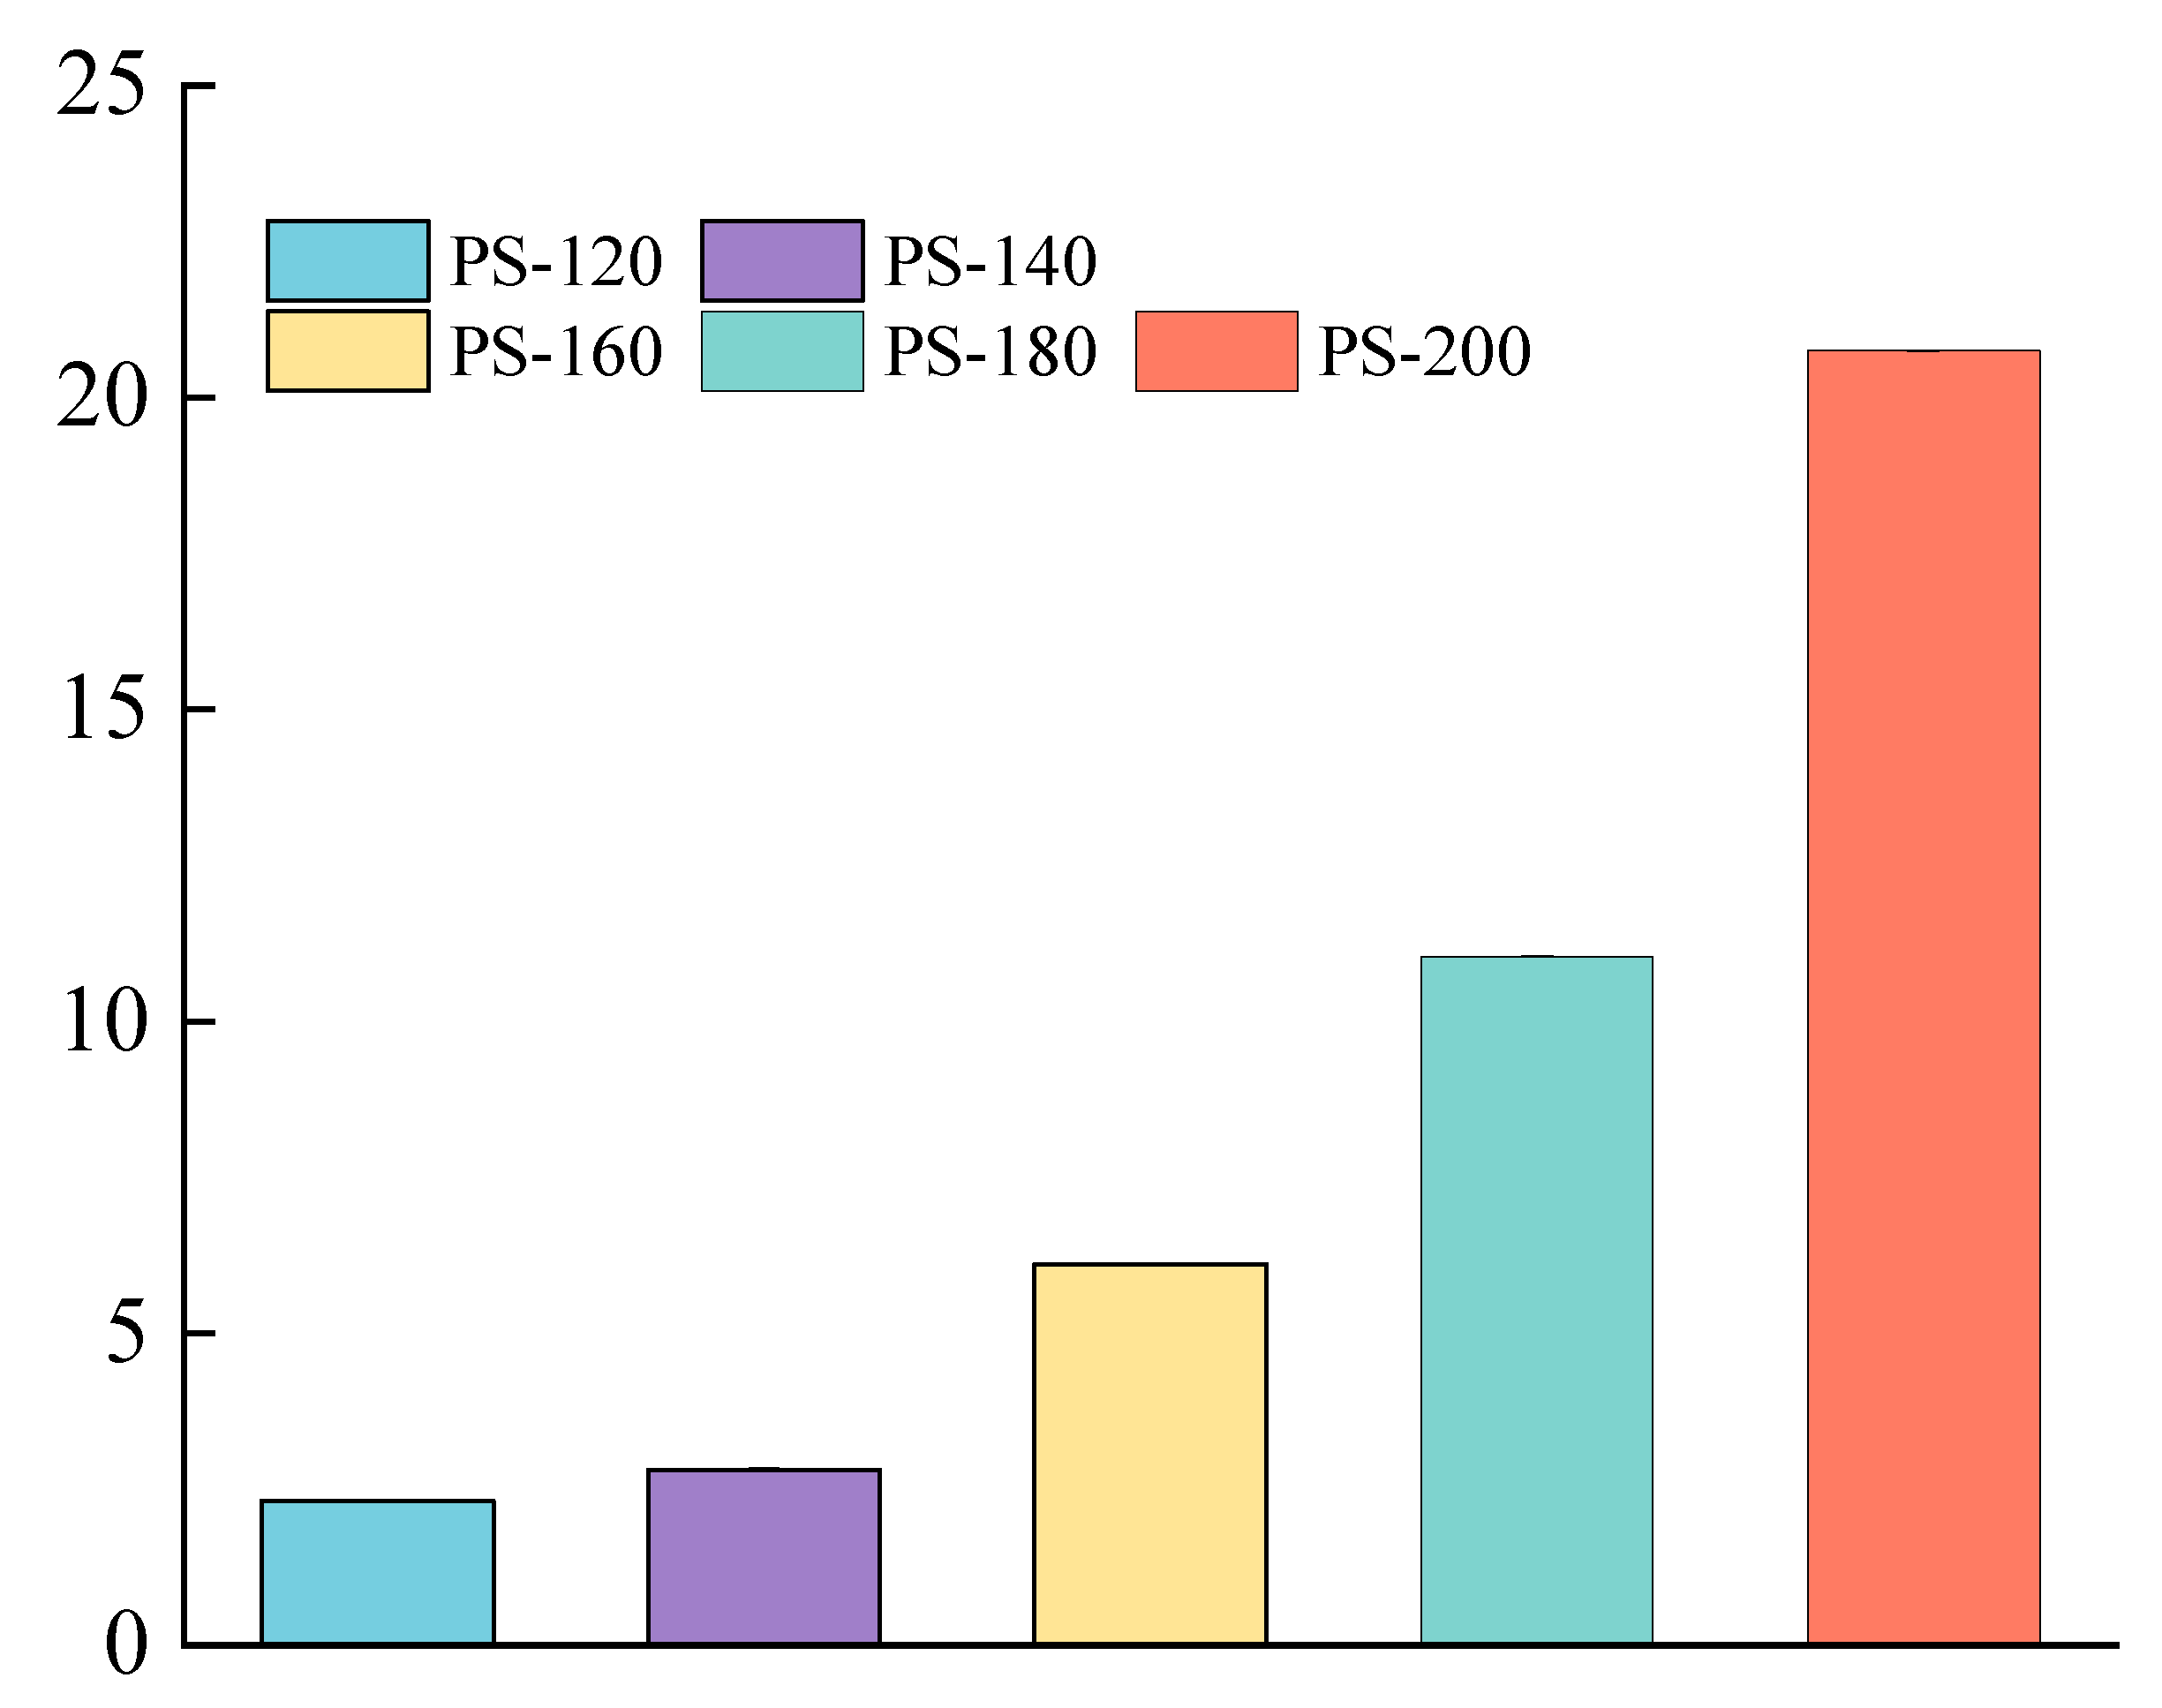
3.2. Effect of Low-Temperature Preheating on Color Change of PS

The color of natural wood is determined by the chromophores present in lignin and the extract [30]. The color changes of the PS after the preheating treatment at different temperature conditions are shown in Figure 3. The degradation of hemicellulose during the low-temperature preheating treatment produces some additional chromophores for the wood, such as quinone, and causes the color change [31,32]. As shown in Figure 4, the red chromophore index (Δa*) of the PS preheated at a low temperature was generally low, about 0.35; when the temperature was raised to 200 °C, Δa dropped to −0.46, indicating that the wood has a slightly greenish and less red hue at this time. Before 160 °C, the yellow chromaticity index (Δb*) gradually increased from 1.64 at PS-120 to 1.84 at PS-140, indicating that the yellow hue gradually increased; however, after 140 °C, the Δb value drops sharply to −3.46 at PS-160, indicating an increase in blue tone, and the overall hue tends to blue–black with the absence of a yellow tone at 200 °C [33]. The decrease in the brightness and color of wood during heat treatment are mainly related in [31]. The ΔL* values are all negative and the values gradually increase, from 4.69 (PS-120) to 21.74 (PS-200), which means that the wood becomes darker, the black tone increases, and the brightness decreases during the preheat treatment, Sivrikaya and Esteves et al. [31,34].
As can be seen from Figure 5, with the increase of the preheating temperature, the total color difference ΔE* shows an upward trend, and the increase rate becomes larger after 160 °C. From the PS-140 to the PS-160 stage, the ΔE* value increases from 2.82 to 6.11, with an increase of 116.67%; while from the PS-180 to the PS-200 stage, the ΔE* value rises from 11.06 to 20.75, with an increase of 87.61%. This change indicates that the color of the wood gradually darkened during the heat treatment with the increase of the preheating temperature, which was mainly attributed to the hemicellulose degradation products, the change of extract composition, and the formation of oxidation products. In addition, the caramelization of soluble sugar induced by the heat treatment will form an oil layer on the surface of the wood, further deepening the color change. Sivrikaya et al. pointed out that the chromosphere structure generated by the hydrolysis reaction is also an important factor leading to the color change of the wood. These phenomena further verified the accelerated decomposition of hemicellulose after 160 °C [31].

3.3. Effect of Low-Temperature Preheating on Physicochemical Properties of Biomass

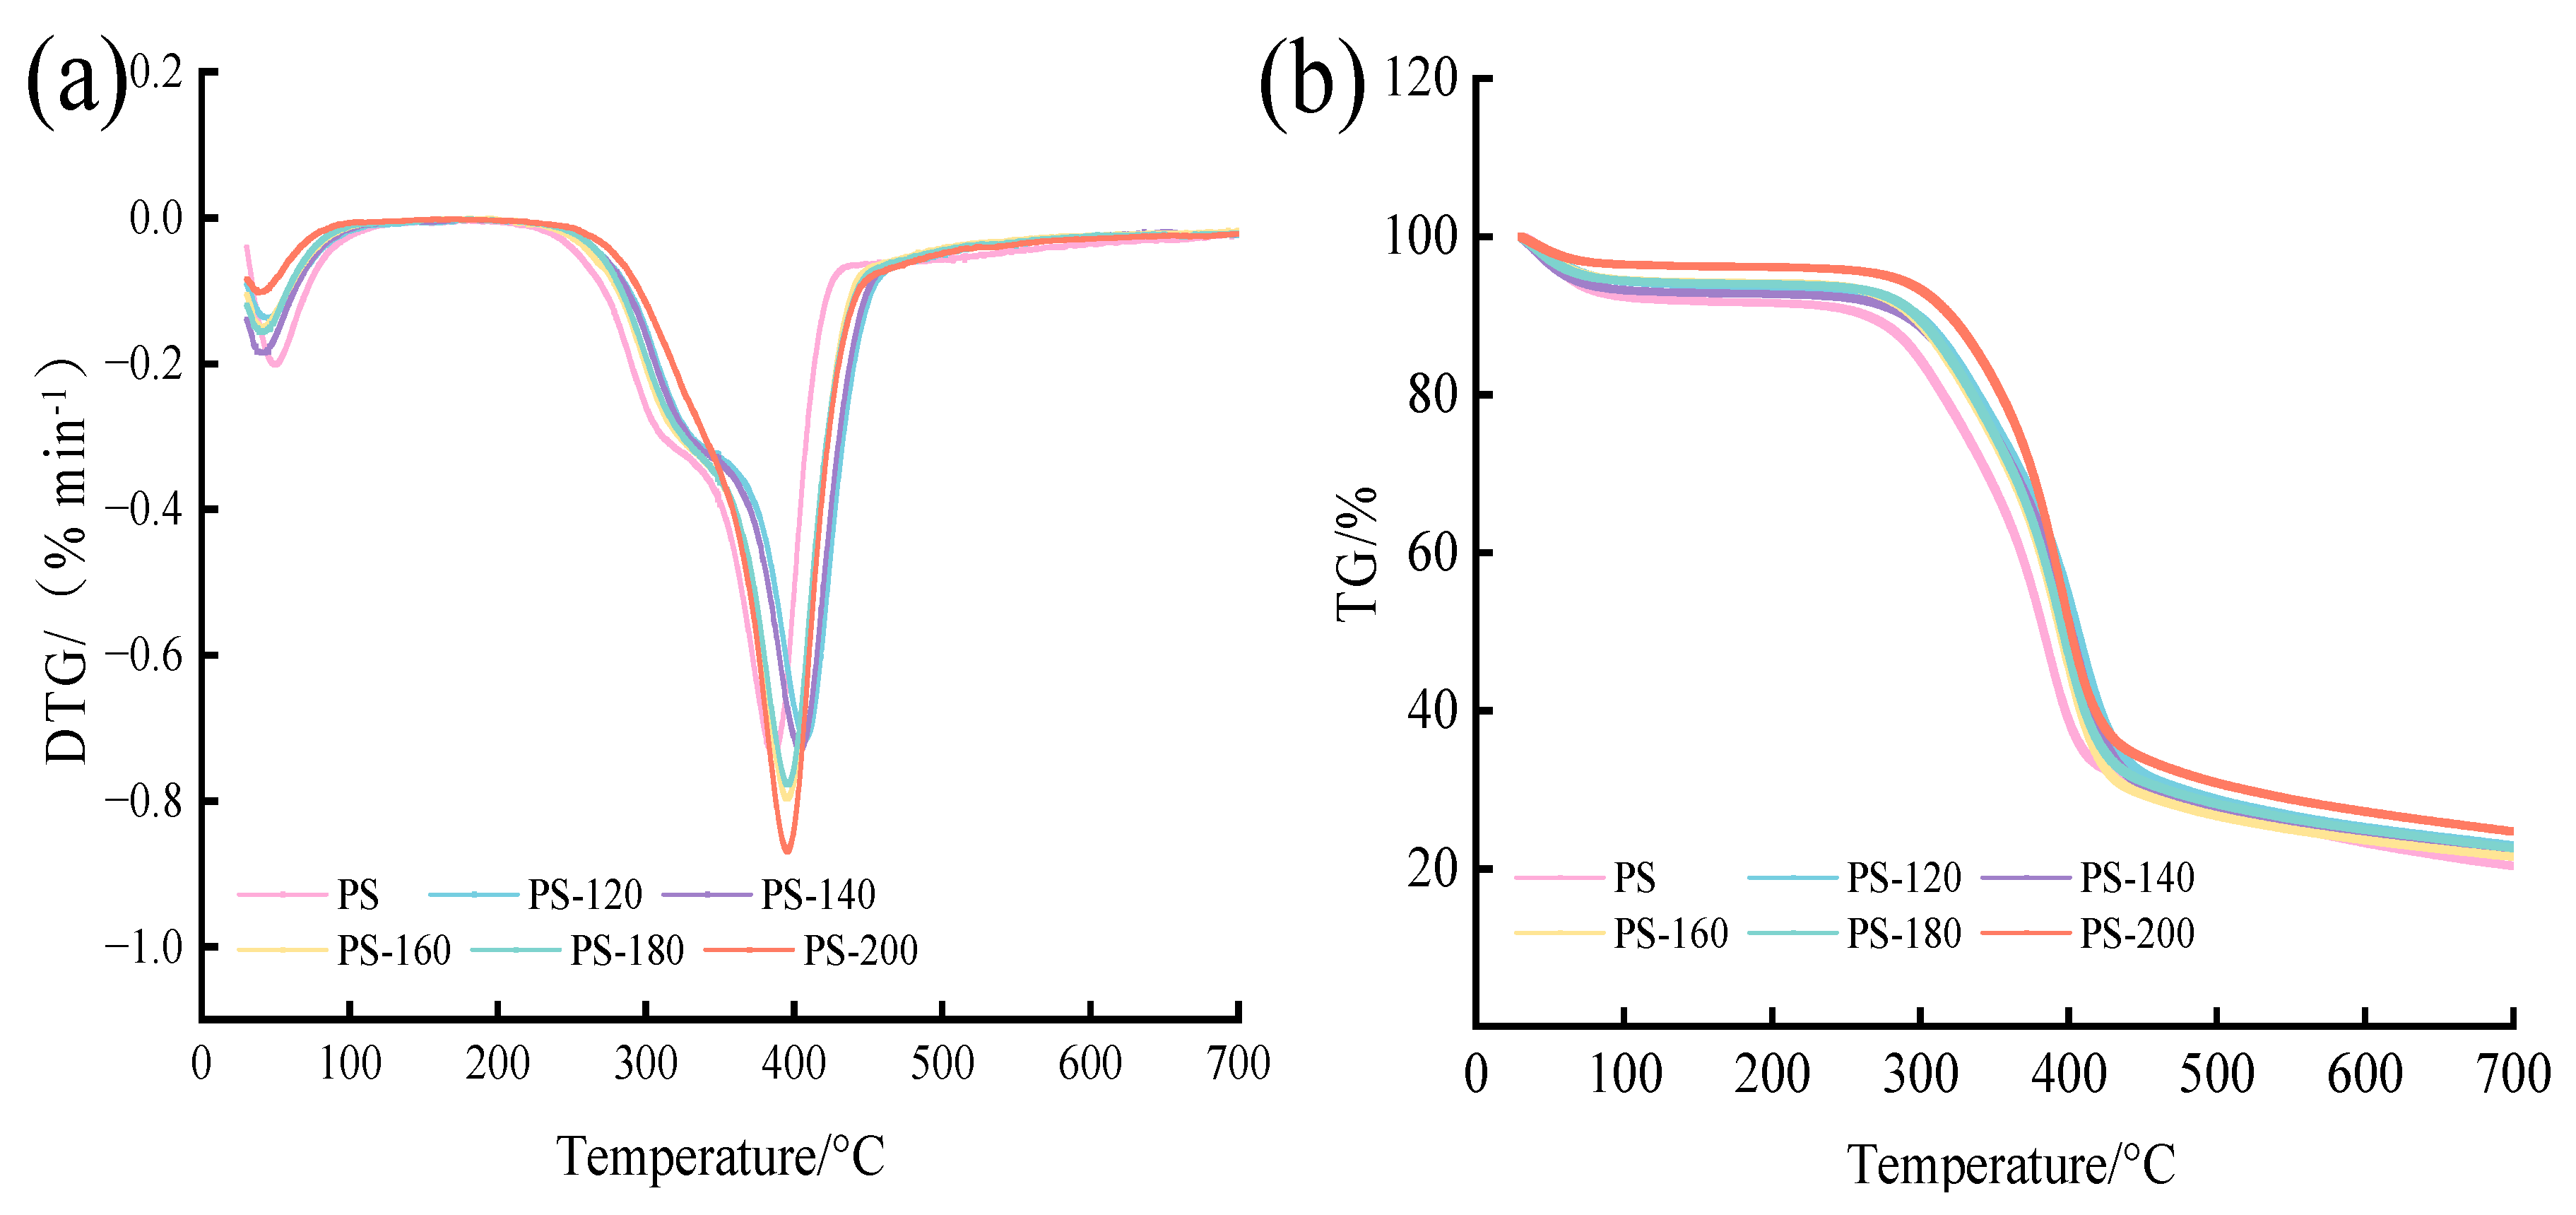
3.3.1. Thermal Analysis by TG and DTG

The TG/DTG curves of the raw materials and the PS preheated at different temperatures are shown in Figure 6. According to DTG image (a), the first drop occurs below 200 °C, with an obvious weight loss peak. This stage is mainly the dehydration stage, and the water mainly comes from the raw material itself [28,35]. The weight loss rate of the PS without the preheating treatment is the largest, indicating that, compared with the preheating treatment, the PS moisture content is the highest, and the free water is mainly lost in the temperature range below 100 °C. Above 105 °C, free water, bound water, and cell cavity adsorption water are continuously lost. The second decline peak occurred between approximately 230 and 500 °C; at this stage cellulose and hemicellulose decomposition mainly occurs, and some experts have pointed out that the maximum weight loss peak of PS preheated at different temperatures occurs between approximately 385 and 410 °C, the maximum weight loss rate reached is 48.09~55.29%, cellulose decomposition occurs between approximately 230 and 450 °C, hemicellulose decomposition occurs between approximately 170 and 340 °C, while lignin thermal decomposition occurs at a temperature of more than 500 °C [34,36]. The thermogravimetric curves (b) of the samples in each treatment group showed similar characteristics. Before the preheating temperature was 180 °C, there was obvious acromion of hemicellulose, indicating that the pyrolysis of hemicellulose occurred. When there was no obvious acromion at PS-200, it indicated that the pyrolysis of hemicellulose was complete and the cellulose content was relatively increased. In this stage, the decomposition of cellulose mainly occurred, so the weight loss rate of PS-200 was the highest, which was 0.87 %/min−1 [37]. Finally, when the temperature reaches 700 °C, weight loss no longer occurs, indicating that the reaction is basically completed. At the end of the 800 °C program, the residue of the remaining amount is the least of the PS without the low-temperature preheating treatment, which is 17.65%, and the residue of the remaining amount of PS-200 is the most, which is 21.85%, indicating that the mass fraction of the residual residue in the crucible increases with the increase of the preheating temperature. This is because the absolute content of ash of the same raw material is basically the same, but with the increase of the preheating temperature, the mass of its preheating solid product is smaller [38].
Table 2 lists the pyrolysis parameters of different samples [39]. The initial temperature of the PS after the low-temperature preheating is lower than that of the untreated raw material (PS), mainly due to the fact that some light volatiles which are easily removed are retained when the temperature is lower, and these substances are decomposed when the temperature is increased. Alkali metal elements K, Ca, and Mg, among other elements in ash have catalytic effects on pyrolysis, resulting in low decomposition. By comparison, the CPI of the PS preheated above 140 °C is higher than PS, indicating that the 160 °C and higher low-temperature preheating treatment can improve the pyrolysis performance of PS. However, the CPI is related to the maximum degradation rate, and the degradation rate of PS-200 is 0.87 %/min, which is 0.13 %/min higher than PS, because the low-temperature preheating treatment causes the hemicellulose and cellulose of the PS to decompose. According to Table 1, compared with PS-180, the cellulose and lignin of PS-200 increased by 0.67% and 3.46%, respectively, and the hemicellulose decreased by 3.64%. The results indicated that the decomposition reaction occurred in PS at 180 °C, which further proved that the low-temperature preheating treatment could promote the degradation of hemicellulose and cellulose.
The Ddev index of all samples was higher than that of the untreated PS with the increase of preheating temperature, which indicated that increasing temperature was conducive to the devolatilization of biomass products. Meanwhile, the pyrolysis benefited from a faster heating rate, and the volatiles were more easily released. At 200 °C, both the Ddev index and the Rw index increase to the maximum, which are 15.50 and 815.80, so PS-200 has better pyrolysis performance and stability [19,35].

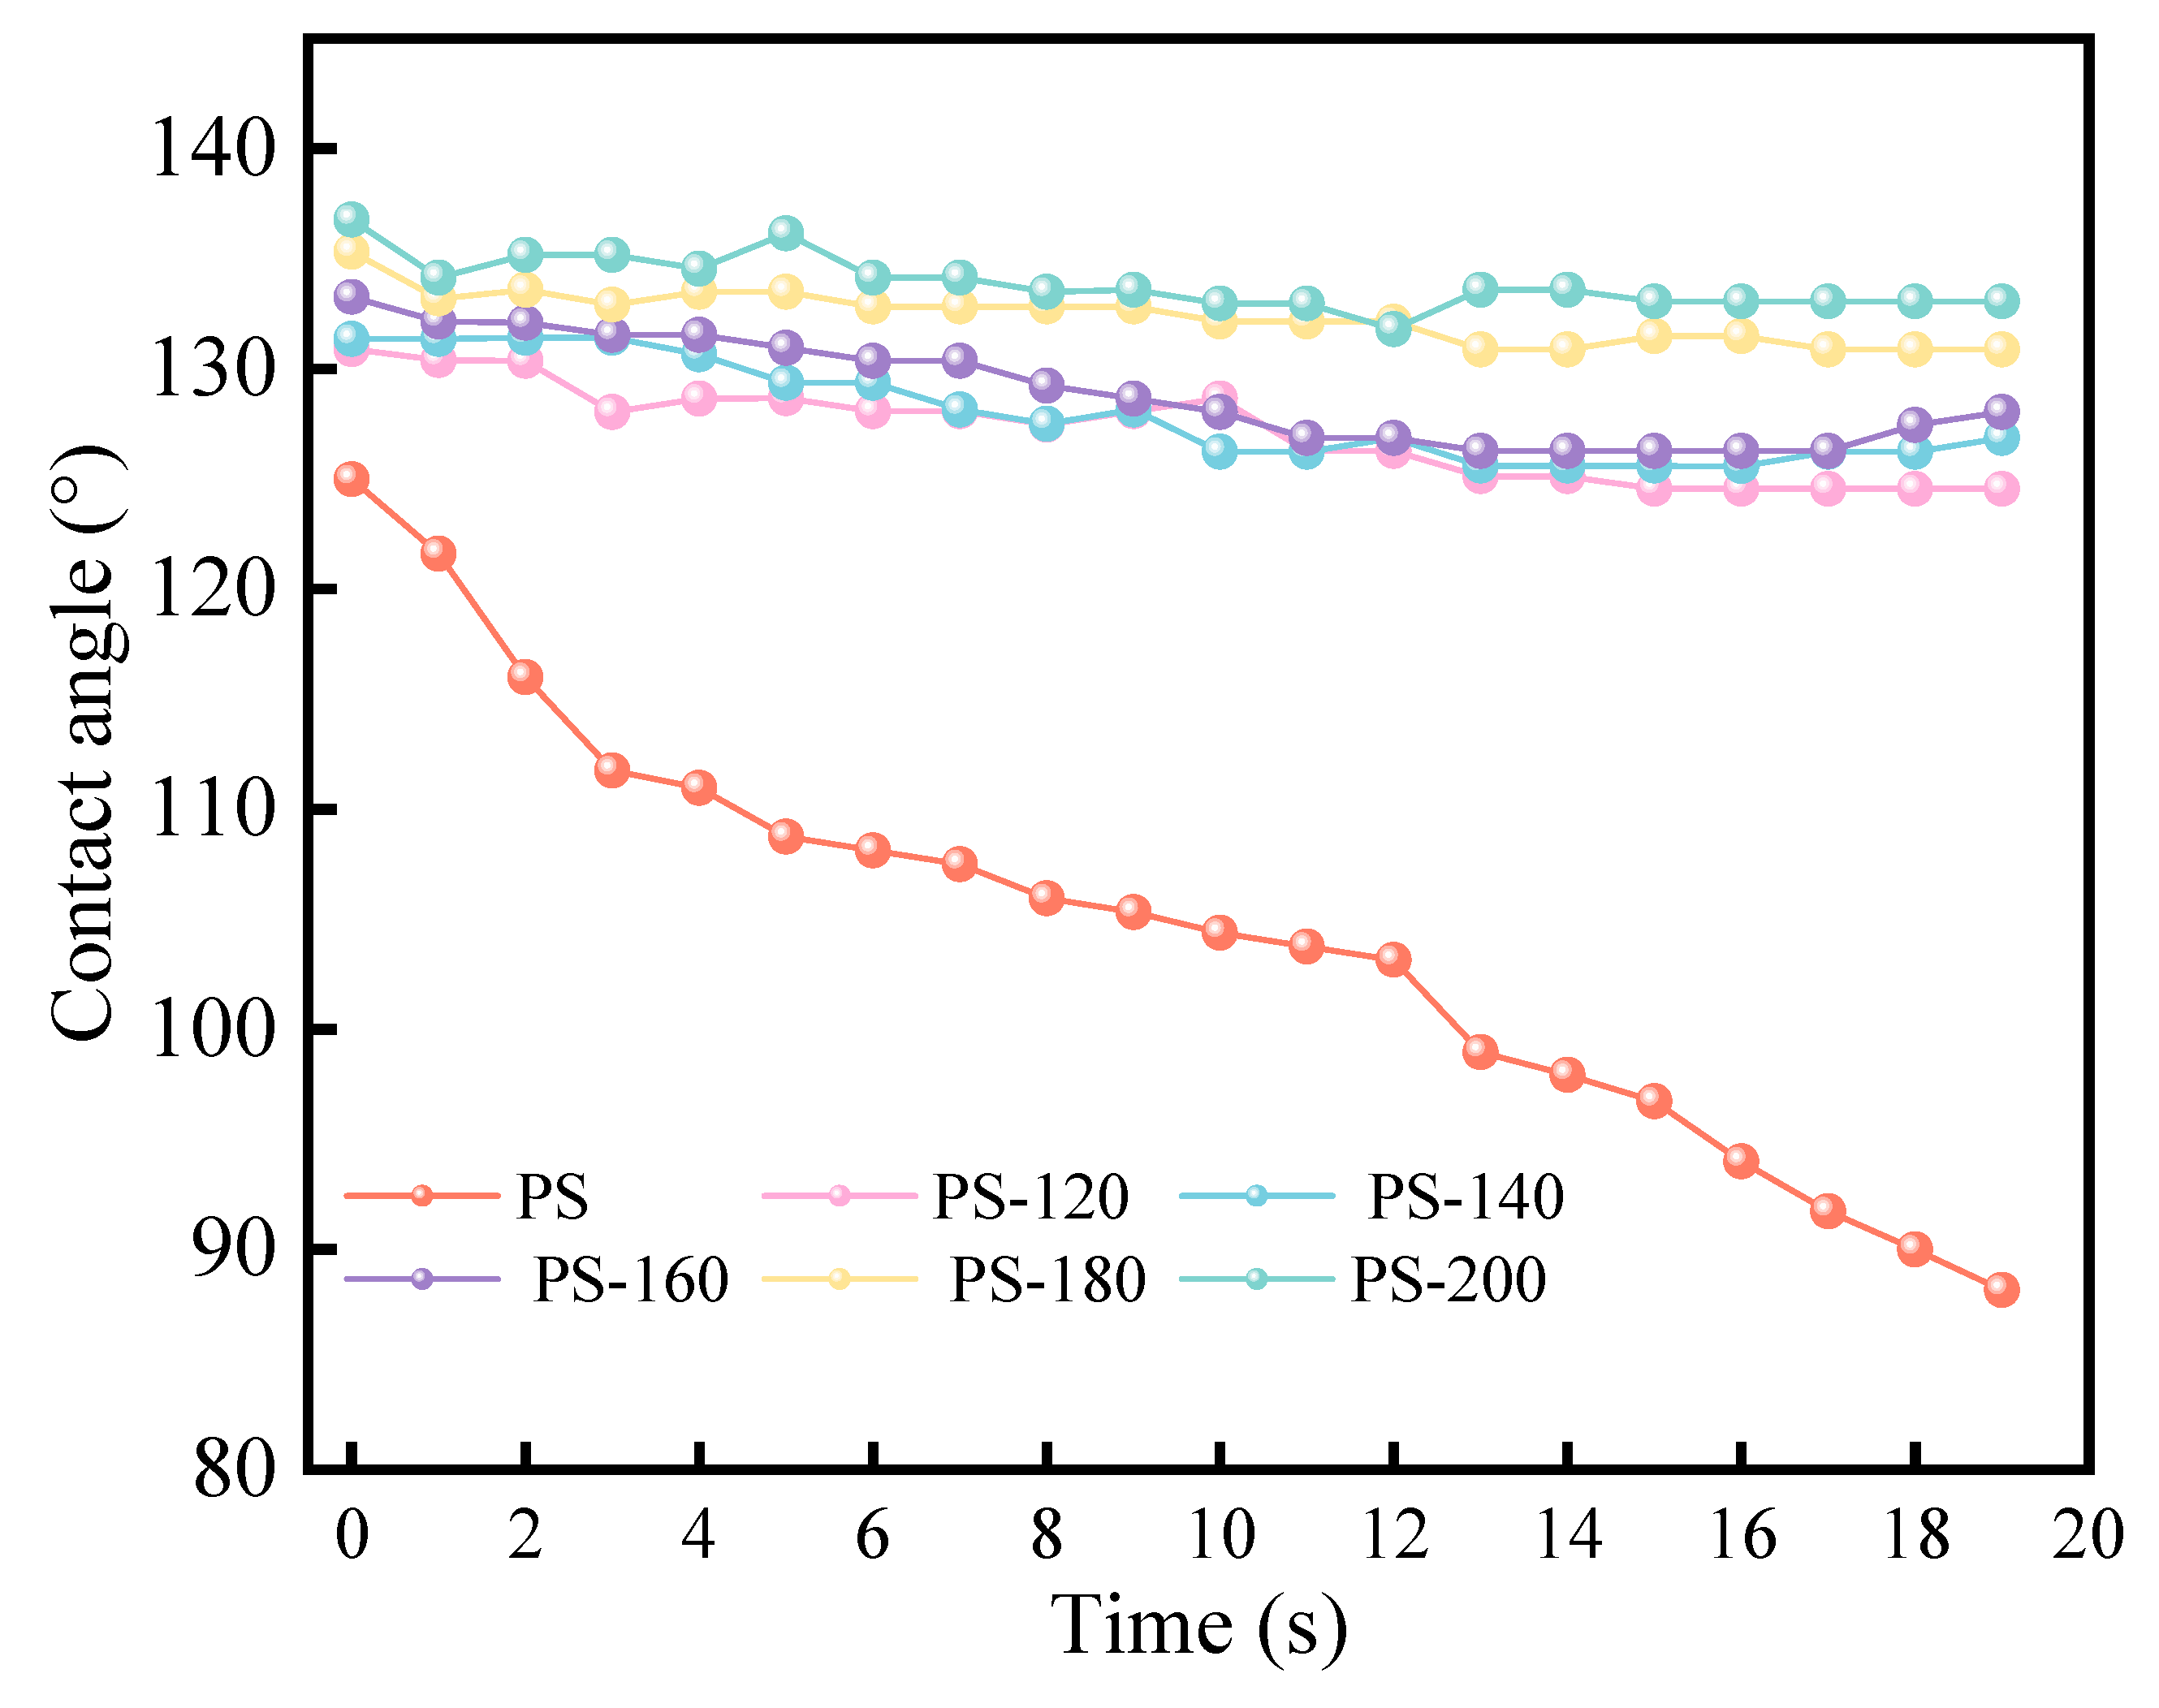
3.3.2. Calorific Value, Energy Yield and Hydrophobicity Analysis
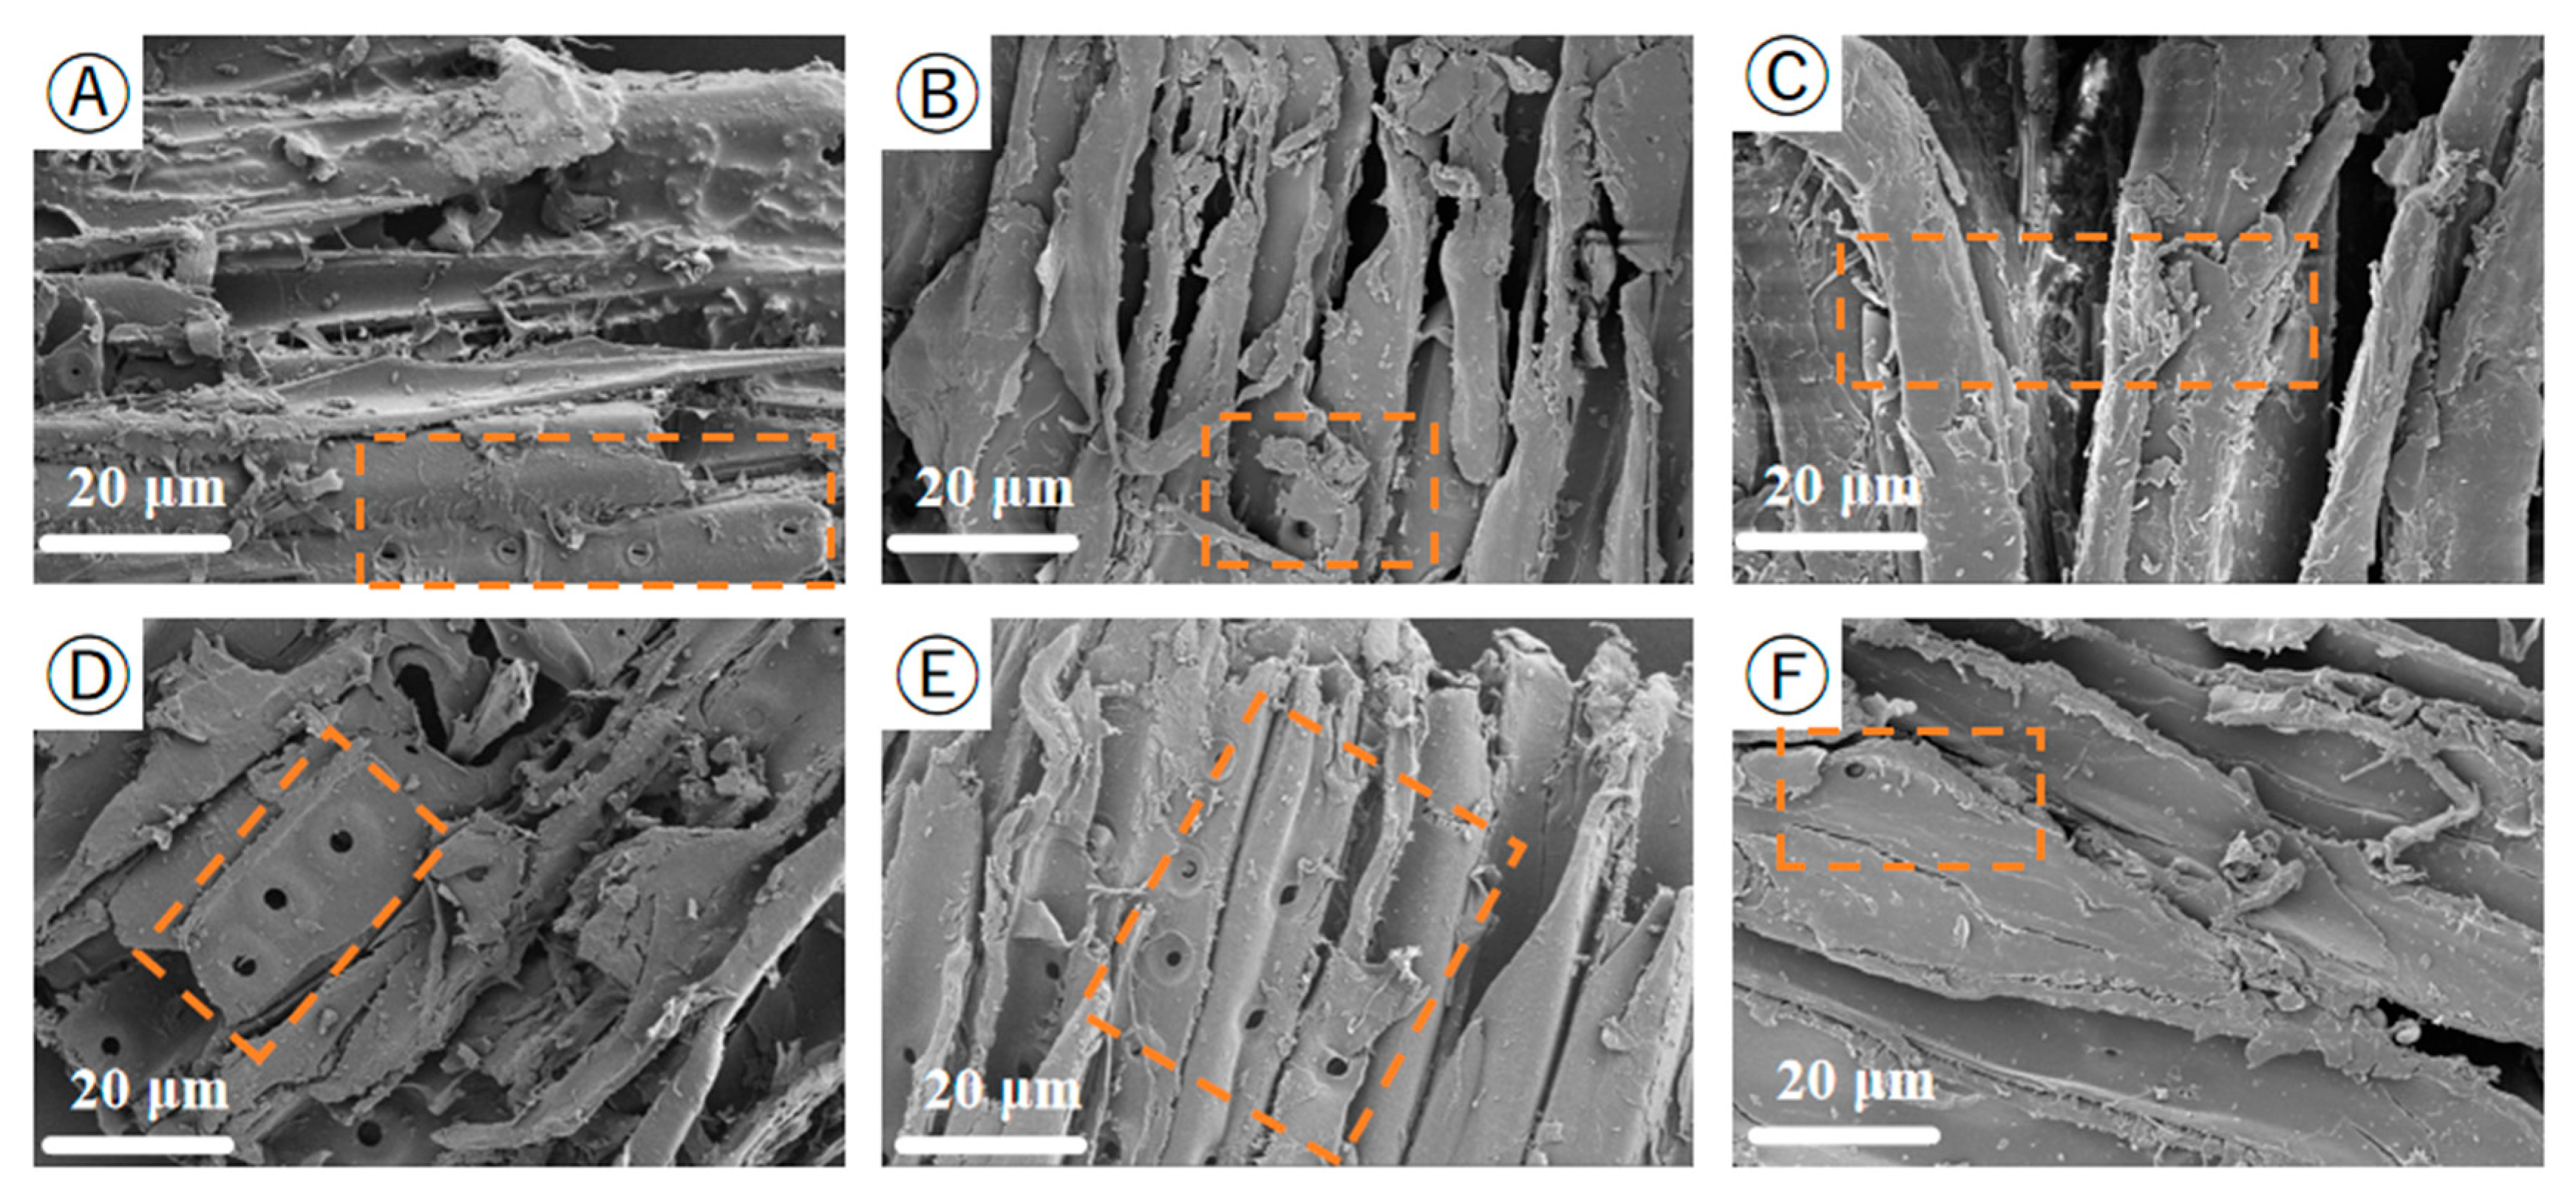
Table 3 lists the solid yield, energy yield, and energy enhancement factor of PS during the preheating process. It can be seen that the preheating pretreatment can effectively increase the high calorific value (QHHV) of the biomass [40]. With the increase of the preheating temperature, the calorific value of the biomass increased from 18.26 MJ/kg (PS) to 19.58 (PS-180), an increase of 7.20%, and basically remained unchanged after 180 °C. This is because, with the increase of the preheating temperature, a large number of volatiles were removed, the fixed carbon content increased, and the O/C ratio in the product decreased. The solid yield of the PS gradually decreased from 100% (PS) to 85.62% (PS-200), and the decrease was increased to 2.56% after 180 °C, mainly due to the decomposition of hemicellulose and cellulose. With the increase of the preheating temperature, the energy enhancement factor reached a maximum of 1.07 (PS-180), an increase of 6.54%, which is because the preheating temperature is below 200 °C, the internal water content of the PS after drying is reduced, so the internal decomposable components are limited in the preheating process, and the overall weight loss rate is small, so the solid yield is as high as 85%. At the same time, about 94% of the energy inside the biomass was retained.
Hydrophobicity is mainly related to surface polarity and surface pore structure, among which surface polarity is the main factor [30,41]. The water absorption capacity of the biomass depends on the content of cellulose, hemicellulose, and lignin. Combined with Table 1 and Table 3, it can be seen that, with the increase of the preheating temperature, the cellulose content of PS has a similar change trend and, at the same time, the hydrophilic groups, such as the carboxyl groups, are removed, resulting in an obvious decrease. Table 3 lists the EMC of the PS treated with different preheating conditions under the same temperature and humidity conditions [42]. The results show that the preheating temperature is inversely proportional to the equilibrium moisture content of the product. Below 140 °C, the equilibrium moisture content decreased from 7.06% to 6.24%, with a decrease of 11.61%. At this time, the hemicellulose decomposition was limited at a low temperature, and the hydrophobicity improvement was limited. When the temperature rose to 200 °C, the equilibrium moisture content decreased to 4.46%, a decrease of 36.83%, indicating that cellulose decomposition destroyed the cell structure of the PS and blocked the passage [43]. In addition, the pores created by cellulose decomposition are small and unevenly distributed, further reducing the amount of water absorption. As a biomass skeleton, the decomposition of cellulose not only changes the pore structure, but reduces the water adsorption site by breaking the continuity of the cell wall, thus improving the hydrophobic performance.
Meanwhile, a WCA higher than 90° is associated with a hydrophobic surface, while a WCA less than 90° indicates more hydrophobicity. Figure 7 shows a clear trend in the WCA values for the raw PS and the PS treated at low temperatures in the range of 120 °C to 200 °C. The WCA of the feedstock PS decreased sharply from 125° to 88° in 20 s. By contrast, the WCA of the pretreated PS increased relatively and was maintained for a long time (>20 s), and the PS showed higher hydrophobicity (133°~136°) after 200 °C pretreatment, while the WCA of the raw PS decreased rapidly (<20 s). The results indicated that the PS showed greater hydrophobicity than the raw PS after pretreatment. When PS is stored in large quantities, it is necessary to control the humidity of the warehouse to prevent it from mold and rot. The improvement of the hydrophobicity helps to reduce the storage and transportation costs of PS, and also makes up for the energy consumption of the preheating process to a certain extent.

3.3.3. SEM Analysis

SEM is used to examine the structure of the biomass samples, and SEM is well used to describe the surface morphology. Figure 8 shows the scanning electron microscope image of the PS at a magnification of 20 μm. It can be clearly observed from the figure that the internal structure and surface morphology of the PS have changed, From Figure 8A, one can observe the distinct cellulose bundle-like structure. As the preheating temperature increases, the PS epidermal tissue begins to rupture. At 200 °C, obvious structural breaks occur on the surface, which is due to the decomposition of hemicellulose and cellulose and the dehydroxylation reaction, resulting in the destruction of the epidermal tissue structure. The internal fiber structure band becomes softer, causing the overall structure to be prone to collapse. However, some regular structural features are still retained in the internal pores, mainly because the degree of thermal decomposition of hemicellulose at this time is relatively low, and the cell pore structure is destroyed, hindering the entry of water molecules. This is also one of the reasons why the thermally treated pine sawdust has good hydrophobicity [44,45].

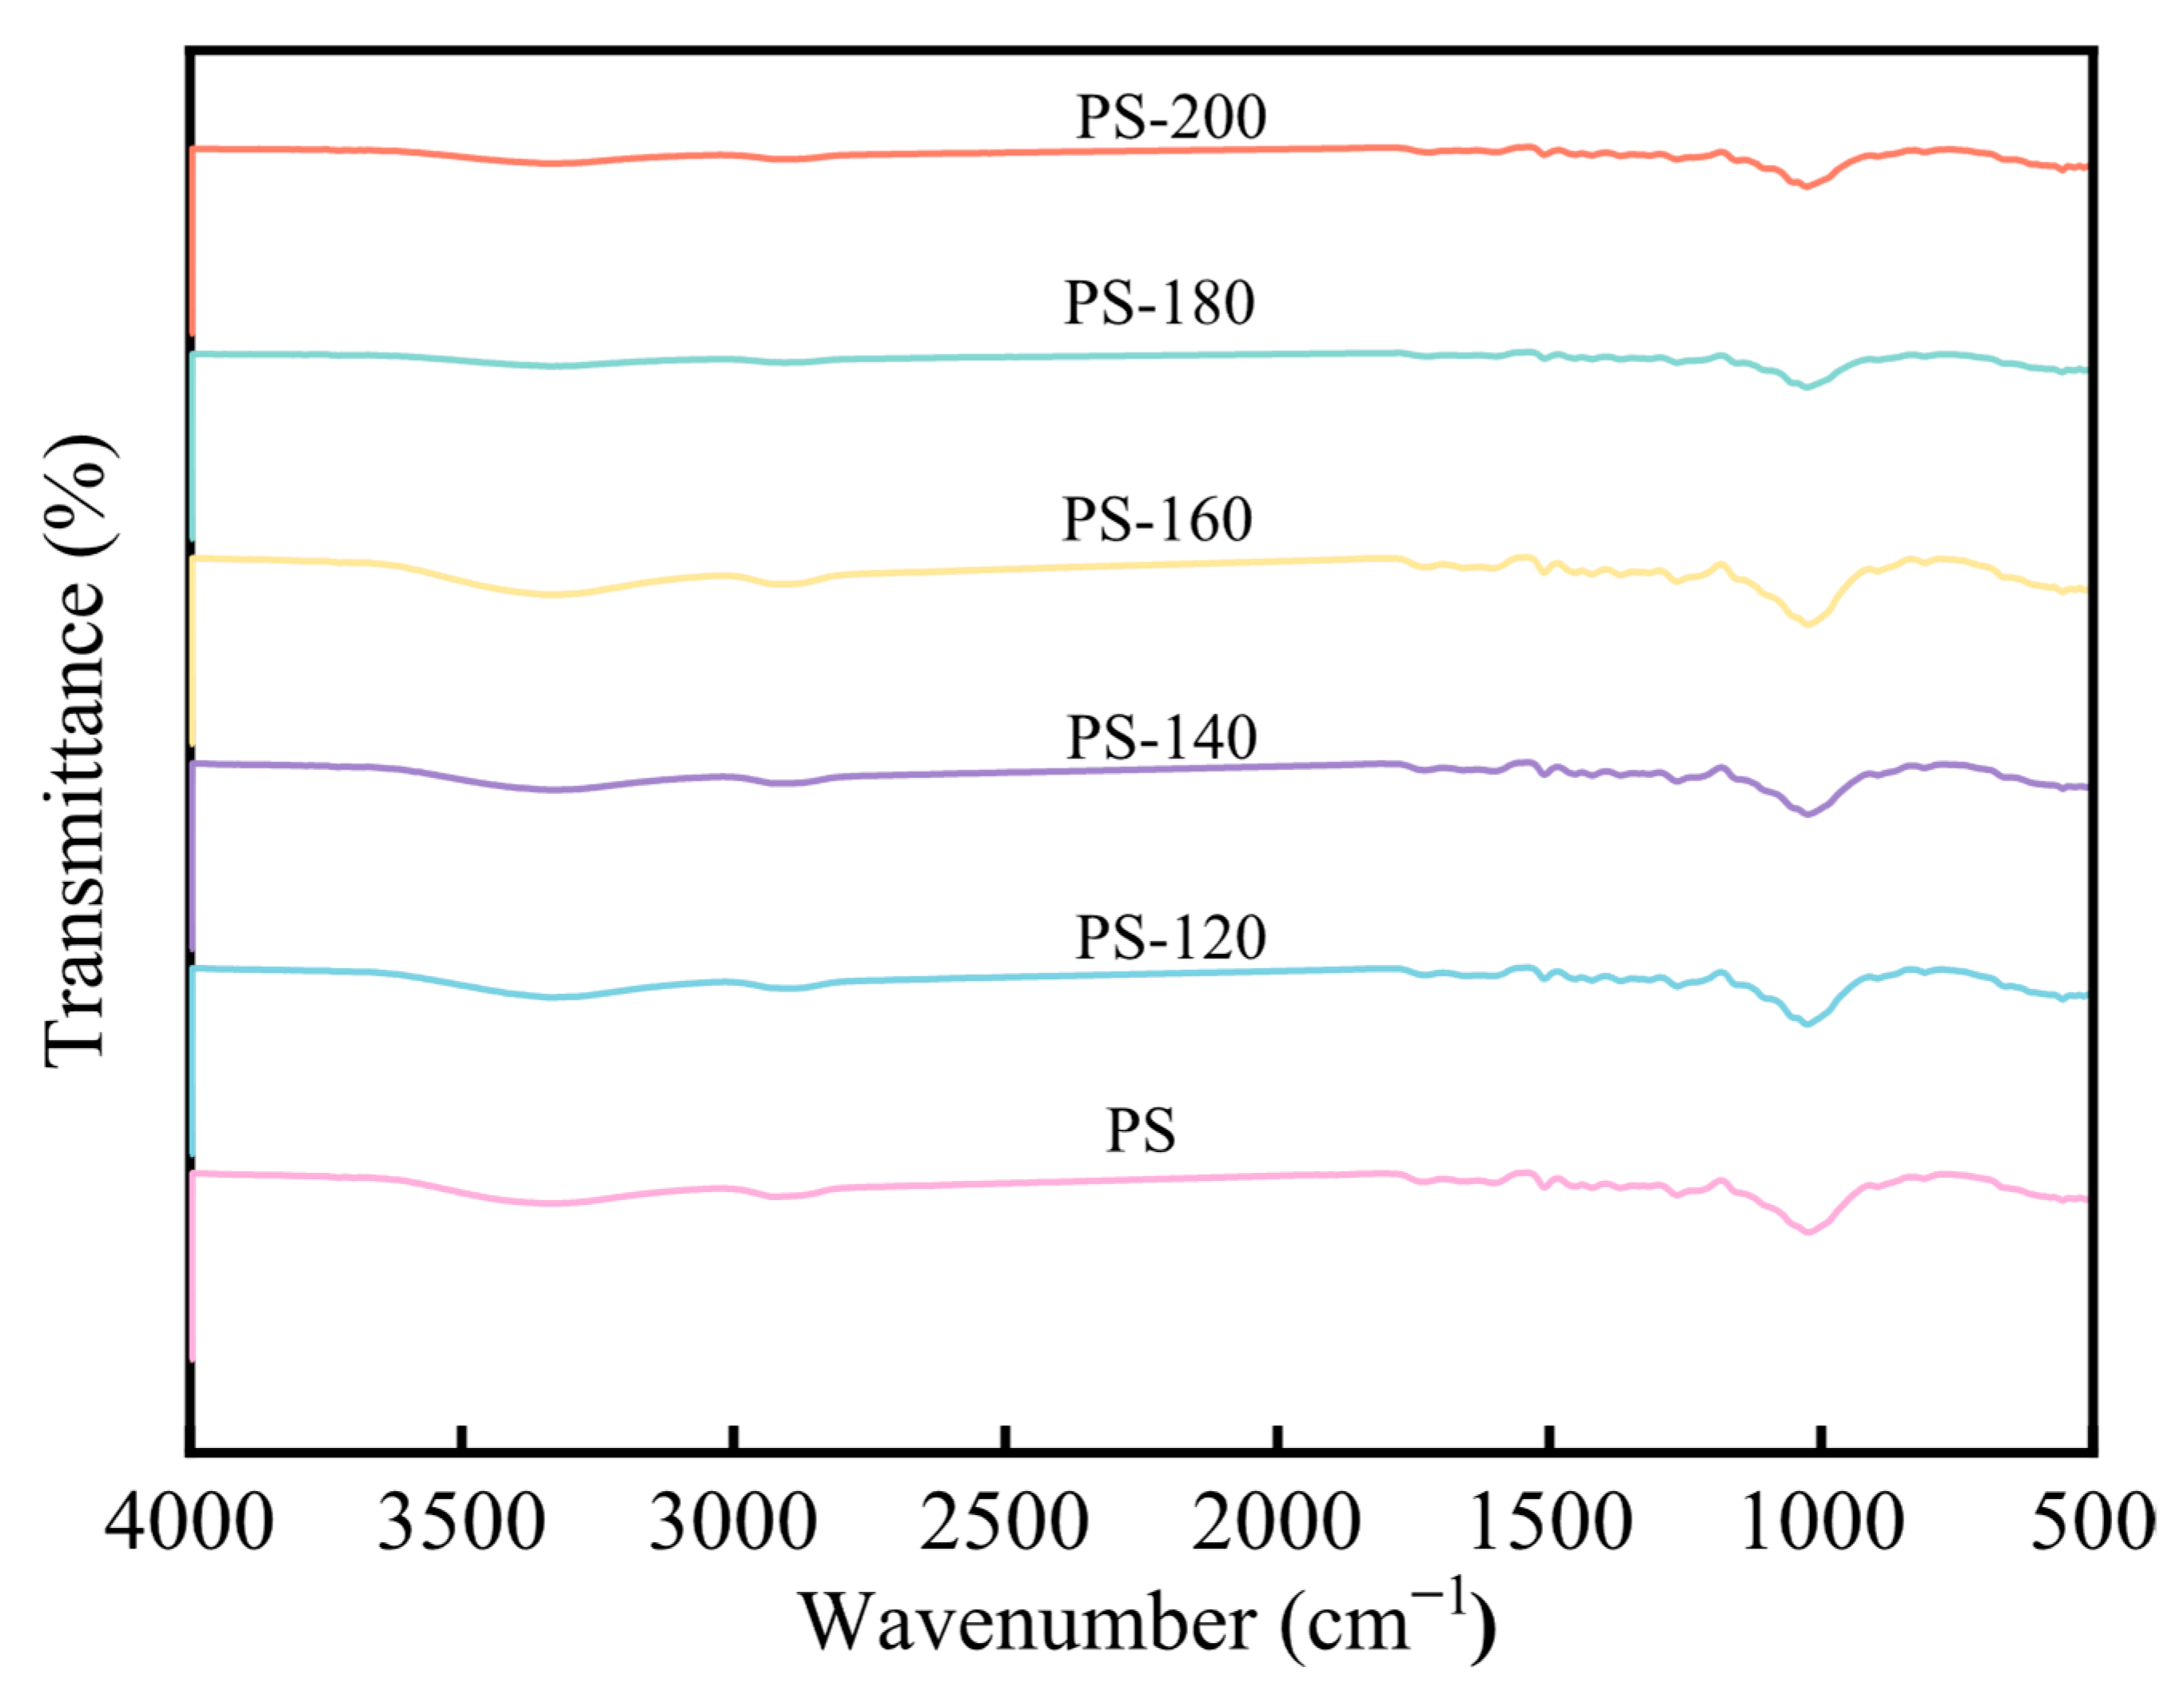
3.3.4. FT-IR Analysis

Figure 9 shows the FT-IR analysis of PS at different preheating temperatures. It can be seen that there are more oxygen-containing functional groups within the dried biomass, such as -OH (3400–3200 cm−1), C=O (1765–1715 cm−1), C-O-H (1050 cm−1), and C-O-C (1260 cm−1). As the preheating temperature increases, the -OH absorption peak gradually decreases. The reason for this phenomenon is that, when hemicellulose reaches a temperature increase, hemicellulose begins to have dehydroxylation and condensation reactions, and the water generated in this reaction will combine with the bound water of PS and be precipitated, thereby causing the intensity of the -OH and C-O absorption peaks to weaken. Under different preheating temperature conditions, the internal curves of PS show a similar shape, and the intensity of the characteristic peaks is basically the same. This indicates that, at preheating temperatures less than 200 °C, the preheating temperature has a relatively small impact on the functional groups of lignin in the PS. This is because lignin has a high thermal stability and a relatively stable composition structure. As the preheating temperature increases, the peak at 1054 cm−1 of the baked rice straw decreases, indicating that the volatile matter content of the baked product decreases [27].

3.3.5. Comparison with Similar Studies

Article TitlePreparation of High-Quality Biochar Fuel from Pine Sawdust through Pressurized Drying and Its Characteristics Research [46] Effect of low-temperature preheating on the physicochemica l properties and energy quality of PS (This manuscript)
AuthorsDing et al.Lei et al.
Preheating ConditionsMicro high-pressure reactor (0.5–2.0 MPa, 200–290 °C)Tubular furnace, atmospheric N2 environment (120–200 °C)
Research ObjectiveEnhance PS fuel quality via pressurized torrefaction for coal substitutionInvestigate low-temperature preheating effects on physicochemical properties to reduce logistics costs
Key Parameter ChangesAt 290°C: Volatiles ↓ 45.7%, fixed carbon ↑ 54.3%—at 290 °C: Volatiles ↓ 45.7%, fixed carbon ↑ 54.3%;
O/C ratio reduced to 0.24, H/C ratio 0.85 (meeting bituminous coal standards);
Calorific value ↑ 28.15 MJ/kg
At 200 °C: Moisture content ↓ 4.19%;
O/C ratio ↓ 0.13;
lignin ↑ 4.34%; hemicellulose ↓ 2.68%;
calorific value ↑ 19.52 MJ/kg
Kinetic AnalysisDAEM model shows significant activation energy increase (259 kJ/mol for CS-290-1.5)TG/DTG curves shift rightward, indicating improved thermal stability
Reaction MechanismPressure promotes decarboxylation/carbonyl reactions, accelerating aromatizationLow temperature facilitates hemicellulose decomposition and dehydration
Key Parameter ChangesProduces coal-like biochar for high-value energy utilizationImproves pelletization quality and reduces storage/transportation costs
In the table, the “↑” symbol represents an increase in data, while the “↓” symbol represents a decrease in data.
Through the above comparison, the main difference between the two studies lies in the technical approach. Ding et al. adopted high-pressure enhanced reactions, while Lei et al. focused on normal pressure and low-temperature pretreatment. In terms of the effect, Ding et al.’s product met the standard of bituminous coal, while Lei et al. paid more attention to optimizing the storage and transportation characteristics. In terms of the mechanism, Ding et al. included Raman spectroscopy and activation energy calculations, while the research by Lei et al. focused on macroscopic property analysis. However, both studies jointly indicated that 200 °C is the key temperature node for the thermal chemical conversion of PS, but pressurization can significantly improve the deoxygenation efficiency (the O/C reduction of Ding et al.’s product reached 68% vs. 16% for Lei et al.’s product).

4. Conclusions

With the increase of the low-temperature preheating temperature, the water content of PS decreased from 4.93% (PS) to 1.70% (PS-200), the fixed carbon mass fraction of PS-200 increased by 6.81%, and the volatile mass fraction decreased by 3.69%. This change was due to the preferential pyrolysis of hemicellulose in the range of 180–340 °C. At the same time, the cross-linking structure of lignin and cellulose was destroyed, and the mass fraction of both reached the maximum when PS-200 was treated. The results of chemical composition showed that the deeper the preheating degree, the better the “deoxy-rich carbon” effect of the biomass, the better the quality.
TG and FT-IR showed that the low-temperature preheating treatment promoted the rapid precipitation of water inside the PS, and the depolymerization of cellulose and hemicellulose resulted in furfural, L-glucan, and other small molecular compounds. At the same time, the decarbonylation (C=O fracture) and decarboxylation (-COOH fracture) reactions were activated, which reduced the activation energy of the pyrolysis reaction and improved the pyrolysis efficiency and stability, indicating that the low-temperature preheating had a strengthening effect on the pyrolysis of the PS. Scanning electron microscopy (SEM) observation showed that, above the 200 °C treatment, fibers collapsed inside the biomass, and the average pore size decreased, providing more active sites for reactant diffusion and mass transfer.
Compared with the PS treated without the low-temperature preheating, the high calorific value of the PS treated at 180 °C reached 19.52 MJ/kg (an increase of 6.90%), and the energy enhancement factor (Ef) increased by 6.00%. This was mainly attributed to the increase of the C mass fraction (from 51.69% to 54.11%) and the decrease of the O mass fraction (from 34.80% to 31.86%). At the same time, the hydrophobic performance was improved: the EMC was reduced from 7.06% to 4.46%, a decrease of 46.74%, which effectively inhibited the problem of moisture absorption caking during transportation and storage, reduced the transportation and storage undertaking, and facilitated the synergistic improvement of source performance and storage economy.

Author Contributions

Conceptualization, T.L.; methodology, Y.M. software, Y.L.; validation, Y.W.; formal analysis, S.L.; investigation, Y.Y. All authors have read and agreed to the published version of the manuscript.

Funding

This research was funded by National Key Research and Development Program of (2022YFB4201901) and Guangdong Provincial Key Laboratory of New and Renewable Energy Development (No. E439kf0501).

Data Availability Statement

The datasets generated or analyzed during the current study are not publicly available, but are available from the corresponding author upon reasonable request.

Acknowledgments

The authors also want to express their gratitude to the Analytic Center of Changzhou University for providing the experimental equipment for measurements.

Conflicts of Interest

The authors declare no conflicts of interest.

Nomenclature

AcronymDefinition
PSPine sawdust
FT-IRFourier Transform Infrared Spectroscopy
SEMScanning Electron Microscopy
TGAThermogravimetric Analysis
HHVHigher Heating Value of torrefied biomass [MJ·kg−1]
CPIComprehensive Pyrolysis Index
WCAWater Contact Angle [°]
mMass of solid component [kg]
SRSolid Residue
EMCEquilibrium Moisture Content
List of symbols
torTorrefied biomass
a*Red-green chromaticity coordinate (positive: red; negative: green)
b*Yellow-blue chromaticity coordinate (positive: yellow; negative: blue)
L*Lightness coordinate (0: black; 100: white)
E*Total color difference
DdevDevolatilization Index
RwPyrolysis Stability Index
TTemperature [°C]
(dw/dt)maxMaximum weight loss rate [%·min−1]
TmaxPeak temperature corresponding to (dw/dt)max [°C]
(dw/dt)meanAverage weight loss rate [%·min−1]
VMaximum weight loss percentage [%]
rawUntreated dry biomass

References

  1. Singara veloo, K.; Lau, A.; Sokhansanj, S. Analysis of Mechanical Durability, Hydrophobicity, Pyrolysis and Combustion Properties of Solid Biofuel Pellets Made from Mildly Torrefied Biomass. Energies 2025, 18, 3464. [Google Scholar] [CrossRef]
  2. Pradeep, M.; Panwar, N.L.; Divyangkumar, N. Torrefaction of agricultural biomass: A state-of-the-art review on transforming waste into clean energy. Energy 360 2025, 3, 100023. [Google Scholar] [CrossRef]
  3. Rozzi, E.; Minuto, F.D.; Lanzini, A.; Leone, P. Green Synthetic Fuels: Renewable Routes for the Conversion of Non-Fossil Feedstocks into Gaseous Fuels and Their End Uses. Energies 2020, 13, 420. [Google Scholar] [CrossRef]
  4. Chen, W.-H.; Lin, B.-J.; Lin, Y.-Y.; Chu, Y.-S.; Ubando, A.T.; Show, P.L.; Ong, H.C.; Chang, J.-S.; Ho, S.-H.; Culaba, A.B.; et al. Progress in biomass torrefaction: Principles, applications and challenges. Prog. Energy Combust. Sci. 2021, 82, 100887. [Google Scholar] [CrossRef]
  5. Isemin, R.; Mikhalev, A.; Kuzmin, S.; Brulé, M.; Ainane, T.; Milovanov, O.; Klimov, D.; Milovanov, K. Comparison of Dry and Wet Torrefaction for Biochar Production from Olive Leaves and Olive Pomace. Processes 2025, 13, 2155. [Google Scholar] [CrossRef]
  6. Deep Singh, A.; Gajera, B.; Sarma, A.K. Appraising the availability of biomass residues in India and their bioenergy potential. Waste Manag. 2022, 152, 38–47. [Google Scholar] [CrossRef]
  7. Petrillo, A.; Travaglioni, M.; Di Fraia, S.; Vanoli, L.; Cirillo, D.; La Villetta, M. Experimental study and Life Cycle Assessment of biomass small-scale trigeneration plant. J. Clean. Prod. 2021, 326, 129234. [Google Scholar] [CrossRef]
  8. Eisavi, B.; Ranjbar, F.; Nami, H. Evaluating the techno-economic viability of biomass for green methanol and low-carbon power production. Int. J. Hydrogen Energy 2025, 109, 397–411. [Google Scholar] [CrossRef]
  9. Santhosh, K.G.; Mohit, A.; Singh, G.B. Effect of torrefaction on the physiochemical and fuel properties of major Indian waste biomasses. Sustain. Energy Technol. Assess. 2025, 76, 104277. [Google Scholar] [CrossRef]
  10. Yu, S.; Park, J.; Kim, M.; Kim, H.; Ryu, C.; Lee, Y.; Yang, W.; Jeong, Y.-g. Improving Energy Density and Grindability of Wood Pellets by Dry Torrefaction. Energy Fuels 2019, 33, 8632–8639. [Google Scholar] [CrossRef]
  11. Niksa, S. Predicting mass loss, solids compositions and heating values, and gas products for any biomass form at any torrefaction conditions. Fuel 2025, 398, 135553. [Google Scholar] [CrossRef]
  12. Azarpour, A.; Zendehboudi, S.; Saady, N.M.C. Deterministic Models for Performance Analysis of Lignocellulosic Biomass Torrefaction. ACS Omega 2025, 10, 6470–6501. [Google Scholar] [CrossRef] [PubMed]
  13. Xu, R.; Lu, X.; Sun, K.; Tan, C.; Zhang, Y. Effects of Torrefaction Pretreatment on the Preparation and Properties of Activated Carbon from Corn Straw by Phosphoric Acid Activation. Biomass Chem. Eng. 2022, 56, 1–8. [Google Scholar]
  14. Song, L.; Li, Y.; Lei, T.; Yang, Y.; Shen, Y.; Yang, M.; Wang, Y.; Zheng, H. Research on the water absorption diffusion model and kinetics of pretreated straw. Sci. Rep. 2025, 15, 9927. [Google Scholar] [CrossRef] [PubMed]
  15. Song, L.; Li, Y.; Lei, T.; Yang, Y.; Shen, Y.; Zheng, H. Research on the Multiple Linear Regression Model of Color Difference and Physicochemical Properties of Thermal Treated Biomass. Agronomy 2025, 15, 302. [Google Scholar] [CrossRef]
  16. Lei, S.; Yilin, S.; Tingzhou, L.; Peng, L.; Mei, Y.; Yantao, Y.J.C. Research on Quality Control of Rice Straw Based on Low Temperature Torrefaction Pretreatment. Chem. Ind. For. Prod. 2024, 44, 11–19. [Google Scholar]
  17. Chen, W.-H.; Kuo, P.-C. A study on torrefaction of various biomass materials and its impact on lignocellulosic structure simulated by a thermogravimetry. Energy 2010, 35, 2580–2586. [Google Scholar] [CrossRef]
  18. GB/T 28731-2012; Industrial Analysis Methods for Solid Biomass Fuels. China Standards Press: Beijing, China, 2012.
  19. Vyas, R.; Swaminathan, P.; Chakraborty, S.; Kiran, B. Study on enhancing waste PVC management through predictive Machine Learning analysis of TGA and its economic benefits. Energy Convers. Manag. X 2024, 22, 100556. [Google Scholar] [CrossRef]
  20. Bongomin, O.; Nzila, C.; Igadwa Mwasiagi, J.; Maube, O. Comprehensive thermal properties, kinetic, and thermodynamic analyses of biomass wastes pyrolysis via TGA and Coats-Redfern methodologies. Energy Convers. Manag. X 2024, 24, 100723. [Google Scholar] [CrossRef]
  21. El-Sayed, S.A.; Khass, T.M.; Mostafa, M.E. Thermal degradation behaviour and chemical kinetic characteristics of biomass pyrolysis using TG/DTG/DTA techniques. Biomass Convers. Biorefinery 2024, 14, 17779–17803. [Google Scholar] [CrossRef]
  22. Soria-Verdugo, A.; Guil-Pedrosa, J.F.; García-Hernando, N.; Ghoniem, A.F. Evolution of solid residue composition during inert and oxidative biomass torrefaction. Energy 2024, 312, 133486. [Google Scholar] [CrossRef]
  23. Kostyniuk, A.; Likozar, B. Wet torrefaction of biomass waste into value-added liquid product (5-HMF) and high quality solid fuel (hydrochar) in a nitrogen atmosphere. Renew. Energy 2024, 226, 120450. [Google Scholar] [CrossRef]
  24. Manouchehrinejad, M.; van Giesen, I.; Mani, S. Grindability of torrefied wood chips and wood pellets. Fuel Process. Technol. 2018, 182, 45–55. [Google Scholar] [CrossRef]
  25. Adeleke, A.A.; Ikubanni, P.P.; Emmanuel, S.S.; Fajobi, M.O.; Nwachukwu, P.; Adesibikan, A.A.; Odusote, J.K.; Adeyemi, E.O.; Abioye, O.M.; Okolie, J.A. A comprehensive review on the similarity and disparity of torrefied biomass and coal properties. Renew. Sustain. Energy Rev. 2024, 199, 114502. [Google Scholar] [CrossRef]
  26. Lu, G.; Zhang, K.; Cheng, F. The fusion characteristics of ashes from anthracite and biomass blends. J. Energy Inst. 2018, 91, 797–804. [Google Scholar] [CrossRef]
  27. Dacres, O.; Suárez Gómez, M.; Fendt, S. Pressurized Torrefaction: Physiochemical characterization of torrefied miscanthus and beechwood. Energy 2025, 331, 137045. [Google Scholar] [CrossRef]
  28. Apaydın Varol, E.; Mutlu, Ü. TGA-FTIR Analysis of Biomass Samples Based on the Thermal Decomposition Behavior of Hemicellulose, Cellulose, and Lignin. Energies 2023, 16, 3674. [Google Scholar] [CrossRef]
  29. Zhang, C.; Chen, W.-H.; Ho, S.-H. Elemental loss, enrichment, transformation and life cycle assessment of torrefied corncob. Energy 2022, 242, 123019. [Google Scholar] [CrossRef]
  30. Song, Y.; Chen, Z.; Li, Y.; Sun, T.; Lei, T.; Liu, P. Regulation of energy properties and thermal behavior of bio-coal from lignocellulosic biomass using torrefaction. Energy 2024, 289, 129949. [Google Scholar] [CrossRef]
  31. Sivrikaya, H.; Tesařová, D.; Jeřábková, E.; Can, A. Color change and emission of volatile organic compounds from Scots pine exposed to heat and vacuum-heat treatment. J. Build. Eng. 2019, 26, 100918. [Google Scholar] [CrossRef]
  32. Zhang, C.; Ho, S.-H.; Chen, W.-H.; Fu, Y.; Chang, J.-S.; Bi, X. Oxidative torrefaction of biomass nutshells: Evaluations of energy efficiency as well as biochar transportation and storage. Appl. Energy 2019, 235, 428–441. [Google Scholar] [CrossRef]
  33. Xi, Y.; Yuan, X.; Tan, M.; Jiang, S.; Wang, Z.; Huang, Z.; Wang, H.; Jiang, L.; Li, H. Properties of oxidatively torrefied Chinese fir residue: Color dimension, pyrolysis kinetics, and storage behavior. Fuel Process. Technol. 2021, 213, 106663. [Google Scholar] [CrossRef]
  34. Esteves, B.; Velez Marques, A.; Domingos, I.; Pereira, H. Heat-induced colour changes of pine (Pinus pinaster) and eucalypt (Eucalyptus globulus) wood. Wood Sci. Technol. 2008, 42, 369–384. [Google Scholar] [CrossRef]
  35. Huang, X.; Yin, H.; Zhang, B.; Mei, N.; Mu, L. Pyrolysis of lignin (De–alkaline) via TG/DSC–FTIR and TG–MS: Pyrolysis characteristics, thermo-kinetics, and gas products. Biomass Convers. Biorefinery 2024, 14, 795–812. [Google Scholar] [CrossRef]
  36. Sun, G.; Zhang, G.; Liu, J.; Evrendilek, D.E.; Buyukada, M. Thermal behaviors, combustion mechanisms, evolved gasses, and ash analysis of spent potlining for a hazardous waste management. J. Environ. Sci. 2021, 107, 124–137. [Google Scholar] [CrossRef] [PubMed]
  37. Kumar, M.; Mishra, P.K.; Upadhyay, S.N. Thermal degradation of rice husk: Effect of pre-treatment on kinetic and thermodynamic parameters. Fuel 2020, 268, 117164. [Google Scholar] [CrossRef]
  38. Nie, Y.; Song, X.; Shan, M.; Yang, X. Effect of pelletization on biomass thermal degradation in combustion: A case study of peanut shell and wood sawdust using macro-TGA. Energy Built Environ. 2024. [Google Scholar] [CrossRef]
  39. Nie, Y.; Deng, M.; Shan, M.; Yang, X. Evaluating the impact of wood sawdust and peanut shell mixing ratio on co-combustion performance. Fuel 2022, 324, 124667. [Google Scholar] [CrossRef]
  40. Chen, Z.; Wang, M.; Jiang, E.; Wang, D.; Zhang, K.; Ren, Y.; Jiang, Y. Pyrolysis of Torrefied Biomass. Trends Biotechnol. 2018, 36, 1287–1298. [Google Scholar] [CrossRef] [PubMed]
  41. Chen, W.-H.; Kuo, P.-C. Torrefaction and co-torrefaction characterization of hemicellulose, cellulose and lignin as well as torrefaction of some basic constituents in biomass. Energy 2011, 36, 803–811. [Google Scholar] [CrossRef]
  42. Giang, D.K.; Ban, S.-E.; Choi, J.-H.; Seong, H.; Jung, C.-D.; Kim, H.; Lee, J.-W. Effect of torrefied biomass on hydrophobicity and mechanical properties of polylactic acid composite. Int. J. Biol. Macromol. 2022, 215, 36–44. [Google Scholar] [CrossRef] [PubMed]
  43. Zhang, Y.; Chen, F.; Chen, D.; Cen, K.; Zhang, J.; Cao, X. Upgrading of biomass pellets by torrefaction and its influence on the hydrophobicity, mechanical property, and fuel quality. Biomass Convers. Biorefinery 2022, 12, 2061–2070. [Google Scholar] [CrossRef]
  44. Lee, S.H.; Ashaari, Z.; Lum, W.C.; Abdul Halip, J.; Ang, A.F.; Tan, L.P.; Chin, K.L.; Md Tahir, P. Thermal treatment of wood using vegetable oils: A review. Constr. Build. Mater. 2018, 181, 408–419. [Google Scholar] [CrossRef]
  45. Wang, Y.; Zhou, Y.; Bai, N.; Han, J. Experimental investigation of the characteristics of NOx emissions with multiple deep air-staged combustion of lean coal. Fuel 2020, 280, 118416. [Google Scholar] [CrossRef]
  46. Ding, X.; Yan, S.; Yan, M. Preparation and Characteristics of High-quality Biochar Fuel by Pressurized Torrefaction of Pine Sawdust. J. Agric. Sci. Technol. 2025, 27, 204–216. [Google Scholar]
Figure 1. Preheating and pretreatment test bench.
Energies 18 03875 g001
Figure 2. Research Roadmap for Low-Temperature Preheating of PS.
Energies 18 03875 g002
Figure 3. Color evolution of PS during the low-temperature heat treatment.
Energies 18 03875 g003
Figure 4. Changes in L*, a*, and b* values of PS under different preheating temperatures.
Energies 18 03875 g004
Figure 5. Change of total color change (ΔE*) of the PS at different preheating temperatures.
Energies 18 03875 g005
Figure 6. Thermogravimetric analysis of the PS: (a) DTG, (b) TG.
Energies 18 03875 g006
Figure 7. Contact angle measurement of PS.
Energies 18 03875 g007
Figure 8. SEM image of PS pretreated at the low-temperature heat treatment (20 μm). (A) PS; (B) PS-120; (C) PS-140; (D) PS-160; (E) PS-180; (F) PS-200.
Energies 18 03875 g008
Figure 9. FT-IR analysis of PS.
Energies 18 03875 g009
Table 1. Elemental analysis and component analysis of PS changing with preheating temperature.
SampleElemental Analysis/% Industrial Analysis Proximate
Analysis/%
Component Analysis
CHON VolatileFixed
Carbon
AshMoisture LigninCelluloseHemicellulose
PS51.697.0734.806.34 89.75 4.900.42 4.93 36.9747.0210.14
PS-12051.516.9134.986.52 90.41 6.650.49 2.45 38.2645.9910.68
PS-14050.646.7535.846.66 90.43 6.740.43 2.39 37.5046.2411.08
PS-16051.376.7935.326.43 89.87 7.710.45 1.96 39.4344.5811.61
PS-18051.316.6335.356.67 88.56 9.250.46 1.72 40.6443.6811.10
PS-20054.116.7631.867.25 86.06 11.710.53 1.70 41.3147.147.46
Table 2. Pyrolysis characteristic parameters of PS.
SampleInitial Temp
(°C)
Peak Temp
(Tp,max)
°C
DTGmax (%/min)
Rp,max
Average Weight Loss Rate
(%·min−1)
CPI
× 10−4
DdevRw
PS232.45385.670.742.861.8612.83708.85
PS-120231.78407.170.712.861.6513.03646.06
PS-140231.72403.670.732.811.6913.29670.19
PS-160232.50393.830.803.052.0614.16750.28
PS-180231.69395.670.782.961.9313.92730.67
PS-200231.75395.170.872.922.0715.50815.80
Table 3. Effect of the low-temperature heat treatment on PS energy and hydrophobicity.
SampleQHHV/
(MJ·kg−1)
Solids Yield/%Energy Yield/%EFEMC/%
PS18.261001001.007.06
PS-12018.4090.8791.561.016.56
PS-14018.8489.1791.971.036.24
PS-16019.0688.6392.511.045.92
PS-18019.5887.8794.181.075.44
PS-20019.5285.6291.531.064.46
Disclaimer/Publisher’s Note: The statements, opinions and data contained in all publications are solely those of the individual author(s) and contributor(s) and not of MDPI and/or the editor(s). MDPI and/or the editor(s) disclaim responsibility for any injury to people or property resulting from any ideas, methods, instructions or products referred to in the content.

