
Numerical Simulation Study of Heat Transfer Fluid Boiling Effects on Phase Change Material in Latent Heat Thermal Energy Storage Units


Abstract
1. Introduction
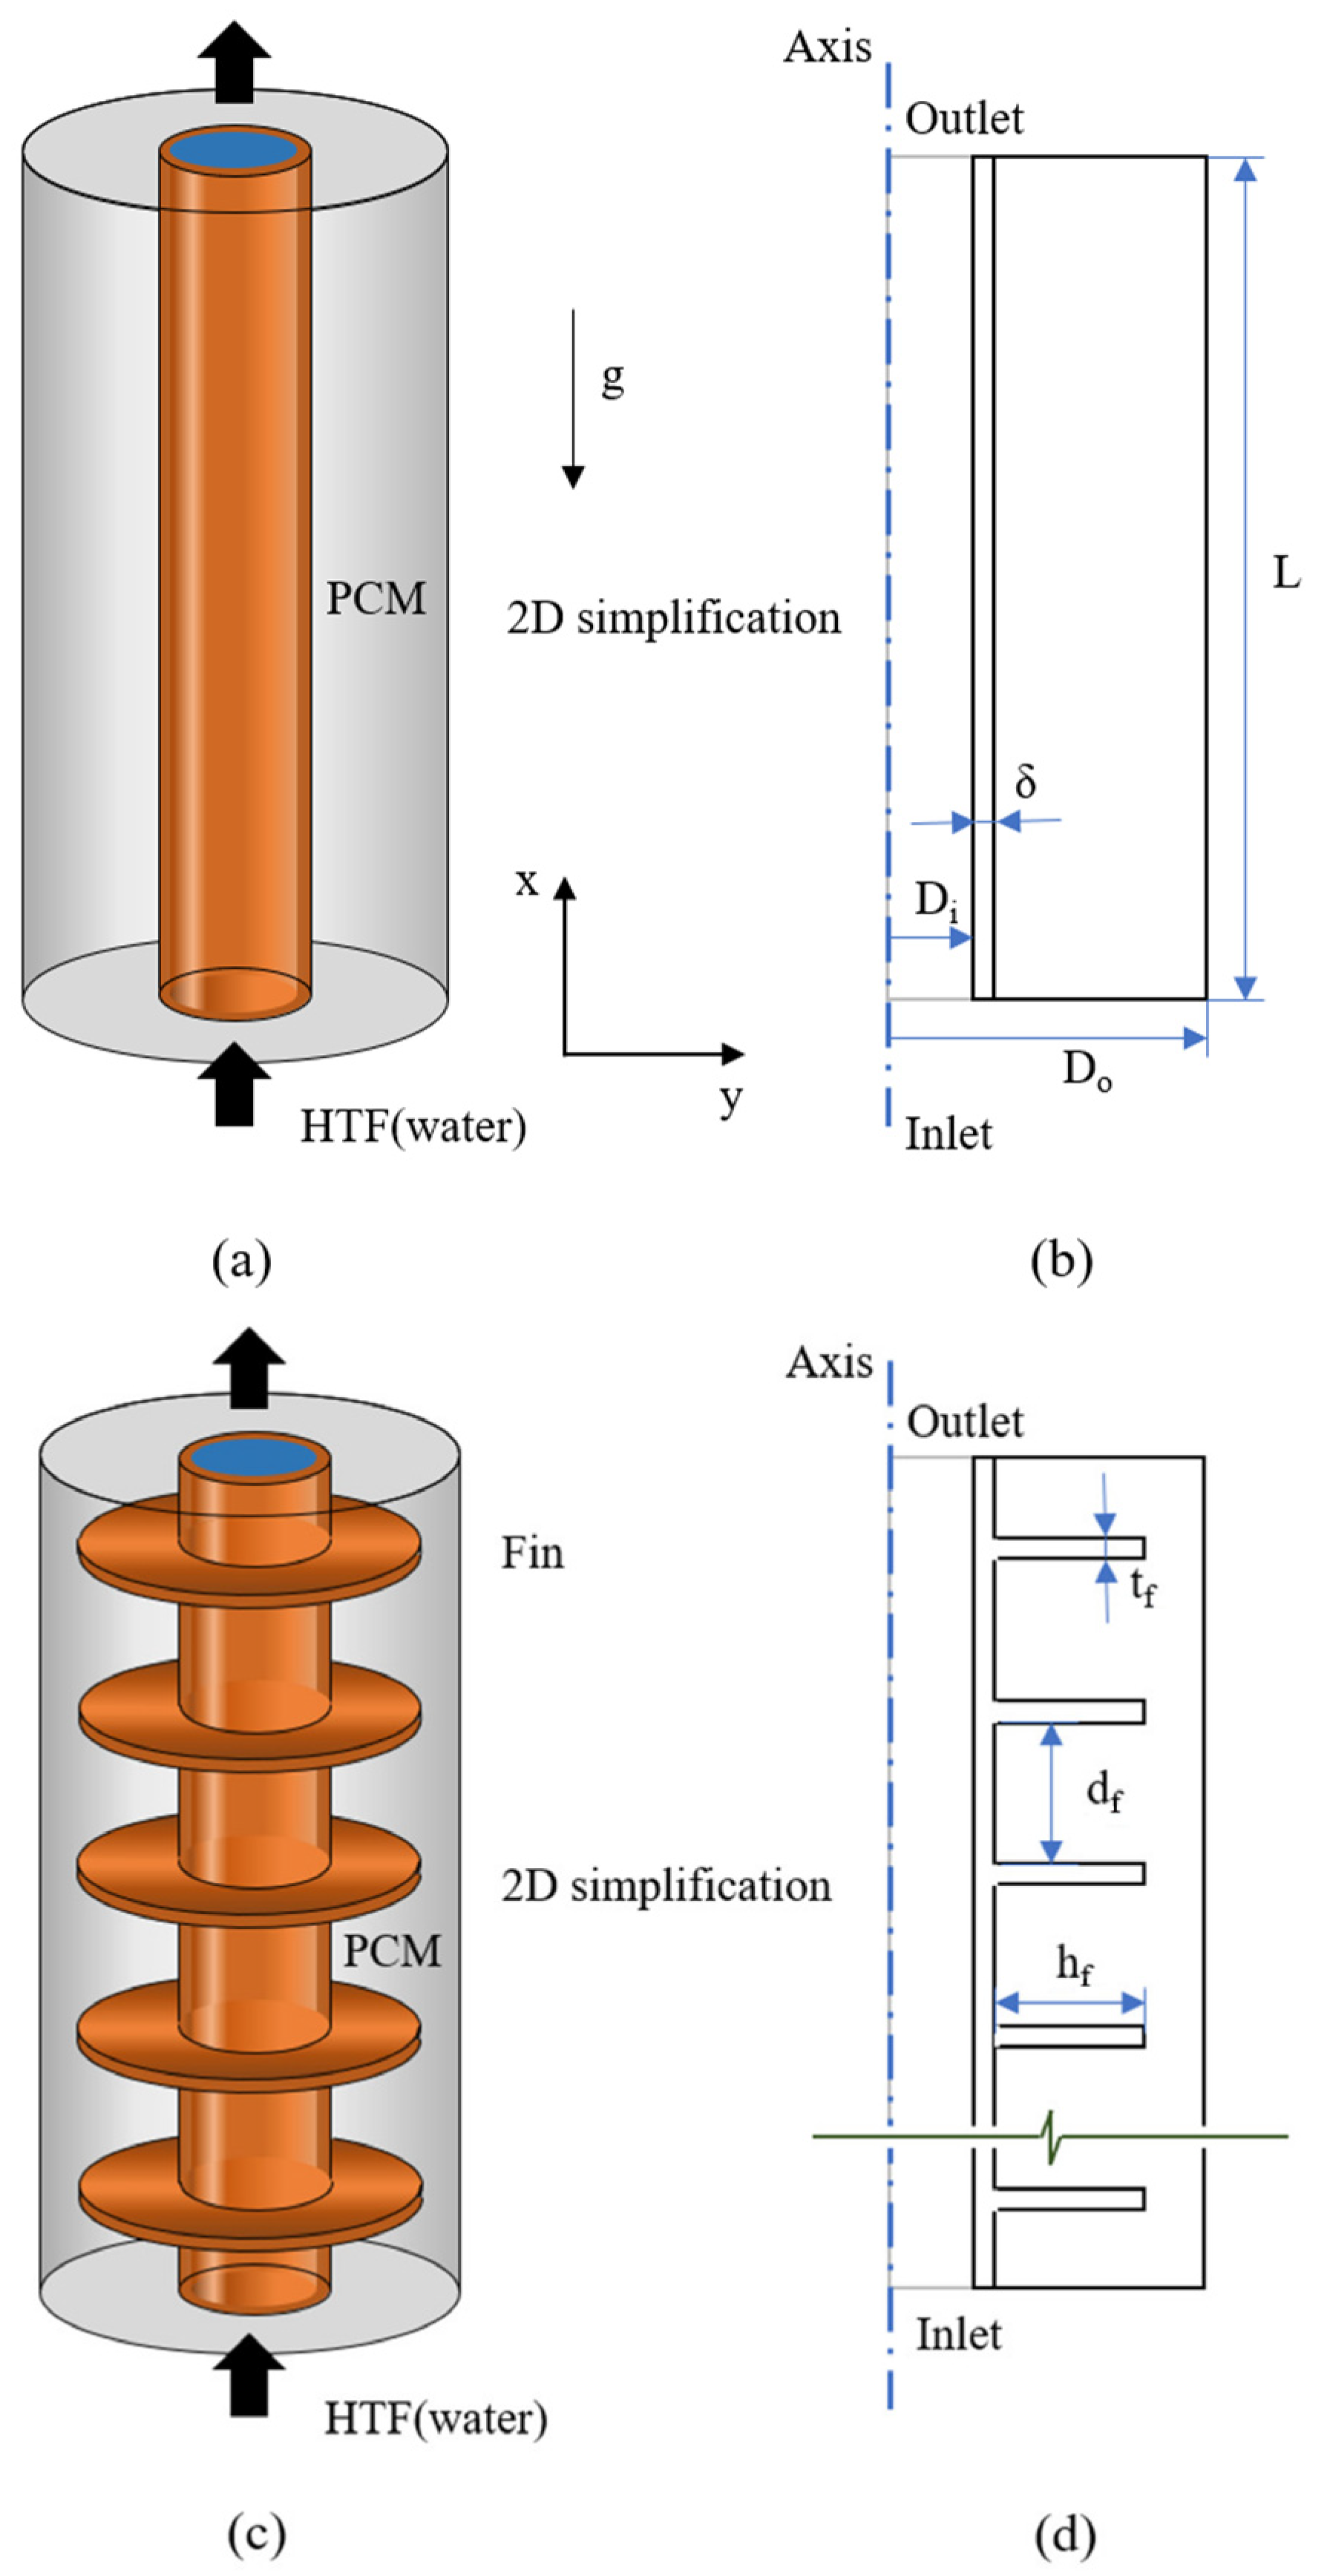
2. Physical Models
- (1)
- All materials utilized are assumed to be homogeneous and isotropic across all phases [35].
- (2)
- Fixed-wall, no-slip boundary conditions are applied to all boundaries.
- (3)
- Volume changes and heat dissipation due to viscosity in the PCM are disregarded, as well as heat transfer via radiation.
- (4)
- The PCM region is assumed to exhibit laminar flow, and only natural convection under gravity is considered. Volume changes resulting from PCM solidification are neglected.
- (5)
- Inlet velocity and temperature of the HTF are held constant, and both liquid and gas phases of the HTF in the tube are treated as incompressible. This approach ignores pressure drops during tube flow and does not account for changes in density.
3. Mathematical Models
3.1. Governing Equations
3.2. Boundary and Initial Conditions
3.3. Computational Methods
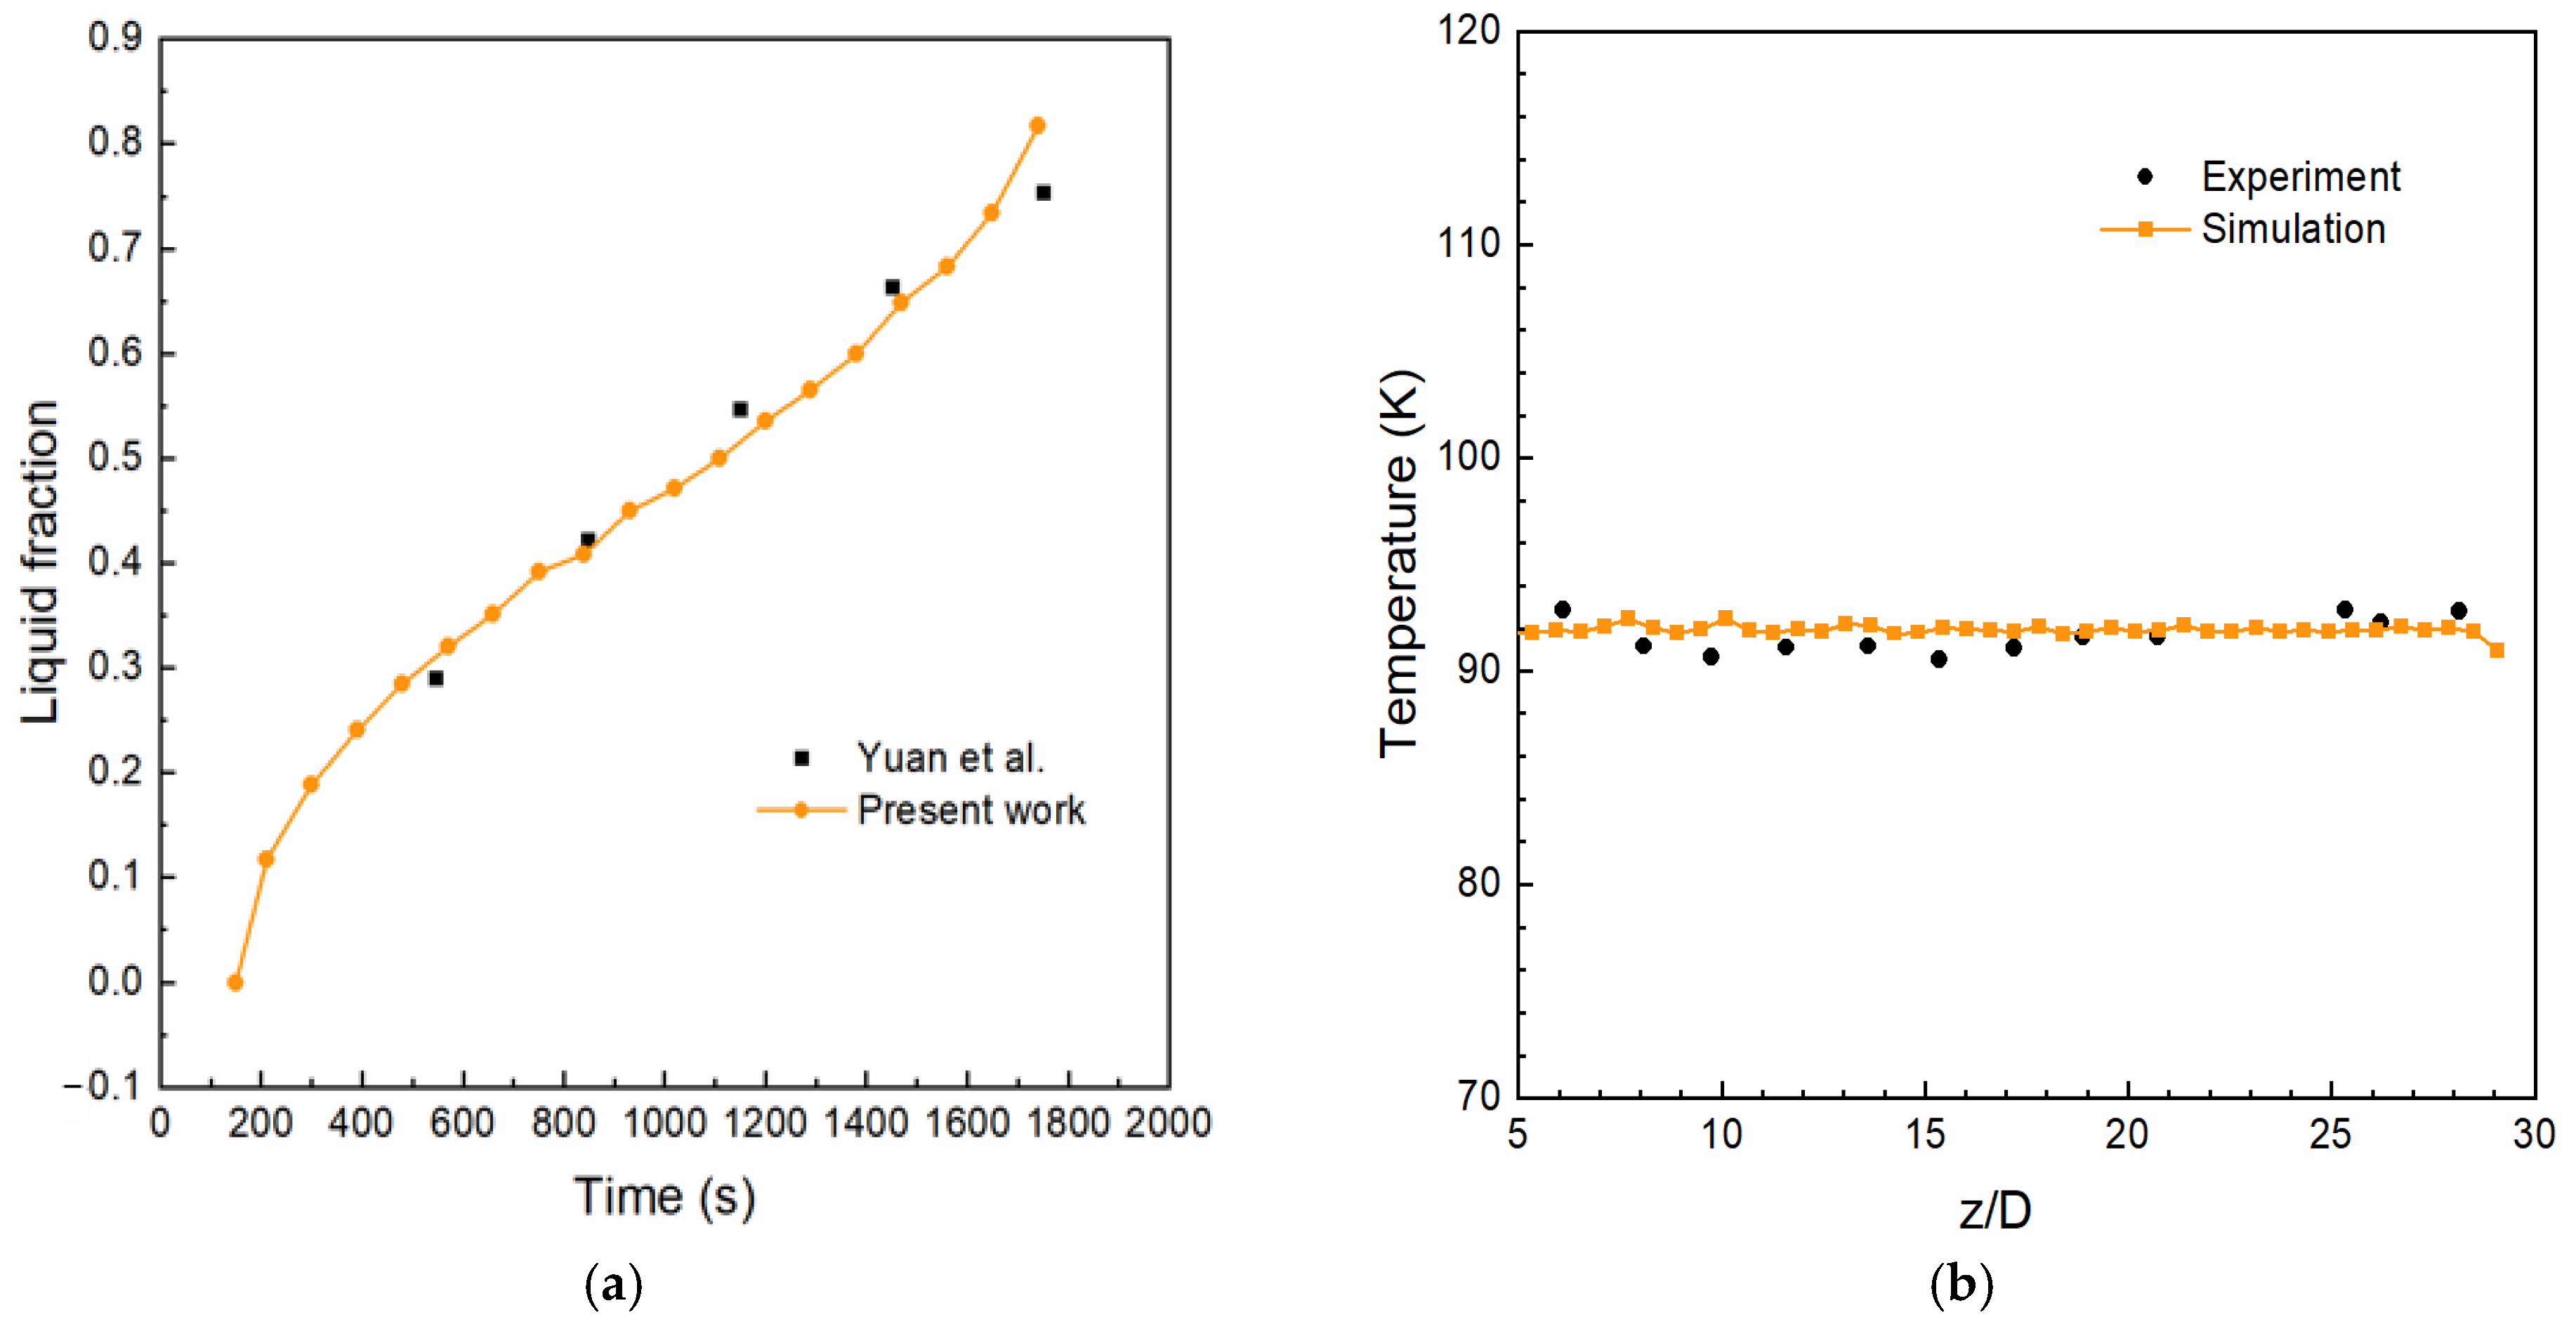
3.4. Grid Independence and Model Verification
4. Results and Discussion
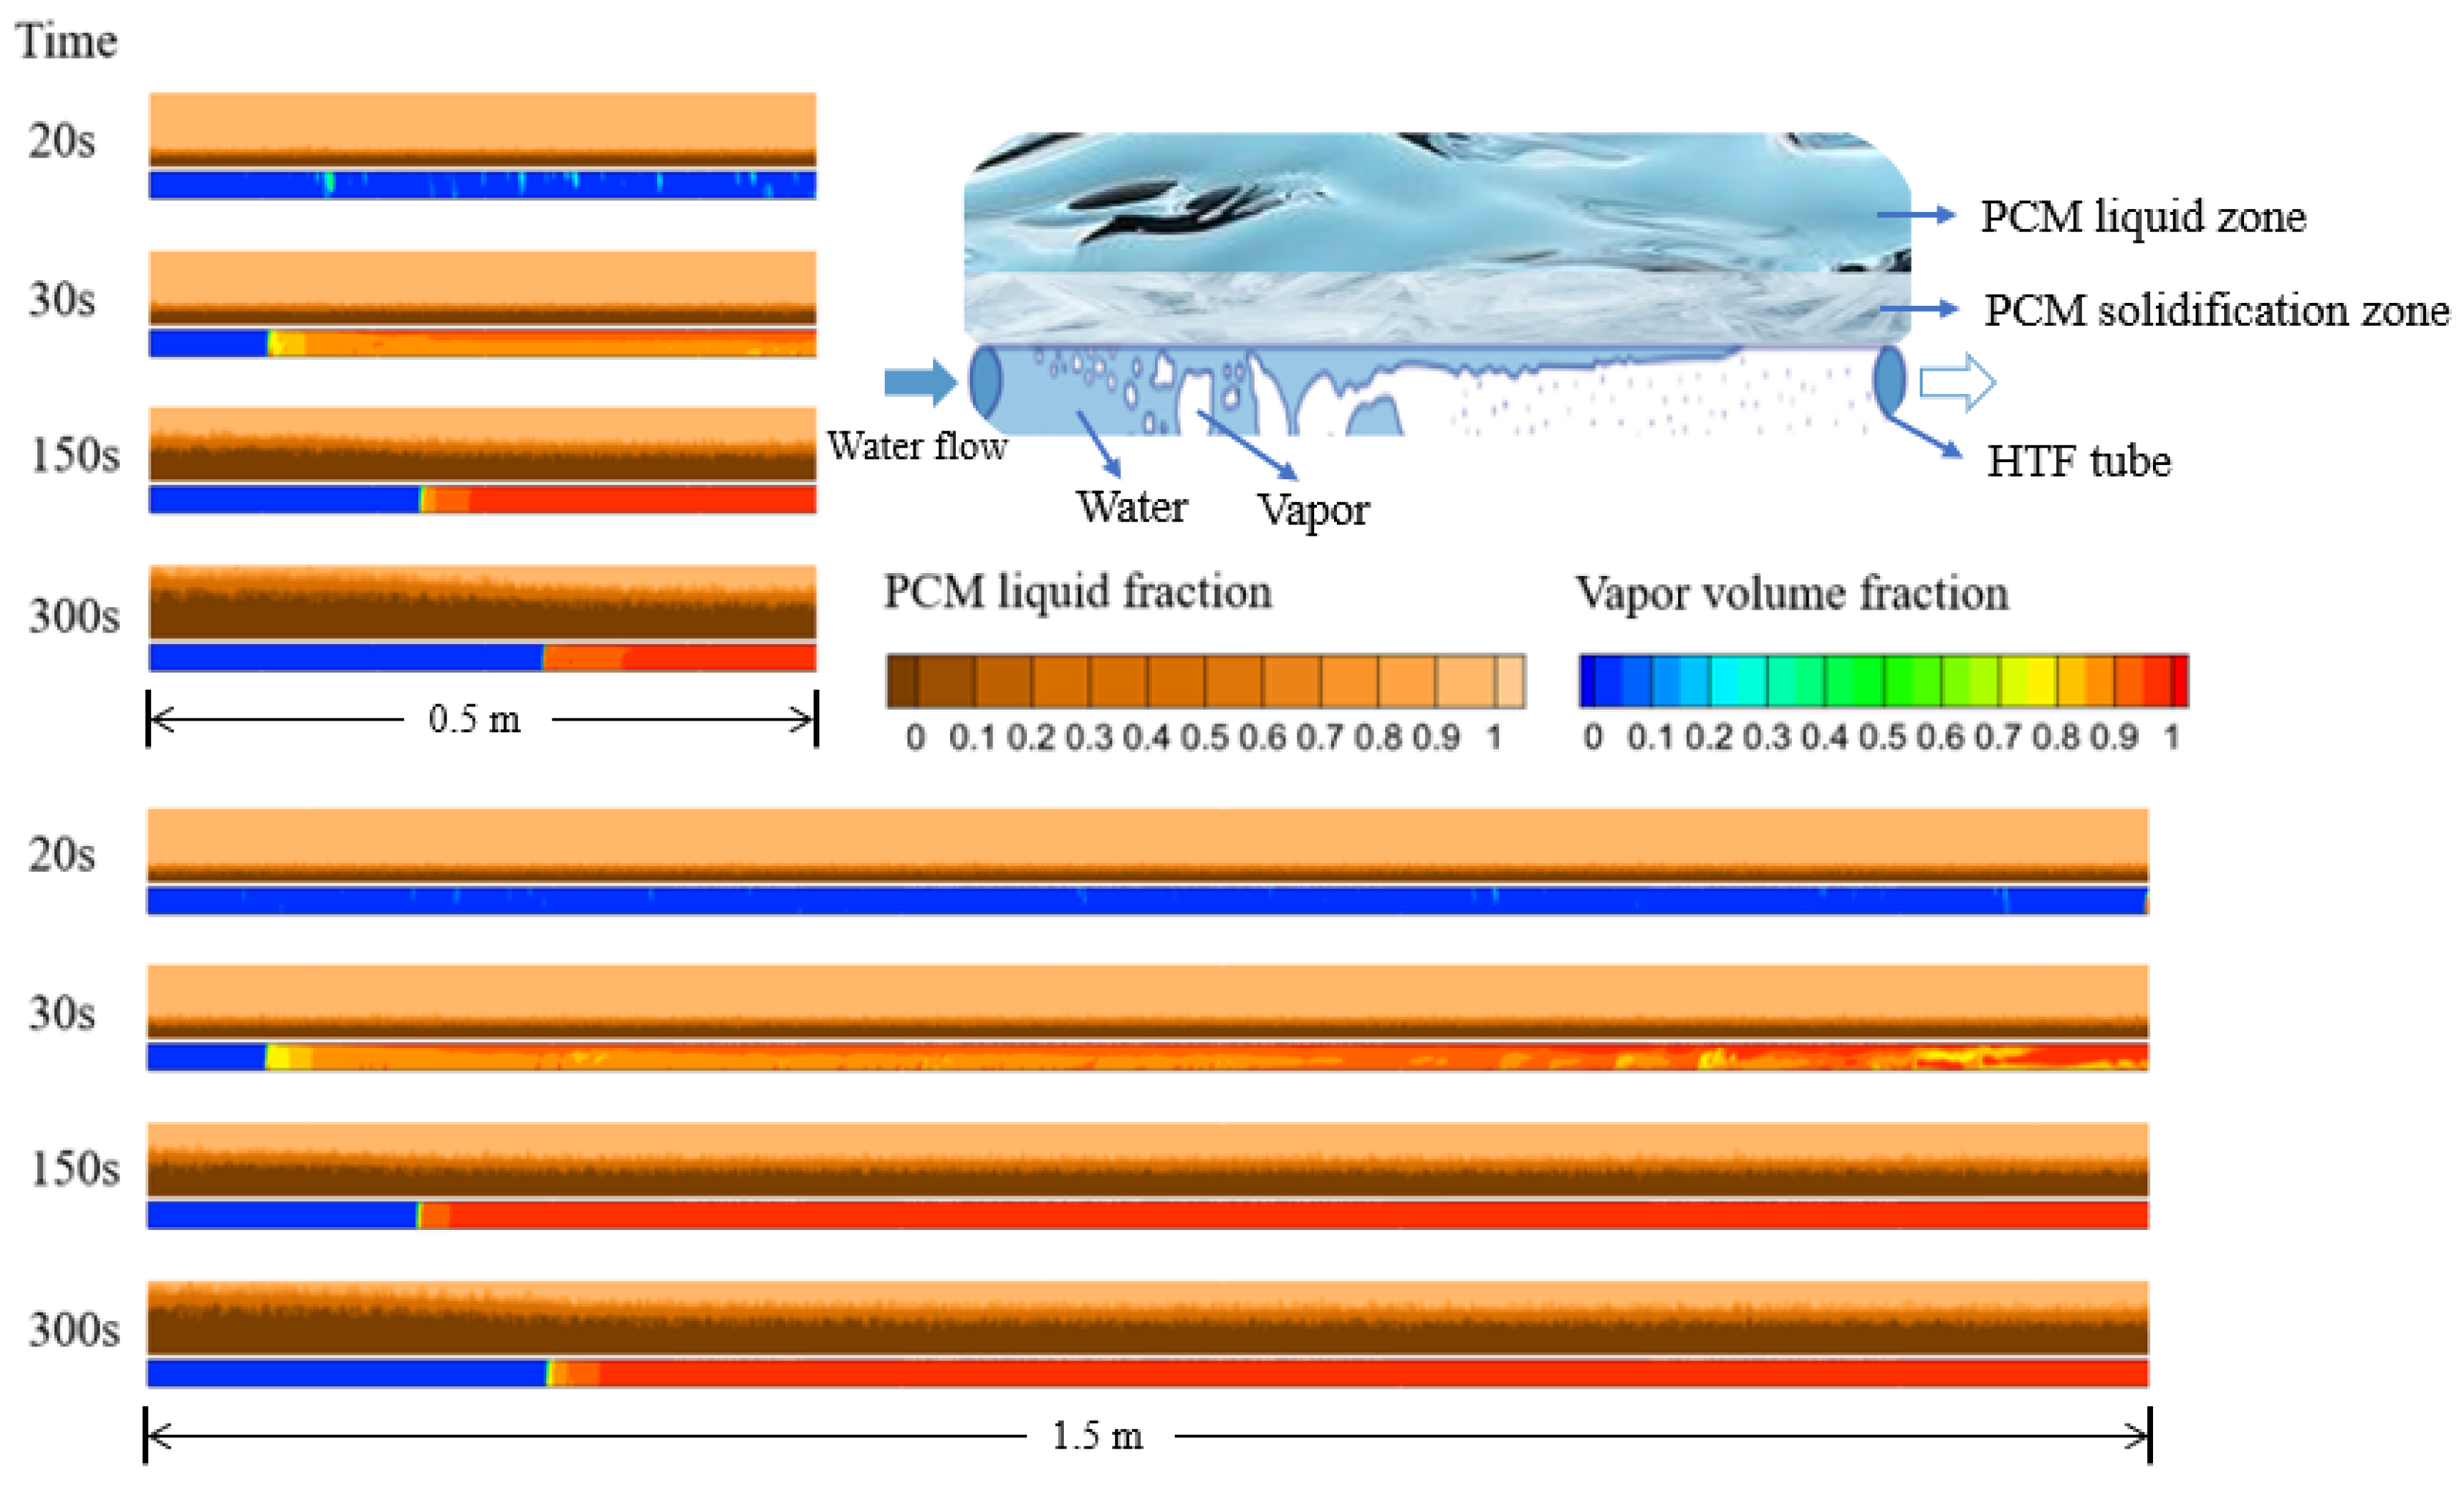
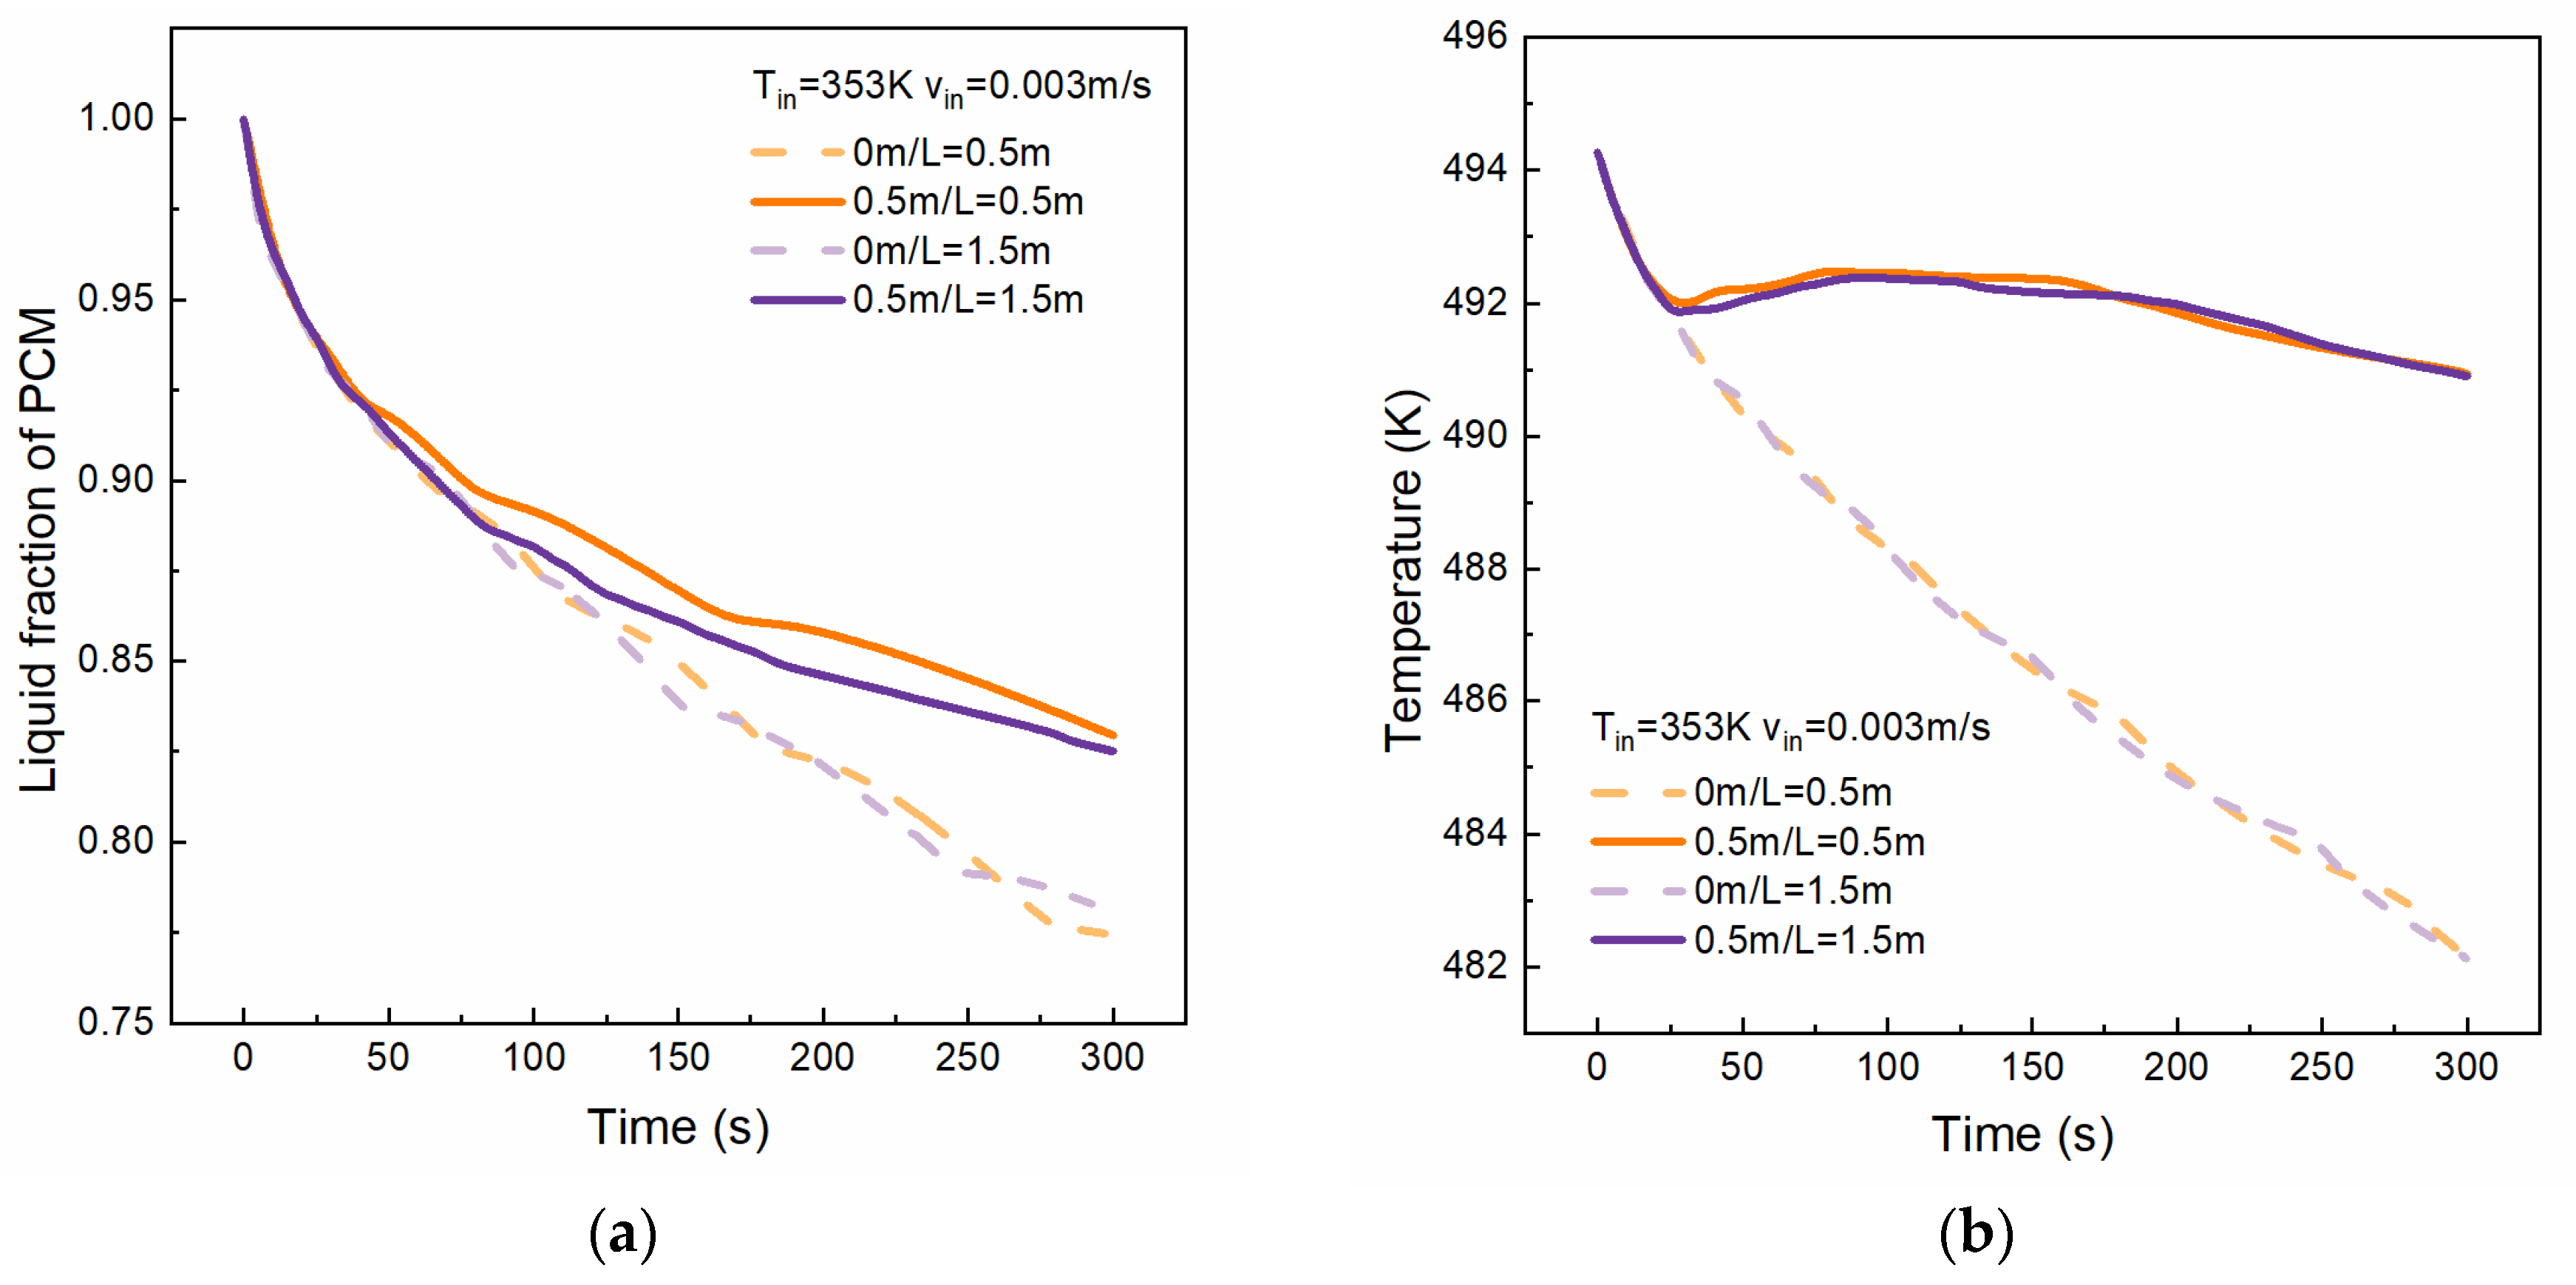
4.1. Effect of Tube Length
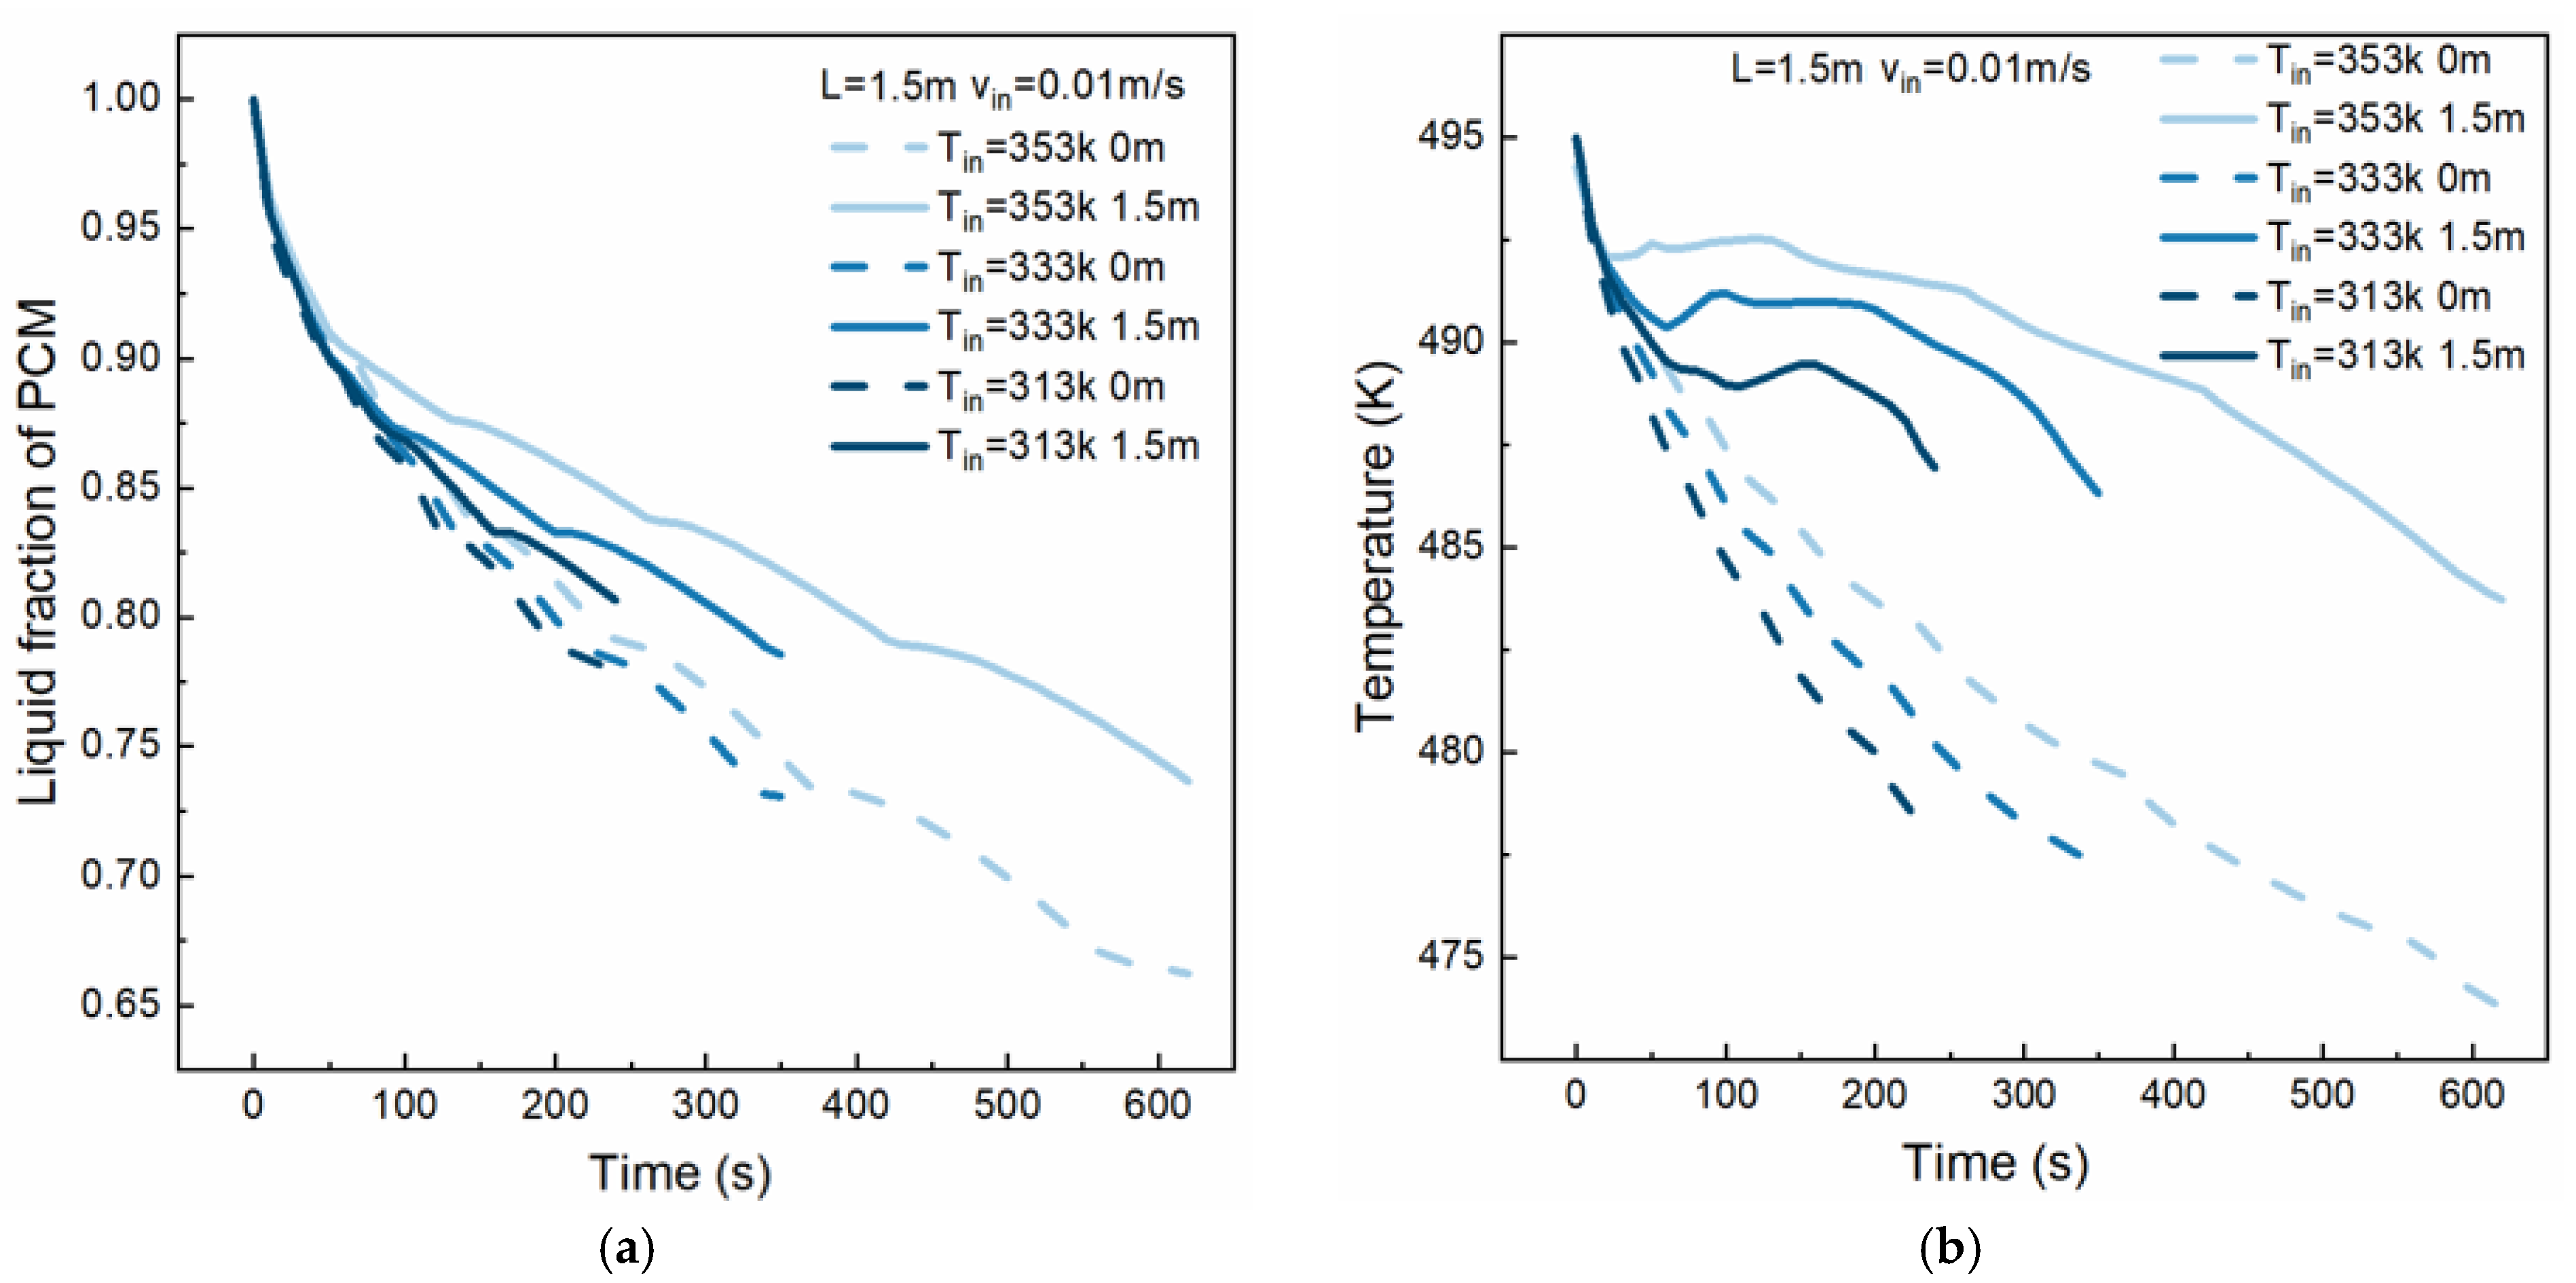
4.2. Effect of HTF Inlet Temperature
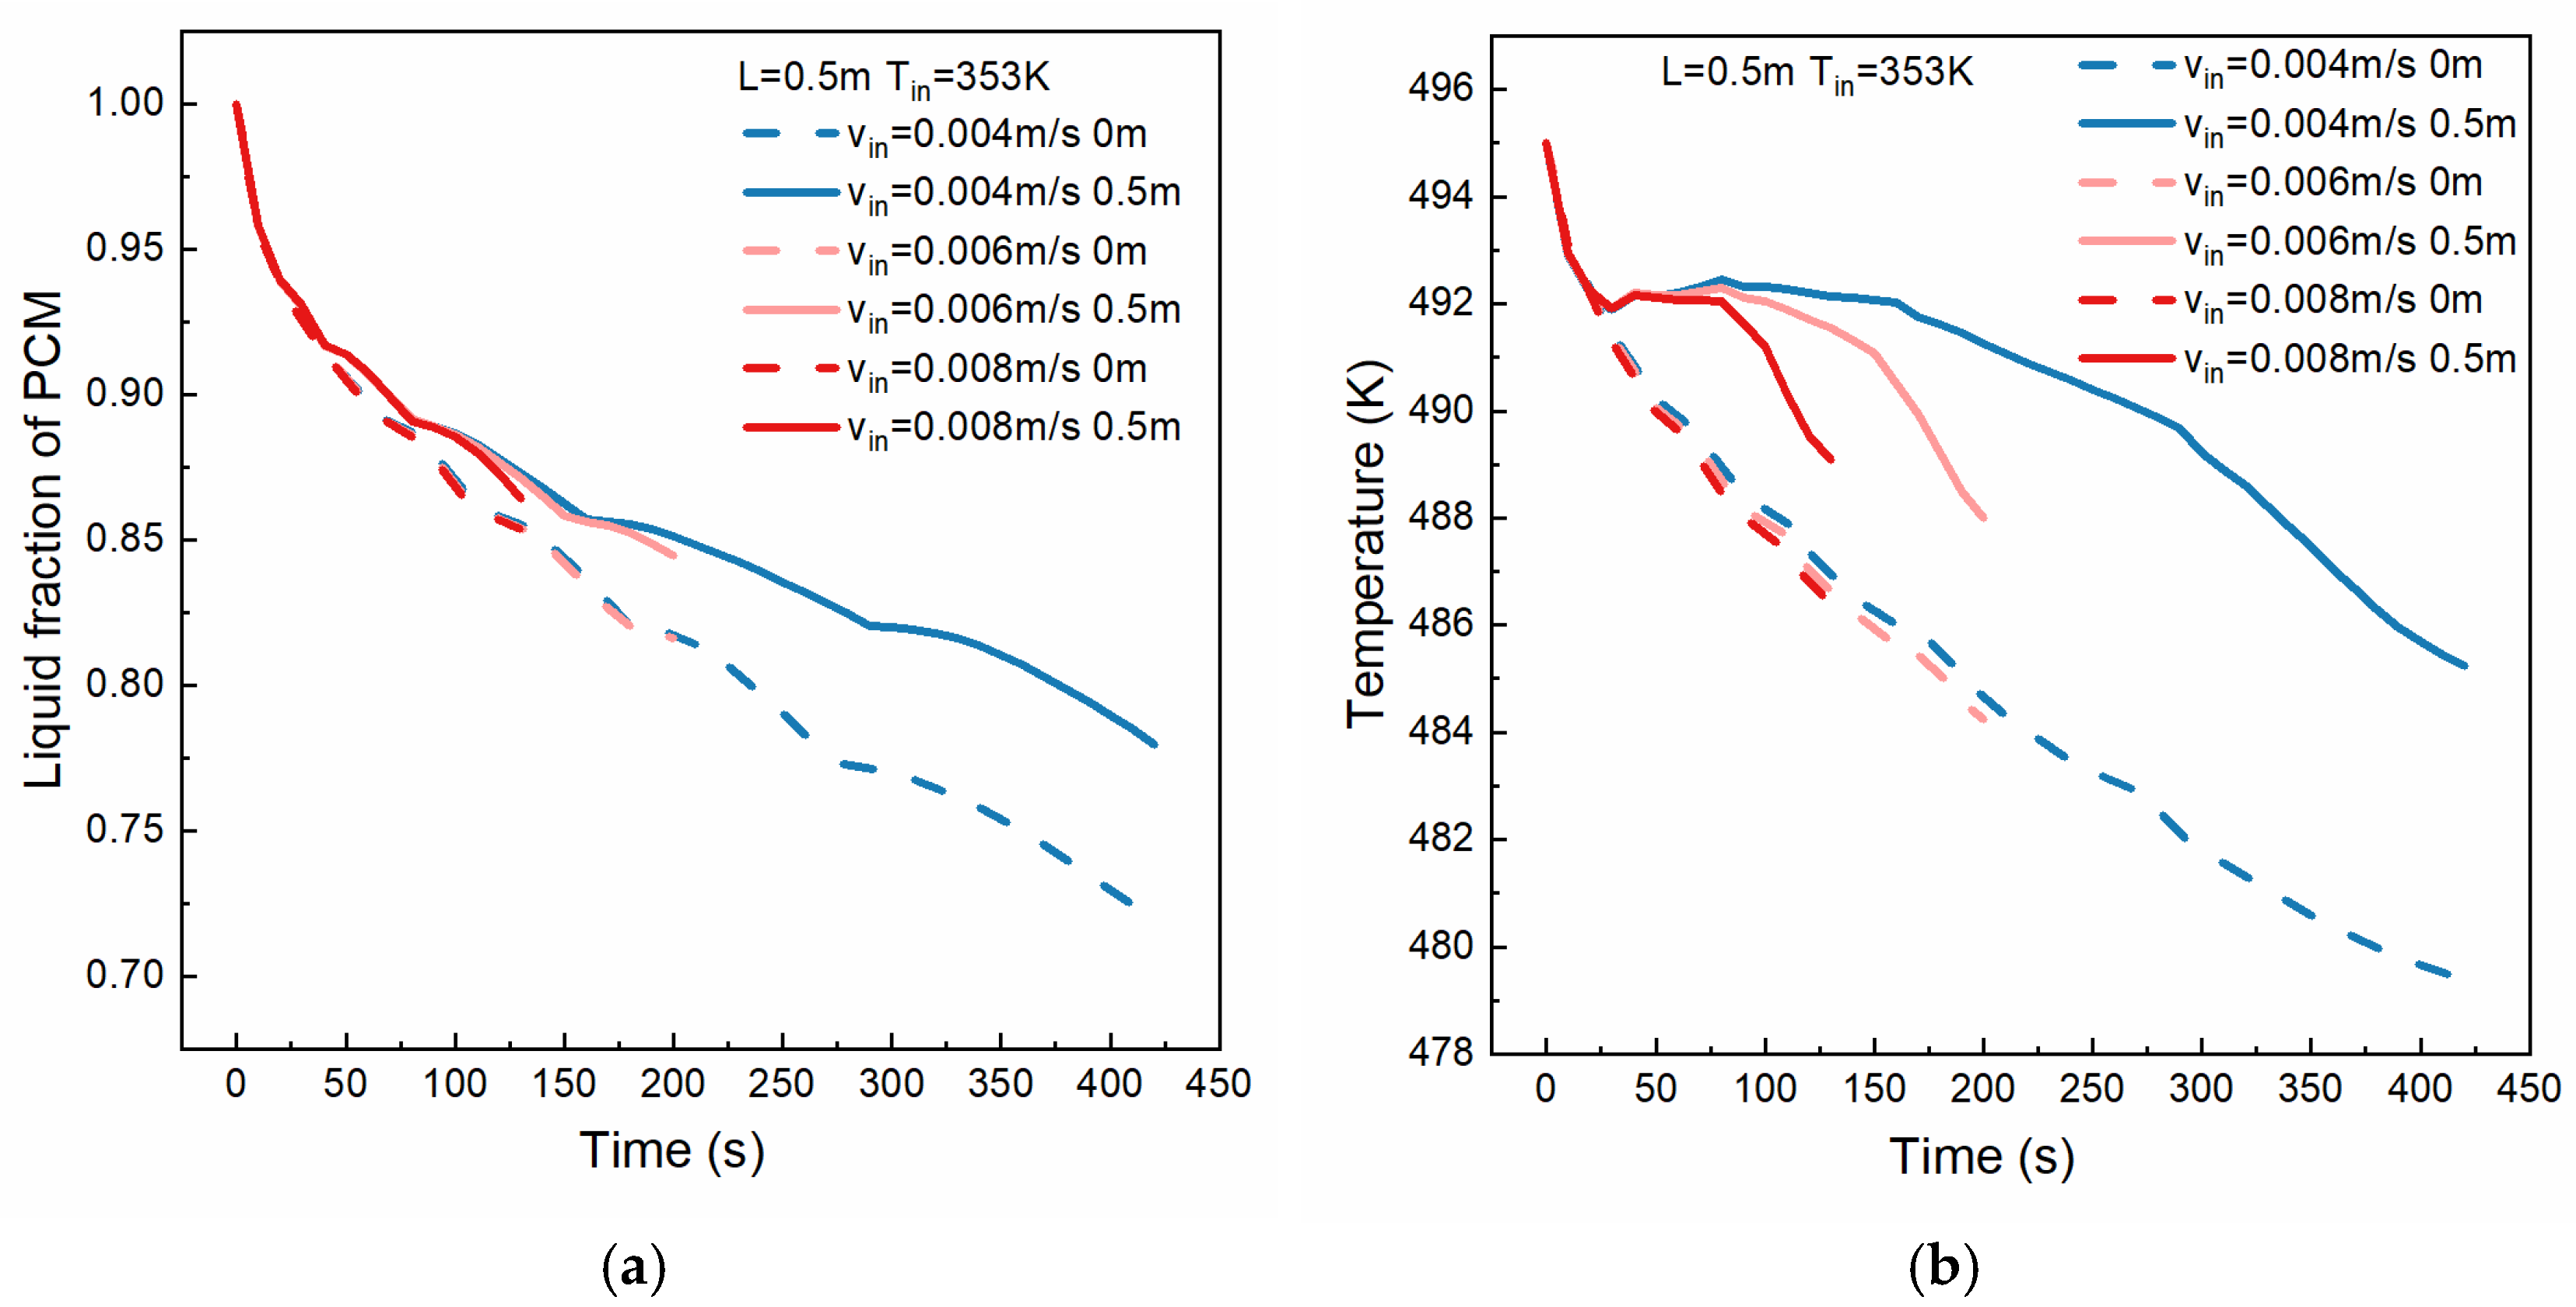
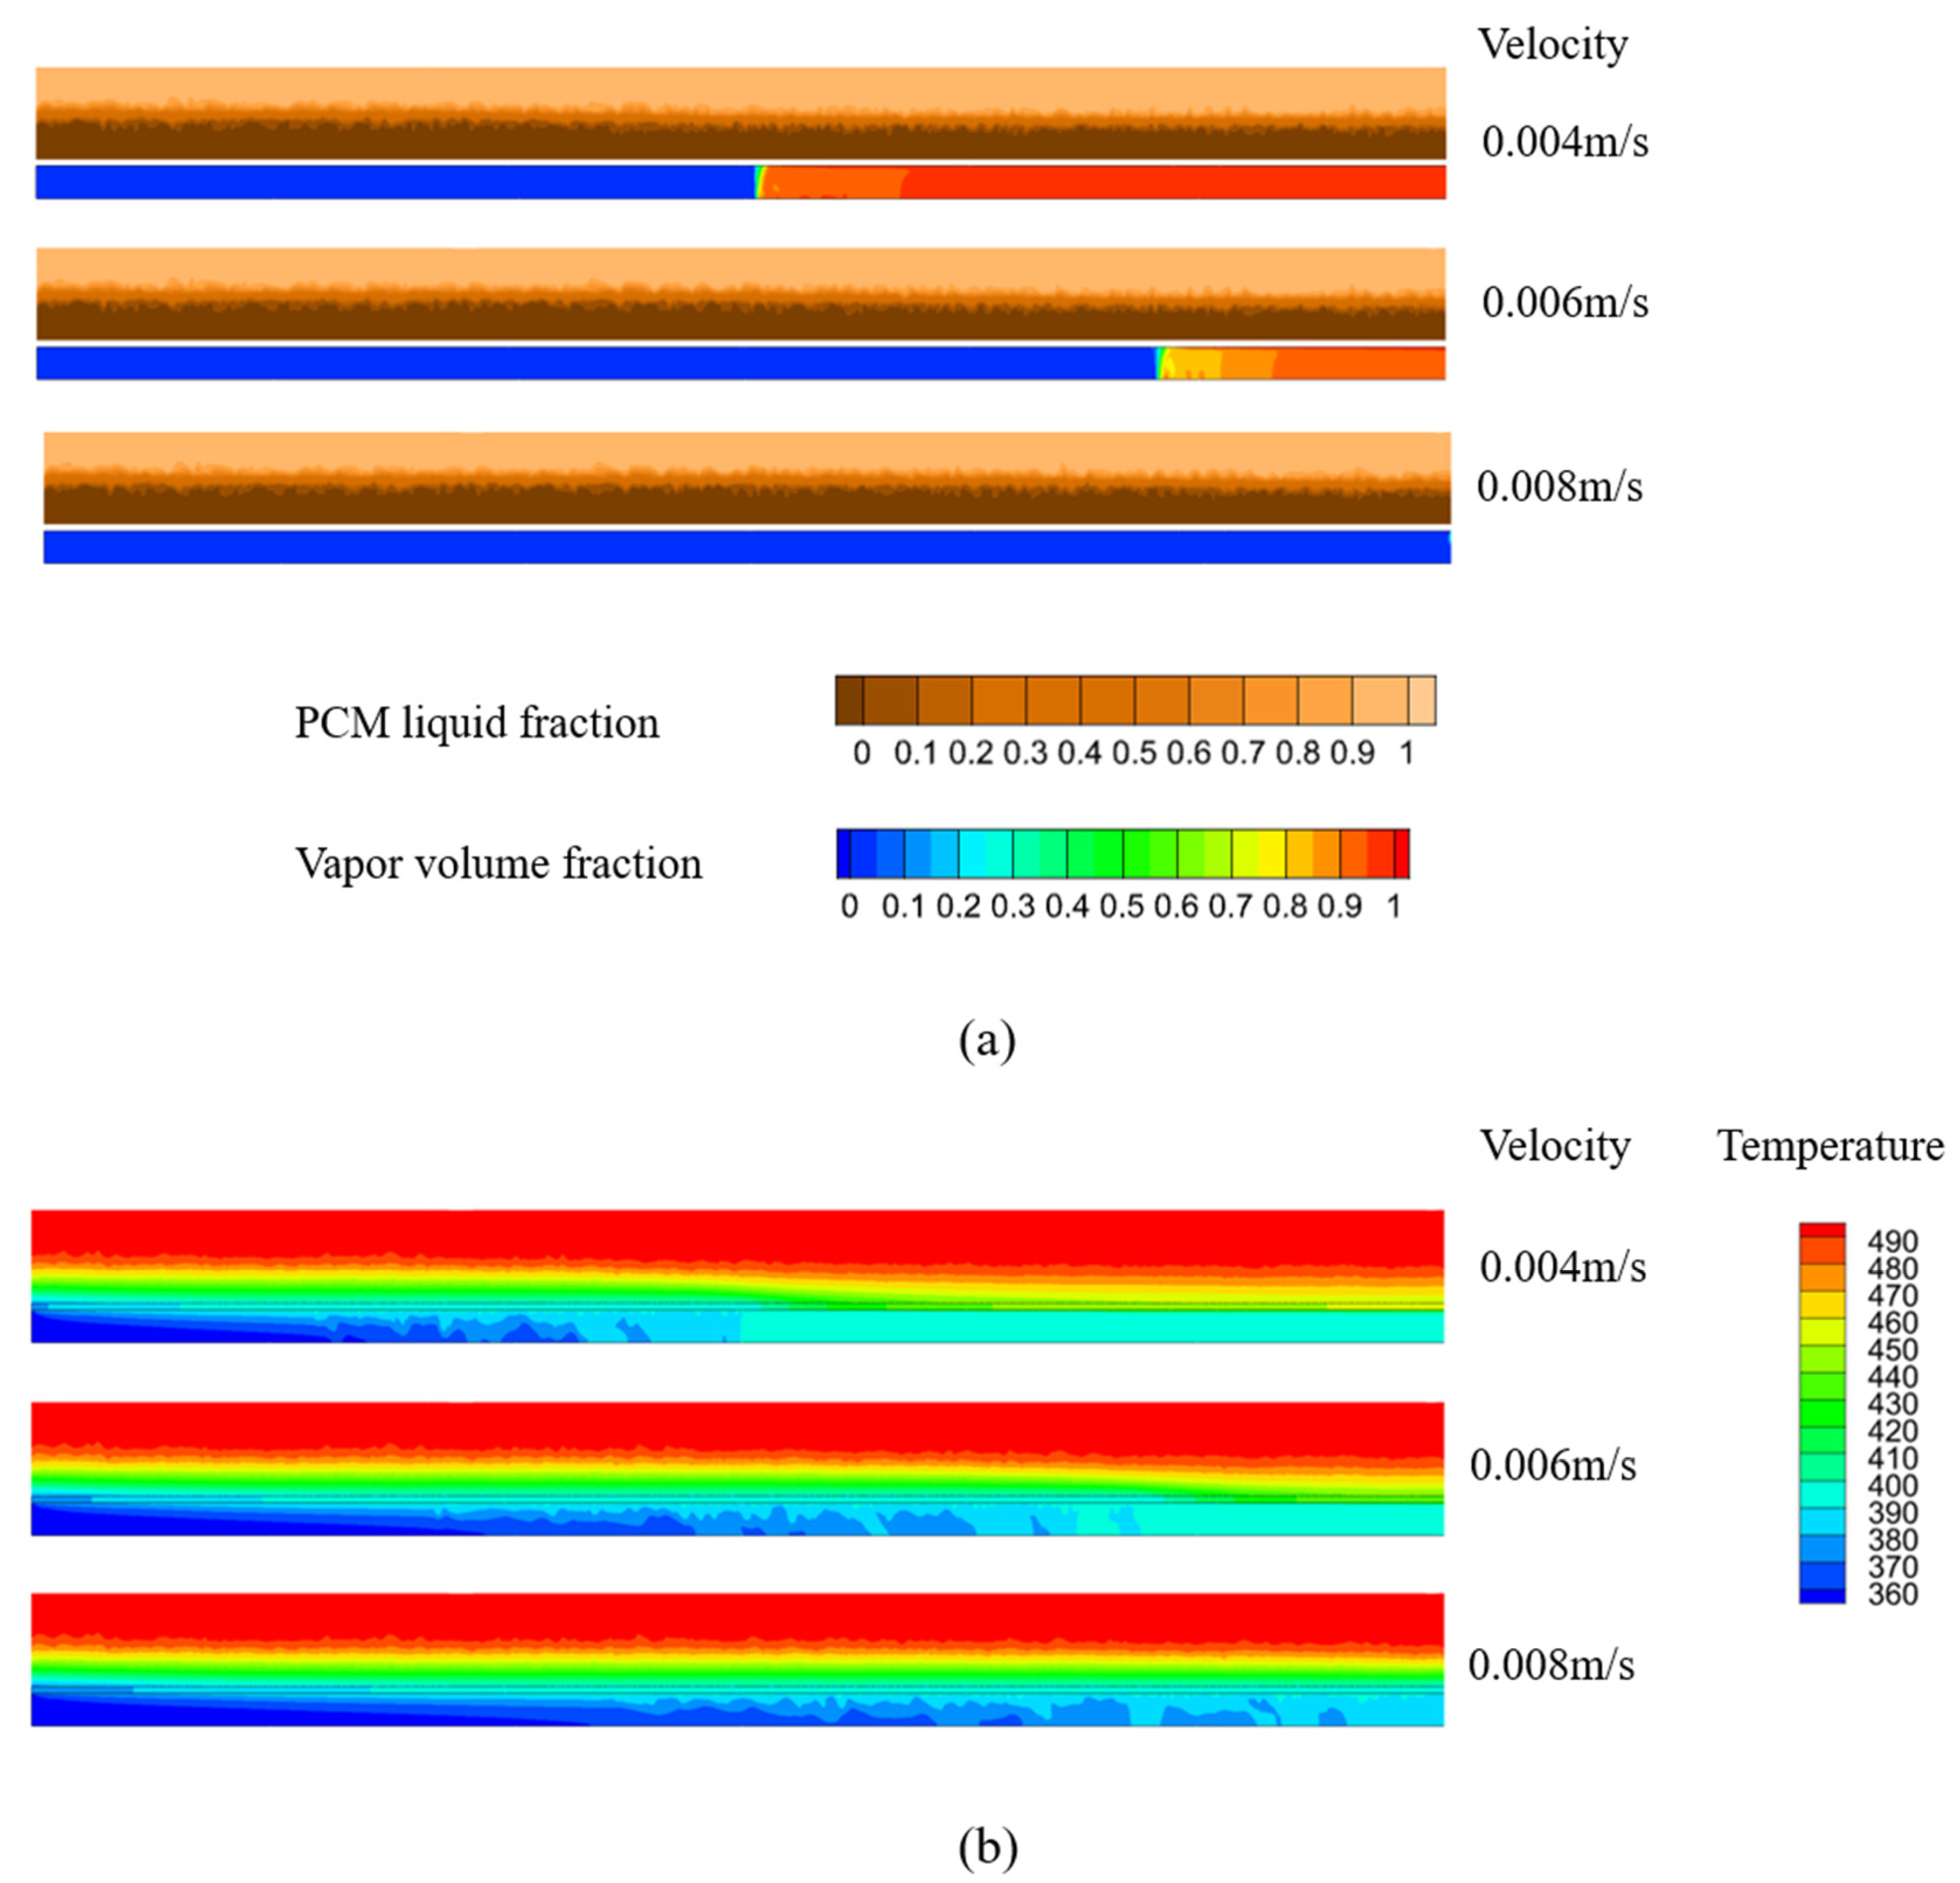
4.3. Effect of HTF Inlet Flow Rate
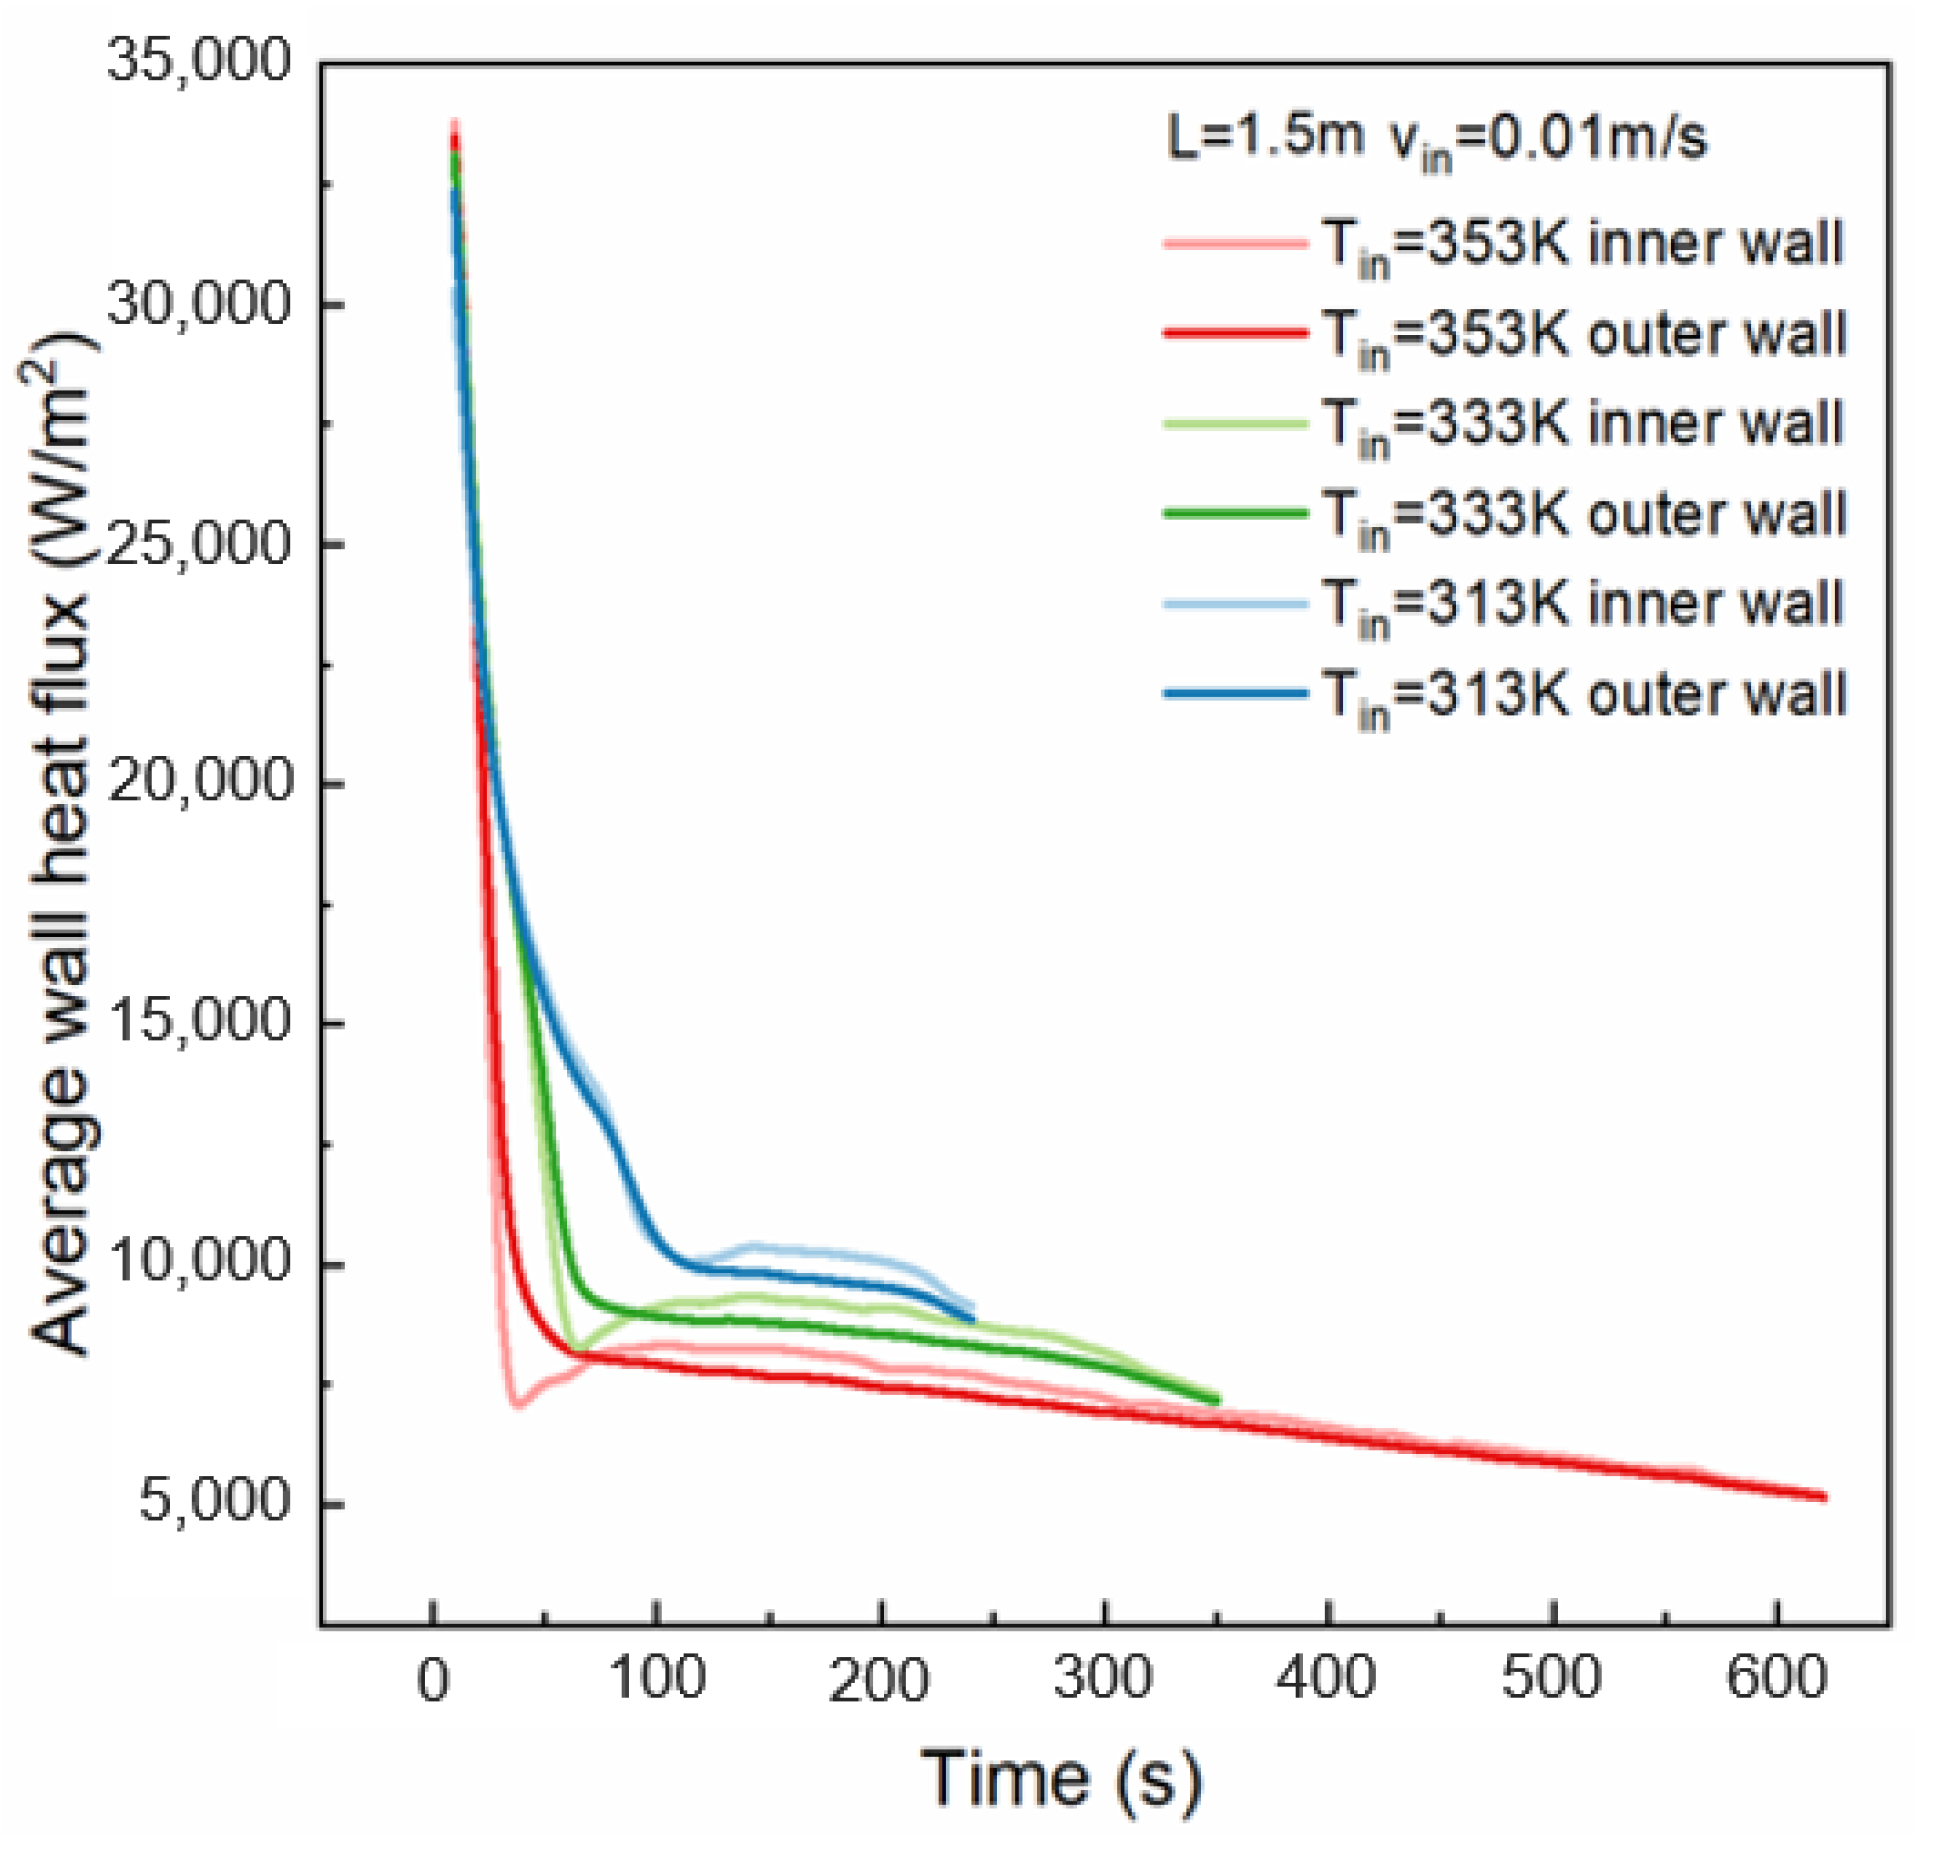
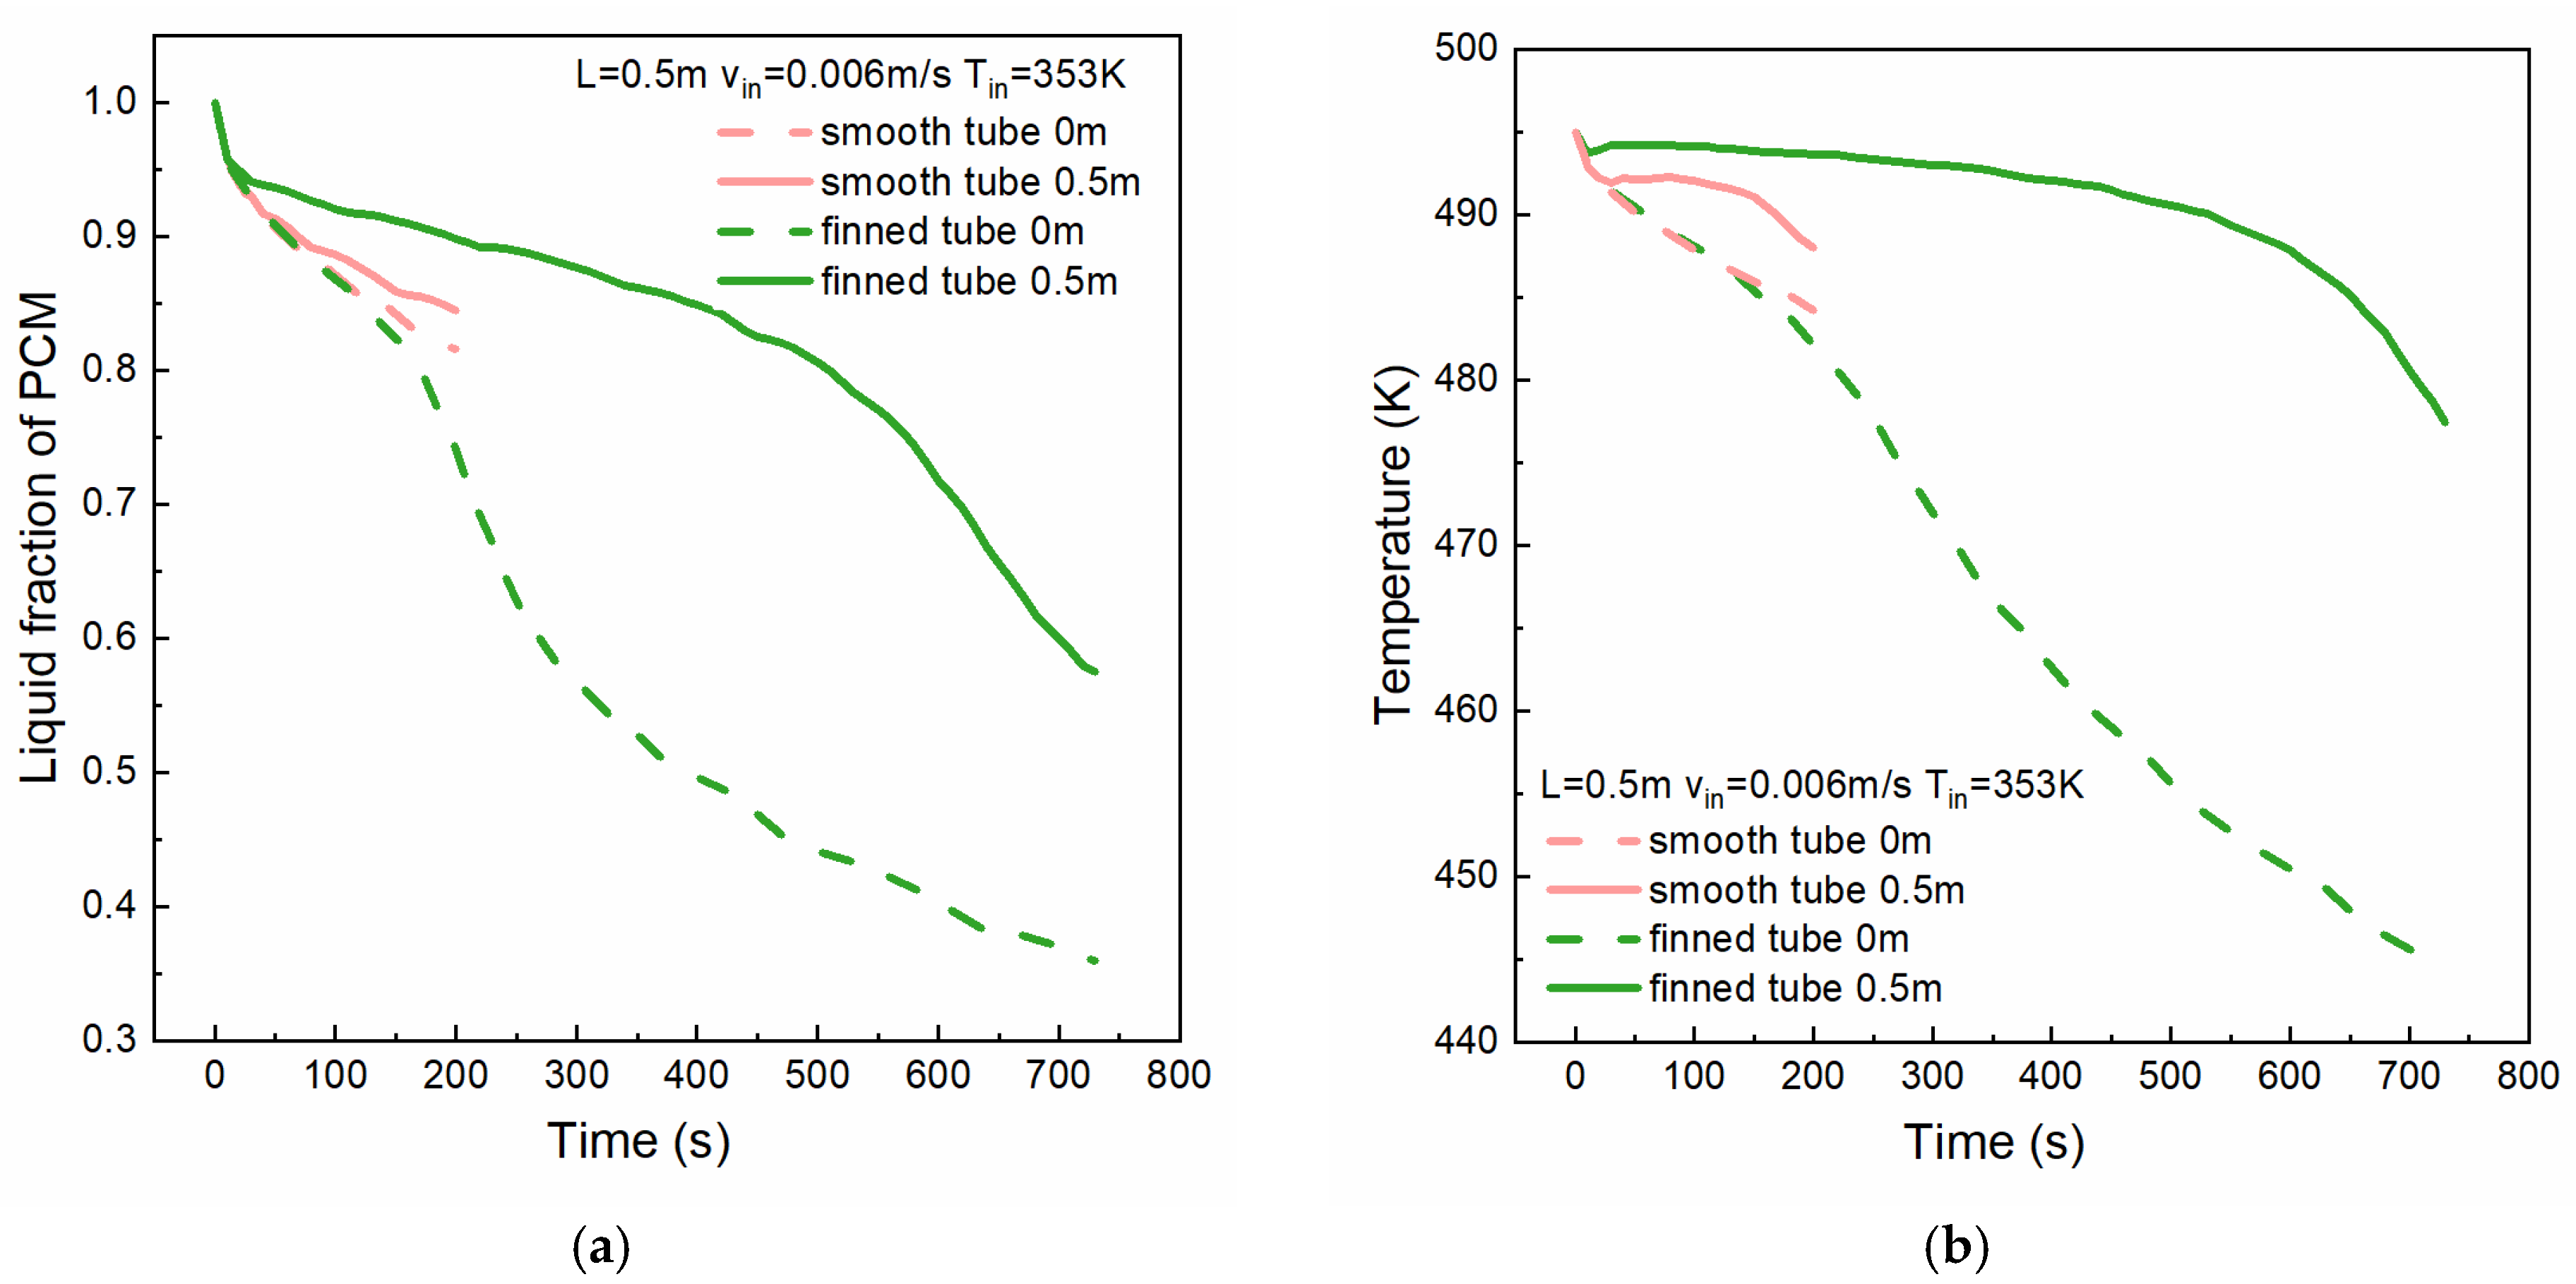
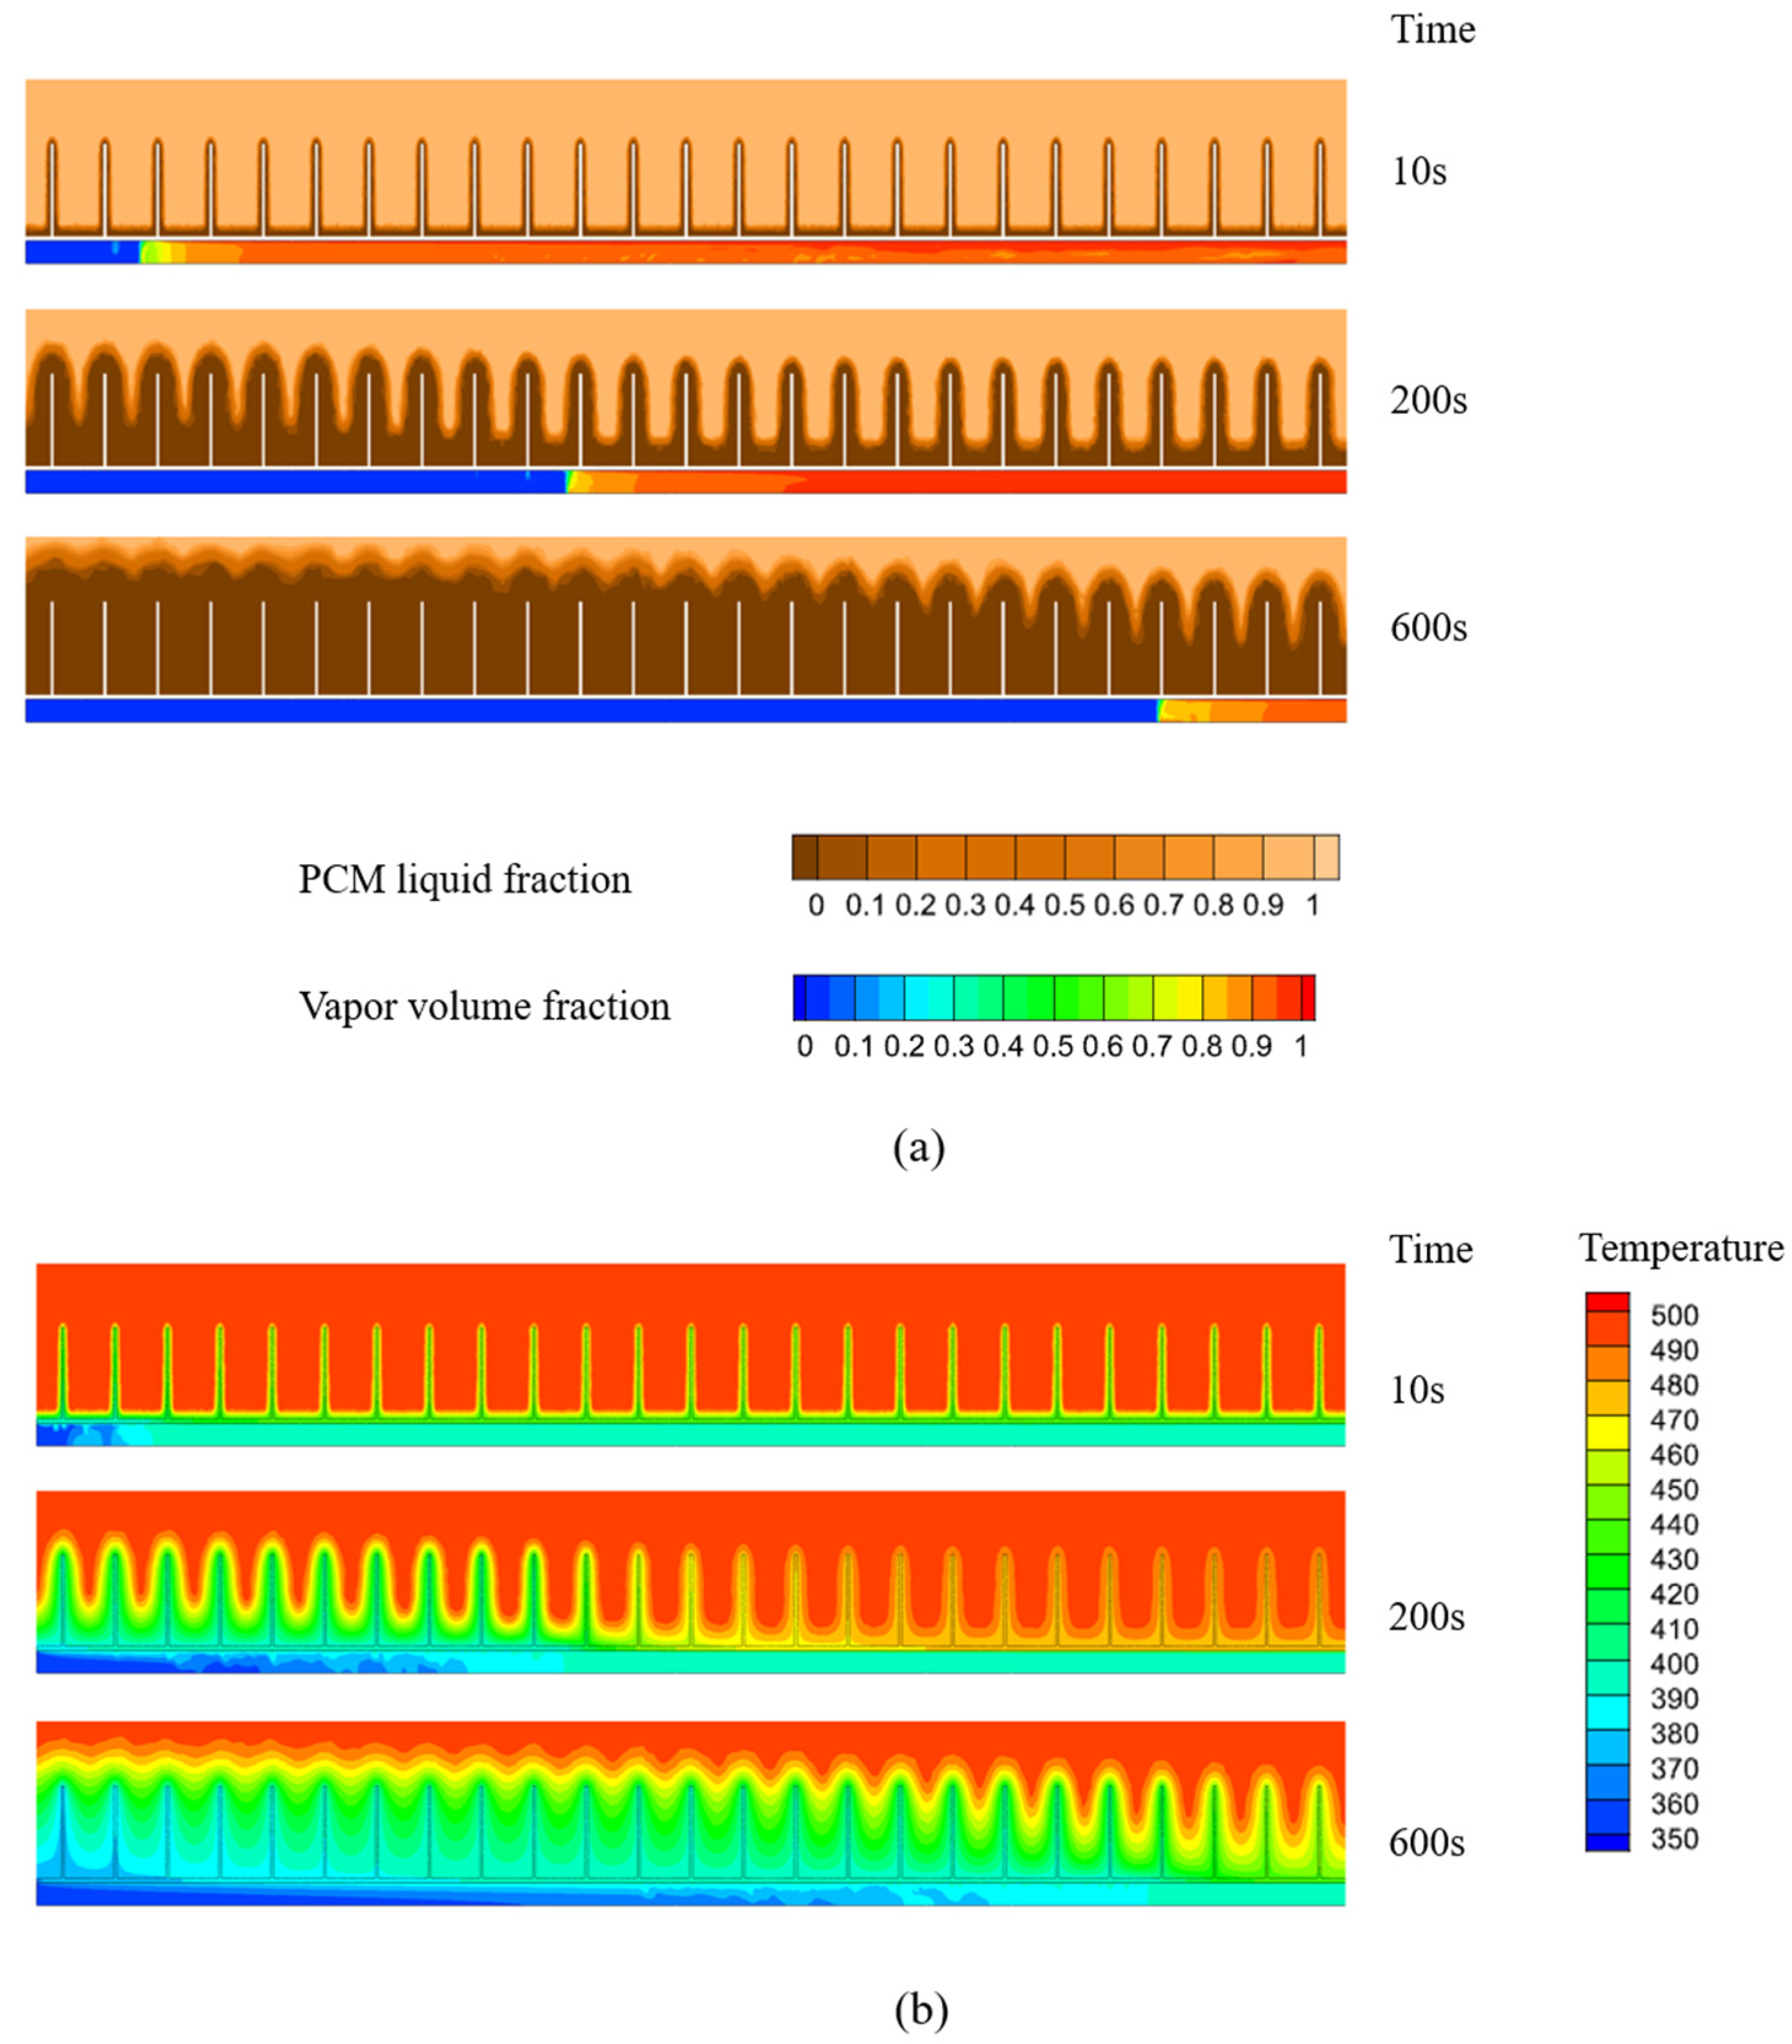
4.4. Effect of Finned Tubes
5. Conclusions
- (1)
- Tube length predominantly influences the boiling duration, subsequently affecting PCM solidification, with longer durations resulting in thicker solidification layers. In this model, the boiling duration inside a 1.5 m tube is approximately eight times that of a 0.5 m tube.
- (2)
- The inlet temperature of the HTF determines the amount of heat absorbed by the HTF before reaching the boiling point. The solidified PCM thickness difference between the inlet and outlet cross sections is smaller at lower inlet temperatures. At 200 s, the difference in the solidification thickness of the PCM at the inlet and outlet under an HTF inlet temperature of 313 K is 1.4% lower than that under an HTF inlet temperature of 353 K.
- (3)
- The HTF inlet flow rate affects the temperature of the solidified PCM layer. While solidification thickness remains largely unchanged in cases with high HTF velocity, the temperature gradient within the solidified layer increases. At 130 s, the average temperature of the PCM under an HTF inlet velocity of 0.008 m/s is 3 K lower than that under an HTF inlet velocity of 0.004 m/s.
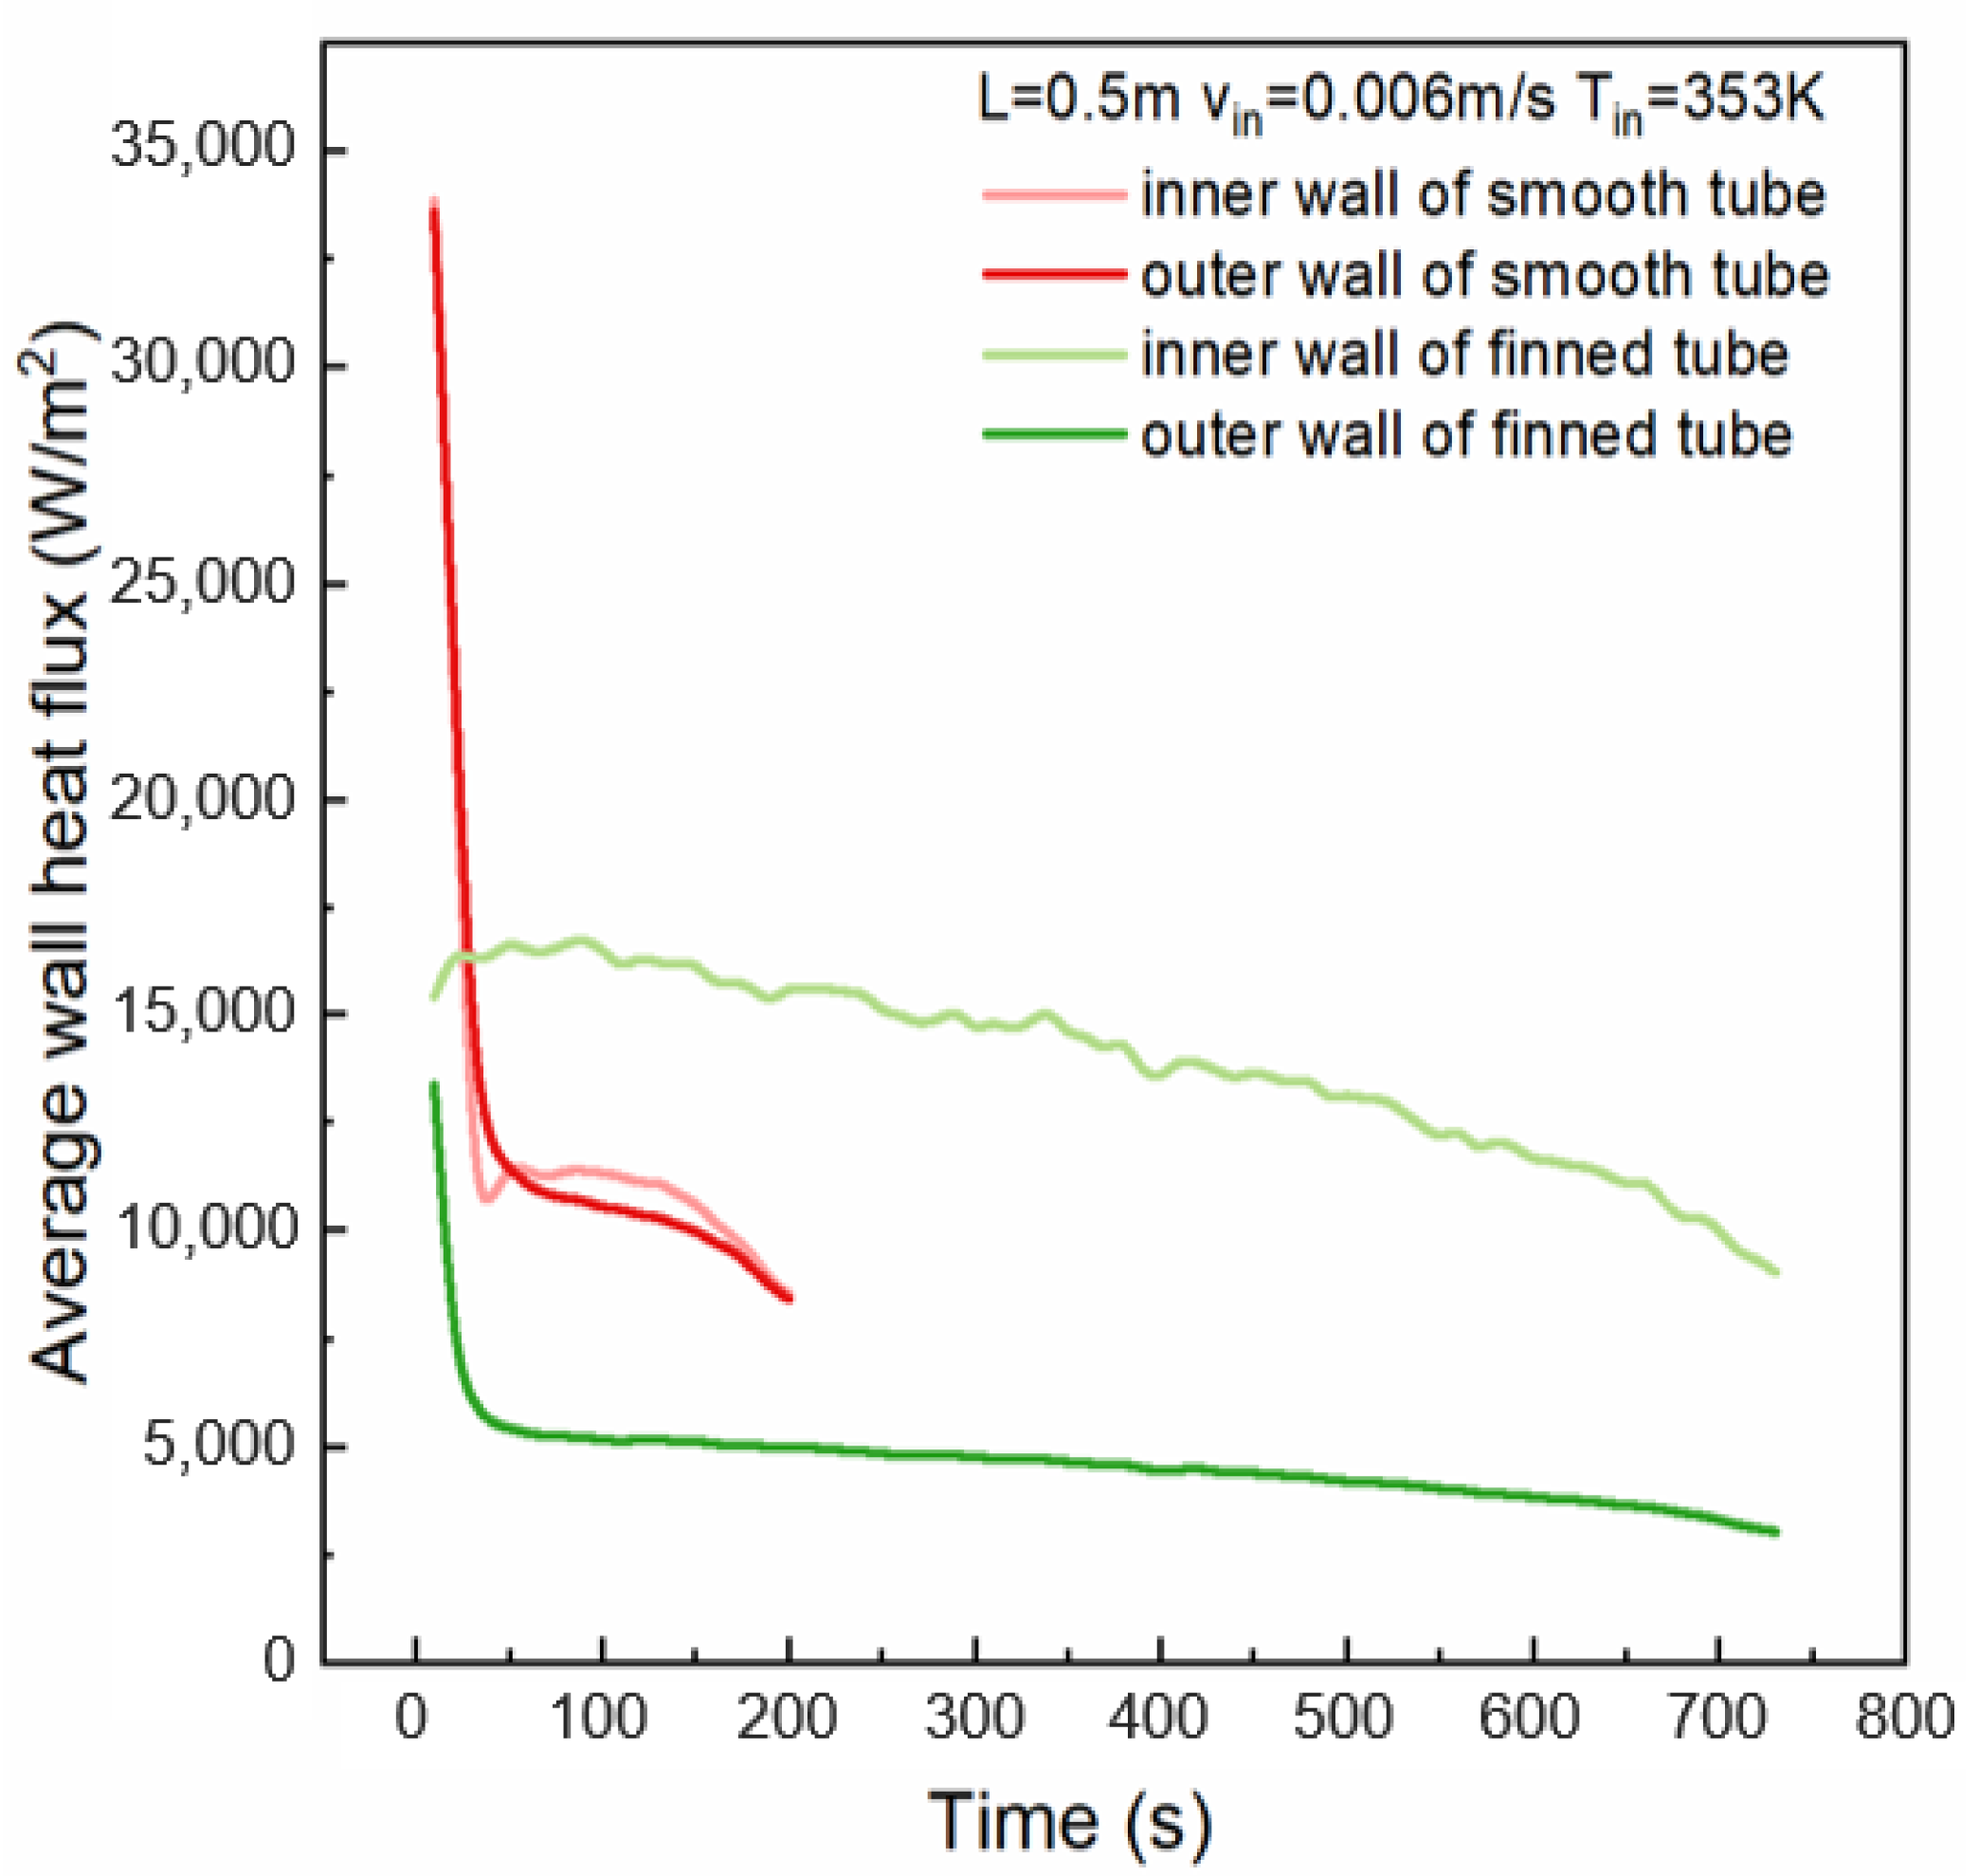
- (4)
- The installation of fins on the outer tube wall increases the contact area between the tube wall and the PCM, thereby augmenting the PCM’s heat transfer capacity. Compared to the smooth tube configuration, the presence of fins leads to a thicker solidified PCM layer, accompanied by lower temperatures in the solidified region. In this model, the finned tube’s inner wall average heat flux, at around 12,800 W/m2, is 1.3 times that of the smooth tube’s 9900 W/m2.
Author Contributions
Funding
Data Availability Statement
Acknowledgments
Conflicts of Interest
Nomenclature
| Nomenclature | |
| Mushy zone parameter (kg/m3) | |
| Specific heat (kJ/(kg·K)) | |
| E | Energy (J/kg) |
| F | Force (N) |
| f | Liquid fraction (m3) |
| G | Mass flow rate (kg/s) |
| g | Gravity (m/s2) |
| H | Total enthalpy (kJ/(kg·K)) |
| h | Sensible enthalpy (kJ/kg) |
| Latent enthalpy (kJ/(kg·K)) | |
| k | Thermal conductivity (W/(m·K)) |
| Latent heat (kJ/kg) | |
| m | Mass (kg) |
| Mass transfer rate (kg/(m2·s)) | |
| p | Pressure (Pa) |
| q | Heat flux (W/m2) |
| Empirical coefficients in the Lee model (s−1) | |
| S | Source term |
| T | Temperature (°C) |
| t | Time (s) |
| v, u | Velocity (m/s) |
| 2D | Two-dimensional |
| Greek symbols | |
| Volume fraction | |
| Thermal expansion coefficient (K−1) | |
| Small number | |
| Density (kg/m3) | |
| Dynamic viscosity (kg/m·s) | |
| Subscripts | |
| ave | Average |
| c | Condenser section |
| e | Evaporator section |
| v | Vapor |
| l | Liquid |
| s | Solid |
| ini | Initial |
| eff | Effective |
| mush | Mushy zone |
| ref | Reference |
| sat | Saturation |
| w | Wall |
| vol | Volume |
References
- Aftab, W.; Usman, A.; Shi, J.; Yuan, K.; Qin, M.; Zou, R. Phase change material-integrated latent heat storage systems for sustainable energy solutions. Energy Environ. Sci. 2021, 14, 4268–4291. [Google Scholar] [CrossRef]
- Pomerantseva, E.; Bonaccorso, F.; Feng, X.; Cui, Y.; Gogotsi, Y. Energy storage: The future enabled by nanomaterials. Science 2019, 366, eaan8285. [Google Scholar] [CrossRef] [PubMed]
- Lyden, A.; Brown, C.S.; Kolo, I.; Falcone, G.; Friedrich, D. Seasonal thermal energy storage in smart energy systems: District-level applications and modelling approaches. Renew. Sustain. Energy Rev. 2022, 167, 112760. [Google Scholar] [CrossRef]
- Pignata, A.; Minuto, F.D.; Lanzini, A.; Papurello, D. A feasibility study of a tube bundle exchanger with phase change materials: A case study. J. Build. Eng. 2023, 78, 107622. [Google Scholar] [CrossRef]
- Zuo, X.; Li, Q.; Tang, Y.; Li, Y.; Zhao, X.; Yang, H. Experimental and numerical investigation of building envelopes constructed with mineral based composite phase change material for thermal management. Constr. Build. Mater. 2025, 474, 141067. [Google Scholar] [CrossRef]
- Brückner, S.; Liu, S.; Miró, L.; Radspieler, M.; Cabeza, L.F.; Lävemann, E. Industrial waste heat recovery technologies: An economic analysis of heat transformation technologies. Appl. Energy 2015, 151, 157–167. [Google Scholar] [CrossRef]
- Kargar, M.R.; Baniasadi, E.; Mosharaf-Dehkordi, M. Numerical analysis of a new thermal energy storage system using phase change materials for direct steam parabolic trough solar power plants. Sol. Energy 2018, 170, 594–605. [Google Scholar] [CrossRef]
- Bian, R.; Deng, Y.; Feng, C.; Yu, B.; Sun, D.; Zhang, W. Performance and optimization study of graded thermal energy storage system for direct steam generation dish type solar thermal power. Case Stud. Therm. Eng. 2023, 49, 103369. [Google Scholar] [CrossRef]
- Jain, S.; Kumar, K.R.; Rakshit, D.; Premachandran, B.; Reddy, K.S. Cyclic performance assessment of medium-temperature cascade thermal energy storage. J. Energy Storage 2023, 68, 107662. [Google Scholar] [CrossRef]
- Li, C.; Leng, G.; Han, L.; Li, Q.; Lu, H.; Xu, R.; Bai, Z.; Du, Y.; Wu, Y. Preparation and characterization of quinary nitrate salt based composite phase change material with low melting point for low and medium temperature thermal energy storage. J. Energy Storage 2023, 74, 109277. [Google Scholar] [CrossRef]
- Lv, L.; Huang, S.; Zhou, H. Heat transfer and thermal performance investigation on a visualized latent heat storage system in pilot-scale: Scalable medium-temperature thermal energy storage system. J. Clean. Prod. 2023, 426, 139141. [Google Scholar] [CrossRef]
- Mahdi, J.M.; Lohrasbi, S.; Nsofor, E.C. Hybrid heat transfer enhancement for latent-heat thermal energy storage systems: A review. Int. J. Heat Mass Transf. 2019, 137, 630–649. [Google Scholar] [CrossRef]
- Yazici, M.Y.; Saglam, M.; Aydin, O.; Avci, M. Thermal energy storage performance of PCM/graphite matrix composite in a tube-in-shell geometry. Therm. Sci. Eng. Prog. 2021, 23, 100915. [Google Scholar] [CrossRef]
- Chibani, A.; Merouani, S.; Laidoudi, H.; Dehane, A.; Bendada, L.; Lamiri, L.; Mecheri, G.; Bougriou, C.; Gherraf, N. Numerical simulation and analysis of heat transfer and melting rate of nano-enhanced PCM composite embedded in a concentrator photovoltaic system. J. Energy Storage 2023, 73, 109247. [Google Scholar] [CrossRef]
- Sardari, P.T.; Giddings, D.; Grant, D.; Gillott, M.; Walker, G.S. Discharge of a composite metal foam/phase change material to air heat exchanger for a domestic thermal storage unit. Renew. Energy 2020, 148, 987–1001. [Google Scholar] [CrossRef]
- Yang, X.; Guo, J.; Yang, B.; Cheng, H.; Wei, P.; He, Y.-L. Design of non-uniformly distributed annular fins for a shell-and-tube thermal energy storage unit. Appl. Energy 2020, 279, 115772. [Google Scholar] [CrossRef]
- Mostafavi, A.; Parhizi, M.; Jain, A. Semi-analytical thermal modeling of transverse and longitudinal fins in a cylindrical phase change energy storage system. Int. J. Therm. Sci. 2020, 153, 106352. [Google Scholar] [CrossRef]
- Nicholls, R.A.; Moghimi, M.A.; Griffiths, A.L. Impact of fin type and orientation on performance of phase change material-based double pipe thermal energy storage. J. Energy Storage 2022, 50, 104671. [Google Scholar] [CrossRef]
- Punniakodi, B.M.S.; Senthil, R. Enhanced heat transfer in a phase change energy storage with helical tubes. J. Energy Storage 2023, 58, 106352. [Google Scholar] [CrossRef]
- Maldonado, J.M.; de Gracia, A.; Cabeza, L.F. Systematic review on the use of heat pipes in latent heat thermal energy storage tanks. J. Energy Storage 2020, 32, 101733. [Google Scholar] [CrossRef]
- Tiari, S.; Qiu, S.; Mahdavi, M. Discharging process of a finned heat pipe–assisted thermal energy storage system with high temperature phase change material. Energy Convers. Manag. 2016, 118, 426–437. [Google Scholar] [CrossRef]
- Bouzgarrou, F.; Mellouli, S.; Alqahtani, T.; Algarni, S. Parametric study of a metal hydride reactor with phase change materials and heat pipes. Int. J. Energy Res. 2022, 46, 4588–4598. [Google Scholar] [CrossRef]
- Seddegh, S.; Wang, X.; Henderson, A.D. Numerical investigation of heat transfer mechanism in a vertical shell and tube latent heat energy storage system. Appl. Therm. Eng. 2015, 87, 698–706. [Google Scholar] [CrossRef]
- Harmen, Y.; Chhiti, Y.; El Fiti, M.; Salihi, M.; Jama, C. Eccentricity analysis of annular multi-tube storage unit with phase change material. J. Energy Storage 2023, 64, 107211. [Google Scholar] [CrossRef]
- Seddegh, S.; Wang, X.; Henderson, A.D. A comparative study of thermal behaviour of a horizontal and vertical shell-and-tube energy storage using phase change materials. Appl. Therm. Eng. 2016, 93, 348–358. [Google Scholar] [CrossRef]
- Entezari, S.; Taheri, A.; Khatibi, M.; Niazmand, H. Acceleration of melting process of phase change material using an innovative triplex-tube helical-coil storage unit: Three-dimensional numerical study. J. Energy Storage 2021, 39, 102603. [Google Scholar] [CrossRef]
- Abbasi, M.; Mousavi, S.M.; Lee, B.J.; Esfahani, J.A.; Karimi, N.; Mamaghani, M.Y. Examination of the effects of porosity upon intensification of thermal storage of PCMs in a shell-and-tube type system. Case Stud. Therm. Eng. 2022, 33, 101963. [Google Scholar] [CrossRef]
- Sriram, M.; Bhattacharya, A. Analysis and optimization of triple tube phase change material based energy storage system. J. Energy Storage 2021, 36, 102350. [Google Scholar] [CrossRef]
- Wang, L.-L.; Wang, L.-B.; Zhang, K.; Wang, Y.; Wang, W.-W. Prediction of the main characteristics of the shell and tube bundle latent heat thermal energy storage unit using a shell and single-tube unit. Appl. Energy 2022, 323, 119633. [Google Scholar] [CrossRef]
- Fornarelli, F.; Camporeale, S.M.; Fortunato, B.; Torresi, M.; Oresta, P.; Magliocchetti, L.; Miliozzi, A.; Santo, G. CFD analysis of melting process in a shell-and-tube latent heat storage for concentrated solar power plants. Appl. Energy 2016, 164, 711–722. [Google Scholar] [CrossRef]
- Mekrisuh, K.U.; Singh, D.; Udayraj. Performance analysis of a vertically oriented concentric-tube PCM based thermal energy storage system: Parametric study and correlation development. Renew. Energy 2020, 149, 902–916. [Google Scholar] [CrossRef]
- Shaikh, M.; Uzair, M.; Allauddin, U. Effect of geometric configurations on charging time of latent-heat storage for solar applications. Renew. Energy 2021, 179, 262–271. [Google Scholar] [CrossRef]
- Costa, S.-C.; Mahkamov, K.; Kenisarin, M.; Ismail, M.; Lynn, K.; Halimic, E.; Mullen, D. Solar Salt Latent Heat Thermal Storage for a Small Solar Organic Rankine Cycle Plant. J. Energy Resour. Technol. 2019, 142, 031203. [Google Scholar] [CrossRef]
- Augspurger, M.; Becker, J.; Buchholz, J.; Udaykumar, H.S. Three-dimensional numerical and experimental investigation of the behavior of solar salts within thermal storage devices during phase change. Appl. Therm. Eng. 2018, 143, 791–811. [Google Scholar] [CrossRef]
- Yuan, Y.; Cao, X.; Xiang, B.; Du, Y. Effect of installation angle of fins on melting characteristics of annular unit for latent heat thermal energy storage. Sol. Energy 2016, 136, 365–378. [Google Scholar] [CrossRef]
- Darzi, A.R.; Farhadi, M.; Sedighi, K. Numerical study of melting inside concentric and eccentric horizontal annulus. Appl. Math. Model. 2012, 36, 4080–4086. [Google Scholar] [CrossRef]
- Ye, W.-B.; Zhu, D.-S.; Wang, N. Numerical simulation on phase-change thermal storage/release in a plate-fin unit. Appl. Therm. Eng. 2011, 31, 3871–3884. [Google Scholar] [CrossRef]
- Lee, H.; Kharangate, C.R.; Mascarenhas, N.; Park, I.; Mudawar, I. Experimental and computational investigation of vertical downflow condensation. Int. J. Heat Mass Transf. 2015, 85, 865–879. [Google Scholar] [CrossRef]
- Brackbill, J.U.; Kothe, D.B.; Zemach, C. A continuum method for modeling surface tension. J. Comput. Phys. 1992, 100, 335–354. [Google Scholar] [CrossRef]
- Lorenzini, D.; Joshi, Y.K. Computational Fluid Dynamics Modeling of Flow Boiling in Microchannels with Nonuniform Heat Flux. J. Heat Transf. 2017, 140, 011501. [Google Scholar] [CrossRef]
- Kim, S.; Lee, J.; Mudawar, I.; Hartwig, J. Computational investigation of vertical upflow boiling of liquid nitrogen and effects of bubble collision dispersion force. Int. J. Heat Mass Transf. 2023, 203, 123780. [Google Scholar] [CrossRef]

| Material | Thermophysical Property | Value |
|---|---|---|
| 60%NaNO3–40%KNO3 | Viscosity (Pa·s) | 0.00693 |
| Thermal conductivity (W/m·°C) | 0.55 | |
| Density (kg/m3) | 1925 | |
| Specific heat (J/kg °C) | 1600 | |
| Enthalpy of fusion (kJ/kg) | 102 | |
| Water | Viscosity (Pa·s) | 0.001003 |
| Thermal conductivity (W/m °C) | 0.6 | |
| Density (kg/m3) | 998.2 | |
| Specific heat (J/kg °C) | 4182 | |
| Vapor | Viscosity (Pa·s) | 1.28 × 10⁻⁵ |
| Thermal conductivity (W/m·°C) | 0.0265 | |
| Density (kg/m3) | 1.122 | |
| Specific heat (J/kg·°C) | 2119.8 | |
| Latent heat of vaporization (kJ/kg) | 2202.3 | |
| Copper | Thermal conductivity (W/m·°C) | 387.6 |
| Density (kg/m3) | 8978 | |
| Specific heat (J/kg·°C) | 381 |
| Solver Variables | Settings |
|---|---|
| Pressure—velocity coupling | Viscosity (Pa·s) |
| Gradient | Least Squares Cell Based |
| Pressure | PRESTO! |
| Momentum | Second Order Upwind |
| Volume fraction | Compressive |
| Turbulent kinetic energy | First Order Upwind |
| Specific dissipation rate | First Order Upwind |
| Energy | Second Order Upwind |
| Transient formulation | First Order Implicit |
Disclaimer/Publisher’s Note: The statements, opinions and data contained in all publications are solely those of the individual author(s) and contributor(s) and not of MDPI and/or the editor(s). MDPI and/or the editor(s) disclaim responsibility for any injury to people or property resulting from any ideas, methods, instructions or products referred to in the content. |
© 2025 by the authors. Licensee MDPI, Basel, Switzerland. This article is an open access article distributed under the terms and conditions of the Creative Commons Attribution (CC BY) license (https://creativecommons.org/licenses/by/4.0/).
Share and Cite
Yu, M.; Zheng, X.; Liu, J.; Niu, D.; Liu, H.; Gao, H. Numerical Simulation Study of Heat Transfer Fluid Boiling Effects on Phase Change Material in Latent Heat Thermal Energy Storage Units. Energies 2025, 18, 3836. https://doi.org/10.3390/en18143836
Yu M, Zheng X, Liu J, Niu D, Liu H, Gao H. Numerical Simulation Study of Heat Transfer Fluid Boiling Effects on Phase Change Material in Latent Heat Thermal Energy Storage Units. Energies. 2025; 18(14):3836. https://doi.org/10.3390/en18143836
Chicago/Turabian StyleYu, Minghao, Xun Zheng, Jing Liu, Dong Niu, Huaqiang Liu, and Hongtao Gao. 2025. "Numerical Simulation Study of Heat Transfer Fluid Boiling Effects on Phase Change Material in Latent Heat Thermal Energy Storage Units" Energies 18, no. 14: 3836. https://doi.org/10.3390/en18143836
APA StyleYu, M., Zheng, X., Liu, J., Niu, D., Liu, H., & Gao, H. (2025). Numerical Simulation Study of Heat Transfer Fluid Boiling Effects on Phase Change Material in Latent Heat Thermal Energy Storage Units. Energies, 18(14), 3836. https://doi.org/10.3390/en18143836